

Page 1
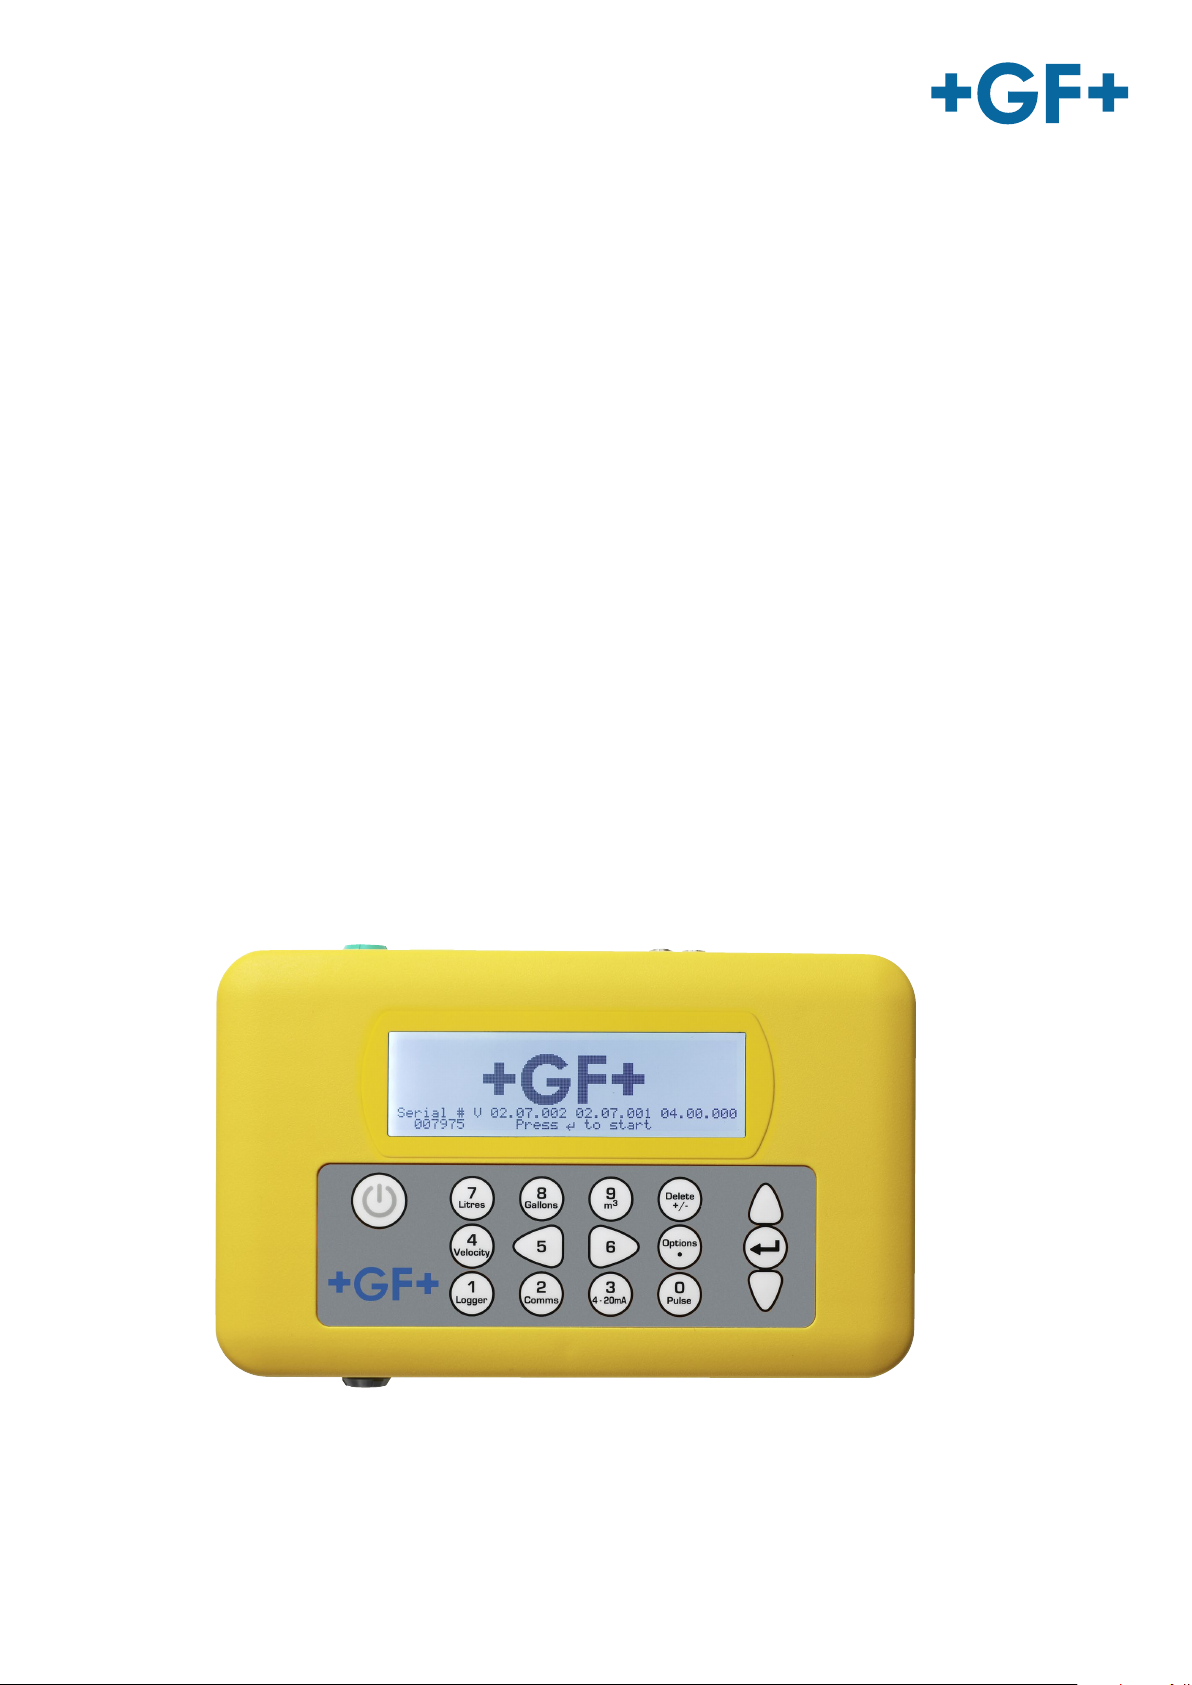
GF Piping Systems
Instruction manual
PORTAFLOW 330 - Portable Ultrasonic Flowmeter
Page 2

Page 3

Intended use Instruction manual
Original instruction manual
Observe instruction manual
The instruction manual is part of the product and an important element within the safety
concept.
Read and observe instruction manual.
Always have instruction manual available at the product.
Pass on instruction manual to all subsequent users of the product.
2
Page 4

Instrction manual Intended use
Contents
Original instruction manual ............................................................................................................ 2
Contents ........................................................................................................................................... 3
1 Intended use .......................................................................................................................... 5
2 About this document ............................................................................................................. 5
2.1 Warnings ................................................................................................................................ 5
2.2 Other related documents ...................................................................................................... 6
2.3 Abbreviations ......................................................................................................................... 6
3 Safety and responsibility ....................................................................................................... 6
4 Transport and storage ........................................................................................................... 7
5 Design and function ............................................................................................................... 7
5.1 Design .................................................................................................................................... 7
5.2 Portaflow 330 Instrument ..................................................................................................... 8
5.2.1 Connectors ............................................................................................................................. 9
5.2.2 Keypad 10
5.2.3 Power supply and battery charging .....................................................................................11
5.3 Transducers ..........................................................................................................................11
5.4 Principles of Operation .........................................................................................................12
6 Installation ............................................................................................................................13
6.1 Transducer Positioning ........................................................................................................13
6.2 Transducer Attachment (Type ‘A’ & ‘B’) ..............................................................................14
6.2.1 Preparation ...........................................................................................................................14
6.2.2 Attaching the guide rails ......................................................................................................15
6.2.3 Attaching the guide rails ......................................................................................................16
6.3 Installing the Data Logging Software ..................................................................................17
7 Operating Procedures ..........................................................................................................17
7.1 Setting-up the Instrument ...................................................................................................18
7.1.1 Using the instrument for the first time ...............................................................................18
7.1.2 Enabling/disabling the backlight .........................................................................................19
7.2 Using the Quick Start Menu .................................................................................................19
7.3 Using the System at a Regularly Monitored Location ........................................................22
7.4 Managing Named Sites ........................................................................................................24
7.4.1 Setting up a new site ............................................................................................................25
7.4.2 Changing a site name ...........................................................................................................26
7.5 Instrument Calibration .........................................................................................................26
7.5.1 Adjusting the zero cut-off .....................................................................................................26
3
Page 5

Intended use Instruction manual
7.5.2 Adjusting the set zero flow offset ........................................................................................26
7.5.3 Adjusting the calibration factor ...........................................................................................27
7.5.4 Adjusting the roughness factor ...........................................................................................28
7.5.5 Adjusting the damping factor ...............................................................................................29
7.6 Performing Monitoring & Logging Functions .....................................................................29
7.6.1 How to measure totalised flows (manually) ........................................................................29
7.6.2 How to set up the basic logging application to memory ....................................................30
7.6.3 How to set up automatic (timed) logging mode ..................................................................33
7.6.4 How to download logged data to a USB memory key .........................................................35
7.6.5 Transferring data to a PC .....................................................................................................36
7.7 Configuring the Current / Pulse Output ..............................................................................36
7.7.1 Current output ......................................................................................................................36
7.7.2 Pulse output ..........................................................................................................................39
8 Maintenance and Repair ......................................................................................................41
9 Troubleshooting ....................................................................................................................42
9.1 Overview ................................................................................................................................42
9.2 General Troubleshooting Procedure ...................................................................................43
9.3 Warning & Status Messages ................................................................................................44
9.4 Test Block .............................................................................................................................47
9.5 Microprocessor Reset Facility .............................................................................................47
9.6 Diagnostics Display ..............................................................................................................48
10 Appendix A: Specification .....................................................................................................49
11 Disposal .................................................................................................................................52
4
Page 6
Instrction manual Intended use
Risk of fatal or serious injury!
There is a risk of fatal or serious physical injury if warnings are ignored!
Risk of damage to property!
Failure to comply leads to a risk of damage to property (loss of time, loss of data, machine
fault etc.)!
Symbol
Meaning
1.
Call for action in a certain order: Here, you have to do something.
Call for action: Here, you have to do something
Listing
NOTICE
WARNING
CAUTION
1 Intended use
The flowmeter is designed to work with clamp-on transducers to enable the flow of a liquid
within a closed pipe to be measured accurately without needing to insert any mechanical
parts through the pipe wall or protrude into the flow system. Using ultrasonic transit time
techniques, the Portaflow 330 is controlled by a micro-processor system which contains a
wide range of data that enables it to be used with pipes with an outside diameter ranging from
13mm up to 5000mm and constructed of almost any material. The instrument will also
operate over a wide range of fluid temperatures.
The flowmeter can be used to measure clean liquids or oils that have less than 3% by volume
of particulate content. Cloudy liquids such as river water and effluent can be measured along
with cleaner liquids such as demineralised water.
Typical applications
River water
Seawater
Potable water
Demineralised water
Treated water
2 About this document
This document contains all necessary information for the installation, operation and service of
the product.
2.1 Warnings
In this instruction manual, warnings are used, which shall warn you of death, injuries or
material damage. Always read and observe these warnings!
Further labels
5
Page 7
Safety and responsibility Instruction manual
Abbreviation
Description
ABS
Acrylonitrile-butadiene-styrene
DA
Double acting function
EMC
Electromagnetic Compatibility
FC
Fail safe to close function
FO
Fail safe to open function
LCD
Liquid crystal display
LED
Light-emitting diode
MOSFET
Metal oxide semiconductor field effect transistor
PBINSTAFLEX
Polybutene plastic piping system
PE-ELGEF
Polyethylene plastic piping system
PP-PROGEF
Polypropylene plastic piping system
PVDF-SGEF
PVDF (polyvinylidene fluoride) plastic piping system
SPNO
MOSFET
Single-pole normally open metal oxide semiconductor field effect transistor
VC-U-PVC
Polyvinyl chloride
2.2 Other related documents
Georg Fischer planning fundamentals
These documents are available via the agency of GF Piping Systems or at www.gfps.com.
2.3 Abbreviations
3 Safety and responsibility
Only use the product for the intended purpose, see Intended Use.
Do not use any damaged or faulty product. Sort out any damaged product immediately.
Make sure that the piping system has been installed professionally and that it is inspected
regularly.
Have the product and accessories installed only by persons who have the required
training, knowledge or experience.
Regularly train personnel on all questions regarding the locally regulations applying to
occupational safety and environmental protection, especially for pressurised pipelines.
6
Page 8
Instrction manual Transport and storage
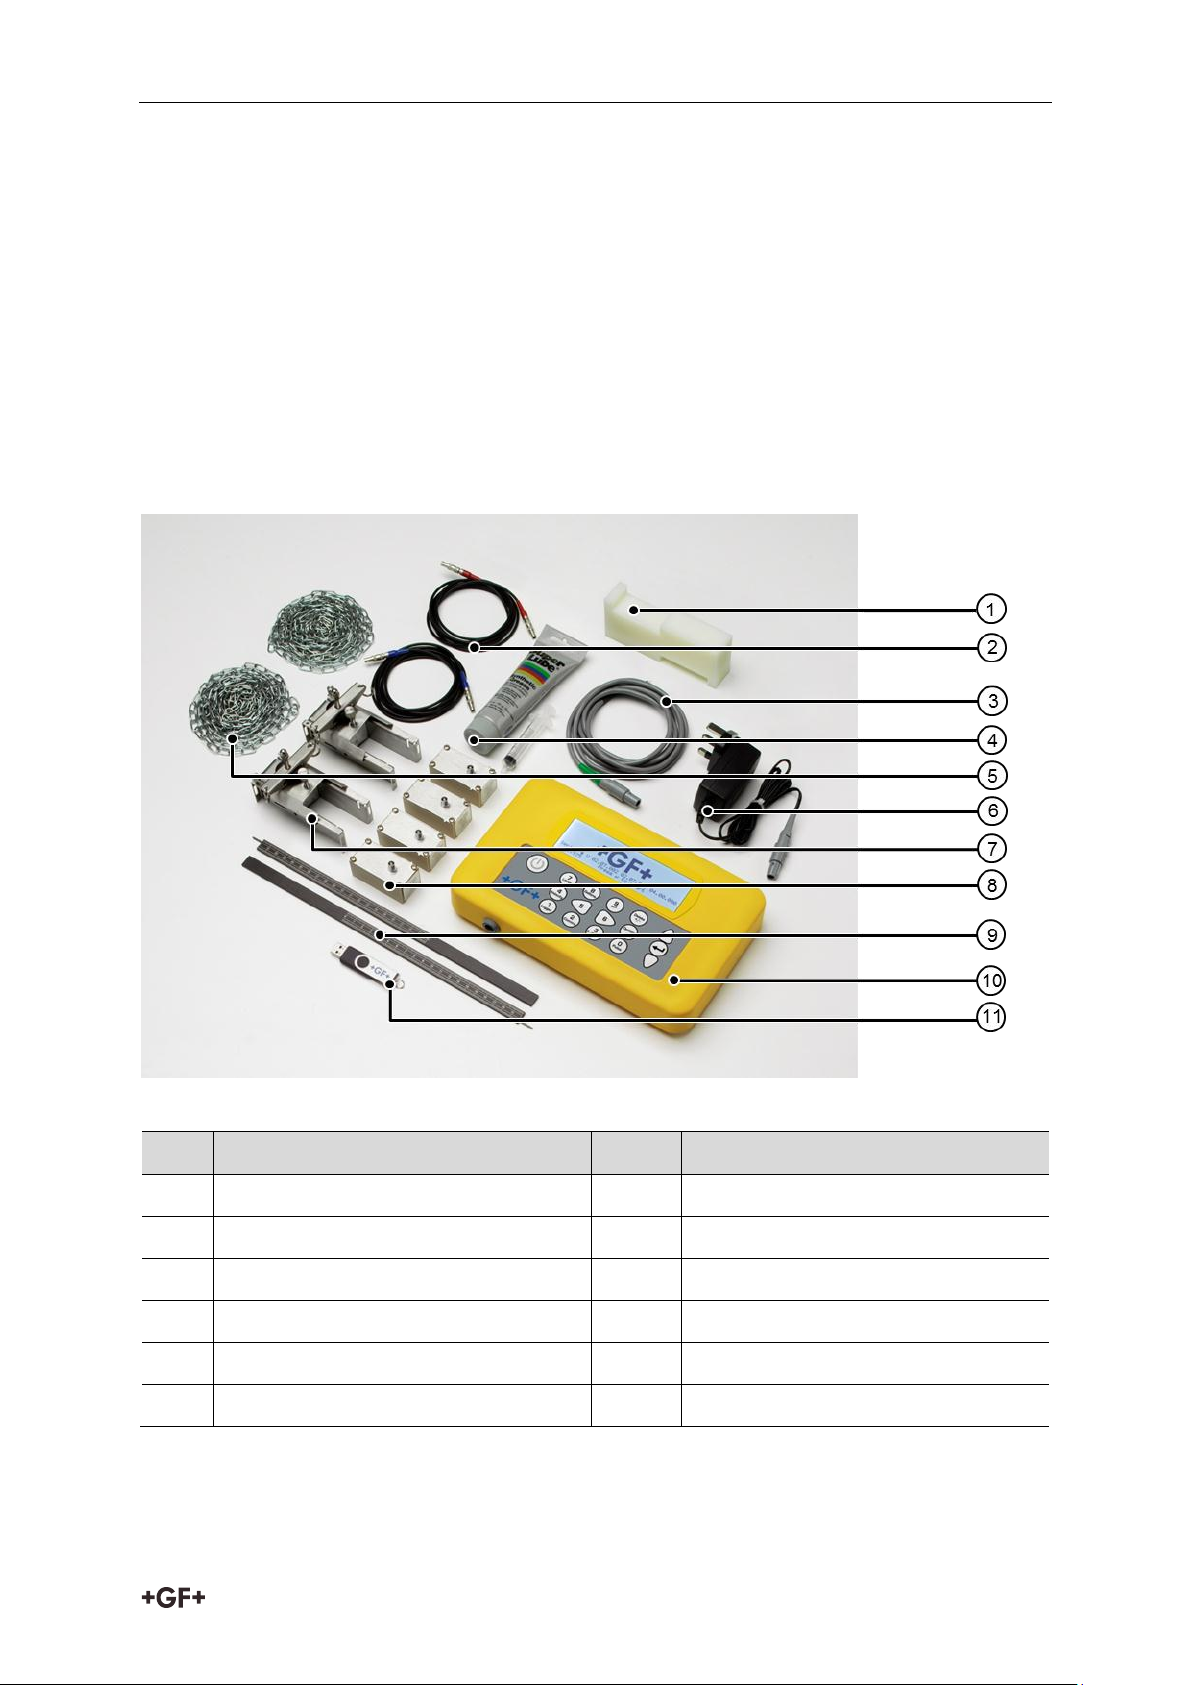
Pos.
Name
Pos.
Name
1
Test Block
7
Guide Rails (x2)
2
Transducer Cables (x2)
8
Transducers (Sensors Ax2, Bx2)
3
4-20mA / Pulse Output Cable
9
Ruled Separation Bars (x2)
4
Ultrasonic Couplant & Applicator
10
Portaflow 330 Instrument
5
Attachment Chains (x2)
11
USB Memory key
6
Power Supply (Batt.Charger)
4 Transport and storage
Protect the product against external forces during transport (impacts, knocks, vibrations
etc.).
Transport and / or store the product unopened in its original packaging.
Protect the product from dust, dirt, moisture as well as heat and ultraviolet radiation.
Ensure that the product is not damaged either by mechanical or thermal influences.
Before assembling, check the product for damage during transport.
5 Design and function
5.1 Design
Legend
The Portaflow equipment is supplied in a rugged IP67 carrying case fitted with a foam insert
to give added protection for transportation.
7
Page 9
Design and function Instruction manual
Reflex mode
Transducer set 'D' – used for monitoring
pipes of 1500mm to 5000mm diameter,
over a temperature range -20°C to
+80°C. Kit is supplied in a separate case
and includes the sensors together with
ratchet straps and guide rails for
attaching to the pipe.
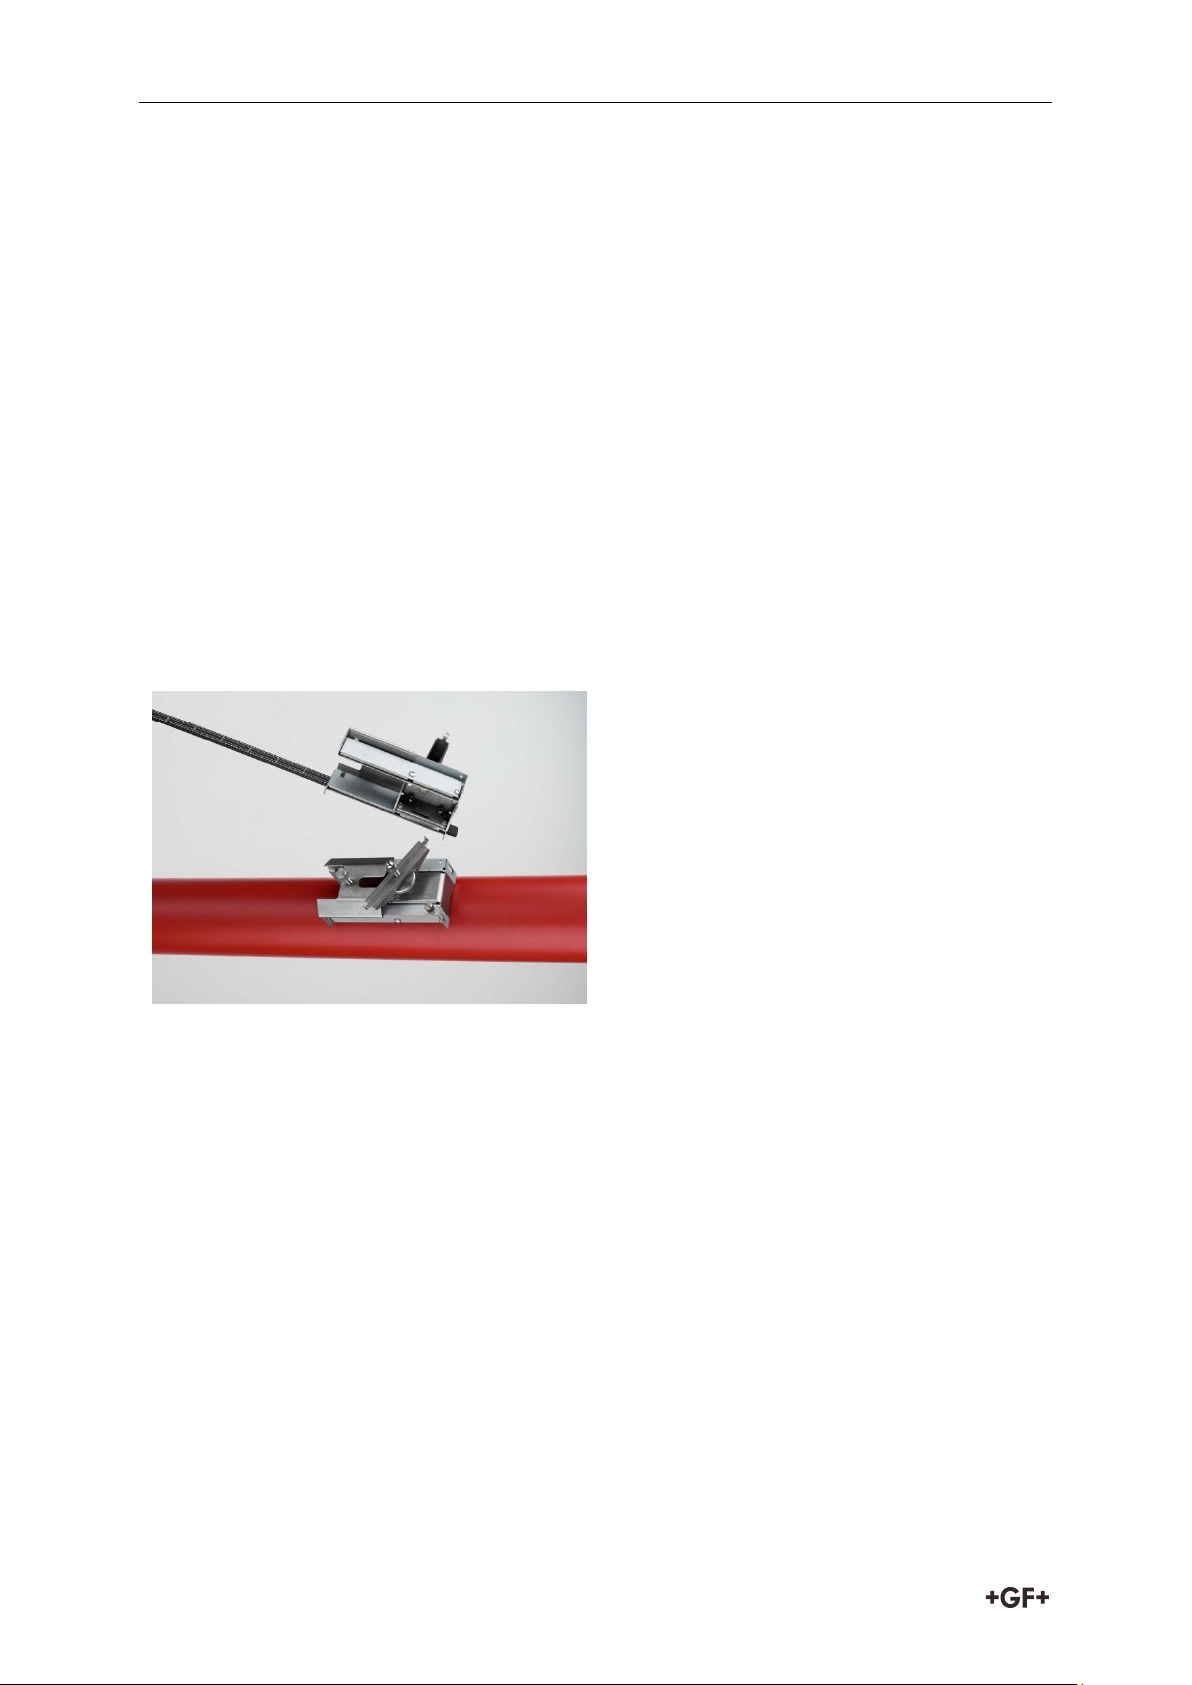
Magnetic guide rail kit, for use on mild
steel and cast iron pipes.
Standard equipment
Portaflow 330 instrument with backlit graphic display.
Power supply - with UK, US, European adaptors. 110/240VAC.
4-20mA/Pulse Output cable.
USB memory key.
2 lengths of attachment chain each at 3.3 metres long.
Test block.
Transducer cables (x2) 2 metres long.
Transducer set 'A' (Transducers x2).
Transducer set 'B' (Transducers x2).
Set of guide rails for use with ‘A’ or ‘B’ transducers.
Ruled separation bar (2-piece).
Ultrasonic couplant.
Manual.
Optional equipment
5.2 Portaflow 330 Instrument
The Portaflow 330 is a microprocessor controlled instrument operated through a menu
system using an inbuilt LCD display and keypad. It can be used to display the instantaneous
fluid flow rate or velocity, together with totalised values, or act as a data logger. When
operating in the data logger mode, the logged data can be stored in the instrument’s non-
volatile memory for downloading to a USB key at a later time. Up to 200k logging events can
be stored internally.
The instrument can also provide a variable current or variable ‘pulse’ (volumetric or
frequency) output that is proportional to the detected flow rate. This output can be calibrated
to suit a particular flow range and used with a range of external interface devices such as
those found in BMS or site monitoring systems.
8
Page 10
Instrction manual Design and function
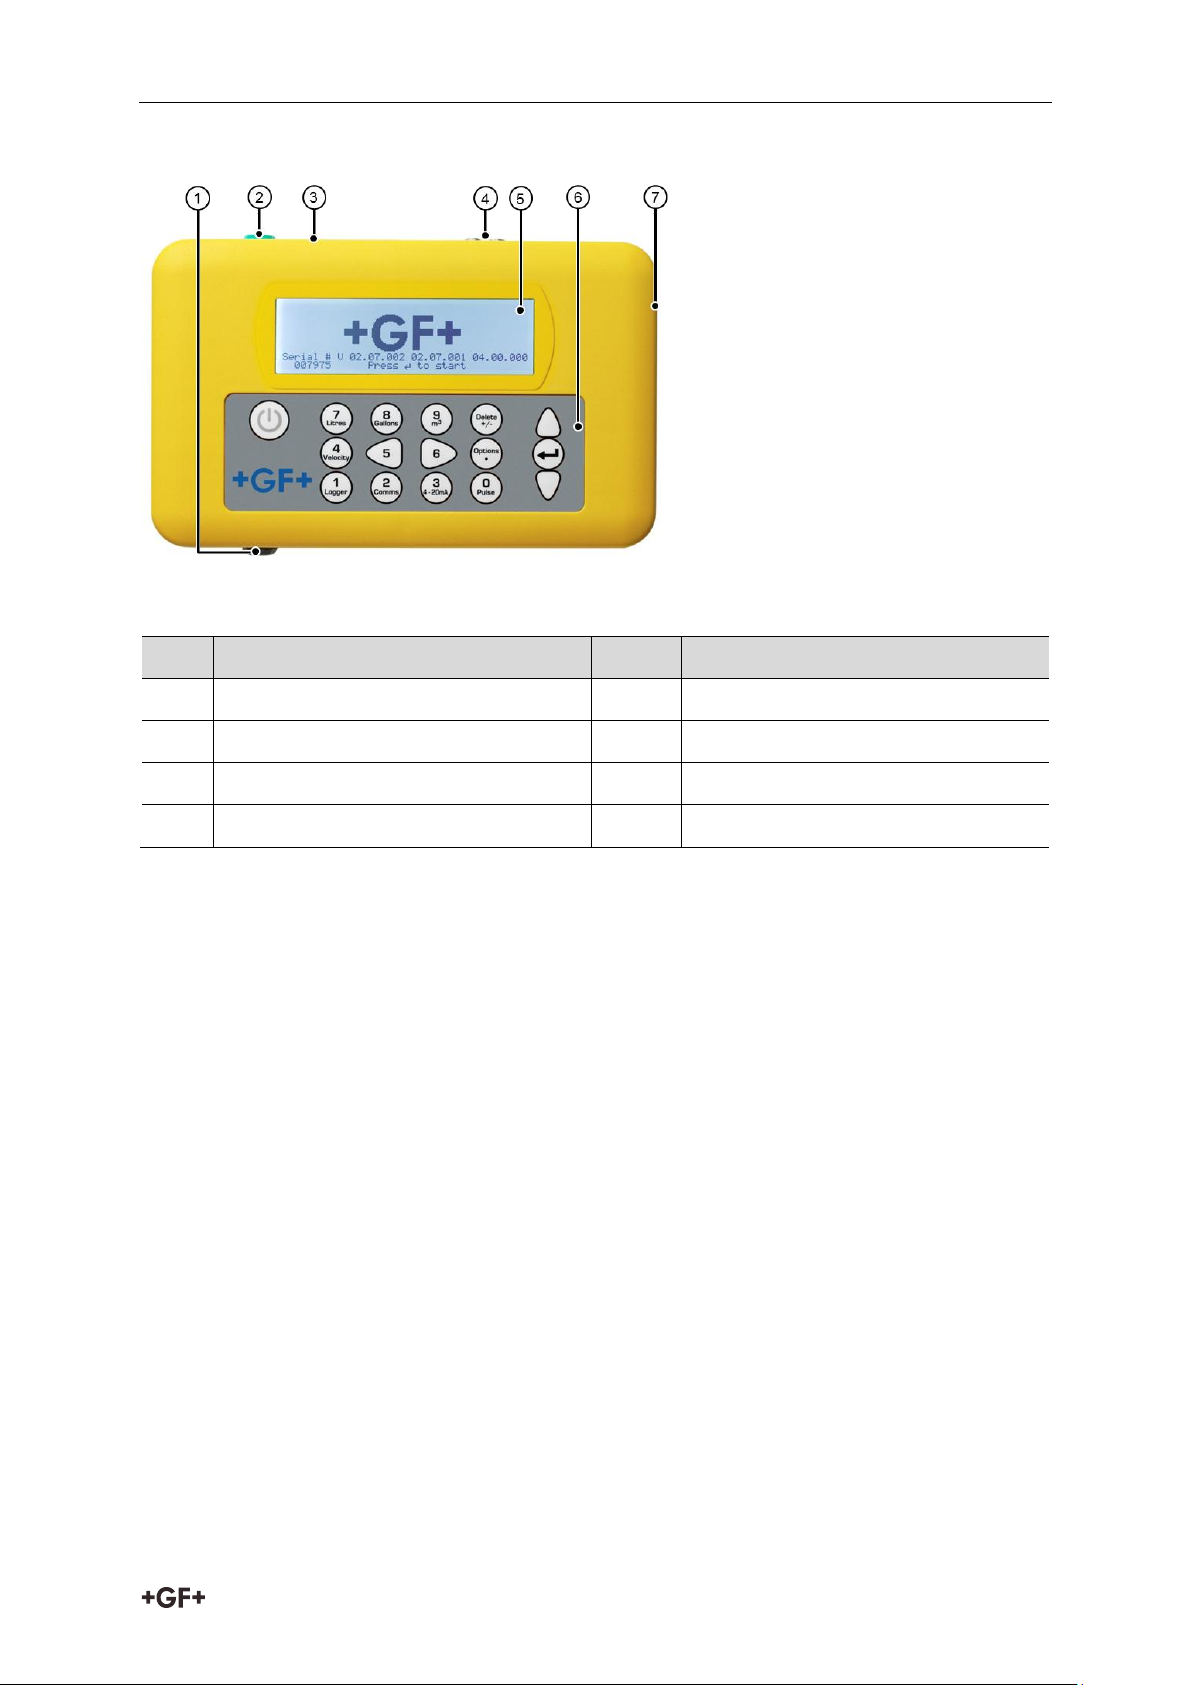
Pos.
Name
Pos.
Name
1
Battery Charger
5
LCD Display
2
4-20mA / Pulse Output
6
Keypad
3
USB Socket
7
Reset pin-hole
4
Transducer Cables
5.2.1 Connectors
Legend
Transducer connections
The transducers are connected to two colour-coded miniature coaxial sockets located on the
top of the instrument. Using the red/blue connector cables provided, the upstream
transducer should always be connected to the RED socket and the downstream transducer to
the BLUE one for a positive flow reading. It is safe to connect or disconnect the cable while
the instrument is switched on.
USB Socket
A standard USB socket is provided to enable logged data stored in the Portaflow 330 to be
transferred to a USB memory key.
4-20mA and Pulse output connection
The 4-20mA / ‘pulse’ output cable should be connected to the green 7-pin connector on the
top of the flowmeter, as shown in Figure 1.4. A single cable that can be adapted for use for
either of these output functions is included in the Portaflow 330 kit. The ‘tails’ on the free end
of the cable must be terminated to suit the intended application.
Red – 4-20mA positive
Black – 4-20mA negative
White – Pulse output
Green – Pulse return
Thick Black – Cable screen
Battery charger connection
9
Page 11
Design and function Instruction manual
The above connectors have different key-ways to prevent incorrect cable connection.
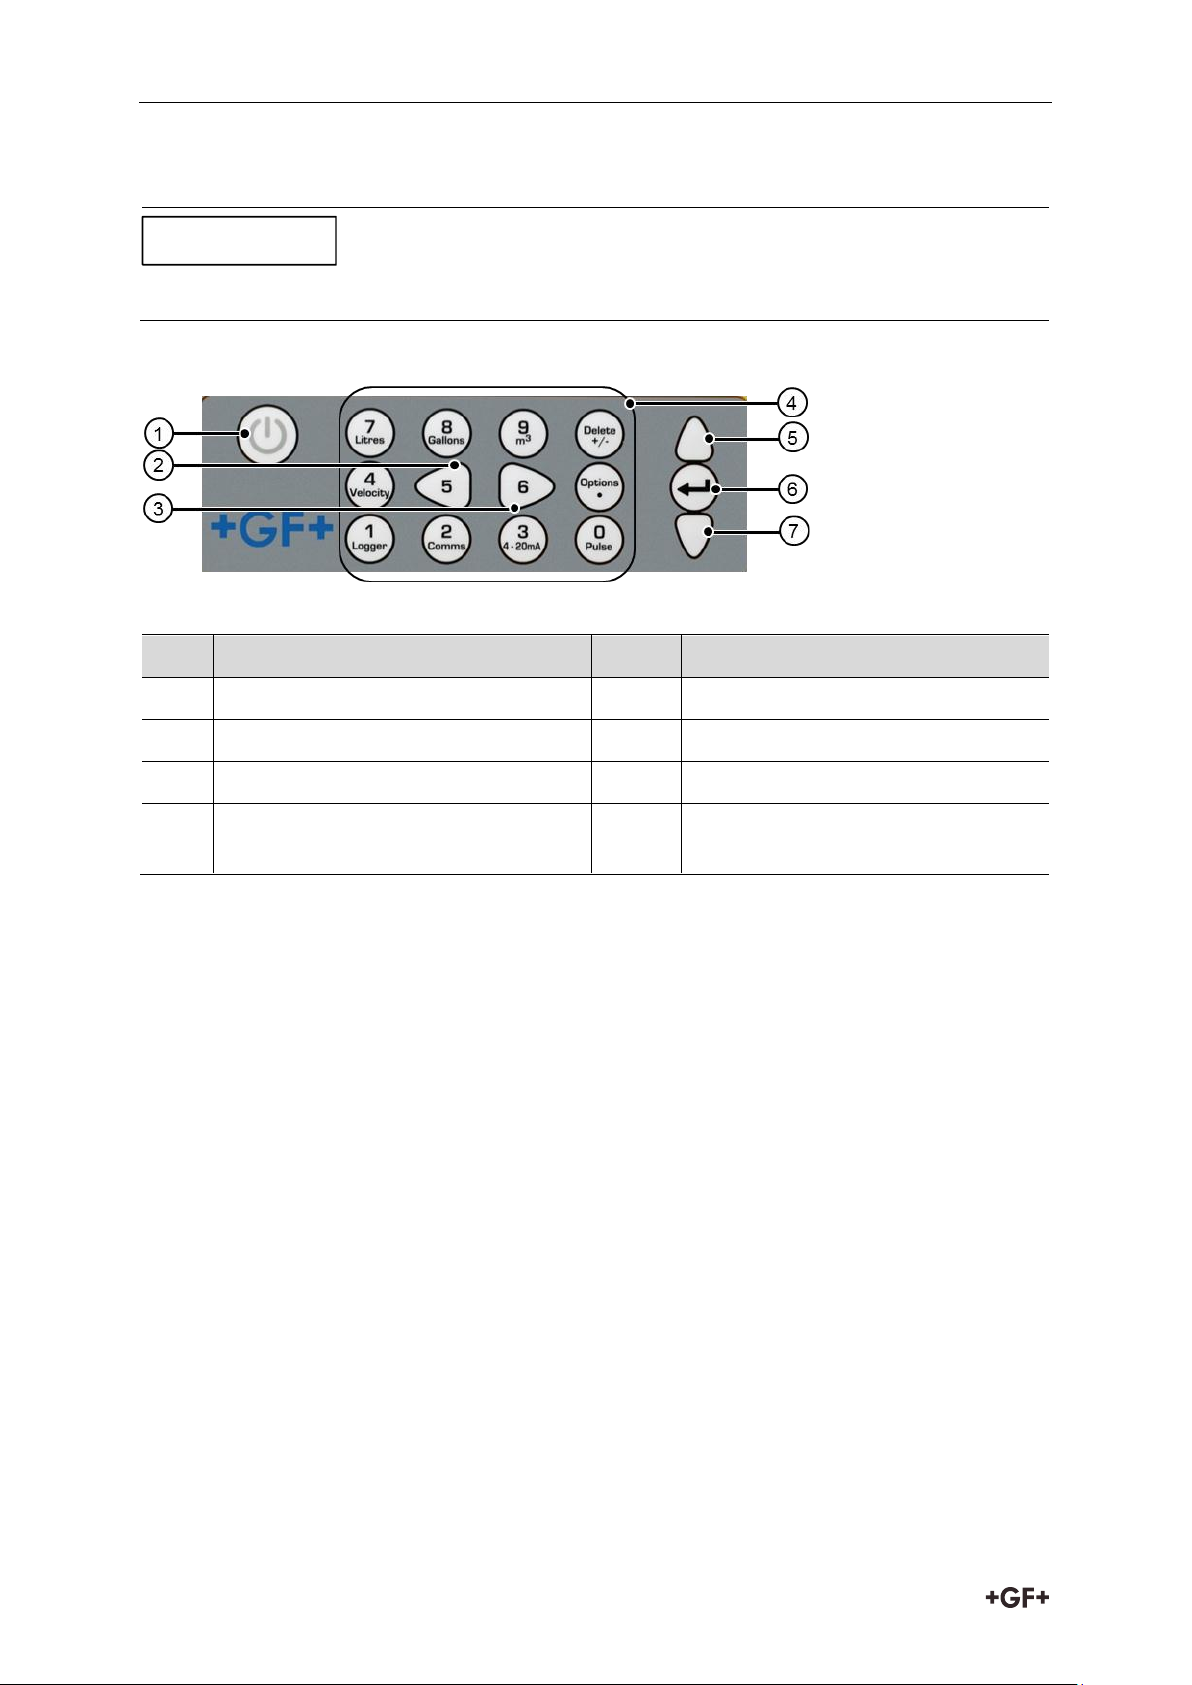
Pos.
Name
Pos.
Name
1
ON/OFF
5
Scroll up
2
Scroll left
6
Enter (select)
3
Scroll right
7
Scroll down
4
Numerical keypad with dual function
keys
NOTICE
The supplied battery charger is connected to the instrument by means of the grey 2-pin
connector on the bottom of the unit.
5.2.2 Keypad
Legend
ON/OFF Key
The ON/OFF key is shown on the top left of the keypad. When turned ON an initialisation
screen is displayed on the LCD showing the instrument’s serial number and software revision.
Once this appears, the instrument can be started by pressing the ENTER key once – the
initialization screen is then replaced by a MAIN MENU which provides access to the remaining
functions.
Menus and the menu selection keys
The Portaflow 330 menus are arranged hierarchally with the MAIN MENU being at the top
level. Menu navigation is achieved by three keys on the right hand side of the keypad which
are used to scroll UP and DOWN a menu list and SELECT a menu item. When scrolling
through a menu an arrow-shaped cursor moves up and down the left hand side of the screen
to indicate the active menu choice which can then be selected by pressing the ENTER
(SELECT) key.
Some menus have more options than can be shown on the screen at the same time, in which
case the ‘overflowed’ choices can be brought into view by continuing to scroll DOWN past the
bottom visible item. Menus generally ‘loop around’ if you scroll beyond the first or last items.
If you select Exit it usually results in taking you back one level in the menu hierarchy, but in
some cases it may go directly to the ‘Flow Reading’ screen.
Some screens require you to move the cursor left and right along the display as well as up
and down. This is achieved using keys 5 (scroll LEFT) and 6 (scroll RIGHT).
10
Page 12
Instrction manual Design and function
The battery is not a user-changeable item. The instrument must be returned to your
distributor if the battery needs replacing.
Only use the supplied charger, or special adaptor lead. Failure to comply with this will
invalidate your warranty.
NOTICE
Dual function numerical keypad
The block of keys shown in the centre of the keypad in Figure 1.5 are dual function keys. They
can be used to enter straight-forward numerical data, select the displayed flow units or
provide quick access to frequently required control menus.
5.2.3 Power supply and battery charging
Operating power is provided by an internal battery that can be charged from the utility supply
using the supplied external charger. When you first receive the unit you must put the battery
on charge for a minimum of 6.5hrs before use. A fully charged battery will power the
instrument for up to 20hrs depending on the output utilisation and backlight usage.
The backlight can be selected to be either permanently OFF, illuminated for 10 seconds, 30
seconds or 1 minute every time a key is pressed, or permanently ON – as configured in the
Setup Instrument menu. If the backlight is active continuously it will reduce the available
battery operating time to 8hrs. Similarly, if the 4-20mA output is used constantly at 20mA, the
battery life would reduce by 50%. It is therefore beneficial to turn off the backlight and 420mA output facilities when they are not required.
When the instrument is operating in the ‘Flow Reading’ mode the percentage battery charge
level is displayed symbolically on the LCD screen. A warning message is triggered if the
charge falls to approximately 30%, at which point there is up to four hours of battery
operation remaining, depending on usage. The battery can be charged both while the
instrument is in use or when switched off. The instrument’s internal data is stored in nonvolatile memory and will not be lost even if the battery discharges completely.
5.3 Transducers
Two sets of ultrasonic transducers are provided as standard. When setting up the instrument
it will indicate the appropriate transducer set to use for a particular application, depending on
data entered by the user. Default pipe ranges are programmed into the instrument and most
of the time there will be no need to use an alternative transducer set to the one suggested by
the instrument. However, if circumstances dictate that a different set must be used it is
possible to manually programme the instrument to accept the alternative set.
Transducer set 'A'
Supplied as standard for use on pipes 13mm to 115mm outside diameter.
Transducer set 'B'
Supplied as standard for use on pipes 50mm to 2000mm outside diameter.
Transducer set 'D'
Type 'D' transducers are optional equipment that can be used by the Portaflow 330 on pipes
from 1500mm to
5000mm. They are supplied complete with ratchet straps for ‘diagonal mode’ attachment.
11
Page 13
Design and function Instruction manual
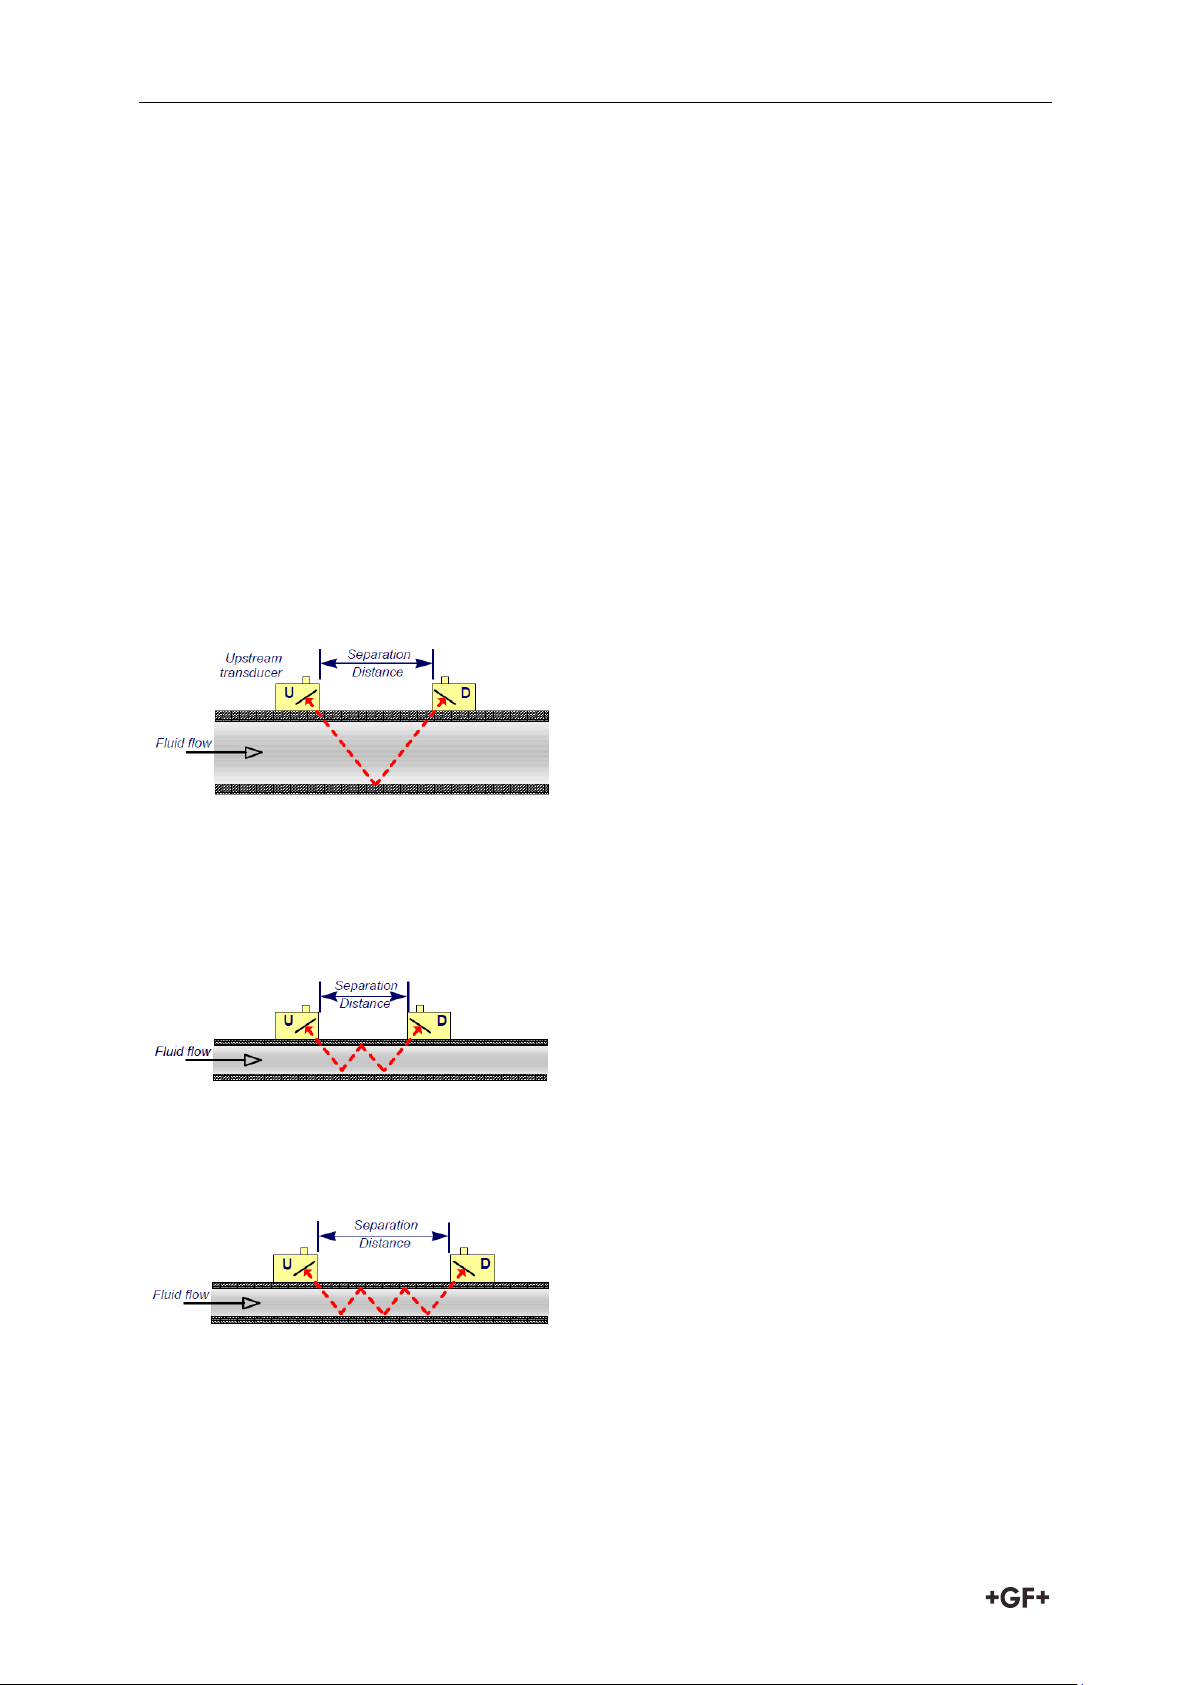
Reflex mode
This is the mode most commonly used. The two
transducers (U & D) are attached to the pipe in
line with each other and the signals passing
between them are eflected by the opposite pipe
wall.
The separation distance is calculated by the
instrument in response to entered data
concerning the pipe and fluid characteristics.
Reflex mode (double bounce)
In this mode the separation distance is
calculated to give a double bounce. This is
most likely to occur if the pipe diameter is so
small that the calculated reflex mode
separation distance would be impractical for
the transducers in use.
Reflex mode (triple bounce)
This illustration goes one step further to show
a triple bounce situation. This would normally
apply when working with very small pipes
relative to the transducer range in use.
5.4 Principles of Operation
When ultrasound is transmitted through a liquid the speed at which the sound travels through
the liquid is accelerated slightly if it is transmitted in the same direction as the liquid flow and
decelerated slightly if transmitted against it. The difference in time taken by the sound to
travel the same distance but in opposite directions is therefore directly proportional to the
flow velocity of the liquid.
The Portaflow 330 system employs two ultrasonic transducers attached to the pipe carrying
the liquid and compares the time taken to transmit an ultrasound signal in each direction. If
the sound characteristics of the fluid are known, the Portaflow microprocessor can use the
results of the transit time calculations to compute the fluid flow velocity. Once the flow
velocity is known the volumetric flow can be easily calculated for a given pipe diameter.
The Portaflow system can be set up to operate in one of four modes determined mainly by the
pipe diameter and the type of transducer set in use. The diagram below illustrates the
importance of applying the correct separation distance between the transducers to obtain the
strongest signal.
12
Page 14
Instrction manual Installation
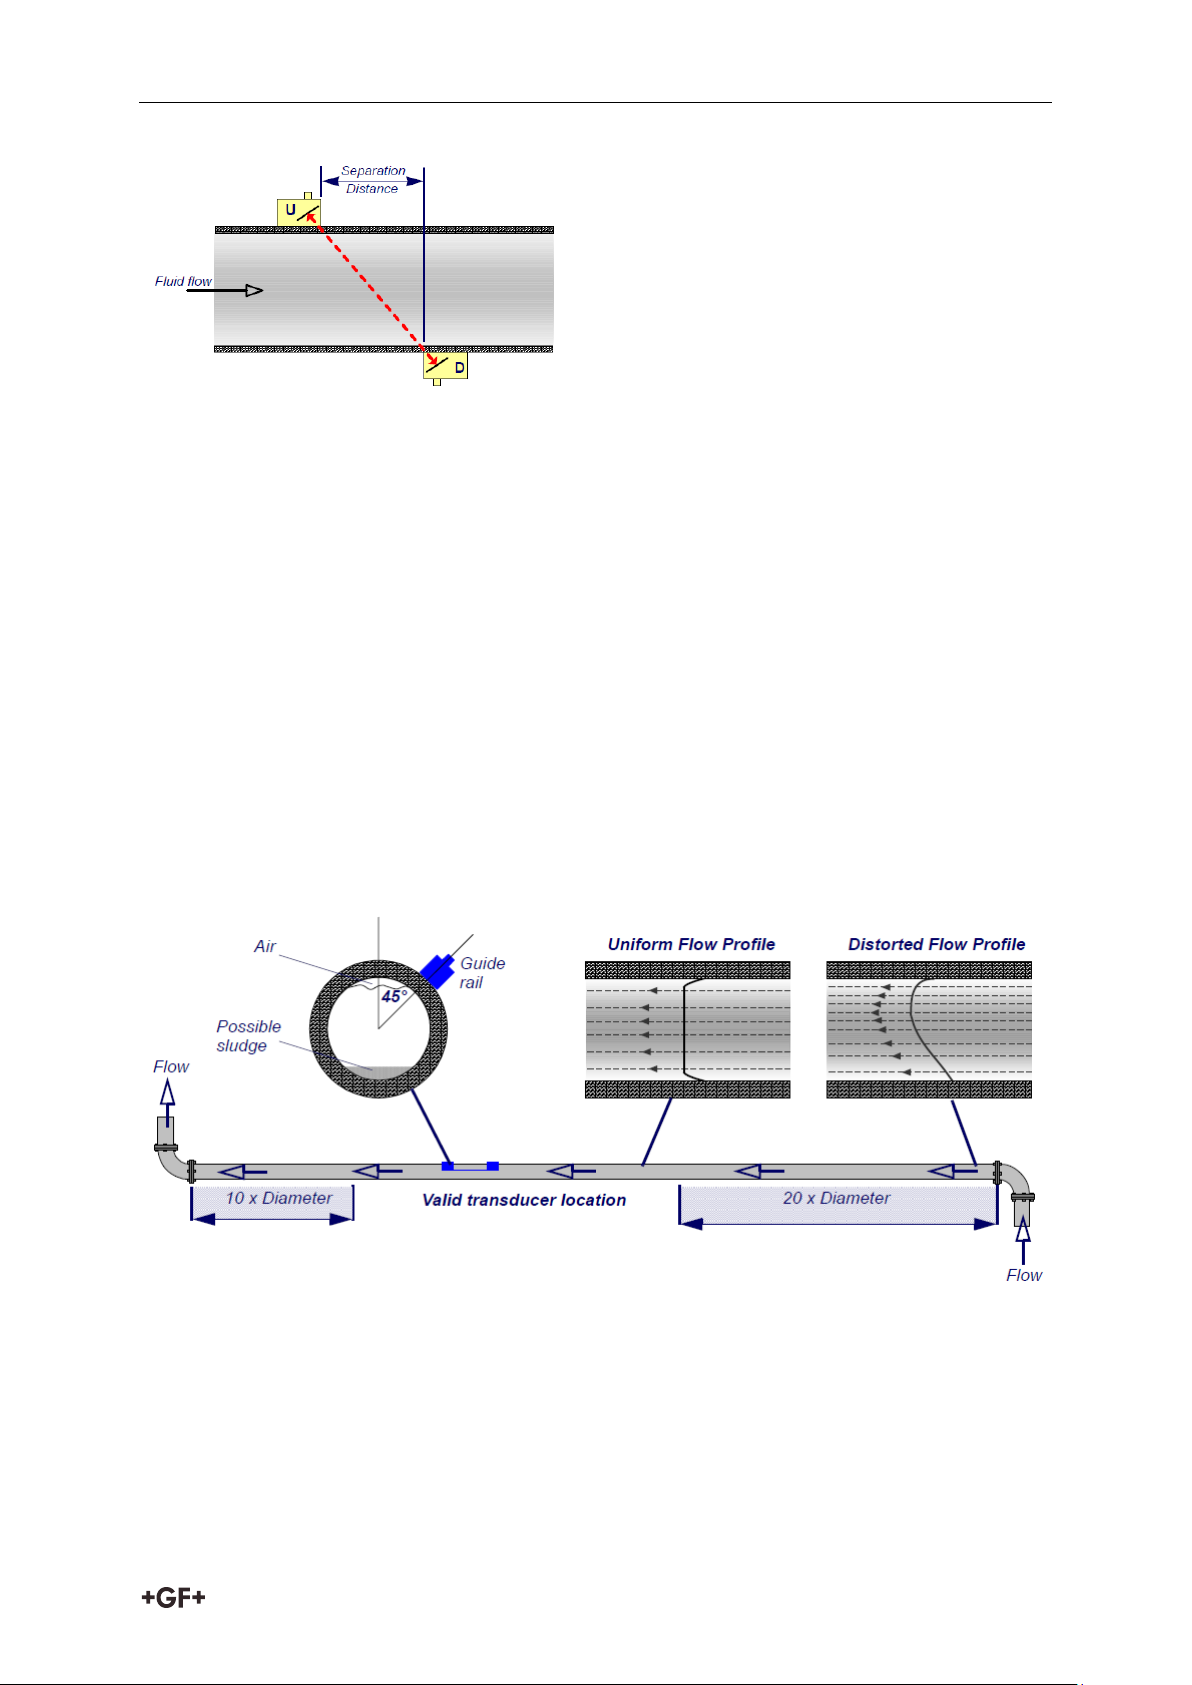
Diagonal mode
This mode might be selected by the instrument
where relatively large pipes are concerned. In
this mode the transducers are located on
opposite sides of the pipe but the separation
distance is still critical in order for the signals
to be received correctly. This mode might be
used with the standard ‘A’ & ‘B’ transducer
sets but for really large pipe installation the
optional transducer set ‘D’ might be
recommended.
6 Installation
6.1 Transducer Positioning
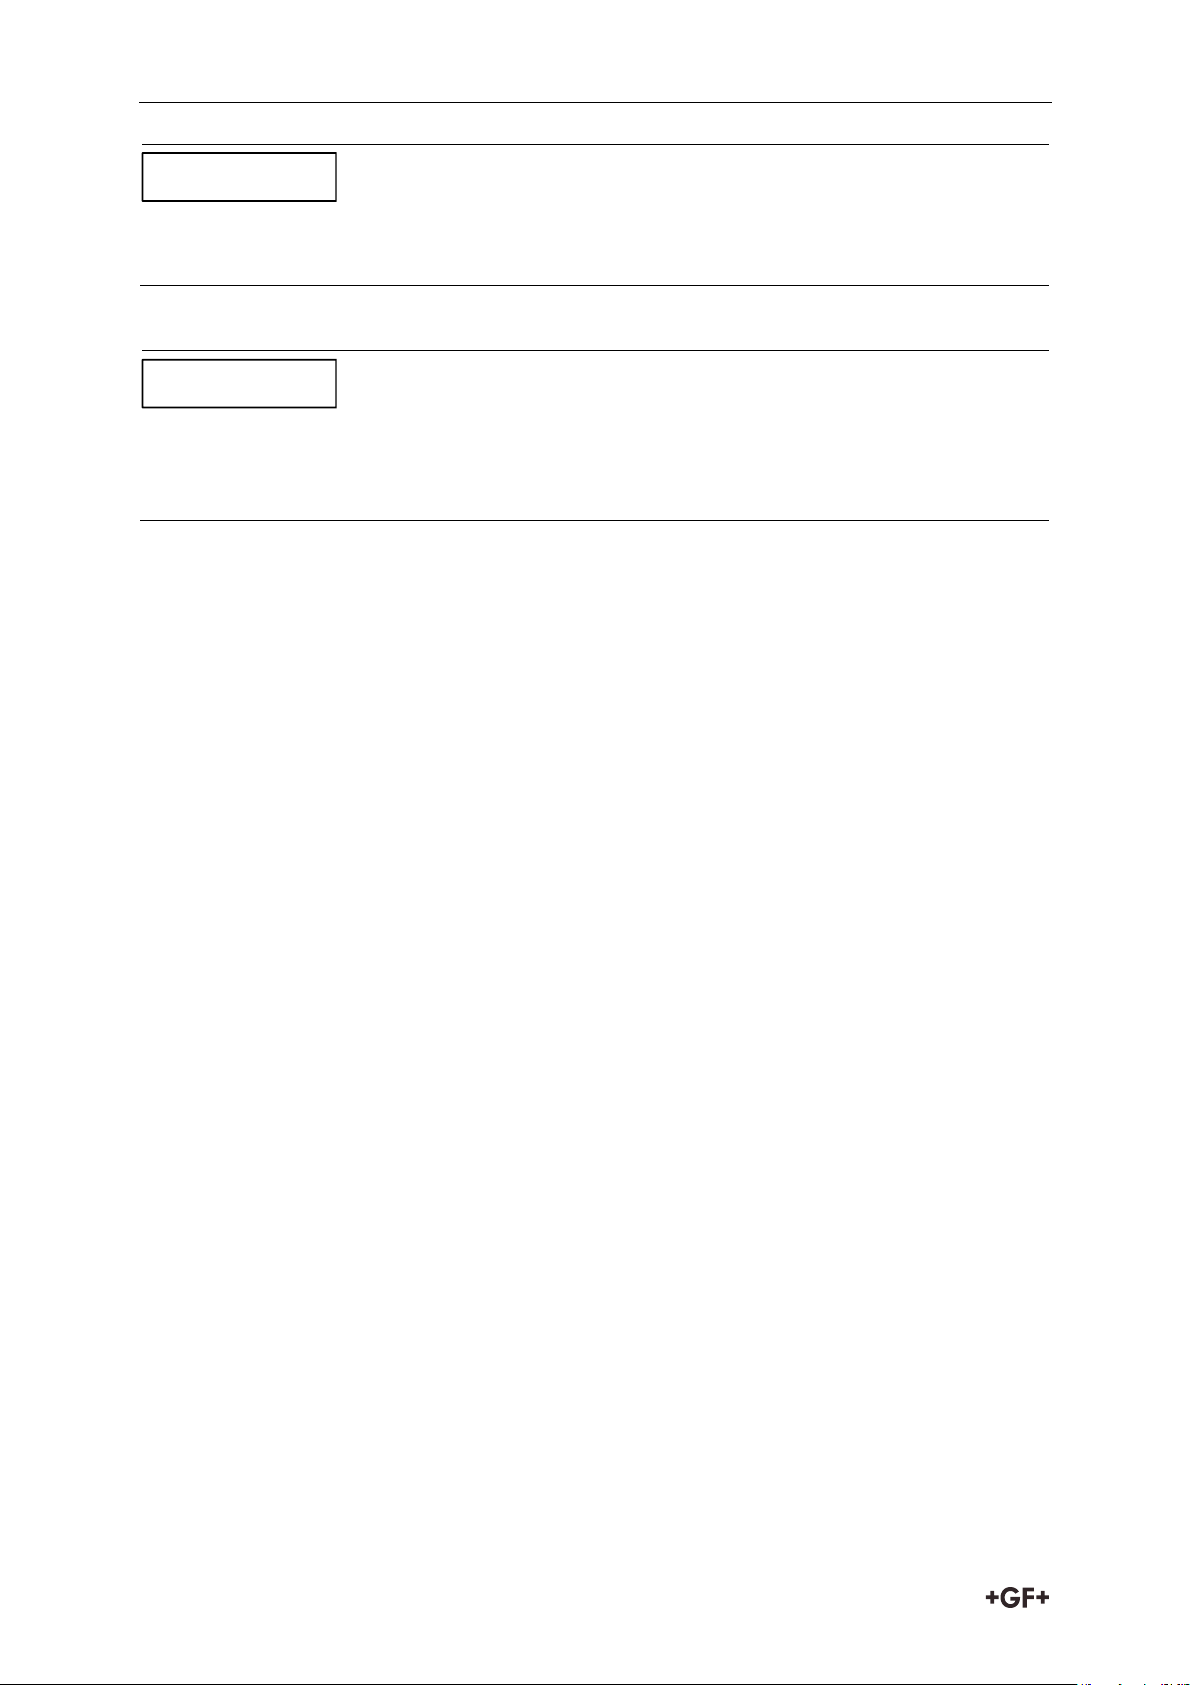
In many applications an even flow velocity profile over a full 360° is unattainable due, for
example, to the presence of air turbulence at the top of the flow and possibly sludge in the
bottom of the pipe. Experience has shown that the most consistently accurate results are
achieved when the transducer guide rails are mounted at 45° with respect to the top of the
pipe.
The Portaflow equipment expects a uniform flow profile as a distorted flow will produce
unpredictable measurement errors. Flow profile distortions can result from upstream
disturbances such as bends, tees, valves, pumps and other similar obstructions. To ensure a
uniform profile the transducers must be mounted far enough away from any cause of
distortion such that it no longer has an effect. Montage
To obtain the most accurate results the condition of both the liquid and the pipe wall must be
suitable to allow the ultrasound transmission along its predetermined path. It is important
also that the liquid flows uniformly within the length of pipe being monitored and that the flow
profile is not distorted by any upstream or downstream obstructions. This is best achieved by
ensuring there is a straight length of pipe upstream of the transducers of at least 20 times
the pipe diameter and 10 times the pipe diameter on the downstream side. Flow
measurements can be made on shorter lengths of straight pipe, down to 10 diameters
upstream and 5 diameters downstream, but when the transducers are positioned this close to
any obstruction the resulting errors can be unpredictable.
13
Page 15
Installation Instruction manual
Do not expect to obtain accurate results if the transducers are positioned close to any
obstructions that distort the uniformity of the flow profile.
The use of chains to fix the guide rail to the pipe can be eliminated on steel pipes by using
the optional magnetic guide rails. In all other respects the setting up of the sensors is the
same as for standard guide rails.
NOTICE
NOTICE
6.2 Transducer Attachment (Type ‘A’ & ‘B’)
Type ‘A’ & ‘B’ transducers are fitted to adjustable guide rails which are secured to the pipe
using wrap-around chains and mechanically connected together by a steel separation bar.
The separation bar also acts as a ruler to allow the distance between the transducers to be
accurately set to the value determined by the Portaflow instrument.
When fitting the guide rails it is easiest to assemble them onto the separation bar and adjust
to the required separation distance before attaching them to the pipe.
6.2.1 Preparation
1. Before you attach the transducers you should first ensure that the proposed location
satisfies the distance requirements shown in Figure 2.1 otherwise the resulting accuracy
of the flow readings may be affected.
2. Prepare the pipe by degreasing it and removing any loose material or flaking paint in
order to obtain the best possible surface. A smooth contact between pipe surface and the
face of the transducers is an important factor in achieving a good ultrasound signal
strength and therefore maximum accuracy.
14
Page 16
Instrction manual Installation
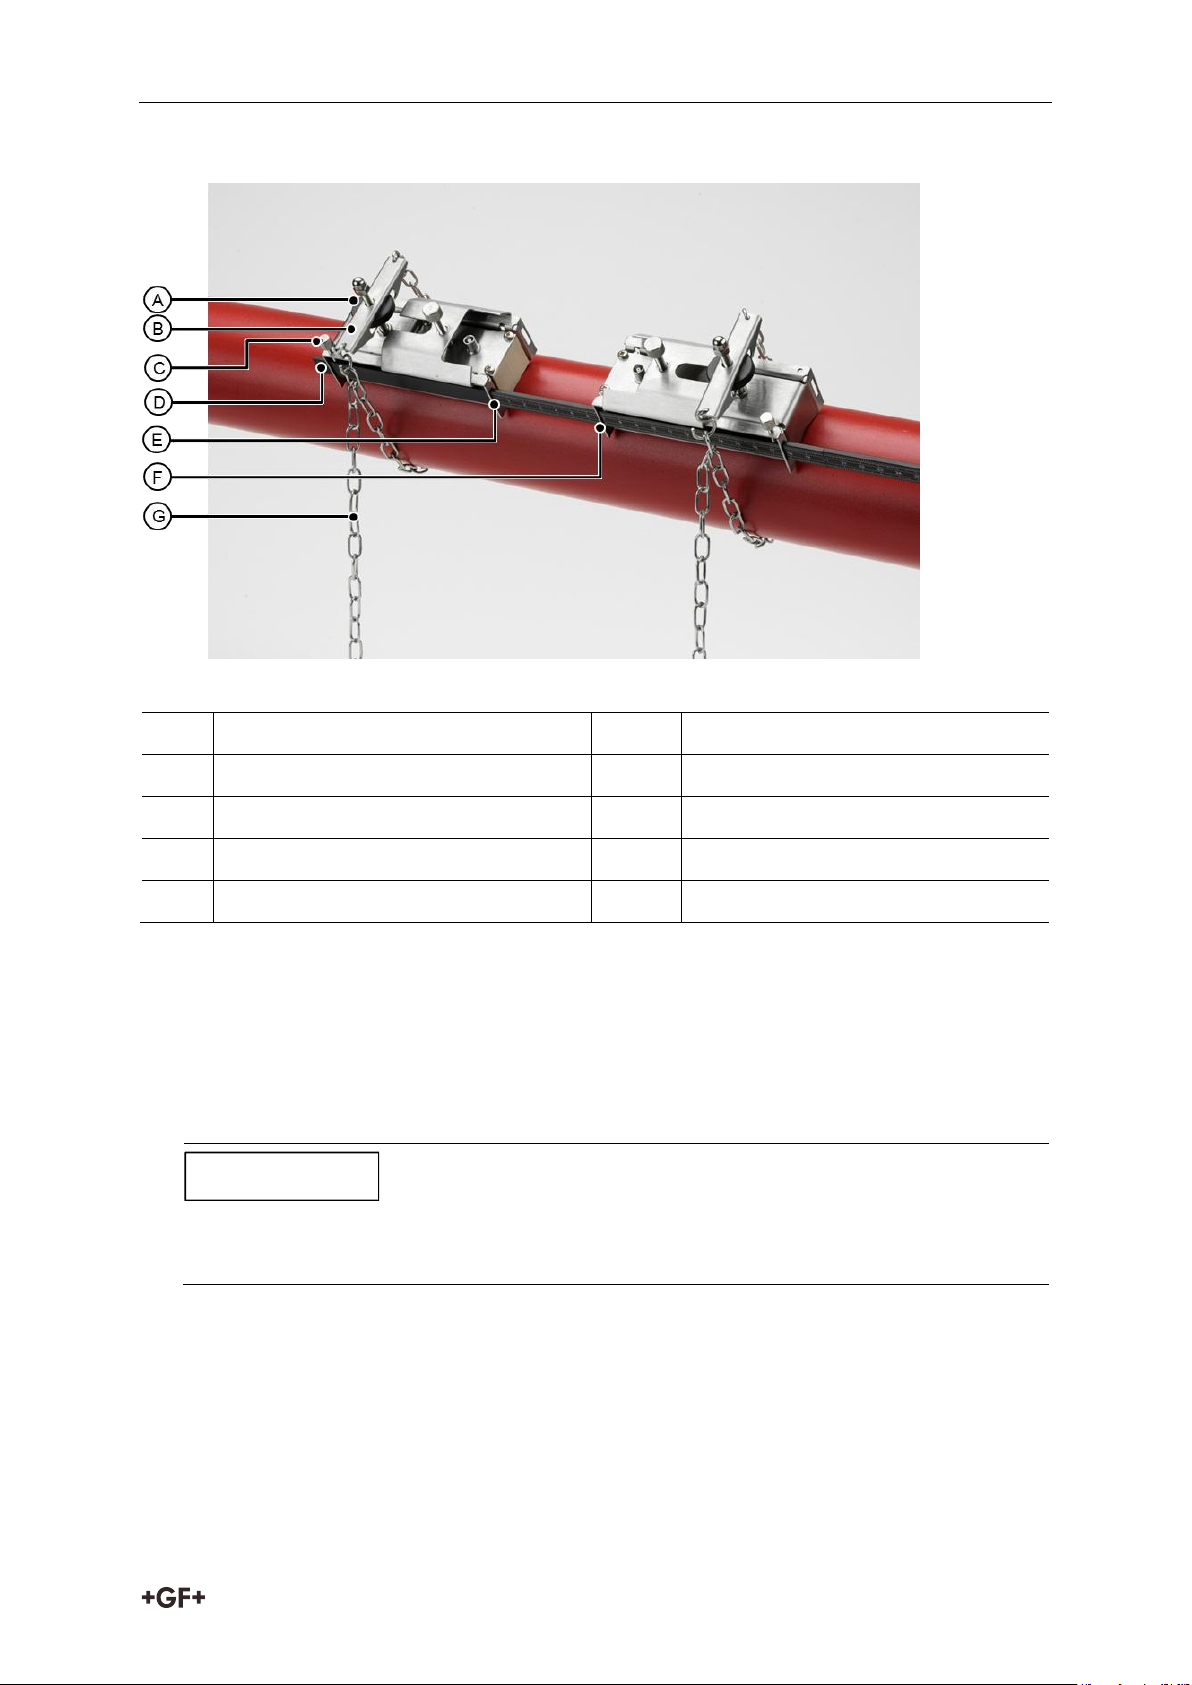
Pos.
Name
Pos.
Name
A
Tensioning thumb-wheel
E
Ruler scale (0)
B
Tension bar
F
Set Separation distance
C
Separation bar securing screw
G
Securing chain
D
Separation bar
If magnetic guide rails are used on steel pipes then only the location at 45° on the pipe
apply on the next two sections.
NOTICE
6.2.2 Attaching the guide rails
Legend
1. Slide the separation bar (D) into the front of the left hand guide rail, align the front edge of
the guide rail with ‘0’ on the ruler scale (E) and secure it in place by tightening the
thumbscrew (C).
2. Slide the other end of the separation bar into the front of the right hand guide rail, align
the front edge of the guide rail to the required separation distance (obtained from the
Portaflow instrument) on the ruler (F), then secure it in place by tightening the
thumbscrew.
3. On each guide rail, attach one end of a securing chain to a hook on the tensioning bar (B),
wrap the chain around the pipe (G) and then attach it to the hook on the other end of the
tensioning bar whilst keeping the chain as tight as possible.
4. Rotate the complete guide rail assembly so that it is approximately 45° with respect to the
top of the pipe. Then tighten the chain by turning the tensioning thumb-wheel (A) on each
guide block until the assembly is securely attached to the pipe.
15
Page 17
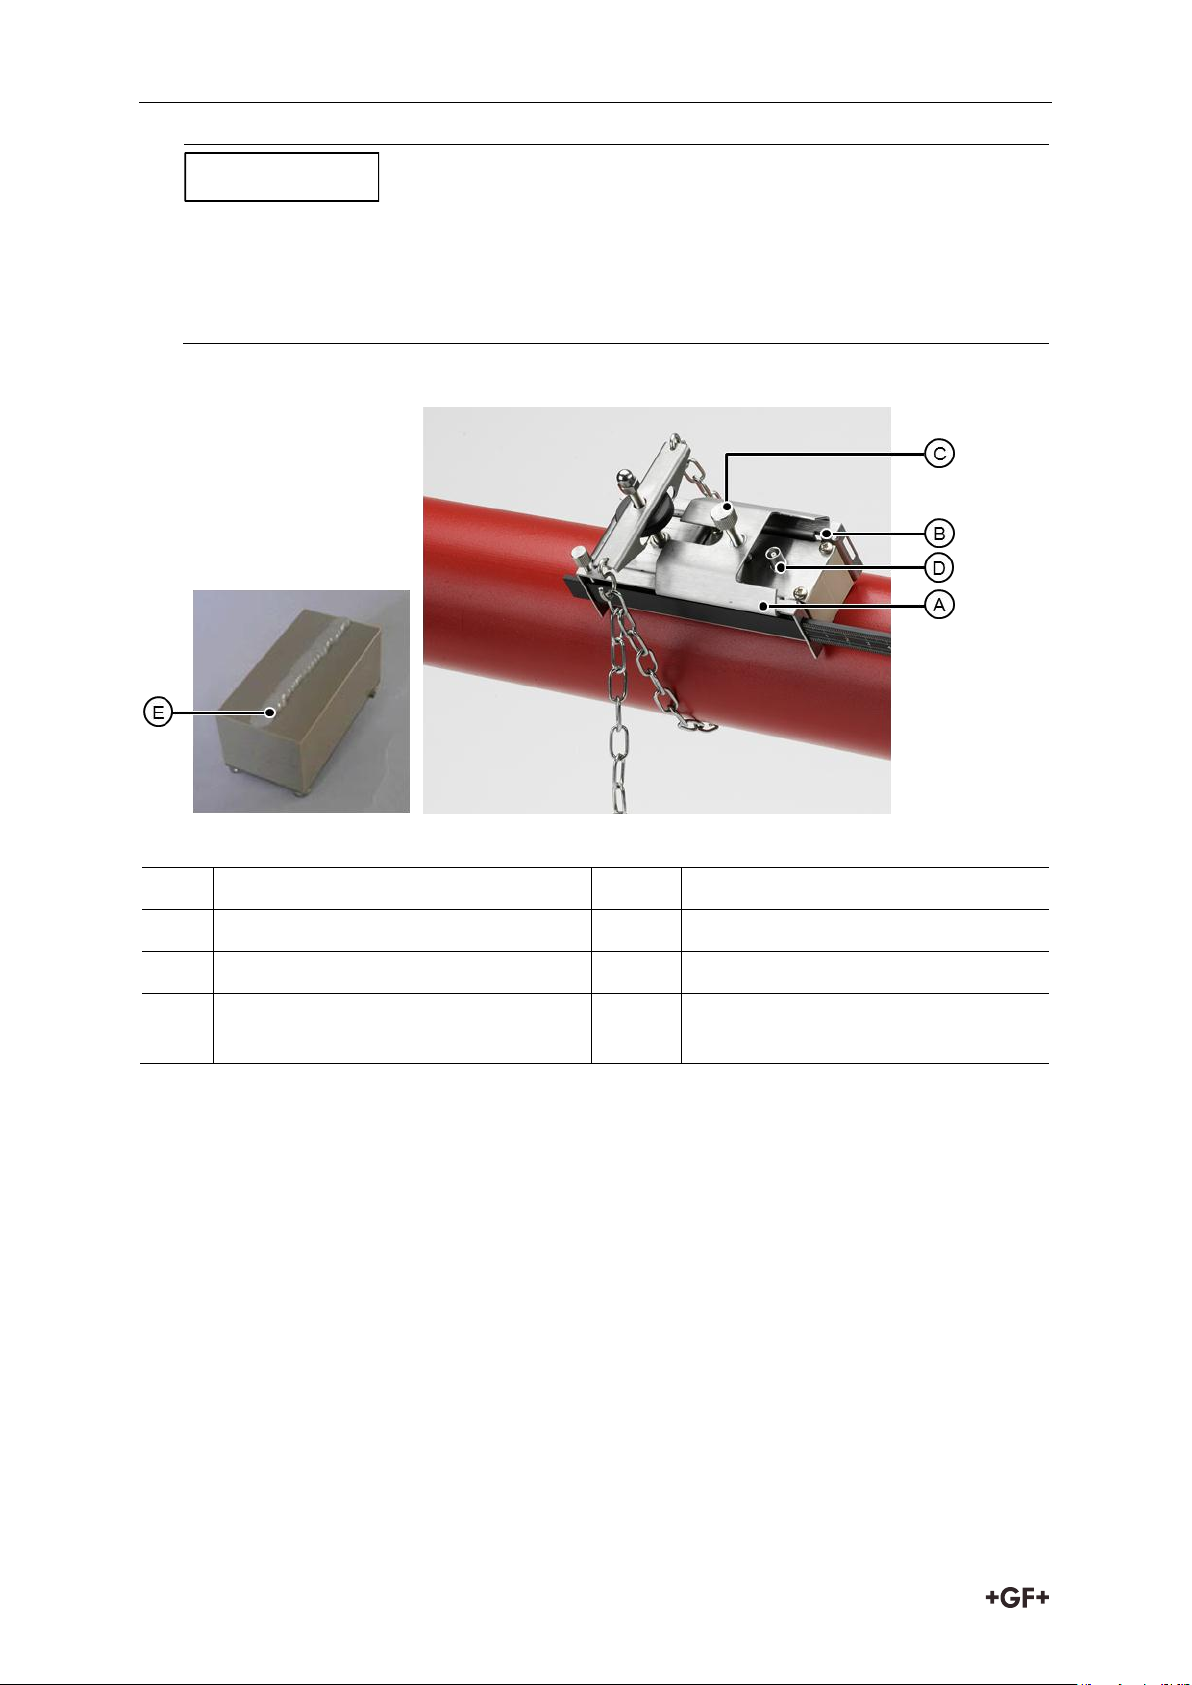
Installation Instruction manual
If you are unable to get sufficient tension on the chain to hold the assembly in place,
fully slacken the tensioning thumb-wheel and shorten the effective length of the chain
wrapped around the pipe by connecting the tensioning bar to the next link in the chain,
then re-tension.
Pos.
Name
Pos.
Name
A
Transducer cover plate.
D
Transducer cable connection
B
Transducer locating slot/lug.
E
Ultrasonic couplant application
C
Transducer cover plate securing
screw.
NOTICE
6.2.3 Attaching the guide rails
Legend
1. Slide the transducer cover plate (A) fully towards the outside of the guide assembly to
allow sufficient access to fit the transducer.
2. Clean the face of the transducer, removing all traces of dirt and grease.
3. Apply a 3mm bead of ultrasonic couplant along the centre length of the transducer (E).
4. Fit the transducer into the guide block – ensuring the lugs on the sides of the transducer
are correctly located into the slots on the sides of the guide block (B).
5. Slide the transducer cover plate (A) over the top of the transducer and tighten the
thumbscrew (C) finger tight to secure the transducer in place. When securing the cover
plate take care to leave sufficient room around the transducer connector (D) to connect
the cable.
6. Repeat the above steps for the second transducer.
7. Connect the transducers to the Portaflow instrument using the coaxial cables provided.
The RED cable must be connected to the upstream transducer and the BLUE cable to the
downstream transducer. If you observe a negative flow, swap the red and blue cables at
the sensor end.
16
Page 18
Instrction manual Operating Procedures
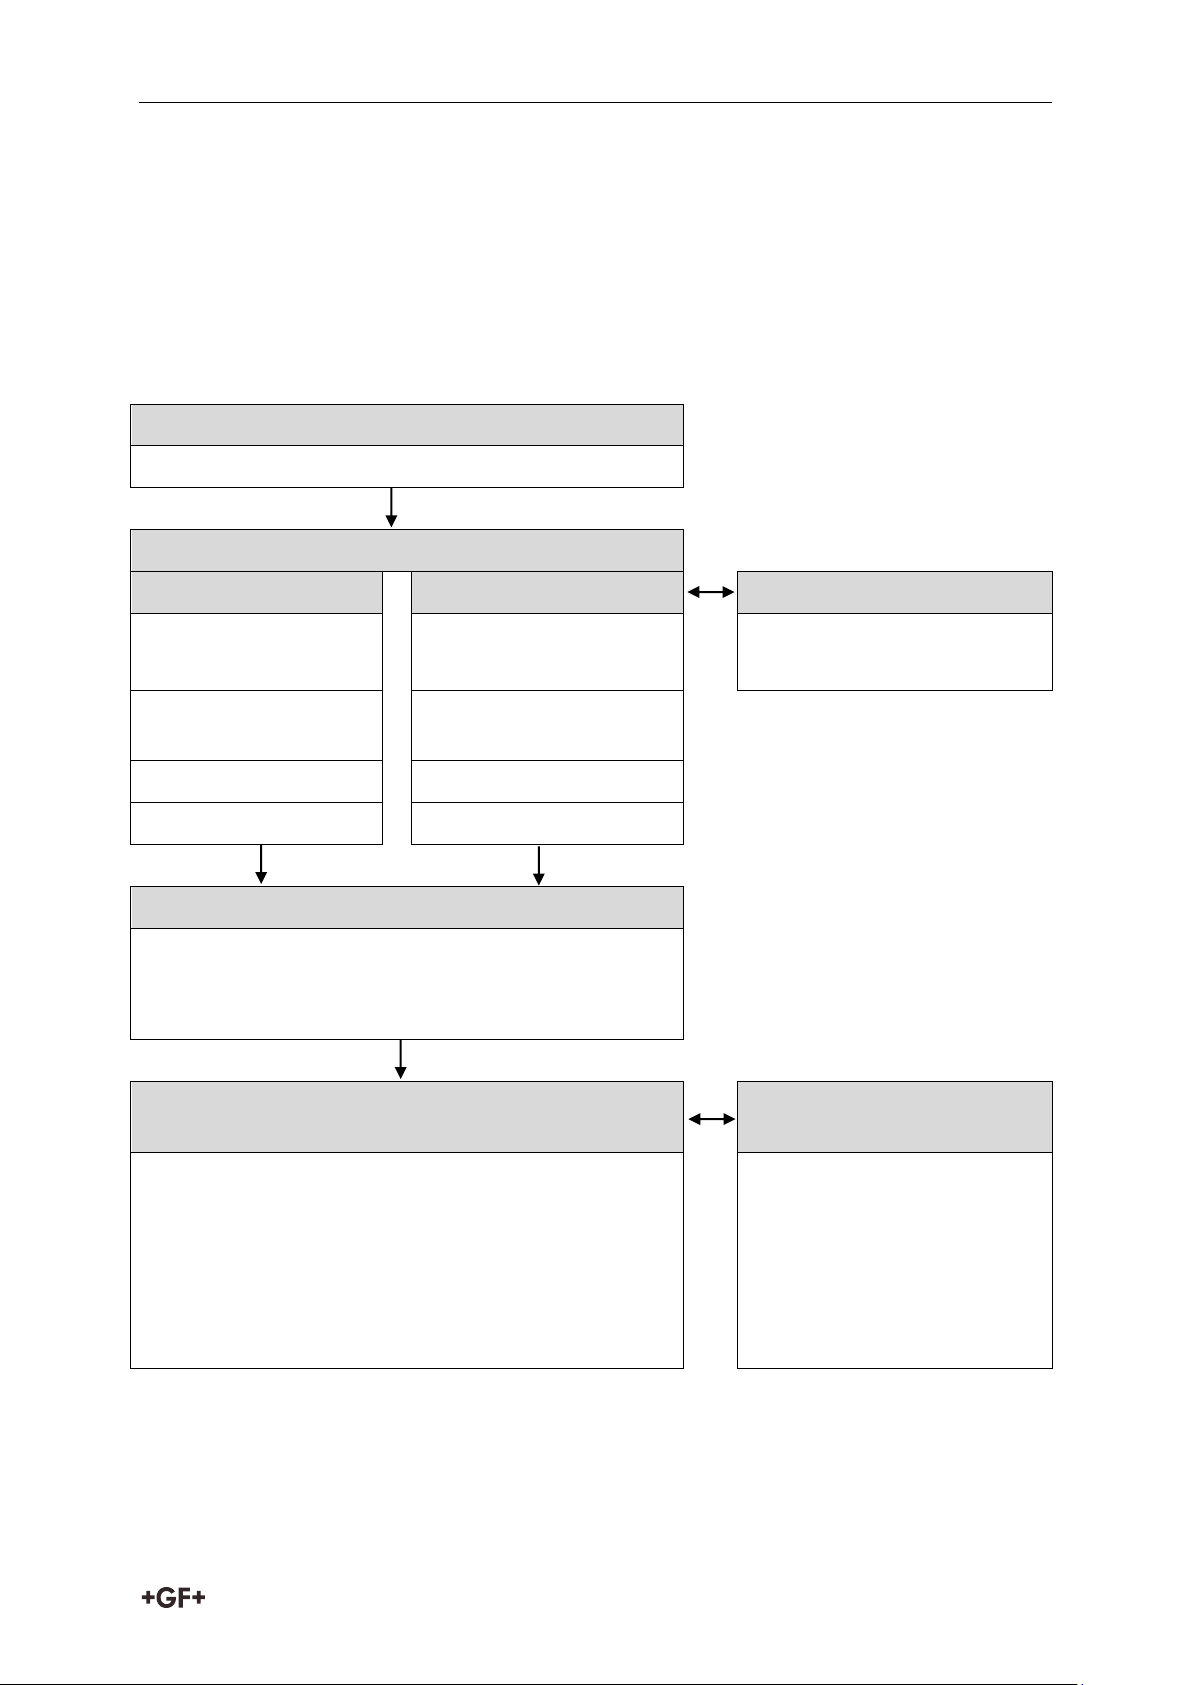
Initial instrument setup
Battery charging, Set date/time, Language, Backlight
Connect and take basic flow readings
At a one-off location
At a frequent location
Manage site details
QUICK START
VIEW EDIT SITE DATA
Set up a named site
Rename a site
Enter data
Choose site /
check/edit data
Attach sensors
Attach sensors
FLOW READING
FLOW READING
Carry out any necessary calibration
How to adjust the Calibration Factor
How to adjust the Roughness Factor
How to adjust the Damping Factor
Set-up a monitoring or logging application
Configure the
interfaces/outputs
How to measure totalised flows
How to set up basic (manual) logging
How to set up auto-timed logging
How to download logged data
4-20mA ON/OFF
4-20mA Calibration
Pulse ON/OFF
Pulse calibration
Pulse frequency mode
Pulse frequency calibration
6.3 Installing the Data Logging Software
The supplied USB memory key contains a copy of the Portagraph program (together with user
manual) which is used to display and save the logged data using a Microsoft based PC. The
manual should be copied to a PC and the Portagraph software installed before the system is
used to log data. A file on the USB key contains the instructions for installing the application.
Contact your local GF partner if the computer to be used is Apple based.
7 Operating Procedures
17
Page 19
Operating Procedures Instruction manual
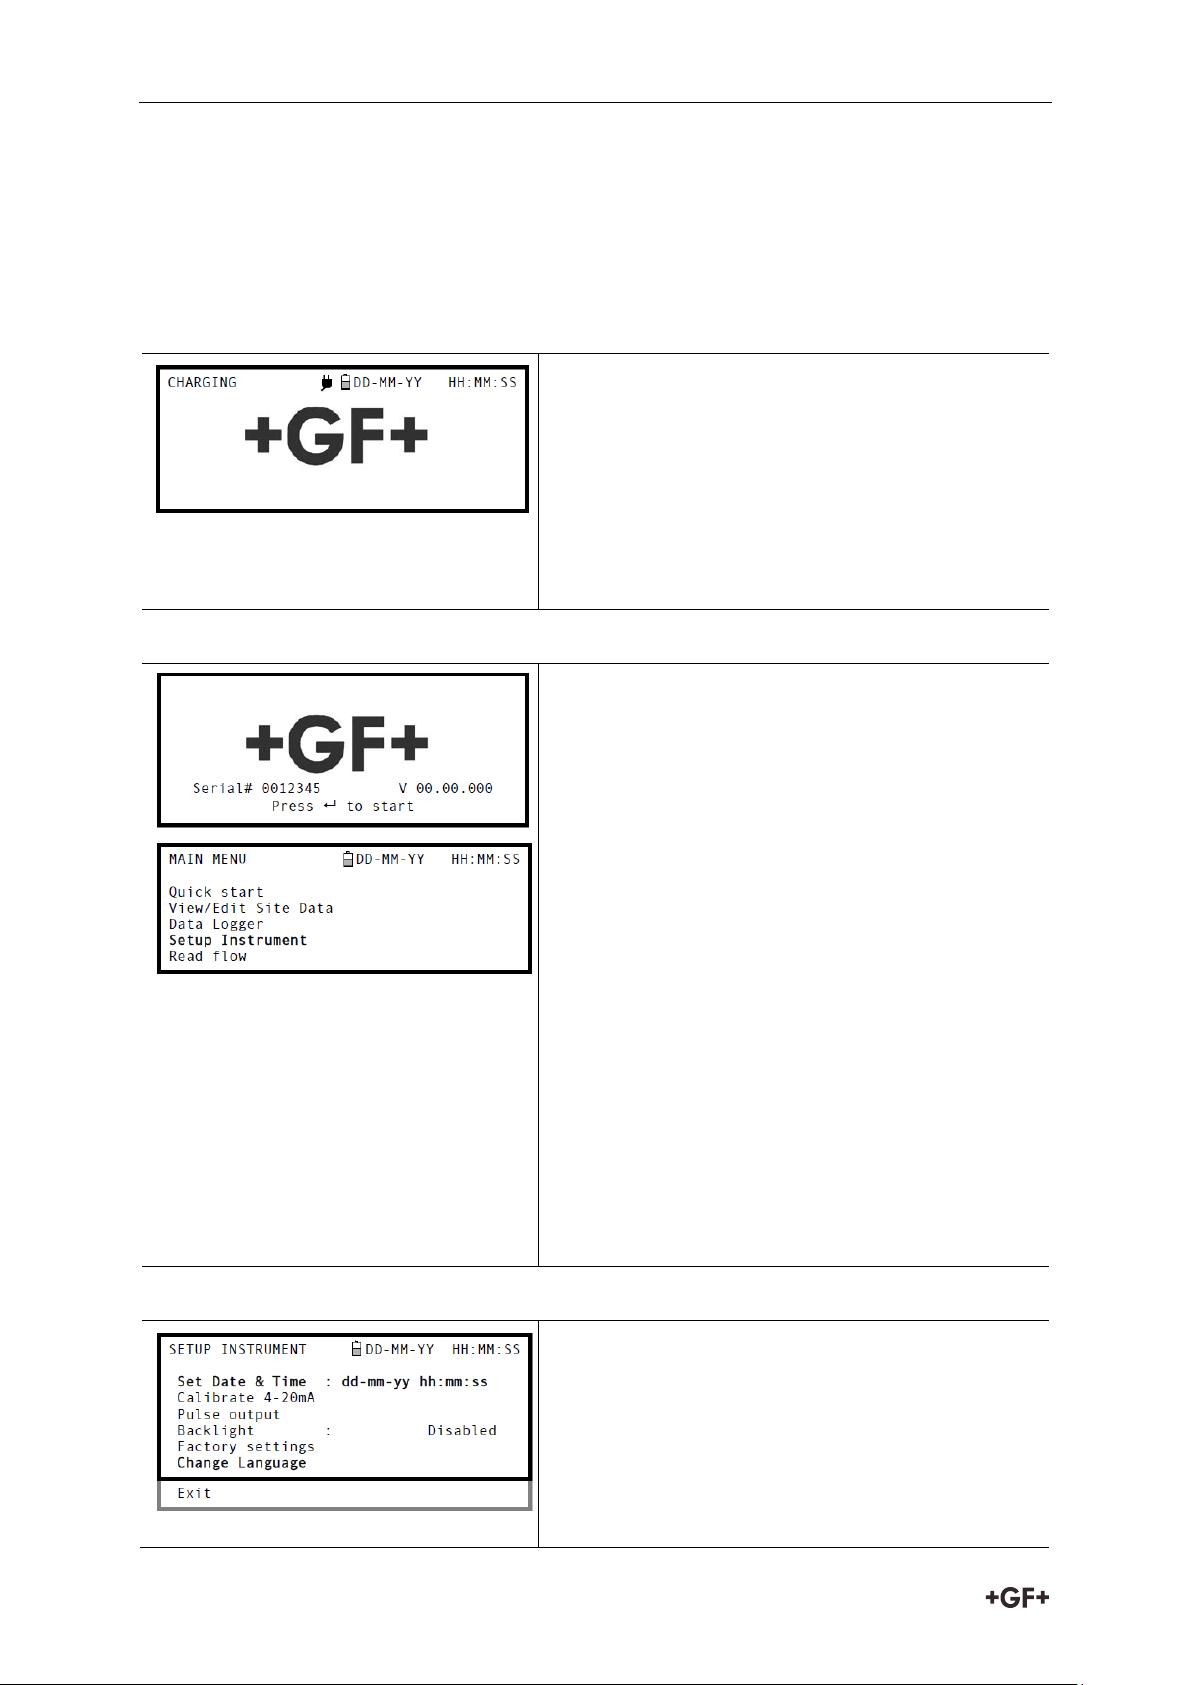
1. Connect the external battery charger to the
charger socket at the bottom of the
instrument then switch on the utility supply.
2. The instrument should indicate CHARGING
and an animated battery symbol indicates that
the battery is taking on charge.
3. Leave the instrument on charge for 6.5 hours
before using it for the first time.
Selecting a language
The first time you switch on the instrument you
may be asked to select a user language.
1. Switch on the instrument by pressing the
N/OFF button.
2. If necessary, select the required language
using the UP/DOWN scroll keys then press
the ENTER key.
3. The selected language will be the default
when the instrument is next used. To change
the language again select the Change
Language option in the SETUP INSTRUMENT
screen (see below)
4. The initialisation screen will be displayed,
giving details of the instrument’s serial
number and software revision details.
5. Press the ENTER key to start the instrument.
6. This is the MAIN MENU and is the starting
7. point for all the operations described in his
chapter.
Setting the Date & Time
1. Select Setup Instrument from the MAIN
MENU. The screen shown here should be
displayed.
2. Select Set Date & Time and click ENTER.
3. A flashing cursor should appear under the
first date number. Enter the date sequence in
dd-mm-yy order then press the ENTER key.
7.1 Setting-up the Instrument
7.1.1 Using the instrument for the first time
Before you use your Portaflow 330 for the first time you should first charge the battery, then
select the display language and set-up the internal clock, as described below.
Charging the battery
18
Page 20
Instrction manual Operating Procedures
4. Repeat this action to set the time.
5. Select Exit then press the ENTER key to return
to the MAIN MENU.
If you make a mistake when entering the data press the Delete key to move the cursor back
to the number you wish to change, then continue. If you enter an invalid number an
‘ERR:Invalid Date or Time!’ error message is displayed on the second line of the screen. If
this occurs repeat the set date/time procedure.
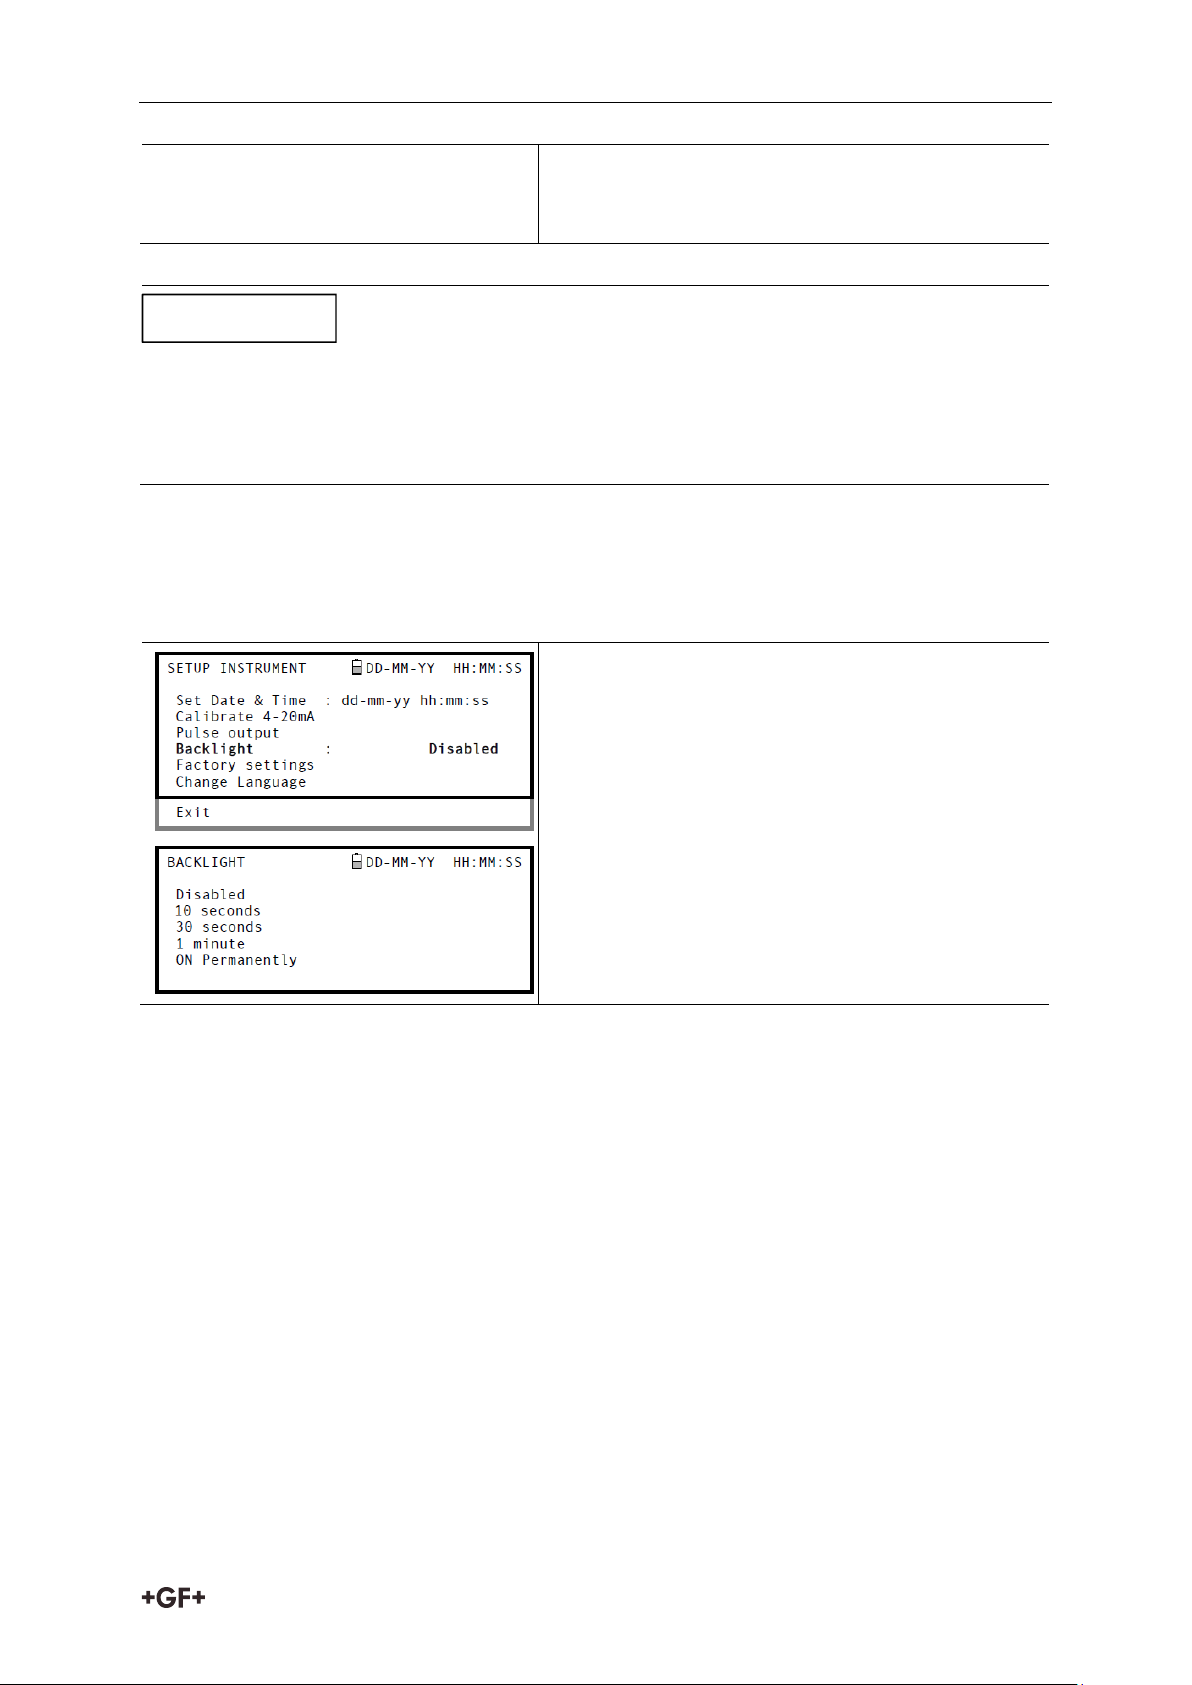
1. Select Setup Instrument from the MAIN
MENU.
2. Select Backlight from the SETUP
INSTRUMENT screen then press the ENTER
key.
3. Select the required backlight operation.
4. Press the ENTER key to return to the SETUP
INSTRUMENT screen.
5. Select Exit then press the ENTER key to return
to the MAIN MENU
NOTICE
7.1.2 Enabling/disabling the backlight
The backlight can be selected to be either Disabled, illuminated for 10 seconds, 30 seconds or
1 minute every time a key is pressed, or ON permanently. If the backlight is not required it is
recommended that you disable it to prolong the battery discharge time.
7.2 Using the Quick Start Menu
the quickest way to set up the Portaflow system and access the FLOW READING screen. If the
point at which you intend to take the measurement is likely to require regular monitoring it is
best to set it up as a ‘Site’ within the Portaflow 330, which then stores the site parameters
Before you can use the Portaflow system you need to obtain the following details (this
information will be required when setting up the Quick Start menu):
The pipe outside diameter.
The pipe wall thickness and material.
The pipe lining thickness and material.
The type of fluid.
The fluid temperature.
19
Page 21
Operating Procedures Instruction manual
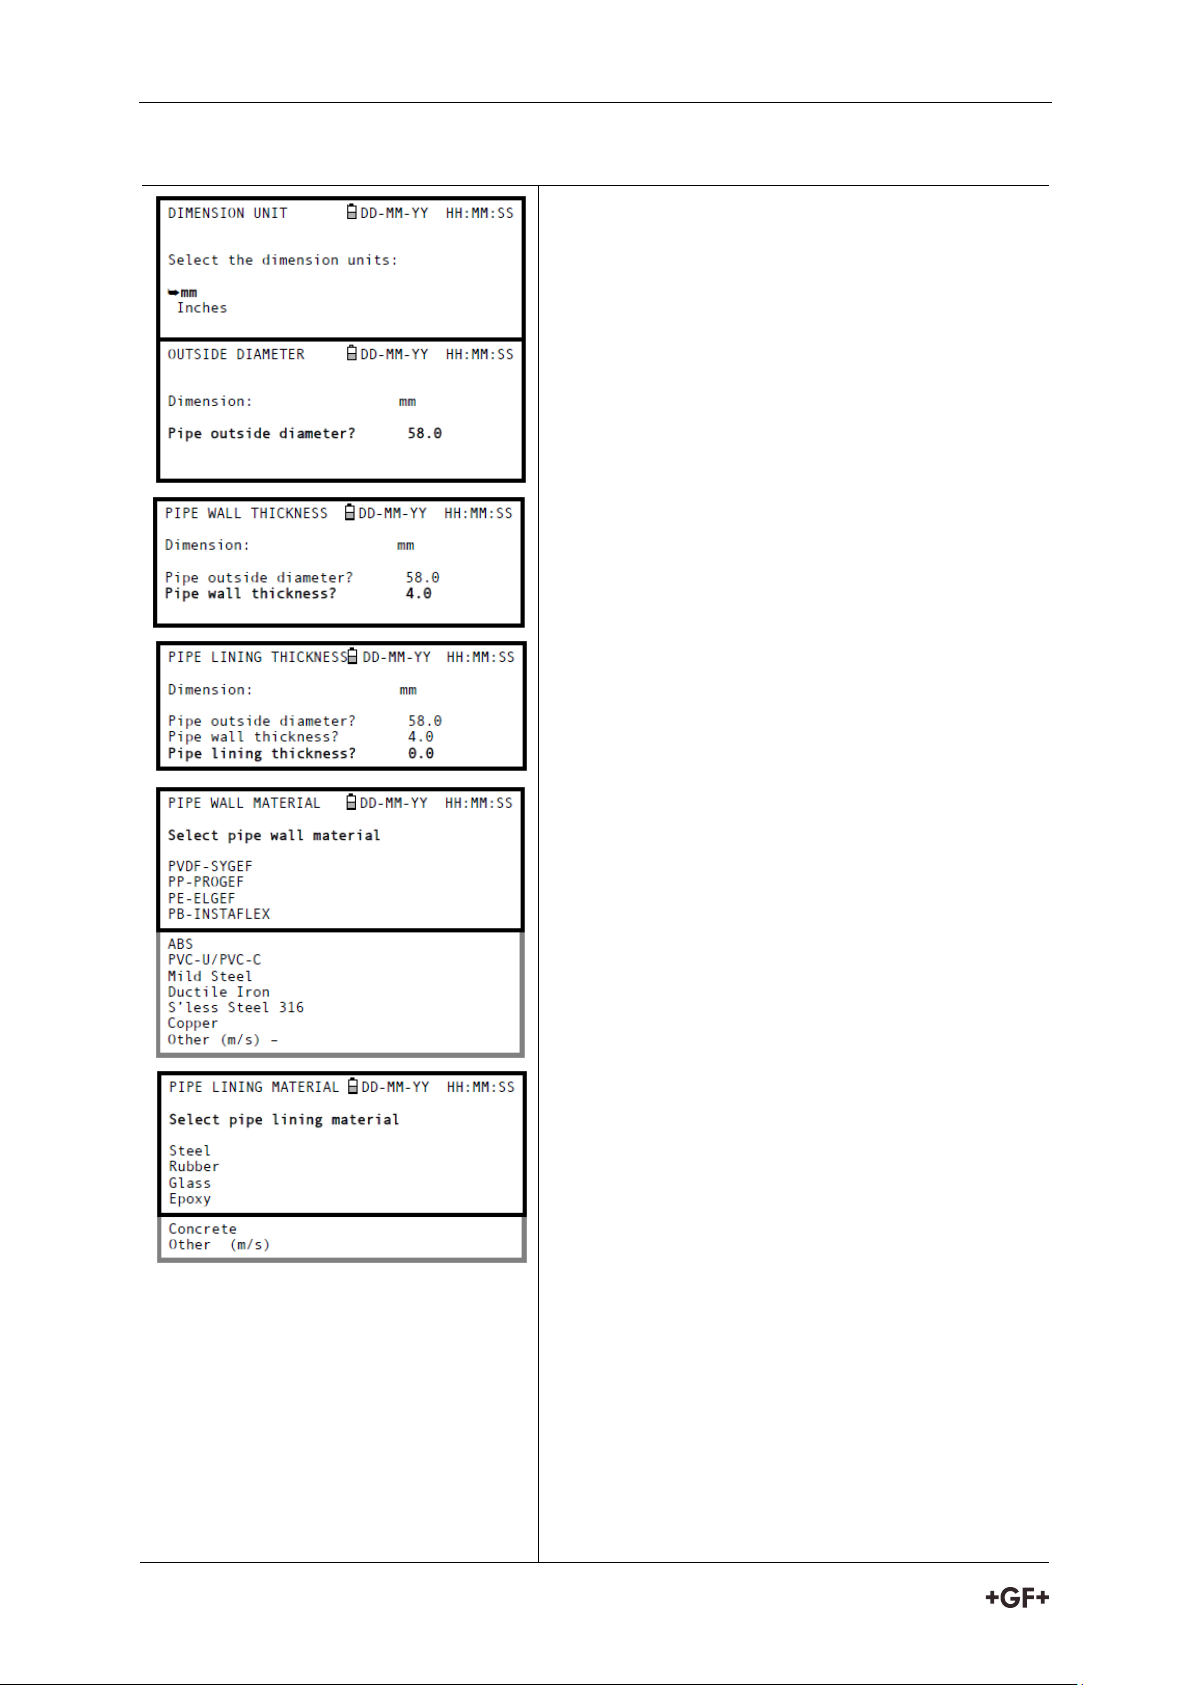
1. Select Quick Start from the MAIN MENU and
press the ENTER key. You will then be
presented with a series of screens in which to
enter the data mentioned above.
2. Select the dimension units (millimetres or
inches) used to measure the pipe, then press
the ENTER key.
3. Enter the pipe outside diameter dimension,
then press the ENTER key.
4. Enter the pipe wall thickness dimension, then
press the ENTER key.
5. If the pipe has a lining, enter the lining
thickness. If nothing is entered the instrument
automatically assumes there is no lining.
6. Press the ENTER key to continue
7. Select the pipe wall material from the list
provided, then press the ENTER key.
If the material is not listed select Other and
enter the propagation rate of the pipe wall
material in metres/sec. Contact your local GF
partner if this is not known.
8. If a lining thickness value was entered earlier,
this screen is displayed to request that you
enter the lining material type. If no lining
thickness was entered this screen will be
bypassed.
9. Select the lining material from the list
provided then press the ENTER key. If the
material is not listed select Other and enter
the propagation rate of the lining material in
metres/sec. Contact your local GF partner if
this is not known.
10. Select the fluid type from the list provided and
press the ENTER key. If the liquid is not listed
select Other and enter a propagation rate in
metres/second.
Entering the site data
20
Page 22
Instrction manual Operating Procedures
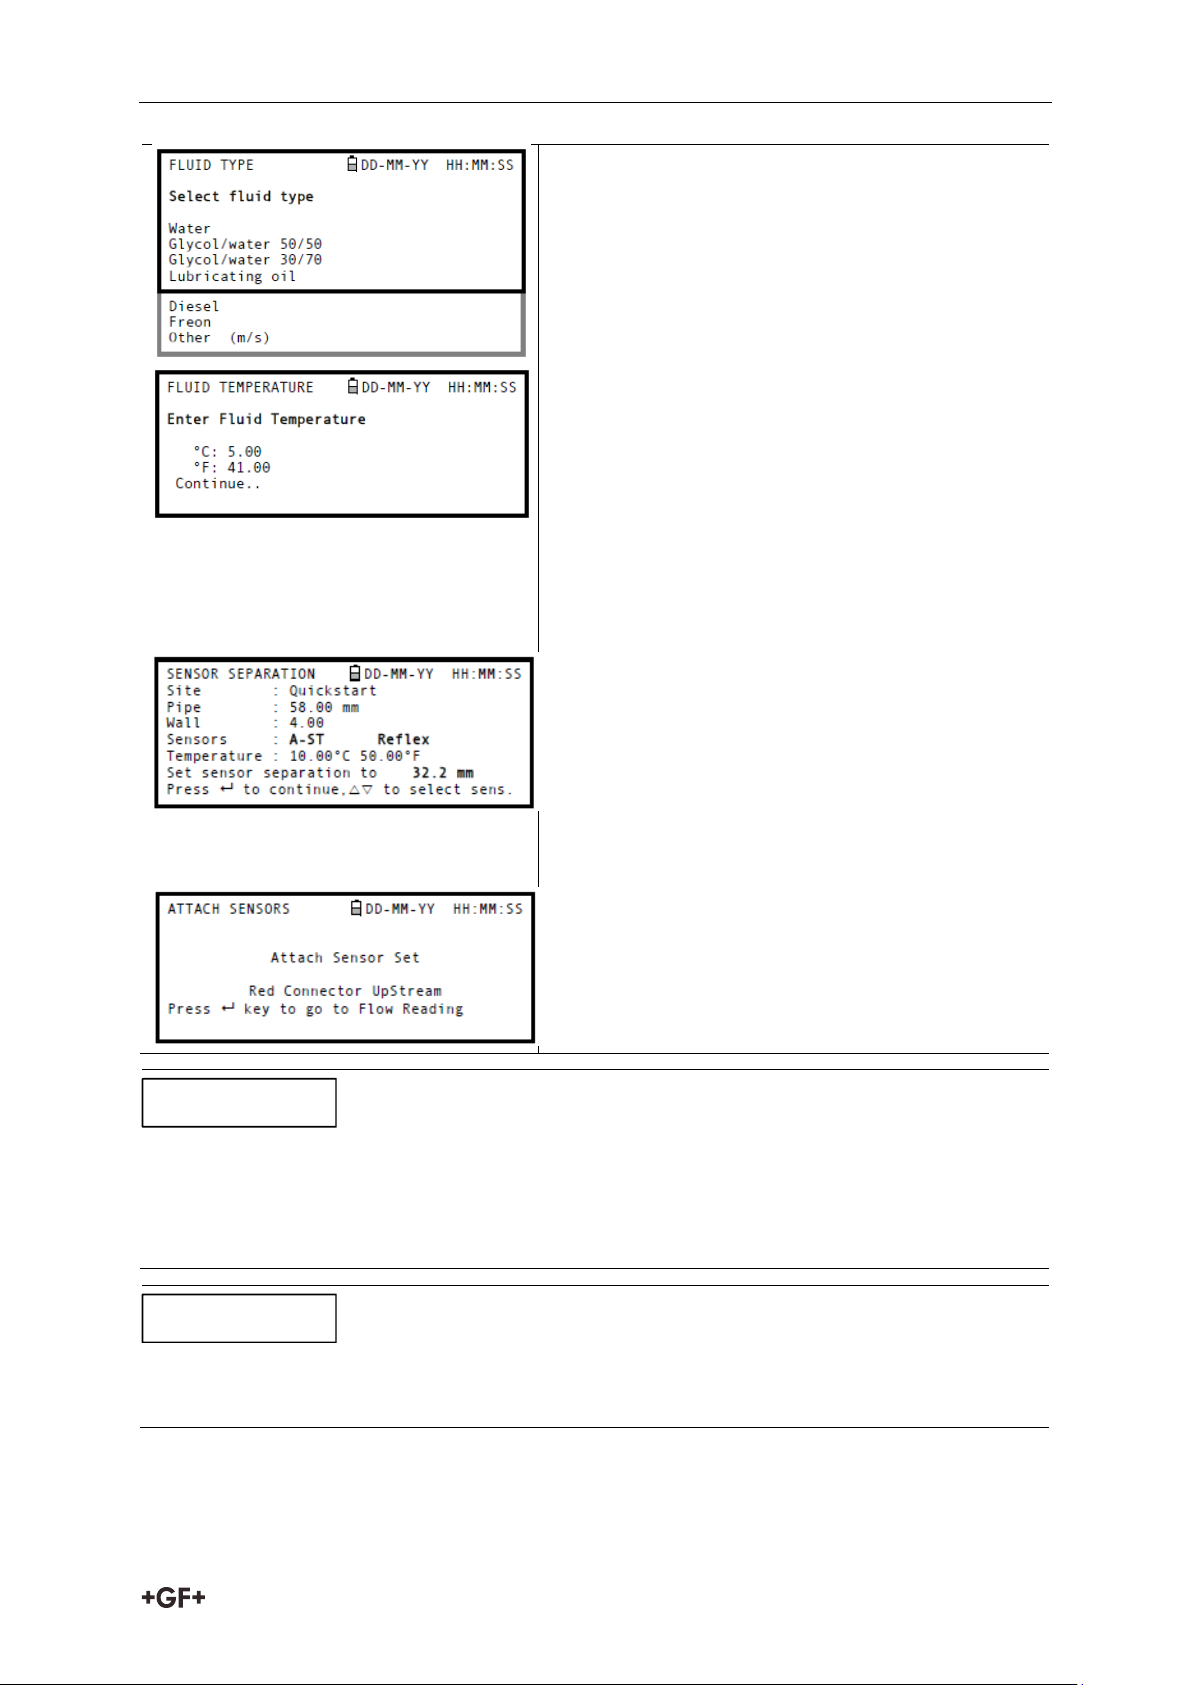
11. If you need to alter the fluid temperature from
that shown select either °C or °F with the
cursor and press the ENTER key.
12. Enter the new temperature value and ress the
ENTER key.
13. The new temperature should now be indicated
in both °C and °F.
14. Select Continue. then press the ENTER key.
15. The SENSOR SEPARATION screen now
displays a summary of the entered parameters
and informs you of the type of sensor to be
used, the mode of operation and the distance
to set up between the sensors. In this example
it recommends type A-ST (A standard) sensors
operating in the ‘Reflex’ mode spaced at
32.2mm apart.
16. Take a note of the displayed parameters, then
press the ENTER key.
17. The ATTACH SENSORS screen displays, giving
instructions to attach the sensors.
The SENSOR SELECTION menu can be entered by use of the Up/Down scroll keys. This
allows the type and mode of the sensors being used to be selected. This menu will be
entered automatically if the entered pipe OD and/or temperature are not valid for the
currently selected sensors.
Do not press the ENTER key until the transducers are fitted and connected to the
instrument.
NOTICE
NOTICE
21
Page 23
Operating Procedures Instruction manual
18. Fit the designated sensors to the pipe using the appropriate guide rails. Take great care
to set the separation distance as accurately as possible.
19. Connect the red and blue coaxial cables between the sensors and the test instrument,
ensuring that the red connector on the instrument is connected to the ‘upstream’
sensor.
Taking a flow reading
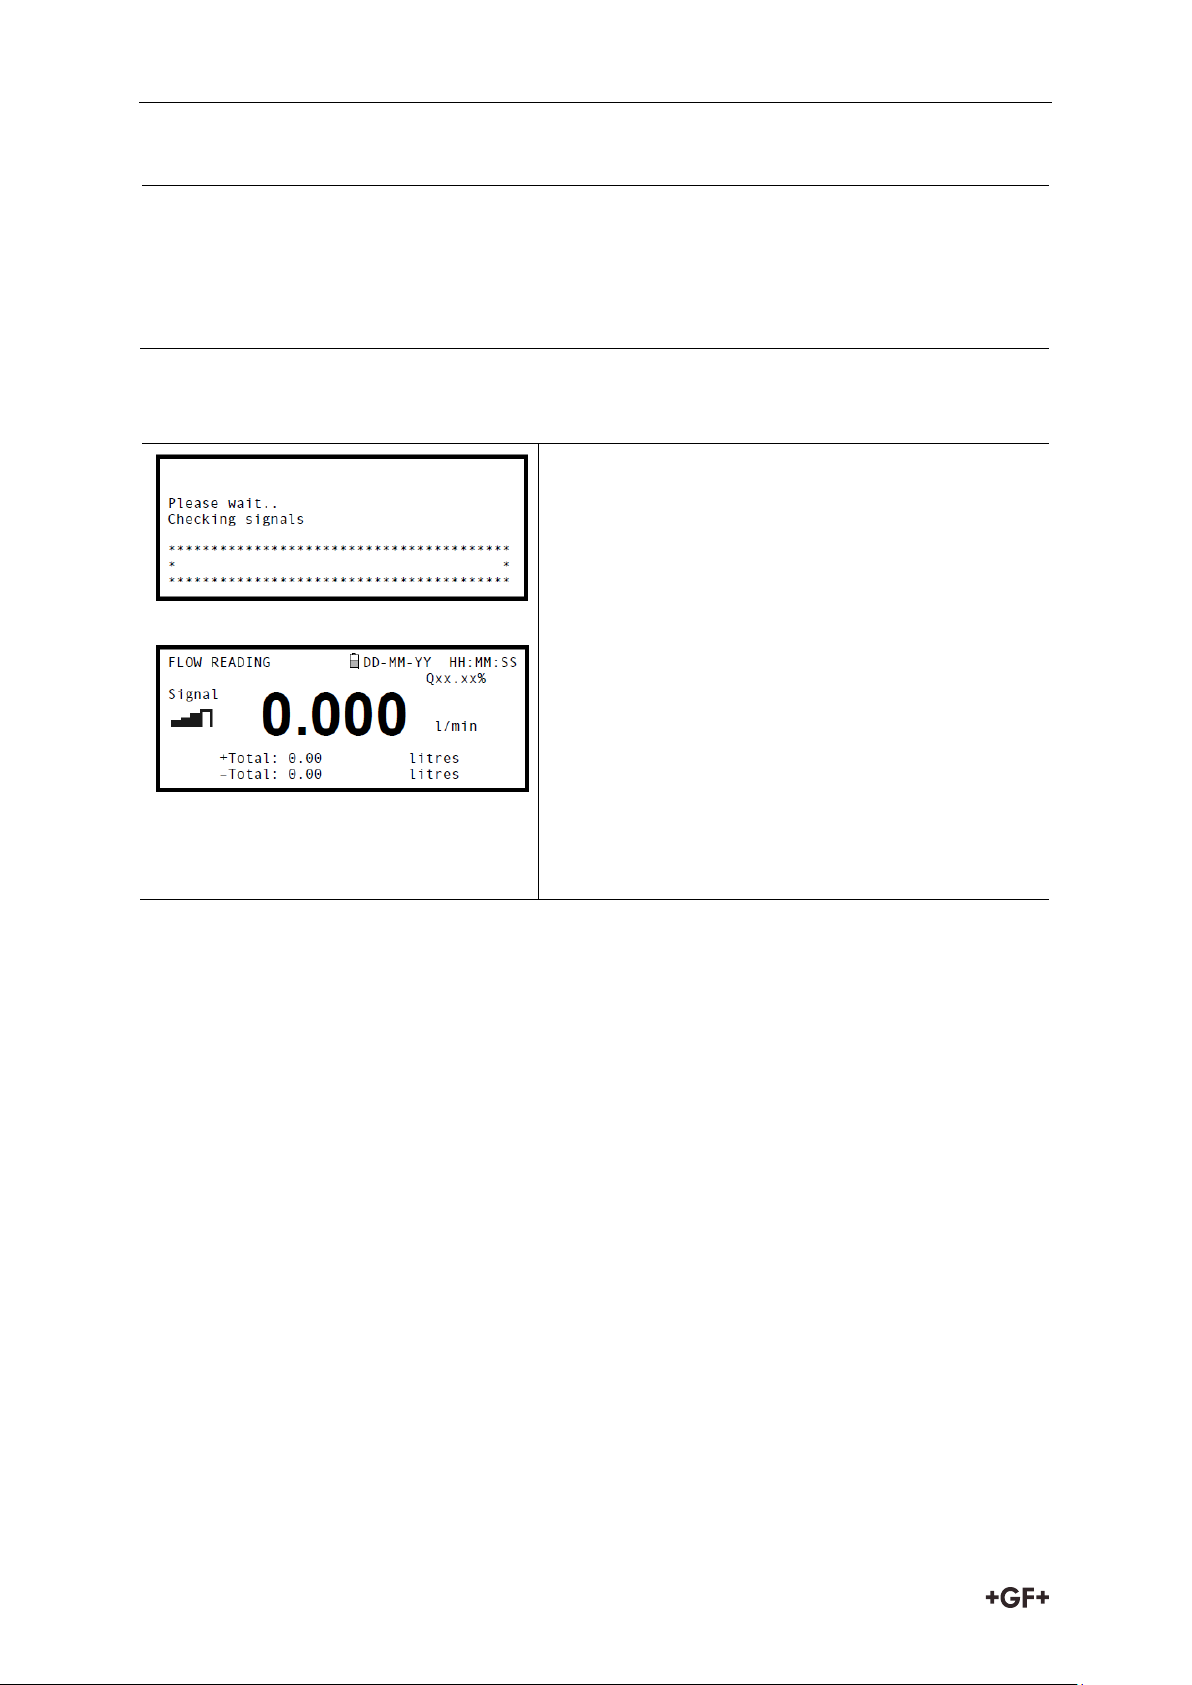
20. Once the transducers have been fitted and
connected, press the ENTER key on the
ATTACH SENSORS screen.
21. This will take you to the FLOW READING
screen via a signal-checking screen (shown
here).
22. Check that the indicated signal strength on the
left of the screen is at least 2 bars (ideally 3 or
4). If less than 2 bars are shown it indicates
there could be a problem with the transducer
spacing, alignment or connections; or it could
be due to an application problem.
23. Qxx.xx% indicates the signal quality and
should have a value of 60% or greater.
Attaching and connecting the transducers
Flow monitoring
The FLOW READING screen is the one most used during normal monitoring operation. It
shows the instantaneous fluid flow together with totalised values (when enabled). In this
mode you can select the flow rate measurement units by pressing keys 7 (litres), 8 (Gallons,
Barrels) or 9 (m³), or change the display to show velocity by pressing key 4.
If the flow reading exceeds a value of +/-9999 in the current units then a *10 multiplier will be
displayed above the units and the value displayed will be a tenth of the actual value. Similarly
a * 100 and *1000 may be displayed on very large flow rates.
There are limitations on the use of these larger flow values with regards to logging of data
and setting the current and pulse outputs. If the flow reading is less than 32000 m³/hour then
the value can be logged and downloaded via a USB memory key.
7.3 Using the System at a Regularly Monitored Location
Setting up the Portaflow system using the Quick Start method is easy and the recommended
method to use in a ‘one-off’ situation. But if you have a site location that you want to monitor
on a frequent basis it is better to set up a named ‘Site’ for that location so that you can recall
it when needed and so avoid the need to re-enter the site details every time you want to install
the equipment there.
22
Page 24
Instrction manual Operating Procedures
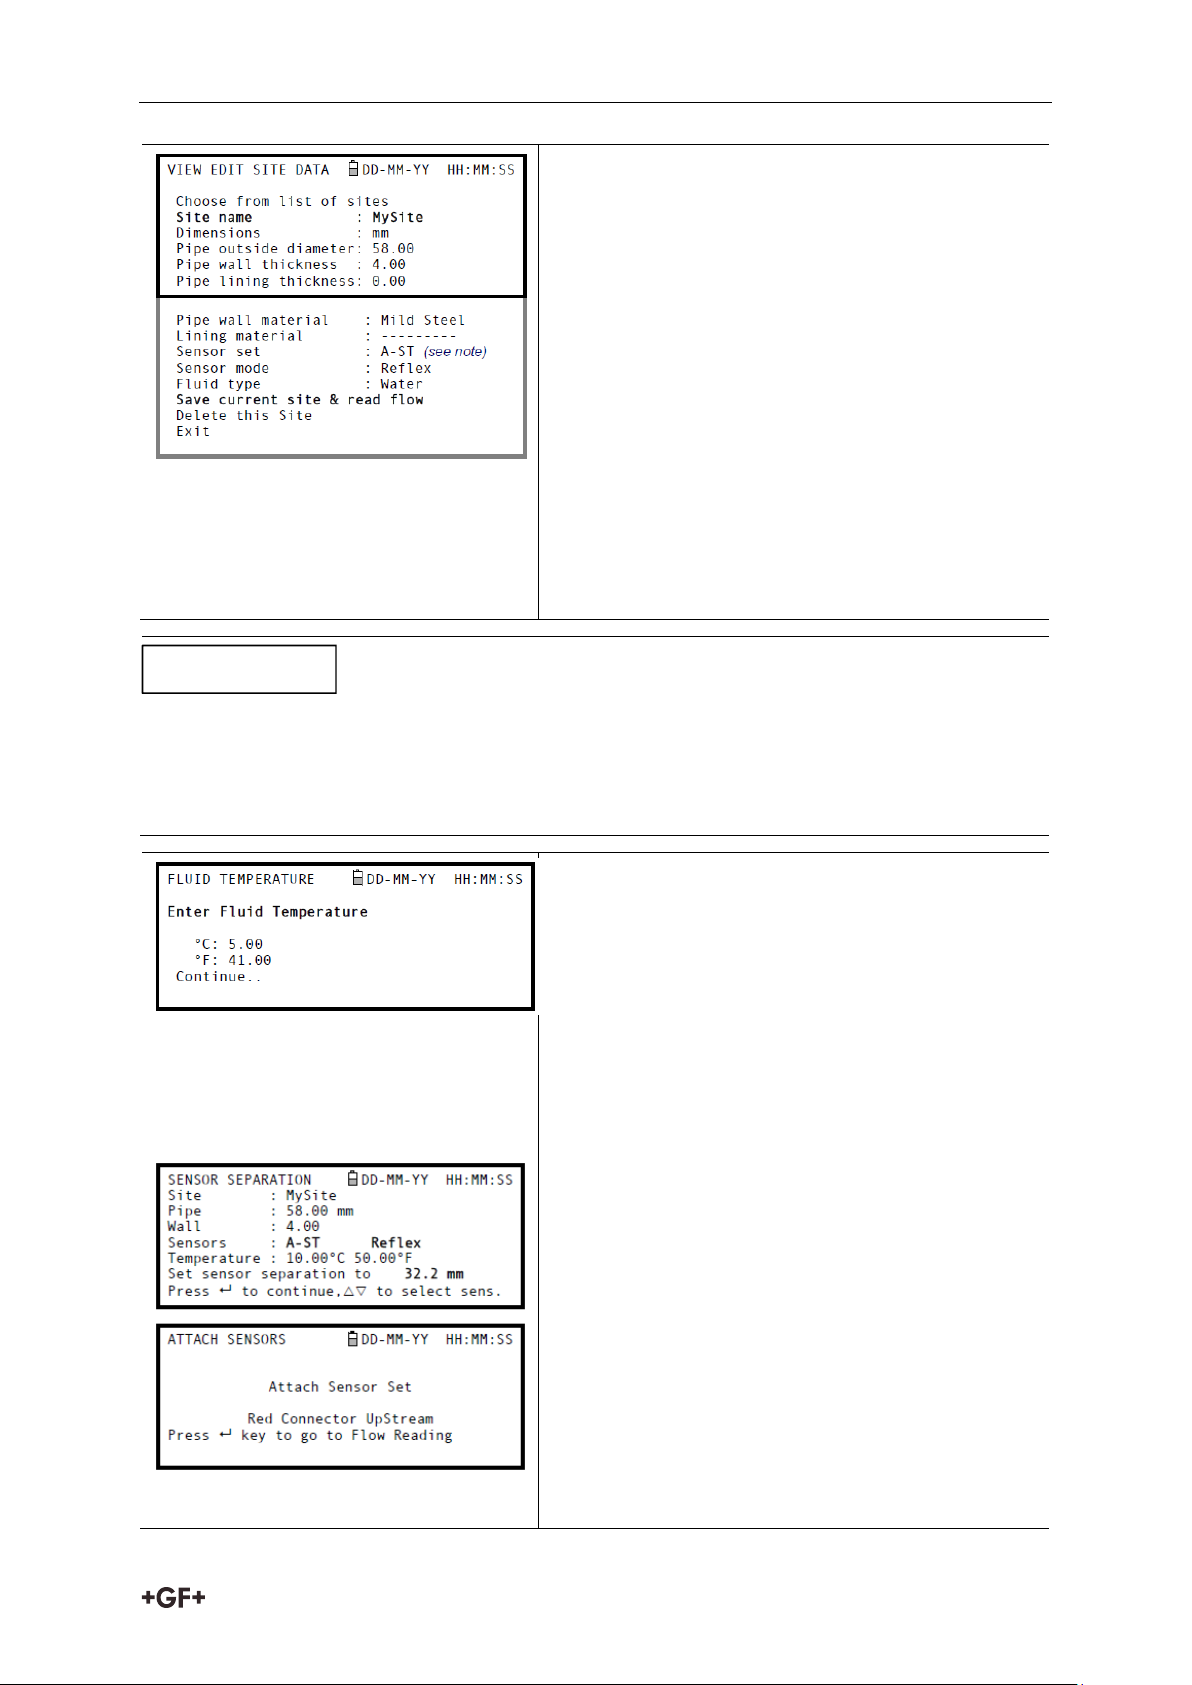
1. Once Select View Edit Site Data from the MAIN
MENU.
2. Select Choose from list of sites.
3. Select one of the sites listed and press the
ENTER key.
4. The Site name will show the selected site and
the site parameters will be listed on the
screen.
5. Scroll down through the menu list and
enter/change the data that might have
changed since the last time the site was
accessed.
6. When you are satisfied that the parameters
are correct select Save current site & read
flow.
If you select a different Sensor set (e.g. A-ST) when entering new site data you could receive
an “invalid” error message if the previous Sensor set was operating at a temperature above
135ºC. If this occurs, ignore the warning as it will disappear when you enter a temperature in
the correct range for new sensors.
7. If you need to alter the fluid temperature from
that shown select either °C or °F with the
cursor and press the ENTER key.
8. Enter the new temperature value and press
the ENTER key.
9. The new temperature should now be indicated
in both °C and °F.
10. Select Continue.. and then press the ENTER
key.
11. The SENSOR SEPARATION screen now
displays a summary of the entered parameters
and informs you of the type of sensor to be
used, the mode of operation and the distance
to set up between the sensors. In this example
it recommends type A-ST (A standard) sensors
operating in the ‘Reflex’ mode spaced at
32.2mm apart.
12. Take a note of the displayed parameters, then
press the ENTER key.
13. The ATTACH SENSORS screen displays, giving
instructions to attach the sensors.
NOTICE
23
Page 25
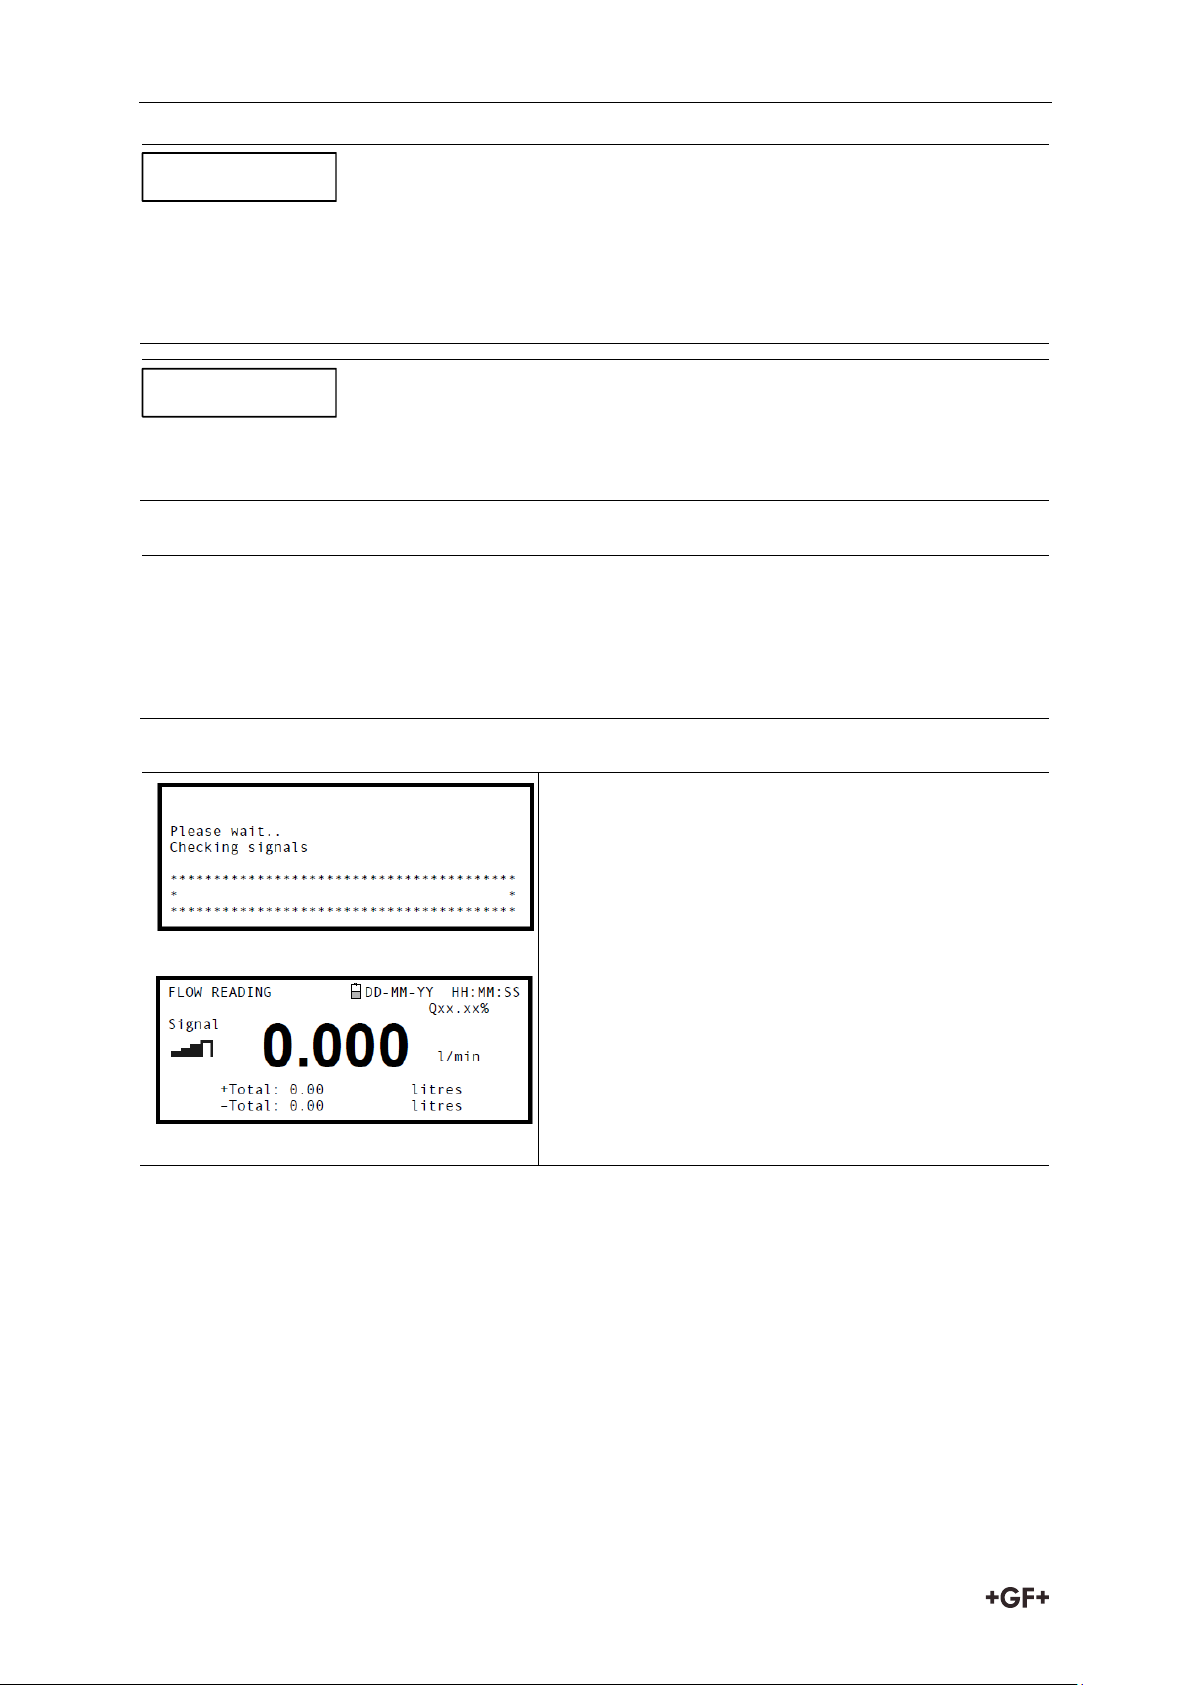
Operating Procedures Instruction manual
The SENSOR SELECTION menu can be entered by use of the Up/Down scroll keys. This
allows the type and mode of the sensors being used to be selected. This menu will be
entered automatically if the entered pipe OD and/or temperature are not valid for the
currently selected sensors.
Do not press the ENTER key until the transducers are fitted and connected to the
instrument.
14. 14. Fit the designated sensors to the pipe using the appropriate guide rails. Take great
care to set the separation distance as accurately as possible.
15. Connect the red and blue coaxial cables between the sensors and the test instrument,
ensuring that the red connector on the instrument is connected to the ‘upstream’
sensor.
16. Once the transducers have been fitted and
connected, press the ENTER key on the
ATTACH SENSORS screen.
17. This will take you to the FLOW READING
screen via a signal-checking screen (shown
here).
18. Check that the indicated signal strength on the
left of the screen is at least 2 bars (ideally 3 or
4). If less than 2 bars are shown it indicates
there could be a problem with the transducer
spacing, alignment or connections; or it could
be due to an application problem.
NOTICE
NOTICE
Attaching and connecting the transducers
Taking a flow reading
Flow monitoring
The FLOW READING screen is the one most used during normal monitoring operation. It
shows the instantaneous fluid flow together with totalised values (when enabled). In this
mode you can select the flow rate measurement units by pressing keys 7 (litres), 8 (Gallons,
Barrels) or 9 (m³), or change the display to show velocity by pressing key 4.
7.4 Managing Named Sites
If you want to monitor a particular site location frequently you can set up a named ‘Site’ to
store the installation details, such as pipe dimensions and material, required to set-up the
Portaflow 330 system. These can then be recalled later when revisiting that particular
location. The instrument can store up to 20 sites, the first site is reserved for QUICK START
24
Page 26
Instrction manual Operating Procedures
Once you have set up a named site you are advised to log some data to the site in order to
avoid the possibility of the site name being overwritten when the QuickStart data is saved.
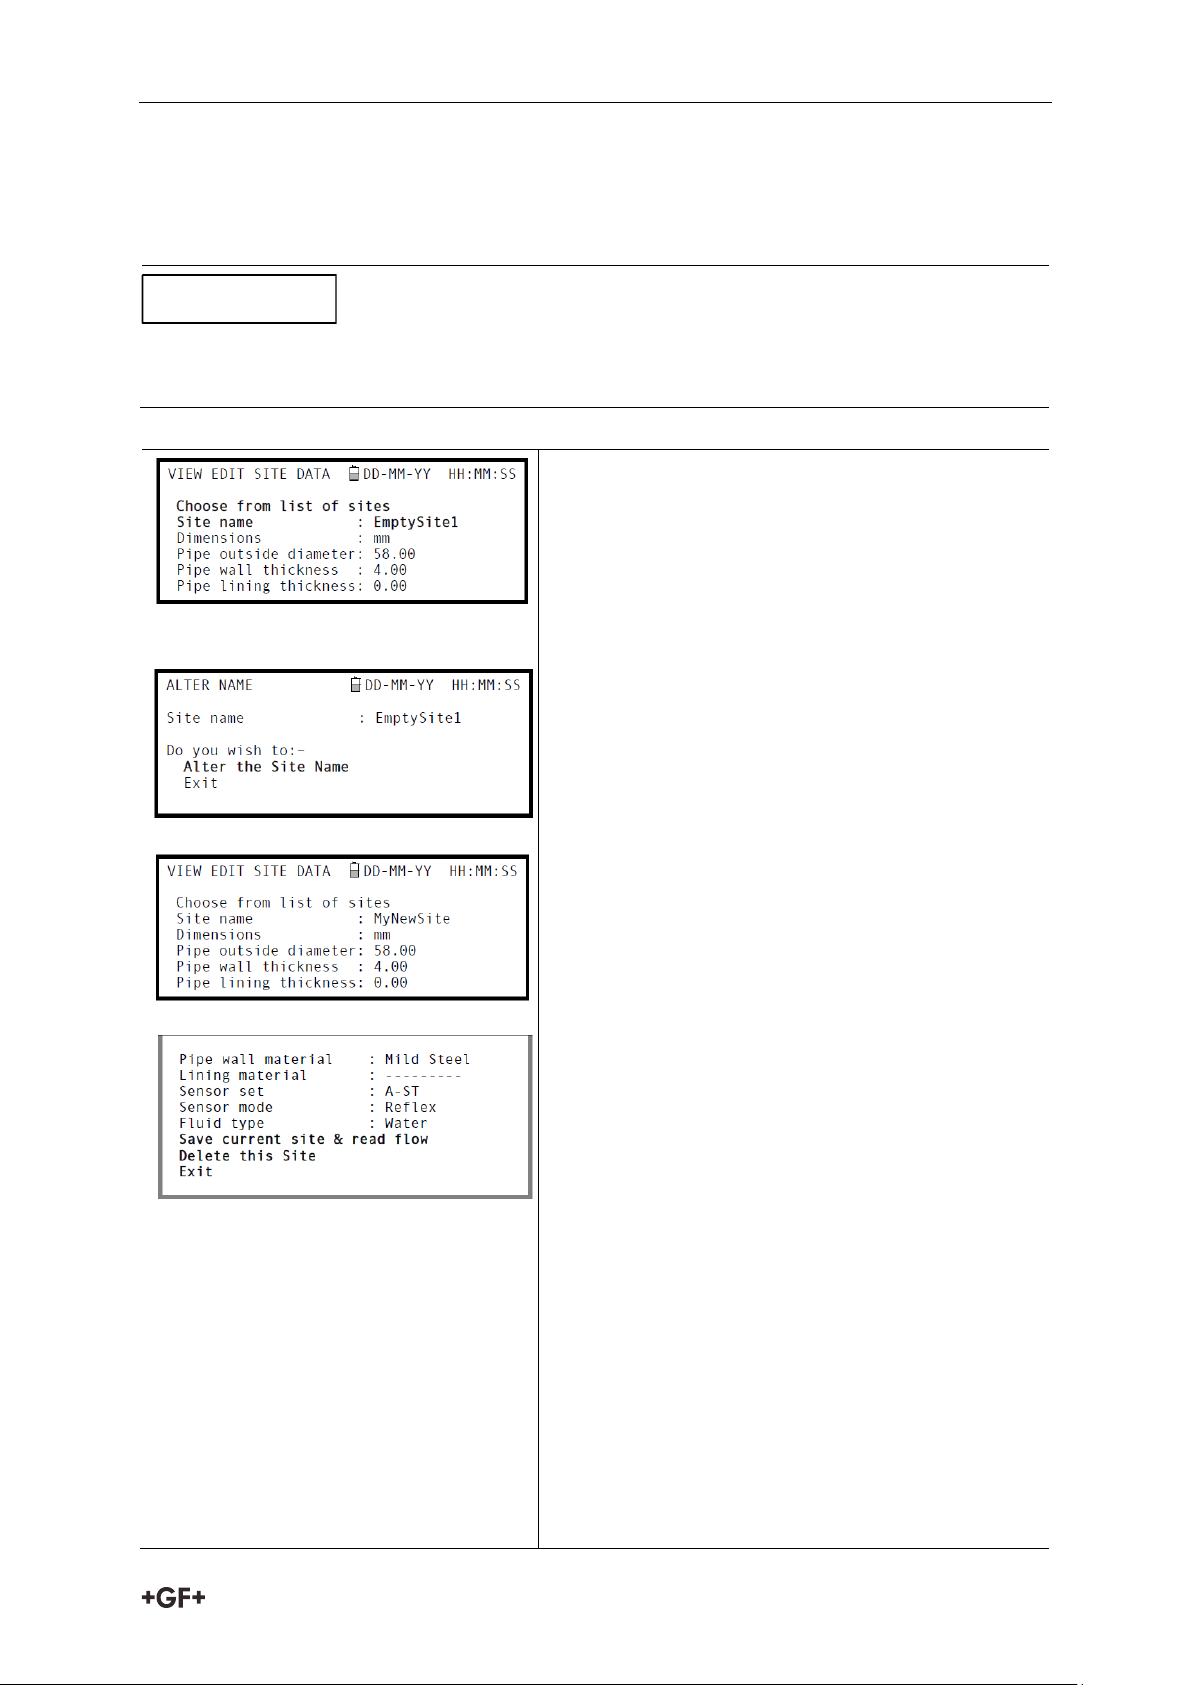
1. Select View Edit Site Data from the MAIN
MENU.
2. Select Choose from list of sites.
3. Select one of the EmptySites from the
presented list (e.g. EmptySite 1 as shown).
4. Select Site name and press the ENTER key.
5. This opens the ALTER NAME screen.
6. Select Alter the Site Name and you will be
presented with a screen which allows you to
enter a new name in much the same way as
when composing a mobile text message.
7. On completion press the ENTER key then
select Exit. This will take you back to the VIEW
EDIT SITE DATA screen.
8. Scroll down through the menu list and enter/
change the pipe parameters and other data
pertaining to the site. Note that this menu
allows you to choose a Sensor Set, unlike the
QUICK START menu which recommended the
sensor set to use. If you enter an inappropriate
sensor set in this menu you will be presented
with an error message later when you go to
the SENSOR SEPARATION screen.
9. When all the data is correct you can either:
a) Select Save current site & read flow to
continue fitting the transducers and
opening the FLOW READING screen.
b) Select Delete this site to delete the site
name and values and restore it to the
original EmptySite name.
c) Select Exit to return to the MAIN MENU.
NOTICE
and cannot be renamed; subsequent sites are initially named EmptySite1 through to
EmptySite19.
7.4.1 Setting up a new site
25
Page 27
Operating Procedures Instruction manual
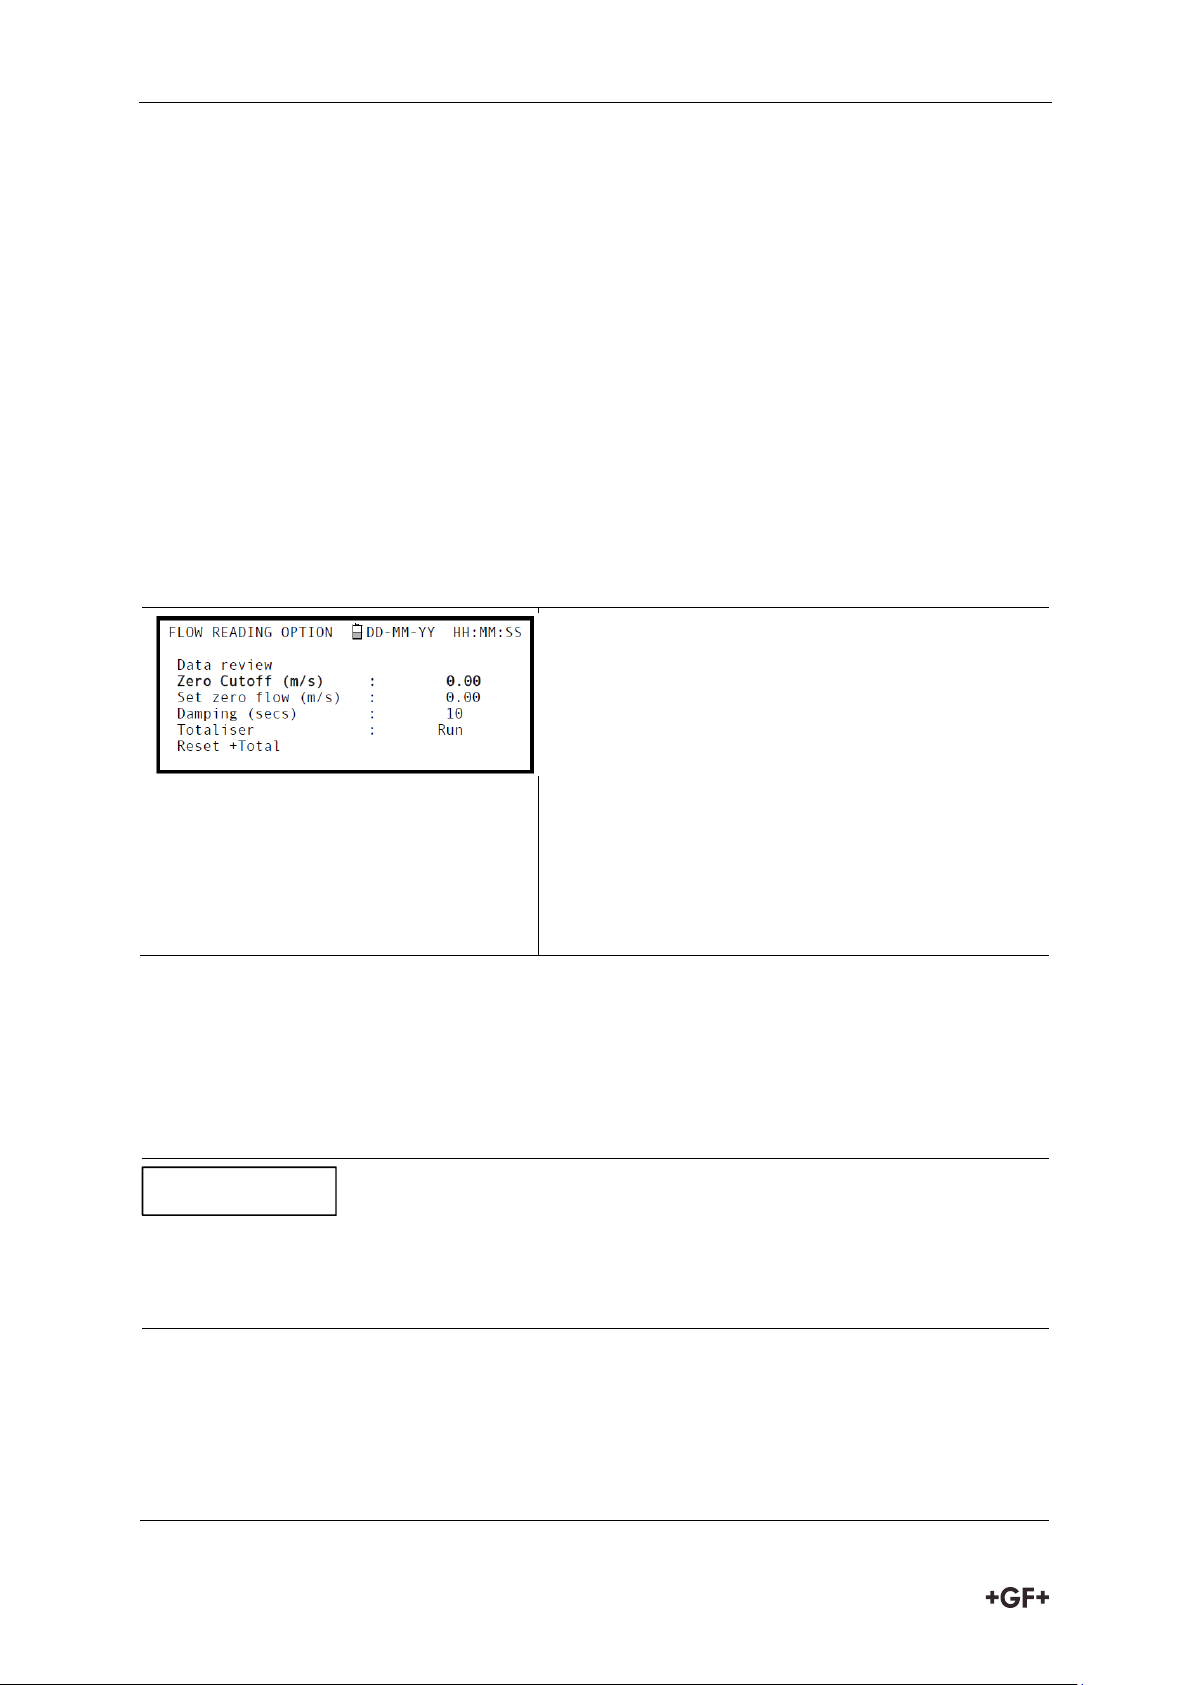
1. With the instrument operating in FLOW
READING mode, press the Options key to
access the FLOW READING OPTIONS menu
shown.
2. Select Zero Cutoff (m/s) and press the ENTER
key.
3. Enter the value for the Zero Cutoff (e.g. 0.06
m/s) then press the ENTER key.
4. Scroll down to select Exit and press the
ENTER key to return to the FLOW READING
screen.
If you have adjusted the Zero Cutoff point to anywhere above ‘0’ you must reset it to ‘0’ before
you can observe and adjust the Set zero flow offset, as its value is very small. Once the Set
zero flow offset has been calibrated you can then reapply the Zero Cutoff if required.
1. Stop the liquid flow.
2. With the instrument in FLOW READING mode press the Velocity function key and
observe the reading (m/s). Any reading other than 0.000 indicates an offset error and in
practice this will typically be in the range ±0.005m/s (possibly higher on smaller
diameter pipes). If a greater figure is shown it is worth calibrating the offset to obtain a
more accurate result. Continue as follows:
NOTICE
7.4.2 Changing a site name
To change a site name use the same method described above for generating a new site: but in
this case access a current site name to change rather than an EmptySite. If you change a site
name while the site is logging the logging will stop.
7.5 Instrument Calibration
The Portaflow is fully calibrated before it leaves the factory; however the following
adjustments are provided to allow you to further ‘fine tune’ your instrument to suit local
conditions and application where necessary. Apart from the zero flow offset adjustment, these
are normally carried out only where the instrument is to be used in a permanent or semipermanent location.
7.5.1 Adjusting the zero cut-off
This adjustment allows you to set a minimum flow rate (m/s) below which the instrument will
indicate ‘0’. The default setting is 0.1 m/s but you may adjust this value if required.
7.5.2 Adjusting the set zero flow offset
The Portaflow instrument operates by comparing the time taken to send an ultrasonic signal
between two transducers in either direction. A Set zero flow offset adjustment is provided to
compensate for any inherent differences between the two sensors, noise pick-up, internal
pipe conditions etc. It can be used to ‘zero’ the flow indication under no-flow conditions.
26
Page 28
Instrction manual Operating Procedures
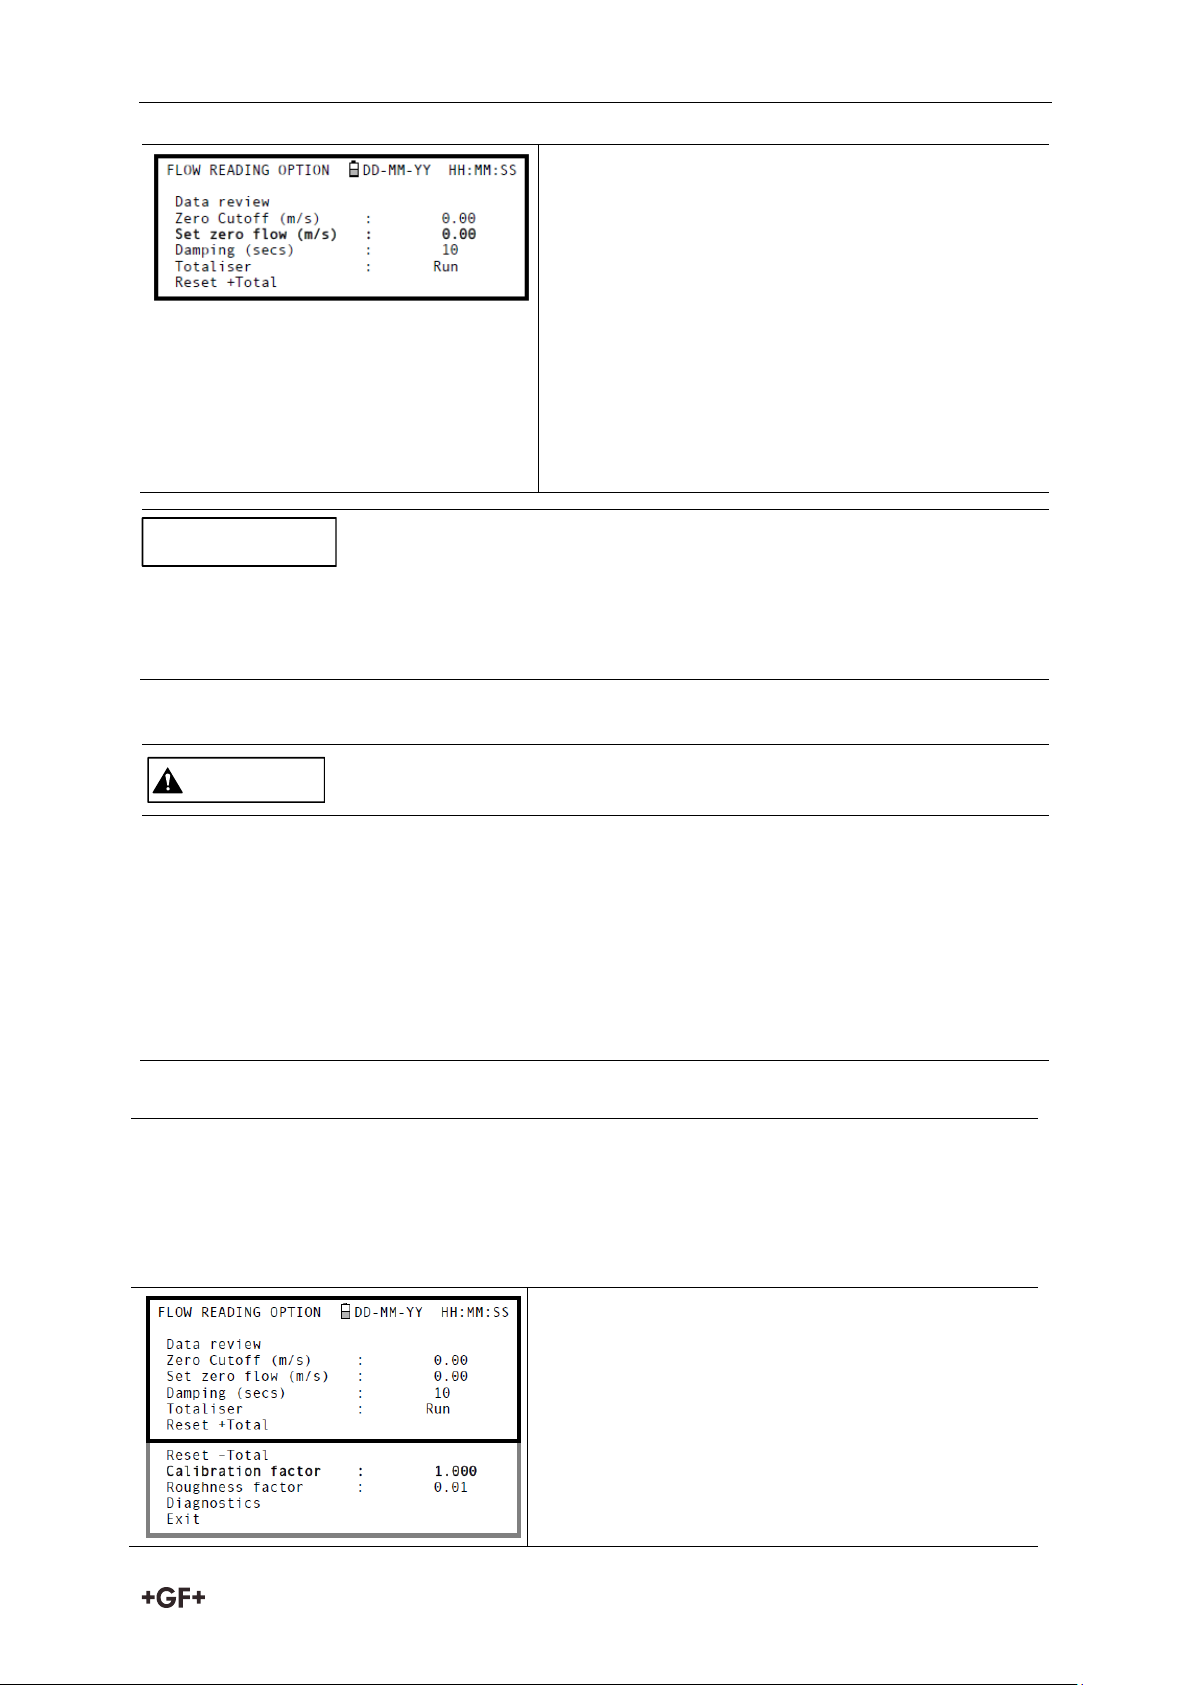
3. Press the Options key to access the FLOW
READING OPTION screen shown.
4. Select Set zero flow (m/s) and press the
ENTER key.
5. Press the ENTER key on the subsequent
screen to accept the change, which will return
you to the screen shown.
6. Scroll down to select Exit and press the
ENTER key to return to the FLOW READING
screen.ENTER key to return to the FLOW
READING screen.
In order to cancel any applied offset you must either read flow via Quick Start or switch the
Portaflow instrument OFF & ON. Any value that you trim-out using the offset adjustment will
be added/subtracted from the flow reading across the whole range.
USE THIS FACILITY WITH CARE & ONLY WHERE NECESSARY
The Portaflow instrument is fully calibrated before leaving the factory and under normal
circumstances does not require further calibration when used on site.
This facility can be used to correct the flow indication where unavoidable errors occur due to
the lack of a straight pipe or where the sensors are forced to be fitted close to the pipe-end,
valve, junction etc.
Any adjustment must be made using a reference flowmeter fitted in the system.
1. Stop (Stall) the Portaflow’s totaliser facility and zero it.
2. Run the Portaflow’s totaliser to measure the total flow over a 30-60 minute period, and
note the total flow indicated by the reference flow meter over the same period.
3. Calculate the % error between the Portaflow and reference meters. If the error is
greater than ±1% calibrate the Portaflow as detailed below.
4. Press the Options key to access the FLOW
READING OPTION screen shown.
5. Scroll down and select Calibration factor.
6. Change the calibration factor according to the
error calculated in step 3. For example, if the
Portaflow was reading 1% high then increase
the Calibration factor value by 0.010.
Conversely, if the reading is 1% low then
NOTICE
CAUTION
7.5.3 Adjusting the calibration factor
With the system running:
27
Page 29
Operating Procedures Instruction manual
decrease the calibration factor to 0.990.
7. Press the ENTER key to apply the change.
8. Select Roughness factor or Exit as required.
Pipe Material
Roughness Factor
Non ferrous metal
Glass
Plastics
Light metal
0.01
Drawn steel pipes:
Fine planed, polished surface
Plane surface
Rough planed surface
0.01
Welded steel pipes, new:
Long usage, cleaned
Lightly and evenly rusted
Heavily encrusted
0.1
Cast iron pipes:
Bitumen lining
New, without lining
Rusted / Encrusted
1.0
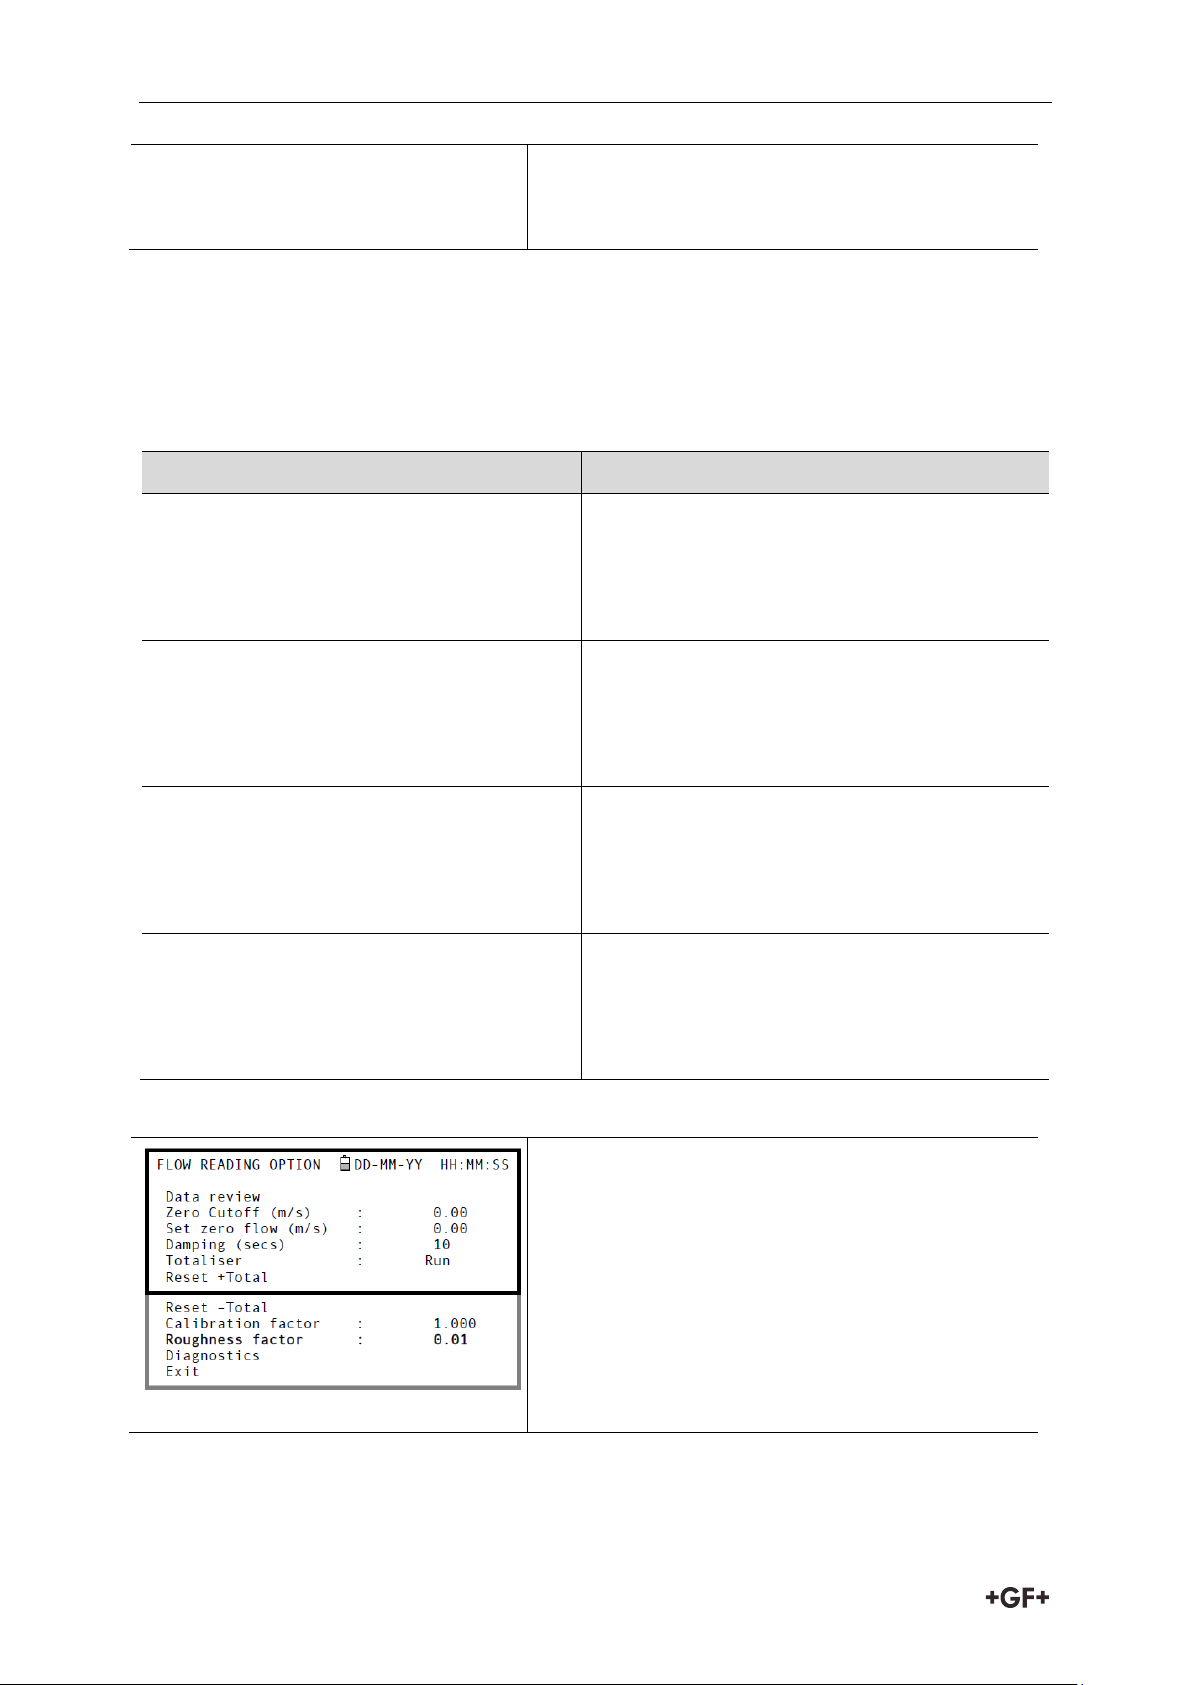
1. Press the Options key to access the FLOW
READING OPTION screen shown. 2. Scroll
down and select Roughness factor.
2. Change the roughness factor according to the
pipe material and condition as described
above.
3. Press the ENTER key to apply the change.
7.5.4 Adjusting the roughness factor
The roughness factor compensates for the condition of the internal pipe wall, as a rough
surface will cause turbulence and affects the flow profile of the liquid. In most situations it is
not possible to inspect the pipe internally and the true condition is not known. In these
circumstances experience has shown that the following values can be used:
With the system running in FLOW READING mode:
28
Page 30
Instrction manual Operating Procedures
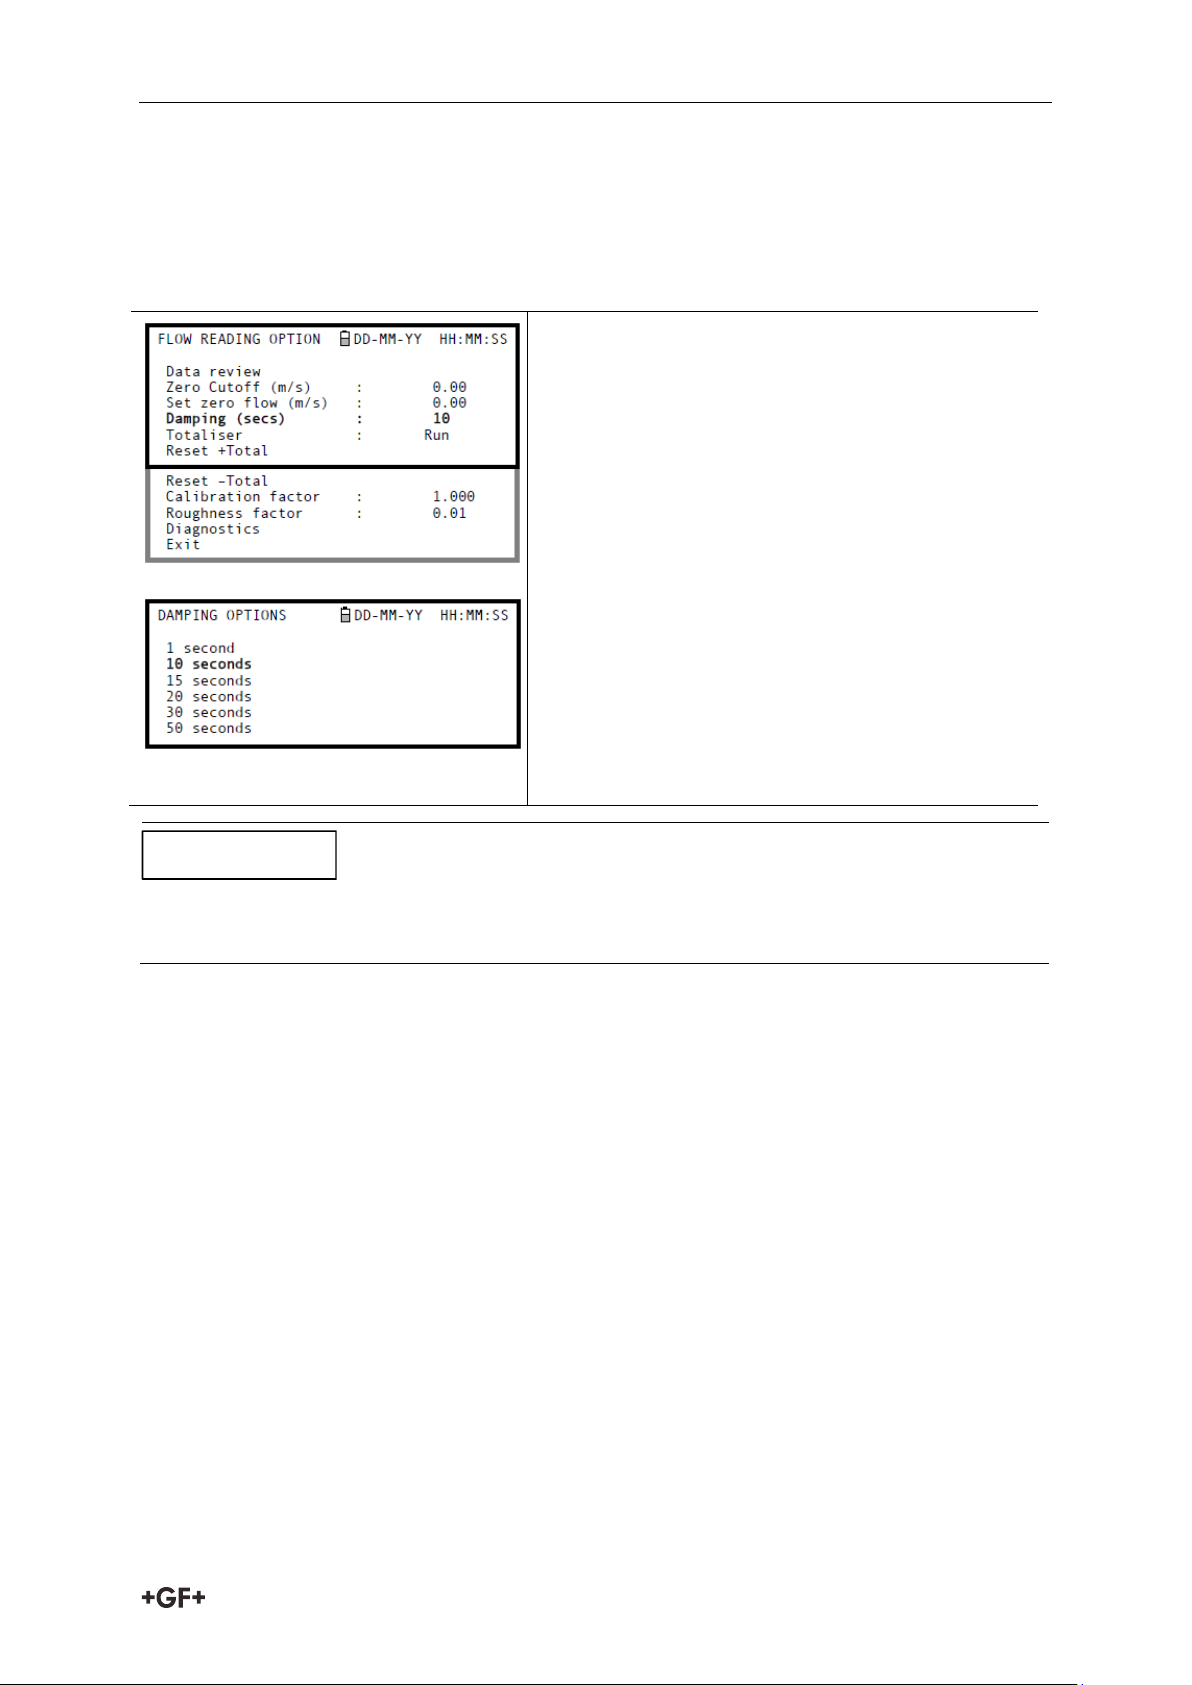
1. Press the Options key to access the FLOW
READING OPTION screen shown.
2. Scroll down and select Damping (secs).
3. This will open the DAMPING OPTIONS screen.
4. Select the value of the Damping factor as
required to remove any unwanted display
fluctuations. Increasing the value applies a
greater smoothing affect.
5. Press the ENTER key to apply the selection
and return to the FLOW READING OPTIONS
screen.
If the damping factor is set too high the value displayed may appear stable but it may exhibit
large step changes when the value is updated.
NOTICE
7.5.5 Adjusting the damping factor
By averaging-out the flow rate over several seconds, the Damping factor can be used to
smooth out rapid changes in flow rate to prevent wild fluctuations in the displayed flow value.
It has a range of 1, 10, 15, 20, 30, 50 seconds, with a default setting of 10.
With the system running in FLOW READING mode:
7.6 Performing Monitoring & Logging Functions
This procedure shows you how to set up a basic logging session under manual start/stop
control.
The flow rate and both +ve and -ve totals are logged by the instrument and downloaded to the
USB memory key. The Totals can be selectively displayed in the View Log as Text screen.
7.6.1 How to measure totalised flows (manually)
The basic measurement indicated on the FLOW READING screen is the instantaneous flow
rate, which in some applications may vary over a period of time. Average flow rates are
therefore often required in order to get a better understanding of an application’s true
performance. This is simply achieved by noting the total flow over a specific period (for
example 30-60 minutes) and then calculating the average flow rate over that period of time.
29
Page 31
Operating Procedures Instruction manual
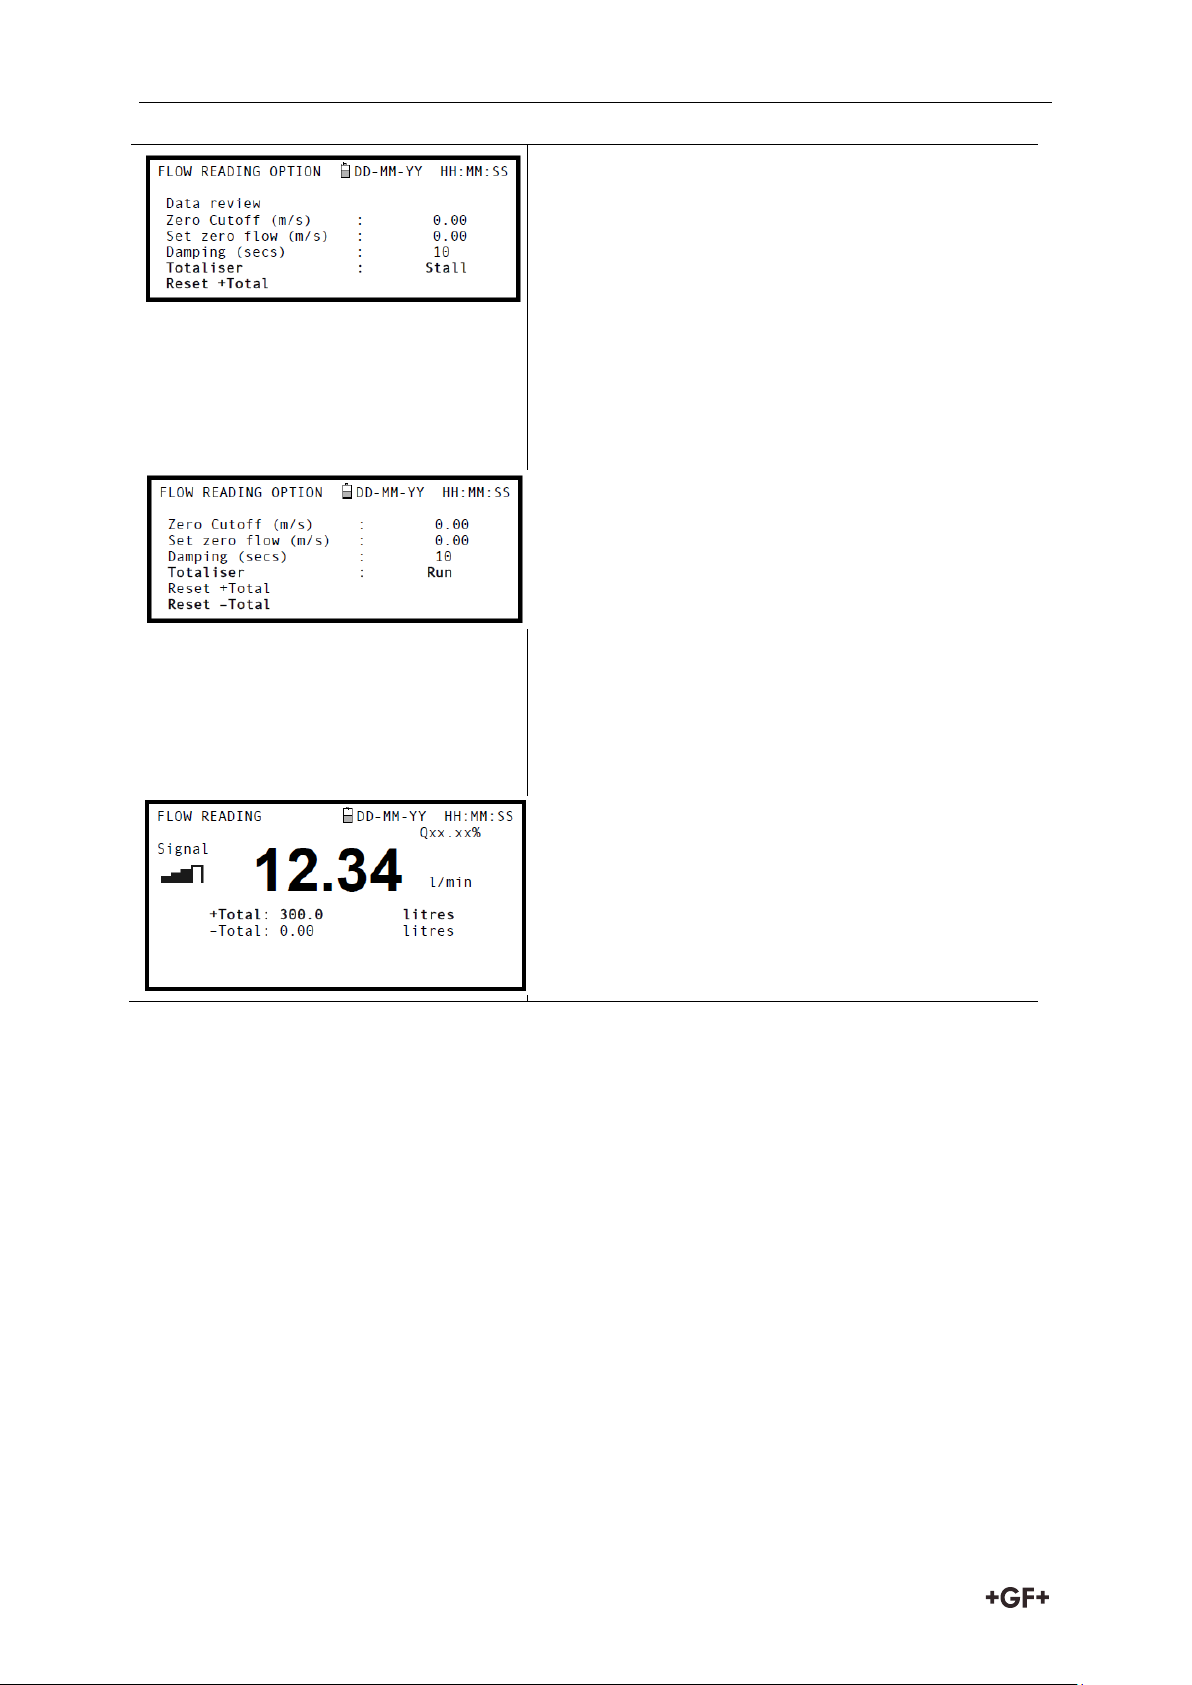
1. Press the Options key to access the FLOW
READING OPTION screen shown.
2. If the Totaliser is indicating Run, select it and
change it to Stall. Press the ENTER key.
3. Select Reset +Total and press the ENTER key.
4. Press the ENTER key on the subsequent
screen to accept the reset.
5. Press the ENTER key again to return to the
FLOW READING OPTIONS menu.
6. Select Reset –Total and press the ENTER key.
7. Press the ENTER key on the subsequent
screen to accept the reset.
8. Press the ENTER key again to return to the
FLOW READING OPTIONS menu.
9. Note and record the current time.
10. Select Totaliser and change it to Run. Press
the ENTER key. Note: the totalisers begin to
count up as soon as Totaliser is put to Run.
11. Scroll down and select Exit to return to the
FLOW READING screen which will now
indicate the instantaneous flow together with
the totalised flow.
Calculating the average flow
To calculate the average flow wait for the allotted monitoring period to expire then divide the
indicated total flow by the time taken. This will give you the average flow in m/s, galls/hour or
whatever units you select. Note that in a bi-directional flow situation you must calculate the
difference between the indicated positive and negative flow totals before carrying out the
average flow rate calculation.
How to stop the totaliser temporarily
If you want to stop the totaliser temporarily for operational reasons, set the Totaliser option to
Stall in the FLOW READING OPTIONS screen as described above. This will stop the totaliser
operation without affecting its current values.
7.6.2 How to set up the basic logging application to memory
This procedure shows you how to set up a basic logging session under manual start/stop
control. The logged data is saved to the instrument’s memory and can be downloaded to a
USB memory key at a later time.
30
Page 32
Instrction manual Operating Procedures
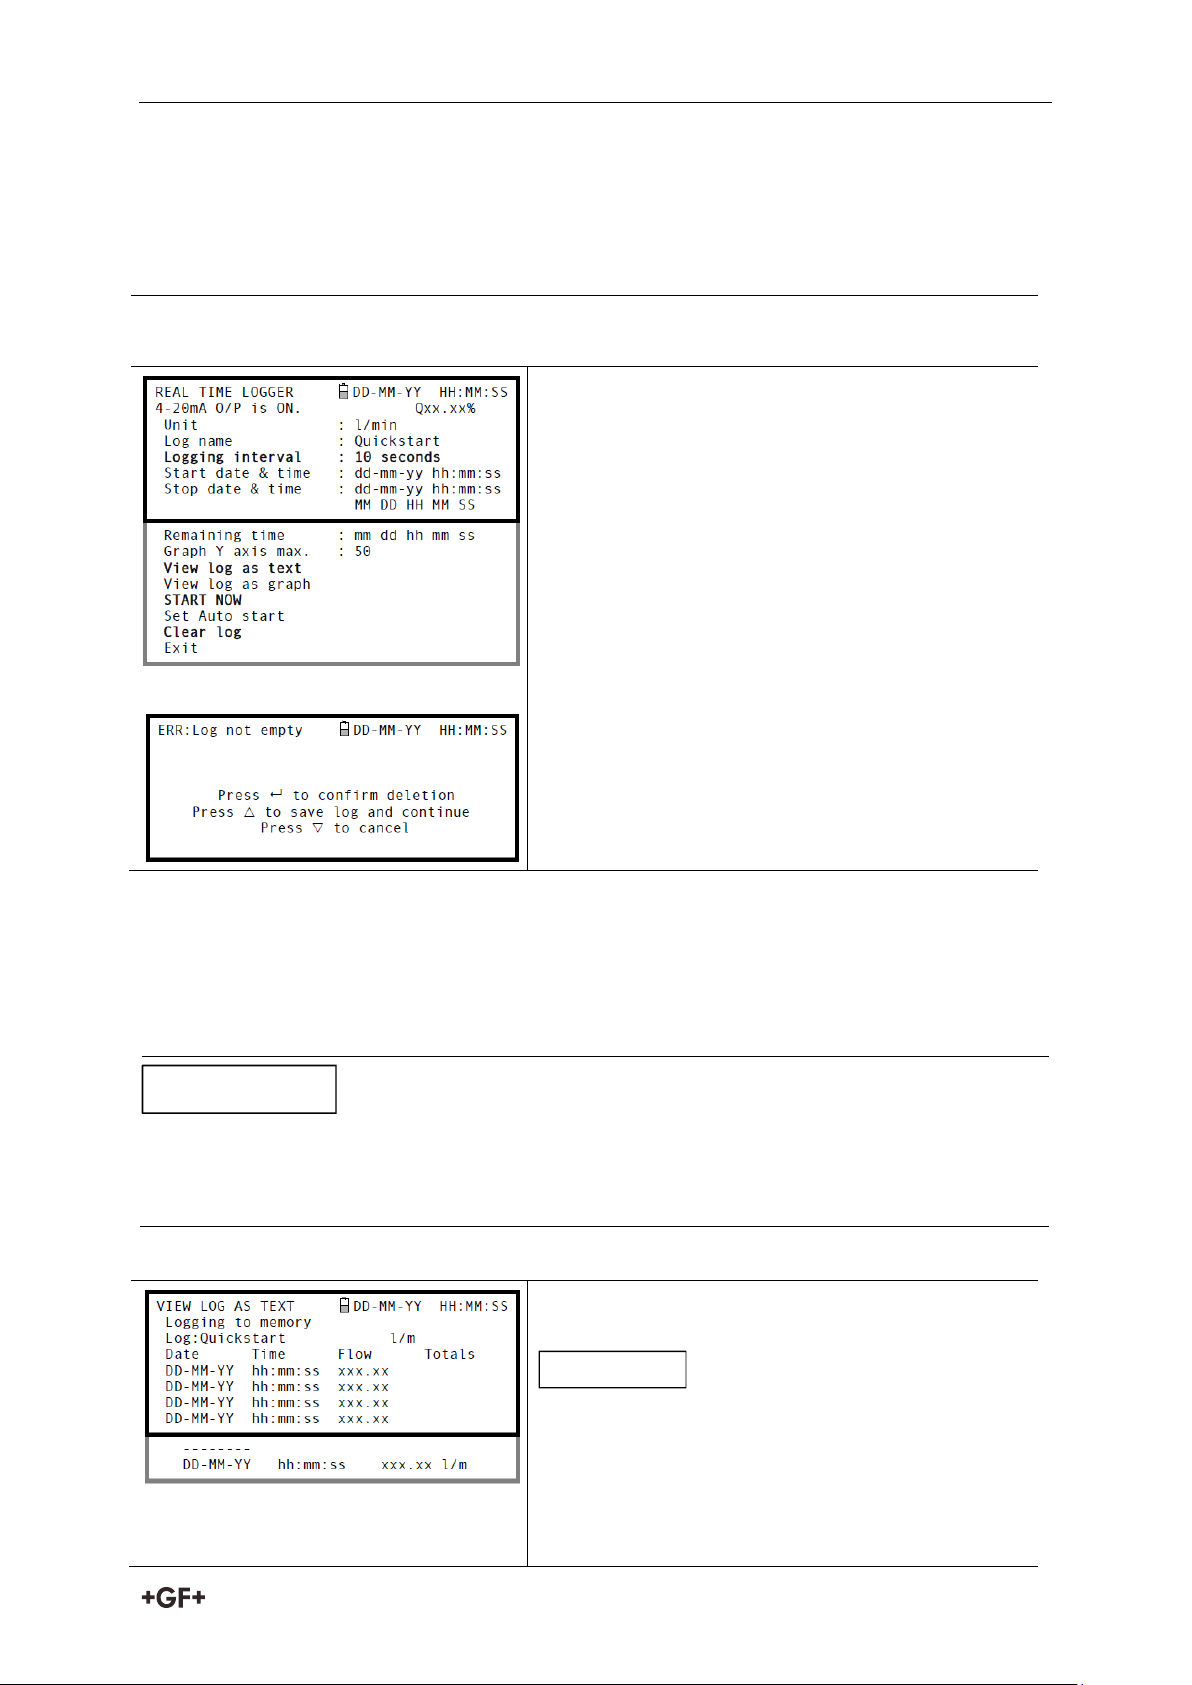
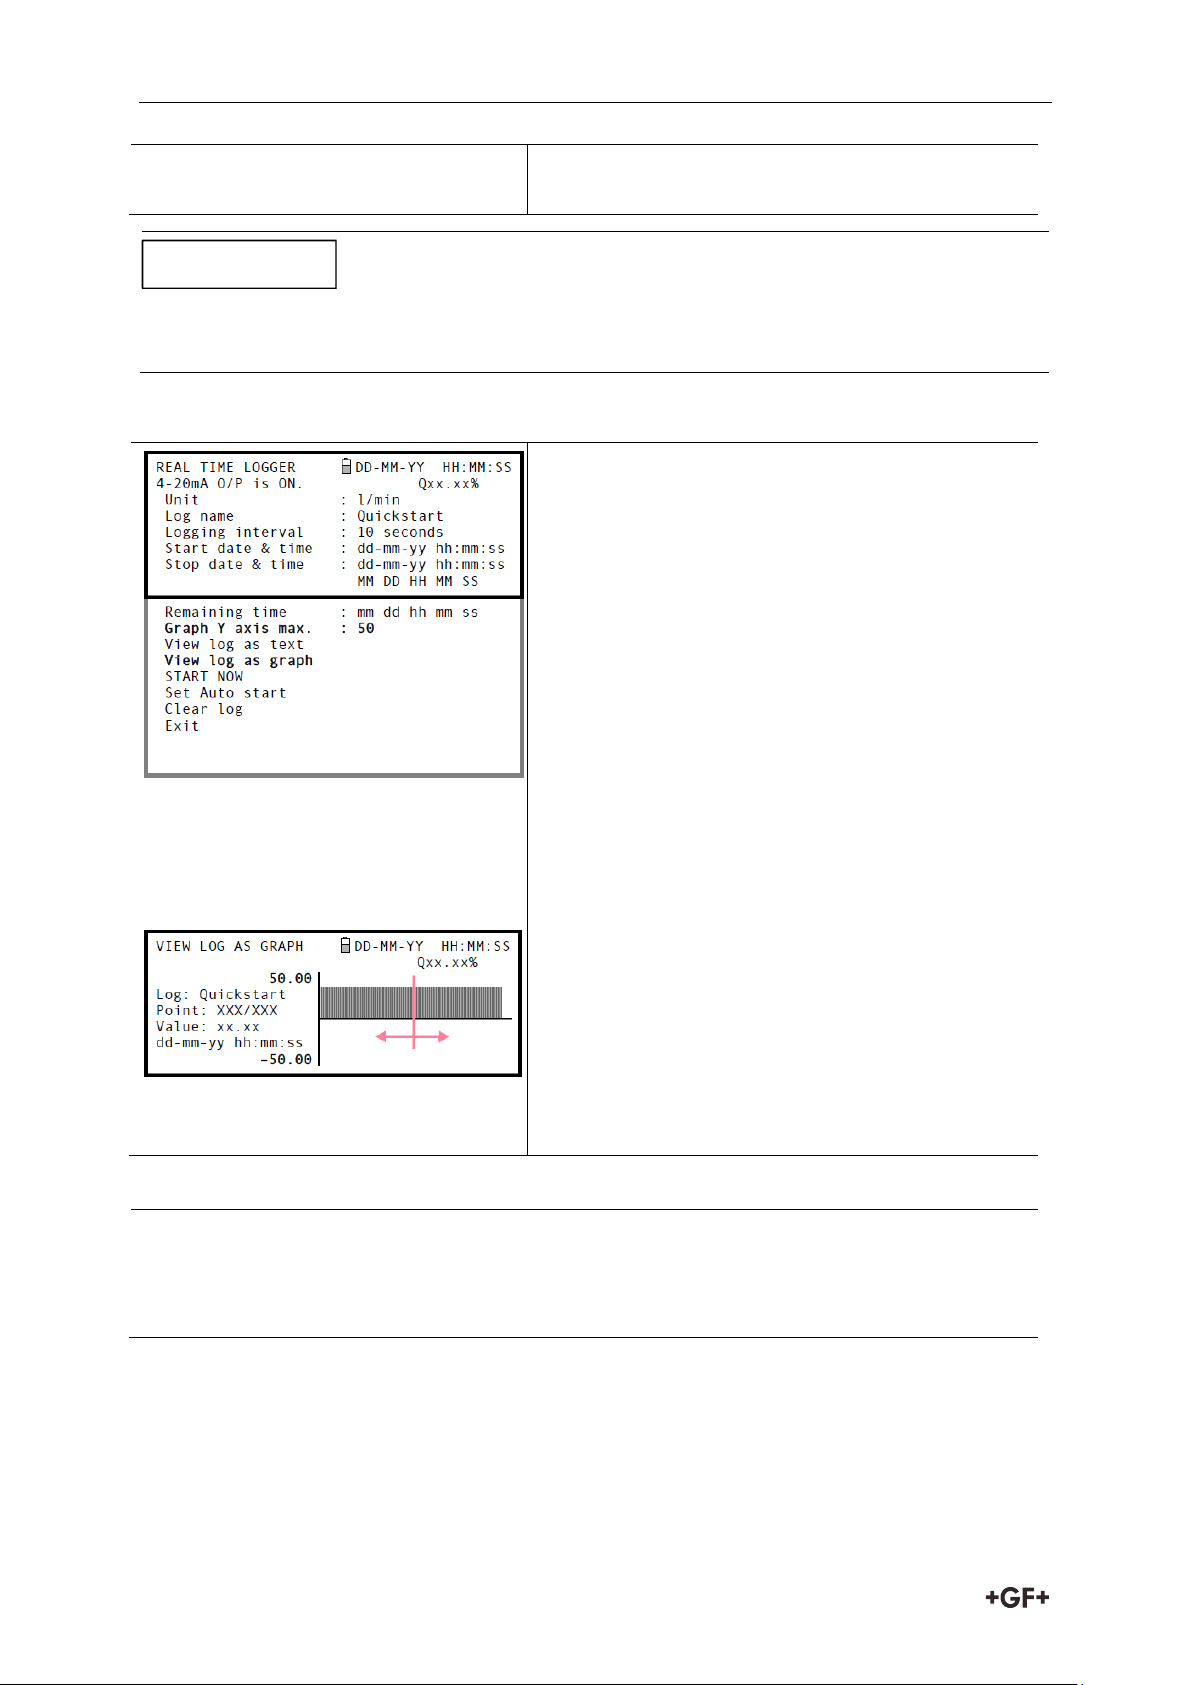
1. With the Portaflow operating in FLOW READING mode, check that the indicated flow
units are the same as those you want to appear on the logger output (e.g. l/min).
2. Press the Logger function key to access the
REAL TIME LOGGER screen.
3. Select Logging interval and enter the required
period (e.g. 10 seconds).
4. Select Clear log if you want to discard any
existing logging data.
5. Select START NOW.
6. This screen appears only if a log already exists
for the QuickStart site. It allows you to either
delete or save the existing log, or cancel the
START NOW request.
When setting up a named site it is advisable to run a brief logging session on the new site to
establish a data log file, as this will prevent the site name being overwritten when saving the
QuickStart log, as described above.
7. The VIEW LOG AS TEXT screen displays the log
events in date-stamped chronological order.
Press key 5 to go to the top line of logged data or
key 6 to go to the bottom line.
8. Press the ENTER key to return to the REAL
TIME LOGGER screen. Then select Exit to
return to the FLOW READING screen. Logging
NOTICE
NOTICE
Starting point
This procedure assumes that the Portaflow instrument has been correctly installed and is
operating in the FLOW READING mode.
Setting up and starting the logging
If you choose to save the existing log it will be saved to the highest number site that does not
currently have an attached log (e.g. EmptySite19, EmptySite18.... etc). The name of the site to
which the log is saved will be changed to CopyQS_xx (where xx is a numerical value which is
incremented each time a log is saved). For example: if EmptySite19 is available when you
elect to save the QuickStart log, the log is saved to EmptySite19 and the sitename is changed
to CopyQS_1.
View log as text
31
Page 33
Operating Procedures Instruction manual
will continue to take place in the background.
There can be only one set of logged data per site. If a new data log is started on a site it will
clear the existing data.
9. If you want to view the logging progress
graphically rather than as text, press the
Logger function key to get to the REAL TIME
LOGGER screen.
10. Select Graph Y axis max and enter a value
equal to the expected maximum flow.
11. Select View log as graph. This will open the
VIEW LOG AS GRAPH screen shown below.
12. You can select the data at any point in time by
scrolling along the time axis of the graph
using the LEFT/RIGHT scroll keys (5 & 6). The
data values for the selected point are then
shown to the left of the graph. Keep the scroll
key pressed for the cursor to move
automatically.
13. If you want to change the value of the Y axis to
improve the resolution of the graph press the
UP/DOWN scroll keys. The maximum values
will then increase/decrease as appropriate.
14. 14. To exit the VIEW LOG AS GRAPH screen
and return to the REAL TIME LOGGER screen
press the ENTER key.
15. If you wish to monitor the logging progress at any time while you are operating in FLOW
READING mode, press the Logger function key as described above to switch to the
REAL TIME LOGGER screen. You can then select View log as text or View log as graph,
as required, without interfering with the logging operation.
NOTICE
View log as graphic
Monitoring the logged events at a later time
32
Page 34
Instrction manual Operating Procedures
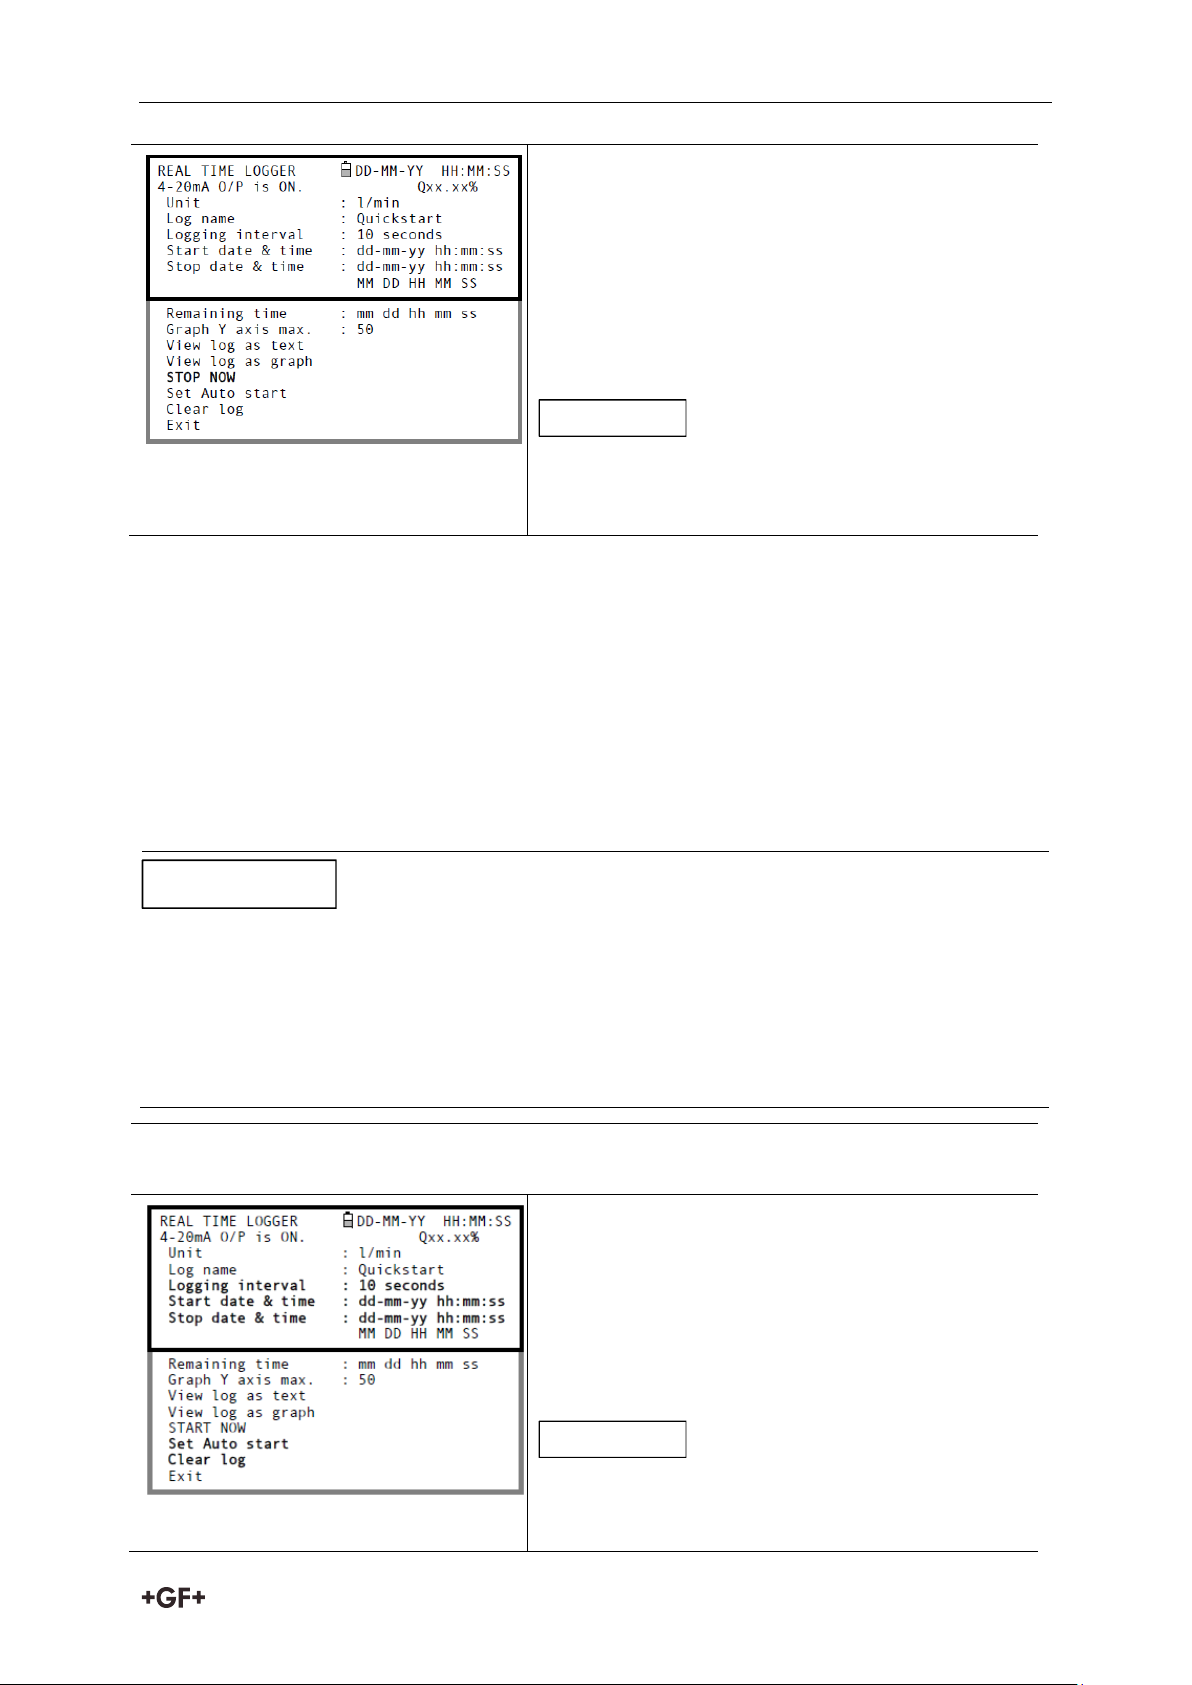
16. From the FLOW READING screen, press the
Logger function key to access the REAL TIME
LOGGER screen.
17. Select STOP NOW to cease logging. Note that
the START NOW and STOP NOW options toggle
depending on which was last selected.
18. Select Exit to return to the FLOW READING
screen.
The logged data will remain storednin the
instrument’s memory and can be accessed at any
time as described above.
When entering the Start and Stop times in this procedure, you must enter ‘00’ in the seconds
field rather than leave it blank, otherwise an error message is displayed.
If you enter a Start time that is later than the Stop time you will see an error message until
the stop time has been set to be later. This does not however affect the operation of the
equipment once the correct times have been set.
1. With the Portaflow operating in FLOW READING mode, check that the indicated flow
units are the same as those you want to appear on the logger output (e.g. l/min).
2. Press the Logger function key to access the
REAL TIME LOGGER screen.
3. Select Logging interval and enter the required
period.
4. Select Start date & time and enter the date
and time you wish logging to commence. Note
this must be in the future.
If the log is not empty then a warning screen will
be displayed, and when a key is pressed the menu
will be displayed with the cursor at the Clear Log
NOTICE
NOTICE
NOTICE
7.6.3 How to set up automatic (timed) logging mode
This procedure shows you how to set up an auto logging session under timed start/stop
control. The logged data is saved to the instrument’s memory and can be downloaded to a
USB memory key at a later time.
Starting point
This procedure assumes that the Portaflow has been correctly installed and is operating in
the FLOW READING mode. Also that the instrument’s date and time are correctly set.
Setting up, starting and cancelling auto logging
33
Page 35
Operating Procedures Instruction manual
item. The log must be cleared before new times
can be entered.
5. Select Stop date & time and enter the date and
time you wish logging to cease. Note this must
be later than the start time.
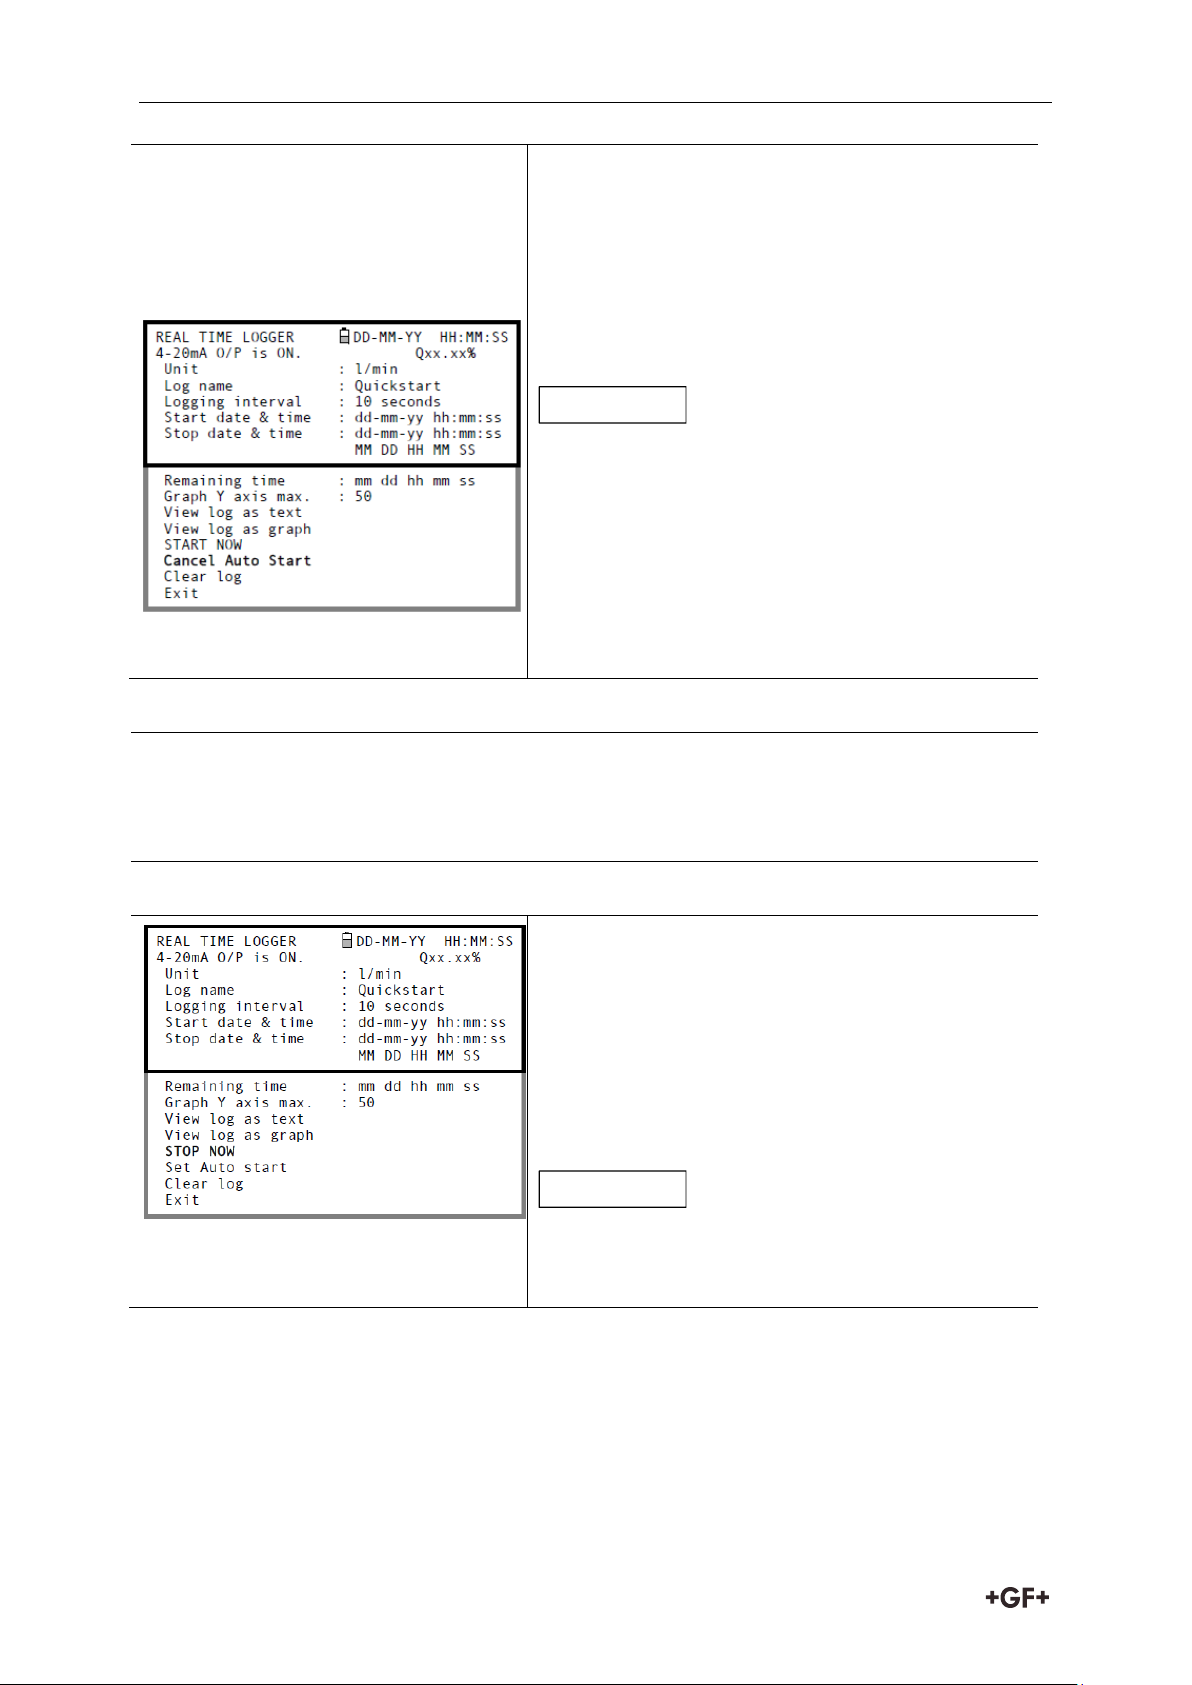
6. Select Set auto start. This enables the auto
logging application.
If Set Auto start is enabled with valid start and
stop times then this entry will change to
Cancel Auto start.
7. To cancel the automatic logging session
before it commences, click the Cancel Auto
Start.
8. Select Exit to return to the FLOW READING
screen.
9. If you wish to view the logging progress at any time while you are operating in FLOW
READING mode, press the Logger function key as described above to access the REAL
TIME LOGGER screen. You can then select View log as text or View log as graph, as
required, without interfering with the logging operation.
Manually stopping the auto logging session
10. The logging session will stop automatically at
the programmed Stop date & time.
11. If you wish to manually stop logging earlier
than programmed, press the Logger function
key to access the REAL TIME LOGGER screen
then select STOP NOW to cease logging.
12. Select Exit to return to the FLOW READING
screen.
The logged data will remain stored in the
instrument’s memory and can be viewed at any
time as described above.
NOTICE
NOTICE
Monitoring the logged events
34
Page 36
Instrction manual Operating Procedures
The backlight will be disabled while the data is being downloaded to the USB memory key.
The USB key must be inserted before you select the download operation.
If this is done from the FLOW READING screen any logging currently taking place will be
terminated.
2. Select Data Logger from the MAIN MENU.
3. Select Choose from list of sites and select the
name of the site to download.
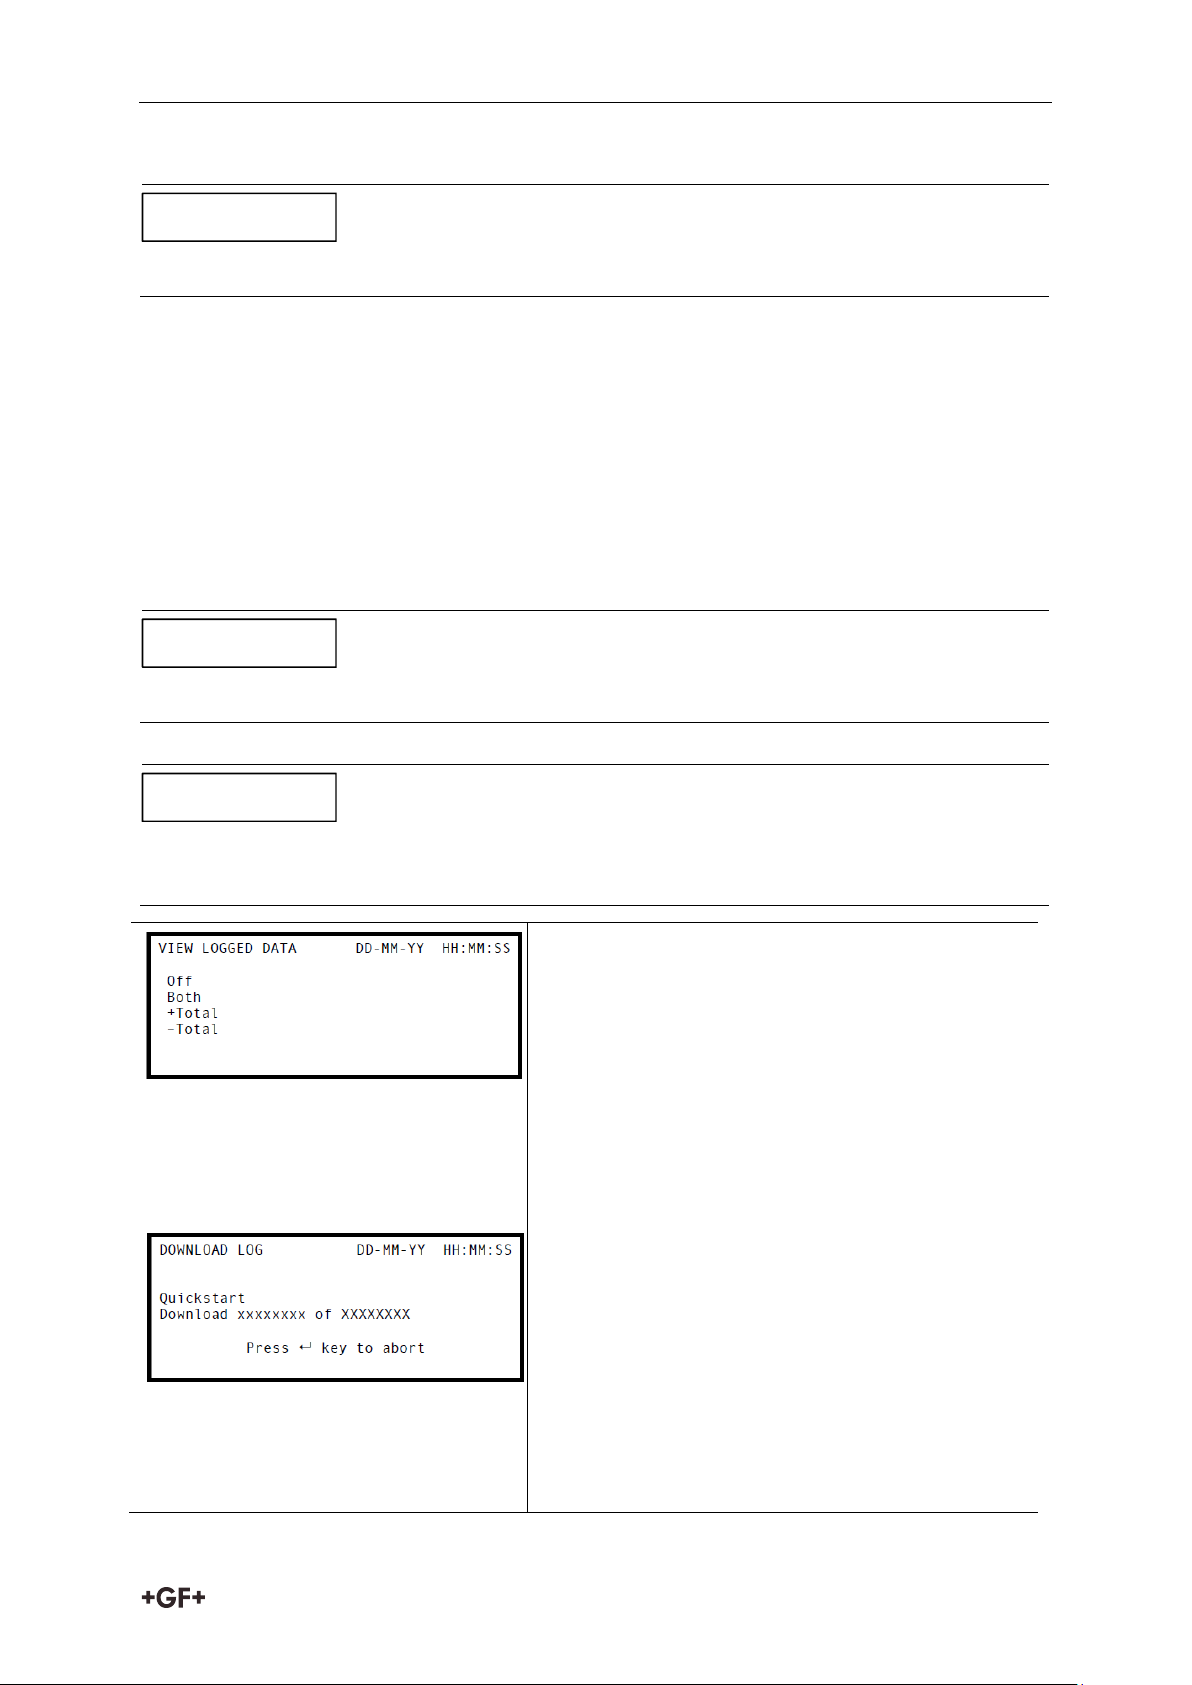
4. The totals are always logged. If you wish to
display them when viewing a log, then use the
options in Select Log Totals. The default is Off.
5. If you want to view the log prior to downloading
it you can do so using the View log as text or
View log as graph options.
6. When you are ready to begin downloading,
insert the USB memory key.
7. Select Download log and press the ENTER
key.
8. The selected logged data is now downloaded
to the USB key and the display changes to
show download activity with the sample count
increasing towards the total number of
samples.
NOTICE
NOTICE
NOTICE
7.6.4 How to download logged data to a USB memory key
This procedure shows you how to download the logged data stored in the Portaflow 330
internal memory to a plug-in USB memory key. The USB key must be formatted with a FAT
format file directory. The files on the memory key will be named LOGxxx, where xxx is a three
digit number. The actual site name is preserved in the header of the data file and if a further
log from the same site name is downloaded it will be appended to the existing data file. The
created file can be imported into Portagraph to provide a graphical display of the data and
then saved in Windows Excel format. The data, which is downloaded at approximately 10,000
samples per hour, always includes the positive and negative totaliser values.
1. Access the MAIN MENU.
35
Page 37
Operating Procedures Instruction manual
As shown on the display the download can be aborted by pressing the ENTER key.
Due to the indirect method of inserting the data into Portagraph, some functions, such as
site details, will not have the relevant data present.
NOTICE
NOTICE
9. The display will return to the VIEW LOGGED DATA menu when the download is complete.
10. On the VIEW LOGGED DATA screen you can now Clear the log if required or Exit directly
back to the MAIN MENU.
7.6.5 Transferring data to a PC
Once the data is on the USB memory key it may be plugged into a PC that has the Portagraph
software installed on it.
To view a graph of the data:
1. Click on File in the top left corner of the Portagraph application screen.
2. From the presented menu options, select Import, then CSV.
3. Navigate to the drive location of the USB key and select the file to be viewed.
To save the USB key data to the PC
1. Follow the instructions in the Portagraph user manual.
7.7 Configuring the Current / Pulse Output
The Current/Pulse Output connector provides two output signals that are proportional to the
measured fluid flow. The first is a current signal calibrated to a standard control range (e.g.
4-20mA), and the second is a pulse output. It is permissible to use both outputs
simultaneously.
7.7.1 Current output
Using the instrument’s menu system, the operator can use the following procedures to:
Select the current output function Off/On
Select the current output signal range (4-20mA, 0-20mA, 0-16mA)
Calibrate the current output signal to a required flow range
36
Page 38
Instrction manual Operating Procedures
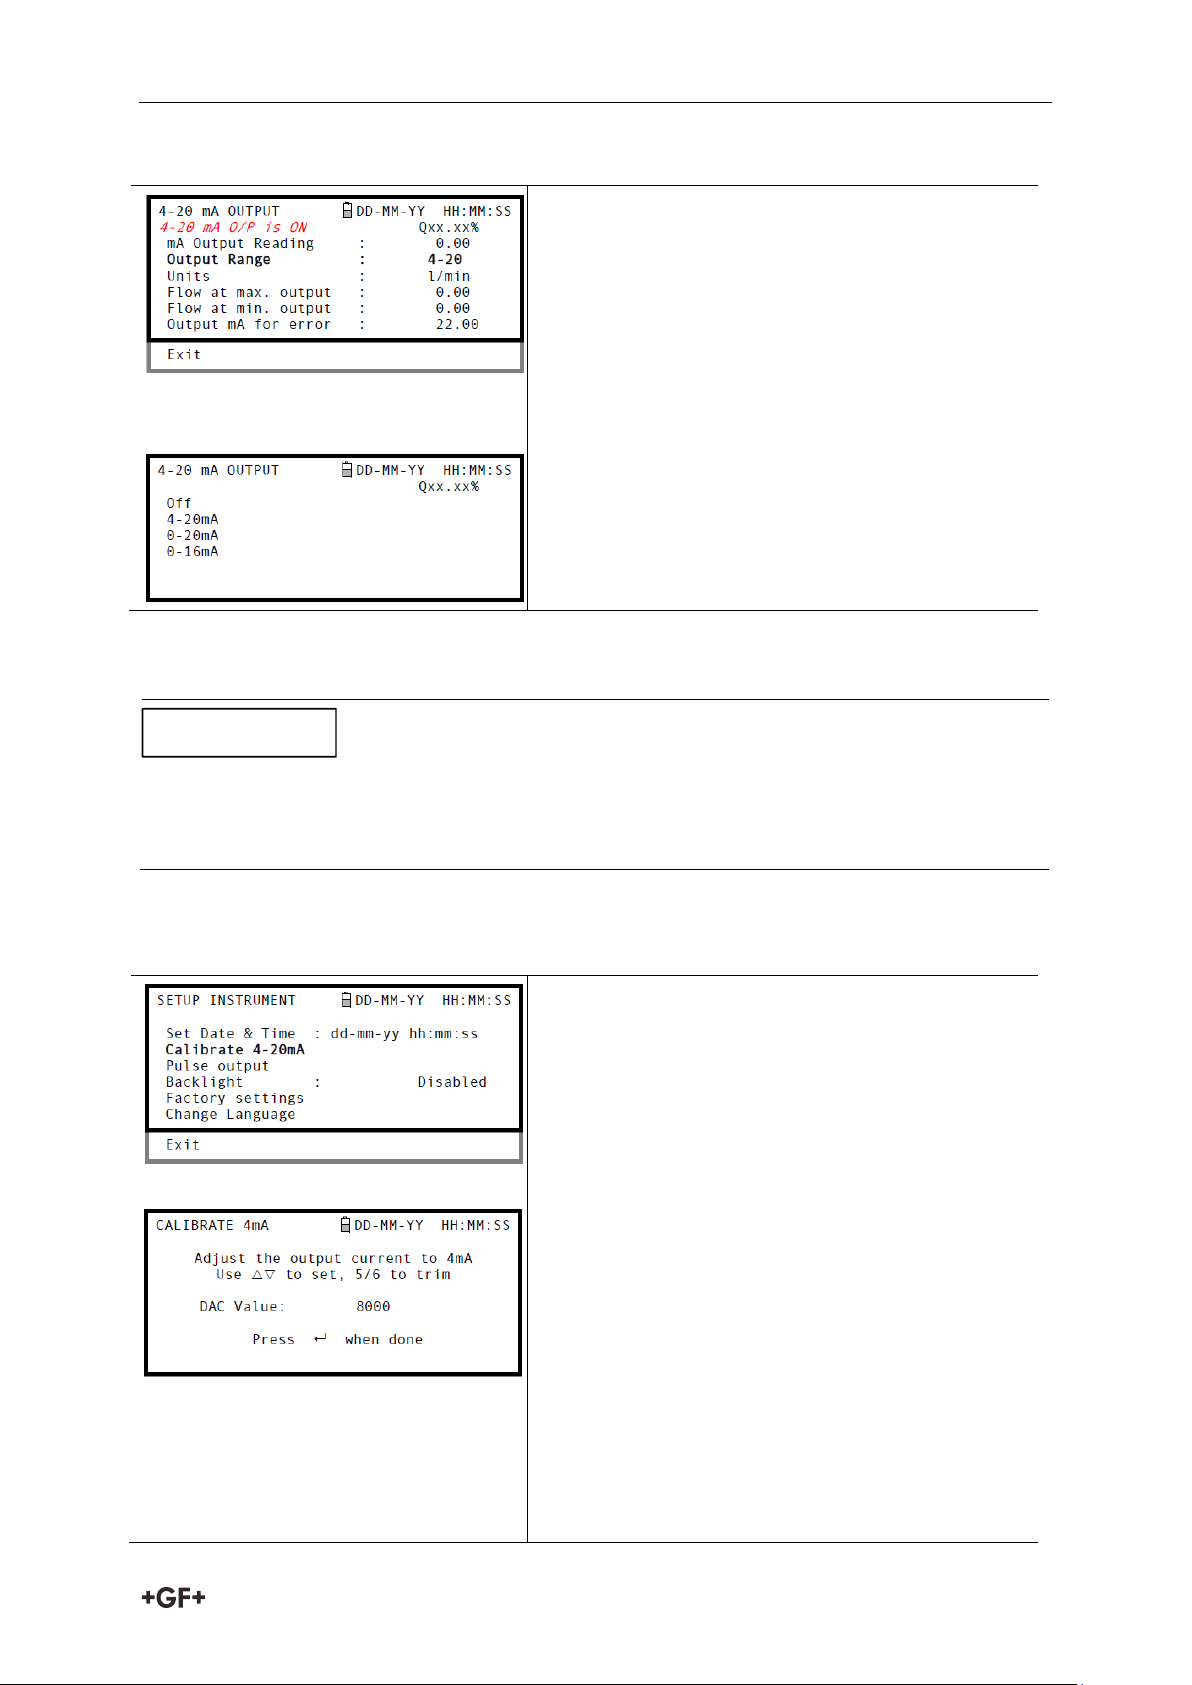
1. With the instrument operating in the FLOW
READING mode, press the 4-20mA function
key. This will access the 4-20mA OUTPUT
screen.
2. The ON/OFF status of the 4-20mA output is
shown on line 2 of the display.
3. To change the ON/OFF status select Output
Range and press the ENTER key.
4. Select Off, to turn OFF the 4-20mA Output or
select one of the output ranges to turn it ON.
5. Press the ENTER key to return to the 4- 20mA
OUTPUT screen.
The 4-20mA output has been calibrated in the factory and should not require further
adjustment. In the rare event that re-calibration is necessary, this procedure should be
carried out only by a trained engineer.
1. Select Setup Instrument from the MAIN
MENU, to access the SETUP INSTRUMENT
screen.
2. 2. Select Calibrate 4-20mA.
3. Connect a calibrated ammeter to the 4-20mA
output and adjust the UP/DOWN Scroll keys
(Coarse) and LEFT/RIGHT Scroll keys 5 & 6
(fine) until the output is exactly 4.0mA. The
DAC should indicate approximately 8000.
4. Press the ENTER key when done.
5. With the meter still connected to the 4-20mA
output adjust the Scroll keys to obtain an
output of exactly 20mA. The DAC should
indicate approximately 40000.
NOTICE
Turning the 4-20mA output OFF/ON and selecting the current range
4-20mA signal calibration and ranging
This procedure describes how to calibrate the 4-20mA output and ‘scale’ it to operate over a
defined flow-rate range.
Signal calibration
37
Page 39
Operating Procedures Instruction manual
6. Press the ENTER key when done.
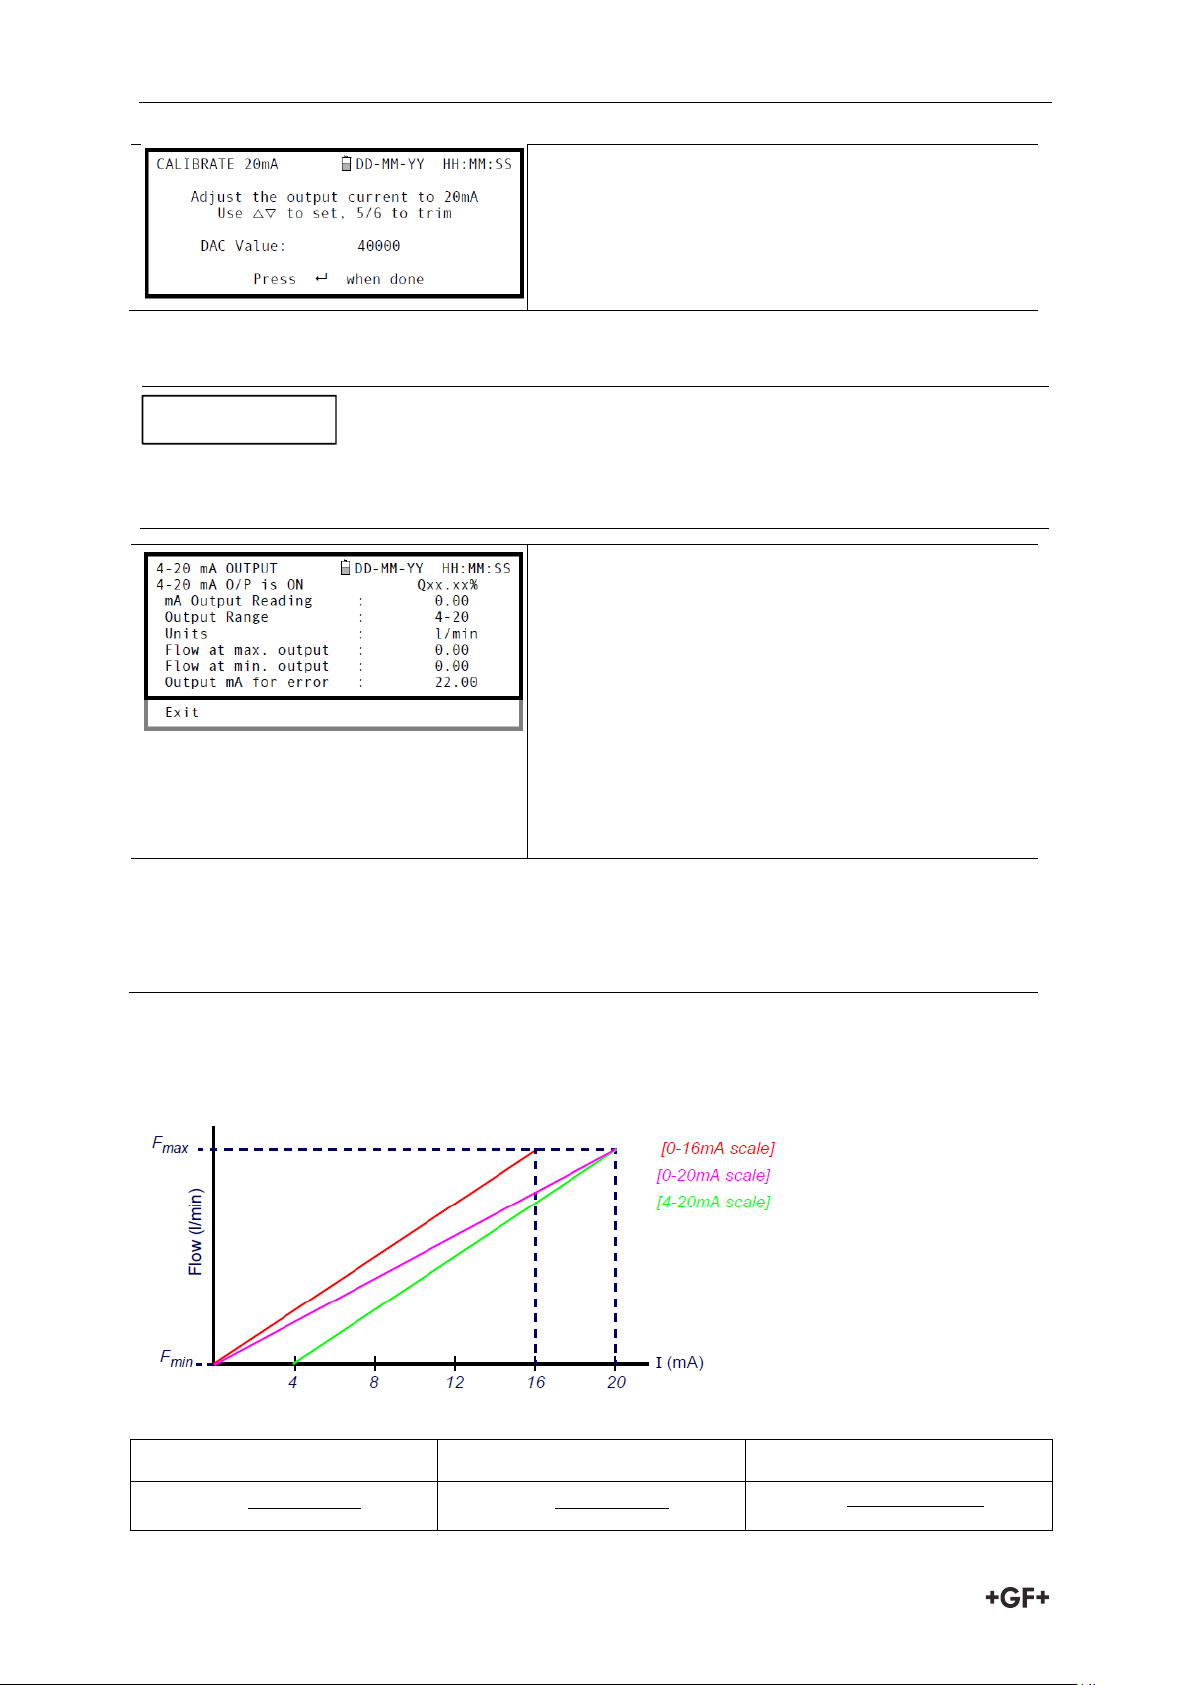
The 4-20mA can be set to represent a particular flow range. It is also possible to enter a
negative figure for the minimum output and this would enable a reverse flow to be monitored
7. With the instrument operating in the FLOW
READING mode, press the 4-20mA function
key. This will access the 4-20mA OUTPUT
screen.
8. Select Flow at max. output and enter a value
of the flow rate that you want to associate with
a 20mA output.
9. Select Flow at min. output and enter a value of
the flow rate that you want to associate with a
4mA output. This could be ‘0’.
10. Select Output mA for error and enter a value (default is 22mA) that you want the 4-
20mA output to produce in the event of an error (e.g. if the flow-rate is outside the set
range).
11. Upon completion press the ENTER key to return to the FLOW READING screen.
0-20mA
0-16mA
4-20mA
NOTICE
4-20mA Signal scaling
Converting the measured current to flow rate
Assume the maximum flow rate is F
(l/min) and the minimum flow rate Fmin is ‘0’ (l/min),
max
as shown.
To calculate the flow rate (l/min) for a measured current I(mA) then:
38
Page 40
Instrction manual Operating Procedures
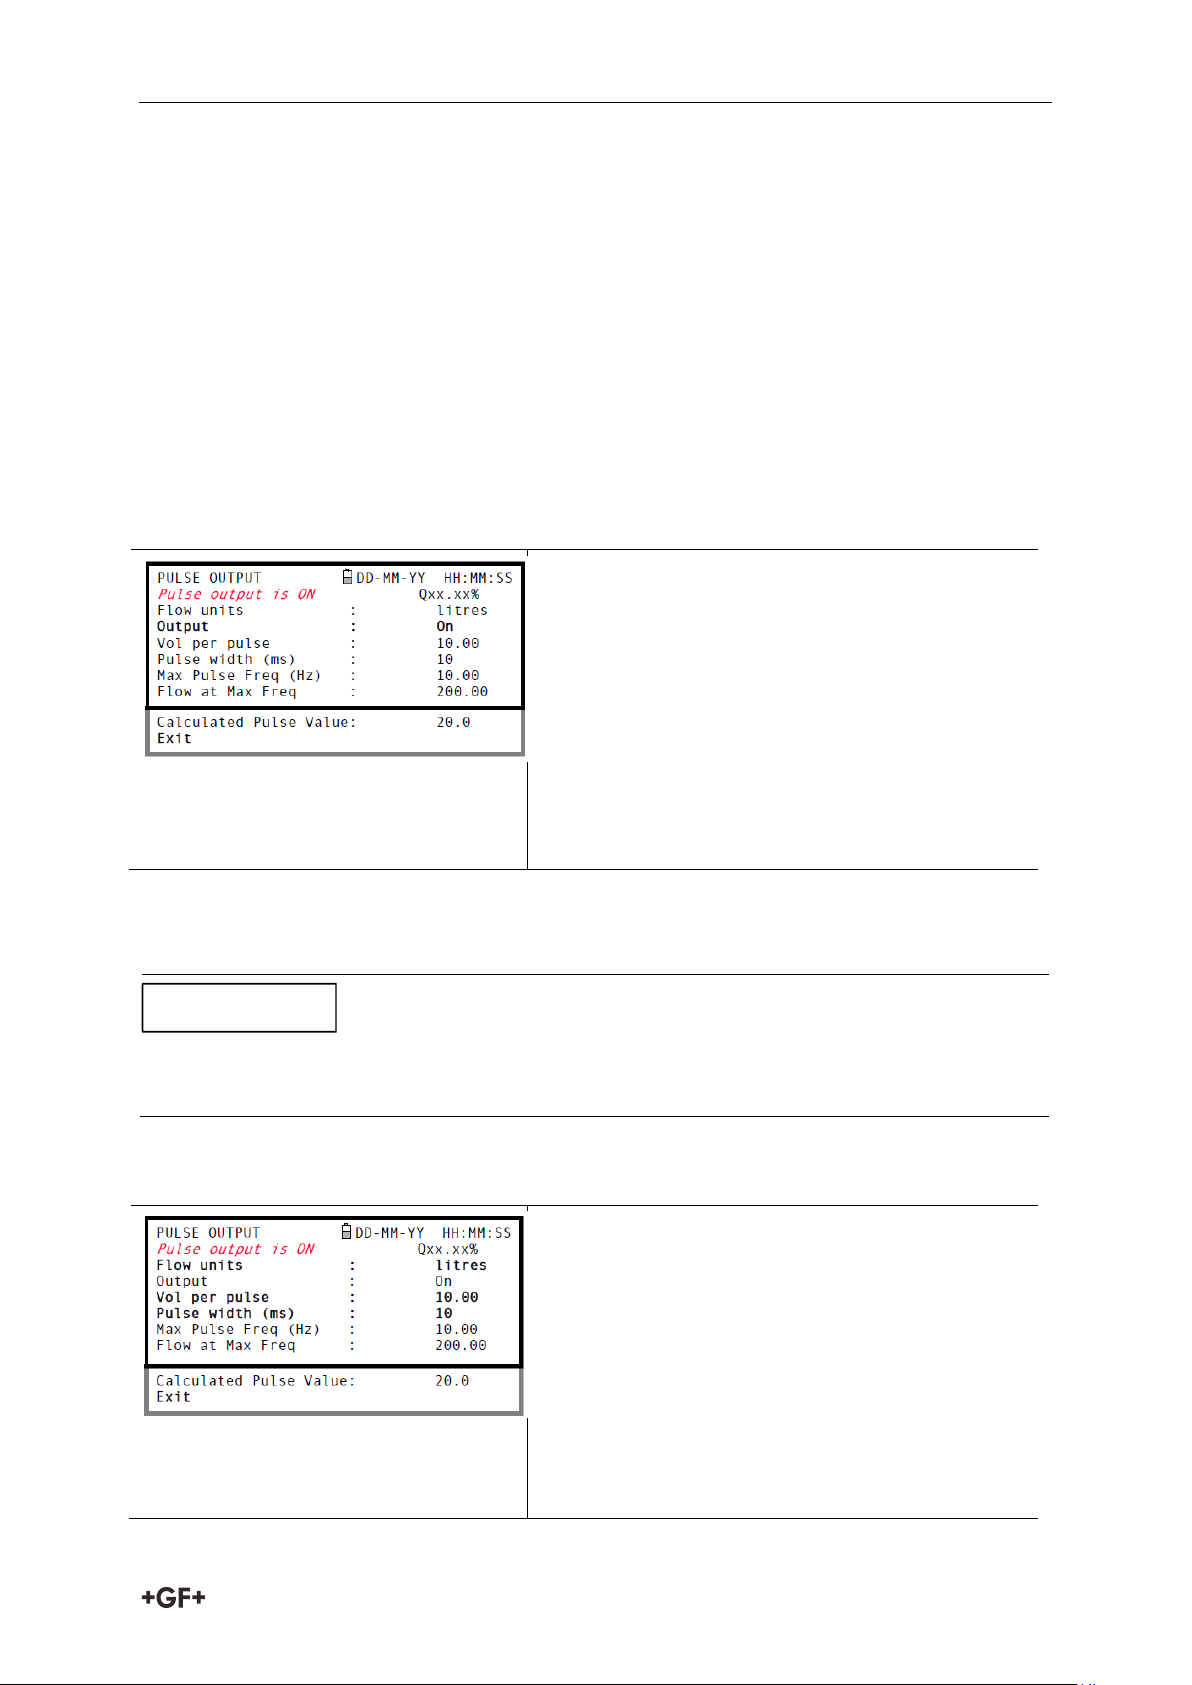
1. With the instrument operating in the FLOW
READING mode, press the Pulse function key
to access the PULSE OUTPUT screen.
2. A Pulse output is ON (or OFF) message
appears in the second line of the display.
3. To change the pulse output operational status,
select the Output menu option then select
Off/On as required.
4. Select Exit and press the ENTER key to return
to the FLOW READING screen.
This does not apply if the PULSE OUTPUT menu is accessed by pressing the Pulse key when
operating in the FLOW READING mode.
1. With the instrument operating in the FLOW
READING mode, press the Pulse function key
to access the PULSE OUTPUT screen.
2. To change the Flow units shown in this menu
you must return to the FLOW READING screen
and select the required units using keys 7,8
and 9.
3. Select Vol per pulse and enter the required
value. In the example shown, a 10ms pulse is
produced for every 10 litres of flow.
NOTICE
7.7.2 Pulse output
The pulse output can be used in two modes, ‘volumetric’ and ‘frequency’. When operating in
the ‘volumetric’ mode a pulse is produced every time a pre-selected volume of liquid passes
through the pipe; and when in the ‘frequency’ mode the output is a continuous pulse-train
with a frequency proportional to the flow rate (l/s). Using the instrument’s menu system, the
operator can use the following procedures to:
Select the pulse output function Off/On/Frequency
Volumetric mode – select the output pulse width and volume per pulse
Frequency mode – select the maximum pulse frequency and the corresponding maximum
flow rate
Turning the pulse output OFF/ON (volumetric mode)
Generating a ‘Test’ pulse
If the PULSE OUTPUT menu screen is accessed from the SETUP INSTRUMENT menu you can
generate a ‘test’ pulse by selecting Flow units and pressing the Option key.
Calibrating the pulse output signal range (volumetric mode)
39
Page 41
Operating Procedures Instruction manual
The pulse Output must be Off in order to change the Volume per pulse.
1. With the instrument operating in the FLOW
READING mode, press the Pulse function key
to access the PULSE OUTPUT screen.
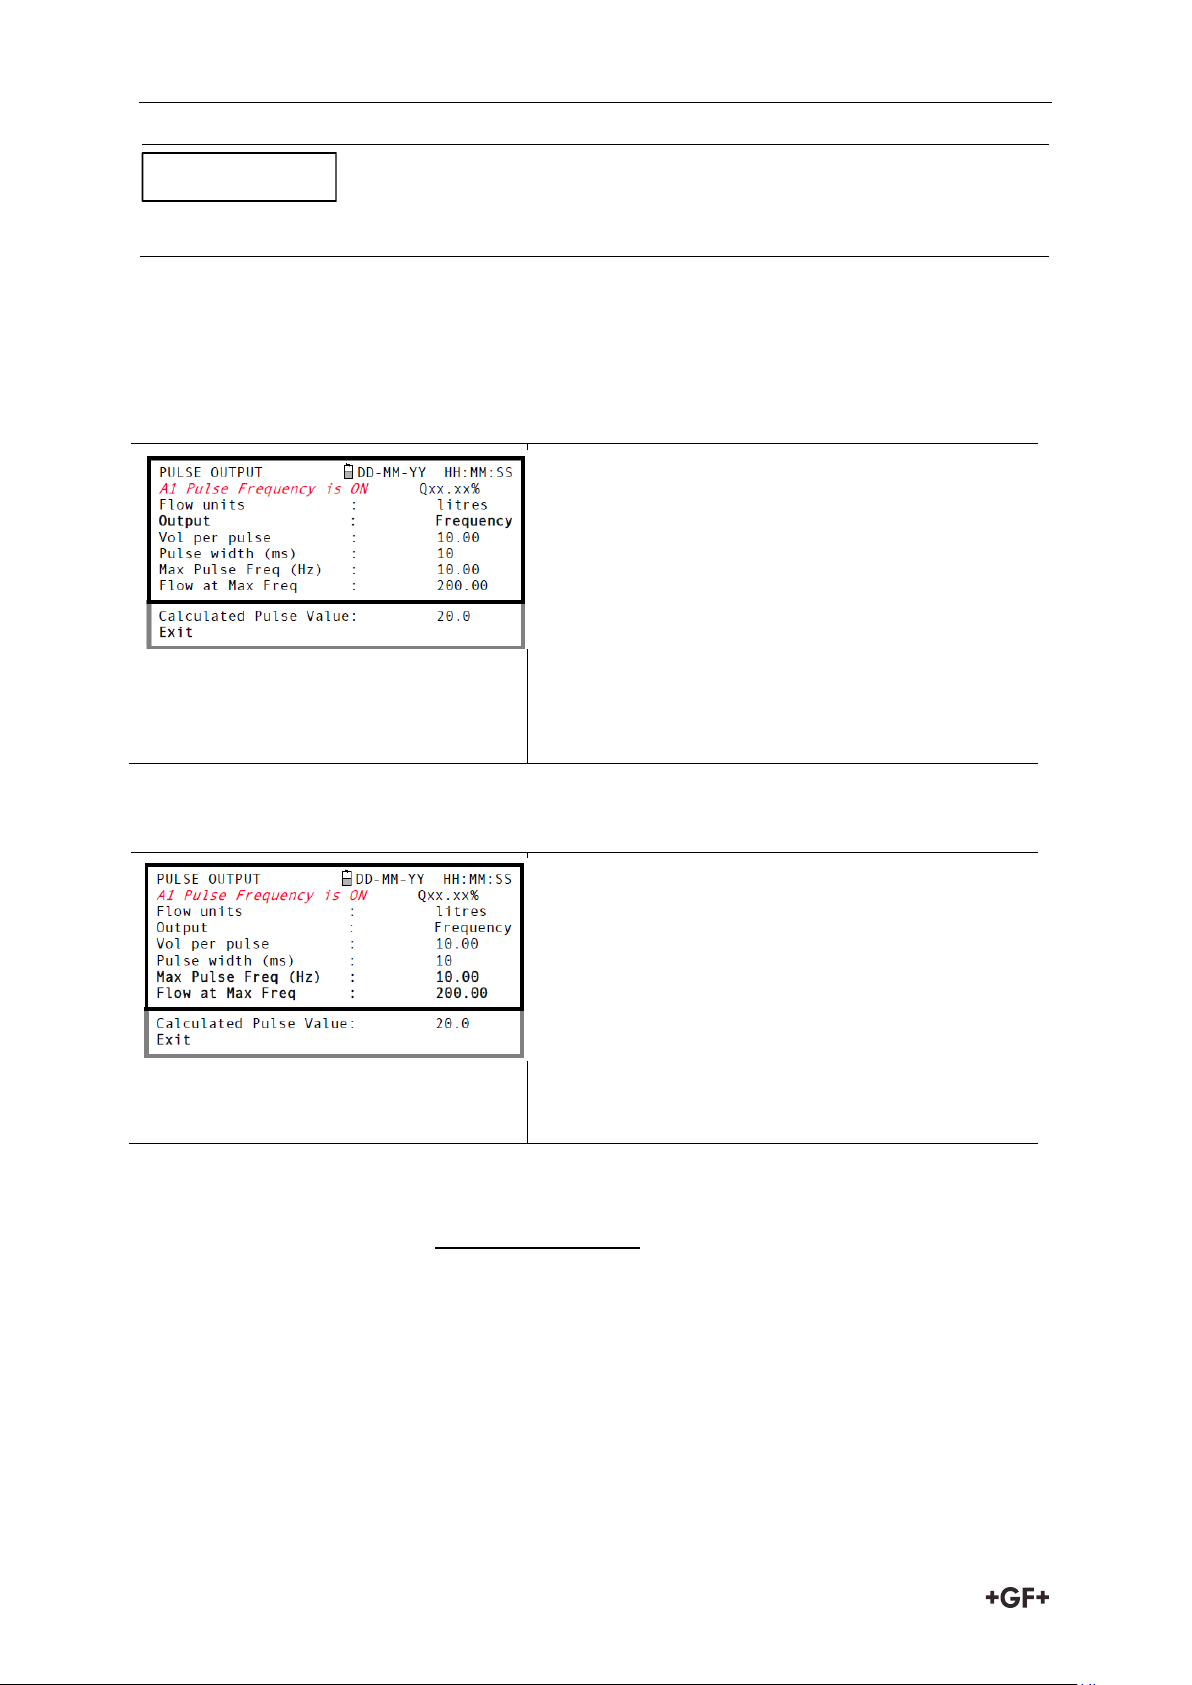
2. To change the pulse output to ‘frequency’
mode, select the Output menu option then
select Frequency as required.
3. A1 Pulse Frequency is ON message appears in
the second line of the display.
4. Select Exit and press the ENTER key to return
to the FLOW READING screen.
1. With the instrument operating in the FLOW
READING mode, press the Pulse function key
to access the PULSE OUTPUT screen.
2. Select Max Pulse Freq (Hz) and enter the
required value.
3. Select Flow at Max Freq and enter the
required value (l/s).
4. Select Exit and press the ENTER key to return
to the FLOW READING screen
NOTICE
4. Select a Pulse width (in ms) to suit the particular application – e.g. electro-mechanical
counter. Refer to the manufacturer’s data sheet for the minimum pulse width.
5. Select Exit and press the ENTER key to return to the FLOW READING screen.
Selecting the pulse output frequency mode
Calibrating the pulse frequency range
The Calculated Pulse Value field is automatically calculated as:
This value is often required to be programmed into the device that is receiving the pulses to
enable it to calculate the correct flow rate – for example, when connecting the pulse output to
a Calec energy meter.
40
Page 42
Instrction manual Maintenance and Repair
Do not disassemble this unit unless advised by GF. Return the unit to an approved service
agent or place of purchase for further advice.
WARNING
CAUTION
8 Maintenance and Repair
This instrument does not contain any user-serviceable parts. The following notes are provided
as a guide to general equipment care
1. Ensure the unit is switched off and disconnected from the mains, then wipe the exterior of
the instrument with a clean, damp cloth or paper towel. The use of a solvent may damage
the surface.
2. The instrument contains a rechargable battery, dispose safely and in accordance with the
local regulations in force in the country of operation.
3. Ensure all cables and connectors are kept clean and free from grease or contaminants.
Connectors may be cleaned with a general purpose cleaner if necessary.
4. Avoid the use of excessive grease/ultrasonic couplant on the sensors as this may impair
the performance of the equipment. Excessive grease/couplant can be removed from the
sensors and guide rails using an absorbent paper towel and a general purpose solvent
cleaner.
5. We recommend that the ultrasonic couplant is replaced on the sensors every 6 months,
especially on pipes where the application is too hot to touch. If the signal level drops
below 30% this is also an indication that the sensors need re-greasing.
6. Regularly check all cables/parts for damage. Replacement parts are available from GF.
7. Ensure the person who services your instrument is qualified to do so. If in doubt, return
the instrument to GF with a detailed report on the nature of any problem.
8. Ensure that suitable precautions are taken when using any materials to clean the
instrument/sensors.
9. The instrument and sensors should be calibrated at least once every 12 months. Contact
GF or your local GF partner for details.
10. When returning product to GF make sure it is clean and please notify GF if the instrument
has been in contact with any hazardous substances.
11. If the instrument was supplied with dust or dirt caps make sure they are re-fitted when
the instrument is not in use.
41
Page 43

Troubleshooting Instruction manual
9 Troubleshooting
9.1 Overview
If you have a problem with your flow monitoring system it can be due to any of the following:
Faulty instrument
If you suspect the instrument is faulty you can check it out using a test block.
This will establish that the instrument is functional and receiving a healthy signal from the
connected transducers.
Incorrect setup
A low, or zero, signal could be caused by incorrect set-up such as:
Incorrect site data entered into the instrument.
Incorrect or non-matching ultrasonic transducers selected for use.
Incorrectly fitted transducers – lack of couplant applied, incorrect spacing, insecure
attachment.
Poor connections between the probes and the instrument.
Application problem
If you are certain that the instrument is healthy and suitably set-up for the current site; and
the probes are properly assembled and fitted correctly, there could be an application problem
concerned with the site.
Check such conditions such as:
Poor pipe outer surface quality
Uneven surface preventing good surface contact with the transducer.
Flaking paint (should be removed).
Variable air gap in concrete-covered pipes affecting the ultrasonic signal quality.
Poor internal pipe construction
Rough internal pipe walls affecting fluid flow (see roughness factor).
Internal welds positioned in the transducer signal path affecting the signal quality.
The ‘drippings’ in galvanised-dipped pipes or other irregularities interfering with the
signal path.
Incorrect probe location
Transducers located too close to bends or valves, disturbing the flow profile.
Transducers located too close to insertion probes, disturbing the flow profile.
For horizontal pipework transducers should not be positioned on the top of the pipe.
Poor fluid conditions within the pipe
Fluid contains bubbles, high particle density or sludge.
Air in the top of the pipe.
Low fluid flow within the pipe
Pipe obstructions.
Malfunctioning valve not opening fully (or closed inadvertently).
42
Page 44
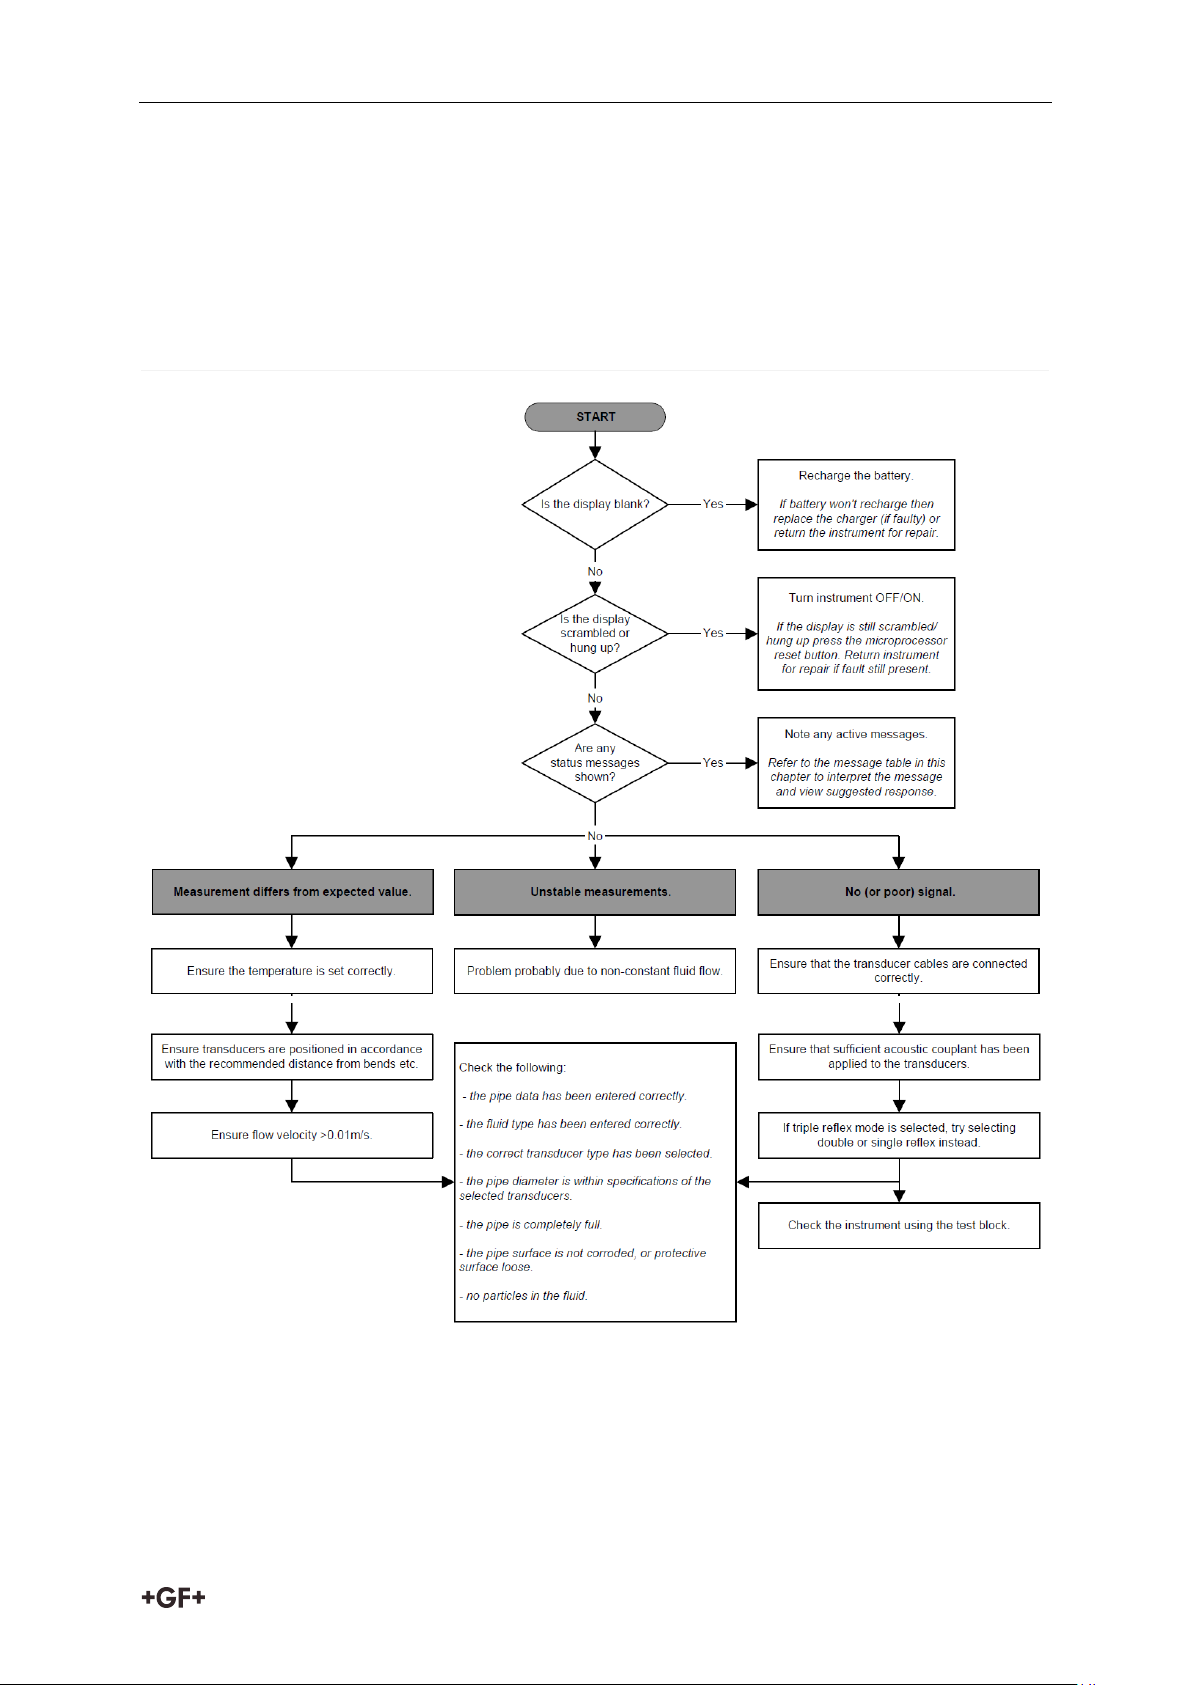
Instrction manual Troubleshooting
Liquid content problems
Multiple liquid contents do not comply accurately to expected sound speed criteria.
Very hot pipe almost turns water to steam and therefore exhibits the wrong speed
characteristics –could be due to reduced pipe pressure.
Flashover – liquid turns into a gas because of lower than required pressure.
9.2 General Troubleshooting Procedure
43
Page 45
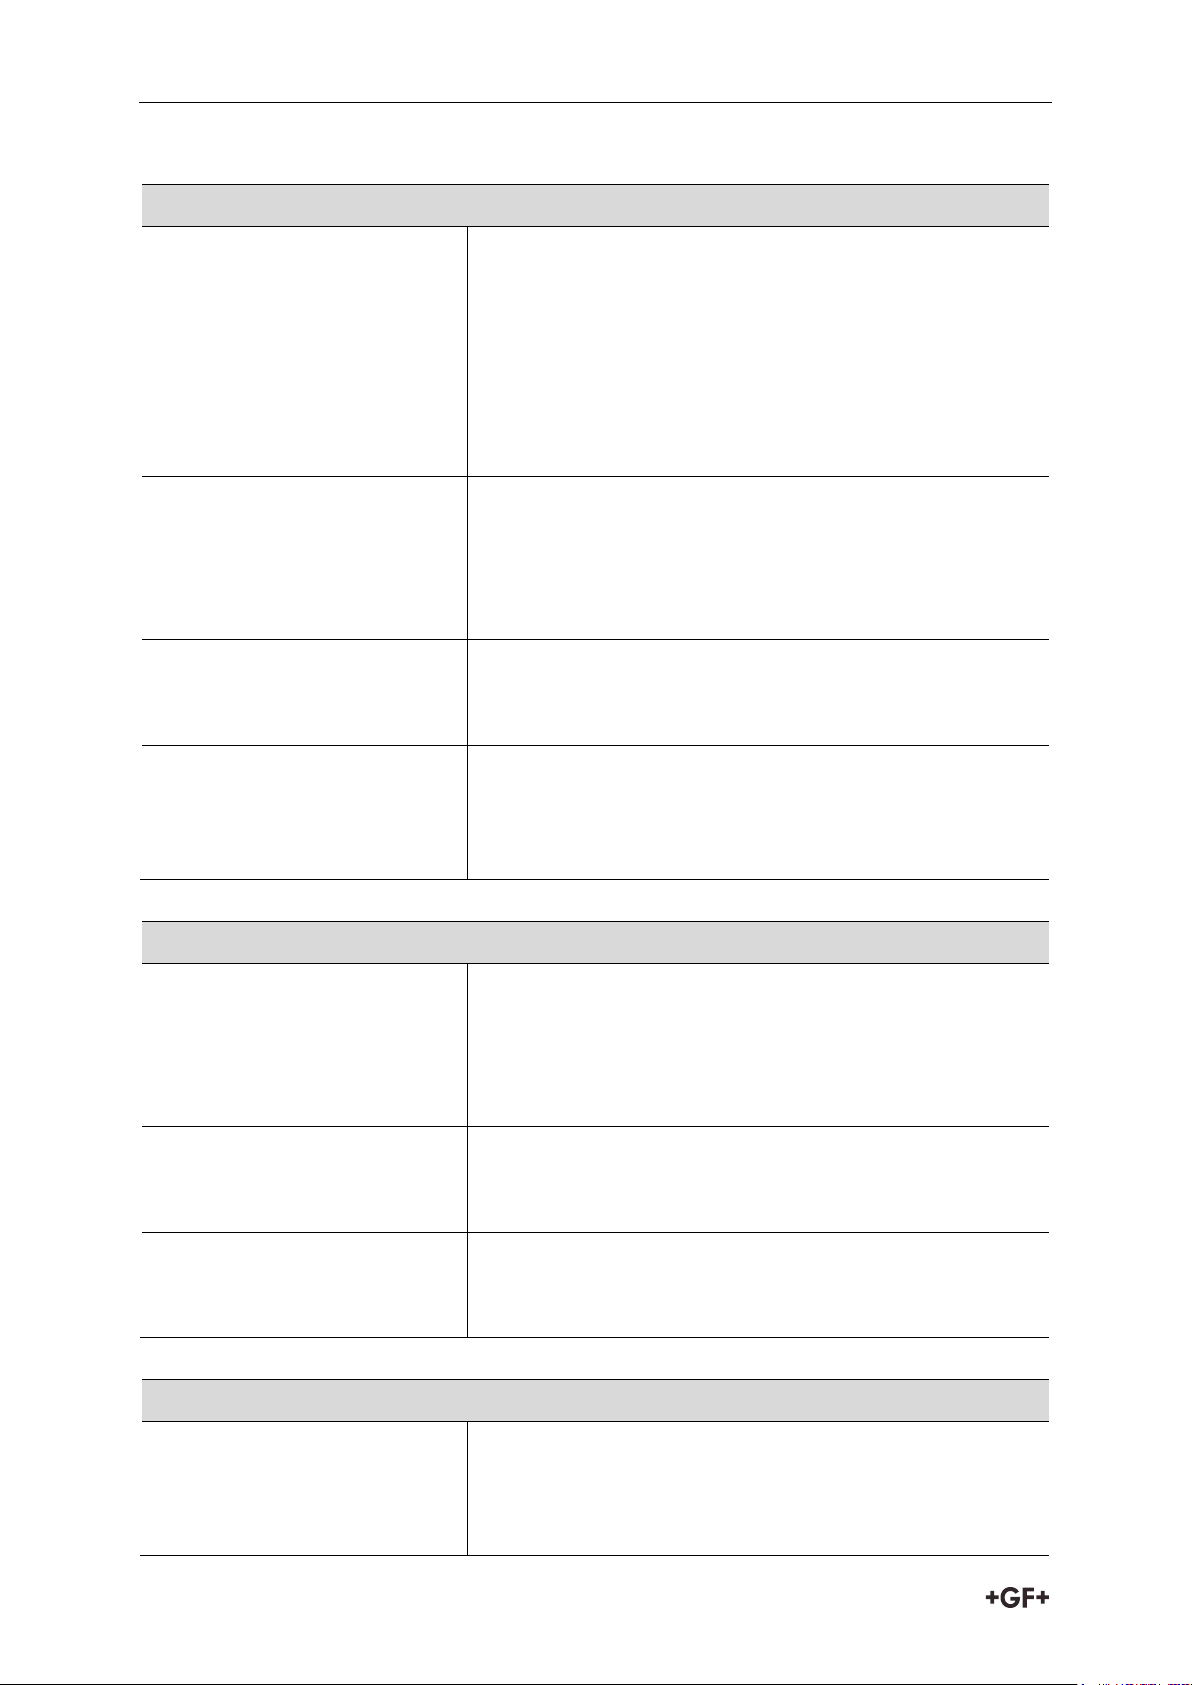
Troubleshooting Instruction manual
Flow rate errors
No flow signal
Interpretation: This message appears when the
transducers cannot send or receive signals to each other.
Response: Firstly check that all cables are connected,
transducers are on the pipe correctly with sufficient
couplant on the face. This condition could also be due to a
partially empty pipe, aerated liquid, particulate content
too high or when the condition of the pipe being
measured is poor.
Flow signal is poor
Interpretation: This warning appears when the signal is
lower than 25%.
Response: This could be due to an application problem, a
poor quality pipe – see also the conditions for No flow
signal (above). Check for sufficient couplant.
Zero cut-off error!
Interpretation: You have entered an out-of-range value in
the Zero cutoff field in the Options menu.
Response: Enter a valid number.
Totaliser beyond
maximum!
Interpretation: The totaliser has overflowed its maximum
count. The counter will roll-over and restart from zero
but this message alerts you to the fact.
Response: Reset the totalizer.
Pulse errors
Pulse Rate > Max
Interpretation: The flow rate exceeds the capability of the
pulse output – i.e. too many pulses per second are
required than can be achieved.
Response: Narrow the pulse width time or increase the
volume per pulse
Pulse volume error!
Interpretation: You have entered an out-of-range value in
the Pulse volume error field in the PULSE OUTPUT menu.
Response: Enter a valid number.
Pulse width error
Interpretation: You have entered an out-of-range value in
the Pulse width error field in the PULSE OUTPUT menu.
Response: Enter a valid number.
4-20mA errors
mA out > Max
Interpretation: The actual flow is higher than the
maximum set on the mA range.
Response: Re-scale the 4-20mA output to be able to cope
with the higher flow.
9.3 Warning & Status Messages
44
Page 46
Instrction manual Troubleshooting
4-20mA errors
Calibration 20mA
Error!
NOTE:
The 4-20mA output is calibrated before the
instrument leaves the factory and should not require
further adjustment.
Interpretation: You have adjusted the DAC outside its
accepted range when calibrating the 20mA signal output.
Response: Re-calibrate the 4-20mA output.
Calibration 4mA Error!
NOTE:
The 4-20mA output is calibrated before the
instrument leaves the factory and should not require
further adjustment.
Interpretation: You have adjusted the DAC outside its
accepted range when calibrating the 4mA signal output.
Response: Re-calibrate the 4-20mA output.
Data logging errors
Log not empty!
Interpretation: When using QuickStart and manually
starting a log, this message is displayed to warn you that
a log already exists. The screen will offer the option to
cancel the logging, or save the log to another site.
Response: Attempt to save the existing log, then re-start
logging. If logging still fails to start, and the error
message remains, then either all the sites are in use or
all the Logger memory is full. Check for any unwanted log
files and delete them.
Log memory full
Interpretation: This occurs when all the data logger
memory locations are filled.
Response: Clear the logger memory
USB key not found
Interpretation: Attempt is made to download logged data
without a working FAT format USB key being present in
the USB socket.
Response: Insert or replace the USB key and abort then
restart the download
Battery errors
Battery Low
Interpretation: The battery has discharged to below 30%
remaining. This leaves the instrument with approximately
4 hours remaining, depending on power usage, before it
needs recharging.
Response: Recharge the internal battery at the earliest
opportunity. Do not leave the instrument for a prolonged
period with a fully discharged battery.
Battery Exhausted
Interpretation: The battery is approaching a fully
45
Page 47
Troubleshooting Instruction manual
Battery errors
discharged state and the instrument is about to store the
internal data and shut-down.
Response: Recharge the battery.
Set-up errors
Pipe OD out of range
Interpretation: You have entered an out-of-range value
for the pipe outside diameter dimension – i.e. larger or
smaller than the unit or sensor can be used on.
Response: Enter a valid number.
Wall thickness out of
range
Interpretation: You have entered an out-of-range value
for the pipe wall thickness dimension – accepted range is
1mm - 75mm.
Response: Enter a valid number.
Lining thickness out of
range
Interpretation: You have entered an out-of-range value
for the lining thickness dimension – acceptable range is
0mm - 25mm.
Response: Enter a valid number.
Temperature range
Interpretation: You have entered an out-of-range value
for the fluid Temperature. Accepted temperature range 20°C to +300°C.
Response: Enter a valid number.
Invalid Date or Time
Interpretation: The entered Date or Time is invalid, or
when setting up ‘timed’ data logging the Stop time is set
earlier than the Start time.
Response: Enter a valid Date and Time.
Sensors: INVALID
Interpretation: The selected temperature is higher than
the maximum allowed for the sensor type.
Response: Select alternative sensors or change the
temperature.
Mode: Err Typ
Interpretation: The selected sensors are invalid and the
mode cannot be verified.
Response: Select a valid sensor type and choose a mode
that gives a non-zero separation distance.
46
Page 48
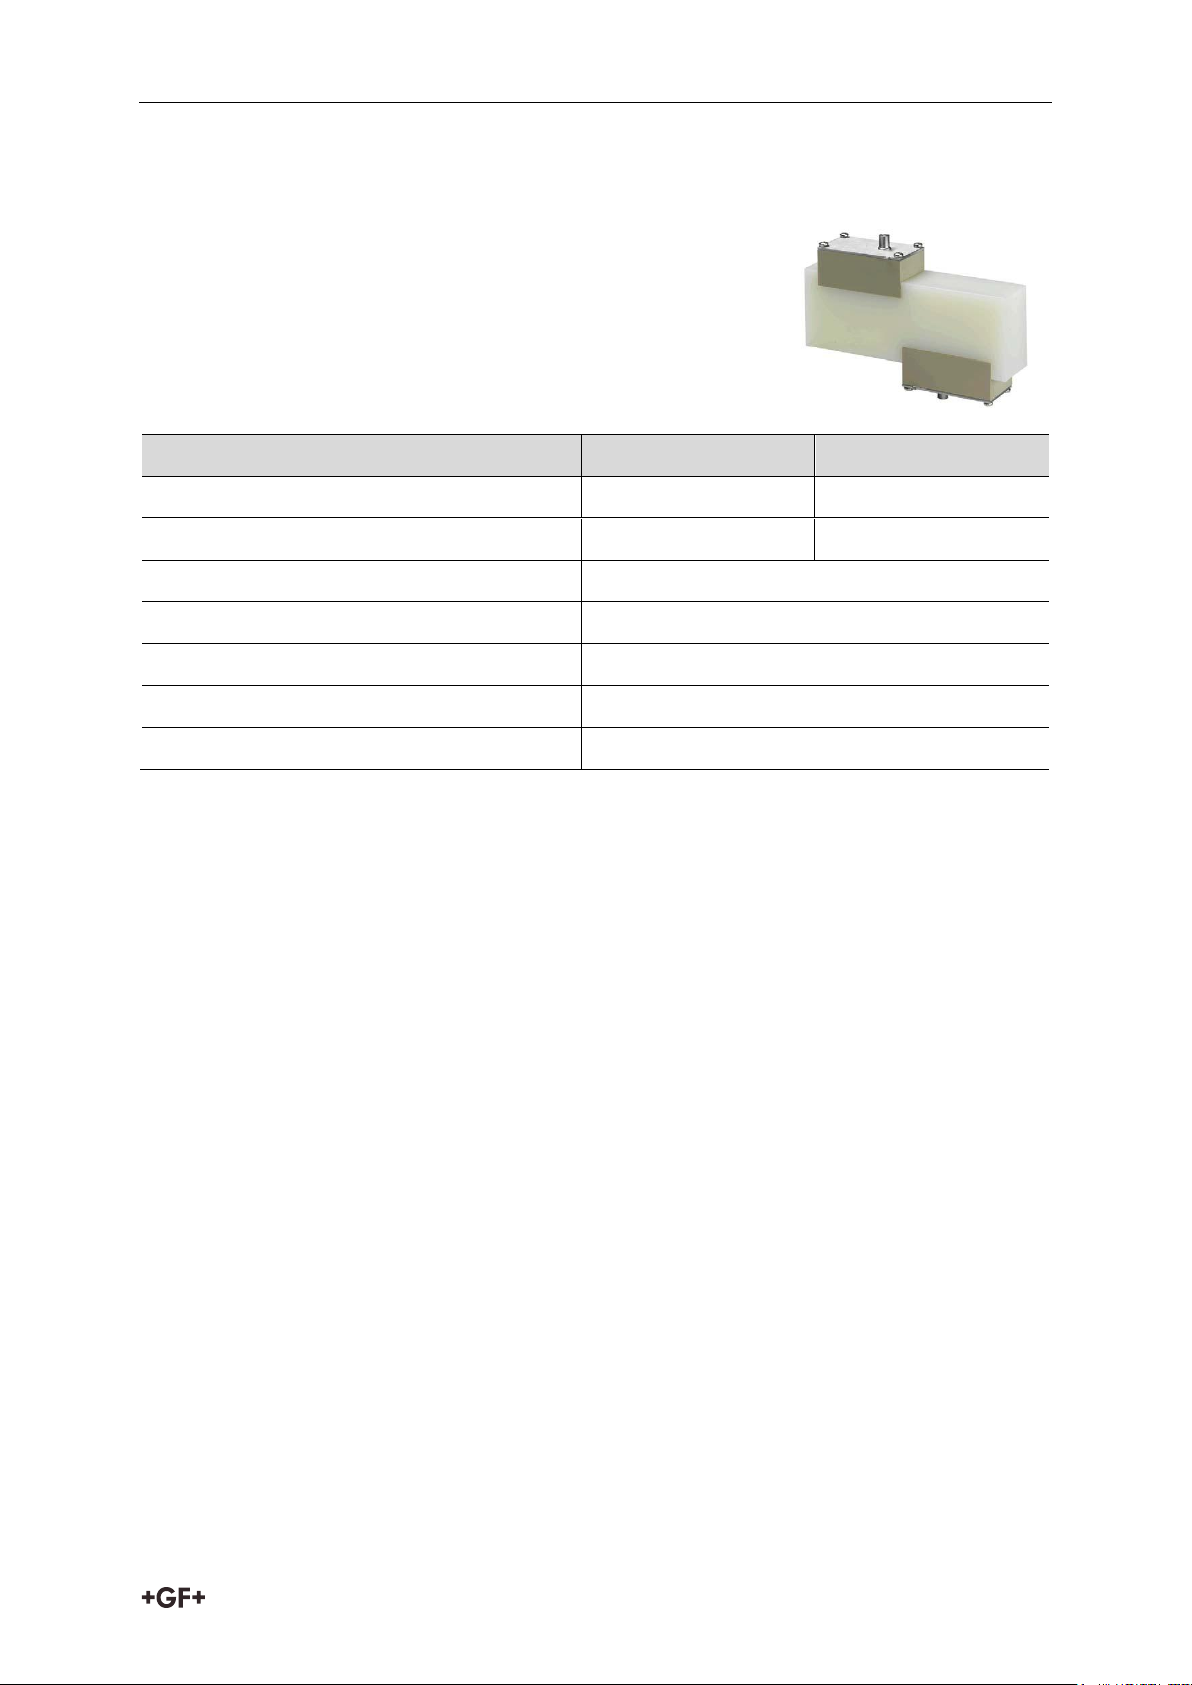
Instrction manual Troubleshooting
A test block is included with the Portaflow 330 equipment to
allow the transducers and inter-connecting cables to be
functionally checked.
1. Switch ON the instrument.
2. Select Quick start and enter the parameters shown in the
table below for the appropriate transducer type (A or B):
Parameter
A Sensors
B Sensors
Pipe outside diameter
30.0mm
50.0mm
Pipe wall thickness
14.0mm
22.0mm
Pipe lining thickness
0.00
Pipe wall material
PVDF-SYGEF
Fluid type
Water
Mode
Diagonal
Temp
20°C
9.4 Test Block
3. When the above data is entered, the SENSOR SEPARATION screen will be displayed.
4. Use the UP/DOWN scroll key to go to the SENSOR SELECTION menu. Select the
appropriate sensor (the default will be “A”) and press the ENTER key to return to the
SENSOR SELECTION menu.
5. Select Sensor mode and position the cursor at Diagonal and press ENTER to return to the
SENSOR SELECTION menu.
6. Select Exit and press the ENTER key to return to the SENSOR SEPARATION screen.
7. Check that the parameters displayed are correct.
8. Apply acoustic couplant to the sensors and attach them to the test block with the
connectors positioned towards the centre of the test block as shown, and temporarily
secure them in place using elastic bands or tape.
9. Connect the sensors to the Portaflow 330 instrument using the cables provided.
10. Press the ENTER key to go to the FLOW READING screen.
11. Select the Options key to go to the FLOW READING OPTION menu and set the Damping to
at least 10 seconds.
12. Select Exit and press ENTER to return to the FLOW READING menu.
13. The flow reading value displayed is not important. The fact that a reading is obtained
indicates that the instrument is functioning. This value may fluctuate but this is normal.
14. The signal strength indicator at the left of the display should show 3–4 bars.
9.5 Microprocessor Reset Facility
In the rare event that the Portaflow 330 instrument appears to totally hang-up, or displays
total gibberish, you can reset its microprocessor by carefully inserting a straightened
47
Page 49

Troubleshooting Instruction manual
paperclip into the pinhole located in the right-hand side of the instrument to operate the
internal reset switch. Hold the paperclip perpendicular to the instrument while doing this.
9.6 Diagnostics Display
This feature is designed for advanced users and is intended to provide information that will
aid the user to diagnose problems – e.g. no signal strength. When operating in the FLOW
READING mode you can access a diagnostics screen by pressing the Options function key and
then selecting Diagnostics from the FLOW READING OPTIONS screen. This will display the
operating values for the following parameters.
Calculated time (μs)
This is a value the instrument predicts will be the time in μsecs that it should take for the
acoustic wave to propagate across a particular pipe size. This value is ascertained from the
data entered by the user. i.e. Pipe size, material, sensor set etc.
Actual time (μs)
This is the value the instrument measures as the time taken for the acoustic wave to
propagate across the pipe. It is used to see if the signal is being taken from the burst, at the
correct time to get the strongest signal. This value is normally a few μs below the calculated
μs value. If, however, this value is much greater than the calculated time then there is a
problem with the set-up.
Flow (m/s)
This displays flow velocity in m/sec to 3 decimal places.
Signal strength
This is the averaged value of Signal and should be a value between 800 and 1600 – where 800
is approximately 50%, and 1600 is approximately 100%.
Gain
Gain values are typically in the range 600 to 850.
Switches
Typical Switches values are None and *10. On small pipes (and when using the test block) the
value should be None. A Switch value of *100 indicates poor sensor set-up or poor
connections.
UP/DN time difference
The difference in transit times between the upstream and downstream signals due to the fluid
flow.
Fluid propagation rate
This is the sound speed of the fluid calculated using the data entered by the user.
Sensor separation
The same value as displayed in the setup screen.
48
Page 50
Instrction manual Appendix A: Specification
General
DSP Measurement Technique:
Transit time.
Timing Resolution:
50 pico-second, continuous signal level indication on
display.
Flow Velocity Range:
Minimum Velocity 0.1m/s; Max Velocity 20m/s: Bidirectional.
Turn Down Ratio:
100:1
Accuracy:
±0.5% to ±2% of flow reading for flow rate >0.2m/s
and Pipe ID >75mm.
±3% of flow reading for flow rate >0.2m/s and Pipe ID
in range 13mm - 75mm.
±6% of flow reading for flow rate < 0.2m/s.
Repeatability:
±0.5% of measured value or ±0.02m/s whichever is
the greater.
Reynolds Number Correction:
Flow velocity corrected for Reynolds number over
entire velocity range.
Response Time:
< 500ms depending on pipe diameter.
Selectable Flow Units:
VELOCITY: m/sec, ft/sec.
VOLUME: l/s, l/min, l/h, gal/min, gal/h, USgals/min,
USgals/h, Barrel/h, Barrel/day, m³/s, m³/min, m³/h.
Selectable Volume Units:
l, gal, USgals, Barrel, m³.
Total Volume:
12 Digits - forward and reverse.
Applicable fluid types
Fluid Condition:
Clean liquids or oils that have less than 3% by
volume of particulate content. Applications include
river water, sea water, potable water, demineralised
water, glycol/water mix, hydraulic systems and diesel
oil.
Applicable pipe types
Pipe Materials:
Any sonic conducting medium such as PVDF-SYGEF,
PP-PROGEF, PE-ELGEF, PB-INSTAFLEX, ABS, PVCU/PVC-C, Mild Steel, Ductile Iron, S’less Steel 316,
Copper
Pipe Dimension (outside diameter):
Min 13mm; Max 5000mm with D sensor set.
Pipe Wall Thickness:
1mm - 75mm.
Pipe Lining:
Applicable pipe linings include Rubber, Glass,
Concrete, Epoxy, Steel.
10 Appendix A: Specification
49
Page 51
Appendix A: Specification Instruction manual
Applicable pipe types
Pipe Lining Thickness:
0mm – 25mm.
Pipe Wall Temperature Range:
Standard sensor operating temperature is -20°C to
+135°C.
Transducer sets
Standard:
Temperature Range -20°C to +135°C.
'A-ST' (standard) 13 mm…115 mm pipe O.D. (2MHz).
'B-ST' (standard) 50 mm…2000 mm pipe O.D. (1MHz).
'D'* 1500 mm…5000 mm pipe O.D. * Temperature
Range -20°C to +80°C (0.5MHz).
Data logger
Data Logged:
Site name, flow rate and totals.
Logs data selected in setup, e.g l, gals, USgals, m³.
No. data points:
200k.
Time Stamping:
All data points are time stamped.
No. Sites:
20 sites.
No. Data Points Per Site:
All free memory can be allocated to any site up to a
max of 200,000 data points.
Programmable Logging Interval:
5 secs to 1hr.
Languages
Standard Supported Languages:
English, French, German, Italian, Spanish,
Portuguese, Russian, Norwegian, Dutch, Swedish.
Outputs
USB Memory key:
FAT formatted
Analogue Output: Resolution:
Alarm Currents: Isolation:
Maximum Load:
4–20mA, 0–20mA, 0–16mA.
0.1% of full scale.
Any between 0–26mA.
1500V Opto-isolated.
620 Ohms.
Pulse Output TTL: Max Current:
(Volumetric mode)
Pulse Repetition Rate:
(Frequency mode)
Max Pulse Frequency
Opto-isolated MOSFET relay.
150mA
Up to 500 pulses/sec (depending on pulse width).
500ms for 1 pulse/sec.
5ms for 100 pulses/sec.
200Hz
50
Page 52
Instrction manual Appendix A: Specification
Outputs
Flow at Max Frequency
9999 l/s
Electrical
Supply Voltage:
Input Voltage Range:
9–24Vdc.
Power Consumption:
10.5W.
Battery
Technology:
5-cell NiMH.
Capacity:
3.8AHr.
Operating time:
Typically 20 hours continuous with backlight and 420mA output OFF.
Recharge Time:
6.5 Hours.
Service Life:
>500 charge/discharge cycles.
Power Supply/Charger
Manufacturer:
Mean Well type GE18I12-P1J
Input Voltage Range:
90–264Vac.
Input Frequency Range:
47–63Hz.
Output Voltage:
12Vdc.
Max. Output Current:
1.2A.
Approvals:
FCC, C-Tick, UL, CUL, TUV, CB & CE.
Mechanical
Carrying case:
Rating:
All components are contained in a hard-wearing IP67
rated carrying case with a protective moulded foam
insert.
Enclosure:
Material:
Flame retardant injection moulded ABS.
Dimensions:
264mm x 168mm x 50mm.
Weight (Including Battery):
1.1 kg.
Protection:
IP54.
Keypad:
No. Keys:
16.
Display:
Format:
240 x 64 pixel graphic display, high contrast black-
51
Page 53
Disposal Instruction manual
Mechanical
on-white, with backlight.
Viewing Angle:
Min 30°, typically 40°.
Environmental
Operating Temperature:
–20°C to +50°C.
Storage Temperature:
–25°C to +65°C.
Operating Humidity:
90% RH MAX at +50°C.
Charging Temperature:
0°C to +40°C.
Approvals
Safety:
BS EN 61010.
EMC:
BS EN 61326 - 1:2006, BS EN 61326-2-3:2006.
Battery Charger:
EN61204 - 3.
Shipping information
Box Dimensions:
410mm x 205mm x 355mm.
Weight:
7.5 kg.
Volumetric Weight:
5. kg.
A product marked with this symbol must be taken to a separate collection point
for electrical and electronic devices.
If you have any questions regarding disposal of the product, please contact your
national agent for GF Piping Systems.
GF reserve the right to alter any specification without notification. PORTAFLOW 330 and
PF330 are identical.
11 Disposal
Before disposing of the different materials, separate them by recyclables, normal waste
and special waste.
Comply with local legal regulations and provisions when recycling or disposing of the
product, the individual components and the packaging.
Comply with national regulations, standards and directives.
If you have questions regarding the disposal of your product, please contact your national GF
Piping Systems representative.
52
Page 54

Notes
Page 55

Notes
Page 56

GF Piping Systems
Worldwide at home
Our sales companies and representatives
ensure local customer support in over 100 countries
www.gfps.com
Argentina / Southern South America
Georg Fischer Central Plastics
Sudamérica S.R.L.
Buenos Aires, Argentina
Phone +54 11 4512 02 90
gfcentral.ps.ar@georgfische .com
www.gfps.com/ar
Australia
George Fischer Pty Ltd
Riverwood NSW 2210 Australia
Phone +61 (0) 2 9502 8000
australia.ps@georgfische .com
www.gfps.com/au
Austria
Georg Fischer
Rohrleitungssysteme GmbH
3130 Herzogenburg
Phone +43 (0) 2782 856 43-0
austria.ps@georgfische .com
www.gfps.com/at
Belgium / Luxembourg
Georg Fischer NV/SA
1070 Bruxelles/Brüssel
Phone +32 (0) 2 556 40 20
be.ps@georgfische .com
www.gfps.com/be
Brazil
Georg Fischer Sist. de Tub. Ltda.
04795-100 São Paulo
Phone +55 (0) 11 5525 1311
br.ps@georgfische .com
www.gfps.com/br
Canada
Georg Fischer Piping Systems Ltd
Mississauga, ON L5T 2B2
Phone +1 (905) 670 8005
Fax +1 (905) 670 8513
ca.ps@georgfische .com
www.gfps.com/ca
China
Georg Fischer Piping Systems Ltd
Shanghai 201319
Phone +86 21 3899 3899
china.ps@georgfische .com
www.gfps.com/cn
Denmark / Iceland
Georg Fischer A/S
2630 Taastrup
Phone +45 (0) 70 22 19 75
info.dk.ps@georgfische .com
www.gfps.com/dk
Finland
Georg Fischer AB
01510 VANTAA
Phone +358 (0) 9 586 58 25
Fax +358 (0) 9 586 58 29
info.fi.p@georgfische .com
www.gfps.com/fi
France
Georg Fischer SAS
95932 Roissy Charles de Gaulle Cedex
Phone +33 (0) 1 41 84 68 84
fr.ps@georgfische .com
www.gfps.com/fr
Germany
Georg Fischer GmbH
73095 Albershausen
Phone +49 (0) 7161 302-0
info.de.ps@georgfische .com
www.gfps.com/de
India
Georg Fischer Piping Systems Ltd
400 076 Mumbai
Phone +91 224007 2001
branchoffi@georgfische .com
www.gfps.com/in
Indonesia
George Fischer Pte Ltd –
Representative Offi
Phone +62 21 2900 8564
Fax +62 21 2900 8566
sgp.ps@georgfische .com
www.gfps.com/sg
Italy
Georg Fischer S.p.A.
20063 Cernusco S/N (MI)
Phone +39 02 921 861
it.ps@georgfische .com
www.gfps.com/it
Japan
Georg Fischer Ltd
556-0011 Osaka,
Phone +81 (0) 6 6635 2691
jp.ps@georgfische .com
www.gfps.com/jp
Korea
GF Piping Systems
Georg Fischer Korea Co., Ltd.
Unit 2501, U-Tower
120 HeungdeokJungang-ro (Yeongdeok-dong)
Giheung-gu, Yongin-si, Gyeonggi-do, Korea
Phone: +82 31 8017 1450
Fax : +82 31 217 1454
kor.ps@georgfische .com
www.gfps.com/kr
Malaysia
George Fischer (M) Sdn. Bhd.
40460 Shah Alam, Selangor Darul Ehsan
Phone +60 (0) 3 5122 5585
Fax +603 5122 5575
my.ps@georgfische .com
www.gfps.com/my
Mexico / Northern Latin America
Georg Fischer S.A. de C.V.
Apodaca, Nuevo Leon
CP66636 Mexico
Phone +52 (81) 1340 8586
Fax +52 (81) 1522 8906
mx.ps@georgfische .com
www.gfps.com/mx
Middle East
Georg Fischer
Piping Systems (Switzerland) Ltd
Dubai, United Arab Emirates
Phone +971 4 289 49 60
gcc.ps@georgfische .com
www.gfps.com/int
Netherlands
Georg Fischer N.V.
8161 PA Epe
Phone +31 (0) 578 678 222
nl.ps@georgfische .com
www.gfps.com/nl
Norway
Georg Fischer AS
1351 Rud
Phone +47 67 18 29 00
no.ps@georgfische .com
www.gfps.com/no
Philippines
George Fischer Pte Ltd
Representative Offi
Phone +632 571 2365
Fax +632 571 2368
sgp.ps@georgfische .com
www.gfps.com/sg
Poland
Georg Fischer Sp. z o.o.
05-090 Sekocin Nowy
Phone +48 (0) 22 31 31 0 50
poland.ps@georgfische .com
www.gfps.com/pl
Romania
Georg Fischer
Piping Systems (Switzerland) Ltd
020257 Bucharest - Sector 2
Phone +40 (0) 21 230 53 80
ro.ps@georgfische .com
www.gfps.com/int
Russia
Georg Fischer
Piping Systems (Switzerland) Ltd
Moscow 125047
Phone +7 495 258 60 80
ru.ps@georgfische .com
www.gfps.com/ru
Singapore
George Fischer Pte Ltd
11 Tampines Street 92, #04-01/07
528 872 Singapore
Phone +65 6747 0611
Fax +65 6747 0577
sgp.ps@georgfische .com
www.gfps.com/sg
Spain / Portugal
Georg Fischer S.A.
28046 Madrid
Phone +34 (0) 91 781 98 90
es.ps@georgfische .com
www.gfps.com/es
Sweden
Georg Fischer AB
117 43 Stockholm
Phone +46 (0) 8 506 775 00
info.se.ps@georgfische .com
www.gfps.com/se
Switzerland
Georg Fischer
Rohrleitungssysteme (Schweiz) AG
8201 Schaffhause
Phone +41 (0) 52 631 30 26
ch.ps@georgfische .com
www.gfps.com/ch
Taiwan
Georg Fischer Co., Ltd
San Chung Dist., New Taipei City
Phone +886 2 8512 2822
Fax +886 2 8512 2823
www.gfps.com/tw
United Kingdom / Ireland
George Fischer Sales Limited
Coventry, CV2 2ST
Phone +44 (0) 2476 535 535
uk.ps@georgfische .com
www.gfps.com/uk
USA / Caribbean
Georg Fischer LLC
9271 Jeronimo Road
92618 Irvine, CA
Phone +1 714 731 88 00
Fax +1 714 731 62 01
us.ps@georgfische .com
www.gfps.com/us
Vietnam
George Fischer Pte Ltd
Representative Offi
136E Tran Vu, Ba Dinh District, Hanoi
Phone +84 4 3715 3290
Fax +84 4 3715 3285
sgp.ps@georgfische .com
www.gfps.com/sg
International
Georg Fischer
Piping Systems (Switzerland) Ltd
8201 Schaffhausen/ witzerland
Phone +41 (0) 52 631 30 03
Fax +41 (0) 52 631 28 93
info.export@georgfische .com
www.gfps.com/int
The technical data are not binding. They neither constitute expressly
warranted characteristics nor guaranteed properties nor a guaranteed durability.
They are subject to modifi ation. Our General Terms of Sale apply.
.
GFDO_6408_4 (08.15)
© Georg Fischer Piping Systems Ltd
CH-8201 Schaffhausen/Switzerland, 2015
 Loading...