

Page 1
Find a contact near you by visiting www.ge.com/water and clicking on “Contact Us”.
* Trademark of General Electric Company; may be registered in one or more countries.
©2011, General Electric Company. All rights reserved.
TP1189EN.doc Jun-11
Technical
Paper
Slag Control Treatment Program at a
Southeastern Utility
Authors:
M. Domingo Tubio, Product Applications Engineer
Rick Higginbotham, Account Executive
Abstract
Coal-fired power plants supply over half the electricity to the US grid. Currently, utilities are facing a
range of challenges including decreasing industrial
demand for electricity, competition from low cost
natural gas and rising coal prices. High quality Eastern bituminous Central Appalachian (CAPP) coal
costs are increasing due to rising exports, increasing
transportation and environmental costs and decreasing production, (Buchsbaum 2008; Metzroth
2008). To stay competitive, some utilities are investigating burning lower-cost, lower-quality “opportunity” coals such as Northern Appalachian (NAPP) and
Illinois Basin. The most efficient plants can be dispatched for longer periods for improved financial
performance. The change to lower rank coal and
increased operation can result in increased slag deposits in the furnace and superheater areas, (Gabriel
2011).
A Southeastern utility desired to blend lower-cost
low ash fusion temperature Northern Appalachian
(NAPP) coal with their typical CAPP coal in their 745
MW pulverized-coal boiler. Sootblower cleaning
alone is not effective when slag deposits are a liquid
or pseudo-plastic state which deforms under pressure. A proprietary mixture of chemical additives
was recommended to elevate ash fusion temperature and modify the deposit to make it more easily
removable by sootblowers. The blend is a unique
combination of water-soluble magnesium hydroxide
and copper oxide slurries which has a synergistic
effect when used together to mitigate slag for-
mation and impact. During the fourth quarter of
2010, the utility consumed over 44,000 tons of
NAPP opportunity coal treated with this combination of proprietary fireside chemical additives over
a four week period. GE’s approach allowed the
customer to minimize the detrimental effects of
burning slag prone coal while reducing fuel costs.
This paper summarizes the trial and performance
results.
Slag and Fouling Formation and Cost
There are numerous non-combustible inorganic
impurities in coal besides hydrocarbons. Depending on the ratio of these minerals and compounds,
slagging and convective pass fouling can occur in
boilers. Slag formation accelerates when the furnace exit gas temperature (FEGT) exceeds the fusion temperature of the ash. Indices such as the
basicity ratio can help predict slag viscosity and
ash fusion temperature (Babcock & Wilcox 1978).
As slag density increases with time and temperature, a deposit is formed that is difficult to remove
with sootblowing. Deposits can “grow” as particles
accumulate; it is not uncommon to observe large
deposits on the leading edge of platen superheat
tubes and secondary superheater tubes above the
bull nose of the boiler. When the slag eventually
falls it can damage tube banks lower in the boiler,
resulting in unscheduled outages and lower availability.
CAPP coal typically has a high ash fusion temperature and less tendency to create excessive
slagging. NAPP coal is becoming more economically attractive for several reasons, including
availability at lower delivered costs than CAPP
coal (Pusateri 2009). Figure 1 illustrates the challenge of using NAPP coal with a lower ash fusion
Page 2
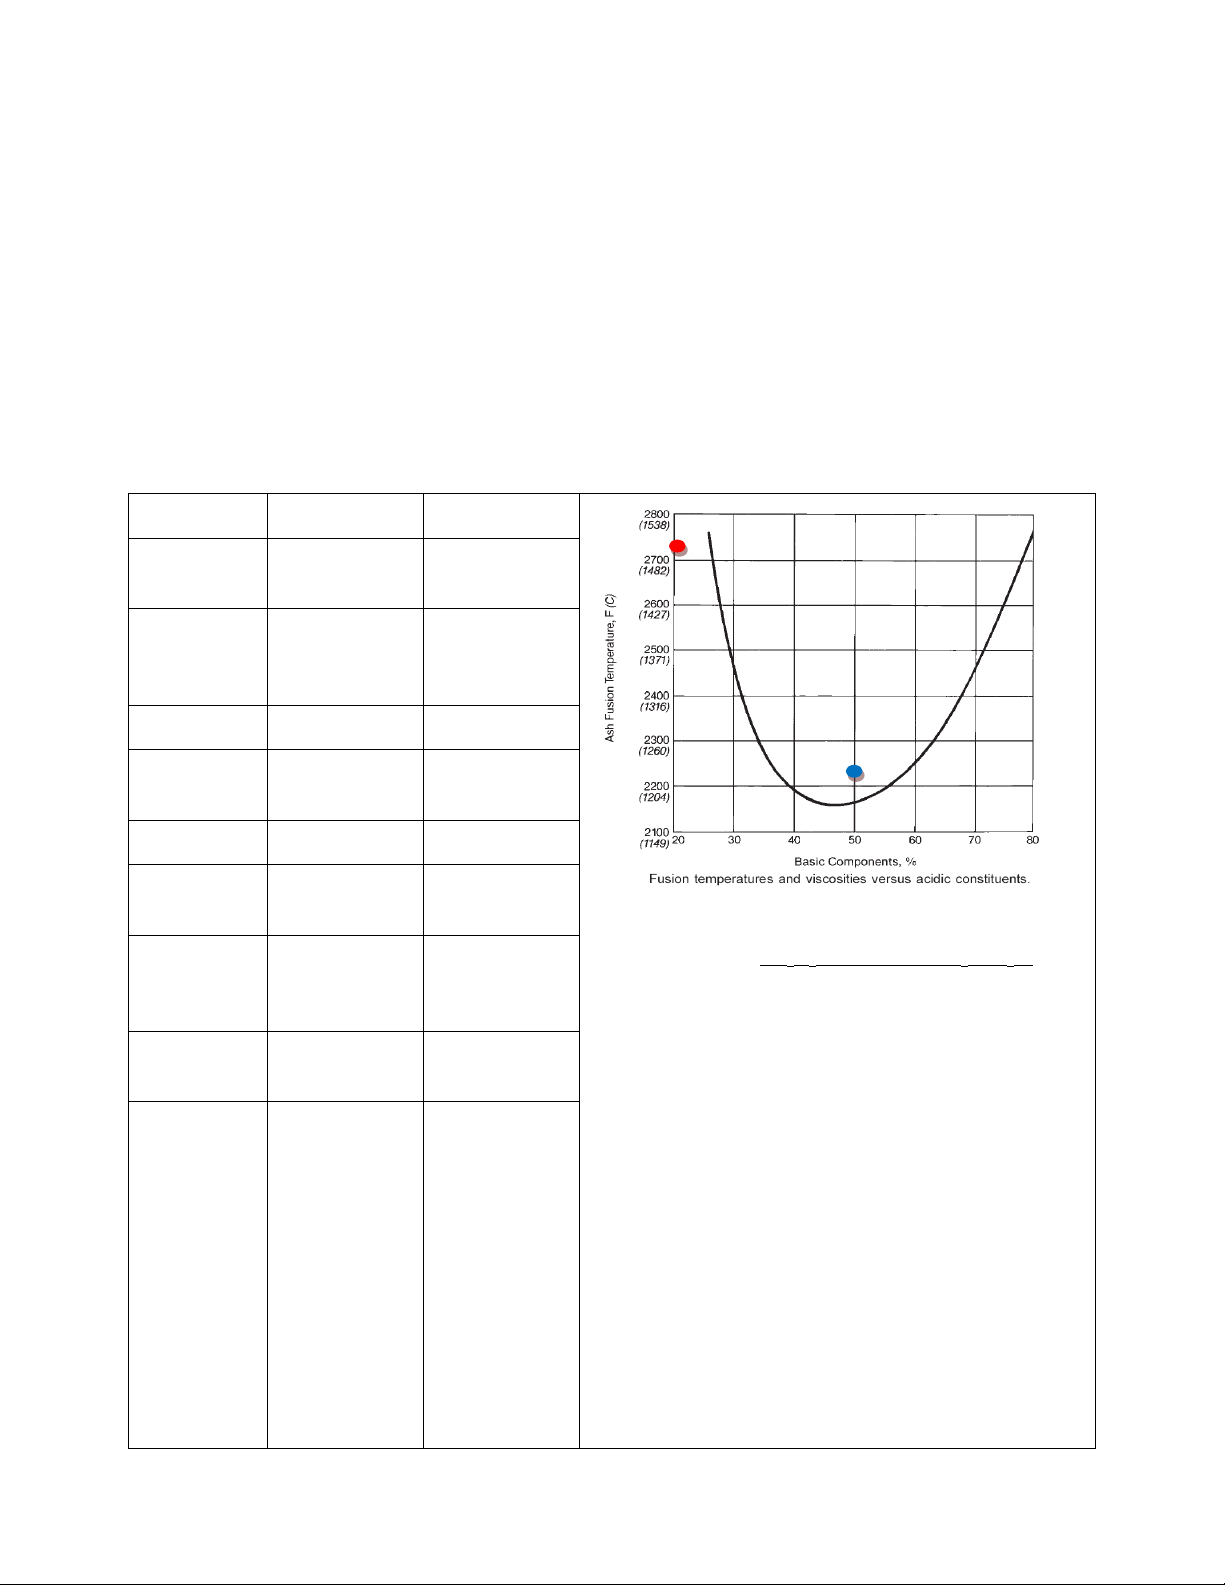
Figure 1: Fuel Comparison and Basicity Ratio (Babcock & Wilcox, 1978)
temperature. Slag deposits are expected to be in
Fuel Type
Typical
Opportunity
** Basicity Ratio = (Fe2O3+CaO+MgO+Na2O+K2O)
(SiO2+Al2O3+TiO2)
Source
Central
Appalachian
Northern
Appalachian
Cost per
ton, $US
(2010)
$70 – $75
$58 – $70
HHV, Btu/lb
~12,000
~13,000
SO2,
lb/MMBtu
1.1 – 1.5
4.5 – 5.0
Ash, wt%
11 – 12
7 – 8
Moisture,
wt%
6.7 – 7.0
6.0 – 7.0
Ash Softening Temp,
deg F
2,700
2,250
Basicity
Ratio **
0.12 – 0.14
0.45 – 0.55
Ash, wt%
SiO2
Al2O3
Fe2O
3
K2O
TiO2
MgO
CaO
Na2O
53 – 56
28 – 30
5 – 6
3.3 – 3.6
1.3 – 1.5
0.9 – 1.0
0.7 – 1.3
0.2 – 0.3
39 – 40
20 – 21
22 – 24
1.3 – 1.4
0.85 – 0.95
1.05 – 1.15
5 – 6
0.95 – 1.05
liquid state at furnace temperatures with noncombustible mineral content present. Sootblower cleaning alone is not effective when the slag is a liquid or
pseudo-plastic state which deforms under pressure.
Fouling, which is closely related to slagging, usually
occurs in the boiler’s cooler convective back-pass
section as gaseous ash components (such as sodium and potassium) condense. It typically occurs in
the vertical and horizontal reheaters and primary
superheater. Fouling deposits can “bridge” across
tubes and restrict gas flow.
That increases induced fan horsepower, which
raises the plant heat rate and, therefore, lowers
plant efficiency. Slagging and fouling can result in
derating (shedding load) and costly unscheduled
outages and repairs from damaging slag falls. But
these problems can be eased by combining chemical additives for fireside applications with mechanical removal (sootblowers).
Boiler and Trial Design
The 745-MW pulverized coal-fired boiler is a Riley
Stoker Corporation front-wall fired boiler with
2,500,000 lbs/hr steam production at 2610 psig
and 1,005 deg F at superheater terminal outlet.
Page 2 Technical Paper
Page 3
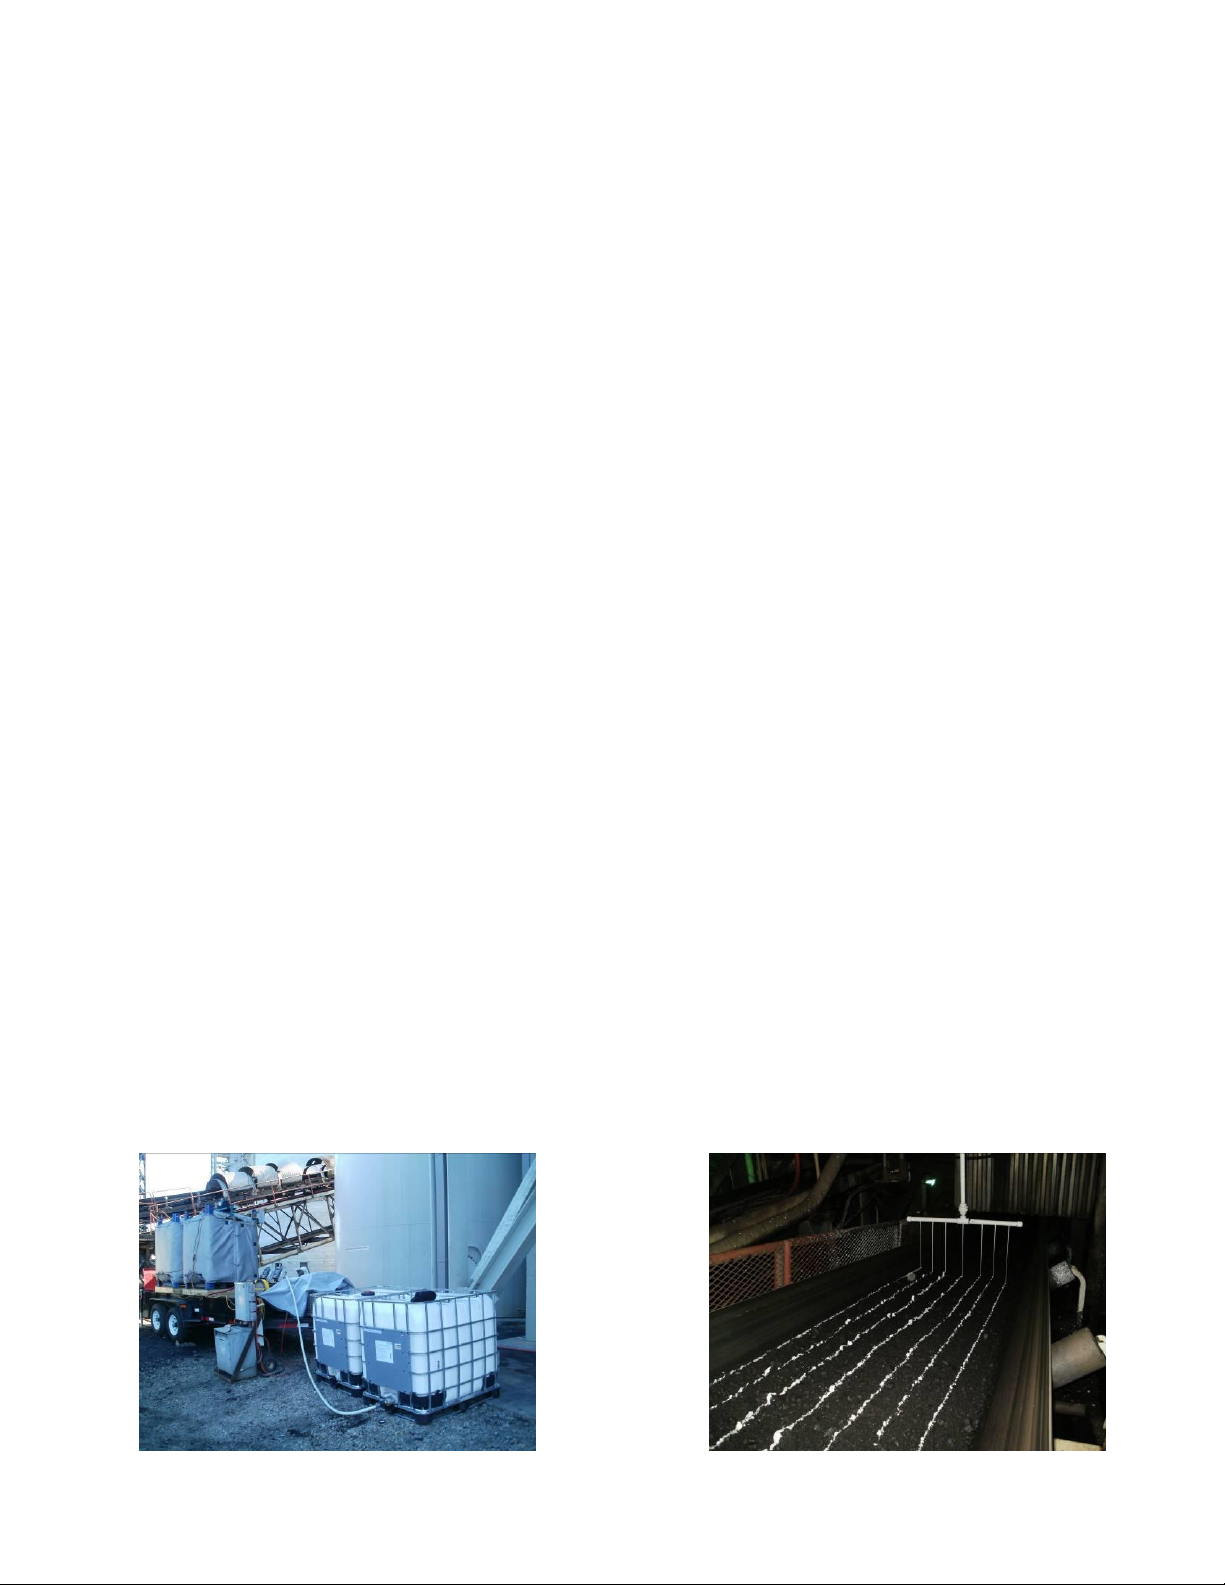
Figure 2: Trial Trailer and totes of additives (left) and applying product to NAPP coal (right)
The boiler fires 250 tons pulverized coal per hour at
maximum load, and the boiler train is equipped with
SCR, cold-side electrostatic precipitators and a wet
flue gas desulfurization (Wet FGD) scrubber system.
Trial results using the same opportunity fuel- NAPP
coal- at a sister station indicated it could not be
burned untreated, as the resulting slag was severe
enough to slag the boiler and block the gas path.
Operating experience indicated boiler conditions
could deteriorate within days of introducing opportunity fuel. To minimize the risks of boiler outage
during trial, the utility blended its typical fuel with a
small proportion of opportunity fuel treated with a
mix of proprietary chemical additives to reduce severity of fireside slagging. Product dosages were
optimized as the percentage of opportunity coal
was increased until it reached the target level of 50
percent.
Chemical Additives for Slag Control
A range of chemical additives were considered before the two products were selected based on ultimate analyses of the fuels. The proprietary mix of
additives selected for this trial included a magnesium based compound and a metal oxide. The magnesium is known in the industry to elevate ash
fusion temperatures due to the high melting point of
magnesium oxide. This treatment keeps the slag in
a solid state instead of liquid-phase deposit. The
metal oxide-based slurry contains copper which has
been used in the industry as a combustion catalyst.
Less well known is that copper can reduce the cohesive strength of the ash via a nucleating effect
with iron species. Gradual thermal decomposition of
the metal oxide product also makes the slag porous
and, therefore, weaker. These mechanisms complement the magnesium effect for certain types of
coals or coal blends, depending on the ratio of minerals and other non-combustible species. Together,
the proprietary additives create fracture planes in
the solidified slag, weakening the deposits so that
they can be more easily removed by sootblowers.
Treatment Application
The chemical additives were transferred from agitated trailer-mounted base totes to the coal belts
via peristaltic pumps, where the chemicals were
the dosed at predetermined amounts via a manifold mounted above the coal conveyor (Figure 2).
Dosing occurred when the coal belts conveyed
NAPP coal. Aqueous magnesium-based slurry
dosages were reduced from 3 lbs of product per
ton of NAPP coal to optimum of 1.0-1.5 lbs. Aqueous metal oxide slurry was introduced to determine its impact on slag mitigation in conjunction
with the magnesium-based product. It was determined that the optimum product feed rate was
0.25 lbs product per ton of NAPP coal. The NAPP
coal quantity was ramped up from 16 percent to
the target of 50 percent, where it was maintained
for a week until the end of the trial. The dynamic
test environment confronted the trial team with
challenges that included outages, inclement
weather, and real time adjustments to the dosage
based on visual observations of furnace slag conditions.
Trial Details
To be considered successful, the trial had to meet
several criteria, including:
1. Demonstrating that the magnesium content
increases the ash fusion temperature and,
therefore, makes the deposit more friable and
easily removable.
2. Demonstrating the metal oxide slurry syner-
gistically assists in slag mitigation.
Technical Paper Page 3
Page 4

3. Determining the optimum product feed rates for
the CAPP/NAPP blends while monitoring (with an
infrared (IR) camera) real-time slagging phenomena along with boiler parameters such as
load, pressure drop, and exit temperature. Customer’s fuel blends included 84 percent CAPP/16
percent NAPP, 77 percent CAPP/33 percent
NAPP, and 50 percent CAPP/50 percent NAPP as
the “highest stress test.” (the untreated “base-
line” NAPP blend slag indices were not available,
as they presented unacceptably high operational risks to the customer.)
Mid-December- following a number of
weather-related outages, inclement
weather compelled the suspension of the
trial.
After a weather-related equipment out-
age, NAPP coal treatment was resumed.
Dosage was increased by 10 percent after
a “gooey slag” was seen in the furnace.
The slag subsequently returned to its
semi-solid state.
December 20- the trial concluded.
4. Demonstrating that the use of magnesium
and/or metal oxide products has no adverse effects on boiler operations- i.e., it does not exacerbate slagging or fouling or emissions.
Obtained Flue Gas Desulfurization (FGD)
wastewater grab samples and ash pond samples, analyzed for copper and other components.
Data was recorded during the “baseline” (100%
CAPP coal) and chemical treatment trial periods, assuming equipment parameters such as tube cleanliness, sootblower availability, and thermocouple
calibrations. Note that during the chemical trial the
unit was not derated overnight for deslagging.
Overnight load shedding allows the slag to contract
in the cooler flue gas, and this uneven contraction in
the matrix causes cracks and gravity-assisted removal of the accumulated slag. This beneficial procedure was not conducted during most of the
chemical trial (Figure 3).
Here is the key chronology of the trial
November 15- the chemical trial began as
16 percent NAPP coal was dosed at 3.0
lbs/ton magnesium-based product on the
coal belt en route to bunkering silos #5 and
#6.
DCS Data
The trial team collected data every 5 minutes from
the customer’s “Pi” distributed control system
(DCS), including load (MW), heat rate (MMBtu/hr),
furnace exit gas temperature (FEGT, deg F), sootblower, and coal mill operation including feeder
flow (kpph). For the analysis, the team removed all
data points below 700 MW so that only “full load”
data was considered and outliers could not impact calculations.
The most obvious change over time was sootblower activity. If at least one of the 60 IR (radiant)
or IK (convective) sootblowers was active when
the data was recorded, the event was logged in Pi.
In the DCS, sootblowers were either “on” or “off”; it
was not possible to record which sootblowers
were active. The trial team decided to record the
average number of sootblowers per day to understand how this rate was changing over time. The
frequency seemed to have doubled as the NAPP
was increased from 0 (baseline) to 33 percent and
apparently tripled by the time the trial achieved 50
percent NAPP. It is important for a utility to keep
this parameter in mind given operations concerns
such as steam consumption and tube wear over
time.
November 24-29- the trial was suspended
over Thanksgiving
December 1 and 2- duct testing occurred.
The flue gas sampling successfully obtained
a baseline for the CAPP/NAPP blend while
the treatment consisted only of magnesiumbased product. The magnesium-based
product dosage was decreased as the metal
oxide product was introduced.
Page 4 Technical Paper
Furnace Exit Gas Temperature (FEGT) data is valuable for a slagging study since it can be a proxy
indictor of slag conditions. FEGT values should rise
as slag increases, since slag is an excellent insulator and because increasing slag conditions will
push the fireball farther back into the convective
pass of the furnace, this analysis indicated that
furnace operation vis-à-vis FEGT was approximately equivalent during the baseline and chemical treatment periods. The team observed
decreasing temperature variances between east
and west side thermocouples across the boiler.
Page 5

Figure 3: Key Dates of Trial and Results Summary (for Gross Load >700 MW)
The data below (Figure 3) presents average parame-
PARAMETERS
(start – end dates)
10/18 –
11/14
11/15 –
11/23
11/30 –
12/3
12/4 –
12/8
12/10 –
12/12
12/17
12/18 –
12/20
NAPP Coal, %
0
16
33
33
50
50
50
Magnesium product, lbs/ton
0
3.0
2.0
1.5
1.5
1.0
1.1
Metal oxide product, lbs/ton
0 0 0
0.25
0.25
0.25
0.275
# of Pi data points
4,118
342
634
391
699
123
771
Avg # of sootblows/day
36
57
63
82
104
94
157
Avg Heat Input, MMBtu/hr
7,003
7,060
6,278
6,216
6,892
6,953
6,986
Avg Coal to Boiler, ton/hr
336
321
325
327
327
332
331
U3A Avg Max FEGT, oF
2,318
2,683
2,602
2,496
2,468
2,561
2,627
U3B Avg Max FEGT, oF
2,497
2,536
2,464
2,486
2,521
2,479
2,511
ter values from the trial, implies that chemical
treatment does not adversely impact the boiler. A
longer trial could indicate if boiler operation significantly improvers with chemical treatment while
burning the opportunity coal.
Infrared Photography
The camera’s integral flame filter and high temperature range covered the boiler’s operating
range throughout the trial and its multi-spot temperature measurement capability enabled final
images to include reference temperature profiles,
(Mikron 2011). Thermal photos of the boiler slag
conditions were recorded at the boiler ports
throughout the trial.
The trial team used port inspection and photography to monitor boiler slagging conditions in the
furnace. The team developed a standardized naming convention for referencing boiler ports at vari-
ous elevations. For example, port “3A4E” refers to
Unit 3, Alpha side, Level 4, Port E. This ensured that
slagging conditions were properly recorded, since
more than a dozen trial team members viewed,
photographed, and commented on the visual conditions during the trial.
Visual and infrared (IR) photos of conditions at the
various boiler elevation ports (Figure 4) were made
with an Olympus brand “point-and-click” digital
camera and a Mikron Lumasense brand infrared
camera.
Slag conditions inside the boiler were recorded with
a portable, battery-operated Lumasense Mikronbrand model 7604F infrared camera.
Not only were visual observations of these conditions important, they were, arguably, the best way
to measure the impact of chemical treatment on
boiler slag, since instantaneous changes in many
variables (such as sootblower activity, number of
pulverizers in operation, load changes, etc.) make
it difficult to compare with other parameters in
isolation (such as FEGT).
Several photos of the slagging conditions in the
boiler on November 23 and 30 (Figures 5 and 6)
clearly show the bottom of the superheater (SH)
pendant and no or minimal slag accumulation.
There was some initial concern about the underside of the tubes at Level 3; however, the slag was
removed with a firm push of a spade. Overall
slagging was considered minor at this point, and
noticeably worsened as the inspection continued
down the boiler. (The worst slag was near the
burners.)
Technical Paper Page 5
Page 6

Figure 4: Unit 3 Ports (Elevation Drawing #69085B5, revised 2-19-99)
Plant monitoring and the attached pictures from the
Port Name
Port Qty
Elevation
Notes
Level 1
Ports A,B
2
~580’
Pendant Superheater
Level 2
Ports A,B,C,D
4
~566’
Cold Reheat Piping
Level 2.5
Port A
1
~563’
Above bullnose
Level 3
Ports A,B
2
~550’
Below bullnose
Level 4 Ports
A,B,C,D,E,F
6
~538’
Bullnose
Level 5
Ports A,B,C,D
4
~520’
Wall tubes
Level 6
Ports A,B,C,D
4
~506’
Wall tubes
Level 7
Ports A,B,C,D
4
~496’
Wall tubes
Level 8
Ports A,B
2
~488’
Overfire Air
Level 9
Ports A,B,C,D
4
~483’
Burners
Level 10
Ports A,B
2
~473’
Below burners
early phase of the trial revealed that the slag formation was minimal, with little day-to-day change,
and was being removed by the sootblowers where
possible. Several locations were identified for possible future installations of IK sootblowers to minimize
slag formation. Initial indications showed the slag to
be self-limiting and still friable. Operations and GE
continued to monitor and report on slag formation,
and GE continued to photograph the Unit at these
ports and report the finding after each inspection.
By December 17, the trial team began burning 50
percent NAPP, dosed with 1.0 lbs. magnesiumbased product per ton and 0.25 lbs. metal oxidebased product per ton. Since the slag appeared
gooey and there was concern over the subminimum amount of feed required for operation,
both feeds were increased 10 percent (Figure 6).
By December 20, the boiler recovered and slagging conditions had improved.
Page 6 Technical Paper
Page 7

3A Level 1 Port A, 11-30-10
3A Level 1 Port A, 11-30-10
3A Level 3 Port B, 11-30-10
3A Level 3 Port C, 11-23-10
3B Level 4 Port E, 11-30-10
3A Level 4 Port A, 11-23-10
Figure 5: Visual and IR Photography, 11-23 and 11-30
Technical Paper Page 7
Page 8

Figure 6: Visual and IR Photography, contrasting 11-30-10 with 12-17-10
Wastewater and Ash Pond Analyses
3A Level 5 Port D, 11-30-10
(note the minor slag)
3A Level 5 Port D, 12-17-10
(note the large formation on the wall)
3A Level 3 Port B, 11-30-10
(note the minor blinding)
3A Level 3 Port A, 12-17-10
(note the blinding and hot runny formation)
SO3 Testing
Two FGD water discharge samples were collected in
order to establish a baseline. No measureable copper was detected and no significant change in operation was noted. In future trials, additional
samples should be taken to provide a greater understanding of the normal state of the FGD composite analysis.
Ash pond water samples were collected on November 19 and 20 (prior to the metal oxide addition) and
on December 12 (after the metal oxide feed) to determine the effects of copper in the ash pond. The
trial team wanted to rule out any negative impacts
from copper carryover from the bottom ash sluice
into the ash pond and subsequent NPDES outfall. No
measurable copper was detected in the ash pond
on all three sample dates.
The trial team also conducted two duct tests,
sampling flue gas to determine the sulfur trioxide
(SO3) concentration during varying operating conditions and when chemicals were added to the
coal feed. Samples were collected from a single
point approximately seven feet from the duct wall
at a test port downstream of the SCR- the only
test port available at the furnace. Measurements
were conducted to observe the treatment regi-
men’s effect on “blue plume”. (There have been
studies on magnesium oxide’s effect on SO3 in
fossil fuel-fired furnaces (Schmidtchen 2002)).
Ammonia injection was off during the testing to
avoid free ammonia interference with the analysis. A third-party stack testing firm was contracted
to collect samples using the Controlled Condensate Method (US EPA Method 8A) and analyze
them by High Performance Liquid Chromatography (HPLC).
Page 8 Technical Paper
Page 9

The untreated opportunity fuel SO3 baseline was
Run No.
Sample Time (EST)
SO3 Concentration (ppm, dry basis)
Start
End
11/30 and 12/1 – 33% NAPP Coal, 2.0 lb/ton magnesium-based product
1
10:40
11:40
11.3
2
13:05
13:50
12.3
3
14:45
15:30
13.0
4 *
16:25
17:10
6.0 *
5
08:37
09:22
12.4
6
12:10
12:55
9.5
7
14:05
14:50
11.6
8
16:05
16:50
15.3
Average
12.2
12/11 – 50% NAPP Coal, 1.5 lb/ton magnesium-based product
and 0.25 lb/ton metal oxide-based product
9
08:30
09:15
13.6
10
10:05
10:50
12.1
11
11:30
12:15
9.5
12
12:45
13:30
10.4
Average
11.4
Run 4 is suspected as an outlier when compared to other runs under the same operating condition and is not included in the
calculated average.
Figure 7: SO3 Testing Summary
unavailable, and the SCR is expected to convert
some SO2 to SO3. The testing indicated that the apparent SO3 removal was within sampling error and
that there was no observable difference in the SO3
mitigation when MgO addition rates were varied.
Thus, the results did not indicate that the MgO
chemical treatment significantly mitigated SO3 in
the furnace. However, it is also important to note
that there was no apparent increase in SO3 formation overall on December 11, when the copperbased metal oxide slurry was added to the system
(Figure 7).
Trial Results and Conclusions
The magnesium-based product alone showed an
improvement in slag removal until the NAPP blend
increased above 33%. Magnesium alone could not
elevate ash fusion temperature to avoid sticky
deposits in the upper regions of the furnace, Tenacious, viscous deposits throughout the boiler
became firmer and were easily removed by IR and
IK sootblowers during the trial once the magnesium and metal oxide products were combined.
Technical Paper Page 9
Page 10

The visual observations and operator feedback indicated that the synergistic combination of the 1.0-lb
to 1.5-lb magnesium-based product range per ton
of NAPP coal in conjunction with 0.25-lb metal oxide-based product per ton of NAPP coal was very
effective in mitigating slag of the blended fuel. Different coals or coal blends may require customized
product ratios to appropriately address potential
slagging issues.
In addition, several locations were identified as possible sites for future IK sootblowers and observation
ports to control and monitor slag formation. Lessons
learned include the importance of freeze protection
on the lines and providing options for continuous
mixing with water-based slurries to reduce material
handling difficulties. Future trial goals include quantifying loss on ignition (LOI) with the metal oxide slurry and evaluation of different additives for SO3
control in the furnace.
Estimates for fuel cost savings are projected to
range from $5,000,000 to $13,000,000 per year by
switching to a 50 percent blend of NAPP opportunity
coal. Even greater savings could be achieved by increasing the blend to include Southern Illinois Basin
(ILB) coal, (Figure 8).
References
Babcock & Wilcox. “Steam”. 39
1978.
Buchsbaum, Lee. “New Coal Economics”. En-
ergybiz, November / December 2008.
Retrieved from
http://energycentral.fileburst.com/EnergyBizO
nline/2008-6-novdec/Financial_Front_New_Coal.pdf
Gabriel, Mark, Manager of Business Develop-
ment, GE Water & Process Technologies. “Slag
Control Treatment Program at EKPC Spurlock
Station.” Presented at Electric Power Conference, Chicago, IL. May 2011.
Hatt, Rod. “Correlating the Slagging of a Utility
Boiler with Coal Characteristics”.
Retrieved from
http://www.coalcombustion.com/PDF%20Files
/CorreSlagefc03.pdf April 2011
Metzroth, Lawrence, VP Analysis & Strategy,
Arch Coal Inc. “Regulatory and Other Con-
straints on CAPP Coal Supply.” Presented at
7th Annual Coal Trading Conference, New York
City, NY. December 2008. Retrieved from
http://www.coaltrade.org/wpcontent/uploads/2011/02/Metzroth.pdf
th
Edition,
Mikron camera information retrieved April
2011 from
http://www.mikroninfrared.com/EN/products/t
hermal-imagers-detectors-andcores/portable-thermal-imagers/portablespecial/m7604f.html
Pusateri, Robert, President Consol Energy
Sales. “NAPP and the Marketplace.” Presented at McCloskey Coal USA 2009 Conference,
New York City, NY. June 2009. Retrieved from
http://www.consolenergy.com/Newsroom/Spe
Figure 8: Customer’s Coal Price Ranges
eches/McCloskeyNewYork2009.pdf
Schmidtchen, Paul. “High Activity Magnesia
Use for SCR Related SO3 Problems.” Presented
at NETL 2002 Conference. Retrieved from
http://www.netl.doe.gov/publications/proceed
ings/02/scr-sncr/schmidtchensummary.pdf
Page 10 Technical Paper
 Loading...