

Instruction Manual
Model LC-2x4
4 Channel VW Datalogger
No part of this instruction manual may be reproduced, by any means, without the written consent of Geokon, Inc.
The information contained herein is believed to be accurate and reliable. However, Geokon, Inc. assumes no responsibility
for errors, omissions or misinterpretation. The information herein is subject to change without notification.
Copyright © 2007 - 2018 by Geokon, Inc.
(Doc Rev W, 11/14/2018)


Warranty Statement
Geokon, Inc. warrants its products to be free of defects in materials and workmanship, under
normal use and service for a period of 13 months from date of purchase. If the unit should
malfunction, it must be returned to the factory for evaluation, freight prepaid. Upon examination
by Geokon, if the unit is found to be defective, it will be repaired or replaced at no charge.
However, the WARRANTY is VOID if the unit shows evidence of having been tampered with
or shows evidence of being damaged as a result of excessive corrosion or current, heat, moisture
or vibration, improper specification, misapplication, misuse or other operating conditions outside
of Geokon's control. Components which wear or which are damaged by misuse are not
warranted. This includes fuses and batteries.
Geokon manufactures scientific instruments whose misuse is potentially dangerous. The
instruments are intended to be installed and used only by qualified personnel. There are no
warranties except as stated herein. There are no other warranties, expressed or implied, including
but not limited to the implied warranties of merchantability and of fitness for a particular
purpose. Geokon, Inc. is not responsible for any damages or losses caused to other equipment,
whether direct, indirect, incidental, special or consequential which the purchaser may experience
as a result of the installation or use of the product. The buyer's sole remedy for any breach of this
agreement by Geokon, Inc. or any breach of any warranty by Geokon, Inc. shall not exceed the
purchase price paid by the purchaser to Geokon, Inc. for the unit or units, or equipment directly
affected by such breach. Under no circumstances will Geokon reimburse the claimant for loss
incurred in removing and/or reinstalling equipment.
Every precaution for accuracy has been taken in the preparation of manuals and/or software,
however, Geokon, Inc. neither assumes responsibility for any omissions or errors that may
appear nor assumes liability for any damages or losses that result from the use of the products in
accordance with the information contained in the manual or software.

TABLE OF CONTENTS
1. INTRODUCTION .................................................................................................................................................. 1
2. GETTING STARTED ............................................................................................................................................ 2
TRANSDUCER INSTALLATION .............................................................................................................................. 2
2.1
2.1.1 Cable Gland Models (8002-4-1, 8002-4-2, 8002-4-3) ............................................................................... 2
2.1.2 10-pin Bulkhead Models (8002-4A-1, 8002-4A-2, 8002-4A-3) .................................................................. 3
BATTERY INSTALLATION .................................................................................................................................... 4
2.2
ACCESSORIES ...................................................................................................................................................... 4
2.3
EARTH GROUND INSTALLATION ......................................................................................................................... 4
2.4
SOFTWARE INSTALLATION AND SETUP ............................................................................................................... 5
2.5
2.5.1 LogView Installation .................................................................................................................................. 5
2.5.2 Launching LogView .................................................................................................................................... 5
2.5.3 LogView Workspaces ................................................................................................................................. 6
2.5.4 Adding Projects to LogView Workspaces ................................................................................................... 7
2.5.5 Adding Dataloggers to LogView Projects .................................................................................................. 8
2.5.6 LC-2x4 Connection (8002-4-1, RS-232) ....................................................................................................10
2.5.7 LC-2x4 Connection (8002-4-2, USB) ........................................................................................................10
2.5.8 LC-2x4 Connection 8002-4-3 (RS_485) ....................................................................................................10
2.5.9 Connecting to a Datalogger with LogView ...............................................................................................11
2.5.10 Determining COM Port Numbers ...........................................................................................................12
COMMUNICATION SETUP EXAMPLE USING HYPERTERMINAL ...........................................................................13
2.6
3. COMMAND LIST .................................................................................................................................................17
3.1
“BRNNN”- SET OR DISPLAY THE CURRENT BAUD RATE ....................................................................................17
“C” - DISPLAY CURRENT CLOCK SETTINGS .......................................................................................................17
3.2
“CSMM/DD/YY/HH:MM:SS” - SET THE INTERNAL CLOCK ...................................................................................17
3.3
“DEFAULT” – LOAD FACTORY DEFAULT SETTINGS ........................................................................................17
3.4
“DF” - DISPLAY OR SET DATE FORMAT .............................................................................................................18
3.5
“DL” – DISPLAY CURRENT MODE .....................................................................................................................18
3.6
“DNNNN” - DISPLAY ARRAYS FORWARD FROM USER POSITION ........................................................................18
3.7
“E” - LOW POWER SLEEP MODE ........................................................................................................................19
3.8
“GNN/C/TT/SZZZZZZ/SFFFFFF/SOOOOOO” OR “GNN/C/TT/SAAAAAA/SBBBBBB/SCCCCCC” – GAGE SETTINGS .....20
3.9
“IDDDDDDDDDDDDDDDDD” - DISPLAY OR SET DATALOGGER ID ...................................................................24
3.10
“L” - DISPLAY LOG INTERVALS .......................................................................................................................24
3.11
“LN/LLLLL/III” - DEFINE LENGTH AND ITERATION OF INTERVAL .....................................................................25
3.12
“LD” - DISABLE LOG INTERVALS ....................................................................................................................26
3.13
“LE” - ENABLE LOG INTERVALS ......................................................................................................................26
3.14
“M” - DISPLAY CURRENT MONITOR MODE SETTING .......................................................................................26
3.15
“MD” - DISABLE MONITOR MODE ...................................................................................................................26
3.16
“ME” - ENABLE MONITOR MODE ....................................................................................................................26
3.17
“MXS” – DISPLAY MULTIPLEXER STATUS ......................................................................................................27
3.18
“MXN” – SET THE MAXIMUM NUMBER OF CHANNELS ....................................................................................27
3.19
“N” - DISPLAY NEXT MEASUREMENT CYCLE ..................................................................................................27
3.20
“NA” - DISPLAY NETWORK ADDRESS .............................................................................................................28
3.21
“NADDD” - SET NETWORK ADDRESS ..............................................................................................................28
3.22
“ND” - NETWORK DISABLE .............................................................................................................................29
3.23
“NE” - NETWORK ENAB LE ...............................................................................................................................29
3.24
“NS” - DISPLAY NETWORK STATUS .................................................................................................................29
3.25
“PNNNN” - SET USER POSITION MEMORY POINTER .........................................................................................30
3.26
“R” - RESET MEMORY POINTERS .....................................................................................................................30
3.27
“RESET” - REBOOT THE LC-2 MICROPROCESSOR ...........................................................................................30
3.28
“S” – DISPLAY STATUS ....................................................................................................................................30
3.29
“SCNNNNN” - SET SCAN INTERVAL .................................................................................................................31
3.30
“SS” - DISPLAY SYSTEM STATUS .....................................................................................................................31
3.31
“SPHH:MM” - STOP LOGGING ..........................................................................................................................32
3.32
“SR” - SYNCHRONIZE READINGS .....................................................................................................................32
3.33

3.34 “STHH:MM” - START LOGGING ........................................................................................................................ 33
“SV” - DISPLAY SOFTWARE VER SION ............................................................................................................. 33
3.35
“TEST” - PERFORM INTERNAL SELF-TESTS .................................................................................................... 33
3.36
“TF” - DISPLAY OR SET TIME FORMA .............................................................................................................. 34
3.37
“TNN/T” – SET THERMISTOR TYPE .................................................................................................................. 35
3.38
“TR” - DISPLAY CURRENT TRAP COUNT ......................................................................................................... 35
3.39
“TR0” - RESET TRAP COUNT ........................................................................................................................... 35
3.40
“VL” – DISPLAY COIN CELL VOLTAGE ........................................................................................................... 35
3.41
“V3” – DISPLAY THE D CELL BATTERY VOLTAGE .......................................................................................... 36
3.42
“V12” – DISPLAY THE EXTERNAL BATTERY VOLTAGE ................................................................................... 36
3.43
“WF” - DISPLAY CURRENT WRAP FORMAT ..................................................................................................... 36
3.44
“X” - TAKE IMMEDIATE READING ................................................................................................................... 37
3.45
4. MAINTENANCE .................................................................................................................................................. 38
4.1
CLEANING.......................................................................................................................................................... 38
BATTERIES ......................................................................................................................................................... 38
4.2
5. TROUBLESHOOTING ........................................................................................................................................ 39
APPENDIX A. SPECIFICATIONS ......................................................................................................................... 40
A.1
MEASUREMENT CAPABILITY ............................................................................................................................ 40
POWER .............................................................................................................................................................. 40
A.2
MEMORY .......................................................................................................................................................... 40
A.3
CLOCK .............................................................................................................................................................. 41
A.4
SERIAL INTERFACE (ALL LC-2X4 MODELS) ...................................................................................................... 41
A.5
RS-485 NETWORK ............................................................................................................................................ 41
A.6
VIBRATING WIRE MEASUREMENT .................................................................................................................... 41
A.7
INTERNAL/EXTERNAL TEMPERATURE MEASUREMENT ..................................................................................... 41
A.8
MAIN BATTERY MEASUREMENT ....................................................................................................................... 42
A.9
MULTIPLEXER RELAY ..................................................................................................................................... 42
A.10
APPENDIX B. CONNECTOR PINOUTS .............................................................................................................. 43
B.1
TRANSDUCER CABLE CONNECTIONS................................................................................................................. 43
RS-232 CONNECTOR PINOUT (8002-4-1) .......................................................................................................... 43
B.2
USB CONNECTOR PINOUT (8002-4-2) .............................................................................................................. 44
B.3
RS-485 CONNECTOR PINOUT (OPTIONAL, 8002-4-3) ........................................................................................ 44
B.4
APPENDIX C. DATA FILE TRANSFER TO A WINDOWS PC ........................................................................ 45
C.1
DOWNLOADING DATA USING LOGVIEW ........................................................................................................... 45
DOWNLOADING DATA USING HYPERTERM INAL (OR EQUIVALENT) .................................................................. 46
C.2
APPENDIX D. SAMPLE DATA FILE ................................................................................................................... 49
D.1
SAMPLE RAW DATA FILE .................................................................................................................................. 49
APPENDIX E. THERMISTOR TEMPERATURE DERIVATION ..................................................................... 50
APPENDIX F. NETWORKING .............................................................................................................................. 53
DESCRIPTION ..................................................................................................................................................... 53
F.1
EXAMPLE OF A FOUR-DATALOGGER NETWORKING SESSION ............................................................................ 53
F.2
APPENDIX G. LITHIUM COIN CELL ................................................................................................................. 55
G.1
DESCRIPTION .................................................................................................................................................... 55
REPLACEMENT PROCEDURE .............................................................................................................................. 55
G.2
APPENDIX H. MODEL 8032-27 AND LOAD CELL WIRING .......................................................................... 57
APPENDIX I. BATTERY REPLACEMENT INSTRUCTIONS FOR UNITS MANUFACTURED BEFORE
SEPTEMBER 2018 ................................................................................................................................................... 58

FIGURES
FIGURE 1 - BATTERY DETAIL......................................................................................................................................... 4
FIGURE 2 - SELECT WORKSPACE NAME ......................................................................................................................... 6
FIGURE 3 - SELECT WORKSPACE FOLDER ...................................................................................................................... 6
FIGURE 4 - LOGVIEW MAIN WINDOW ........................................................................................................................... 7
FIGURE 5 - LOGVIEW MAIN WINDOW WITH NEW PROJECT ............................................................................................ 8
FIGURE 6 - LOGVIEW CONTEXT MENU .......................................................................................................................... 9
FIGURE 7 - DATALOGGER SETTINGS, CONNECTION OPTIONS ........................................................................................ 9
FIGURE 8 - DATALOGGER HIGHLIGHTED, NOT CONNECTED .........................................................................................10
FIGURE 9 - DATALOGGER CONNECTION MISMATCH .....................................................................................................11
FIGURE 10 - DATALOGGER CONNECTED .......................................................................................................................11
FIGURE 11 - PC INTERNAL COM PORT .........................................................................................................................12
FIGURE 12 - DEVICE MANAGER PORTS LIST .................................................................................................................12
FIGURE 13 - HYPERTERMINAL CONNECTION DESCRIPTION ..........................................................................................13
FIGURE 14 - COM PORT SELECTION .............................................................................................................................13
FIGURE 15 - COM PORT SETTINGS ...............................................................................................................................14
FIGURE 16 - ORDER OF ARRAY USAGE .........................................................................................................................19
FIGURE 17 - LOGVIEW COLLECT DATA BUTTON ..........................................................................................................45
FIGURE 18 - DATA COLLECTION PROGRESS BAR ..........................................................................................................45
FIGURE 19 - DATA COLLECTION COMPLETE MESSAGE.................................................................................................46
FIGURE 20 – HYPERTERMINAL CONNECTION DESCRIPTION .........................................................................................46
FIGURE 21 - HYPERTERMINAL CONNECTION SELECTION .............................................................................................46
FIGURE 22 - HYPERTERMINAL COM PORT SETTINGS ..................................................................................................47
FIGURE 23 - HYPERTERMINAL TRANSFER MENU .........................................................................................................47
FIGURE 24 - SPECIFY DATA CAPTURE FILE ..................................................................................................................48
FIGURE 25 - HYPERTERMINAL/DATALOGGER COMMUNICATION .................................................................................48
FIGURE 26 - MODEL 8032-27 JUMPER WIRE ASSEMBLY ..............................................................................................57
FIGURE 27 - BATTERY INSTALLATION DETAIL .............................................................................................................58
TABLES
TABLE 1 - TRANSDUCER CABLE CONNECTIONS ............................................................................................................. 3
TABLE 2 - VIBR ATING WIRE GAGE TYPES ....................................................................................................................22
TABLE 3 - GAGE TYPE DESCRIPTIONS ..........................................................................................................................23
TABLE 4 - ENGINEERING UNITS MULTIPLICATION FACTORS ........................................................................................23
TABLE 5 - LOGARITHMIC INTERVALS LIST ...................................................................................................................25
TABLE 6 - S COMMAND INFORMATION .........................................................................................................................31
TABLE 7 - SS COMMAND INFORMATION .......................................................................................................................31
TABLE 8 - TEST MENU INFORMATION .........................................................................................................................34
TABLE 9 - APPROXIMATE OPERATING TIMES ...............................................................................................................38
TABLE 10 - TRANSDUCER CABLE CONNECTIONS ..........................................................................................................43
TABLE 11 - RS-232 CONNECTOR PINOUT .....................................................................................................................43
TABLE 12 - USB CONNECTOR PINOUT .........................................................................................................................44
TABLE 13 - RS-485 CONNECTOR PINOUT .....................................................................................................................44
TABLE 14 - STANDARD THERMISTOR RESISTANCE VERSUS TEMPERATURE .................................................................50
TABLE 15 - BR55KA822J THERMISTOR RESISTANCE VERSUS TEMPERATURE .............................................................51
TABLE 16 - 103JL1A THERMISTOR RESISTANCE VERSUS TEMPERATURE ....................................................................52
TABLE 17 - COMMON CONDUCTOR CHART ..................................................................................................................57
TABLE 18 - MULTIPLEXER BOARD WIRING ..................................................................................................................57
EQUATIONS
EQUATION 1 - DISPLAYED GAGE READING USING LINEAR CONVERSION .....................................................................21
EQUATION 2 - DISPLAYED GAGE READING USING POLYNOMIAL CONVERSION ............................................................22
EQUATION 3 - DIGITS CALCULATION USING LINEAR CONVERSION ..............................................................................23
EQUATION 4 - DIGITS CALCULATION USING POLYNOMIAL CONVERSION .....................................................................23
EQUATION 5 - CONVERT THERMISTOR RESISTANCE TO TEMPERATURE .......................................................................50
EQUATION 6 - CONVERT THERMISTOR, TYPE BR55KA822J, RESISTANCE TO TEMPERATURE .....................................51
EQUATION 7 - CONVERT THERMISTOR, TYPE 103JL1A, RESISTANCE TO TEMPERATURE .............................................52

1
1. INTRODUCTION
Model 8002-4, LC-2x4, 4-Channel Datalogger is a low cost, battery powered, easy to use
measurement instrument, designed to read up to four vibrating wire sensors equipped with
thermistors.
The 320K standard memory provides storage for 10666 data arrays. Each array consists of an
optional datalogger ID string (16 characters maximum), a timestamp consisting of the year, date
(Julian day or month/day format), time (hhmm or hours/minutes format) and seconds when the
reading was taken. Also included in the data is the internal 3V (or external 12V) battery voltage,
the datalogger temperature, the vibrating wire readings, the transducer temperature and the Array
number.
Internal math is calculated using 32-bit floating point notation (IEEE). Math operations on the
instrument readings, such as application of zero readings, gage factors (or calibration factors)
and offsets when using a linear conversion technique or polynomial coefficients when using the
polynomial conversion, provide outputs directly in engineering units. The dataloggers internal
configuration is defined through communication with a computer using the supplied RS-232 or
USB (or optional RS-485) interface cable. The datalogger is configured and monitored using
LogView, a Geokon proprietary Graphic User Interface (GUI) software application (See Section
2.5). The datalogger can also be configured and monitored via text-based commands with any
standard terminal emulator software, such as Microsoft Windows HyperTerminal™ (see Section
3).
The communication method for each model of the LC-2x4 is described below
8002-4-1: Communication with the LC-2x4 is implemented via the host computer’s RS-232
COM port. See Section 2.5.6 for further information.
8002-4-2: Communication with the LC-2x4 is implemented via the host computer’s USB 2.0
port. When connected to a computer via the USB port, the LC-2x4 appears to the
computer as a “virtual” COM port. The LC-2x4 datalogger also receives all of its
operating power from the computer, thus extending the internal 3V (or external
12V) battery life. When disconnected from the USB port, the datalogger
automatically switches to the internal 3V (or external 12V) battery pack. See
Section 2.5.7 for further information.
8002-4-3: Communication with the LC-2x4 is implemented via RS-485. This allows for
long communication cables (up to 4000’) between the host computer and the LC2x4. The ability to network two or more LC-2x4 dataloggers together is also
available with this communication option. See Section 2.5.8 and Appendix F
Networking for further information.
All data, both readings and configuration, are stored in non-volatile EEPROM with a typical
storage life of 10 years (minimum). The internal temperature compensated real-time clock, used
to provide timekeeping and triggering of readings, is accurate to approximately two minutes per
year. The comma delineated ASCII output format allows for easy importing into popular
spreadsheet programs such as Lotus 1-2-3 or Microsoft Excel. See Appendix D for sample data
files.

2
2. GETTING STARTED
The following equipment will arrive with the Model LC-2x4 datalogger:
(If any accessories are missing or damaged, please contact the factory.)
• Set of two alkaline D cell batteries.
• Set of four desiccant packs packaged with the batteries.
• Accessories:
Shipped with the 8002-4-1: Part #8002-10-RS232 comprising: a USB to RS-232 serial
adapter cable, a RS-232 Communication Cable (DB-9F to 10-pin Bendix Male), a #3
Phillips head screwdriver, and a 3/32" flat head screw driver.
Shipped with the 8002-4-2: Part #8002-10-USB comprising: USB Communication
Cable (USB-A to 10-pin Bendix Male) a #3 Phillips head screwdriver, and a 3/32" flat
head screw driver.
Shipped with the 8002-4-3: USB Communication Cable (USB-A to 10-pin Bendix
Male), RS-485 Interface for PC, RS-485 patch cord
2.1 Transducer Installation
2.1.1 Cable Gland Models (8002-4-1, 8002-4-2, 8002-4-3)
1) Open the datalogger by unscrewing the four captive screws on the front of the
enclosure. Make sure that no dirt, water or other contaminants are allowed to
enter the enclosure.
2) Loosen the nuts on the cable fittings and remove the white plastic dowels.
3) Thread the transducer cables through the cable fittings.
4) Connect the cable wires to the datalogger’s 5-pin internal terminal blocks, located on
the Multiplexer circuit board. (NOTE: The multiplexer board is mounted on the
right side of the enclosure. Do not connect any transducer cables to the terminal
block located on the battery board.) Wire each conductor of the cable into the
correct position in the terminal block by pressing down on the corresponding orange
tab at the back, inserting the conductor, and then releasing the orange tab. Refer to
Table 1 for transducer wiring information. (See also Appendix B.)

3
Cable
Color
VW1+
1
Vibrating Wire +
RED
VW1-
1
Vibrating Wire -
BLACK
TH1+
1
Thermistor +
WHITE
TH1-
1
Thermistor -
GREEN
Analog Ground
(shield)
BARE
WIRE
VW2+
2
Vibrating Wire +
RED
VW2-
2
Vibrating Wire -
BLACK
TH2+
2
Thermistor +
WHITE
TH2-
2
Thermistor -
GREEN
Analog Ground
(shield)
BARE
WIRE
VW3+
3
Vibrating Wire +
RED
VW3-
3
Vibrating Wire -
BLACK
TH3+
3
Thermistor +
WHITE
TH3-
3
Thermistor -
GREEN
Analog Ground
(shield)
BARE
WIRE
VW4+
4
Vibrating Wire +
RED
VW4-
4
Vibrating Wire -
BLACK
TH4+
4
Thermistor +
WHITE
TH4-
4
Thermistor -
GREEN
Analog Ground
(shield)
BARE
WIRE
Terminal
Block Position
SHLD1 1
SHLD2 2
SHLD3 3
Channel
Number
Description
Wire
SHLD4 4
5) Tighten the nuts on the cable fittings so that they securely grip the cables. This must
be done to ensure that water does not enter the enclosure. (Beware of
overtightening, which may damage the plastic threads.)
2.1.2 10-pin Bulkhead Models (8002-4A-1, 8002-4A-2, 8002-4A-3)
Transducers are attached to the datalogger with 10-pin Bulkhead connectors. Align the
grooves on the transducer connector (male), with the connector on the unit (female). Push
the connector into place and then twist the outer ring of the male connector until it locks.
Table 1 - Transducer Cable Connections

4
2.2 Battery Installation
Install the batteries as follows:
(For units manufactured prior to September 2018, refer to Appendix I.)
1) Open the device by unscrewing the four captive screws on the front of the enclosure. Make
sure that no dirt, water or other contaminants are allowed to enter the enclosure.
2) Install the batteries by aligning the positive (+) side of the D cells with the left side of the
battery holder. Push the batteries straight down into the holder.
Figure 1 - Battery Detail
3) The battery select switch (located to the right of the battery holder) is set to “Alkaline” at the
factory. If using lithium batteries, move the switch to the “Lithium” position.
2.3 Accessories
After the batteries have been installed:
1) Remove the desiccant packs from the plastic seal top bag they were shipped in and place
them inside the enclosure.
2) Reinstall the cover. Ensure that the rubber gasket clean and properly seated in the groove on
the underside of the cover. Tighten the screws a little at a time, working in a diagonal pattern.
Make sure the cover seals tightly and evenly.
2.4 Earth Ground Installation
The LC-2x4 provides lightning protection in the form of gas tube surge arrestors. In order for
these components to divert the energy from a lightning strike safely to ground, a good solid
electrical connection to earth ground needs to be made. A grounding rod should be driven (or
other suitable attachment to earth utilized) to ground the system and provide a path to earth in the
event of a lightning strike. A 6' to 8' copper stake with appropriate large gauge wire (12 AWG or
larger) connected to the LC-2x4 enclosure is suggested. The stake should be driven as close to
the datalogger as possible, and to a depth of at least one meter (three feet). A copper grounding
lug is supplied on the exterior of the LC-2x4 enclosure to provide connection to this wire from
the grounding rod.

5
2.5 Software Installation and Setup
LogView is Graphical User Interface (GUI) software is used to communicate with the datalogger
using a personal computer running a Microsoft Windows® operating system. Other general
purpose communication programs (e.g., Windows HyperTerminal™) can also be used to
communicate with the Model LC-2x4 via text-based commands. The LogView and USB drivers
install program can be downloaded at www.geokon.com/software.
Perform the following steps to install LogView software for each computer that will connect to
an LC-2x4. These instructions are for computers running Windows XP. The installation
procedure is very similar for computers running Windows7, Windows 2000 and Windows 98.
This installation procedure needs to be performed only once for each computer that will run
LogView to communicate with an LC-2x4 datalogger.
NOTE: The USB drivers are only required for LC-2x4 models 8002-4-2 and the 8002-5 RS-485
Interface
Make sure that the two 1.5-volt D cell alkaline batteries are installed in the datalogger (See
Section 2.2, “Battery Installation” for instructions) and that the LC-2x4 datalogger is not
connected to the computer at this time.
2.5.1 LogView Installation
1) Using Windows Explorer, navigate to the extracted downloaded files and double
click on the file “start.bat” to start the install process.
2) Click “ >” when the Welcome window appears.
3) When the Choose Install Location window appears, choose a folder for the
LogView installation then click “Next>”.
4) When the Choose Start Menu Folder window appears, choose an appropriate
folder (default is Geokon) then click “Install”.
5) Click “Next >” when the Java Installation Complete window appears.
6) Click “Finish” when the Completing the LogView Setup Wizard window appears.
2.5.2 Launching LogView
Launching LogView can be accomplished two different ways. Double clicking on the
desktop icon:
Or via the Windows Start button: “Programs → Geokon → LogView”

6
2.5.3 LogView Workspaces
When opening LogView for the first time, the user will be prompted to create a
workspace name (see Figure 2). The workspace name can be any combination of letters
and numbers and, ideally, will be descriptive in nature. See the LogView User’s Guide
for more information on workspaces.
Figure 2 - Select Workspace Name
Once the workspace name has been selected, clicking on “Ok” causes LogView to
prompt the user to choose or create a folder where all the workspace elements will be
stored (see Figure 3). The folder location can be entered directly, e.g.,
C:\Workspaces\East Coast or the Browse button can be used to navigate to a folder
location or to create a new folder (see Figure 3). This workspace location will be stored in
the LogView configuration for subsequent application access. Once workspaces are
created, future user access is always by name.
Figure 3 - Select Workspace Folder
If no other is specified, a default folder path is displayed based on the system default
workspace path combined with the new workspace name. After the folder path has been
specified, either the default or user selected, clicking on “Ok” will display the main
window of LogView (see Figure 4). On the left-hand side of the main window is the
Project Explorer displaying the newly created workspace. The user can now add new
project(s), datalogger(s) and sensor configurations to the workspace by right-clicking on
the workspace and using the menu tools.

7
Figure 4 - LogView Main Window
2.5.4 Adding Projects to LogView Workspaces
Right-clicking on the “PRODUCTION” workspace brings up a context sensitive menu
that allows the user to add projects to this workspace (using the “New→Project” menu
selection). Select a name that makes sense for the real-world project this program will be
used for. In this example “TestLoggers” was chosen as the project name (see Figure 5
below)

8
Figure 5 - LogView Main Window with new project
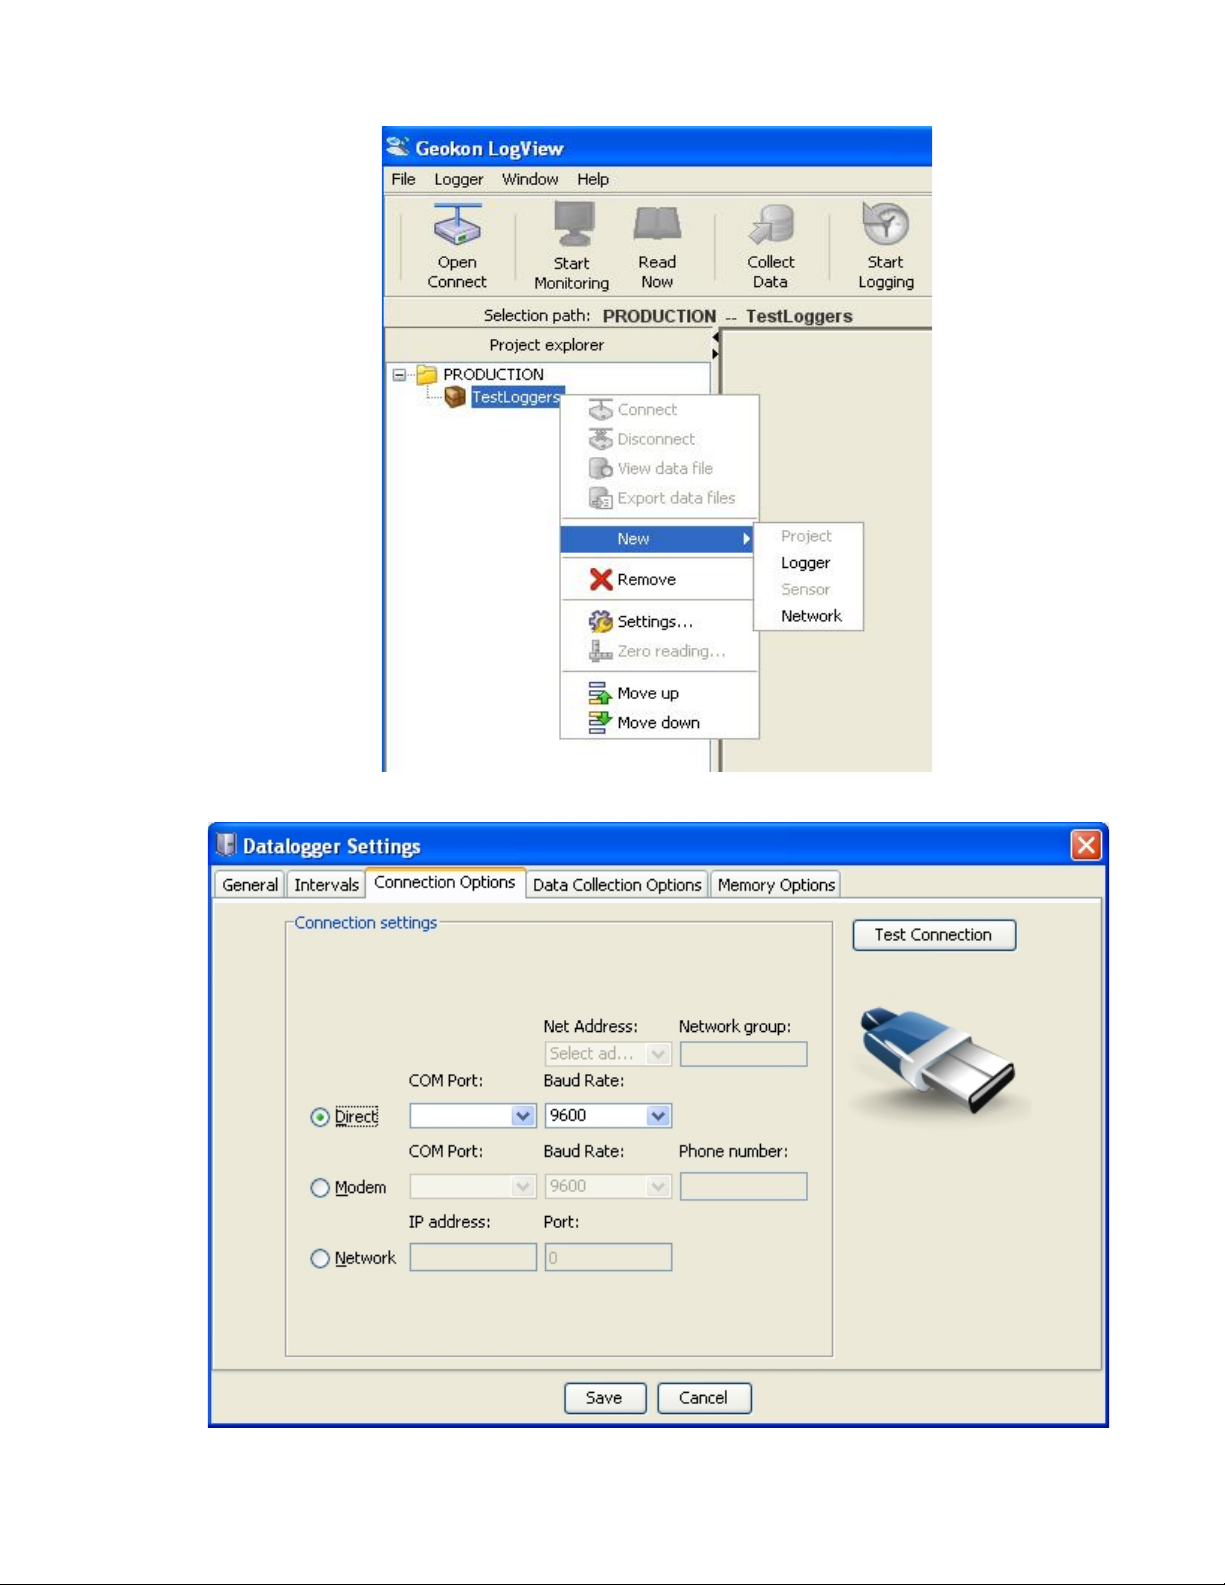
2.5.5 Adding Dataloggers to LogView Projects
Right-clicking on the “TestLoggers” project brings up a context sensitive menu (see
Figure 6) that allows users to add dataloggers to their projects. Selecting New→Logger
from the context menu causes the “Datalogger Settings” dialog to be displayed. Like
Workspaces and Projects, Dataloggers can be assigned a unique human-readable name. For
this example, “MyLogger” was chosen for the Datalogger name. For a complete
description of all datalogger settings please see the LogView Online Help section on
Datalogger Settings. For connection purposes, the relevant tab in this dialog is
“Connection Options” (see Figure 7).
After physically connecting to a PC, all LC-2x4 dataloggers require a COM port to be
identified in the “Connection Options”. Starting with firmware revision 3.1.X, LC-2x4
dataloggers can communicate at baud rates of 9600 and 115,200. Before this revision the
datalogger baud rate was 9600 only; for these dataloggers, the default setting should not be
changed (See Figure 7).
9
Figure 6 - LogView Context Menu
Figure 7 - Datalogger Settings, Connection Options

10
2.5.6 LC-2x4 Connection (8002-4-1, RS-232)
Connect the supplied LC-2x4 RS-232 Communications cable (S-8001-6) to the COM port
of the LC-2x4 datalogger. The protective cap on the datalogger COM connector is
removed by pushing in and turning. Plug the DB-9 end of the RS-232 Communications
cable into the host computer’s RS-232 port (either internal or external via a USB to Serial
converter). Proceed to Section 2.5.9, Connecting to a Datalogger with LogView.
2.5.7 LC-2x4 Connection (8002-4-2, USB)
Connect the supplied LC-2x4 USB Communications cable (COM-109) to the USB port of
the LC-2 datalogger. The protective cap on the datalogger USB connector is removed by
pushing in and turning. Plug the USB-A end of the USB cable into an available USB-2.0
port on the host computer.
NOTE: On certain PCs with operating systems older than XP, Service Pack 3, the 80024-2 may require the installation of a driver to properly communicate with the PC. If the
PC does not recognize the datalogger’s internal USB to serial converter then the driver
may need to be installed by executing the program, CDMv2_xxxx, from the LogView
Install folder. Proceed to Section 2.5.9, Connecting to a Datalogger with LogView.
2.5.8 LC-2x4 Connection 8002-4-3 (RS_485)
Make the COM port connection per Section 2.5.6 (RS-232) or 2.4.7 (USB), and then refer
to Appendix F: Networking to establish communications.
Figure 8 - Datalogger Highlighted, Not Connected

11
2.5.9 Connecting to a Datalogger with LogView
1) With a Datalogger profile configured and selected in the Project Explorer (see Figure
8), click on the “Open Connect” button on the LogView Toolbar.
2) When connecting to a new Datalogger for the first time, the message below (see Figure
9) may be displayed after a few seconds. This is normal and is only an indication that
the datalogger does not match the configuration created in the Project Explorer. Click
on “Continue” to finish connecting to the datalogger.
3) Click on the “Upload Settings” button on the LogView Toolbar to synchronize the
datalogger with the LogView configuration (see Figure 10).
4) LogView is now connected and configured correctly for the LC-2x4 datalogger. Sensors
can now be added to the datalogger in a similar fashion as adding Dataloggers to
Projects. Sensor settings are accessed via the context menu from the Project Explorer.
5) Always upload the new settings to the datalogger after changing its configuration in
LogView.
Figure 9 - Datalogger Connection Mismatch
Figure 10 - Datalogger Connected

12
2.5.10 Determining COM Port Numbers
When connecting an 8002-4-1 datalogger to a PC with an internal serial port(s) the COM
Port number that LogView requires is usually COM1 or COM2 but, occasionally may be
COM3 if the PC has more than one internal serial port. Figure 11 below illustrates that the
PC has two serial ports, one internal (COM1) and the other via a USB to serial converter
(COM13).
Figure 11 - PC Internal COM Port
When connecting an 8002-4-2 datalogger to a PC the COM Port number LogView requires
can be any number and depends on how many other devices are attached to the PC like,
internal serial ports and Bluetooth devices. Figure 12 below illustrates that the PC has three
serial ports, one internal (COM1) and the other two via USB to serial converters (COM13
and COM3). One way to determine which COM port an 8002-4-2 datalogger is attached to
is to disconnect the cable and see which COM device disappears from the Device Manager
Ports list.
Figure 12 - Device Manager Ports List
In this case, COM3 is actually the 8002-4-2 datalogger and not a universally available
serial port.
13
2.6 Communication Setup Example Using HyperTerminal
NOTE: If using a 8002-4-2 USB LC-2x4, it is important that the LC-2x4 first be connected to the
computer’s USB port before attempting to communicate so that the LC-2x4 can be recognized by
the computer as a virtual COM port.
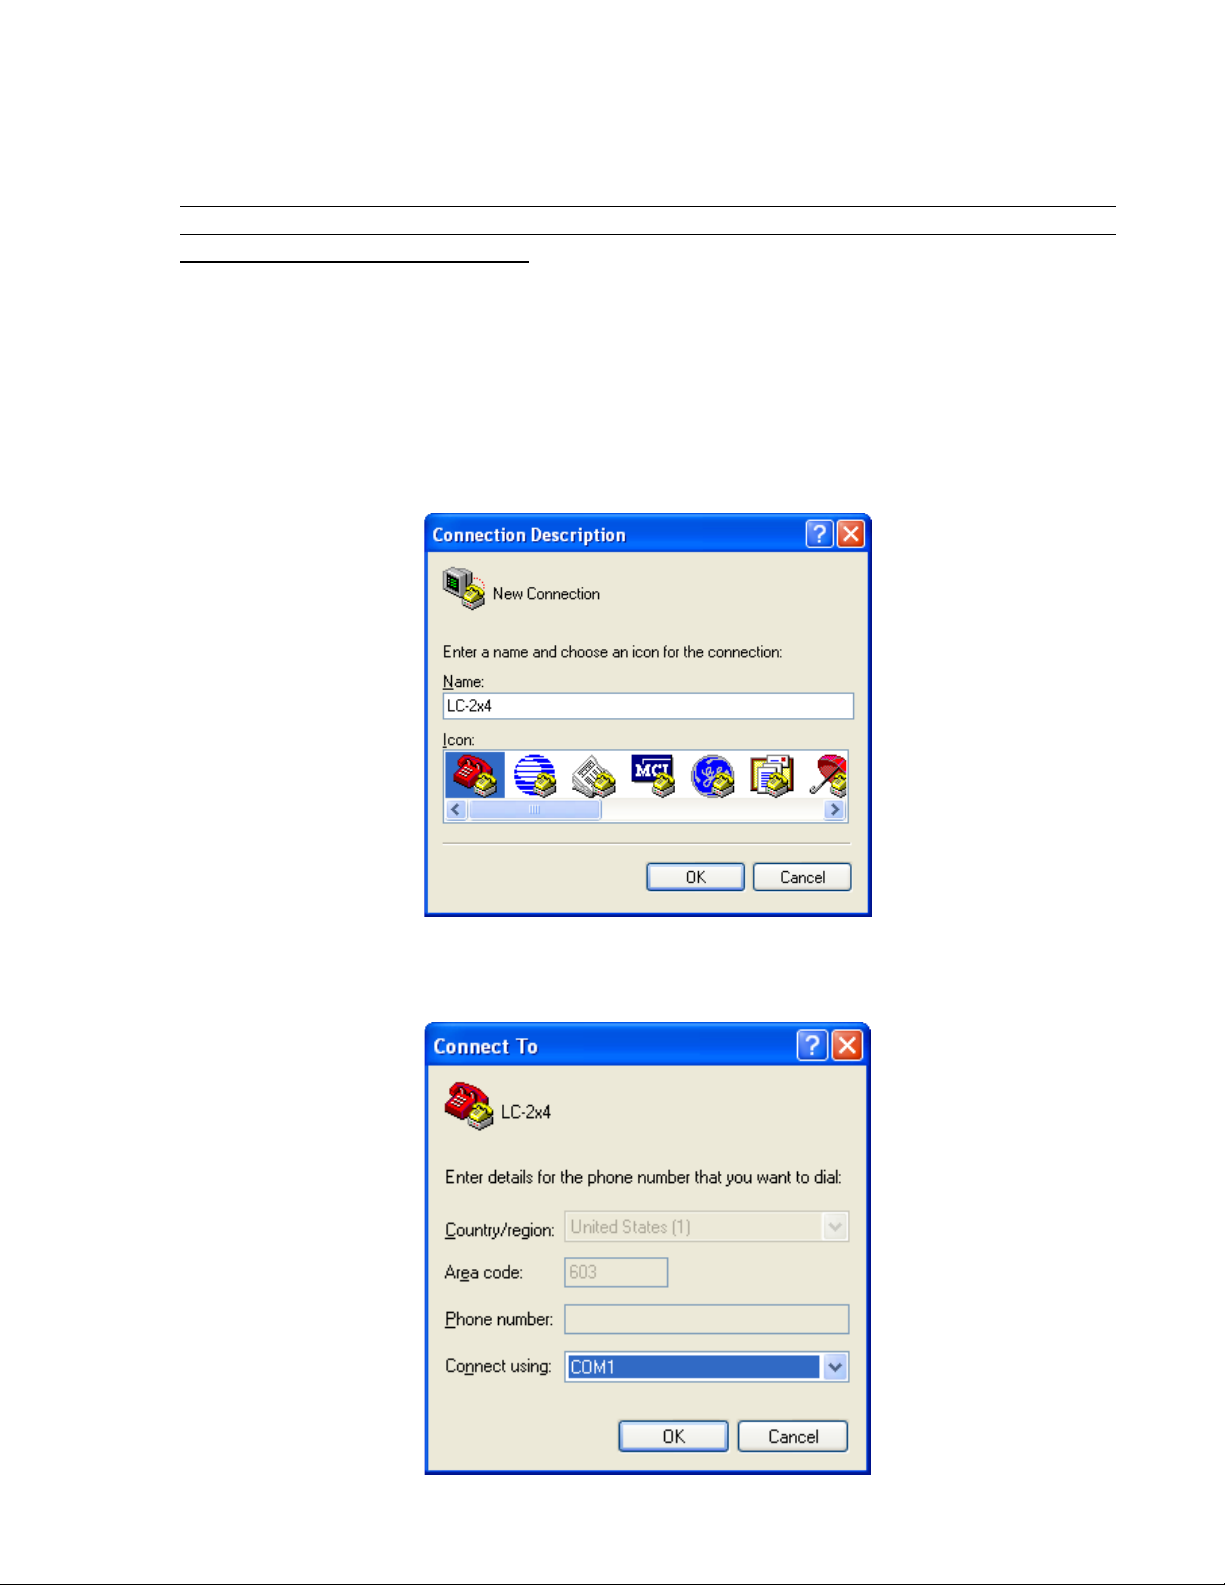
Proceed with the following steps to connect with the datalogger using a terminal emulator
program such as Microsoft Windows HyperTerminal™:
1) Launch HyperTerminal (Start → All Programs → Accessories → Communications → HyperTerminal). If
running under Vista or newer, contact Geokon for Geokon’s Terminal Window Software.
2) Enter a name for the New Connection and click OK (see Figure 13):
Figure 13 - HyperTerminal Connection Description
3) In the Connect Using window, select the appropriate COM port (see Figure 14):
Figure 14 - COM Port Selection

14
4) In the COM Properties window, configure the COM port (see Figure 15):
Figure 15 - COM Port Settings
8002-4-1 (RS-232): Configure the COM port (typically COM1 or COM2) as 9600 Bits per
second, 8 Data bits, no Parity, 1 Stop bit, no Flow control.
8002-4-2 (USB): Configure the new COM port that is added when the LC-2x4 is connected as
9600 Bits per second, 8 Data bits, no Parity, 1 Stop bit, no Flow control.
5) Click Apply then OK.
6) Press <ENTER> <ENTER> to wake the datalogger from sleep. The datalogger returns the
power up prompt:
Hello. Press "?" for Help.
*
Note: If no characters are received in 15 seconds the datalogger (non-networked)
will return to its low power sleep mode. Press <ENTER> <ENTER> to wake it
again.
Note: When network commands are enabled and RS-485 is being used, the address
must be sent before the respective datalogger will respond. See Sections 3.21 thru
3.25 for additional information.

15
1) Type ? <ENTER> to display the Help list. See Section 3 for detailed information on all the
commands listed. Note: All commands must be entered in capital letters.
*?
Command Description
-----------------------------------------------C View current Clock
CSmm/dd/yy/hh:mm:ss Clock Set
DEFAULT Load factory DEFAULT gage settings
DF Date Format(0=julian,1=month,day)
DL Display DataLogger type
Dnnnnn Display nnnnn arrays from pointer
E End communications and go to sleep
Gnn/c/tt/szzzzzz/sffffff/soooooo
(or Gnn/c/tt/saaaaaa/sbbbbbb/scccccc)
Gage information, where;
nn = Channel #
c = Conversion Type(L/P)
tt = Gage Type
For Linear (L) Conversion:
szzzzzz = zero reading with sign
sffffff = gage factor with sign
soooooo = offset with sign
For Polynomial (P) Conversion:
saaaaaa = polynomial coefficient A with sign
sbbbbbb = polynomial coefficient B with sign
scccccc = polynomial coefficient C with sign
IDdddddddddddddddd View current ID,set to dddddddddddddddd
Ln/lllll/iii View Log intervals/change n interval
lllll = length
iii = iterations of interval
LD,LE Log intervals Disable, Enable
M,MD,ME Monitor status, Disable, Enable
MXS Display Multiplexer Setup
MX# Select Multiplexer Configuration(4,16)
N Display Next time to read
NAddd Network Address (1-256)
NS,ND,NE Network Status, Disable, Enable
Pnnnnn Position array pointer to nnnnn
R Reset memory
RESET RESET processor
S,SS Datalogger Status, System Status
SCnnnnn View SCan interval/enter nnnnn interval
SPhh:mm StoP logging, hh:mm = stop time
SR Synchronize Readings(0=not synch'd,1=synch'd)
SThh:mm STart logging, hh:mm = start time

16
SV Software Version
TEST System Test
TF Time Format (0 = hhmm, 1 = hh,mm)
Tnn/t Thermistor information, where;
nn = Channel #
t = Thermistor Type
0=standard
1 = high temp BR55A822J
2 = high temp 103JL1A)
TR,TR0 display TRap count, zero TRap count
VL display Lithium cell Voltage
V3 display 3V Battery Voltage
V12 display 12V Battery Voltage
WFn Wrap Format(0=don't wrap memory,1=wrap memory)
X Single Reading - NOT stored
All of these commands are executed by typing with the correct syntax and pressing <ENTER>.
If the command has not been entered correctly, the datalogger will respond with an asterisk only.
For example:
*L7/100/255
*
The datalogger will respond to correctly entered commands by displaying the modified values.
The purpose and syntax of each of these commands are discussed in the following sections.

17
3. COMMAND LIST
3.1 “BRnnn”- Set or Display the Current Baud Rate
This command is not displayed in the help text (?<ENTER>). Displays or sets the current baud
rate. Valid numbers for “nnn” are 9 (9600 baud) or 115 (115,200 baud). The example below
changes the baud rate to 9600 with no confirmation.
*BR9
3.2 “C” - Display Current Clock Settings
Displays the current datalogger real-time clock settings. The CS command section explains how
to adjust the clock settings.
*C
Date: 02/21/07 Time: 10:43:08
*
3.3 “CSmm/dd/yy/hh:mm:ss” - Set the Internal Clock
Set the datalogger’s internal real time clock; mm represents the month, dd the day of the month,
yy the year, hh the hours, mm the minutes, and ss the seconds. Illegal combinations will be
ignored (e.g., CS02/30/07 or CS///12:60). Fields that are left blank will not be changed (e.g.,
CS//07 to only change the year).
*CS///10:45:00
Date: 02/21/07 Time: 10:45:00
*
Note: If logging is currently started and the clock is changed, a restart of the scan interval or log
interval table will occur.
3.4 “DEFAULT” – Load Factory Default Settings
The DEFAULT command will reload the datalogger’s channel and gage settings to the factory
default settings, along with the reading synchronization and memory wrap settings. This results
in:
All channels Enabled
All Gage Types set to 1
All Zero Readings set to 0.00000
All Gage Factors set to 1.00000
All Gage Offsets set to 0.00000
All channels use linear conversion
Scan interval = 10S
All readings synchronized to the top of the hour

18
Memory will wrap when full and continue logging
All Thermistors set to standard temperature
*DEFAULT
This will load all channels with factory default gage settings!
Are you sure(Y/N)?Y
All channels restored to factory default gage settings.
3.5 “DF” - Display or Set Date Format
This setting determines how the date information will be displayed in the array when the monitor
mode is active or arrays are displayed from memory. Entering DF displays the current date
format. Entering DF0 sets the date format to julian. Entering DF1 sets the date format to
month,day. The default date format display is Julian (decimal) day.
*DF
Date format is julian.
*DF1
Date format is month,day.
*DF0
Date format is julian.
3.6 “DL” – Display Current Mode
Displays the current datalogger mode setting.
*DL
LC-2x4
3.7 “Dnnnn” - Display Arrays Forward from User Position
Use the D command to display arrays forward from the User Position for verification or
collection. The updated memory pointers are displayed by this command.
*P1
MS:3146 OP:3147 UP:1
*D5
2007,11,23,17,52,43,3.10,25.51,9039.950,-999999.0,-999999.0,-999999.0,23.2,-99.0,
-99.0,-99.0,1
2007,11,23,17,53,43,3.10,24.77,9040.149,-999999.0,-999999.0,-999999.0,23.2,-99.0,
-99.0,-99.0,2
2007,11,23,17,54,43,2.97,24.42,9040.319,-999999.0,-999999.0,-999999.0,23.2,-99.0,
-99.0,-99.0,3
2007,11,23,17,55,43,2.98,24.22,9039.622,-999999.0,-999999.0,-999999.0,23.1,-99.0,
-99.0,-99.0,4

19
1
10666
2007,11,23,17,56,43,2.98,23.96,9038.542,-999999.0,-999999.0,-999999.0,22.7,-99.0,
-99.0,-99.0,5
MS:3146 OP:3147 UP:6*
MS represents the Memory Status of the datalogger. This number indicates how many arrays
have been written to memory. In this example, MS:3146 indicates that 3146 out of 10666 arrays
have been written to memory. OP:3147 indicates that the next memory location to be written to
is location 3147. UP:1 indicates that the memory location currently being pointed to (via the P
command) is memory location one. Use the D command to display arrays forward from the User
Position. In this case, D5 displays the arrays stored at memory locations 1, 2, 3, 4, and 5, and
leaves the memory pointer at memory location 6. Figure 16 illustrates the ring memory scheme.
Figure 16 - Order of Array Usage
OP represents the Output Position that the next array will be written to.
UP represents the User Position. This value is updated by D and P commands. The user can
display arrays from this position or re-position to another array.
The format is comma delineated ASCII, identical to that displayed when the Monitor mode is
active. See Appendix D for a sample data file. See Appendix C in regards using the D command
to collect data. When the array display is finished the memory pointers are displayed.
3.8 “E” - Low Power Sleep Mode
Returns the datalogger to its low power sleep mode (readings continue to be logged and
displayed in this mode). This command should always be used when finished communicating
with the datalogger to ensure the lowest power consumption. However, the datalogger (non-
networked) will enter sleep mode regardless if no command is received in a period of
approximately 15 seconds.
To return from the low power operating mode press <ENTER> <ENTER>. The datalogger
responds:

20
Hello. Press "?" for Help.
*
Note: When network commands are enabled the address must be sent before the respective
datalogger will respond. See Sections 3.21, 3.23, and 3.24 for additional information.
3.9 “Gnn/c/tt/szzzzzz/sffffff/soooooo” or “Gnn/c/tt/saaaaaa/sbbbbbb/scccccc” – Gage Settings
The G command is used to set up each of the four datalogger channels. All of the transducer
parameters, including the type of conversion (linear or polynomial) and whether a channel is
enabled or disabled are set with this command.
Refer to Table 2 and Table 3 for a description of each gage type.
The syntax for this command is:
Linear Conversion:
Gnn/c/t/szzzzzz/sffffff/soooooo
Where:
nn = Channel # (Valid entries are 1, 2, 3, and 4 for the LC-2x4)
c = Conversion Type(L/P) where L=Linear and P=Polynomial
t = Gage Type:
0: Channel Disabled (will display “---“)
1: VW Gage Type 1
2: VW Gage Type 2
3: VW Gage Type 3
4: VW Gage Type 4
5: VW Gage Type 5
6: VW Gage Type 6
szzzzzz = zero reading with sign
sffffff = gage factor with sign
soooooo = offset with sign
Example: To setup Channel 1 as a model 4000 VW Strain Gage with a Zero Reading of 490
digits, a Gage Factor of –0.0015 and a Gage Offset of zero, enter:
G1/L/3/490/-0.0015/0 <ENTER>
The LC-2x4 will return:
CH 1: ENABLED
GT: 3 ZR: 490.0000 GF: -0.00150 GO: 0.00000
*Note: If selecting Gage Type 0 to disable the channel, the LC-2x4 will only return “*”. Use the
MXS command (Section 3.18) to view the disabled channels.
When using linear conversion (L) of the instrument reading, the G command is used to select the
gage type and enter the gage zero reading, gage factor, and gage offset.
Linear Conversion is described further as follows:

21
szzzzzz represents the zero reading for the transducer being read, sffffff represents the multiplier
NOTE: It is possible that a new datalogger might be used with an older sensor or vice versa and because of
(calibration or gage factor) that will be applied to the reading to convert to engineering units and
soooooo is the offset that will be applied to the gage reading. The zero reading, gage factor and
offset can be entered with a sign and decimal point. The maximum number of digits, including
sign and decimal point is 15. The entered value will display to a maximum of five places to the
right of the decimal point.
For all vibrating wire instruments (Gage Types 1-6), manufactured after November 2, 2011 and
for all dataloggers (8002-4-X) with a firmware revision of 3.1.X and up, the basic formula for
calculation of displayed and stored values is as follows:
Display = ((CurrentReading - ZeroReading) × Multiplier) + Offset
Equation 1 - Displayed Gage Reading using Linear Conversion
equation differences the output might be negative. As of LogView version V2.1.1.X, an additional sensor
configuration parameter is now required, allowing LogView to compensate for old versus new
sensor/datalogger combinations. This new parameter: Output Calculation, determines whether the sensor
was calibrated using the formula: G x (R
available from the calibration certificate supplied with each sensor. Please see the LogView User’s Guide or
the online help section, “Sensor Settings” available while running LogView.
NOTE: In Equation 1 (above), the “CurrentReading” is frequently referred to as R1 while the
“ZeroReading” is referred to as R0
Polynomial Conversion:
Gnn/c/tt/saaaaaa/sbbbbbb/scccccc
Where:
nn = Channel # (Valid entries are 1, 2, 3, and 4 for the LC-2x4)
c = Conversion Type(L/P)
t = Gage Type:
0: Channel Disabled (will display “---“)
1: VW Gage Type 1
2: VW Gage Type 2
3: VW Gage Type 3
4: VW Gage Type 4
5: VW Gage Type 5
6: VW Gage Type 6
saaaaaa = polynomial coefficient A with sign
sbbbbbb = polynomial coefficient B with sign
scccccc = polynomial coefficient C with sign
When using polynomial conversion (P), the G command is used to select the gage type and enter
the three polynomial coefficients, A, B and C.
Polynomial Conversion is described further as follows:
– R1) or G x (R1 – R0). As with the gage factor, this information is
0

22
Geokon Model
Gage Type
Description
4000 3 Strain Gage
4100 1 Strain Gage
4200 3 Strain Gage
4204 6 Strain Gage
4202/421X
1
Strain Gage
4300BX
1
BX Borehole Stressmeter
4300EX
5
EX Borehole Stressmeter
4300NX
1
NX Borehole Stressmeter
4400
1
Embedment Jointmeter
4420 1 Crackmeter
4450
1
Displacement Transducer
4500 1 Piezometer
4600/4651/4675
1
Settlement Systems
4700
1
Temperature Transducer
4800
1
Pressure Cell
4850
1
Low Pressure Piezometer
4900 1 Load Cell
4910/4911/4912
1
Load Bolts
saaaa represents polynomial coefficient A, sbbbb represents polynomial coefficient B and scccc
polynomial coefficient C. The polynomial coefficients can be entered with a sign and decimal
point. The maximum number of digits, including sign and decimal point is 15. The entered value
will display to a maximum of five places to the right of the decimal point.
For the vibrating wire instruments (Gage Types 1-6), the basic formula for calculation of
displayed and stored values is:
Display = (CurrentReading2 × A) + (CurrentReading × B) + C
Equation 2 - Displayed Gage Reading using Polynomial Conversion
NOTE: When using the Polynomial conversion method, the default reading units for a vibrating wire instrument is
the frequency squared multiplied by 10
when A is entered as “0”, B is “1” and C is “0”. However, typical calibration units for vibrating wire instruments are
frequency squared multiplied by 10
units multiply the A coefficient by 1,000,000 and the B coefficient by 1000. The A and B coefficients can be
found on the supplied calibration certificate. The C coefficient should be calculated based on an actual field
reading. The above multiplication is only necessary if the datalogger is being set up via text commands (see Section
2.6) AND the gage conversion is set for polynomial. When using LogView to set up the datalogger configuration,
the multiplication is performed by LogView. Refer to the appropriate sensor manual for more information on how to
calculate the C coefficient.
-6
. For example, an instrument reading 3000Hz will output a value of “9.000”
-3
. To adjust for this discrepancy between LC-2 expected units and calibration
Table 2 - Vibrating Wire Gage Types

23
Type
Measurement
Type
Description
Output
Units
Linear Range
Polynomial
Range
0
Channel Disabled
1
Vibrating Wire
Middle frequency sweep, 1400-3500 Hz
Digits
1960 to 12250
1.960 to 12.250
2
Vibrating Wire
High frequency sweep, 2800-4500 Hz
Digits
7840 to 20250
7.840 to 20.250
3
Vibrating Wire
Very low frequency sweep, 400-1200 Hz
Digits
160 to 1440
0.160 to 1.440
4
Vibrating Wire
Low frequency sweep, 1200-2800 Hz
Digits
1440 to 7840
1.440 to 7.840
5
Vibrating Wire
Very high frequency sweep, 2500-4500 Hz
Digits
6250 to 20250
6.250 to 20.250
6
Vibrating Wire
Low frequency sweep, 800-1600 Hz
Digits
640 to 2560
0.640 to 2.560
psi 1 .036127
.43275
.0014223
1.4223
.49116
.019337
14.696
.014503
14.5039
.14503
145.03
"H2O
27.730 1 12
.039372
39.372
13.596
.53525
406.78
.40147
401.47
4.0147
4016.1
'H2O
2.3108
.08333
1
.003281
3.281
1.133
.044604
33.8983
.033456
33.4558
.3346
334.6
mm H20
704.32
25.399
304.788
1
1000
345.32
13.595
10332
10.197
10197
101.97
101970
m H20
.70432
.025399
.304788
.001 1 .34532
.013595
10.332
.010197
10.197
.10197
101.97
"HG
2.036
.073552
.882624
.0028959
2.8959
1
.03937
29.920
.029529
29.529
.2953
295.3
mm HG
51.706
1.8683
22.4196
.073558
73.558
25.4 1 760
.75008
750.08
7.5008
7500.8
atm
.06805
.0024583
.0294996
.0000968
.0968
.03342
.0013158
1
.0009869
.98692
.009869
9.869
mbar
68.947
2.4908
29.8896
.098068
98.068
33.863
1.3332
1013.2
1
1000
10
10000
bar
.068947
.0024908
.0298896
.0000981
.098068
.033863
.001333
1.0132
.001 1 .01
10
kPa
6.8947
.24908
2.98896
.0098068
9.8068
3.3863
.13332
101.320
.1
100 1 1000
MPa
.006895
.000249
.002988
.00000981
.009807
.003386
.000133
.101320
.0001
.1
.001
1
Table 3 - Gage Type Descriptions
The “Digits” calculation for the Vibrating Wire transducer output when using linear conversion
is based on this equation:
Digits = frequency2 × 10
-3
Equation 3 - Digits Calculation using Linear Conversion
The “Digits” calculation for the Vibrating Wire transducer output when using polynomial
conversion is based on this equation:
Digits = frequency2 × 10
-6
Equation 4 - Digits Calculation using Polynomial Conversion
Frequency, in the above equations, represents the resonant frequency of vibration of the wire in
the transducer (in Hertz) as determined by the datalogger.
To convert calibration factors (pressure transducers are usually psi per digit) to other engineering
units consult Table 4.
NOTE: In LogView Sensor Settings, when output units are set different than inputs units, a
conversion factor (see Table 4) is automatically applied to the gage factor of each sensor. See the
LogView User’s Guide for more information on Sensor Settings.
From →
To
↓
psi
"H2O
'H2O
mm H20
m H20
"HG
mm HG
atm
mbar
bar
kPa
MPa
Table 4 - Engineering Units Multiplication Factors

24
3.10 “IDdddddddddddddddd” - Display or Set Datalogger ID
The ID is a 16-character string that can be used to identify a datalogger and the data that is
transmitted by it. If an ID is entered it will be transmitted as the first element in each array of
data. For example:
*ID
Datalogger ID:
*ID
Datalogger ID:
*IDDatalogger#1
Datalogger ID:Datalogger#1
*ST
Logging started.
Datalogger#1,2007,11,25,11,25,16,2.92,20.93,9.020,
-999999.0,-999999.0,-999999.0,22.0,-99.0,-99.0,-99.0,1
Datalogger#1,2007,11,25,11,25,21,2.92,20.95,9.061,
-999999.0,-999999.0,-999999.0,22.0,-99.0,-99.0,-99.0,2
Datalogger#1,2007,11,25,11,25,26,2.92,21.04,9.045,
-999999.0,-999999.0,-999999.0,22.0,-99.0,-99.0,-99.0,3
Datalogger#1,2007,11,25,11,25,31,2.92,21.09,9.014,
-999999.0,-999999.0,-999999.0,22.0,-99.0,-99.0,-99.0,4
To clear the ID enter a <SPACE> character as the ID. When the ID is cleared the arrays from the
logger will display beginning with the year. To display the current ID enter ID <ENTER>.
3.11 “L” - Display Log Intervals
Displays all six log intervals.
*L
Log Intervals List
-----------------------------------------------Interval #1 Length: 10 Iterations: 100
Interval #2 Length: 20 Iterations: 90
Interval #3 Length: 30 Iterations: 80
Interval #4 Length: 40 Iterations: 70
Interval #5 Length: 50 Iterations: 60
Interval #6 Length: 60 Iterations: 50
*
This command has no effect on the current interval (scan or log). If logging is started and log
intervals are enabled the iterations value will be followed by the number of readings left at that
interval. For example:

25
Interva
l
Length
Iterations
Elapsed Time
1
10 seconds
6
1 minute
2
30 seconds
20
10 minutes
3
60 seconds
100
100 minutes
4
300 seconds
200
1000 minutes
5
2400 seconds
250
10000 minutes
6
3600 seconds
0
endless
*L
Log Intervals List
-----------------------------------------------Interval #1 Length: 10 Iterations: 100/96
Interval #2 Length: 20 Iterations: 90/90
Interval #3 Length: 30 Iterations: 80/80
Interval #4 Length: 40 Iterations: 70/70
Interval #5 Length: 50 Iterations: 60/60
Interval #6 Length: 60 Iterations: 50/50
*
The above list indicates that there are 96 iterations of interval #1 left before interval #2 begins
execution. See Section 3.12 to modify intervals.
3.12 “Ln/lllll/iii” - Define Length and Iteration of Interval
Define the length and iteration of any interval in the list; n refers to the number of the interval
(#1-#6), lllll is the length (3-86400), and iii is the iterations (0-255), or the number of readings
that will be taken at that interval. If 0 is entered for the iteration value that interval will execute
indefinitely. Illegal entries will be ignored (e.g., L7/10/100 or L1/1000/500). If the entry
is correct the modified interval will display.
*L1/100/0
Interval #1 Length: 100 Iterations: 0
*
If log intervals are enabled and logging was started, any change to the interval list will
result in a restart of the table!
Table 5 lists possible logarithmic interval lengths and iterations. Any combination of lengths and
iterations is permissible.
Table 5 - Logarithmic Intervals List

26
3.13 “LD” - Disable Log Intervals
If logging is started (ST command) it will continue based on the scan interval entry (SC
command).
*LD
Log intervals disabled.
*Datalogger#1,2007,11,25,11,41,17,2.92,20.63,9.055,
-999999.0,-999999.0,-999999.0,22.5,-99.0,-99.0,-99.0,549
*
3.14 “LE” - Enable Log Intervals
If logging is started (ST command) it will continue based on the interval lengths and iterations of
the log list (SC command).
*LE
Log intervals enabled.
*Datalogger#1,2007,11,25,11,42,56,2.92,21.51,9.042,
-999999.0,-999999.0,-999999.0,22.5,-99.0,-99.0,-99.0,622
3.15 “M” - Display Current Monitor Mode Setting
The monitor mode will display arrays as they are stored in memory in the course of logging. This
is useful where a test is being conducted and immediate display of logged values would be
helpful. Use the “MD” and “ME” commands (next two sections) to disable or enable the use of
the Monitor mode.
*M
Monitor mode enabled.
*
3.16 “MD” - Disable Monitor Mode
Arrays will not be sent to the host computer as they are logged.
*MD
Monitor mode disabled.
*
3.17 “ME” - Enable Monitor Mode
Arrays will be sent to the host computer as they are logged.
*ME
Monitor mode enabled.
*

27
3.18 “MXS” – Display Multiplexer Status
Displays the Multiplexer Status.
*MXS
LC-2MUX 4-Channel Multiplexer Setup:
CH 1: ENABLED
GT: 3 ZR: 0.00000 GF: 1.00000 GO: 0.00000 TH: 0
CH 2: ENABLED
GT: 1 ZR: 0.00000 GF: 1.00000 GO: 0.00000 TH: 0
CH 3: ENABLED
GT: 1 ZR: 0.00000 GF: 1.00000 GO: 0.00000 TH: 0
CH 4: ENABLED
GT: 1 ZR: 0.00000 GF: 1.00000 GO: 0.00000 TH: 0
*
3.19 “MXn” – Set the Maximum Number of Channels
Set the maximum number of channels of the multiplexer. Can be set to 4 or 16. Set to 4 by the
factory for all LC-2x4 dataloggers.
*MX4
4 Channel Multiplexer Selected.
*
3.20 “N” - Display Next Measurement Cycle
Displays the next time the datalogger will initiate a measurement cycle. If the start time (ST
command) has been set, this command will display when logging will begin.
*ST12:00
Logging will start at: 12:00:00
*N
Next time to read: 12:00:00
*

28
3.21 “NA” - Display Network Address
Displays the current network address.
*NA
Network address: 1
*
When network recognition is enabled, this number (preceded by the # character) must be entered
for the respective datalogger to respond. The following example illustrates communication with
two different dataloggers on the RS-485 network.
<ENTER>
<ENTER>
#1<ENTER>
Network address: 1
*NA
Network address: 1
*E
<ENTER>
<ENTER>
#2<ENTER>
Network address: 2
*NA
Network address: 2
*E
3.22 “NAddd” - Set Network Address
Sets the current network address to any address between 1 and 256.
*NA10
Network address: 10
*
When network recognition is enabled, this number (preceded by the # character) must be entered
for the respective datalogger to respond. The following example illustrates communication with
two different dataloggers on the RS-485 network.
<ENTER>
<ENTER>
#1<ENTER>
Network address: 1
*NA
Network address: 1
*E

29
<ENTER>
<ENTER>
#10<ENTER>
Network address: 10
*NA
Network address: 10
*E
NOTE: If connected directly to the datalogger via USB and networking is enabled, the
datalogger will respond with the * prompt only.
NOTE: The network address cannot be changed while networked. Direct connect to the
datalogger via USB in order to change the network address.
3.23 “ND” - Network Disable
Disables networking of two or more LC-2x4 dataloggers.
*ND
Network recognition disabled.
3.24 “NE” - Network Enable
Enables networking of two or more LC-2x4 dataloggers.
*NE
Network recognition enabled.
Note: If a networked LC-2x4 is connected via the RS-232 or USB port, connection to the
datalogger can be made directly without the need to enter the correct datalogger address. This
can be helpful if the network address is unknown and the datalogger is network enabled.
3.25 “NS” - Display Network Status
Displays the current network status.
*NS
Network recognition disabled.
*
Or;
*NS
Network recognition enabled.
*

30
3.26 “Pnnnn” - Set User Position Memory Pointer
Type P and a number between 1 and 10666 to position the pointer. Arrays can then be displayed
(D command) from the new position. The updated pointers will display after entering a valid
position.
*P1
MS:3200 OP:1567 UP:1
*
3.27 “R” - Reset Memory Pointers
Reset memory pointers to default settings. Gage and interval settings, as well as the real-time
clock settings, are not affected by this command. User will be asked to verify before executing.
Press Y to continue, any other key to abort.
*R
Are you sure(Y/N)?Y
Memory cleared.
*
Note: This command does not erase memory. If the need arises to recover data that was
previously taken, take one or more readings and then position the memory pointers via the P and
D commands to recover previously taken readings
3.28 “RESET” - Reboot the LC-2 Microprocessor
All stored readings and settings, as well as the ID and real-time clock settings are not affected by
this command.
*RESET
Resetting...
RESET COMPLETE
*
3.29 “S” – Display Status
Displays the datalogger Status.
*S
MS:1004 OP:1005 UP:1004
4 Channel Multiplexer Selected.
Scan interval: 15 second(s).
Logging stopped.
Log intervals disabled.
Monitor mode enabled.
*
31
Line
Description
Manual
Sections
1
Status of memory pointers
3.7, 3.26 2 Multiplexer Type
3.18 3 Scan interval setting
3.30 4 Start/Stop status
3.32, 3.34
5
Stop time (optional)
3.32 6 Log interval status
3.13, 3.14
7
Monitor mode status
3.15, 3.16, 3.17
Line
Description
1
Trap Count (Communication errors counter)
2
Current network address
3
Current network status
4
Current time format configuration.
5
Current date format configuration.
Table 6 - S Command Information
3.30 “SCnnnnn” - Set Scan Interval
Enter the scan interval, in seconds. Range of entry is 3 to 86400 and is dependent on the number
and type of transducers connected. Only whole numbers are accepted. Typing SC with no value
returns the current setting only
*SC
Scan interval: 60 second(s).
*SC300
Scan interval: 300 second(s).
*
3.31 “SS” - Display System Status
Displays the System Status of the datalogger.
*SS
Trap count: 0
Network address: 1
Network recognition disabled.
Time format is hh,mm.
Date format is month,day.
*
Table 7 - SS Command Information

32
3.32 “SPhh:mm” - Stop Logging
Stop the datalogger logging values; hh is the hour (24-hour format) of the day to stop and mm
the minutes. The time entry is optional.
*SC60
Scan interval: 60 second(s).
*ST
Logging started.
Datalogger#1,2007,11,25,14,10,05,2.94,23.99,9.071,---,---,
---,22.9,---,---,---,1
*SP12:00
Logging will start at: 15:13:46
Logging will stop at: 12:00:00
*
Note that when SPhh:mm is issued, the datalogger responds with the time of the next reading
along with the time at which logging will stop.
3.33 “SR” - Synchronize Readings
Synchronize readings to the top of the hour. If enabled (default) via the SR1 command, then all
readings after the first reading will synchronize to the top of the hour:
*SR1
Readings are synchronized to the top of the hour.
*ST
Logging started.
2008,318,1314,41,3.50,24.45,-8961.077,-999999.0,-999999.0,
-8444.892,23.1,-99.0,23.8,23.9,6645
*2008,318,1314,45,3.50,24.57,-8961.276,-999999.0,-999999.0,
-8445.080,23.2,-99.0,23.8,23.9,6646
2008,318,1315,0,3.50,24.86,-8960.023,-999999.0,-999999.0,
-8445.035,23.2,-99.0,23.8,23.9,6647
*SR0
Readings are not synchronized to the top of the hour.
*ST
Logging started.
2008,318,1316,31,3.50,24.39,-8960.209,-999999.0,-999999.0,
-8445.080,23.3,-99.0,23.8,23.9,6648
*2008,318,1316,46,3.50,24.80,-8960.090,-999999.0,-999999.0,
-8445.092,23.3,-99.0,23.8,23.9,6649
*2008,318,1317,1,3.50,24.80,-8961.173,-999999.0,-999999.0,
-8445.302,23.4,-99.0,23.8,23.9,6650

33
3.34 “SThh:mm” - Start Logging
Start the datalogger logging values; hh is the hour of the day (24-hour format) to start and mm
the minutes. The time entry is optional. Entry is ignored if logging is already started (unless a
time is entered).
*ST
Logging already started!
*ST11:00
Logging will start at: 11:00:00
*
3.35 “SV” - Display Software Version
Returns the software version of the datalogger’s operating system software. Consult the factory
to check on latest versions available.
*SV
Software version: 3.7.0
*
3.36 “TEST” - Perform Internal Self-Tests
Initiates a set of internal self-tests that are performed at the factory during final test.
*TEST
LC-2MUX TEST MENU:
SELECTION TEST
0 INTERNAL EEPROM
1 EXTERNAL EEPROM BANK 1
2 EXTERNAL EEPROM BANK 2
3 EXTERNAL EEPROM BANK 3
4 EXTERNAL EEPROM BANK 4
5 EXTERNAL EEPROM BANK 5
6 EXTERNAL EEPROM BANK 6
7 ALL EEPROM
8 +5X_X
9 RTC 32KHz
A EXTERNAL INPUT (GAGE TYPE 1)
B EXTERNAL INPUT (GAGE TYPE 2)
C EXTERNAL INPUT (GAGE TYPE 3)
D EXTERNAL INPUT (GAGE TYPE 4)
E EXTERNAL INPUT (GAGE TYPE 5)
X EXIT TEST MENU
ENTER SELECTION:

34
Selection
Description
0
Test the Configuration memory bank
1
Test Readings 1-1777 memory bank
2
Test Readings 1778-3554 memory bank
3
Test Readings 3555-5331 memory bank
4
Test Readings 5332-7108 memory bank
5
Test Readings 7109-8885 memory bank
6
Test Readings 8886-10666 memory bank
7
Test all memory banks
8
Turn on System power supplies
9
Test the 32.768 RTC timebase
A
External Input with Gage Type 1 filter
configuration
B
External Input with Gage Type 2 filter
configuration
C
External Input with Gage Type 3 filter
configuration
D
External Input with Gage Type 4 filter
configuration
E
External Input with Gage Type 5 filter
configuration
X
Exit and return to normal operations
Table 8 - TEST Menu Information
3.37 “TF” - Display or Set Time Forma
Displays the current time format display option setting. This setting determines how the time
information will be displayed in the array when the Monitor mode is active (see Section 3.15,
“Display Current Monitor Mode Setting”) or arrays are being displayed from memory. Entering
TF alone returns the current time format. Entering TF0 sets the time format to hhmm. Entering
TF1 sets the time format to hh,mm. The default time format display is hhmm.
*TF
Time format is hh,mm.
*TF0
Time format is hhmm.
*TF1
Time format is hh,mm.
*

35
3.38 “Tnn/t” – Set Thermistor Type
Enter the channel’s (nn) thermistor type (t). This command allows a specific thermistor to be
assigned to each individual channel (generally the external thermistor that is incorporated into
the VW gage). Entering T1/0 sets the external thermistor type of Channel 1 to the standard
3KΩ@25ºC NTC (default). For example, entering T2/1 sets the external thermistor type of
Channel 2 to the high temperature BR55KA822J 8.22KΩ@25ºC NTC thermistor. Entering T3/2
sets the external thermistor type of Channel 3 to the high temperature 103JL1A 10KΩ@25ºC
NTC thermistor.
T1/0:
CH 1: ENABLED
GT: 1 ZR: 0.00000 GF: 1.00000 GO: 0.00000 TH: 0
T2/1:
CH 2: ENABLED
GT: 1 ZR: 0.00000 GF: 1.00000 GO: 0.00000 TH: 1
T3/2:
CH 3: ENABLED
GT: 1 ZR: 0.00000 GF: 1.00000 GO: 0.00000 TH: 2
3.39 “TR” - Display Current Trap Count
The trap counter is a register that keeps track of the number of times that the internal processor
has detected a communications error. This is a useful register to check if communication
problems are suspected.
3.40 “TR0” - Reset Trap Count
Reset the TRap count register to zero.
3.41 “VL” – Display Coin Cell Voltage
The internal 3V lithium coin-cell is used to supply power to the real-time clock circuit. The 3V
lithium coin cell life is rated at 10 years minimum.
*VL
Lithium Cell Voltage = 2.92V
*

36
3.42 “V3” – Display the D Cell Battery Voltage
Displays the three-volt D cell battery pack voltage. Replace the batteries when this voltage is less
than 1.8-volts.
*V3
3V Battery Voltage = 2.93V
*
3.43 “V12” – Display the External Battery Voltage
Displays the external 12-volt battery voltage. Replace or recharge the battery when this voltage
is less than six volts.
*V12
12V Battery Voltage = 12.33V
*
3.44 “WF” - Display Current Wrap Format
Memory “wrapping” means that once the memory has filled, the datalogger will continue taking
readings and overwrite the stored values in a circular fashion (see Section 3.7, “Display Arrays
Forward from User Position”).
When the wrap format is set to 0, logging will stop once the memory becomes full. This is useful
if critical data is stored and it must not be inadvertently overwritten and lost.
When the wrap format is set to 1, logging will continue when the memory becomes full and the
original stored values will be overwritten. With this setting, logging will continue indefinitely
until told to stop with the SP command, the programmed stop time has been reached, or the
battery has fallen to 1.6-volts.
*WF
Logging will not stop when memory is full
*WF0
Logging will stop when memory is full
*WF1
Logging will not stop when memory is full
*

37
3.45 “X” - Take Immediate Reading
Takes and displays one reading, but do not store this reading in memory. Useful if interested in
obtaining a reading at the moment, without interrupting or affecting the current logging schedule.
*D
MS:3 OP:4 UP:3
*X
Datalogger#1,2007,11,25,13,11,39,2.93,23.59,9.060,---,---,---,22.8,---,---,---
*D
MS:3 OP:4 UP:3
*
Note: In this example, Channels 2, 3, and 4 are disabled.

38
Battery
Type
Battery
Capacity
4 Second
Scan Rate
1 Minute
Scan Rate
1 Hour
Scan Rate
1 Day
Scan Rate
Lithium
19 AHr
54 hours
128 days
≥1 year
≥4 years
Alkaline
14 AHr
20 hours
47 days
≥6 months
≥2 years
Carbon-Zinc
5 Ahr
6 hours
16.5 days
≥3 months
≥1 year
4. MAINTENANCE
While the Model LC-2x4 Datalogger is designed to operate in field environments, nevertheless
there are some basic maintenance procedures that should be followed to insure maximum
reliability and functionality.
4.1 Cleaning
The outside of the box can be cleaned using a cloth dampened with soap and water. DO NOT
USE ANY TYPES OF SOLVENTS OR SCOURING AGENTS!
The connector sockets can be cleaned using a small stiff brush (small painters brush) dipped in
soap and water. The sockets are water resistant; therefore, the internal electronics will not be
adversely affected by them filling with water or other liquids. Be aware however, readings could
be affected by shorting or other effects of an improper connection due to fluids being present in
the connector. Dry connections thoroughly before using.
4.2 Batteries
When the unit is not in use, especially for extended periods of time, the D cells should be
removed to prevent damage due to leakage. The warranty does not cover damage due to
battery leakage. The table below details the approximate operating times for the various types
of D cell batteries that can be used with the Model LC-2x4.
Table 9 - Approximate Operating Times
The above table assumes a constant temperature environment of 25 °C (not field conditions!).
Battery life is shortened by temperature extremes. If the datalogger is continuously connected to
an active computer’s USB port, all operating power will be supplied via the USB port. As soon
as USB power is lost, the datalogger will immediately switch over to its internal 3V (or external
12V) battery pack.
Batteries should be replaced when the measured voltage drops below 1.8 VDC (internal 3V
battery) or 6V (external 12V battery). The datalogger electronics will stop the datalogger from
logging and disable RS-485 communications if the battery goes below 1.6 VDC (internal 3V
battery) or 5.5V (external 12V battery). In this event, a new set of batteries must be installed (or
USB connection must be made) before the datalogger becomes operable again. All data and
operating parameters are retained when removing batteries, even for an extended period (years)
of time due to non-volatile EEPROM memory. If the datalogger was logging when it halted due
to low battery voltage, it will resume logging as soon as new batteries are installed or as soon as
it is connected to a USB port.

39
5. TROUBLESHOOTING
Listed below are a few commonly experienced problems and remedial action. Contact the factory
should a problem arise not explained herein or additional information be needed.
Symptom: Unit will not respond to communications
Wrong COM port selected.
The USB Drivers may not be properly installed. See Section 2.5, 8002-4-2 (USB) Driver
Installation.
If RS-232 or RS-485 communications are being used, the internal batteries of the
datalogger may be low, dead, or inserted incorrectly. Check the batteries and replace if
necessary. (Units manufactured before September 2018 were supplied with an aluminum battery
holder, which may need adjusting; refer to Appendix I.)
If RS-485 communications is being used, the <ENTER>, <ENTER>, #,datalogger address,
<ENTER> key sequence is not being sent. Refer to Appendix F – NETWORKING for further
information.
Symptom: Vibrating wire gage measurement reads -999999.0
Using an ohmmeter, check connections to the vibrating wire gage leads. Resistance
should be between 90 and 180 ohms (pins A and B on the 10-pin connector, see Appendix B).
Remember to correct for cable resistance, which is approximately 50 Ω per km (14.7Ω per 1000
ft.) Multiply this factor by two to account for both directions. If resistance reads less than 100Ω,
the cable is probably shorted. If resistance reads infinite or in the megohms range, the cable is
probably cut.
Check the datalogger with another known good transducer. If it still reads –999999.0, the
datalogger may be malfunctioning.
Check that the proper gage type is selected (see Table 2 and Table 3).
Check that the transducer shield wire is not shorted to either the red or black wire.
Symptom: Gage measurement (analog or vibrating wire) reads -999999.9
A mathematical over-range has occurred. Check the magnitude of the reading, zero
reading, multiplier and offset. The result must be in the range of 1.0 × 10⁻⁷ to 1.0 × 10⁷.
Symptom: Vibrating wire gage reading is unstable
Is there a source of electrical noise nearby? Likely candidates are generators, motors, arc
welding equipment, high voltage lines, etc. If possible, move the datalogger and transducer
cables away from the power lines or electrical equipment.
Check if the proper gage type is selected (see Table 2 and Table 3).
Symptom: Thermistor measurement shows -99.9 degrees Celsius
Indicates open circuit to thermistor leads. Check connections from datalogger to
thermistor leads. If okay, check thermistor with ohmmeter. Appendix E details the resistance
versus temperature relationship.

40
APPENDIX A. SPECIFICATIONS
A.1 Measurement Capability
• Vibrating Wire (all types).
• External temperature (thermistor).
• Internal temperature (thermistor).
• Main battery voltage (3V and 12V).
• RTC lithium battery voltage.
A.2 Power
Power supply: Internal 3 VDC (7.5Vmax) or
External 12 VDC (15Vmax)
Processing/communication current: <100 mA
VW measurement current: <250 mA
Quiescent current: <600 µA
RTC battery type: Panasonic CR2032 3V lithium coin cell:
20mm, 225 mAHr
RTC battery life: >10 years
Operating temperature range: −30 to +50° C
A.3 Memory
Data memory: 320K EEPROM
Program memory: 24K EEPROM
Array storage 10666
Data memory type: ring (oldest over-write)
Array elements: ID (optional)
Year
Julian day (or month,day)
Time (hhmm or hh,mm)
Seconds
Battery voltage
Datalogger temperature
Channel 1 Transducer reading
Channel 2 Transducer reading
Channel 3 Transducer reading
Channel 4 Transducer reading
Channel 1 Transducer temperature
Channel 2 Transducer temperature
Channel 3 Transducer temperature
Channel 4 Transducer temperature
Array #

41
A.4 Clock
Features: Full calendar
Time format: 12 or 24 hour (selectable)
Date Format: mm,dd or julian (selectable)
Accuracy: ±2 minutes per year
A.5 Serial Interface (all LC-2x4 models)
Speed: 9600 bps & 115,200 (version 3.1.X and later)
Parameters: 8 Data bits
1 Stop bit
no Parity
no Flow control
Data output format: ASCII text
A.6 RS-485 Network
Maximum nodes: 256
Maximum cable length: 4000', 1.22 km
A.7 Vibrating Wire Measurement
Excitation sweep range: 400 Hz to 4500 Hz
Frequency Measurement Technique: Adaptive Multiple Period Averaging
Accuracy: 0.05% F.S.R. (450-4000 Hz)
Resolution: 0.001 digit
A.8 Internal/External Temperature Measurement
Thermistor: Dale #1C3001-B3 (YSI 44005) (Standard 0)
Thermometrics BR55KAKA822J (High Temp 1)
U.S. Sensor 103JL1A (High Temp 2)
Transducer accuracy: ±0.5° C
Measurement accuracy: 0.5% FSR
Resolution: 0.01° C (Internal)
0.1° C (External)
Linearization error: 0.02% FSR
Temperature range: −40 to +60° C Standard Thermistor
0 to +200º C High Temp Thermistor
Overall accuracy: 1.0% FSR (±1°)

42
A.9 Main Battery Measurement
3V Battery: 12V Battery:
Range: 0 to 7.5 VDC Range: 0 to 15 VDC
Accuracy: ±1.83mV Accuracy: ±3.662mV
Resolution: 0.01 VDC
A.10 Multiplexer Relay
NAIS TXS2SA-4.5V
Contact resistance: 0.1 ohm (max)
Switching current: 1A (max)

43
APPENDIX B. CONNECTOR PINOUTS
Terminal Block
Position
Channel
Number
Description
Cable Wire
Color
VW1+
1
Vibrating Wire +
RED
VW1-
1
Vibrating Wire -
BLACK
TH1+
1
Thermistor +
WHITE
TH1-
1
Thermistor -
GREEN
SHLD1
1
Analog Ground (shield)
BARE WIRE
VW2+
2
Vibrating Wire +
RED
VW2-
2
Vibrating Wire -
BLACK
TH2+
2
Thermistor +
WHITE
TH2-
2
Thermistor -
GREEN
SHLD2
2
Analog Ground (shield)
BARE WIRE
VW3+
3
Vibrating Wire +
RED
VW3-
3
Vibrating Wire -
BLACK
TH3+
3
Thermistor +
WHITE
TH3-
3
Thermistor -
GREEN
SHLD3
3
Analog Ground (shield)
BARE WIRE
VW4+
4
Vibrating Wire +
RED
VW4-
4
Vibrating Wire -
BLACK
TH4+
4
Thermistor +
WHITE
TH4-
4
Thermistor -
GREEN
SHLD4
4
Analog Ground (shield)
BARE WIRE
10 Pin
Bendix
Internal Wire
Color
PCB connector J5
pin
Description
A
Brown 1 Ground
B
Red 2 Tx
C
Orange 3 Rx
D
Yellow 4 RTS
E
Green 5 CTS
F
Blue 6 N/C
G
Violet 7 DTR
H
Grey 8 +5V
J
White 9 N/C
K
Black
10
Ground
B.1 Transducer Cable Connections
Table 10 - Transducer Cable Connections
B.2 RS-232 Connector Pinout (8002-4-1)
The mating 10 pin Bendix plug is part number PT06F-12-10P.
Table 11 - RS-232 Connector Pinout

44
10 Pin
Bendix
Internal Wire
Color
PCB connector J5
pin
Description
A
Brown 1 USB VCC
B
Red 2 USB DM
C
Orange 3 USB DP
D
Yellow 4 Digital Ground
E
Green 5 RS-485 RX
F
Blue 6 RS-485 /RX
G
Violet 7 RS-485 TX
H
Grey 8 RS-485 /TX
J
White 9 RS-485 +12V
K
Black
10
RS-485 Ground
10 Pin
Bendix
Internal Wire
Color
PCB connector J6
pin
Description
A
Brown 1 No Connection
B
Red 2 No Connection
C
Orange 3 No Connection
D
Yellow 4 Digital Ground
E
Green 5 RS-485 RX
F
Blue 6 RS-485 /RX
G
Violet 7 RS-485 TX
H
Grey 8 RS-485 /TX
J
White 9 RS-485 +12V
K
Black
10
RS-485 Ground
B.3 USB Connector Pinout (8002-4-2)
The mating 10 pin Bendix plug is part number PT06F-12-10P.
Table 12 - USB Connector Pinout
B.4 RS-485 Connector Pinout (optional, 8002-4-3)
Table 13 - RS-485 Connector Pinout

45
APPENDIX C. DATA FILE TRANSFER TO A WINDOWS PC
Data can be downloaded to the PC either via LogView software (refer to the LogView Online Help) or
via Windows HyperTerminal, which, prior to Windows Vista, was supplied with most personal
computers. The steps to download the data using LogView are as follows:
C.1 Downloading Data using LogView
The steps below assume that a successful connection has been previously established between LogView
and the datalogger. (See Section 2.5.9)
Click on the Collect Data button from the Main Toolbar. See Figure 17 below:
Figure 17 - LogView Collect Data Button
If the datalogger configuration is set for “Collect all data” in “Datalogger Settings→Data Collection
Options” (see the LogView on-line help menu covering datalogger settings) then LogView will issue
commands to the datalogger to initiate a download of all arrays logged on the datalogger. If the memory
has wrapped, then 10666 arrays will be downloaded starting at the current User Pointer (See Sections 3.7
and 3.26).
If the datalogger configuration is set for “Collect new data since last download” in “Datalogger
Settings→Data Collection Options” then LogView will issue commands to the datalogger to initiate a
download of all arrays since the last time data was downloaded.
Once the data collection has been initiated, the following progress bar (see Figure 18) will be displayed
until the collection has completed:
Figure 18 - Data Collection Progress Bar

46
After a data collection has finished LogView will display the message shown in Figure 19:
Figure 19 - Data Collection Complete Message
C.2 Downloading Data using HyperTerminal (or equivalent)
The steps to download the data using HyperTerminal are as follows:
Launch HyperTerminal: Start → Programs → Accessories → Communications → HyperTerminal
1) Enter a name for the New Connection – Select OK (Figure 20).
.
Figure 20 – HyperTerminal Connection Description
2) Change the Connect using setting to the appropriate COM port (Figure 21) – Select OK.
Figure 21 - HyperTerminal Connection Selection

47
3) In the COM Properties Dialog, enter the “Port Settings”. Select Apply. Select OK (Figure 22).
Figure 22 - HyperTerminal COM Port Settings
4) With the cursor in the display screen, press the Enter key a few times to verify that communications
have been established. The datalogger should return the power up prompt:
Hello. Press "?" for Help.
*
5) Upon confirmation of communications, select Transfer | Capture Text (see Figure 23):
Figure 23 - HyperTerminal Transfer Menu
6) Enter the path and name of the file to be created, either directly or with the Browse button, then click
on the Start button (see Figure 24).
Hint: It may be helpful to specify “.CSV” as the file extension to allow for direct formatted entry into a
spreadsheet program.

48
Figure 24 - Specify Data Capture File
7) With the cursor in the display screen, push the <Enter> key a few times to wake-up the datalogger,
then:
Type “S” to get the Status of the datalogger.
Type “P1” to position the data array Pointer at location one.
Type “D5” to Display the readings stored in memory (see Figure 25).
Select Transfer | Capture Text | Stop.
Figure 25 - HyperTerminal/Datalogger Communication
The data are now stored in the specified file.

49
APPENDIX D. SAMPLE DATA FILE
D.1 Sample Raw Data File
Datalogger#1,2007,329,1421, 0 ,2.93,25.01,-9040.265,---,---,---,23.7,---,---,---,1
Datalogger#1,2007,329,1421,10,2.93,25.13,-9039.986,---,---,---,23.7,---,---,---,2
Datalogger#1,2007,329,1421,20,2.93,25.42,-9039.950,---,---,---,23.7,---,---,---,3
Datalogger#1,2007,329,1421,30,2.93,25.30,-9041.042,---,---,---,23.7,---,---,---,4
Datalogger#1,2007,329,1421,40,2.93,25.16,-9040.502,---,---,---,23.7,---,---,---,5
Datalogger#1,2007,329,1421,50,2.93,25.07,-9039.458,---,---,---,23.7,---,---,---,6
Datalogger#1,2007,329,1422, 0 ,2.93,25.04,-9040.303,---,---,---,23.7,---,---,---,7
The comma delineated columns above represent the following:
Column 1 represents the datalogger id
Column 2 represents the year when the array was stored.
Column 3 represents the julian day (or day, month format, see Section 3.5).
Column 4 represents the time (or hh,mm format, see Section 3.37).
Column 5 represents the seconds.
Column 6 represents the main battery voltage (alkaline batteries, nominal 3.0 VDC).
Column 7 represents the internal temperature in degrees Celsius.
Column 8 represents the Channel 1 vibrating wire reading.
Column 9 represents the Channel 2 vibrating wire reading.
(disabled)
Column 10 represents the Channel 3 vibrating wire reading.
(disabled)
Column 11 represents the Channel 4 vibrating wire reading.
(disabled)
Column 12 represents the Channel 1 external temperature in degrees Celsius.
Column 13 represents the Channel 2 external temperature in degrees Celsius. (disabled)
Column 14 represents the Channel 3 external temperature in degrees Celsius. (disabled)
Column 15 represents the Channel 4 external temperature in degrees Celsius. (disabled)
Column 16 represents the Array #

50
Ohms
Temp
Ohms
Temp
Ohms
Temp
Ohms
Temp
Ohms
Temp
201.1K
-50
16.60K
-10
2417
+30
525.4
+70
153.2
+110
187.3K
-49
15.72K
-9
2317
31
507.8
71
149.0
111
174.5K
-48
14.90K
-8
2221
32
490.9
72
145.0
112
162.7K
-47
14.12K
-7
2130
33
474.7
73
141.1
113
151.7K
-46
13.39K
-6
2042
34
459.0
74
137.2
114
141.6K
-45
12.70K
-5
1959
35
444.0
75
133.6
115
132.2K
-44
12.05K
-4
1880
36
429.5
76
130.0
116
123.5K
-43
11.44K
-3
1805
37
415.6
77
126.5
117
115.4K
-42
10.86K
-2
1733
38
402.2
78
123.2
118
107.9K
-41
10.31K
-1
1664
39
389.3
79
119.9
119
101.0K
-40
9796 0 1598
40
376.9
80
116.8
120
94.48K
-39
9310
+1
1535
41
364.9
81
113.8
121
88.46K
-38
8851 2 1475
42
353.4
82
110.8
122
82.87K
-37
8417 3 1418
43
342.2
83
107.9
123
77.66K
-36
8006 4 1363
44
331.5
84
105.2
124
72.81K
-35
7618 5 1310
45
321.2
85
102.5
125
68.30K
-34
7252 6 1260
46
311.3
86
99.9
126
64.09K
-33
6905 7 1212
47
301.7
87
97.3
127
60.17K
-32
6576 8 1167
48
292.4
88
94.9
128
56.51K
-31
6265 9 1123
49
283.5
89
92.5
129
53.10K
-30
5971
10
1081
50
274.9
90
90.2
130
49.91K
-29
5692
11
1040
51
266.6
91
87.9
131
46.94K
-28
5427
12
1002
52
258.6
92
85.7
132
44.16K
-27
5177
13
965.0
53
250.9
93
83.6
133
41.56K
-26
4939
14
929.6
54
243.4
94
81.6
134
39.13K
-25
4714
15
895.8
55
236.2
95
79.6
135
36.86K
-24
4500
16
863.3
56
229.3
96
77.6
136
34.73K
-23
4297
17
832.2
57
222.6
97
75.8
137
32.74K
-22
4105
18
802.3
58
216.1
98
73.9
138
30.87K
-21
3922
19
773.7
59
209.8
99
72.2
139
29.13K
-20
3748
20
746.3
60
203.8
100
70.4
140
27.49K
-19
3583
21
719.9
61
197.9
101
68.8
141
25.95K
-18
3426
22
694.7
62
192.2
102
67.1
142
24.51K
-17
3277
23
670.4
63
186.8
103
65.5
143
23.16K
-16
3135
24
647.1
64
181.5
104
64.0
144
21.89K
-15
3000
25
624.7
65
176.4
105
62.5
145
20.70K
-14
2872
26
603.3
66
171.4
106
61.1
146
19.58K
-13
2750
27
582.6
67
166.7
107
59.6
147
18.52K
-12
2633
28
562.8
68
162.0
108
58.3
148
17.53K
-11
2523
29
543.7
69
157.6
109
56.8
149
55.6
150
APPENDIX E. THERMISTOR TEMPERATURE DERIVATION
Thermistor Type: YSI 44005, Dale #1C3001-B3, Alpha #13A3001-B3
Resistance to Temperature Equation:
1
T=
A+B(LnR)+C(LnR)
Equation 5 - Convert Thermistor Resistance to Temperature
Where: T = Temperature in °C.
LnR = Natural Log of Thermistor Resistance
A = 1.4051 × 10⁻³ (coefficients calculated over the −50 to +150° C. span)
B = 2.369 × 10⁻⁴
C = 1.019 × 10⁻⁷
-273.2
3
Table 14 - Standard Thermistor Resistance versus Temperature

51
Thermistor Type: Thermometrics BR55KA822J
Temp
R
(ohms)
LnR
LnR3
Calculated
Temp
Diff
FS Error
Temp
R
(ohms)
LnR
LnR3
Calculated
Temp
Diff
FS Error
-30
113898
11.643
1578.342
-30.17
0.17
0.06
120
407.62
6.010
217.118
120.00
0.00
0.00
-25
86182
11.364
1467.637
-25.14
0.14
0.05
125
360.8
5.888
204.162
125.00
0.00
0.00
-20
65805
11.094
1365.581
-20.12
0.12
0.04
130
320.21
5.769
191.998
130.00
0.00
0.00
-15
50684.2
10.833
1271.425
-15.10
0.10
0.03
135
284.95
5.652
180.584
135.00
0.00
0.00
-10
39360
10.581
1184.457
-10.08
0.08
0.03
140
254.2
5.538
169.859
140.01
-0.01
0.00
-5
30807.4
10.336
1104.068
-5.07
0.07
0.02
145
227.3
5.426
159.773
145.02
-0.02
-0.01
0
24288.4
10.098
1029.614
-0.05
0.05
0.02
150
203.77
5.317
150.314
150.03
-0.03
-0.01
5
19294.6
9.868
960.798
4.96
0.04
0.01
155
183.11
5.210
141.428
155.04
-0.04
-0.01
10
15424.2
9.644
896.871
9.98
0.02
0.01
160
164.9
5.105
133.068
160.06
-0.06
-0.02
15
12423
9.427
837.843
14.98
0.02
0.01
165
148.83
5.003
125.210
165.08
-0.08
-0.03
20
10061.4
9.216
782.875
19.99
0.01
0.00
170
134.64
4.903
117.837
170.09
-0.09
-0.03
25
8200
9.012
731.893
25.00
0.00
0.00
175
122.1
4.805
110.927
175.08
-0.08
-0.03
30
6721.54
8.813
684.514
30.01
-0.01
0.00
180
110.95
4.709
104.426
180.07
-0.07
-0.02
35
5540.74
8.620
640.478
35.01
-0.01
0.00
185
100.94
4.615
98.261
185.10
-0.10
-0.04
40
4592
8.432
599.519
40.02
-0.02
-0.01
190
92.086
4.523
92.512
190.09
-0.09
-0.03
45
3825.3
8.249
561.392
45.02
-0.02
-0.01
195
84.214
4.433
87.136
195.05
-0.05
-0.02
50
3202.92
8.072
525.913
50.01
-0.01
-0.01
200
77.088
4.345
82.026
200.05
-0.05
-0.02
55
2693.7
7.899
492.790
55.02
-0.02
-0.01
205
70.717
4.259
77.237
205.02
-0.02
-0.01
60
2276.32
7.730
461.946
60.02
-0.02
-0.01
210
64.985
4.174
72.729
210.00
0.00
0.00
65
1931.92
7.566
433.157
65.02
-0.02
-0.01
215
59.819
4.091
68.484
214.97
0.03
0.01
70
1646.56
7.406
406.283
70.02
-0.02
-0.01
220
55.161
4.010
64.494
219.93
0.07
0.02
75
1409.58
7.251
381.243
75.01
-0.01
0.00
225
50.955
3.931
60.742
224.88
0.12
0.04
80
1211.14
7.099
357.808
80.00
0.00
0.00
230
47.142
3.853
57.207
229.82
0.18
0.06
85
1044.68
6.951
335.915
85.00
0.00
0.00
235
43.673
3.777
53.870
234.77
0.23
0.08
90
903.64
6.806
315.325
90.02
-0.02
-0.01
240
40.533
3.702
50.740
239.69
0.31
0.11
95
785.15
6.666
296.191
95.01
-0.01
0.00
245
37.671
3.629
47.788
244.62
0.38
0.13
100
684.37
6.528
278.253
100.00
0.00
0.00
250
35.055
3.557
45.001
249.54
0.46
0.16
105
598.44
6.394
261.447
105.00
0.00
0.00
255
32.677
3.487
42.387
254.44
0.56
0.19
110
524.96
6.263
245.705
110.00
0.00
0.00
260
30.496
3.418
39.917
259.34
0.66
0.23
115
461.91
6.135
230.952
115.00
0.00
0.00
Resistance to Temperature Equation:
1
T=
A+B(LnR)+C(LnR)
Equation 6 - Convert Thermistor, Type BR55KA822J, Resistance to Temperature
Where: T = Temperature in °C.
LnR = Natural Log of Thermistor Resistance
A = 1.02569 × 10⁻³
B = 2.478265 × 10⁻⁴
C = 1.289498 × 10⁻⁷
Note: Coefficients calculated over -30° to +260° C. span.
-273.2
3
Table 15 - BR55KA822J Thermistor Resistance versus Temperature

52
Temp
Ohms
Temp
Ohms
-30
176974
120
389.6
-25
130421
125
341.9
-20
97081
130
301
-15
72957
135
265.8
-10
55329
140
235.3
-5
42327
145
208.9
0
32650
150
186.1
5
25392
155
165.96
10
19901
160
148.36
15
15712
165
132.95
20
12493
170
119.43
25
10000
175
107.52
30
8057
180
97.02
35
6531
185
87.72
40
5326
190
79.49
45
4368
195
72.17
50
3602
200
65.66
55
2986
205
59.85
60
2488
210
54.65
65
2083
215
50
70
1752
220
45.82
75
1480
225
42.06
80
1255
230
38.68
85
1070
235
35.62
90
915.5
240
32.86
95
786.6
245
30.36
100
678.6
250
28.09
105
587.6
255
26.03
110
510.6
260
24.15
115
445.3
Thermistor Type: U.S. Sensor 103JL1A
Resistance to Temperature Equation:
1
T=
A+B(LnR)+C(LnR)
Equation 7 - Convert Thermistor, Type 103JL1A, Resistance to Temperature
Where: T = Temperature in °C.
LnR = Natural Log of Thermistor Resistance
A = 1.12766979300187 × 10⁻³
B = 2.34444184128213 × 10⁻⁴
C = 8.47692130592308 × 10
D = 1.17512193579615 × 10
-8
-11
3
+D(LnR)
-273.2
5
Table 16 - 103JL1A Thermistor Resistance versus Temperature

53
APPENDIX F. NETWORKING
F.1 Description
The Model LC-2x4 Datalogger is capable of being networked by way of a single, optically-isolated RS485 communications cable. Utilizing one 8001-5 (RS-232) or 8002-5 (USB) RS-485 interface adapter at
the computer (data collection) end, up to 256 Model LC-2x4 Dataloggers* can be networked. Also, the
maximum network length* can be up to 1.22 km (4000 ft.). RS-485 is chosen as the transmission
medium due to its inherent noise immunity and its capability to support a bus type of network
architecture. The 8001-5 RS-485 interface adapter is battery powered to allow for collection of data in
the field. An AC adapter is also provided if mains power is available. The 8002-5 draws its operating
power from the host computer’s USB 2.0 port.
Each datalogger appears as a “node” on the RS-485 bus, with its own unique address. In order to
communicate with a specific datalogger, the user transmits the address of the datalogger via the #nnn
command, where nnn represents the network address of the datalogger. Valid addresses are 1 thru 256.
In a RS-485 system, it is important to locate the “termination” device at the end of the bus. Make sure
that circuit board jumper JP1 (located adjacent to J5 – the COM connector cable termination on
datalogger the circuit board) is positioned between pins one and two on the datalogger that is located at
the farthest point on the bus from the RS-485 Interface Adapter and data collection computer. Refer to
Appendix F.2 for an example of a typical communications session.
Finally, it is helpful to set the datalogger ID# to agree with the network address. This will tend to
eliminate any confusion when collecting data.
For further information, refer to Section 3.10, and Sections 3.21 through 3.25.
* The total number of networked dataloggers is limited by the total network cable length. Contact
a Geokon Sales Engineer for further information.
F.2 Example of a Four-Datalogger Networking Session
1) This session assumes that there are four dataloggers running at five second scan intervals, and
that each datalogger has only one channel enabled.
2) Press <ENTER> <ENTER> to wake the dataloggers from sleep. At this point, each datalogger is
“listening” for its network address to be transmitted down the RS-485 bus.
3) To communicate with Datalogger #1 and observe several readings, type #1<ENTER>.
Datalogger #1 returns:
Network address: 1
*
1,2007,11,25,16,25,0,2.98,24.6,-9040.265,---,---,---,20.5,---,---,---,34
1,2007,11,25,16,25,5,2.98,24.7,-9039.886,---,---,---,20.4,---,---,---,35
1,2007,11,25,16,25,10,2.98,24.7,-9040.028,---,---,---,20.5,---,---,---,36
*E

54
Note that the datalogger ID, which is the first entry for each ASCII character string, corresponds to the
network address. This should be set by the user during initial datalogger setup via the ID command.
Typing E<ENTER> puts the datalogger back to sleep and disconnects it from the RS-485 bus. The
datalogger will continue to wake up periodically (scan rate setting) to take a data reading. The E
command must be used in order to disconnect from the current datalogger and allow connection to
the next datalogger.
4) To communicate with Datalogger #2 and observe several readings, type <ENTER> <ENTER>to
wake the dataloggers and then type #2<ENTER>. Datalogger #2 returns:
Network address: 2
*
2,2007,11,25,16,25,25,2.95,24.7,-360.112,---,---,---,20.4,---,---,---,27
2,2007,11,25,16,25,30,2.96,24.7,-360.155,---,---,---,20.4,---,---,---,28
*E
5) Doing the same for Datalogger #3 and #4 results in:
Network address: 3
*
3,2007,11,25,16,30,0,2.98,24.7,9091.346,---,---,---,20.5,---,---,---,25
3,2007,11,25,16,30,5,2.98,24.7,9091.400,---,---,---,20.5,---,---,---,26
*E
Network address: 4
*
4,2007,11,25,16,31,26,2.96,24.8,-8457.811,---,---,---,20.4,---,---,---,20
4,2007,11,25,16,31,31,2.96,24.8,-8456.978,---,---,---,20.4,---,---,---,21
*E

55
APPENDIX G. LITHIUM COIN CELL
G.1 Description
Under normal operating conditions, the 1.5-volt D cells provide all the power required to operate the LC2x4 datalogger. In order to maintain the correct date and time settings for those periods when the D cells
are removed, the LC-2x4 datalogger incorporates a 3-volt lithium coin cell (Panasonic CR2032) to
supply operating current to the internal Real Time Clock.
Since the power requirements of the Real Time Clock circuit are minimal (3µA max.), the clock will
continue to operate for up to 10 years under these conditions.
However, if the lithium cell voltage falls to 2.5-volts or less, it should be replaced using the following
replacement procedure.
G.2 Replacement Procedure
Materials Required:
• 6 mm (1/4") Slotted Screwdriver
• 6 mm (1/4") Nutdriver
• CR2032 Lithium Coin Cell (Geokon P/N BAT-115),
• Disposable Grounding Wrist Strap (3M P/N 2209 or equivalent)
Procedure:
1) Put on the disposable grounding wrist strap and connect to a good earth ground.
2) Using the 6 mm (1/4") slotted screwdriver, loosen the four captive screws and remove the datalogger
cover.
3) Remove the two D cells.
4) Using the 6 mm (1/4") slotted screwdriver, remove the four 9.5 mm long M3.5 x .6 (3/8" long, 6-32)
battery board mounting screws.
5) Lift up the battery board and disconnect the two-wire Molex connector (red and black wires) from
the main PCB, which is located below the battery board. Set the battery board aside.
6) Using the 6 mm (1/4") nut driver, remove the four standoffs securing the printed circuit board to the
case.
7) Lift the printed circuit board up to expose the bottom of the circuit board.
8) Using the 3 mm (1/8") slotted screwdriver, gently pry the lithium coin cell battery from the battery
holder.

56
9) Insert the replacement lithium coin cell into the battery holder (+ side facing out).
10) Re-install the printed circuit board back into the enclosure.
11) Thread the four standoffs onto the set screws, using the nut driver to gently tighten the standoffs.
12) Reconnect the two-wire Molex connector to the header labeled “3V” (“12V” if applicable).
13) Position the battery board over the standoffs and reinstall using the four, 9.5 mm long,
M3.5 x .6 (3/8" long, 6-32) battery board mounting screws.
14) Reinstall the D cells.
15) Reinstall the datalogger cover.
Lithium coin cell replacement is now complete.

57
10 pin Bendix
PT06A-12-10P
Function
3 Gage VW Load Cell,
Purple Cable
4 Gage VW Load Cell,
Purple Cable
6 Gage VW Load Cell,
Orange Cable
H
Common
White's Black*
Green
Blue
Multiplexer
Board
Vibrating Wire
with Thermistor
VW1+
VW Sensor #1
VW1-
8032-27
TH1+
Thermistor
TH1-
Thermistor
SHLD1
Shield Drain Wire
VW2+
VW Sensor #2
VW2-
8032-27
TH2+
-
TH2-
-
SHLD2
-
VW3+
VW Sensor #3
VW3-
8032-27
TH3+
-
TH3-
-
SHLD3
-
VW4+
VW Sensor #4
VW4-
8032-7
TH4+
-
TH4-
-
SHLD4
-
APPENDIX H. MODEL 8032-27 AND LOAD CELL WIRING
Connect the “common” VW- conductor from the load cell to the 8032-27 by lifting up on the orange tab
located on the opposite side of the six black conductors, inserting the common conductor fully into the
8032-27 (Figure 26), and then pushing down on the orange tab until it snaps into place. Refer to Table 17
to identify which conductor carries the common VW- signal.
Figure 26 - Model 8032-27 Jumper Wire Assembly
Table 17 - Common Conductor Chart
* White's black and Green wires are switched on Geokon three-gage VW load cells prior to serial number 3313.
The following wiring chart details the connections between the load cell, the 8032-27, and the multiplexer board:
Table 18 - Multiplexer Board Wiring

58
APPENDIX I. BATTERY REPLACEMENT INSTRUCTIONS FOR UNITS MANUFACTURED BEFORE SEPTEMBER 2018
1) Remove the four captive lock regular head screws on the top of the case and lift the cover off.
Underneath the cover is the 'D' cell battery holder.
2) Remove the two batteries from the holder being careful not to bend the sides outward.
3) Insert the new batteries straight down into the battery holder. Ensure that the polarity of the batteries
matches the diagram on the battery holder.
4) Check for secure connection between the battery terminals and holder. If a gap exists, remove
batteries and bend the holder sides inward. See Figure 27 below.
Proper Battery Installation Faulty Battery Installation
Figure 27 - Battery Installation Detail
5) Re-install the cover. Check datalogger for proper operation.
 Loading...