

Page 1
a
Page 2

Beamage Series User Manual Revision 9.0 1
WARRANTY
The Gentec-EO Beamage series beam profiler carries a one-year warranty (from date of shipment)
against material and/or workmanship defects, when used under normal operating conditions. The
warranty does not cover damages related to battery leakage or misuse.
Gentec-EO Inc. will repair or replace, at Gentec-EO Inc.’s option, any Beamage that proves to be
defective during the warranty period, except in the case of product misuse.
Any attempt by an unauthorized person to alter or repair the product voids the warranty.
The manufacturer is not liable for consequential damages of any kind.
In case of malfunction, contact your local Gentec-EO distributor or nearest Gentec-EO Inc. office to obtain
a return authorization number. The material should be returned to:
Gentec Electro-Optics, Inc.
445, St-Jean-Baptiste, Suite 160
Québec, QC
Canada G2E 5N7
Tel: (418) 651-8003
Fax: (418) 651-1174
e-mail: [email protected]
Website: www.gentec-eo.com
CLAIMS
To obtain warranty service, contact your nearest Gentec-EO agent or send the product, with a description
of the problem, and prepaid transportation and insurance, to the nearest Gentec-EO agent. Gentec-EO
Inc. assumes no risk for damage during transit. Gentec-EO Inc. will, at its option, repair or replace the
defective product free of charge or refund your purchase price. However, if Gentec-EO Inc. determines
that the failure is caused by misuse, alterations, accident or abnormal conditions of operation or handling,
it would therefore not be covered by the warranty.
Page 3

Beamage Series User Manual Revision 9.0 2
Refer to the manual for specific Warning or Caution information to avoid any
damage to the product.
DC, Direct Current
SAFETY INFORMATION
Do not use a Beamage if the device or the detector looks damaged, or if you suspect that a Beamage is
not operating properly.
Note: This equipment has been tested and found to comply with the limits for a Class B digital
device, pursuant to part 15 of the FCC Rules. These limits are designed to provide
reasonable protection against harmful interference in a residential installation. This
equipment generates, uses, and can radiate radio frequency energy. If not installed
and used in accordance with the instructions, it may cause harmful interference to radio
communications. However, there is no guarantee that interference will not occur in a
particular installation. If this equipment does cause harmful interference to radio or
television reception, which can be determined by turning the equipment off and on, try
to correct the interference by taking one or more of the following steps:
• Reorient or relocate the receiving antenna.
• Increase the distance between the equipment and receiver.
• Connect the equipment to an outlet that is on a different circuit than the receiver.
• Consult the dealer or an experienced radio/TV technician for help.
Caution: Changes or modifications not expressly approved in writing by Gentec-EO Inc. may
void the user’s authority to operate this equipment.
SYMBOLS
The following international symbols are used in this manual:
Page 4

Beamage Series User Manual Revision 9.0 3
TABLE OF CONTENTS
1. Beamage-3.0 ......................................................................................................................................... 8
1.1. INTRODUCTION.................................................................................................................................. 8
1.2. SPECIFICATIONS ............................................................................................................................... 8
2. Beamage-4M ....................................................................................................................................... 11
2.1. INTRODUCTION................................................................................................................................ 11
2.2. SPECIFICATIONS ............................................................................................................................. 11
2.2.1. Beamage Series Mechanical Drawings ................................................................................ 14
2.2.2. Sensor and Filter Spectral Responses .................................................................................. 15
3. Quick Start procedure ....................................................................................................................... 16
4. Main User Interface ............................................................................................................................ 18
5. The Main Controls .............................................................................................................................. 19
5.1. MULTIPLE BEAMAGE MODE .............................................................................................................. 19
5.2. CAPTURE CONTROLS ...................................................................................................................... 20
5.2.1. Camera Status....................................................................................................................... 20
5.2.2. Capture Button ...................................................................................................................... 21
5.2.3. Subtract Background Button ................................................................................................. 21
5.3. FILE CONTROLS .............................................................................................................................. 22
5.3.1. Open ...................................................................................................................................... 22
5.3.2. Save Current Image .............................................................................................................. 23
5.3.3. Save All Images in Buffer ...................................................................................................... 23
5.3.4. Start Data Acquisition ............................................................................................................ 23
5.3.5. Print Report ........................................................................................................................... 24
5.4. STARTUP CONFIG CONTROLS ........................................................................................................... 28
5.5. BUFFER CONTROLS ........................................................................................................................ 28
5.5.1. Image Index ........................................................................................................................... 29
5.5.2. Previous Image and Next Image ........................................................................................... 29
5.5.3. Clear Buffer ........................................................................................................................... 30
5.5.4. Animate ................................................................................................................................. 30
5.5.5. Buffer Size ............................................................................................................................. 30
5.6. DATA COMPUTATIONS ..................................................................................................................... 30
5.6.1. Filters ..................................................................................................................................... 31
5.6.2. Normalize .............................................................................................................................. 32
5.6.3. Trigger ................................................................................................................................... 32
5.6.4. Turbo ..................................................................................................................................... 33
5.6.5. Show/Hide Options ................................................................................................................ 33
5.7. BEAMAGE-M2 MODE ....................................................................................................................... 35
5.8. SOFTWARE INFO ............................................................................................................................. 36
5.8.1. Color Legend ......................................................................................................................... 36
5.8.2. About ..................................................................................................................................... 37
5.8.3. Help ....................................................................................................................................... 37
6. Home and Setup Panels .................................................................................................................... 38
6.1. HOME ............................................................................................................................................. 39
6.1.1. Main Controls ........................................................................................................................ 41
6.1.2. Measures ............................................................................................................................... 41
6.2. SETUP ............................................................................................................................................ 45
6.2.1. Exposure Time ...................................................................................................................... 46
6.2.2. Image Orientation .................................................................................................................. 46
6.2.3. Image Averaging ................................................................................................................... 47
6.2.4. Active Area ............................................................................................................................ 47
Page 5

Beamage Series User Manual Revision 9.0 4
6.2.5. Pixel Addressing .................................................................................................................... 48
6.2.6. Gain ....................................................................................................................................... 48
6.2.7. ADC Level ............................................................................................................................. 48
6.2.8. Pixel Multiplication Factor (PMF)........................................................................................... 48
6.3. DATA ACQUISITION .......................................................................................................................... 49
6.4. DIVERGENCE .................................................................................................................................. 51
6.5. RELATIVE POSITION ........................................................................................................................ 52
6.5.1. Setup ..................................................................................................................................... 52
6.5.2. Measures ............................................................................................................................... 53
6.6. CAMERA LENS ................................................................................................................................ 54
6.7. FIXED CROSSHAIR .......................................................................................................................... 55
6.7.1. Center Setup ......................................................................................................................... 55
6.7.2. Orientation Setup .................................................................................................................. 58
7. Display Panel ...................................................................................................................................... 60
7.1. 3D DISPLAY .................................................................................................................................... 60
7.1.1. 3D Display: Controls .............................................................................................................. 61
7.2. 2D DISPLAY .................................................................................................................................... 62
7.2.1. 2D Display: Controls .............................................................................................................. 63
7.3. XY DISPLAY .................................................................................................................................... 64
7.3.1. XY Display: Controls ............................................................................................................. 64
7.3.2. Gaussian Fit .......................................................................................................................... 65
7.4. BEAM TRACKING DISPLAY ............................................................................................................... 66
7.4.1. Beam Tracking Display: Controls .......................................................................................... 67
8. LabVIEW Driver .................................................................................................................................. 68
8.1. PC-BEAMAGE LABVIEW EXAMPLE VI’S ........................................................................................... 68
8.1.1. Connection VIs ...................................................................................................................... 68
8.1.2. Control VIs ............................................................................................................................. 68
8.1.3. Measurement VIs .................................................................................................................. 69
8.1.4. Display VIs. ............................................................................................................................ 70
8.1.5. Activate VIs. ........................................................................................................................... 71
8.1.6. Miscellaneous VIs. ................................................................................................................ 71
8.1.7. The Example VI. .................................................................................................................... 72
9. Troubleshooting and Tips ................................................................................................................. 74
9.1. WHILE TRYING TO INSTALL PC-BEAMAGE, THE FOLLOWING MESSAGE APPEARS: THE PROGRAM CAN’T
START BECAUSE MSVCR100.DLL IS MISSING […] .......................................................................................... 74
9.2. BEAMAGE IS NOT DETECTED ............................................................................................................ 74
9.3. THE DISPLAY AREA IS COMPLETELY WHITE ........................................................................................ 74
9.4. CHANGING THE OPTICS IN FRONT OF THE BEAMAGE .......................................................................... 74
9.5. SMALL BLACK SPOTS APPEAR ON THE IMAGE ..................................................................................... 74
9.6. IT IS NOT POSSIBLE TO START AN ACQUISITION. IT KEEPS OPENING A WARNING MESSAGE INDICATING
THAT 0 GB IS AVAILABLE ON HARD DRIVE ..................................................................................................... 74
9.7. THERE IS NO SERIAL NUMBER DISPLAYED IN THE CAMERA .............................................................. 74
9.8. THE DETECTED SERIAL NUMBER IS 000000 ...................................................................................... 75
9.9. THE 10 BIT ADC LEVEL IS NOT AVAILABLE EVEN WHEN THE BEAMAGE IS CONNECTED TO A USB 3.0 PORT
75
9.10. DO NOT DISCONNECT THE BEAMAGE WHILE IT IS STREAMING ......................................................... 75
9.11. TIPS TO INCREASE THE FRAME RATE ............................................................................................. 75
10. Declaration of Conformity ............................................................................................................. 76
Appendix A. ISO11146 and ISO11670 Definitions ............................................................................... 77
Appendix B. Beamage-3.0 Driver Installation Quick Guide ................................................................ 80
Appendix C. Beamage FIRMWARE Installation Quick Guide ............................................................. 89
Page 6

Beamage Series User Manual Revision 9.0 5
Appendix D. Recycling and separation procedure for WEEE ............................................................ 90
Appendix E. Complete list of SAVED settings ..................................................................................... 91
Page 7

Beamage Series User Manual Revision 9.0 6
LIST OF ILLUSTRATIONS
FIGURE 1-1 BEAMAGE SERIES FRONT AND SIDE VIEWS ................................................................................... 14
FIGURE 1-2 ATTENUATION FILTER TRANSMISSION ........................................................................................... 15
FIGURE 3-1 PC-BEAMAGE USER INTERFACE .................................................................................................. 18
FIGURE 4-1 PC-BEAMAGE MAIN CONTROLS ................................................................................................... 19
FIGURE 4-2 THE PC-BEAMAGE INTERFACE WITH AND WITHOUT THE MAIN CONTROLS RIBBON ......................... 19
FIGURE 4-3 BEAMAGE SELECTOR FOR NUMEROUS CONNECTED BEAMAGE ...................................................... 20
FIGURE 4-4 CAPTURE CONTROLS .................................................................................................................. 20
FIGURE 4-5 CAMERA STATUS ......................................................................................................................... 20
FIGURE 4-6 CAPTURE BUTTON ....................................................................................................................... 21
FIGURE 4-7 SUBTRACT BACKGROUND BUTTON ............................................................................................... 21
FIGURE 4-8 SUBTRACT BACKGROUND MESSAGE BOX ..................................................................................... 21
FIGURE 4-9 FILE CONTROLS .......................................................................................................................... 22
FIGURE 4-10 OPEN FILE BUTTON ................................................................................................................... 22
FIGURE 4-11 SAVE CURRENT IMAGE BUTTON ................................................................................................. 23
FIGURE 4-12 SAVE ALL IMAGES IN BUFFER BUTTON ....................................................................................... 23
FIGURE 4-13 START DATA ACQUISITION BUTTON ............................................................................................ 23
FIGURE 4-14 PRINT REPORT BUTTON ............................................................................................................ 24
FIGURE 4-15 CUSTOM PRINT REPORT DIALOG ................................................................................................ 25
FIGURE 4-16 PRINT REPORT PREVIEW ........................................................................................................... 25
FIGURE 4-17 DEFAULT PRINT REPORT PAGE 1 ............................................................................................... 26
FIGURE 4-18 DEFAULT PRINT REPORT PAGE 2 ............................................................................................... 27
FIGURE 4-19-STARTUP CONFIG CONTROLS .................................................................................................... 28
FIGURE 4-20 BUFFER CONTROLS ................................................................................................................... 28
FIGURE 4-21 IMAGE INDEX ............................................................................................................................. 29
FIGURE 4-22 NEXT AND PREVIOUS IMAGE BUTTONS ....................................................................................... 29
FIGURE 4-23 CLEAR BUFFER BUTTON ............................................................................................................ 30
FIGURE 4-24 ANIMATE BUTTON ...................................................................................................................... 30
FIGURE 4-25 BUFFER SIZE ............................................................................................................................ 30
FIGURE 4-26 DATA COMPUTATIONS ............................................................................................................... 31
FIGURE 4-27 FILTERS BUTTON ....................................................................................................................... 31
FIGURE 4-28 AVAILABLE FILTERS ................................................................................................................... 31
FIGURE 4-29 SPATIAL FILTER EXAMPLE.......................................................................................................... 31
FIGURE 4-30 NORMALIZE BUTTON .................................................................................................................. 32
FIGURE 4-31 NORMALIZATION EXAMPLE ......................................................................................................... 32
FIGURE 4-32 TRIGGER BUTTON ..................................................................................................................... 32
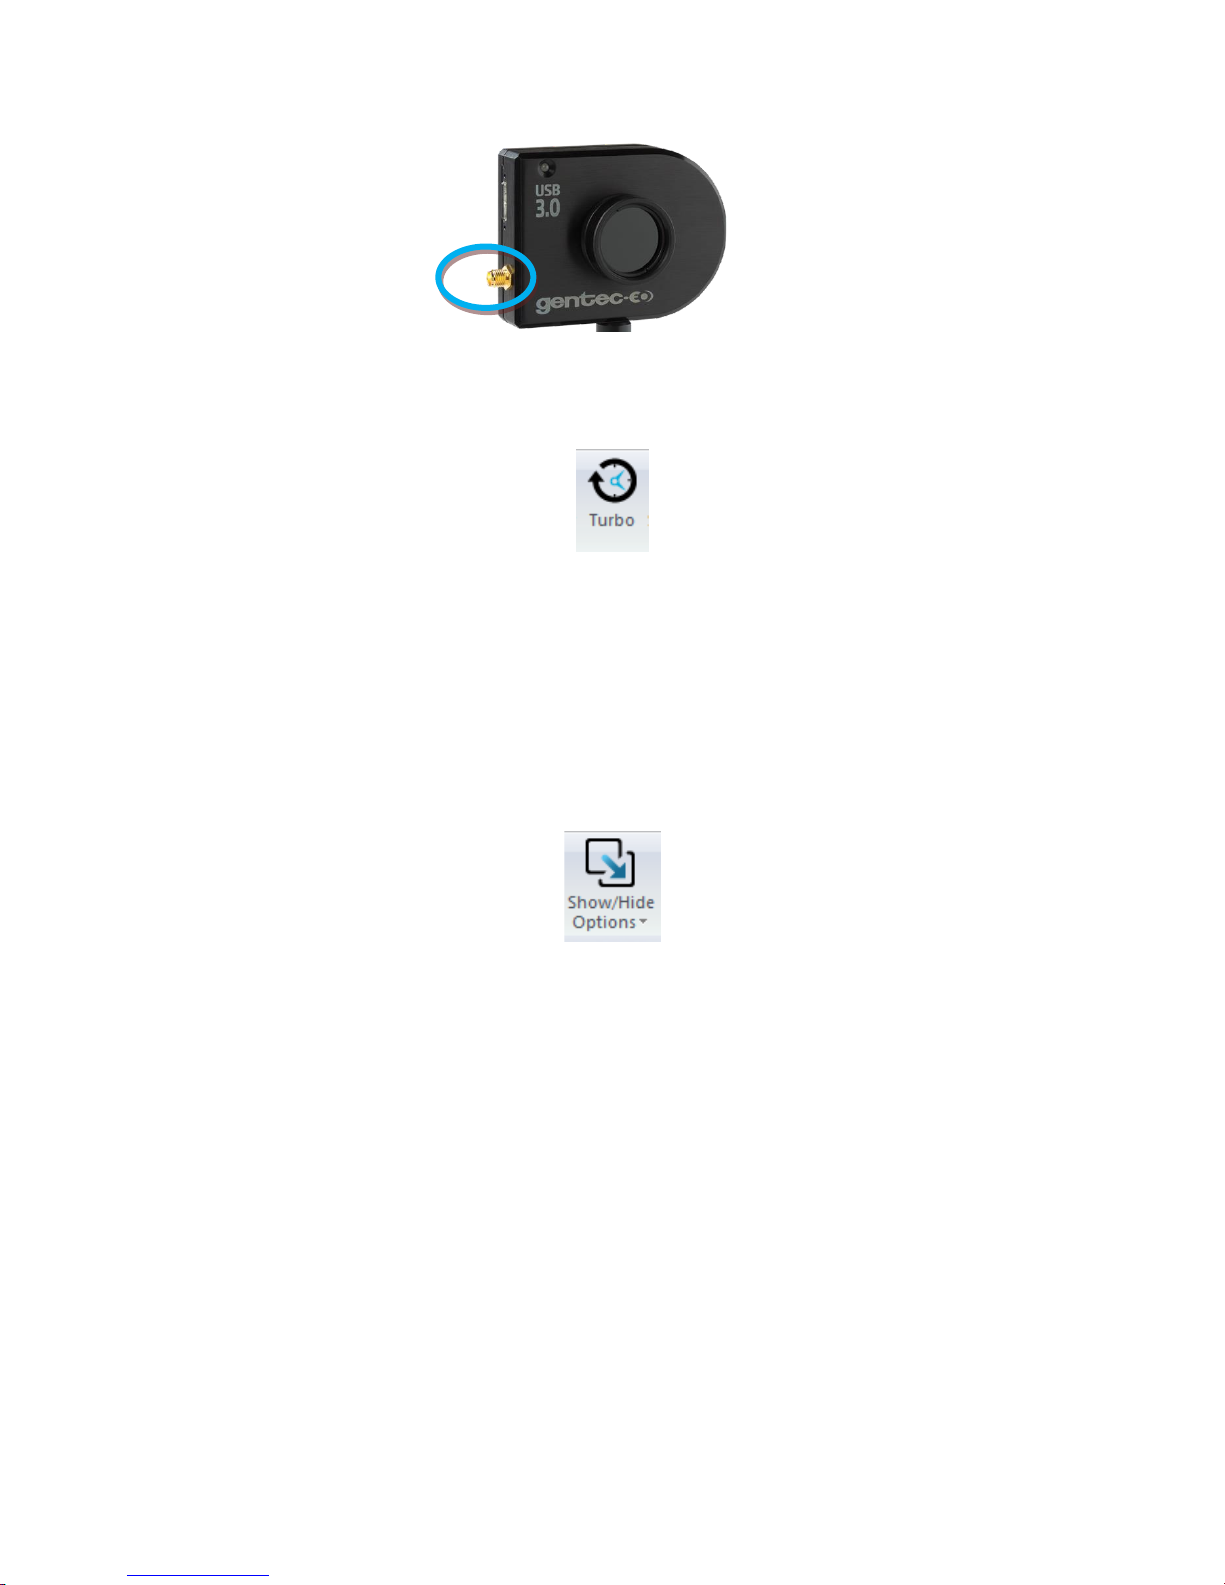
FIGURE 4-33 SMA CONNECTOR FOR TRIGGER INPUT ..................................................................................... 33
FIGURE 4-34 TURBO BUTTON ........................................................................................................................ 33
FIGURE 4-35 SHOW/HIDE OPTIONS BUTTON ................................................................................................... 33
FIGURE 4-36 SHOW/HIDE OPTIONS ................................................................................................................ 34
FIGURE 4-37 DIVERGENCE BUTTON ............................................................................................................... 34
FIGURE 4-38 RELATIVE POSITION PANEL ........................................................................................................ 34
FIGURE 4-39 CAMERA LENS CALIBRATION PANEL ........................................................................................... 35
FIGURE 4-40 FIXED CROSSHAIR PANEL .......................................................................................................... 35
FIGURE 4-41 SHOW/HIDE M2 MODE BUTTON ................................................................................................. 35
FIGURE 4-42 SOFTWARE INFO ....................................................................................................................... 36
FIGURE 4-43 COLOR LEGEND BUTTON ........................................................................................................... 36
FIGURE 4-44 COLOR LEGEND ........................................................................................................................ 36
FIGURE 4-45 ABOUT BUTTON......................................................................................................................... 37
FIGURE 4-46 HELP BUTTON ........................................................................................................................... 37
FIGURE 5-1 GRAPHIC DISPLAY ....................................................................................................................... 38
FIGURE 5-2 HOME TAB .................................................................................................................................. 39
FIGURE 5-3 FIXED COORDINATES SYSTEM FOR THE SENSOR .......................................................................... 43
Page 8

Beamage Series User Manual Revision 9.0 7
FIGURE 5-4 PEAK TO AVERAGE ...................................................................................................................... 43
FIGURE 5-5 PEAK TO AVERAGE RATIO EXAMPLE ............................................................................................. 44
FIGURE 5-6 SETUP TAB ................................................................................................................................. 45
FIGURE 5-7 IMAGE ORIENTATION EXAMPLES................................................................................................... 47
FIGURE 5-8 PIXEL ADDRESSING MODE ........................................................................................................... 48
FIGURE 5-9 PIXEL MULTIPLICATION FACTOR ................................................................................................... 49
FIGURE 5-10 EXAMPLE FILE OF A MEASUREMENT ACQUISITION ....................................................................... 49
FIGURE 5-11 DATA ACQUISITION TAB ............................................................................................................. 50
FIGURE 5-12 DIVERGENCE TAB ...................................................................................................................... 51
FIGURE 5-13 RELATIVE POSITION TAB ............................................................................................................ 52
FIGURE 5-14 COORDINATES DEFINED BY USER .............................................................................................. 53
FIGURE 5-15 MEASURES SECTION ................................................................................................................. 53
FIGURE 5-16 CAMERA LENS CALIBRATION SECTION ........................................................................................ 54
FIGURE 5-17 - CAMERA LENS CALIBRATION MOVING DIRECTION ..................................................................... 55
FIGURE 5-18 PIXEL MULTIPLICATION FACTOR SECTION ................................................................................... 55
FIGURE 5-19 FIXED CROSSHAIR CENTER SECTION ......................................................................................... 56
FIGURE 5-20 FIXED CROSSHAIR SECTION ...................................................................................................... 56
FIGURE 5-21 USER-DEFINED ORIGIN ............................................................................................................. 57
FIGURE 5-22 FIXED CROSSHAIRS AT PEAK POSITION IN THE 2D DISPLAY ......................................................... 57
FIGURE 5-23 FIXED CROSSHAIRS AT PEAK POSITION IN THE XY DISPLAY......................................................... 58
FIGURE 5-24 FIXED CROSSHAIR ORIENTATION SECTION ................................................................................. 58
FIGURE 5-25 USER-DEFINED CROSSHAIR ORIENTATION ................................................................................. 59
FIGURE 5-26 DIFFERENT CROSSHAIR ORIENTATIONS FOR THE SAME BEAM ..................................................... 59
FIGURE 6-1 DISPLAY PANEL ........................................................................................................................... 60
FIGURE 6-2 3DDISPLAY ................................................................................................................................. 61
FIGURE 6-3 2D DISPLAY SHOWING CROSSHAIRS AND DIAMETER POSITIONS .................................................... 62
FIGURE 6-4 2D DISPLAY ................................................................................................................................ 63
FIGURE 6-5 XY DISPLAY ................................................................................................................................ 64
FIGURE 6-6 BEAM TRACKING DISPLAY ............................................................................................................ 66
FIGURE 7-1 - BEAMAGE LABVIEW EXAMPLE .................................................................................................. 72
Page 9

Beamage Series User Manual Revision 9.0 8
Sensor Specification
Sensor Technology
CMOS without coverglass
Sensor Size
11.3 x 6.0 mm
Sensor Area
0.67 cm2
Pixel Count
2.2 MPixels
Pixel H x V
2048 x 1088
Optical Format
⅔”
Pixel Dimension
5.5 µm
Minimum Measurable Beam
55 µm
ADC
12 bit (default) or 10 bit
Shutter Type
Global
Wavelength Range
350 -1150 nm
Frame Rate
8 fps (2.2 MPixel Full Frame)
15 fps (1.1 MPixel Active Area 2048 x544)
32 fps (0.066 MPixel Active Area 256 x 256)
RMS noise
1000:1 (60 dB)
Minimum and Maximum
Exposure Times
0.06 to 200 ms
External Trig
SMA connector
1.1 volts to 24 volts, the rise edge response time is 300 ns
Trigger signal pulse width: 300 ns to 230 ms
Optional SMA to BNC adaptor (202273) :
1. BEAMAGE-3.0
1.1. INTRODUCTION
Gentec-EO introduces the new Beamage-3.0. Its sleek and thin design allows the Beamage-3.0 to fit
between tight optical components. Its USB 3.0 connection and improved algorithm allows very fast frame
rates. The new 2.2 MPixel CMOS sensor has a large ⅔” optical format with a small 5.5 µm pixel pitch
allowing high resolution on large beams. Most importantly the innovative and improved PC-Beamage
software is simple and intuitive to any new or expert beam profiling user.
1.2. SPECIFICATIONS
The following specifications are based on a one-year calibration cycle, an operating temperature of 18 to
28°C (64 to 82 F) and a relative humidity not exceeding 80%.
Table 1-1 List of Specifications
Page 10

Beamage Series User Manual Revision 9.0 9
Damage Thresholds
Maximum Average Power
1 W with ND filter
Saturation Level
(1064 nm, CW, ND4)
10 W/cm
2
Saturation Level
(1064 nm, Pulsed, ND4)
300 µJ/cm
2
PC Requirements
USB Port
USB 3.0 port for optimal performance
USB 2.0 port
Operating System
Compatibility
Windows 8 (for optimal performance)
Windows 7 (for optimal performance)
Windows Vista
Average RAM Allocation
500 MB
Up to 1250 MB for128 images in buffer
Recommended Requirement
4 Gb RAM minimum
8Gb RAM for optimal performance
Intel i series processors (i3, i5, i7) or equivalent for optimal
performance, other processors will have lower specifications.
i7 for optimal performance
Beamage-3.0 is a new and a high end product. It needs an equally
recent high end computer to work. Computer hardware must be from
2010 or after. No computer or parts bought before 2010 will be
supported
For Optimal Performance
Close all programs except the PC-Beamage;
Keep a minimum of 1 GB RAM free when running the PC-Beamage;
Keep a minimum of 50% of free CPU power when running the PC-
Beamage
Use an Image Buffer of 1
Multi Camera
Recommendations
When working with more than one camera, we strongly recommend
using one USB3.0 port per camera and a recent high end computer
for optimal performance
Internet Upgrades
Downloadable at www.gentec-eo.com/downloads
Physical Characteristics
Dimensions
61 H x 81.1W x 19.7D
Weight
138 g
Default Attenuation
ND 4.0
Page 11

Beamage Series User Manual Revision 9.0 10
Measured and Displayed Parameters
Displays
3D, 2D, XY (crosshair), Beam Tracking
Beam Diameter Definition
4 Sigma (ISO) - ISO-11146-1:2005
FWHM along crosshair (50%)
1/e2 along crosshair (13.5%)
86% effective diameter (D86)
Beam Center Definition
Centroid - ISO-11146-1:2005
First Encountered Peak
Displayed Measurements
Major Axis
Minor Axis
Effective Diameter
Ellipticity
Orientation
Centroid X and Y
Peak X and Y
Peak Saturation Level
Peak to Average Ratio X and Y
Divergence
Fitted Gaussian equations
Roughness fit along crosshairs
Gaussian fit along crosshairs
Mean Centroid Position
Azimuth
Beam Position Stability
M2 Quality Measurement
Setup Options
Exposure Time (auto or manual)
Image Orientation (rotation and flip)
Image Averaging (temporal filter)
Active Area
Pixel Addressing
Gain
ADC Level
Magnifying Lens
Processing Option
Background Subtraction
Area Filters (triangular and flat spatial filters)
Normalized Display
Trigger
Buffer
Buffer size from 1 to 128 frames
Possibility to animate stored frames
File options
Save 1 or all images in buffer
Save in native format, text format, or binary format
Load native format files
Default and custom print report
Save 3D or 2D image in bitmap format
Save crosshairs in text format
Data Acquisition of measurements in text format and in native format
Page 12

Beamage Series User Manual Revision 9.0 11
All screenshots in this manual with the words "Beamage-3.0" can be
interpreted as "Beamage-4M".
Sensor Specification
Sensor Technology
CMOS without coverglass
Sensor Size
11.3 x 11.3 mm
Sensor Area
1.28 cm2
Pixel Count
4.2 MPixels
Pixel H x V
2048 x 2048
Optical Format
1”
Pixel Dimension
5.5 µm
Minimum Measurable Beam
55 µm
ADC
12 bit (default) or 10 bit
Shutter Type
Global
Wavelength Range
350 -1150 nm
Frame Rate
6.2 fps (4.2 MPixel Full Frame)
11.4 fps (2.1 MPixel Active Area 2048 x 1024)
18.6 fps (1.1 MPixel Active Area 2048 x 544)
32 fps (0.066 MPixel Active Area 256 x 256)
RMS noise
1000:1 (60 dB)
Minimum and Maximum
Exposure Times
0.06 to 200 ms
1. BEAMAGE-4M
1.1. INTRODUCTION
Gentec-EO introduces the new Beamage-4M. Its sleek and thin design allows the Beamage-4M to fit
between tight optical components. Its USB 3.0 connection and improved algorithm allows very fast frame
rates. The new 4.2 MPixel CMOS sensor has a large 1” optical format with a small 5.5 µm pixel pitch
allowing high resolution on large beams. Most importantly the innovative and improved PC-Beamage-4M
software is simple and intuitive to any new or expert beam profiling user.
1.2. SPECIFICATIONS
The following specifications are based on a one-year calibration cycle, an operating temperature of 18 to
28°C (64 to 82 F) and a relative humidity not exceeding 80%.
Table 1-1 List of Specifications
Page 13

Beamage Series User Manual Revision 9.0 12
External Trig
SMA connector
1.1 volts to 24 volts, the rise edge response time is 300 ns
Trigger signal pulse width: 300 ns to 230 ms
Optional SMA to BNC adaptor (202273) :
Damage Thresholds
Maximum Average Power
1 W with ND filter
Saturation Level
(1064 nm, CW, ND4)
10 W/cm
2
Saturation Level
(1064 nm, Pulsed, ND4)
300 µJ/cm
2
PC Requirements
USB Port
USB 3.0 port for optimal performance
USB 2.0 port
Operating System
Compatibility
Windows 8 (for optimal performance)
Windows 7 (for optimal performance)
Windows Vista
Average RAM Allocation
500 MB
Up to 1250 MB for 64 images in buffer
Recommended Requirement
4 Gb RAM minimum
8Gb RAM for optimal performance
Intel i series processors (i3, i5, i7) or equivalent for optimal
performance, other processors will have lower specifications.
i7 for optimal performance
Beamage-4M is a new and a high end product. It needs an equally
recent high end computer to work. Computer hardware must be from
2010 or after. No computer or parts bought before 2010 will be
supported
For Optimal Performance
Close all programs except the PC-Beamage-4M;
Keep a minimum of 1 GB RAM free when running the PC-
Beamage-4M;
Keep a minimum of 50% of free CPU power when running the
PC-Beamage-4M
Use an Image Buffer of 1
Multi Camera
Recommendations
When working with more than one camera, we strongly
recommend using one USB3.0 port per camera and a recent
high end computer for optimal performance
Internet Upgrades
Downloadable at www.gentec-eo.com/downloads
Physical Characteristics
Dimensions
61 H x 81.1W x 19.7D
Weight
138 g
Default Attenuation
ND 4.0
Page 14

Beamage Series User Manual Revision 9.0 13
Measured and Displayed Parameters
Displays
3D, 2D, XY (crosshair), Beam Tracking
Beam Diameter Definition
4 Sigma (ISO) - ISO-11146-1:2005
FWHM along crosshair (50%)
1/e2 along crosshair (13.5%)
86% effective diameter (D86)
Beam Center Definition
Centroid - ISO-11146-1:2005
First Encountered Peak
Displayed Measurements
Major Axis
Minor Axis
Effective Diameter
Ellipticity
Orientation
Centroid X and Y
Peak X and Y
Peak Saturation Level
Peak to Average Ratio X and Y
Divergence
Fitted Gaussian equations
Roughness fit along crosshairs
Gaussian fit along crosshairs
Mean Centroid Position
Azimuth
Beam Position Stability
Setup Options
Exposure Time (auto or manual)
Image Orientation (rotation and flip)
Image Averaging (temporal filter)
Active Area
Pixel Addressing
Gain
ADC Level
Magnifying Lens
Processing Option
Background Subtraction
Area Filters (triangular and flat spatial filters)
Normalized Display
Trigger
Buffer
Buffer size from 1 to 64 frames
Possibility to animate stored frames
File options
Save 1 or all images in buffer
Save in native format, text format, or binary format
Load native format files
Print report
Save 3D or 2D image in bitmap format
Save crosshairs in text format
Data Acquisition of measurements in text format and in native format
Page 15
Beamage Series User Manual Revision 9.0 14
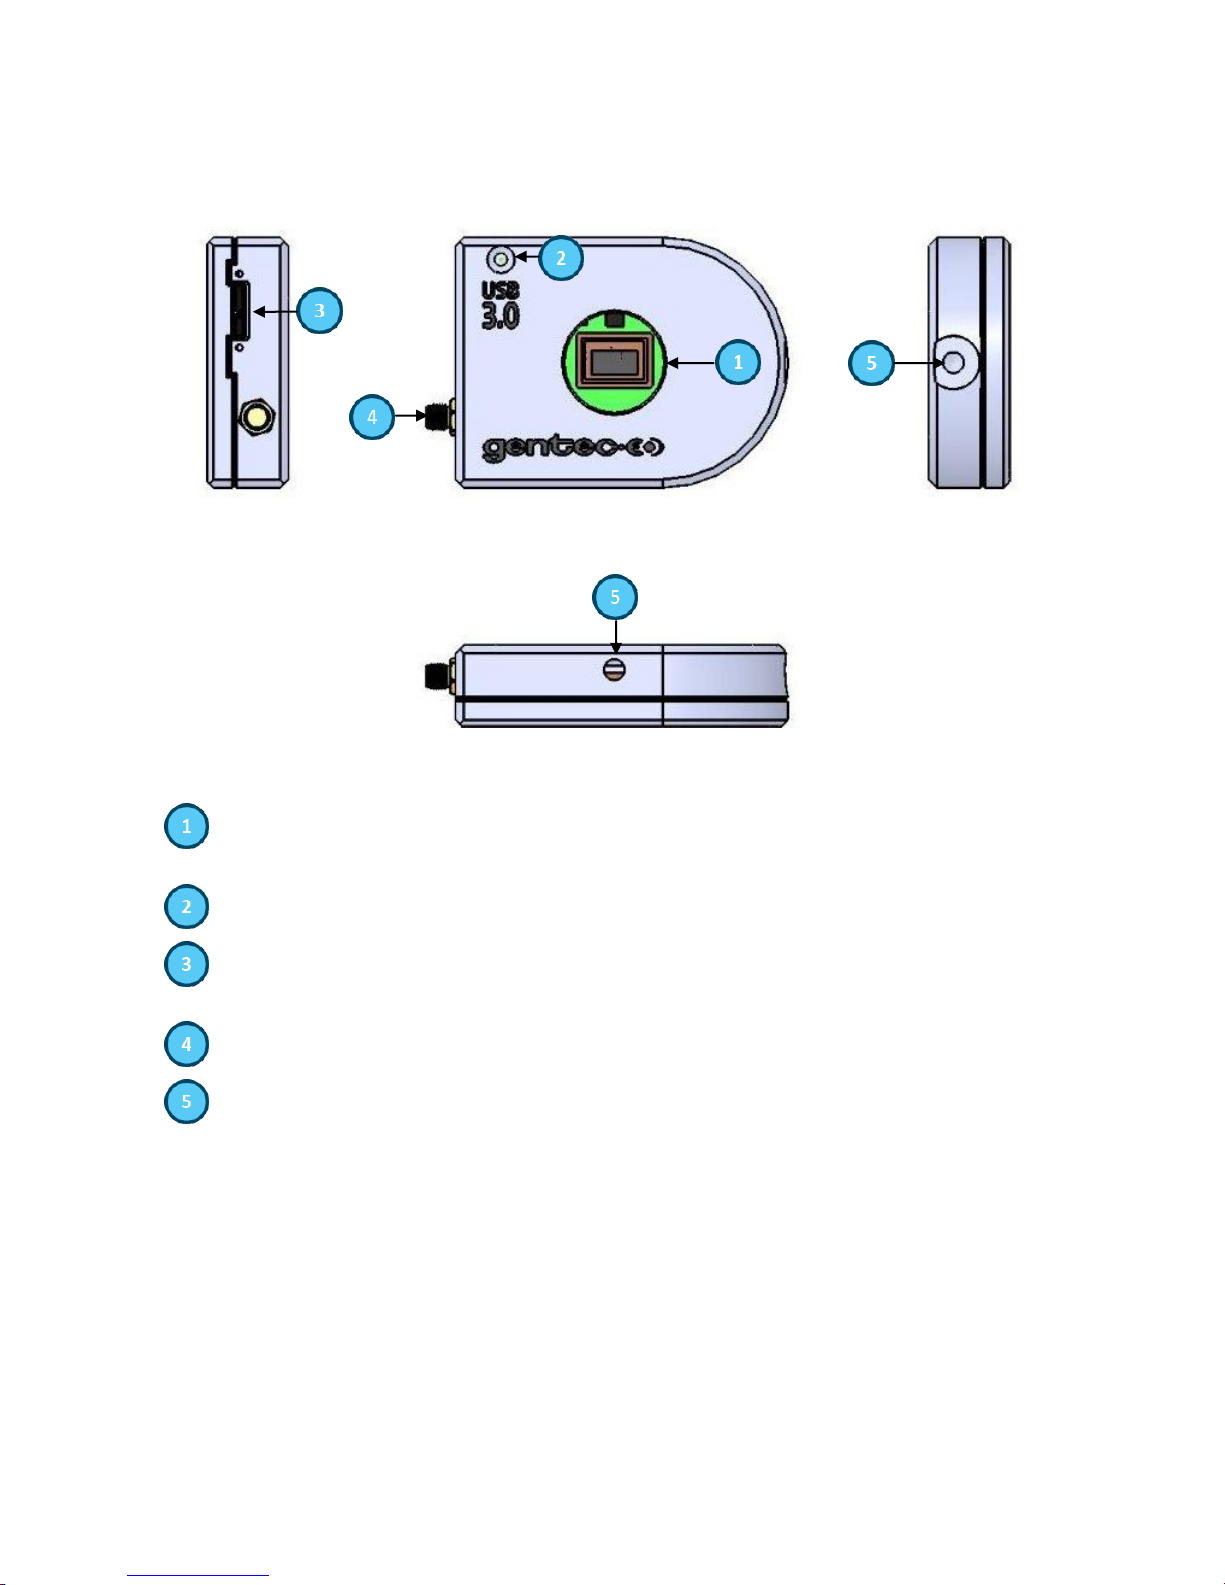
Aperture: The Beamage-3.0’s aperture and screw threads are C-MOUNT, allowing easy
connectivity with optical accessories such as attenuation filters, UV converters or lenses. The
sensor is centered with the aperture’s center.
LED Indicator: The LED indicates if the Beamage-3.0 has been detected by the computer and
if it is currently streaming.
USB 3.0 connector: The USB 3.0 connector is now more rugged with its screwable holes.
Please note that only USB 3.0 compliant cables can be used with the Beamage-3.0. USB 2.0
ports can be used, but it will lower the Beamage-3.0 speed performances.
SMA connector: The SMA connector is used to externally trigger the Beamage-3.0. A SMA to
BNC adaptor is available.
Post holes: ¼”-20 holes are aligned with the sensor’s center allowing easy optical alignment.
1.2.1. Beamage Series Mechanical Drawings
Figure 1-1 Beamage Series Front and Side Views
Page 16
Beamage Series User Manual Revision 9.0 15
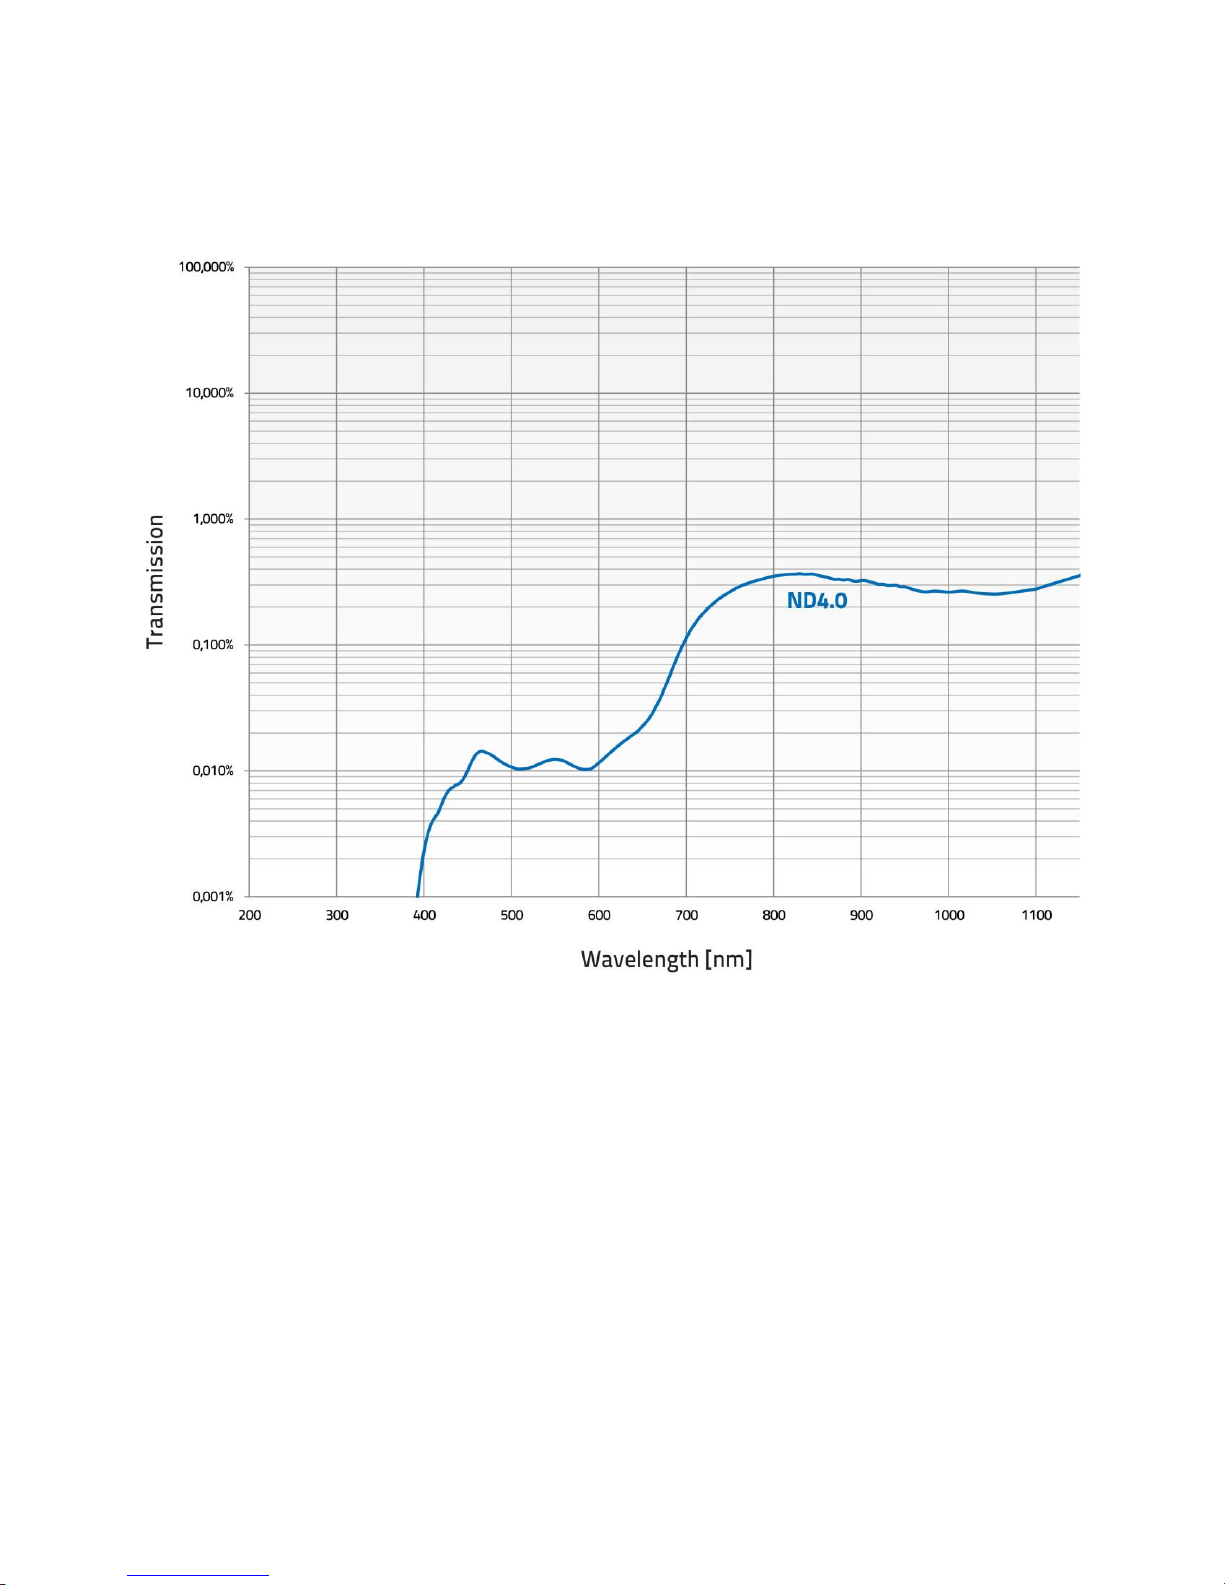
1.2.2. Sensor and Filter Spectral Responses
Figure 1-2 Attenuation Filter Transmission
Page 17
Beamage Series User Manual Revision 9.0 16
2. QUICK START PROCEDURE
These steps must be followed in the specified order.
1. Install the PC-Beamage software.
2. Install the Beamage USB driver by following the Beamage-3.0 Driver Installation Quick Guide
(refer to Appendix B). The driver must be reinstalled if a new version of software was updated;
a. If necessary, update the Beamage’s firmware, using the BeamageUpdater (refer to
Appendix C);
3. Connect the Beamage to a USB 3.0 port or USB 2.0 port. Please fix the USB connector on the
Beamage using the set screws to ensure a stable connection;
a. If multiple Beamage are used, please connect them all to the computer;
4. Start your laser and align in the Beamage aperture;
5. Start the PC-Beamage software. Select the desired Beamage from the displayed list. The green
led button in the “Main Controls” indicates that communication has been established.
a. If multiple Beamage are used, please start multiple instances of the software one by one
before selecting the desired Beamage in the appropriate instance. For example, if you
have 2 cameras, first open an instance of PC-Beamage and wait for the Beamage
Selector dialog. Then, open another instance of PC-Beamage and wait for the Bemage-
3.0 Selector dialog. Then, go back to the first instance and select the appropriate serial
number. Go back to the second instance and do the same;
6. Press “Start Capture”;
a. If multiple Beamage are used, press “Start Capture” for both PC-Beamage instances.
Page 18
Beamage Series User Manual Revision 9.0 17
7. Let the auto-exposure find the correct exposure time. This should take a few seconds. If the
exposure time is at 200 ms and your beam is under exposed, please decrease the ND filter
attenuation. If the exposure time is at 0.06 ms and the beam is saturated (maximum is white)
please increase the ND filter attenuation;
8. Click on the “Subtract Background” in the Ribbon;
9. A message box will appear. Once this message appears, block your laser beam and click “OK”;
10. Once the “Please wait” message box disappears, you can unblock your laser beam;
11. The measures will appear in the “Home” tab on the right-hand side;
12. Choose the appropriate graphic for your measurement mode on the bottom left hand-side:
a. 3D display;
b. 2D display;
c. XY display;
d. Beam tracking display.
Page 19
Beamage Series User Manual Revision 9.0 18
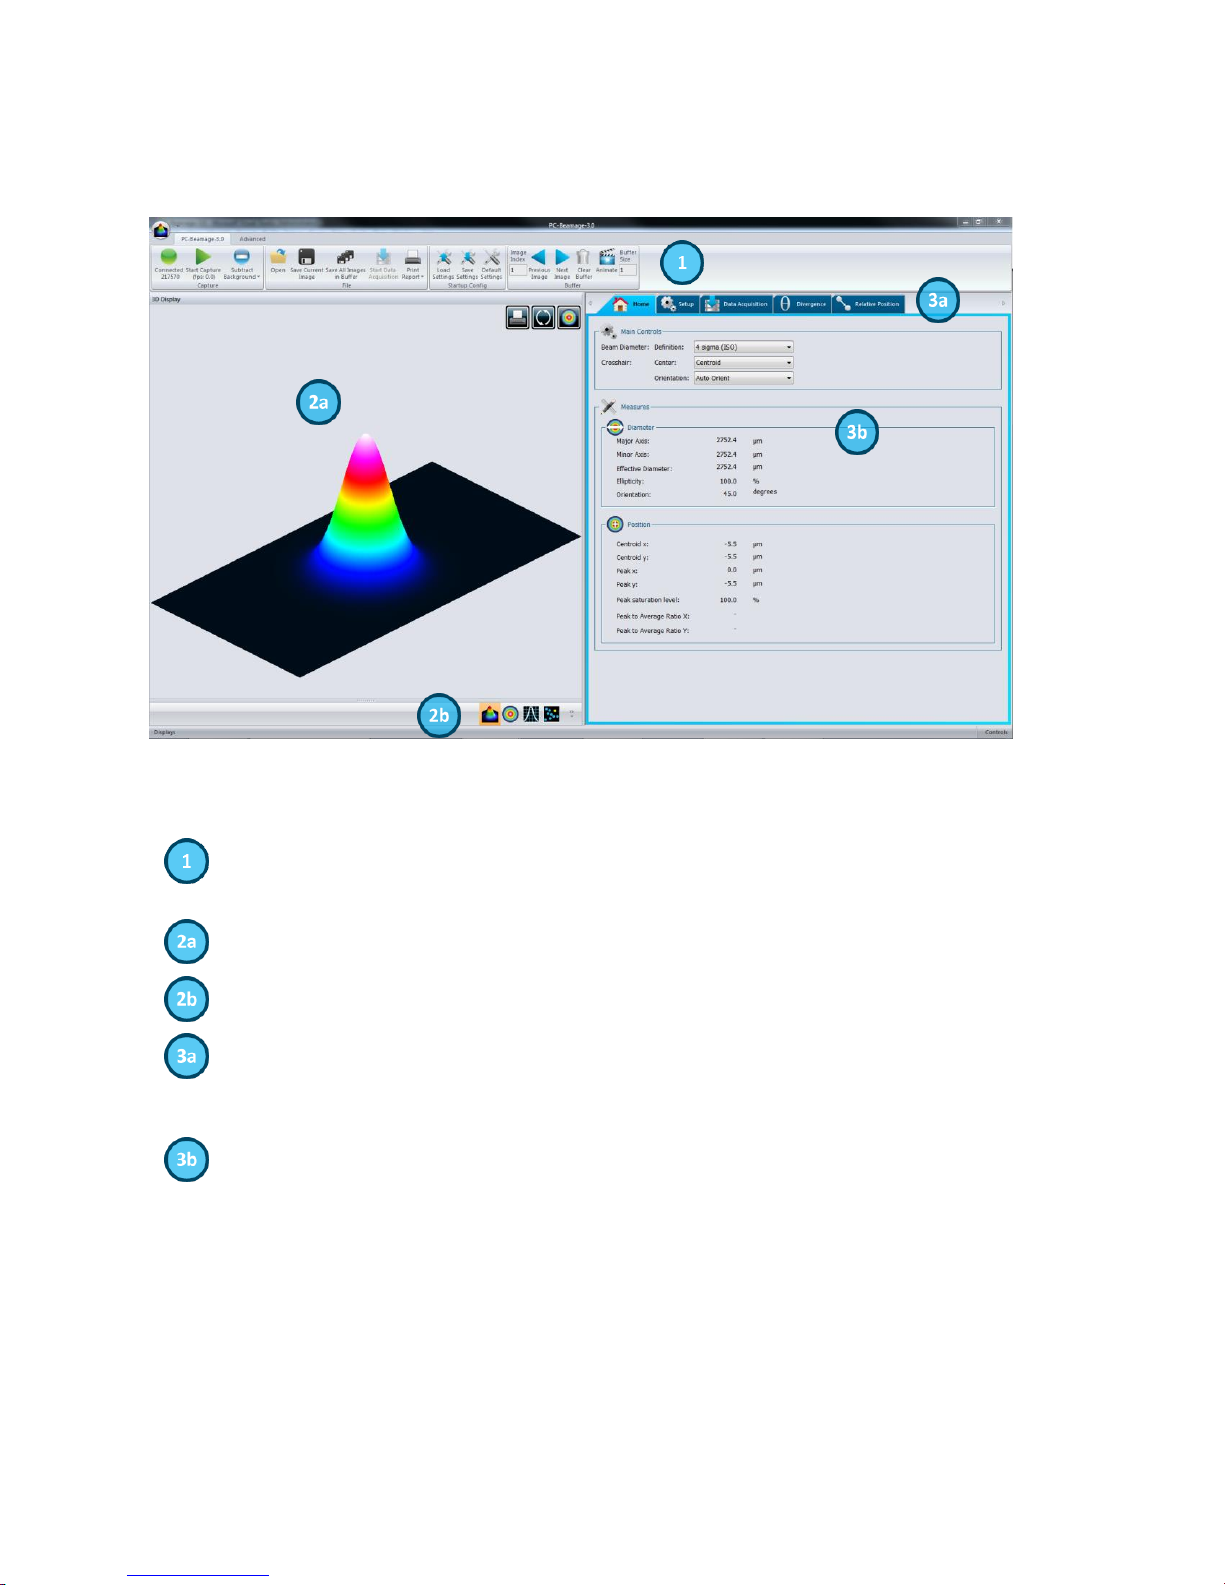
The Main Controls: The top portion of the software is in a ribbon format and includes all the
main controls. These are grouped by family, including Capture controls, File controls, Startup
Config controls, Buffer controls, Data Computation controls (which include a very useful spatial
filter and a normalizing function), M2 controls and Information controls.
Displays: The left-hand side of the software is the display panel. Three displays are available:
3D, 2D, and XY (cross-sectional graphs along the crosshairs).
Displays Selector: At any time, it is possible to change the type of display by selecting the
desired graphic (3D Display, 2D Display, XY Display).
Analysis Panel - Tab Selector: Choose between the Home, Setup or Data Acquisition panel
tab.
Analysis Panel - Controls: The right-hand side of the software contains the Home, Setup and
Data Acquisition tabs. The first tab (Home) allows the user to select the type of measurements
to be performed, it also shows the resulting measures of the beam. The second tab (Setup)
contains all the measurement parameters, such as the Exposure Time, Image Orientation,
Averaging, Active Area, and more. The third tab (Data Acquisition) lets the user specify the
desired acquisition parameters.
3. MAIN USER INTERFACE
Figure 3-1 PC-Beamage User Interface
Page 20
Beamage Series User Manual Revision 9.0 19
4. THE MAIN CONTROLS
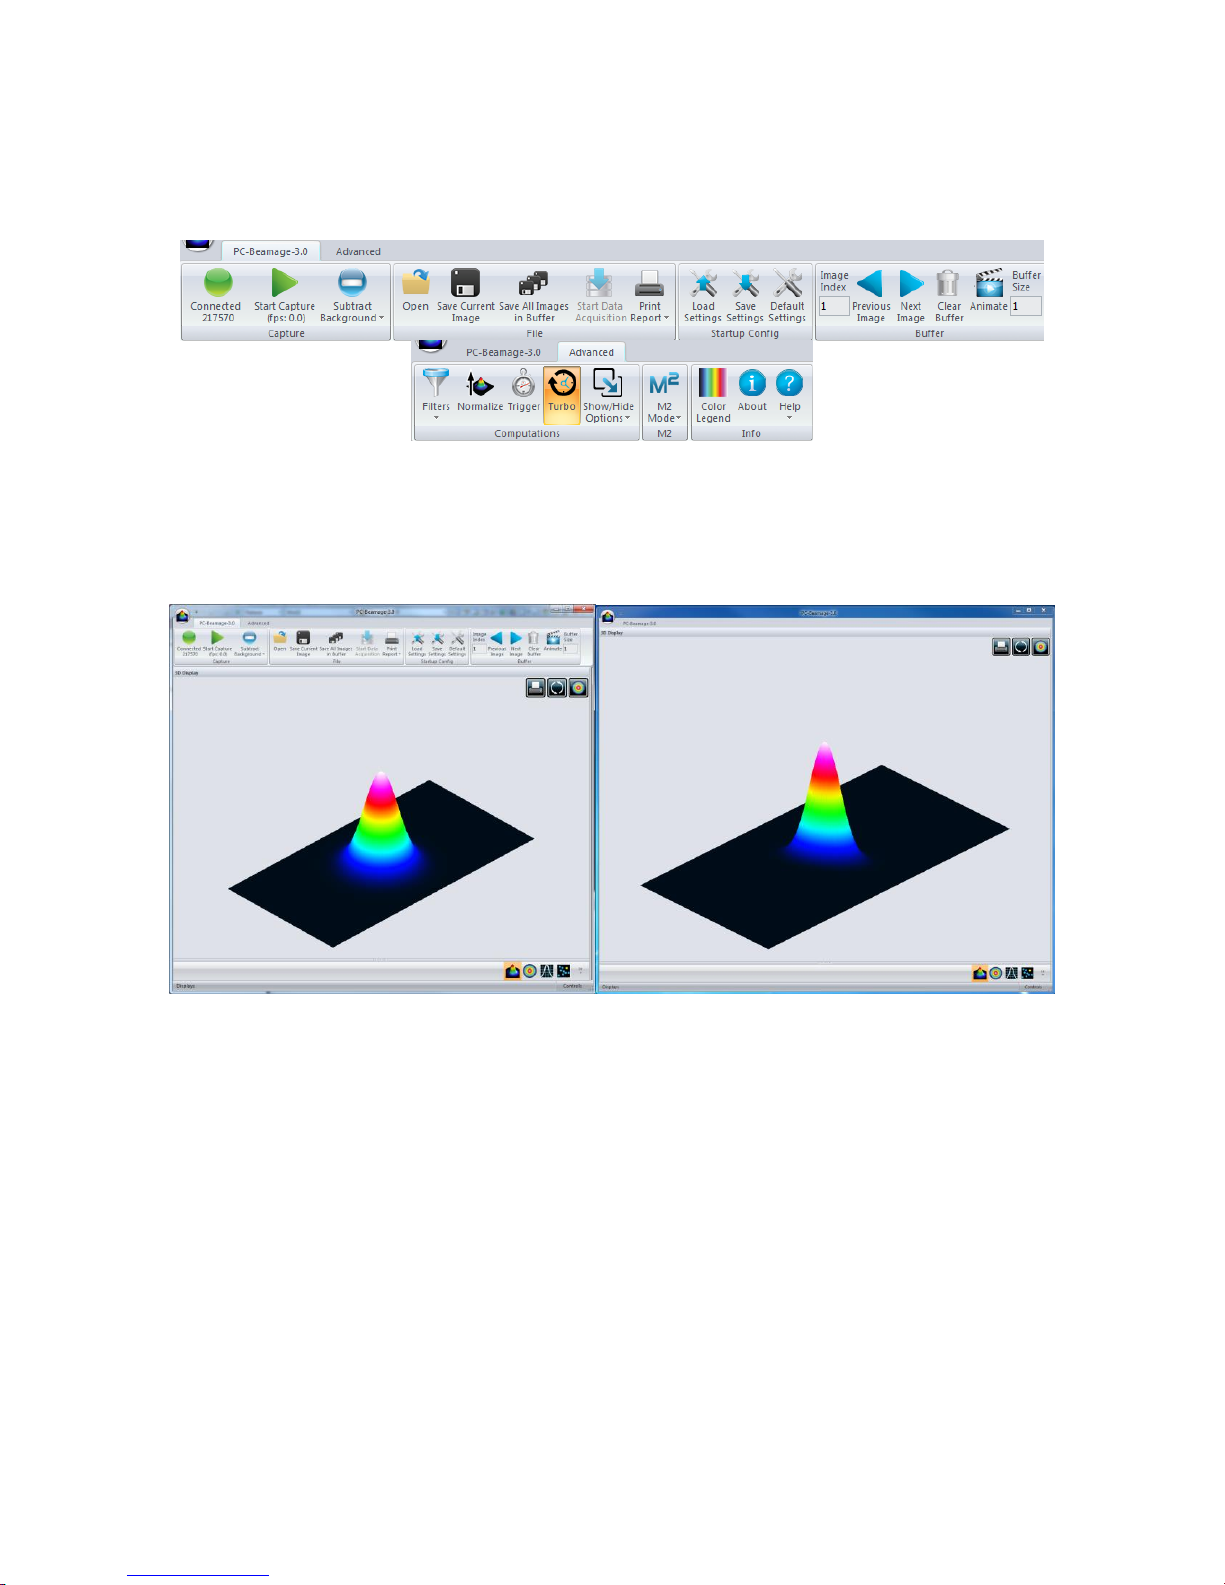
Figure 4-1 PC-Beamage Main Controls
To give more room to the graphical display and less to the ribbon, you can minimize the ribbon by rightclicking on it and choosing “Minimize the ribbon”. You can retrieve the ribbon at any time by right-clicking
on the upper portion of the window and unchecking “Minimize the ribbon”.
Figure 4-2 The PC-Beamage Interface With and Without the Main Controls Ribbon
4.1. MULTIPLE BEAMAGE MODE
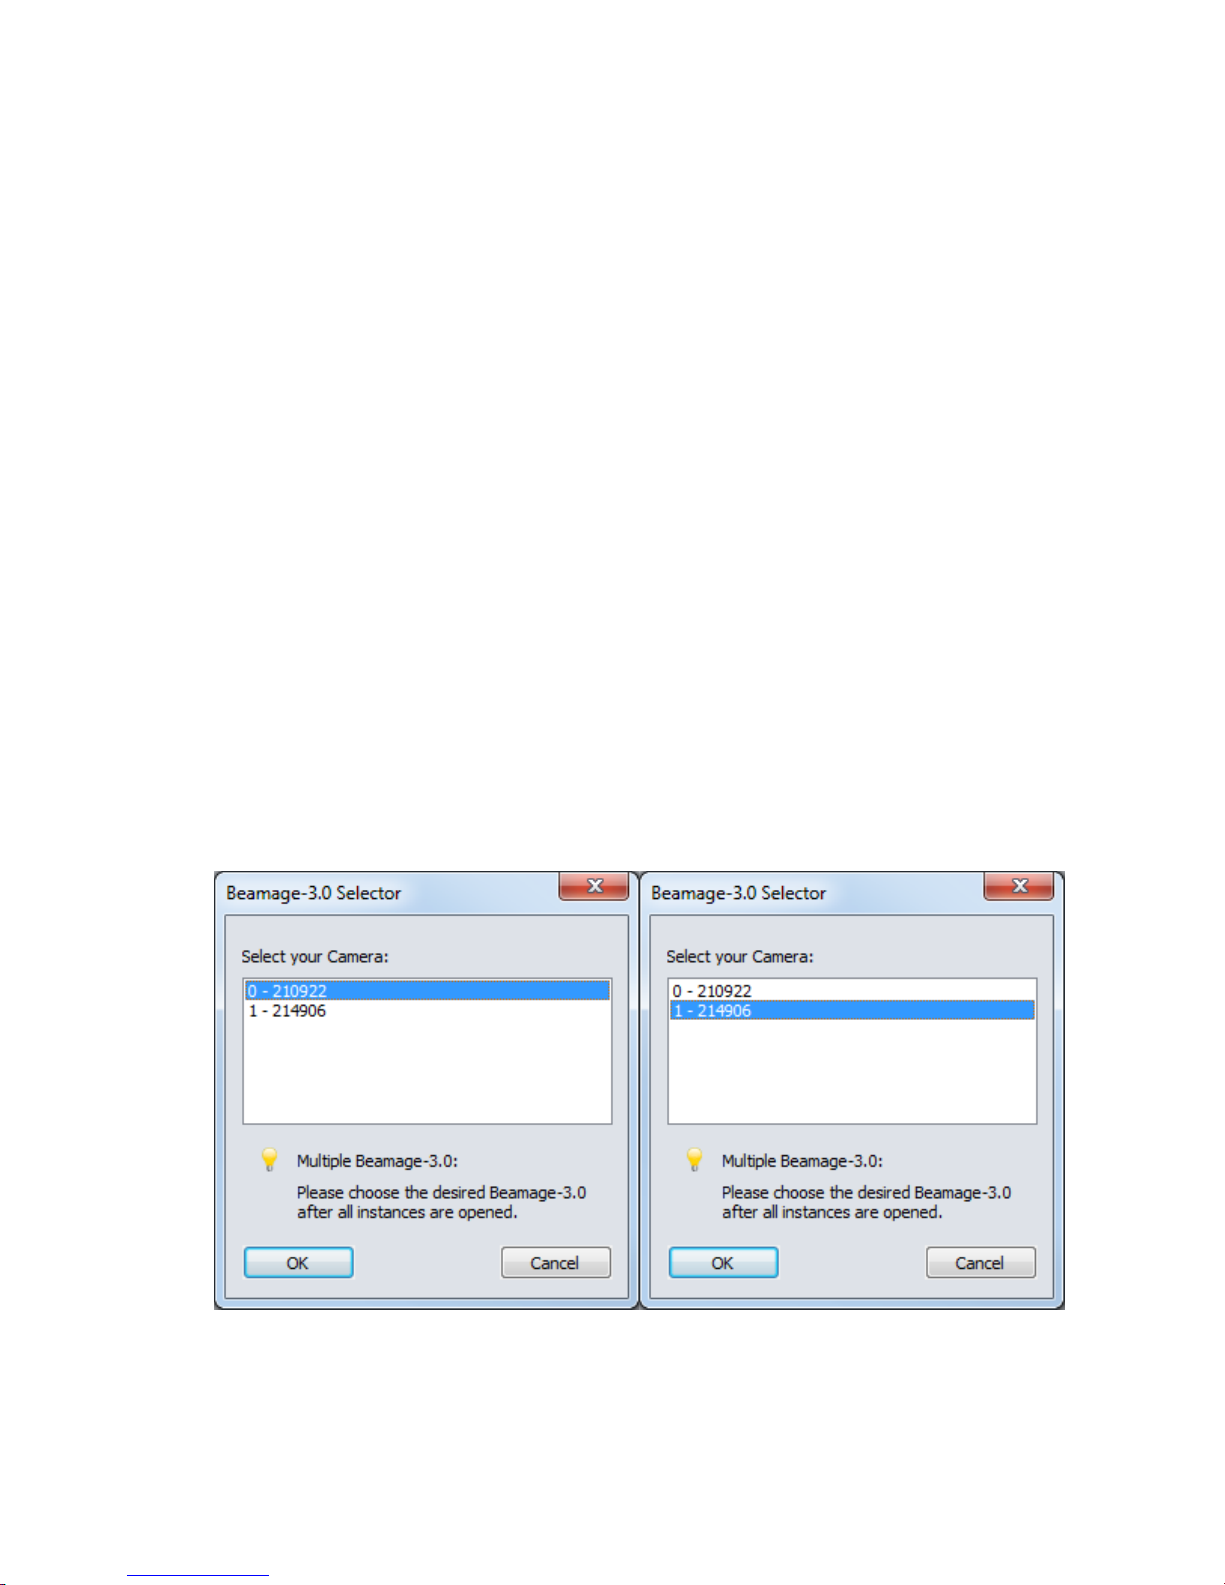
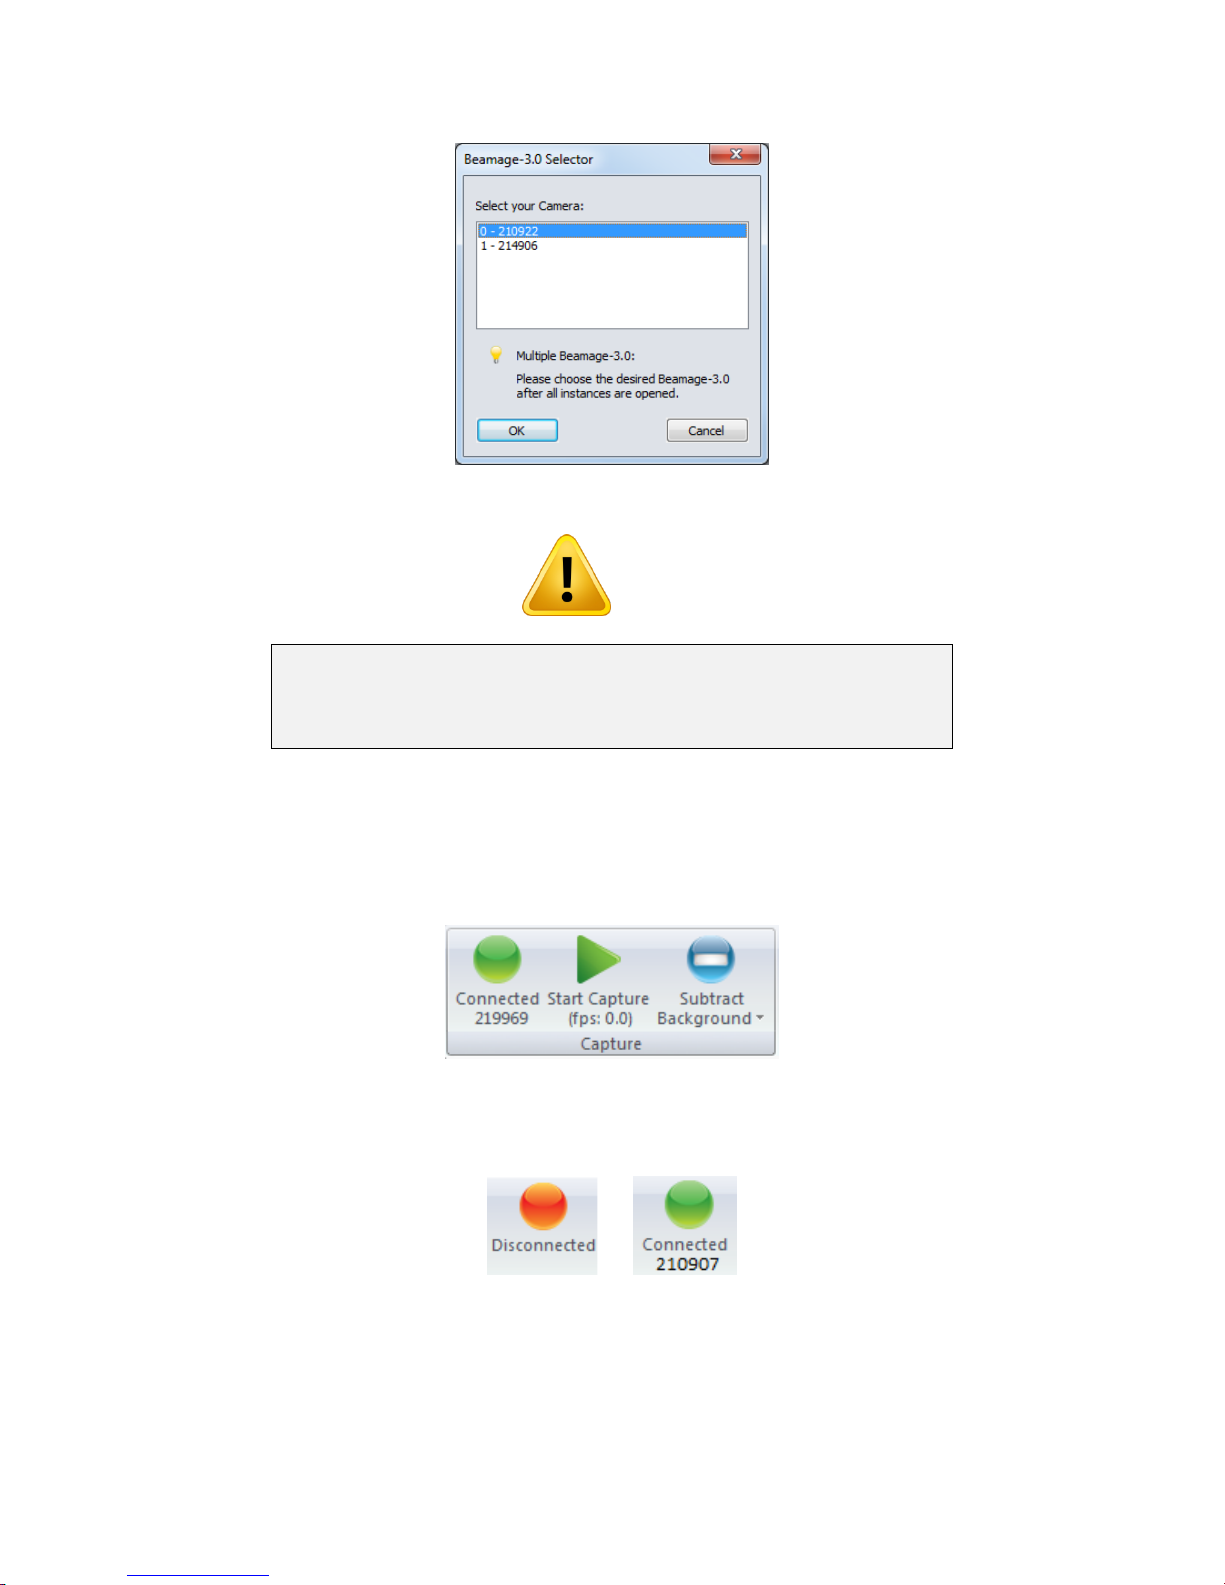
It is possible to connect multiple Beamage units to a single computer. When you start the PC-Beamage,
the following window showing all the serial numbers of the connected cameras will appear. If numerous
Beamage are connected to the computer, please select the desired camera. To connect to another
Beamage simultaneously, you must first start all desired PC-Beamage instances one by one before
selecting the desired serial number for each instance. For example, if you have 2 cameras, first open an
instance of PC-Beamage and wait for the Beamage Selector dialog. Then, open another instance of PCBeamage and wait for the Beamage Selector dialog. Then, go back to the first instance and select the
appropriate serial number. Then, go back to the second instance and do the same. You can start
streaming after all the desired Beamage units have been connected to a PC-Beamage instance.
Page 21
Beamage Series User Manual Revision 9.0 20
Multiple Beamage beam profilers can be connected to a single computer.
However, PC-Beamage is not a multiple device software so you need to
open a new instance of the program for each camera that is connected to
your computer.
Figure 4-3 Beamage Selector for Numerous Connected Beamage
Warning
4.2. CAPTURE CONTROLS
The “Capture Menu” displays the Beamage current status, controls the capture, and captures an average
detector background map.
Figure 4-4 Capture Controls
4.2.1. Camera Status
Figure 4-5 Camera Status
The software will automatically detect when a Beamage is connected to the computer and it will be
indicated in the Camera Status with a green button, while a red button indicates that there is no Beamage
connected. When the PC-Beamage is capturing an image, the status green button will flash as well as the
LED on the Beamage. Each time the Beamage’s pixels are capturing an image, the LED will be off to
Page 22
Beamage Series User Manual Revision 9.0 21
To abide by ISO-11146-3:2004 (Section 3) and have an accurate
measurement, a background subtraction must be done.
avoid parasitic lighting from the LED. Note that clicking on this button will not do anything since it is not a
control button, but rather a status indicator. It also indicates the serial number of the connected Beamage
3.0.
4.2.2. Capture Button
Figure 4-6 Capture Button
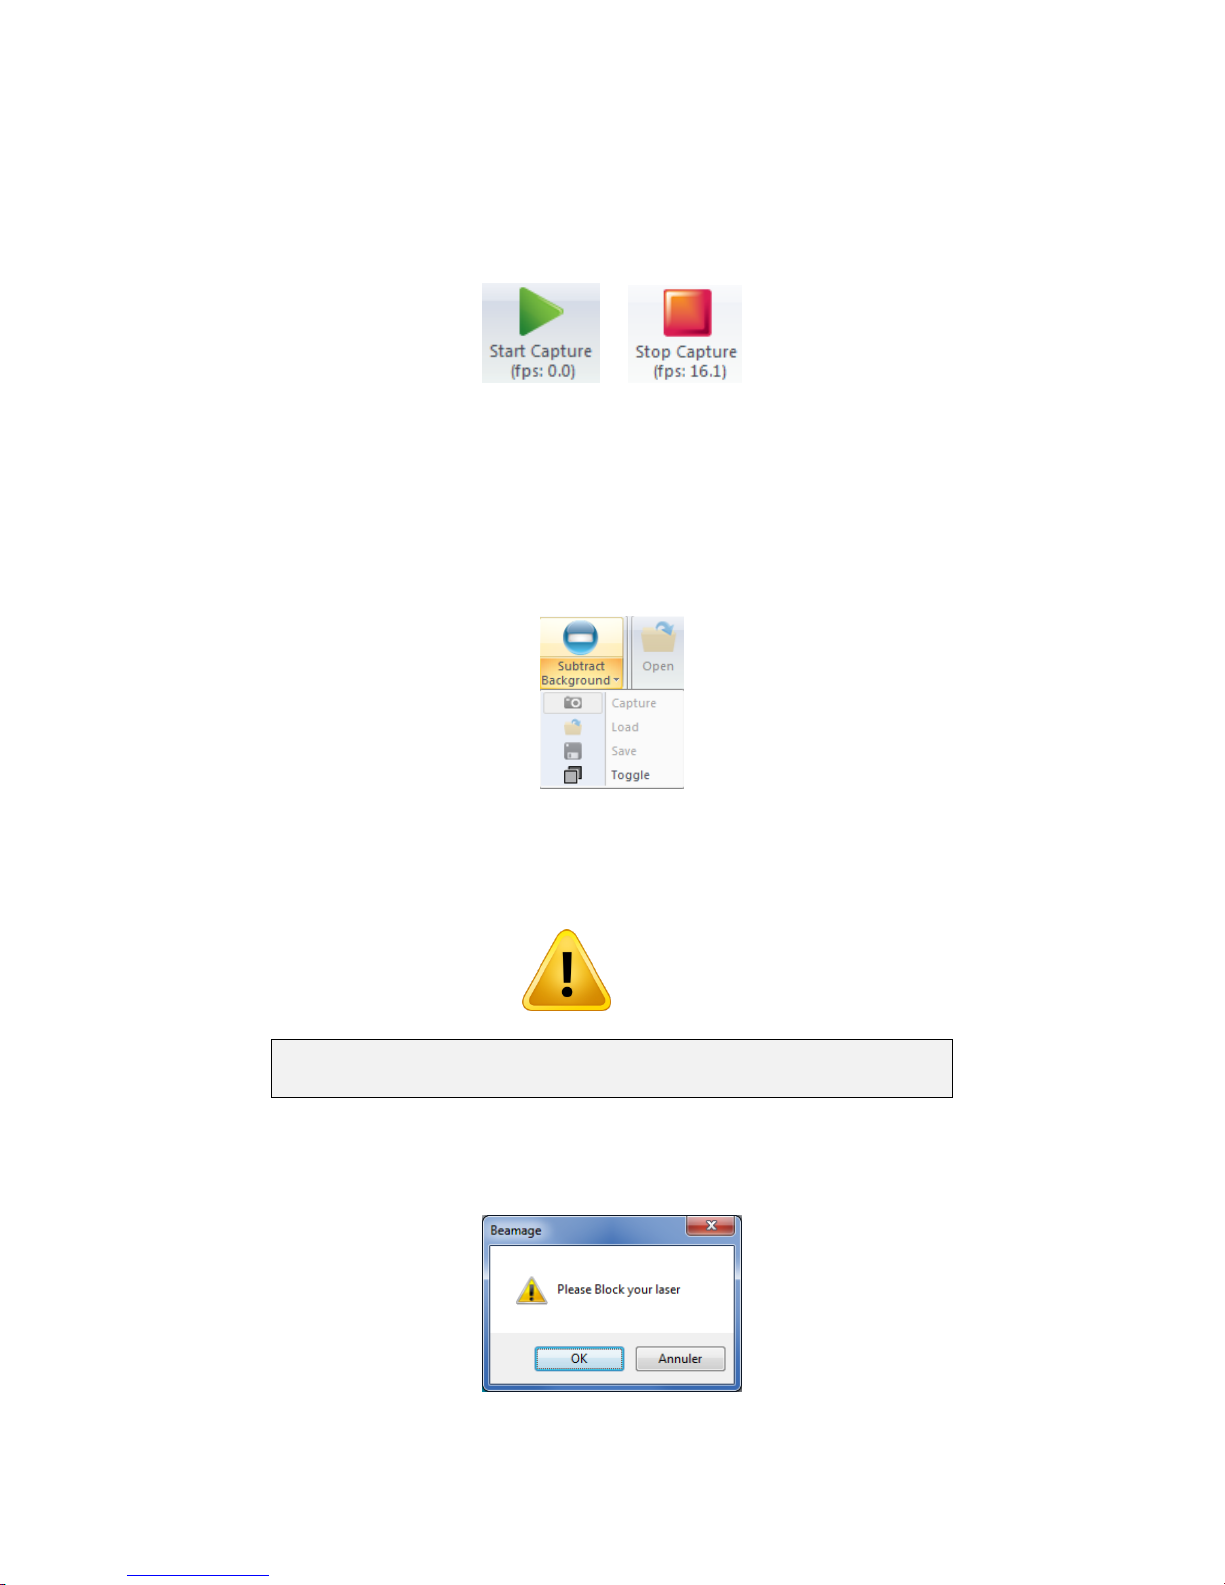
To start capturing images with the Beamage, click on the “Start Capture”. If no Beamage is connected to
the computer or if the “Animate” mode (refer to section 4.5.4) is on, this button will not be available. Once
the Beamage starts streaming, the frame rate will be displayed below the button in frames per second
(fps). This measure includes the acquisition and computation time.
4.2.3. Subtract Background Button
Figure 4-7 Subtract Background Button
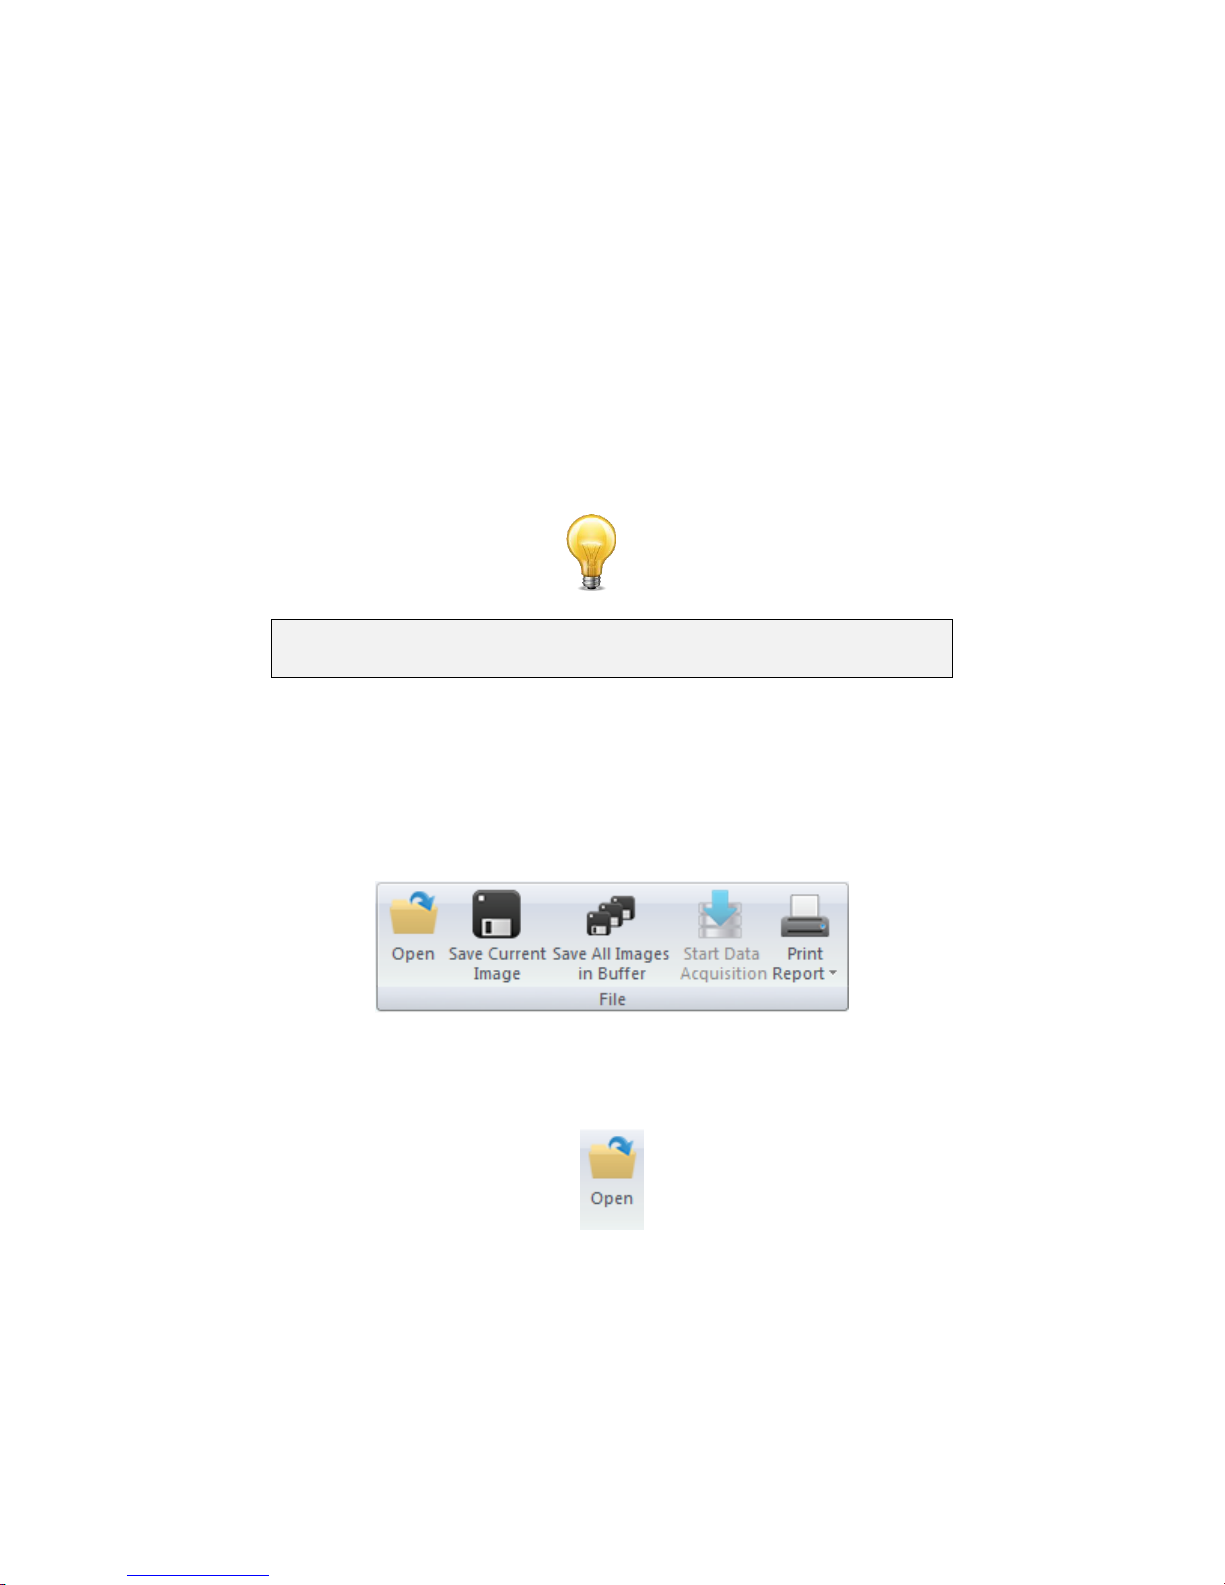
The “Subtract Background” button includes a drop down menu in its lower part. The list contains a
“Capture” button, a “Load” button, a “Save” button and a “Toggle” button.
Warning
Once you have clicked the upper part of the “Subtract Background” button or the “Capture” button in the
drop down menu, the following message box will appear:
Figure 4-8 Subtract Background Message Box
Page 23
Beamage Series User Manual Revision 9.0 22
If the Exposure Time is set to “Auto”, be sure to block your beam only
when the Message Box appears and not before.
Once this message box appears, block the beam and click on “OK”. The software will capture 10 images
and average pixel by pixel to compute the average detector background map. A “Please Wait” message
box will appear while the software is capturing the background map. The detector background map will be
subtracted from all the images that will follow. Note that once the background subtraction has been done,
the exposure time will no longer be in “Auto” mode and set to the current exposure time.
To load a background map (*.BMG file) that already exists on your computer, simply click the “Load”
button in the drop down menu and browse the file on your computer. To save your background map
(*.BMG file) on your computer, simply click the “Save” button in the drop down menu.
It is possible to toggle ON or OFF the background subtraction at any moment by simply clicking the
“Toggle” button in the drop down menu.
It is also possible to see the background. To see it, stop the capture and simply click the “Open File
Button” (section 4.3.1). The background has the same format (*.BMG file) as all Beamage images.
Tip
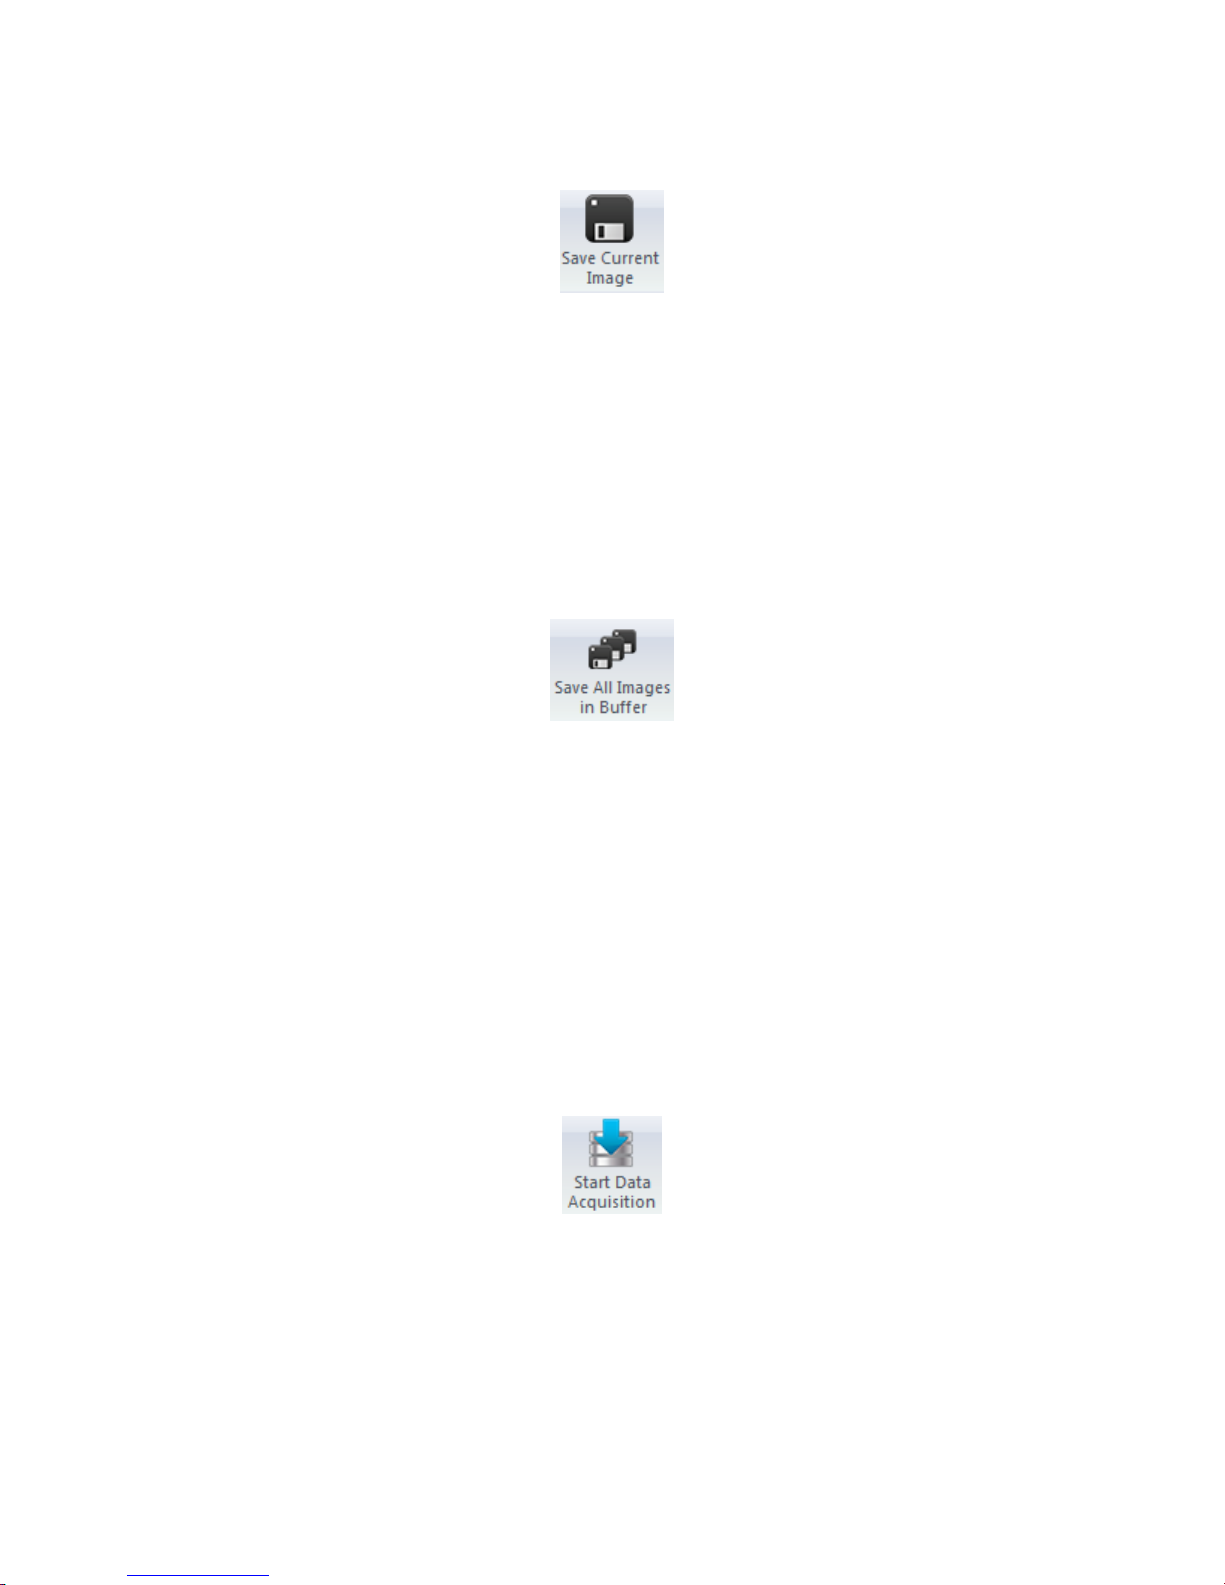
4.3. FILE CONTROLS
The “File Menu” opens and saves frames captured with the Beamage, and also prints a complete report.
These controls are not available while capturing images, except for “Start Data Acquisition” function,
which is only available while the camera is streaming.
Figure 4-9 File Controls
4.3.1. Open
Figure 4-10 Open File Button
Click on the “Open” file button to retrieve previously saved data. The PC-Beamage software will only
open native *.BMG files. The files can contain between 1 and 128 frames, depending on how the file was
created (refer to section 4.3.2 and 4.3.3). If the file was saved with multiple frames, it will be possible to
access all of them with the Buffer Control (refer to section 4.4).
Page 24
Beamage Series User Manual Revision 9.0 23
4.3.2. Save Current Image
Figure 4-11 Save Current Image Button
Click on the “Save Current Image” button to save the currently displayed image. This option will only save
1 frame. Data can be saved in native *.BMG format, in text *.TXT format or in binary *.BIN format. Note
that only the *.BMG format can be re-opened with the PC-Beamage software.
The *.TXT and the *.BIN files must be used with a compatible software. The *.TXT file saves a header
containing the measurements settings followed by the sensor’s output matrix. Every pixel output is
separated by a coma. The *.BIN file only saves the data and does not contain a header. The *.BIN file
saves data on signed 32 bit integers.
4.3.3. Save All Images in Buffer
Figure 4-12 Save All Images in Buffer Button
Click on the “Save All Images in Buffer” button to save all the frames stored in the buffer. Data can be
saved in native *.BMG format, in text *.TXT format or in binary *.BIN format. Note that only the *.BMG
format can be re-opened with the PC-Beamage software. When opening the *.BMG file, all the stored
images will be accessible via the Buffer Controls menu including all the calculated measurement values
(refer to section 4.4).
When saving in *.TXT or *.BIN file, a series of files will be saved and identified with their respective buffer
index number. The *.TXT and the *.BIN files must be used with a compatible software. The *.TXT file
saves a header containing the measurements settings followed by the sensor’s output matrix. Every pixel
output is separated by a coma. The *.BIN file only saves the data and does not contain a header. The
*.BIN file saves data on signed 32 bit integers.
4.3.4. Start Data Acquisition
Figure 4-13 Start Data Acquisition Button
Click on the “Start Data Acquisition” button to start the data logging of all the measurements displayed in
the “Home” tab. This function is only available while the camera is streaming. The acquisition parameters
can be modified in the “Data Acquisition” tab on the right-hand side of the user interface (refer to section
5.3).
Page 25
Beamage Series User Manual Revision 9.0 24
Each *.BMG file can take up to 8.50 MB on the hard drive. Acquiring
multiple frames can quickly sum up to multiple GigaBytes.
Fast acquisition should only be done on the computer’s hard drive and
cannot be done on an external drive or on a server hard drive.
It is only possible to save the beam profiling results shown in the “Home” tab (refer to section 5.3) in a
*TXT file. The *TXT file includes a header, containing the acquisition settings, followed by the data. Each
line corresponds to a single frame and all the measurements are separated by a tab. This file can be
opened in a spreadsheet software, such as Microsoft Excel.
It is also possible to save the images associated with the measurements saved in the *.TXT logging file.
Each image will be individually saved in a native *.BMG file. Each file will have the same filename as the
*.TXT file, followed by the corresponding increment.
Warning
4.3.5. Print Report
Figure 4-14 Print Report Button
Click on the “Print Report” button and choose the Default option to print a complete report of the current
measurement. To print only specific information from the current measurement, choose the Custom
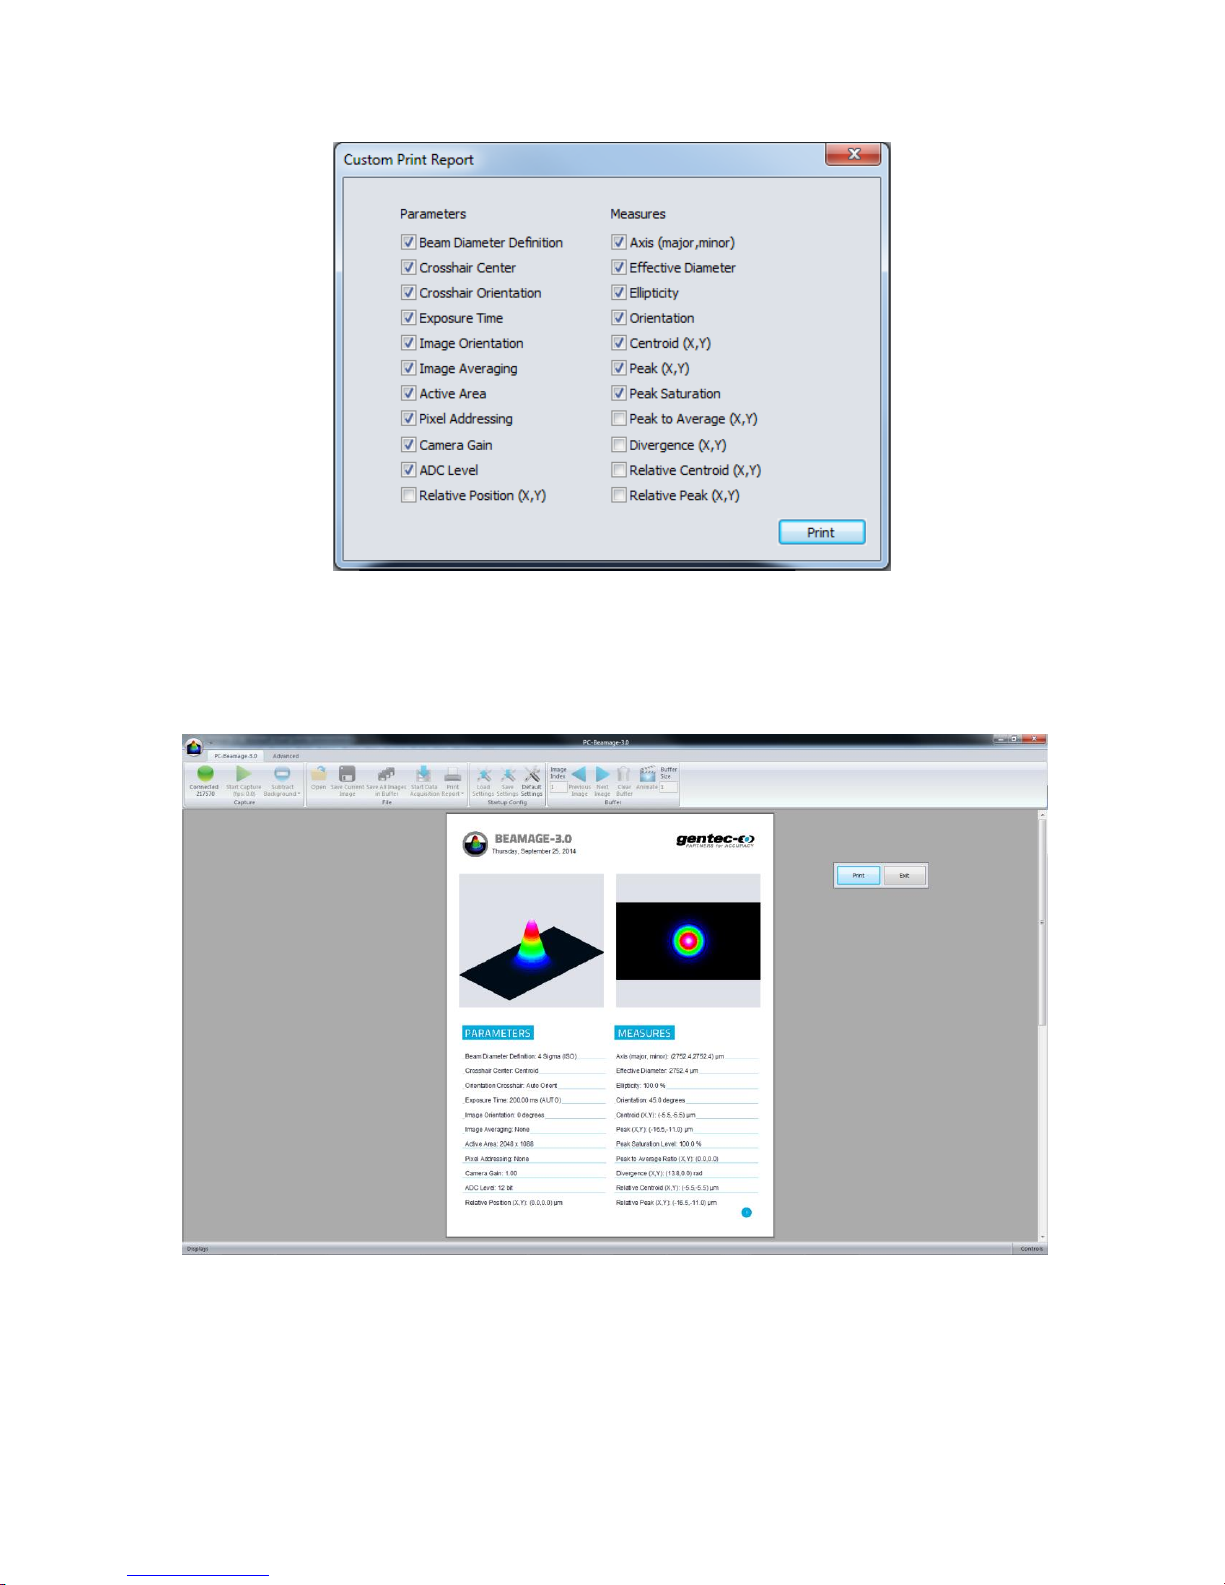
option and a dialog box will show up. Check every measurement wanted in the report and uncheck every
measurement not wanted in the report.
Page 26
Beamage Series User Manual Revision 9.0 25
Figure 4-15 Custom Print Report dialog
After choosing the default or the custom report, a print preview will appear in the PC-Beamage software.
To print the report, click “Print”. To exit without printing, click “Exit”. These buttons are located on the
right-hand side.
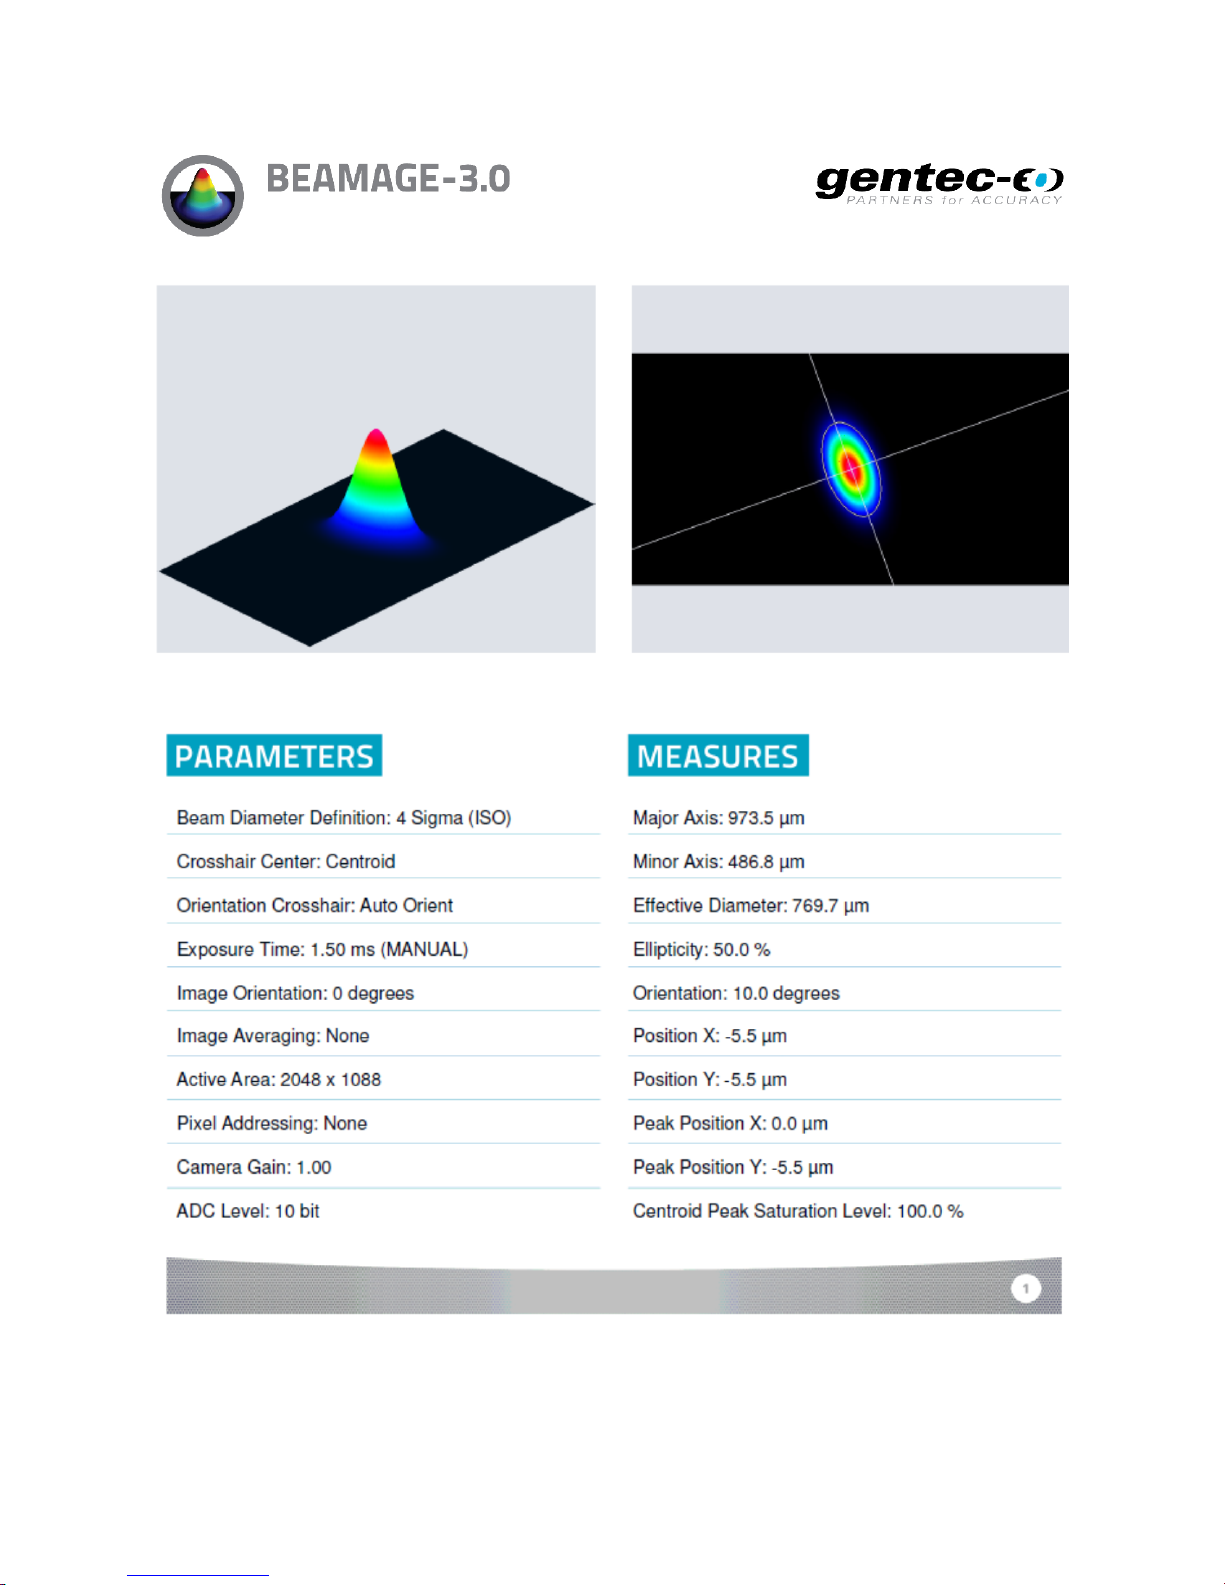
The report fits on 2 pages. The first page presents the 3D and 2D images, measurement results, and the
Beamage’s settings.
Figure 4-16 Print Report Preview
Page 27
Beamage Series User Manual Revision 9.0 26
Figure 4-17 Default Print Report Page 1
Page 28
Beamage Series User Manual Revision 9.0 27
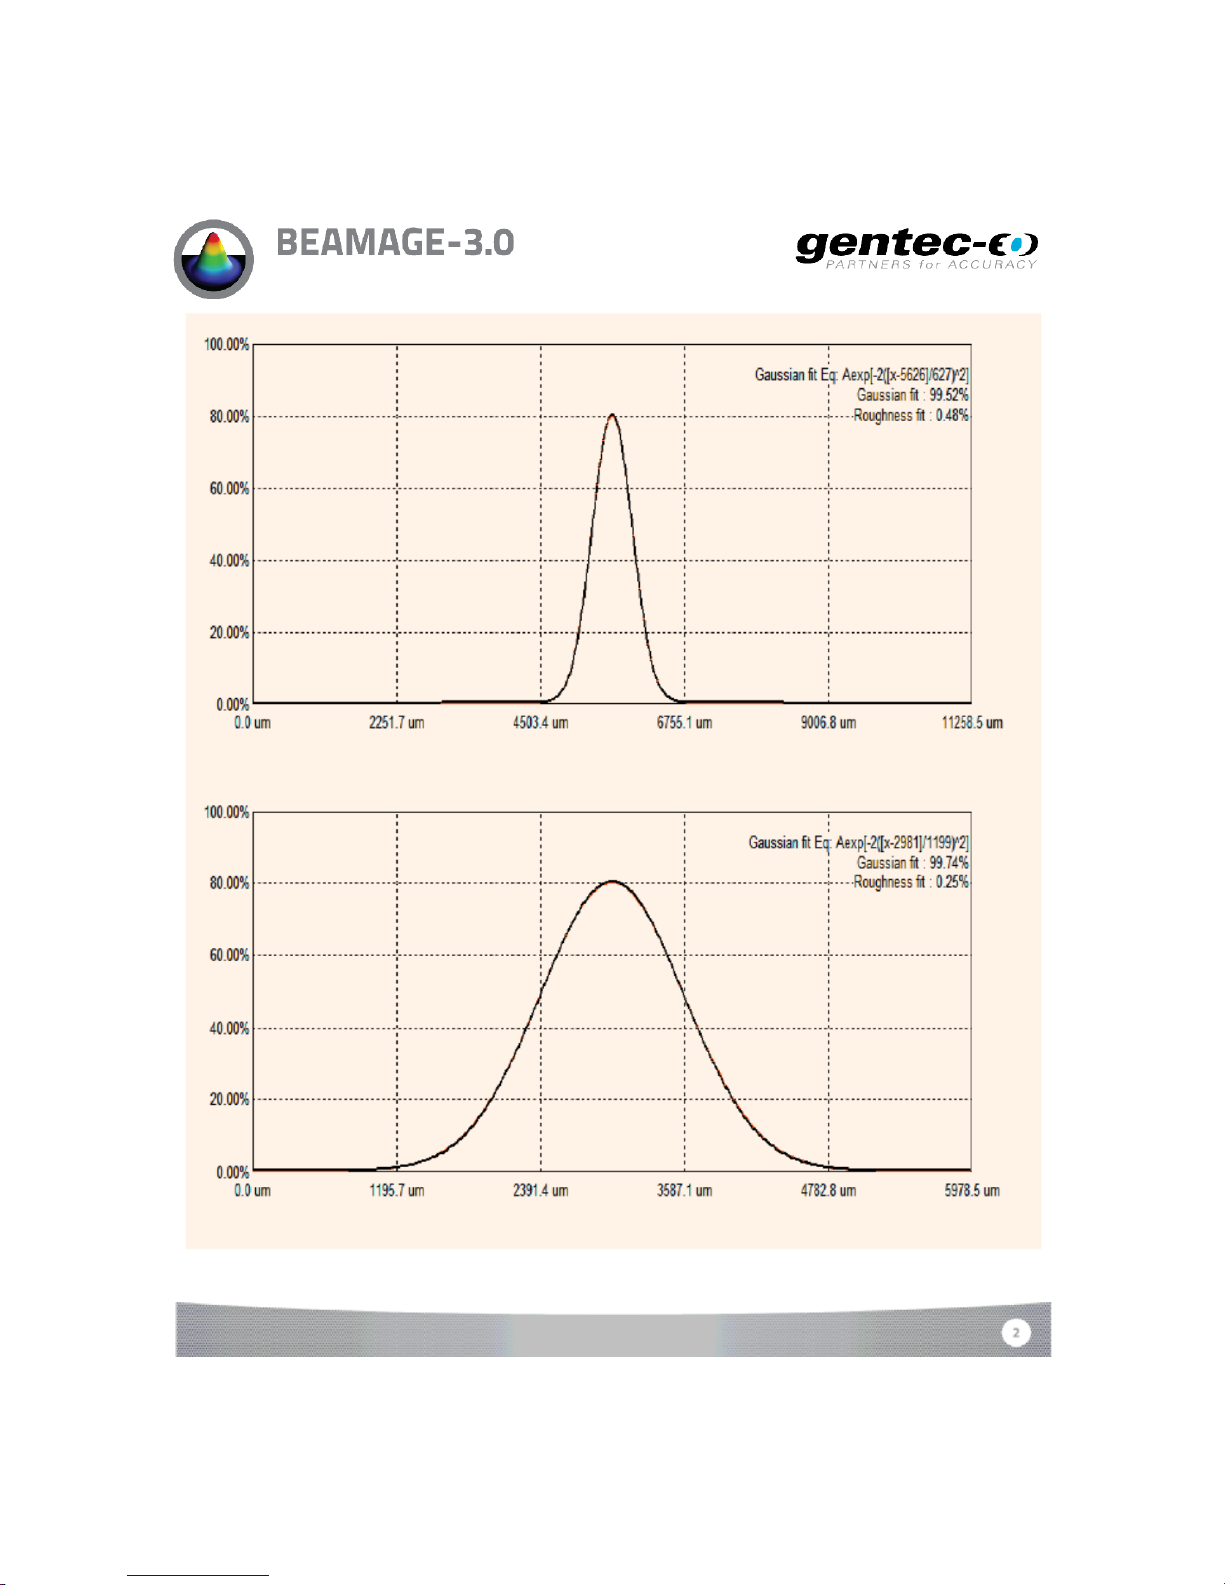
The second page prints the cross-sectional XY graphs along the crosshairs. If the “Cursor”, the “Gaussian
Fit”, “FWHM”, or the “1/e
2
” options are selected (refer to section 6.3.1), they will also appear in the report.
Figure 4-18 Default Print Report Page 2
Page 29
Beamage Series User Manual Revision 9.0 28
When closing the PC-Beamage, all current settings will be saved and will
automatically be loaded next time the PC-Beamage is opened.
Note that all images are stored in the RAM memory of your computer,
which could limit the number of images in the buffer.
4.4. STARTUP CONFIG CONTROLS
The PC-Beamage software can load, save and reset to the default factory state the software settings. The
file extension is *.geo.
Figure 4-19-Startup Config Controls
Tip
The complete list of settings saved could be finding in the annex section.
4.5. BUFFER CONTROLS
The PC-Beamage software saves the last 128 frames in the buffer. This buffer is circular, the first stored
frame is replaced by the last taken image. The buffer can store from 1 to 128 frames. By default, the
buffer size is 10.
Figure 4-20 Buffer Controls
Warning
Page 30
Beamage Series User Manual Revision 9.0 29
4.5.1. Image Index
Figure 4-21 Image Index
The “Image Index” edit box displays the current image index. When the Beamage is not streaming, it is
possible to access different frames by typing the desired image index.
4.5.2. Previous Image and Next Image
Figure 4-22 Next and Previous Image Buttons
The “Next Image” and “Previous Image” buttons access the next and previous image in the buffer.
Page 31
Beamage Series User Manual Revision 9.0 30
4.5.3. Clear Buffer
Figure 4-23 Clear Buffer Button
The “Clear Buffer” button clears the entire buffer. The captured frames will no longer be available, any
measures and graphical displays will also be erased.
4.5.4. Animate
Figure 4-24 Animate Button
Once the Beamage has captured frames in its buffer, it is possible to stream them in a playback manner.
With as much as 128 frames temporarily saved in the buffer, simply clicking the animation button will
create an animation with any display (2D, 3D, and XY). This allows to visualize the beam while working
offline and to have a recalculation process if the beam diameter definition or crosshair parameters are
changed.
4.5.5. Buffer Size
Figure 4-25 Buffer Size
The “Buffer Size” edit box displays the number of images stored in the buffer. It is possible to change the
buffer size from 1 to 128 images.
4.6. DATA COMPUTATIONS
The “Data Computations” menu filters and normalizes the current frame and enables the Beamage’s
trigger and divergence options.
Page 32
Beamage Series User Manual Revision 9.0 31
If an image is saved while it is in “Filter” mode, the resulting filtered image
will be saved
Figure 4-26 Data Computations
4.6.1. Filters
Figure 4-27 Filters Button
Figure 4-28 Available Filters
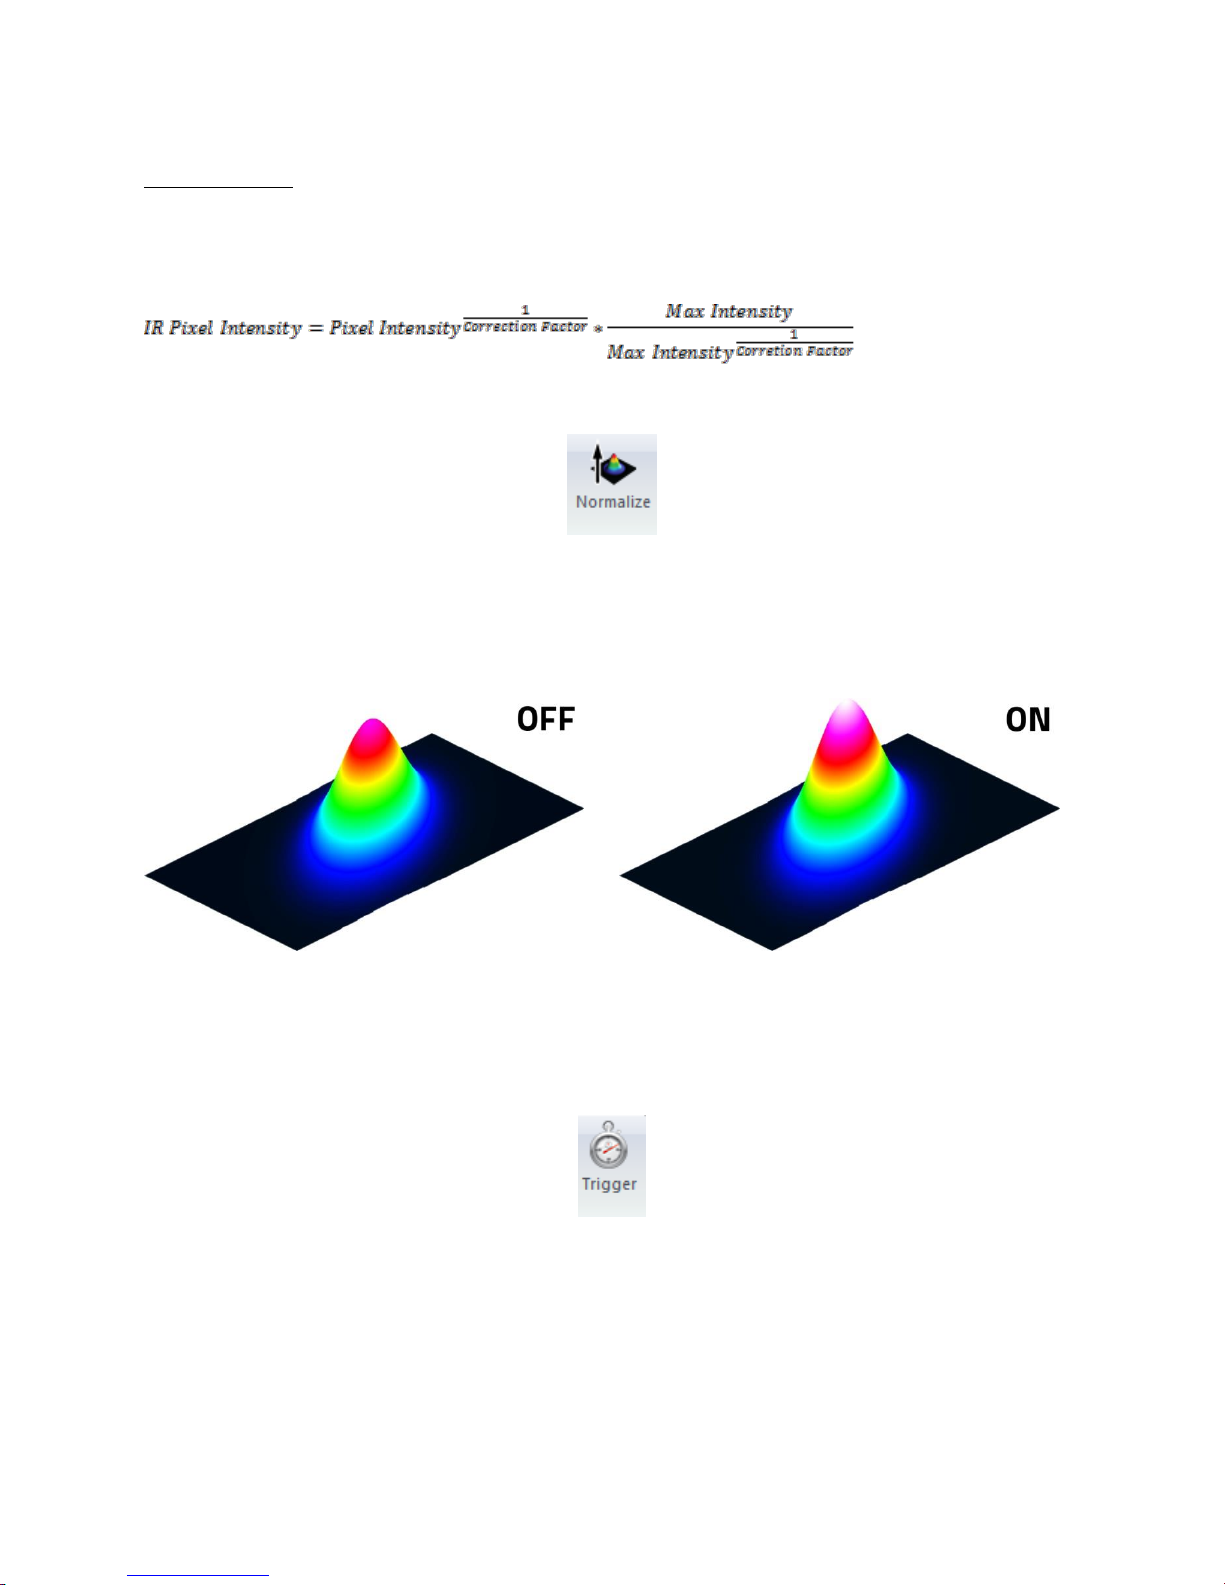
The “Filters” button opens a drop-down menu. Two spatial filters are available: “Smoothing” and
“Despeckle”. These tools are great with low quality laser or low level signals. Note that the “Despeckel”
filter is more “aggressive” than the “Smoothing” filter, which makes it ideal for very poor quality beams.
Figure 4-29 Spatial Filter Example
Warning
Smoothing Filter
The “Smoothing” filter performs a 3x3 mask triangular filter. The center pixel has a higher weight (3/11)
than the surrounding pixels (1/11). If the filtered pixel is on the edge, it will set the surrounding pixels
outside the image to 0.
Despeckle Filter
The “Despeckle” filter uses a 9x9 mask flat filter to perform a simple averaging of the central pixel. All
pixels have the same weight (1/81). If the filtered image is on the edge, the surrounding pixels outside the
image will be set to 0.
Page 33
Beamage Series User Manual Revision 9.0 32
IR Sensors Filter
The “Filters” button also contains the “IR Sensors” correction factor. With a Beamage-3.0-IR camera, this
filter must be activated. Then, a correction factor is applied to the intensity of each pixel, according to the
following correction formula:
4.6.2. Normalize
Figure 4-30 Normalize Button
The “Normalize” button will spread the graph’s (3D, 2D, and XY) intensity over the full range (0% to
100%). Note that only the displays are normalized, the normalization does not affect the centroid and
diameter computations.
4.6.3. Trigger
The “Trigger” button enables the camera to capture images only when an electric signal is sent to the
Beamage via the SMA connector. This can synchronize the system’s capture rate with a pulsed laser
source. A SMA to BNC adaptor is provided (202273). The input trigger signal can be from 1.1 volts to
24 volts. The rise edge response time is 300 ns. The pulse width of the trigger signal must be between
300 ns and 230 ms.
Figure 4-31 Normalization Example
Figure 4-32 Trigger Button
Page 34
Beamage Series User Manual Revision 9.0 33
SMA Connector
Figure 4-33 SMA Connector for Trigger Input
4.6.4. Turbo
Figure 4-34 Turbo Button
The “Turbo” button modifies the flow of data between the Beamage camera and the computer. By default,
the turbo mode is activated when the application starts, assuming the user has a computer that works
with the latest generation of USB 3.0 technology. If the streaming stops and error messages appear while
running, the user is working with a computer that cannot handle such a flow of data. Simply click on the
icon to deactivate or activate the Turbo mode.
4.6.5. Show/Hide Options
Figure 4-35 Show/Hide Options Button
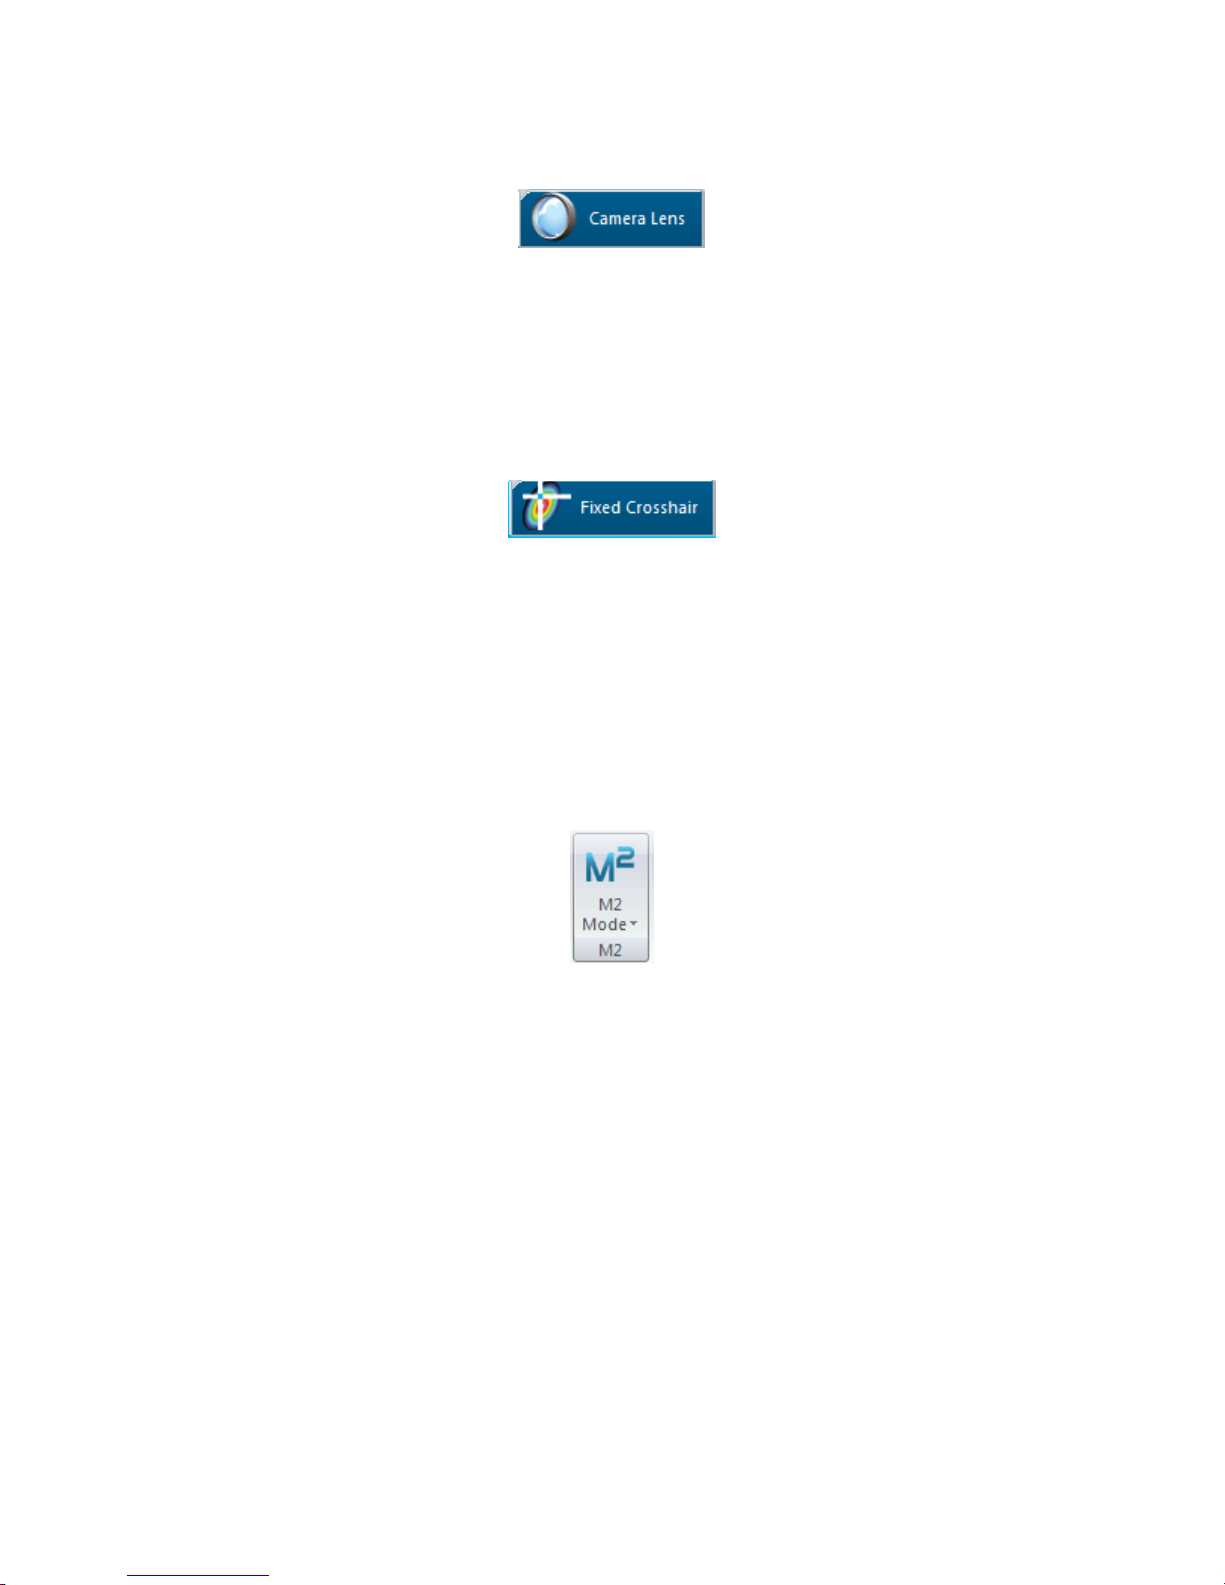
The “Show/Hide Options” button will show or hide the “Divergence”, the “Relative Position”, “Camera Lens
Calibration” and “Fixed Crosshair” panels beside the “Data Acquisition” tab. By clicking on “Show All’ or
“Hide All”, one can show or hide both tabs at the same time. The “Start LabVIEW Pipeline” button will
open the communication channel between the PC-Beamage and the LabVIEW driver. Please refer to
section 7 for more information about this function.
Page 35
Beamage Series User Manual Revision 9.0 34
The Beamage sensor must be placed precisely at the focal point, not at
the beam waist.
Figure 4-36 Show/Hide Options
4.6.5.1. Divergence
Figure 4-37 Divergence Button
The “Divergence” button activates a new tab on the right-hand side of the user interface. It contains all the
settings and results relative to the beam divergence (refer to section 5.4). To compute the divergence and
abide by the ISO-11146-1:2005 standard, the first step is to place an aberration-free lens between the
Beamage and the laser. The lens should be placed in the far-field of the laser beam while the Beamage
should be at the focal point of the lens. The second step is to enter the focal length of the lens in the
software. Since the focal length is wavelength dependent, make sure to use the correct value for your
laser in the settings. The divergence in both main axes (x and y) are computed as defined by the ISO11146-1:2005 and ISO-11146-2:2005 standards and displayed at the bottom of the “Divergence” tab.
Warning
4.6.5.2. Relative Position
Figure 4-38 Relative Position Panel
The “Relative Position” panel activates a new tab on the right-hand side of the user interface. It contains
all the settings and results relative to the origin position. This tool allows you to easily align a laser to any
desired position. Please refer to section 5.5 for more information about this functionality.
Page 36
Beamage Series User Manual Revision 9.0 35
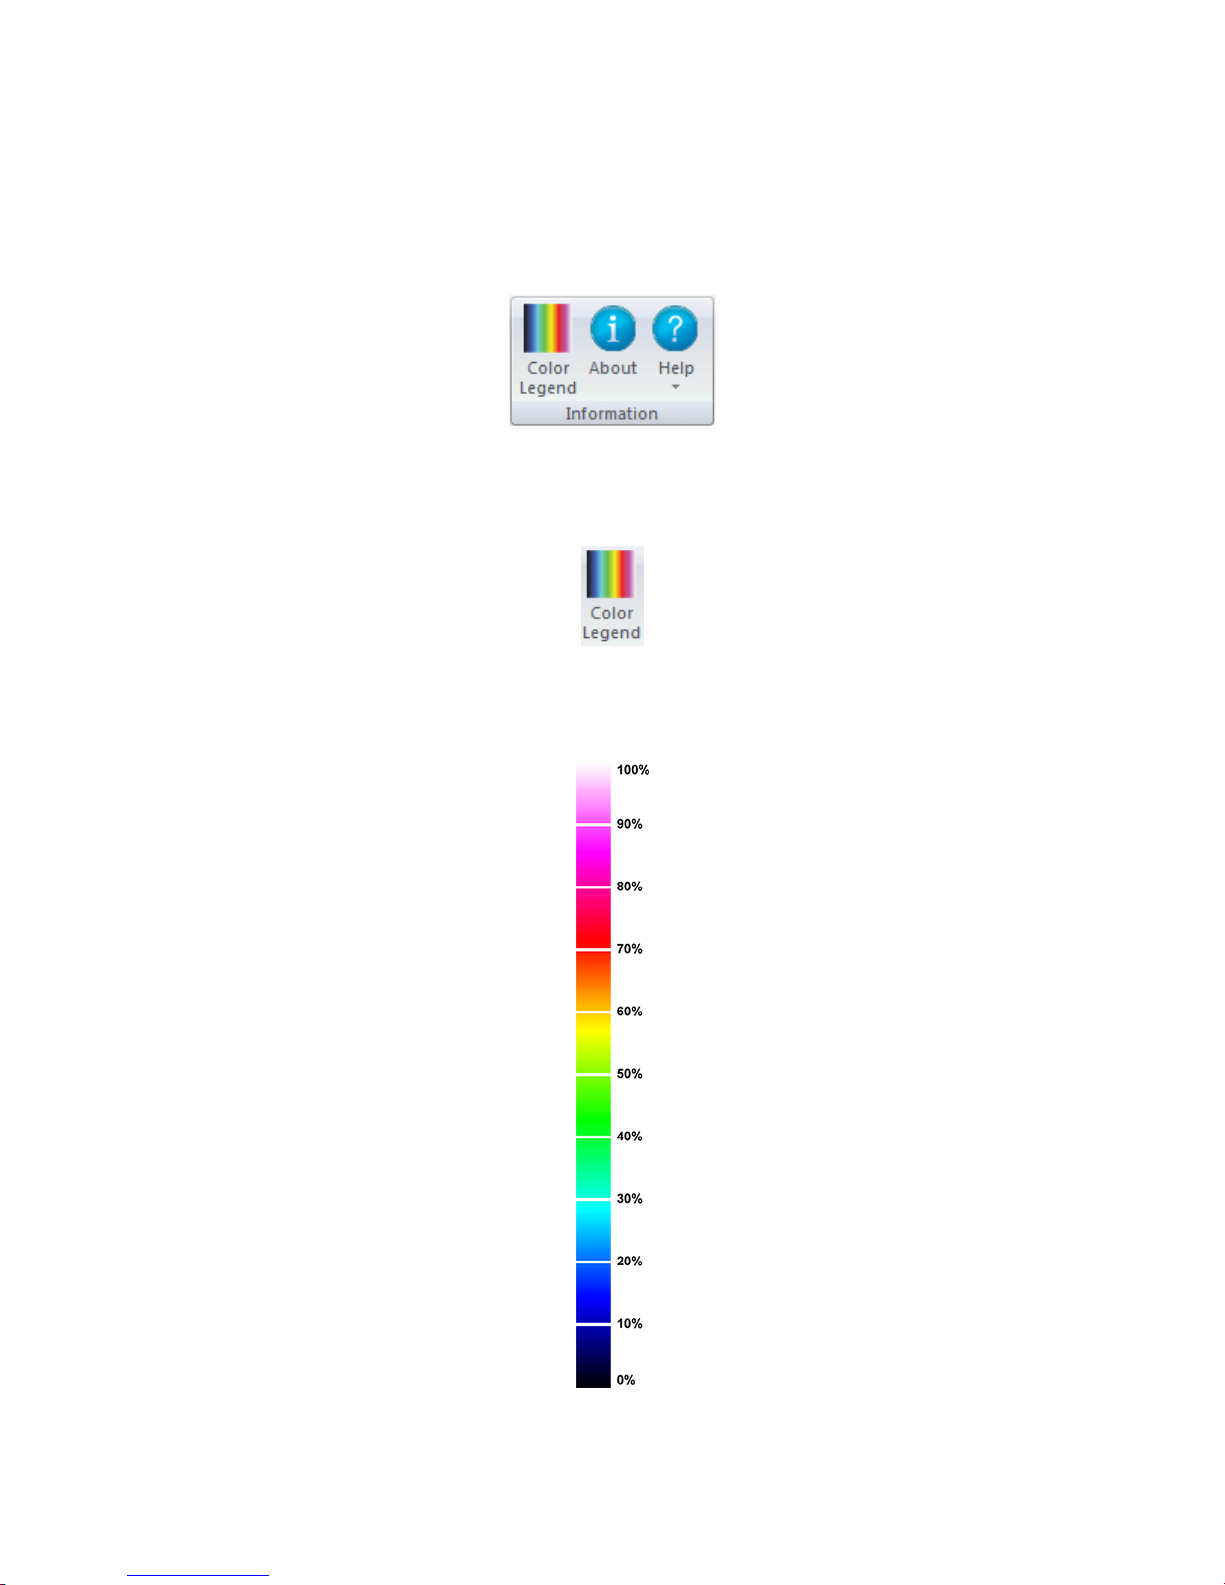
4.6.5.3. Camera Lens Calibration
Figure 4-39 Camera Lens Calibration Panel
The “Camera Lens Calibration” panel activates a new tab on the right-hand side of the user interface. It
contains the procedure relative to the camera lens calibration. This tool allows you to easily calibrate a
system that contains a magnifying lens. Please refer to section 5.6 for more information about this
function.
4.6.5.4. Fixed Crosshair
Figure 4-40 Fixed Crosshair Panel
The “Fixed Crosshair Panel” panel activates a new tab on the right-hand side of the user interface. It
contains the settings relative to the fixed crosshair. This tool allows you to easily fix and see the crosshair
at a precise position on the sensor, and also to adjust the crosshair’s orientation. Please refer to section
5.7 for more information about this function.
4.7. BEAMAGE-M2 MODE
Figure 4-41 Show/Hide M2 Mode Button
The M2 mode activates the M2 measurement functions of PC-Beamage software when using the
Beamage-M2 accessory. For more information on how to use this mode, please refer to the Beamage-M2
manual which can be found in the Help section (refer to 4.8.3).
The M2 factor can be considered as a quantitative indicator of laser beam quality. In terms of propagation,
it is an indicator of closeness to an ideal Gaussian beam at the same wavelength. Paired with a
Beamage-3.0 beam profiling camera, the Beamage-M2 module can provide Real-Time M2 measurements
directly in the PC-Beamage software. The calculations are based on the second order spatial moments
and therefore are fully compliant to the ISO 11146 and 13694 standards.
Unlike other M2 measurement systems, the Beamage-M2 can measure the propagation parameters of a
laser beam without the need of any moving part or an external power supply, providing calculation of the
M2 factor in less than a second. This condition allows the possibility to do on-line monitoring. Its modular
design allows users who only want to measure the energy or intensity spatial profile of their beam to
remove the Beamage-3.0 from the M2 module and use it as a simple beam profiler.
Page 37
Beamage Series User Manual Revision 9.0 36
4.8. SOFTWARE INFO
The “Information Menu” displays important and useful information about the Beamage and provides help.
Figure 4-42 Software Info
4.8.1. Color Legend
Figure 4-43 Color Legend Button
The “Color Legend” button shows the colors corresponding to the 3D and 2D display intensity levels.
Figure 4-44 Color Legend
Page 38
Beamage Series User Manual Revision 9.0 37
You can also obtain the latest PC-Beamage software version on our
website at www.gentec-eo.com/downloads
The help file is in PDF format. A PDF reader needs to be installed on your
computer to open the file.
4.8.2. About
Figure 4-45 About Button
To learn more about the PC-Beamage software, camera and sensor, click the “About” Button.
Tip
4.8.3. Help
Figure 4-46 Help Button
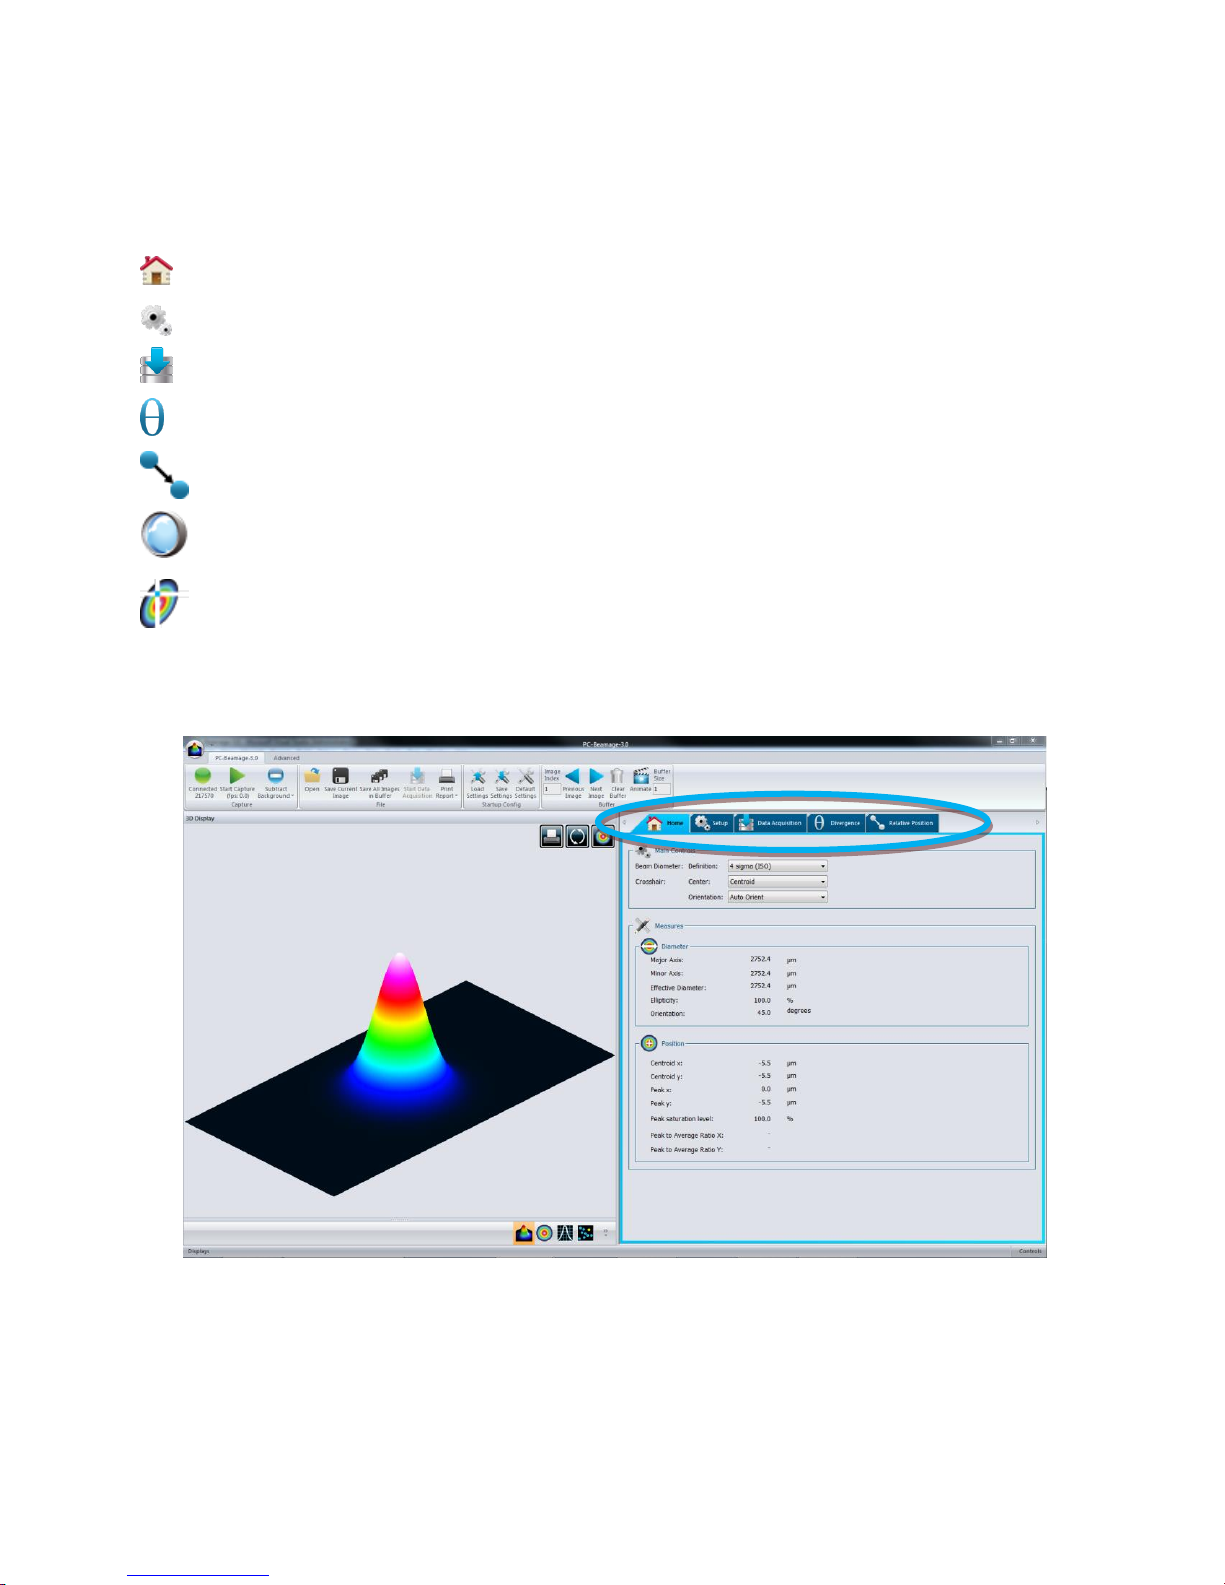
The “Help” button opens the Beamage Series user manual. All information, tips, warnings and
troubleshooting about the software are in this manual. It is also possible to open both the Beamage-M2
user manual and the Beamage-3.0 accessories user manual.
Warning
Page 39
Beamage Series User Manual Revision 9.0 38
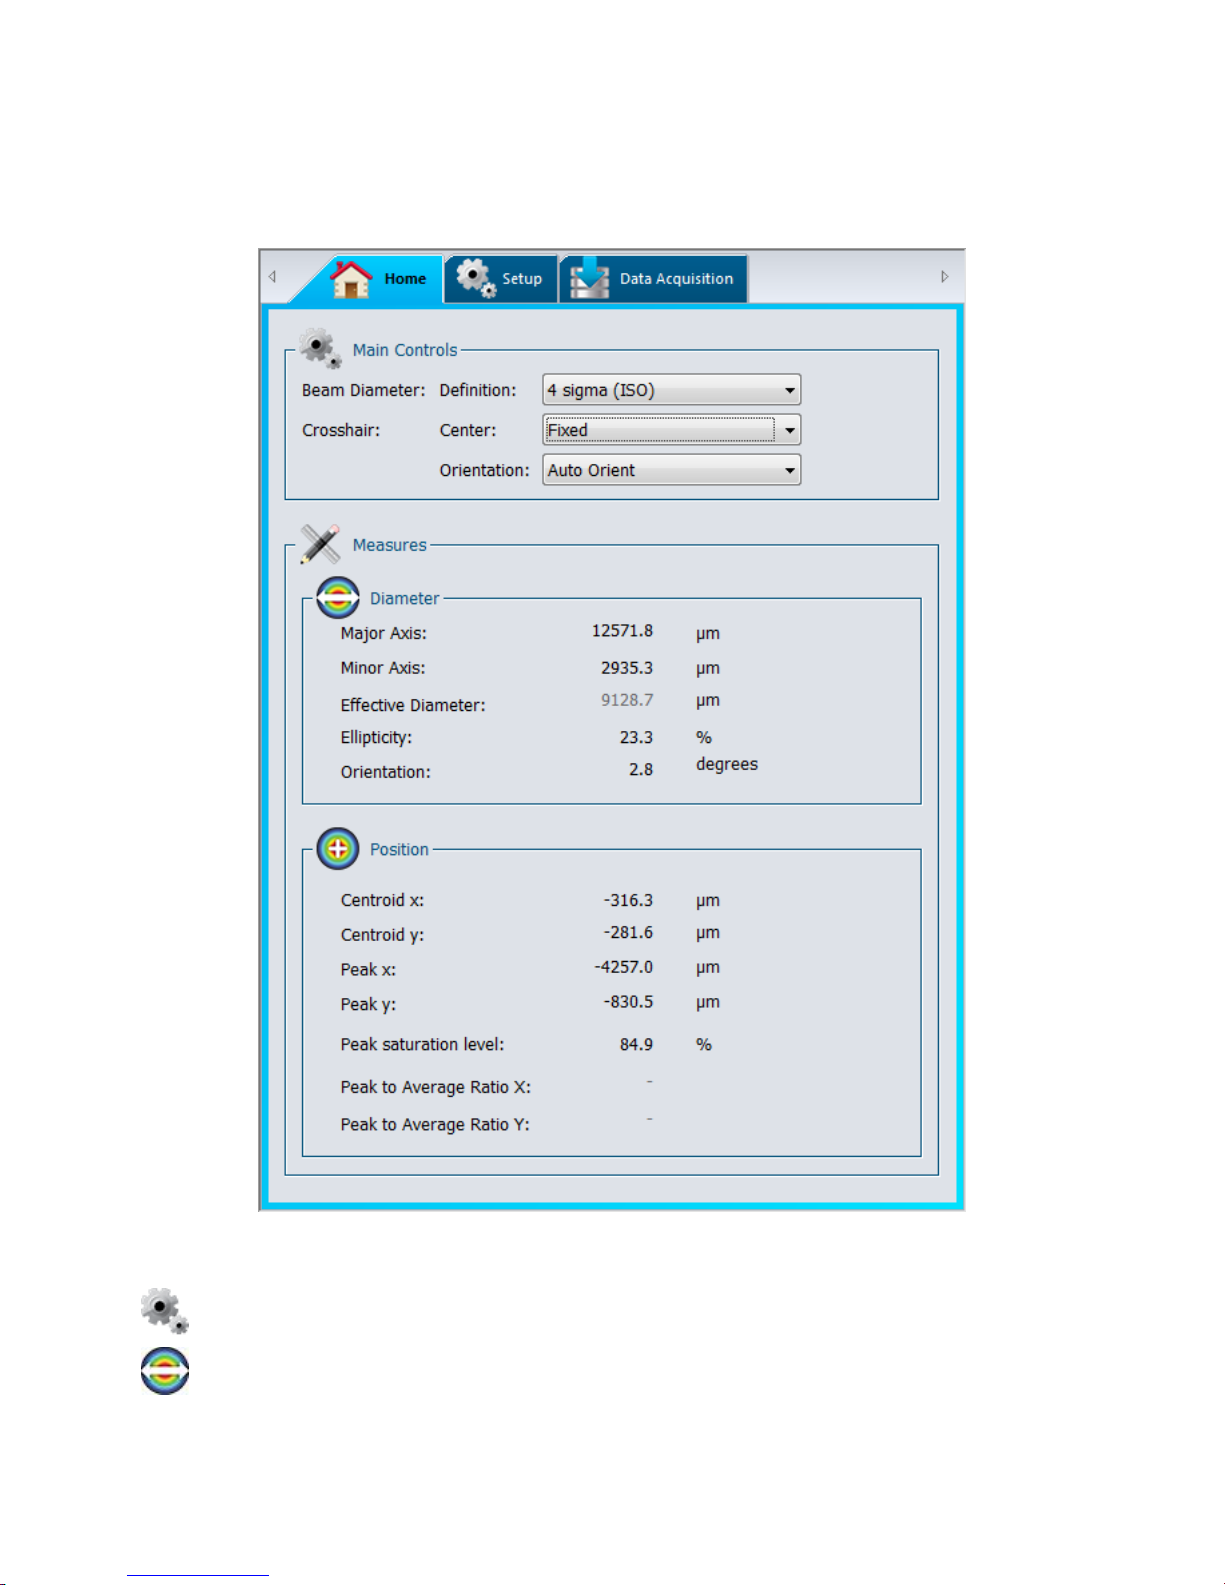
Home: Controls the computation parameters and displays the beam’s diameter and centroid
information.
Setup: Controls the Beamage parameters.
Data Acquisition: Controls the acquisition parameters
Divergence: Controls the divergence parameters and displays the results. This tab is available
when the Divergence button is activated in the Main Controls (refer to section 4.6.5).
Relative Position: Sets the origin position (0,0) to a user-defined value. This tab is available
when the Relative Position button is activated in the Main Controls (refer to section 4.6.5).
Camera Lens: Calibrates the Pixel Multiplication Factor when using a Camera Lens. This tab is
available when the Camera Lens button is activated in the Main Controls (refer to section 4.6.5).
Fixed Crosshair: Set the crosshair origin position (0,0) and orientation to a user-defined value.
This tab is available when the Fixed Crosshair button is activated in the Main Controls (refer to
section 4.6.5).
5. HOME AND SETUP PANELS
The PC-Beamage offers different panels to view the measures and set different options for the Beamage.
To choose the desired display mode, click on the corresponding tab above the Controls and Measure
panel
Figure 5-1 Graphic Display
Page 40
Beamage Series User Manual Revision 9.0 39
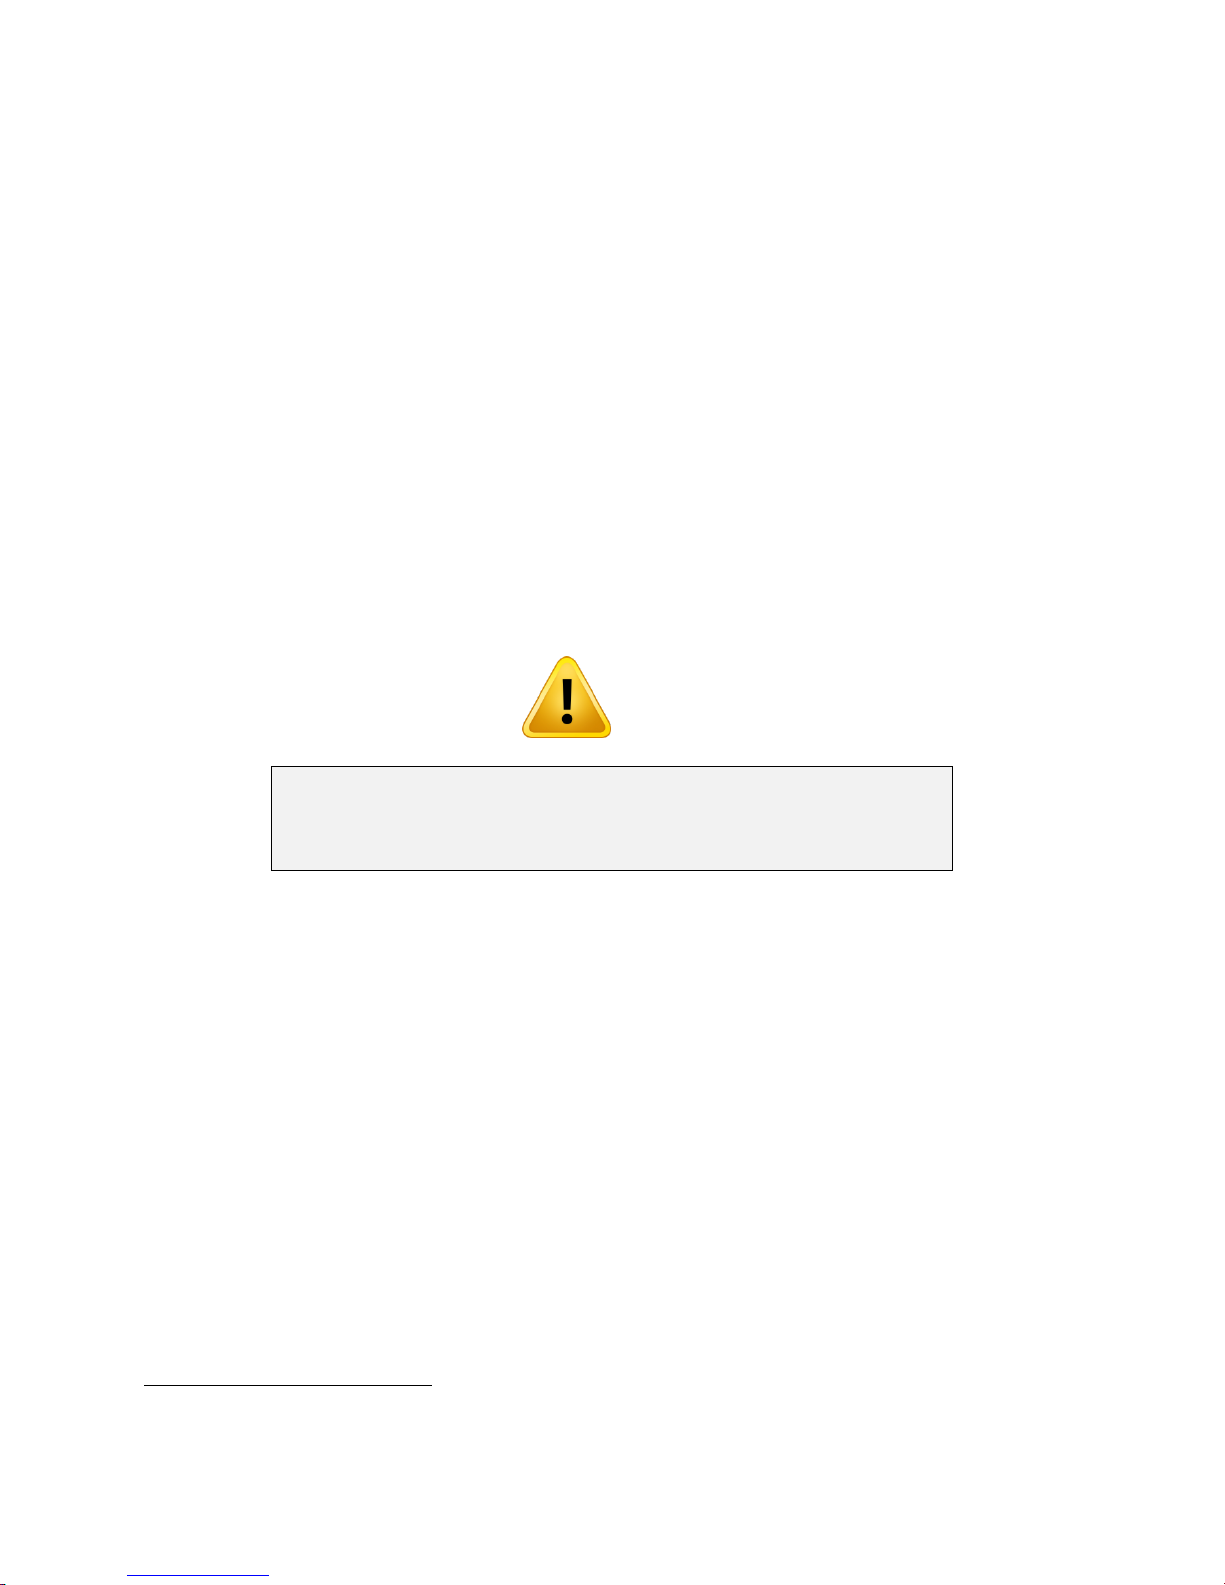
Main Controls: Defines the beam width definition and crosshair position.
Diameter: Displays the beam diameter computation results.
5.1. HOME
Figure 5-2 Home Tab
Page 41

Beamage Series User Manual Revision 9.0 40
Centroid: Displays the beam’s centroid and peak coordinates.
Page 42

Beamage Series User Manual Revision 9.0 41
The crosshair definition will affect the XY Display (refer to section 6.36.3)
and the beam width if it is defined by the FWHM or 1/e2 along crosshair
5.1.1. Main Controls
The “Main Controls” section allows the user to set the desired beam diameter definition and crosshair
position. Use the drop-down menu to select the desired settings.
5.1.1.1. Beam Diameter Definition
By default, the beam width definition is set to “4 sigma (ISO)” which respects the ISO-11146-1:2005 and
ISO11146-2:2005 standards (refer to Appendix A. ISO11146 and ISO11670 Definitions). This definition
takes the entire image to compute the beam parameters, which slows the computation time and reduces
the frame rate.
The “FWHM along crosshairs (50%)” finds the crosshair’s Full Width Half Maximum (FWHM). The
algorithm will return the width corresponding to the curve’s first half maximum and the curve’s last half
maximum. Because the beam definition only takes into account a slice of the beam, the computation time
is much faster and higher frame rates can be achieved.
The “1/e2 along crosshairs (13.5%)” finds the crosshair’s width corresponding to 1/e2 (about 13.5%) of its
maximum. Similarly to the FWHM, this beam definition will increase the frame rate.
The “86% effective diameter (D86)” computes the circular beam containing 86% of the total intensity. This
definition assumes the beam is circular.
5.1.1.2. Crosshair Definition
The crosshair is defined by its center (intersection of the 2 crosshairs) and its orientation. The crosshair
center can be set to the beam’s centroid as defined by the ISO-11146-1:2005 and ISO-11146-2:2005
standards, the beam’s peak position or at a user-defined fixed position. If many pixels correspond to the
peak value, the crosshair’s center will be set to the first peak.
The crosshair’s orientation is set to “Auto Orient” by default, which aligns it to the beam’s orientation as
defined by the ISO-11146-1:2005 and ISO-11146-2:2005 standards. It can also be set to a fixed 45° or 0°
angle, or at a user-defined fixed angle.
Warning
5.1.2. Measures
The “Measures” section presents the beam’s diameter and centroid information according to the selected
beam definition (refer to section 5.1.1.1).
The computation algorithm first determines an approximate beam diameter (13.5% clip level). The
algorithm will consider that all pixels outside 2 times the approximate beam diameter are the outside area.
The outside area’s average will become the baseline, which will be subtracted from the area containing
the beam. Only the area containing the beam will be used to compute the diameter. This means that a
smaller beam will have a smaller area which will decrease the computation time and increase the frame
Page 43
Beamage Series User Manual Revision 9.0 42
1
According to the beam definition, the displayed measures will vary. For
example, for “86% effective diameter (D86)”, only the effective diameter
will be displayed, as the major, minor axis, and orientation are not relevant
in a perfectly circular beam.
1
rate. If the beam is larger and all pixels contain the area containing the beam, there will be no baseline
subtraction and the frame rate will be slower.
5.1.2.1. Diameter
The “Major Axis” is the beam maximum width whereas the “Minor Axis” is the minimum beam width.
The “Effective Diameter” is the beam’s diameter considering it is circular.
The effective diameter is only valid if the ellipticity is greater than 87%. If the beam’s ellipticity is lower
than 95%, the effective diameter will by grayed-out, indicating it is not valid.
The “Ellipticity” is the ratio between the minor axis and the major axis. For a perfect round Gaussian
beam, the ellipticity would be equal to 100%.
The “Orientation” is defined as the “angle between the x-axis […] and that of the principal axis of the
power density distribution which is closer to the x-axis.”
. From this definition, the angle is comprised
between -45° and 45°.
For more information on beam diameter computations as defined by the ISO-11146-1:2005 and ISO-
11146-2:2005 standards, please refer to Appendix A. ISO11146 and ISO11670 Definitions)
Warning
5.1.2.2. Centroid
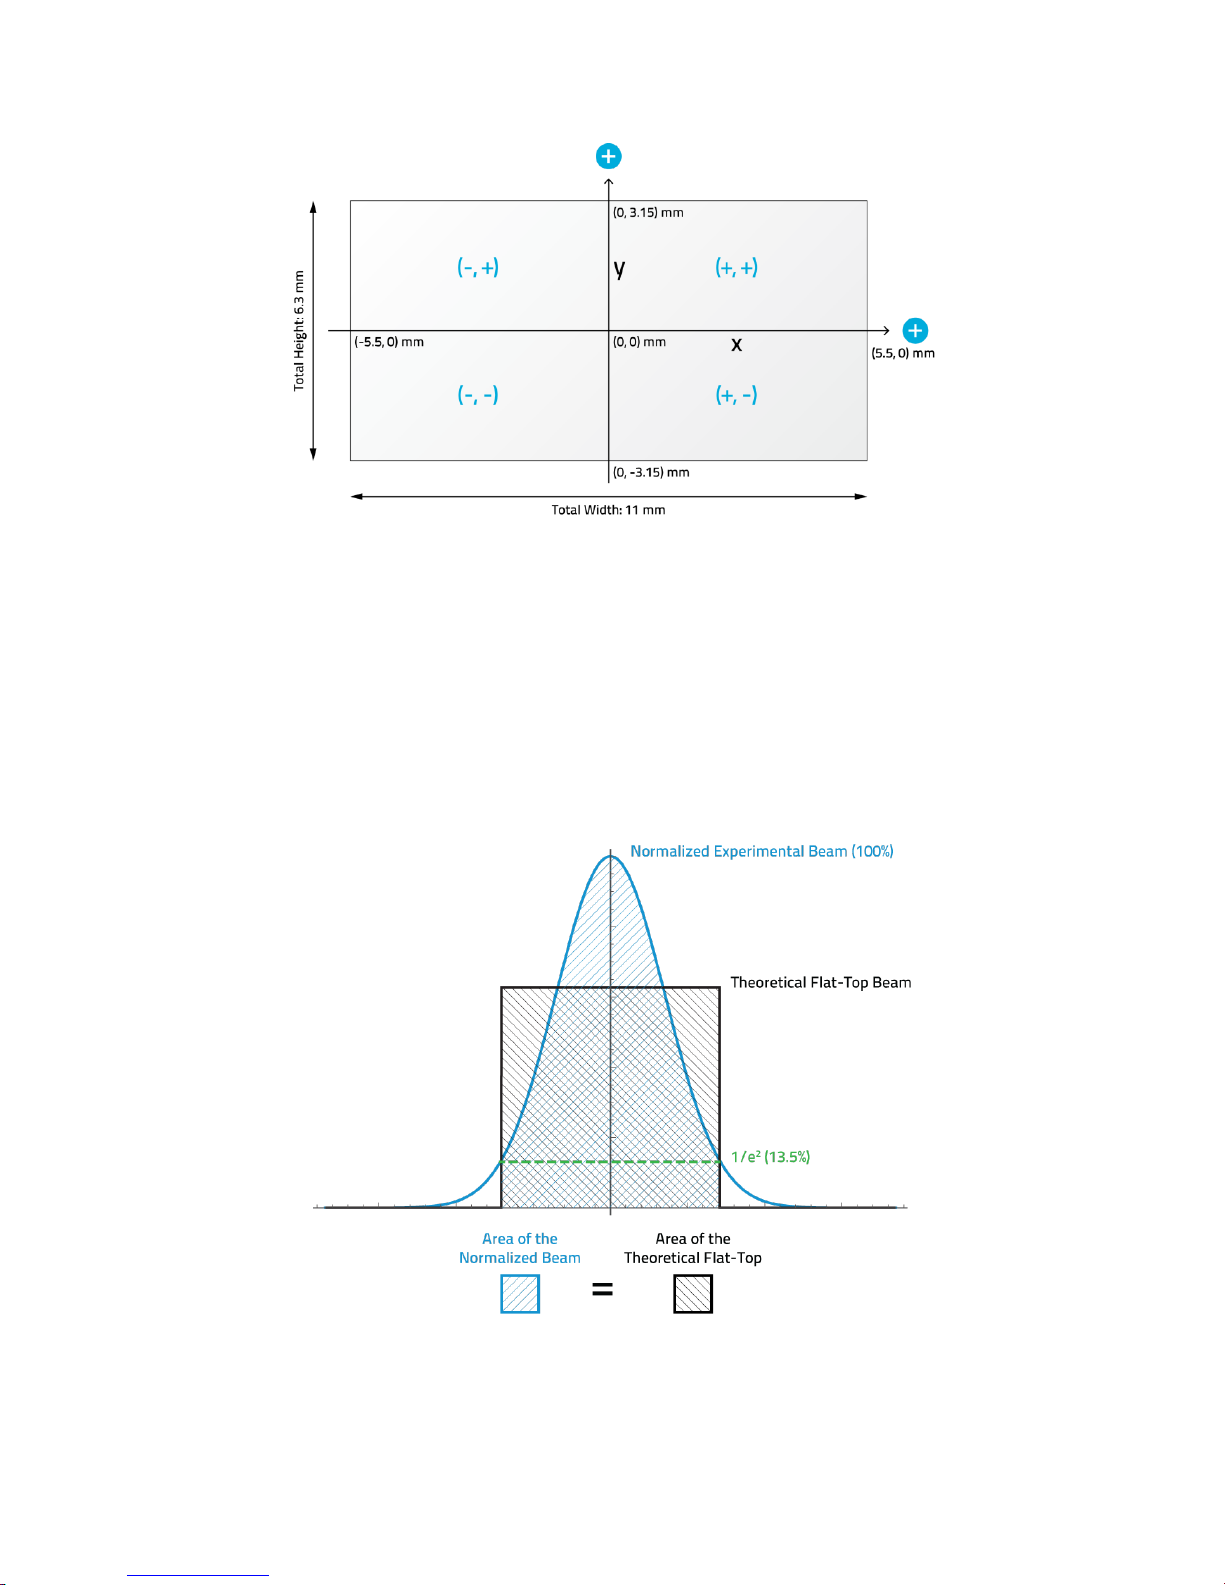
All positions are relative to the image center which is (0,0). The horizontal axis increases toward the righthand side and the vertical axis increases toward the top.
International Organization for Standardization, ISO 11146 :2005 Laser and laser-related equipment –
Test methods for laser beam widths, divergence angles and beam propagation ratios, 2005, Geneva
Page 44
Beamage Series User Manual Revision 9.0 43
Figure 5-3 Fixed Coordinates System for the Sensor
The beam “Centroid” corresponds to the beam’s first order distribution as defined by the ISO-111461:2005 and ISO-11146-2:2005 standards (refer to Appendix A)
The beam’s “Peak” position corresponds to the pixel’s peak value position. If many pixels correspond to
the peak value, the crosshair will be centered on the first peak.
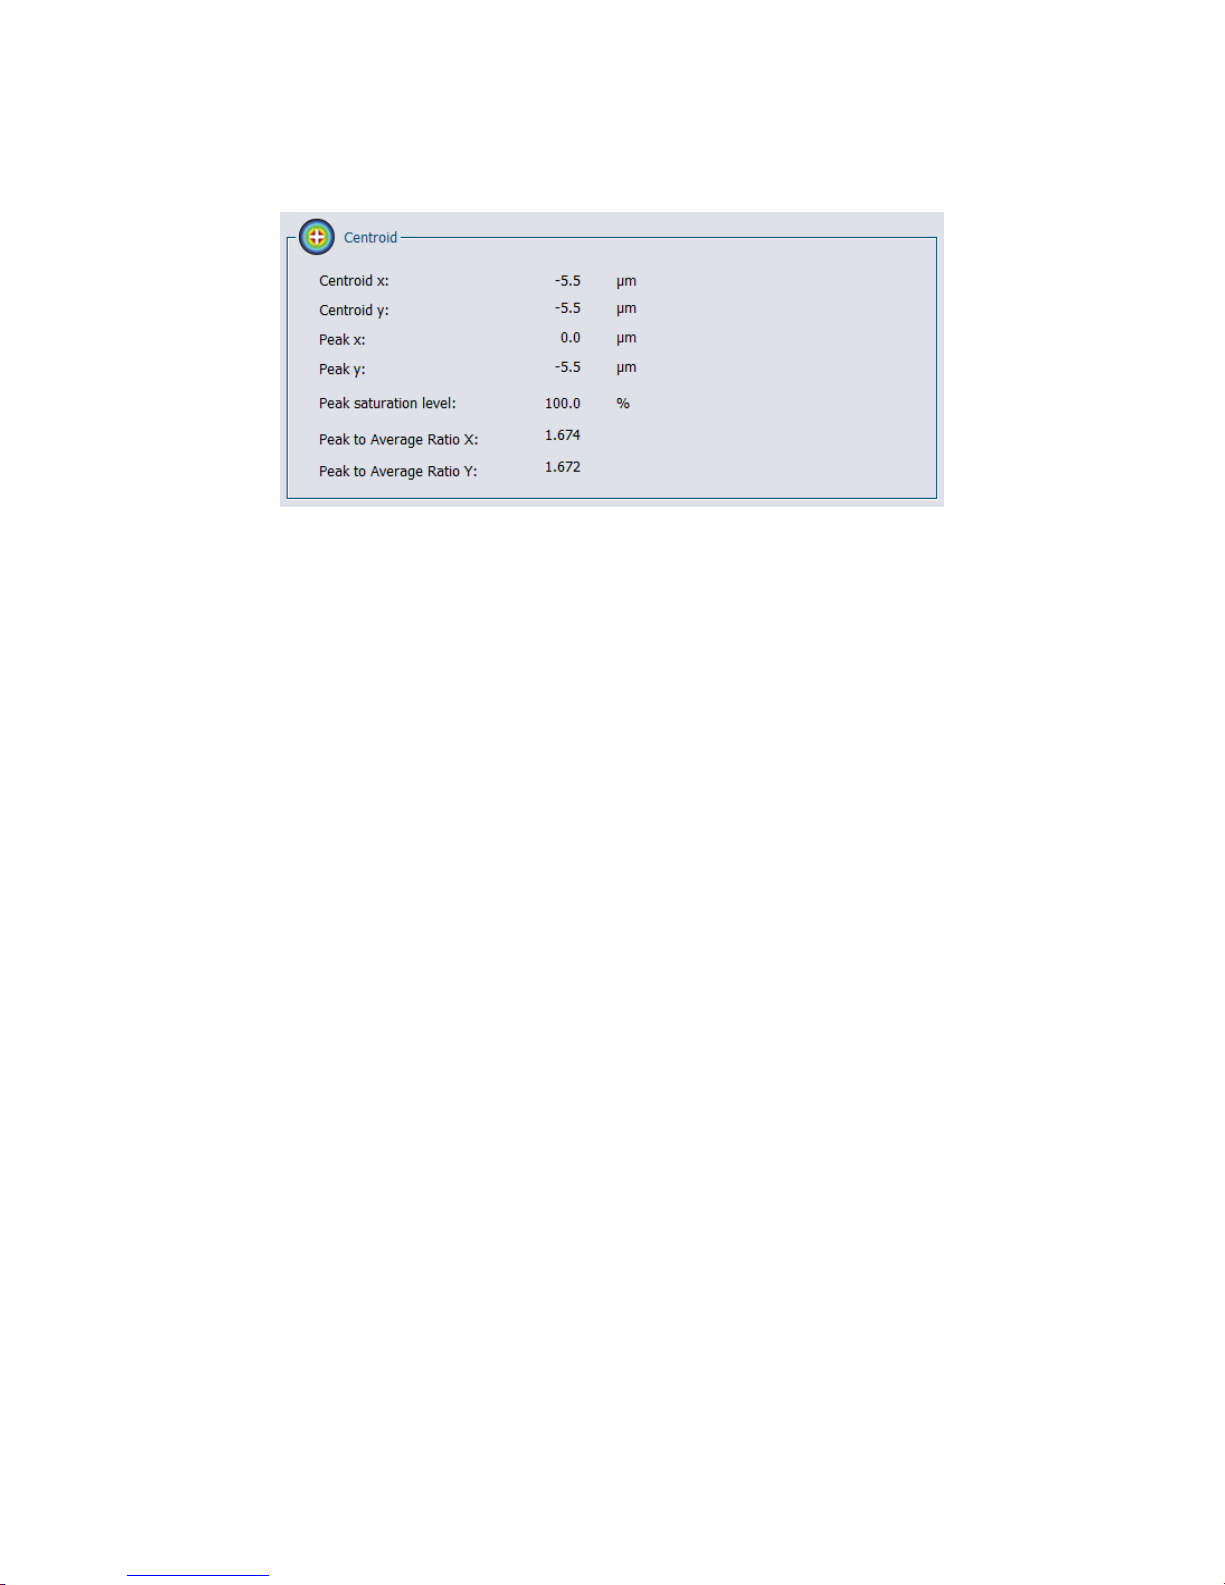
The beam “Peak to Average Ratio” corresponds to the ratio between the actual beam peak value and the
height of an equivalent simulated flat-top beam. The simulated beam’s width is the 1/e2 diameter of the
actual beam and has the same area (same energy). The software computes the ratios for both the X and
Y axes.
These results are only available when the “1/e2 along crosshairs (13.5%)” beam diameter definition is
selected. If any other definition is used, the “Peak to Average Ratios” are not computed and dashes are
Figure 5-4 Peak to Average
Page 45
Beamage Series User Manual Revision 9.0 44
displayed. When the crosshair center is set to “Centroid” instead of “Peak”, results are grayed out to
remind the user that the values do not correspond to the “Peak to Average Ratios”.
Figure 5-5 Peak to Average Ratio Example
Page 46
Beamage Series User Manual Revision 9.0 45
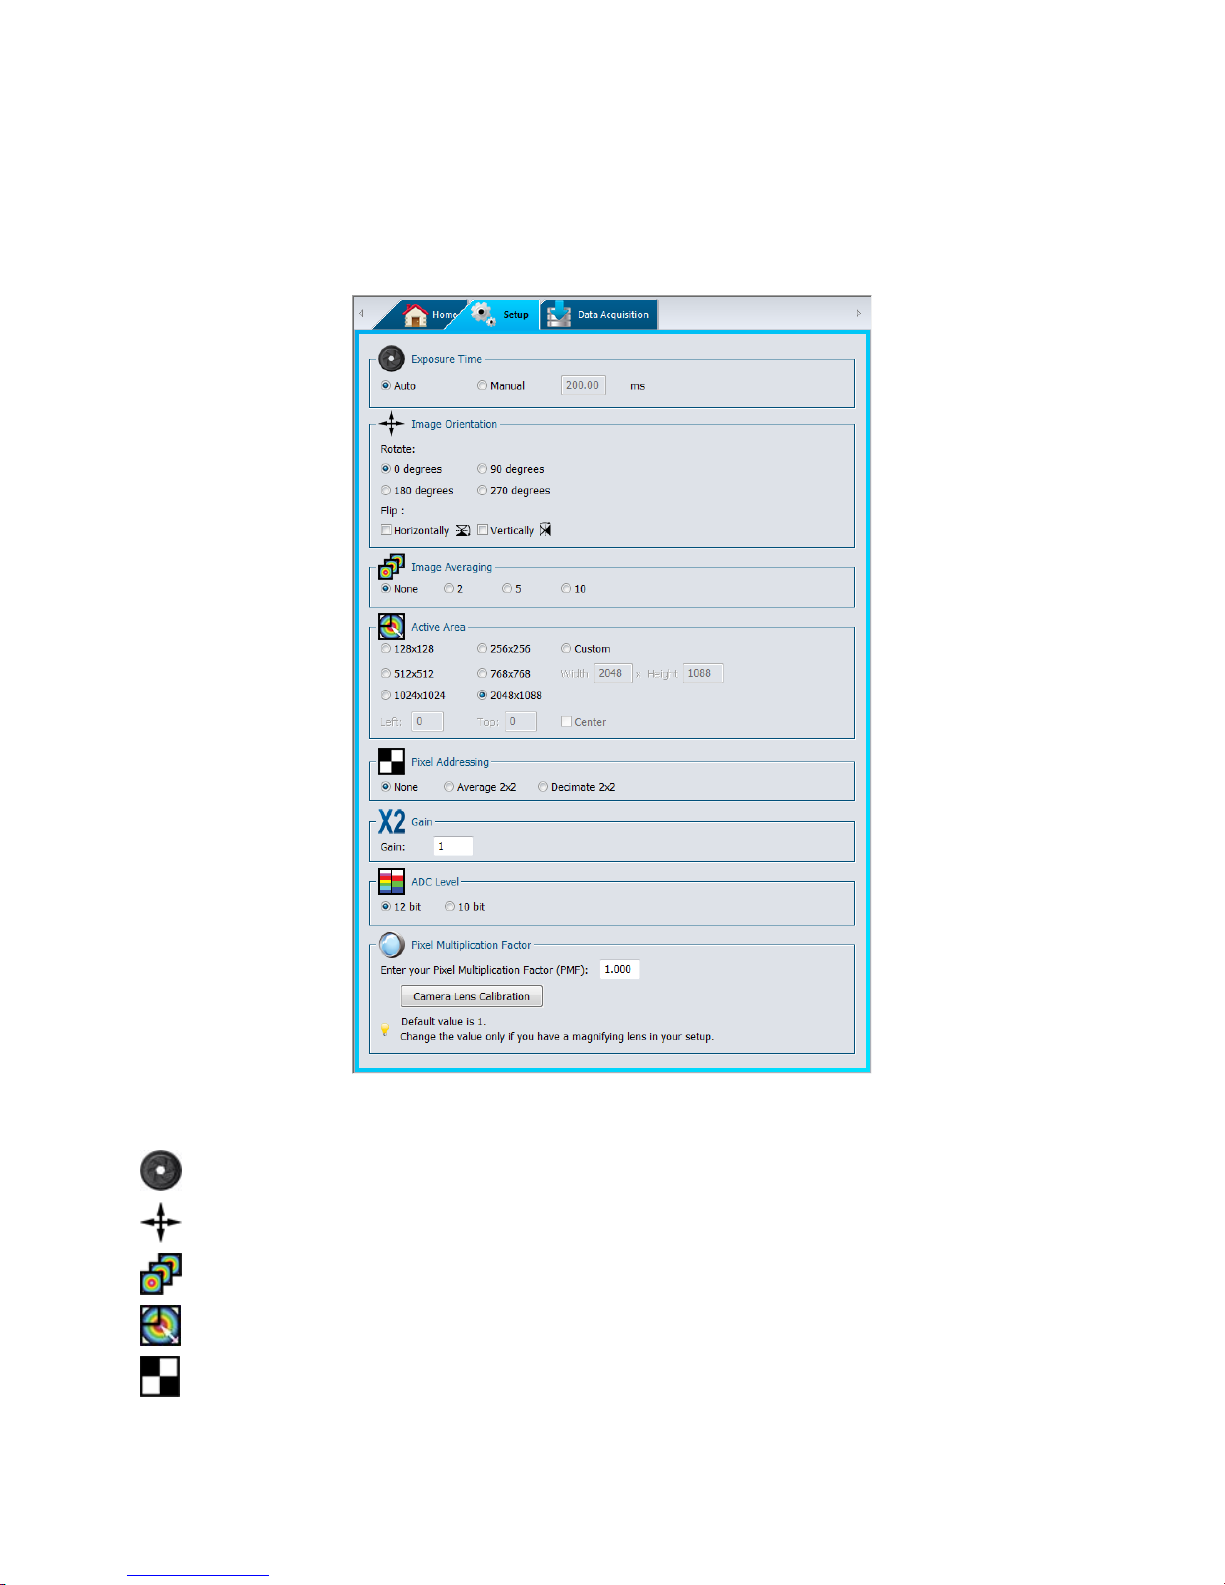
Exposure time: Controls the Beamage sensor’s exposure time.
Image orientation: Rotates or flips the captured image.
Image Averaging: Applies a temporal filter by averaging multiple frames
Active Area: Selects the region of interest.
Pixel Addressing: Reduces the spatial resolution by averaging or decimating pixels.
5.2. SETUP
The “Setup” tab allows the user to set the Beamage parameters.
Figure 5-6 Setup Tab
Page 47
Beamage Series User Manual Revision 9.0 46
Gain: Adds numerical gain to captured image.
ADC Level: Selects the BEAMAGE’s ADC level for each pixel
Pixel Multiplication Factor: Adjusts the pixel multiplication factor when using optical components
If the beam is still saturated at a 0.06 ms exposure time, please increase
the attenuation in front of the Beamage. If the beam intensity is too low at
200 ms exposure time, please lower the attenuation in front of the
Beamage.
When the Beamage is not capturing images and is in “Animate” mode or
buffer viewing mode, it will neither flip nor rotate the current image, as it
has already been captured.
5.2.1. Exposure Time
The “Exposure Time” controls the Beamage’s exposure time settings. It can be set from 0.06 ms to
200 ms. The “Auto” option will automatically set the exposure time in order to have the maximum beam
intensity at 85% of the sensor’s saturation level. The exposure time can also be set manually by clicking
on the corresponding radio button and changing the value in ms.
Tip
5.2.2. Image Orientation
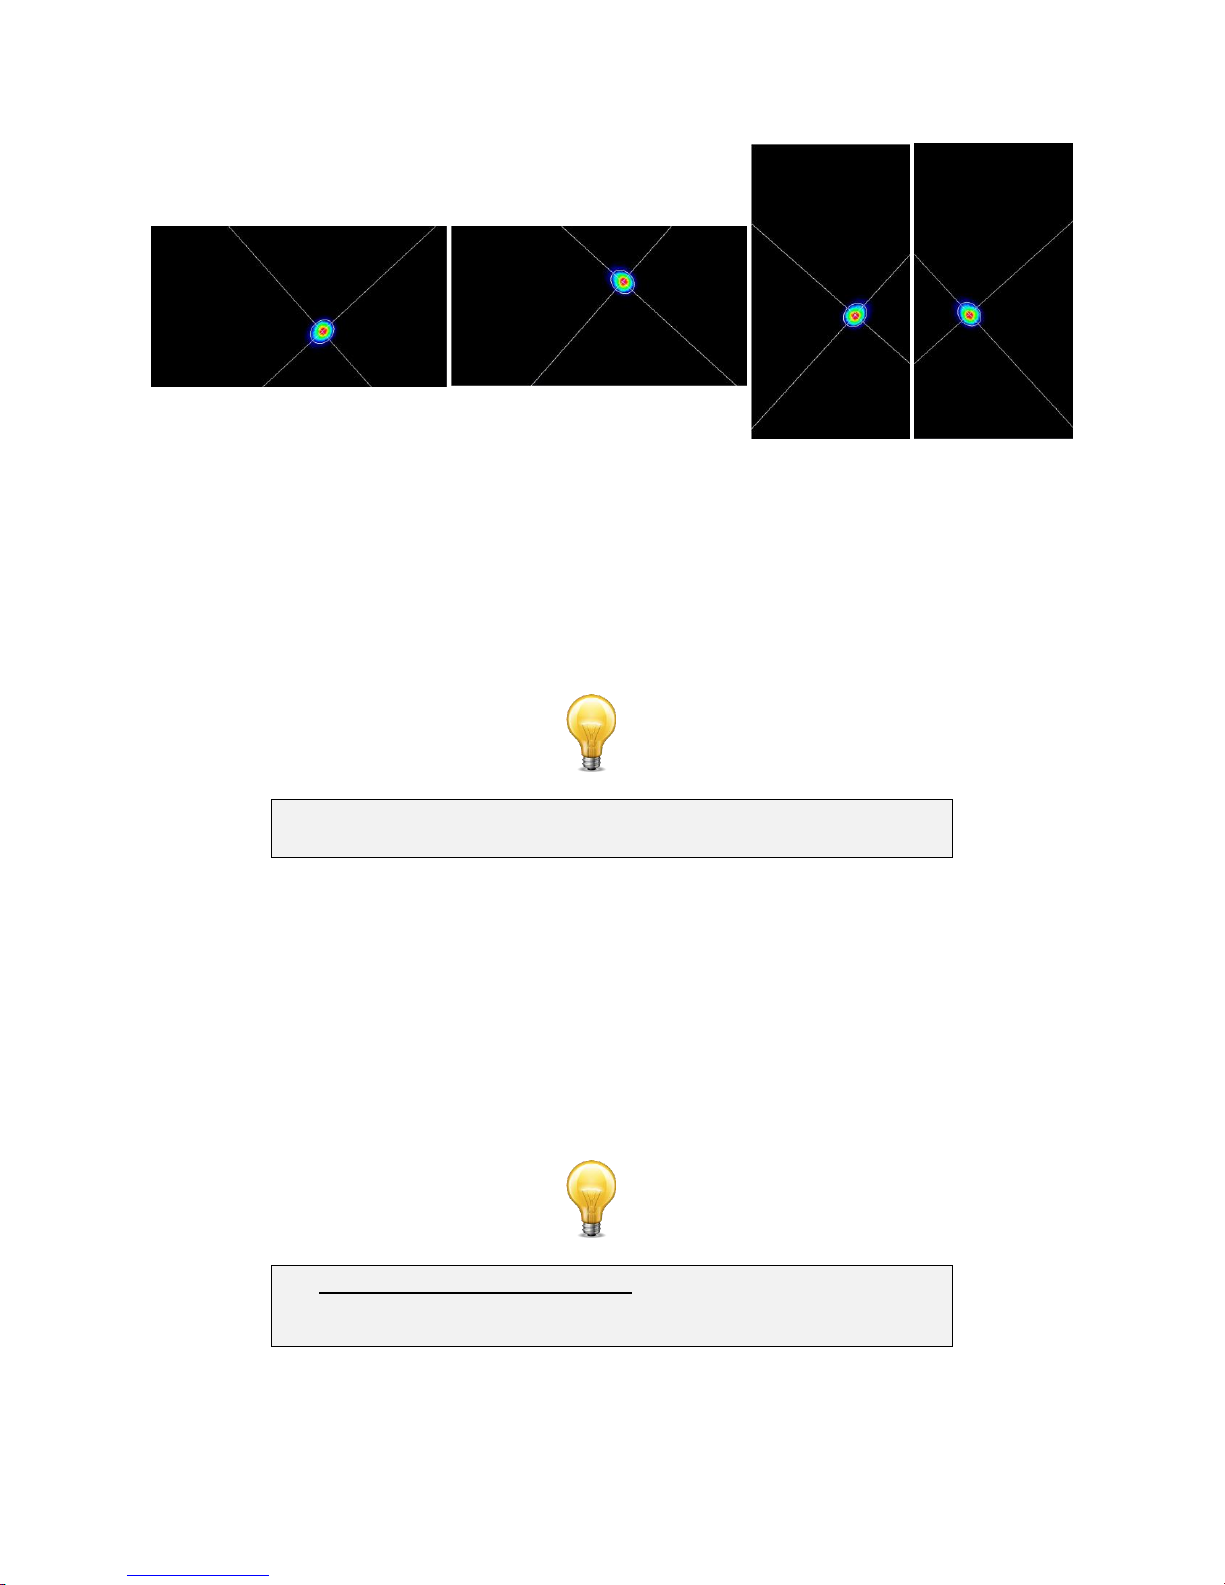
The “Image Orientation” controls rotate or flip the captured frame. The captured frame can be rotated to
90⁰, 180⁰, or 270⁰. All angles rotate clockwise. The captured frame can also be flipped horizontally or
vertically. If a frame is saved with a rotation and/or a flip, it will keep these orientation settings. Note that
the reference axis for the centroid is neither flipped nor rotated. All positions are always relative to the
image’s center which is (0,0) and the horizontal axis always increases towards the right-hand side and
the vertical axis always increases towards the top.
Warning
Page 48
Beamage Series User Manual Revision 9.0 47
Image Averaging will smooth the beam fluctuations that can occur over
time. It is very useful when working with unstable laser sources.
When working with small beams, optimize the speed of the data
transfer and still maintain accurate results, by using an Active Area that is
twice the size of your beam.
Initial image (no rotation, no flip) Flip horizontal 90° rotation Flip & rotation
Figure 5-7 Image Orientation Examples
5.2.3. Image Averaging
The “Image Averaging” function is a temporal filter that captures a specified number of frames (2, 5, or
10) and averages the frames pixel by pixel to create a single time-averaged image. This lowers the total
frame rate because multiple frames need to be captured for one computation.
Tip
5.2.4. Active Area
The “Active Area” function allows the user to select a region of interest (ROI) on the sensor. This will
increase the frame rate, as fewer pixels need to be transferred from the Beamage. This can only be done
on small beam sizes, since a cropped beam would invalidate the beam width measurements.
Furthermore, to have an accurate measurement, the active area must be at least 2 times the beam size.
The user can select the desired area from a preset selection or enter a custom size. By default, the area
will be placed at the sensor’s upper left corner pixel (0, 0). This position can be changed by entering the
active area’s upper left position. Checking the “Center” check box will center the active area to the
sensor’s center.
Tip
Page 49
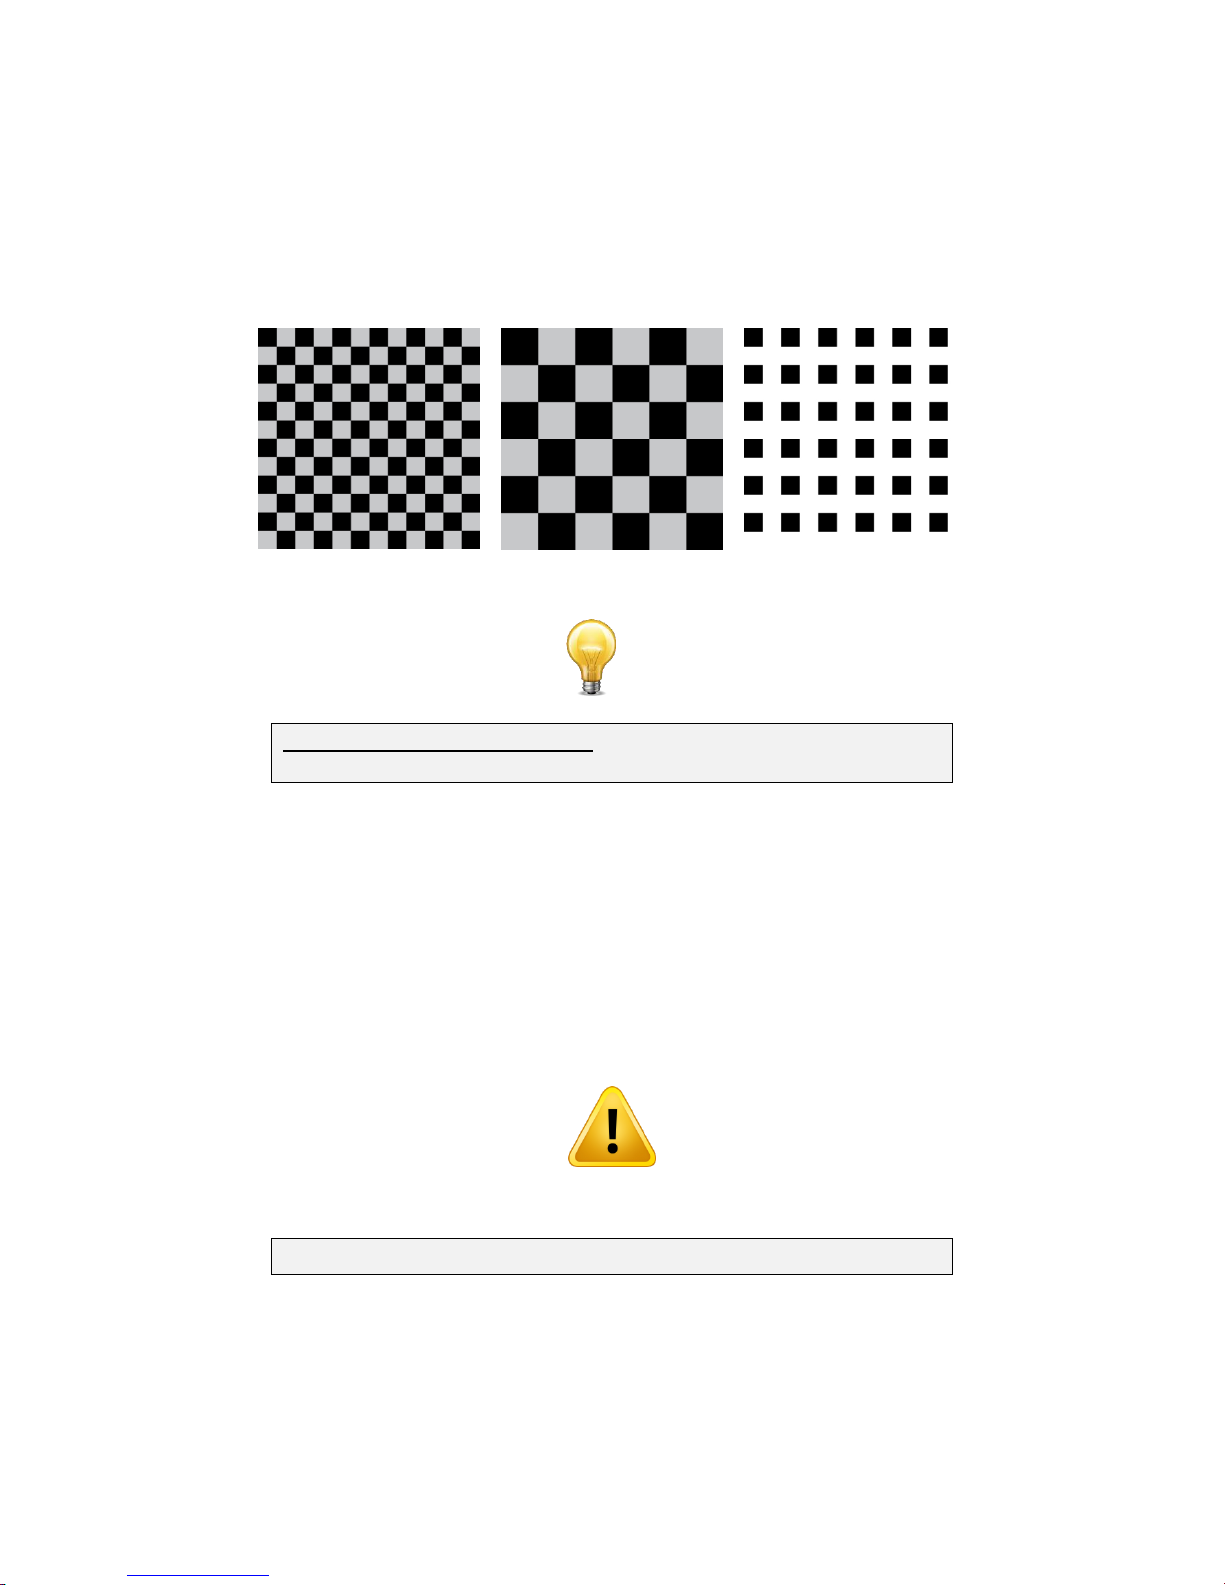
Beamage Series User Manual Revision 9.0 48
Full Resolution
Average 2x2
Decimate 2x2
When working with large beams, optimize the speed of the data transfer
by reducing the spatial resolution using the Pixel Addressing function.
If the Beamage is set in 12 bit mode, it will slow the frame rate.
5.2.5. Pixel Addressing
The “Pixel Addressing” mode allows the user to downsample the captured image. The “Average 2x2” will
take a 2x2 pixel cluster and return its average as one larger pixel. The “Average 2x2” function is only
available in the 12 bit ADC mode. The “Decimate 2x2” will only return 1 out of the 4 pixels. Because the
pixel area is doubled with this mode, it can be used with large beams, where the spatial resolution is not
crucial. It will increase the frame rate because fewer pixels are transferred from the Beamage.
Figure 5-8 Pixel Addressing Mode
Tip
5.2.6. Gain
The “Gain” setting allows the user to set a numerical gain on the captured image. The gain must be
between 1 and 10. If the pixel value is over the maximum ADC level (For 12-bit 212 = 4096), the pixel
value will be topped at the maximum ADC level.
5.2.7. ADC Level
The ADC level is the pixel’s depth which can be set to 12 or 10 bit. In the 12 bit mode, each pixel value is
on 212 = 4096 levels while the 10 bit mode is on 210 = 1024 levels. The 12 bit mode has a slower frame
rate.
Warning
5.2.8. Pixel Multiplication Factor (PMF)
If the Beamage camera is operated with an optical component that has magnification properties (such as
a magnifying lens, a UV Converter or an IR Adaptor), the Pixel Multiplication Factor must be adjusted in
order to have the exact beam dimensions. The “Pixel Multiplication Factor” section can be found at the
bottom of the “Setup” tab.
Page 50
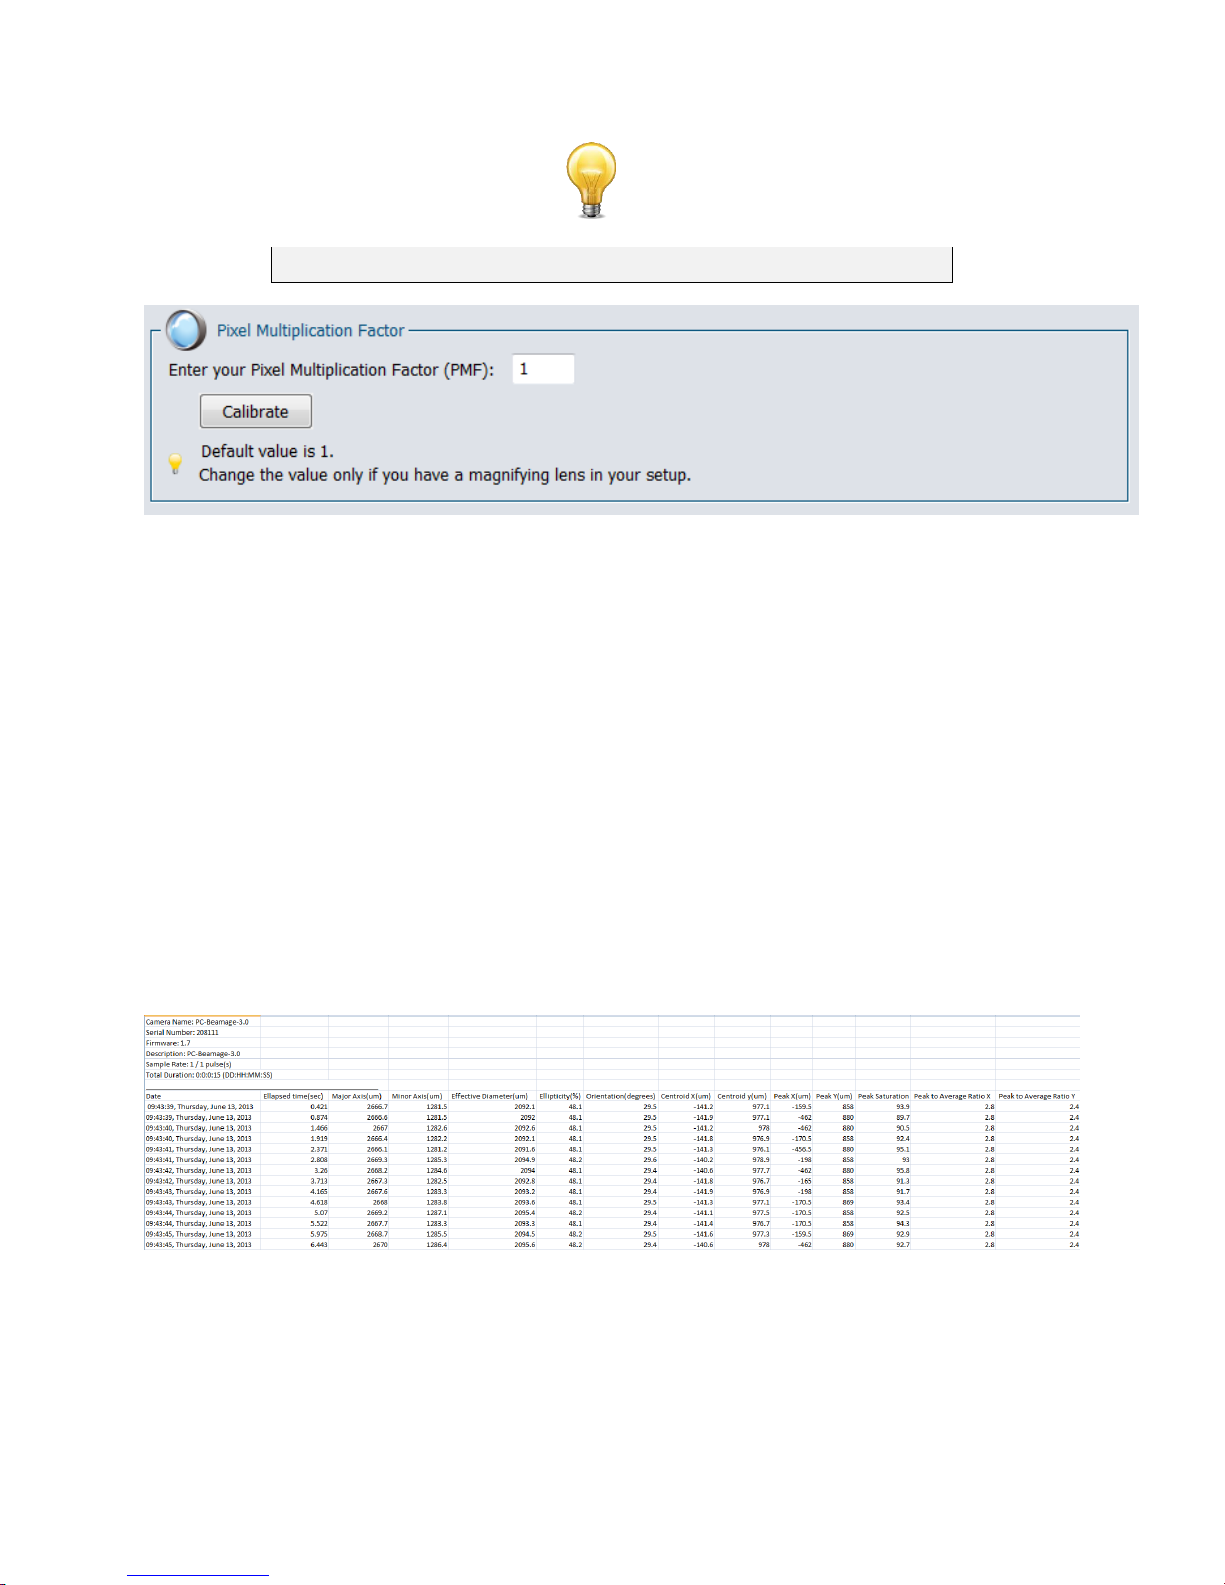
Beamage Series User Manual Revision 9.0 49
The default value for the Pixel Multiplication Factor is 1.
Tip
Figure 5-9 Pixel Multiplication Factor
It is possible to manually set a value for the PMF. Simply enter the desired value in the white box and
press enter. The beam dimensions will be adjusted accordingly. If a camera lens is used with the
Beamage camera, it is possible to follow the camera lens calibration steps by clicking on the “Calibrate”
button. This will open the “Camera Lens” tab. Refer to section 5.6 for more information about the camera
lens calibration
5.3. DATA ACQUISITION
The “Data Acquisition” tab allows the user to set the acquisition parameters. It is possible to save the
beam profiling results shown in the “Measures” tab (refer to section 5.1.2) in a *TXT file. The *TXT file
includes a header, containing the acquisition settings, followed by the data. Each line corresponds to a
single frame and all the measurements are separated by a tab. This file can be opened in a spreadsheet
software, such as Microsoft Excel. It is also possible to save the images associated with the
measurements saved in the *.TXT logging file. Each image will be individually saved in a native *.BMG
file.
Figure 5-10 Example File of a Measurement Acquisition
To start the acquisition, click on the “Start Data Acquisition” button in the “Main Controls” (refer to section
4.3.4).
Page 51
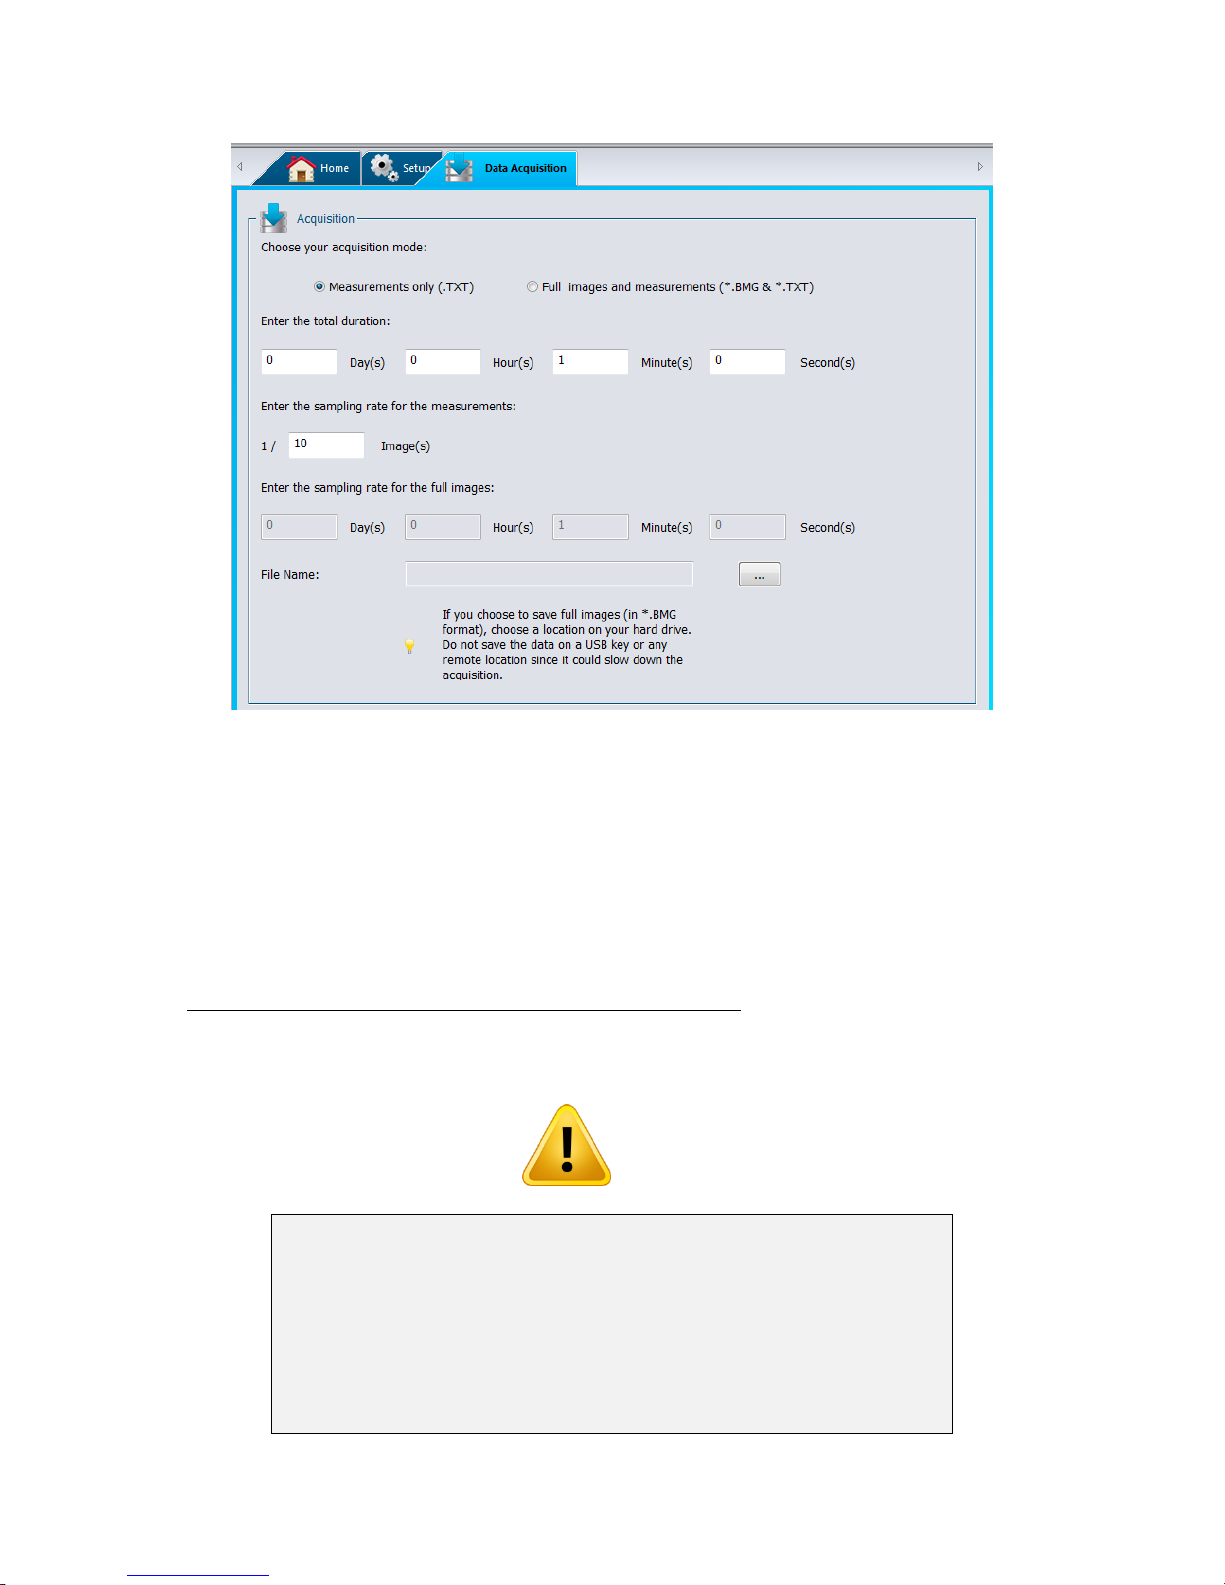
Beamage Series User Manual Revision 9.0 50
Each *.BMG file can take up to 8.50 MB on the hard drive. Acquiring
multiple frames can quickly sum up to multiple GigaBytes. If the total
acquisition if over 1 GB, a warning message will appear. If there is only 10
GB left on the hard drive, a warning message will appear and the
acquisition will be stopped.
Fast acquisition should be done on the computer’s hard drive and cannot
be done on an external drive or on a server hard drive since it could slow
down the acquisition.
Figure 5-11 Data Acquisition Tab
The “Duration” defines the time for which the acquisition will keep running. The countdown starts as soon
as the user presses the “Start Data Acquisition” button located in the “Main Controls”. The user can select
the number of days, hours, minutes and seconds.
The “File Name” allows the user to specify a name and a path for his file. A filename must be defined to
start an acquisition. If the “Full images and measurements” is selected, then a series of “.BMG” files with
the same filename concatenated with its corresponding increment will be saved.
The “Sample Rate” defines the rate at which the samples are saved. When choosing the “Measurements
only” acquisition mode, the sample rate is defined as 1/X images. To save every frame computed, enter
the value “1” in the box. To keep track of only a small amount of frames, enter a higher value. When
choosing the ‘Full images and measurements” acquisition mode, the sample rate is defined temporally.
The fastest rate is limited to 1 per second.
Warning
Page 52
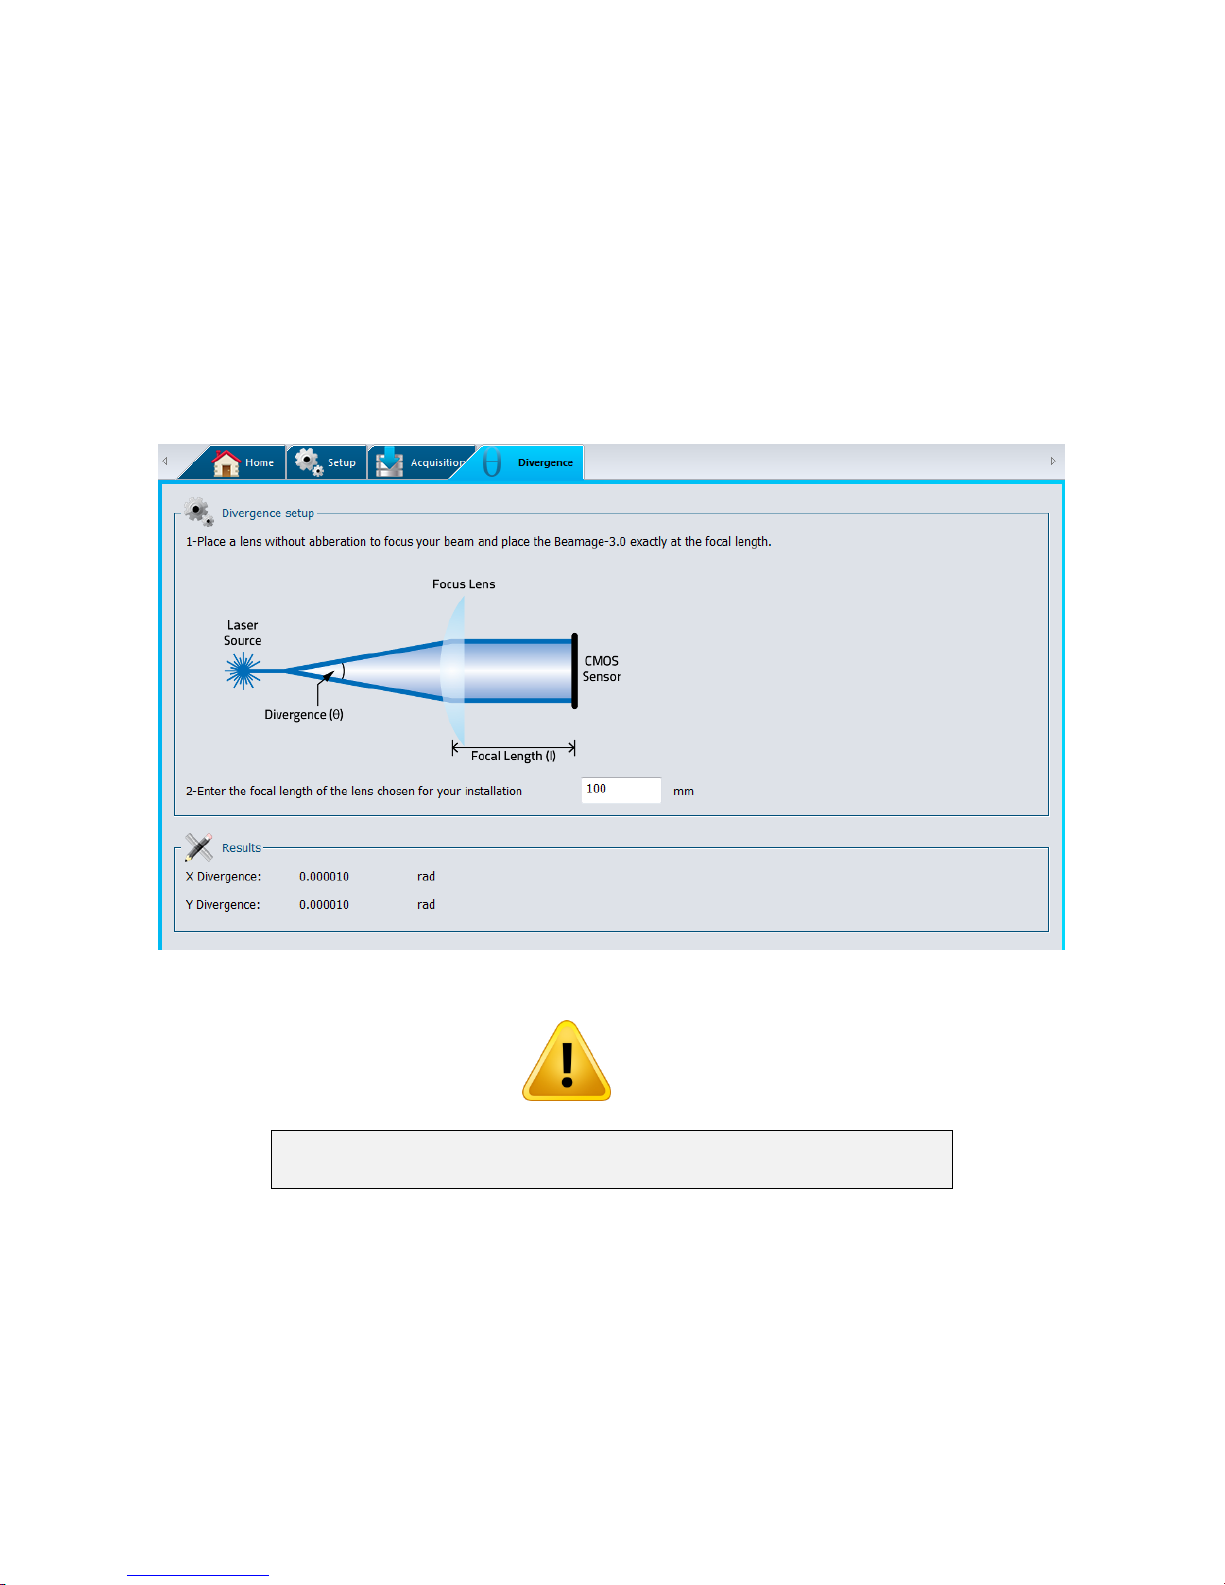
Beamage Series User Manual Revision 9.0 51
The Beamage sensor must be placed precisely at the focal point, not at
the beam waist.
5.4. DIVERGENCE
The divergence tab opens when the divergence button is clicked in the Main Controls (refer to section
4.6.5).
To compute the divergence and abide by the ISO-11146-1:2005 standard, the first step is to place an
aberration-free lens between the Beamage and the laser. The lens should be placed in the far-field of the
laser beam while the Beamage is at the lens’ focal point. The second step is to enter the lens’ focal length
in the software. Since the focal length is wavelength dependent, make sure to use the correct value for
your laser in the prior settings. The divergence in both main axes (x and y) are computed as defined by
the ISO-11146-1:2005 and ISO-11146-2:2005 standards and displayed at the bottom of the “Divergence”
tab (refer to Appendix A).
Figure 5-12 Divergence Tab
Warning
Page 53
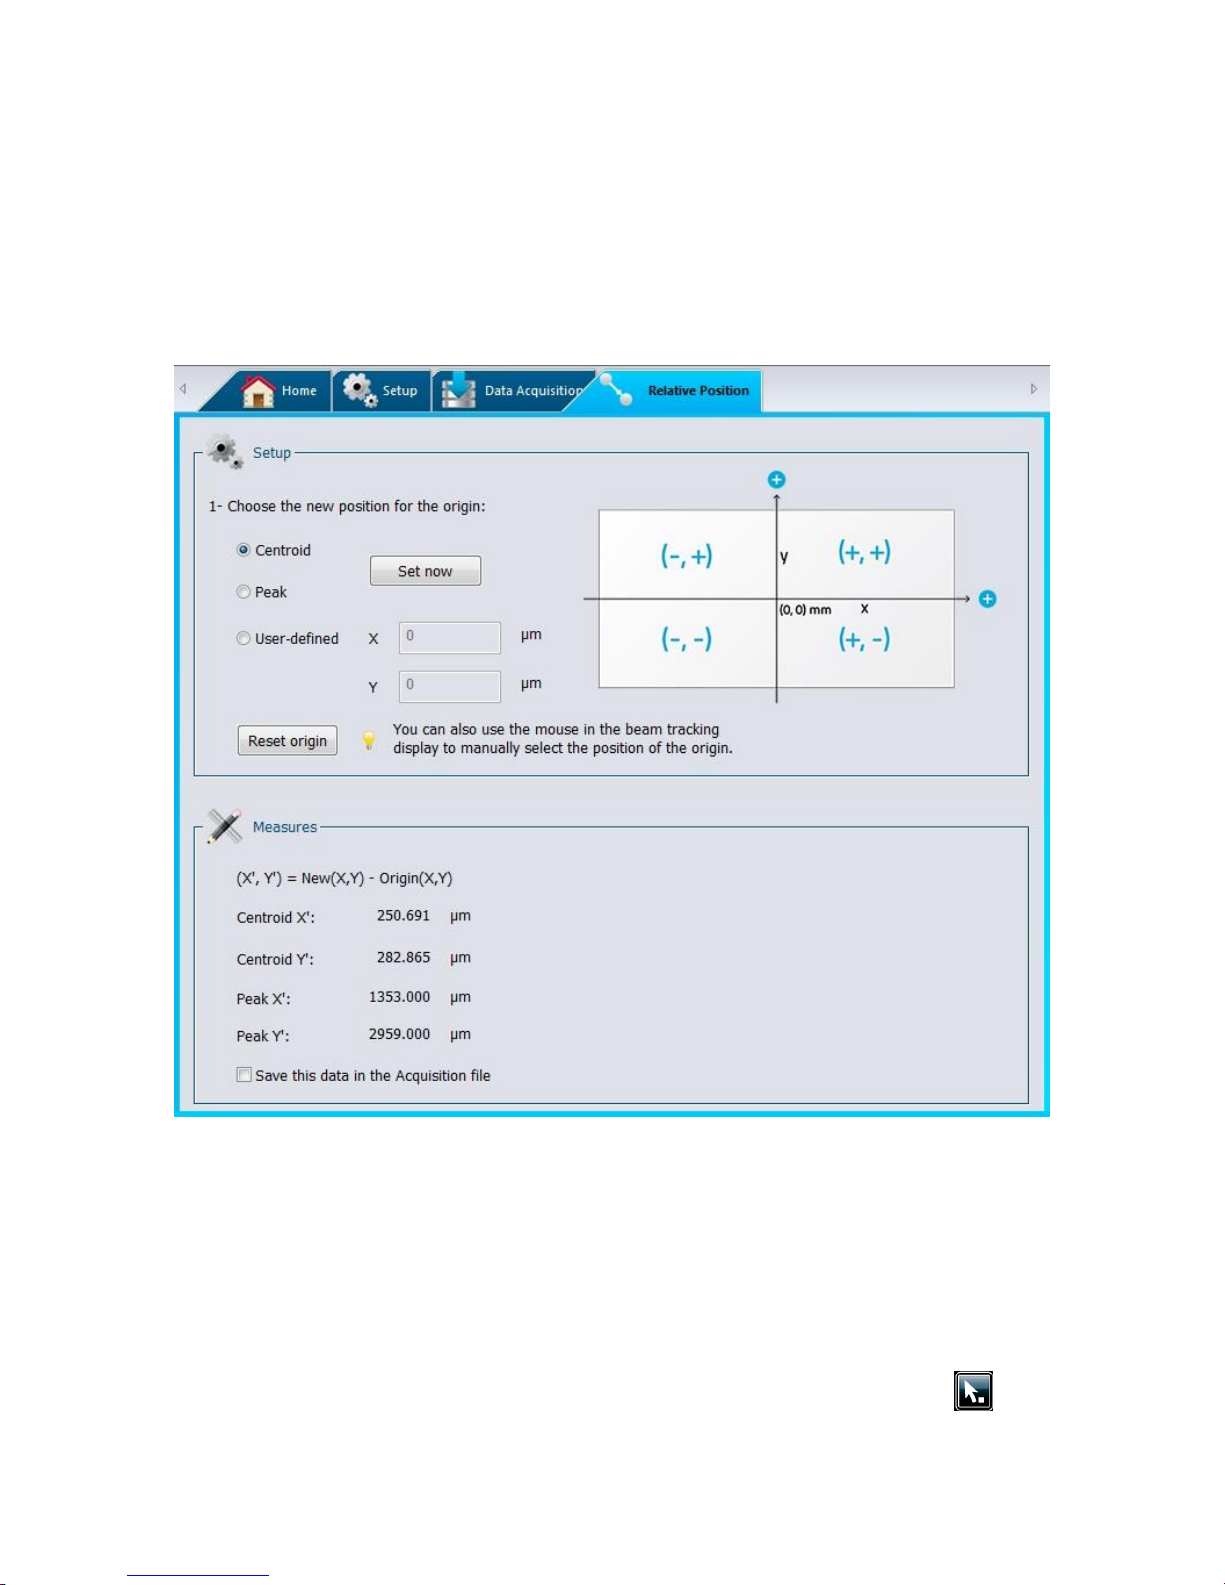
Beamage Series User Manual Revision 9.0 52
5.5. RELATIVE POSITION
5.5.1. Setup
The “Setup” section, which displays the coordinate system of the Beamage sensor on the right side,
allows the user to select the parameter that will be considered as the origin position (0,0) by the software.
By selecting “Centroid” and clicking “Set now”, the user chooses to position the origin at the computed
centroid (center of energy). By selecting “Peak” and clicking “Set now”, the user chooses to position the
origin at the computed energy peak (highest measured value). The option “User-defined”, allows the user
to manually enter origin position values for both the X and Y axes.
It is also possible to position the origin by simply clicking with the mouse in the display. This can be done
in the Beam Tracking Display, which shows the coordinate system of the Beamage sensor (refer to
section 6.4). First, click on the “Beam Tracking Display” button at the bottom of the display screen to open
the Beam Tracking window. Then, activate the pointer button at the top of the display ,and click
where you want to position the new origin of the coordinate system. Once you have clicked on the desired
Figure 5-13 Relative Position Tab
Page 54
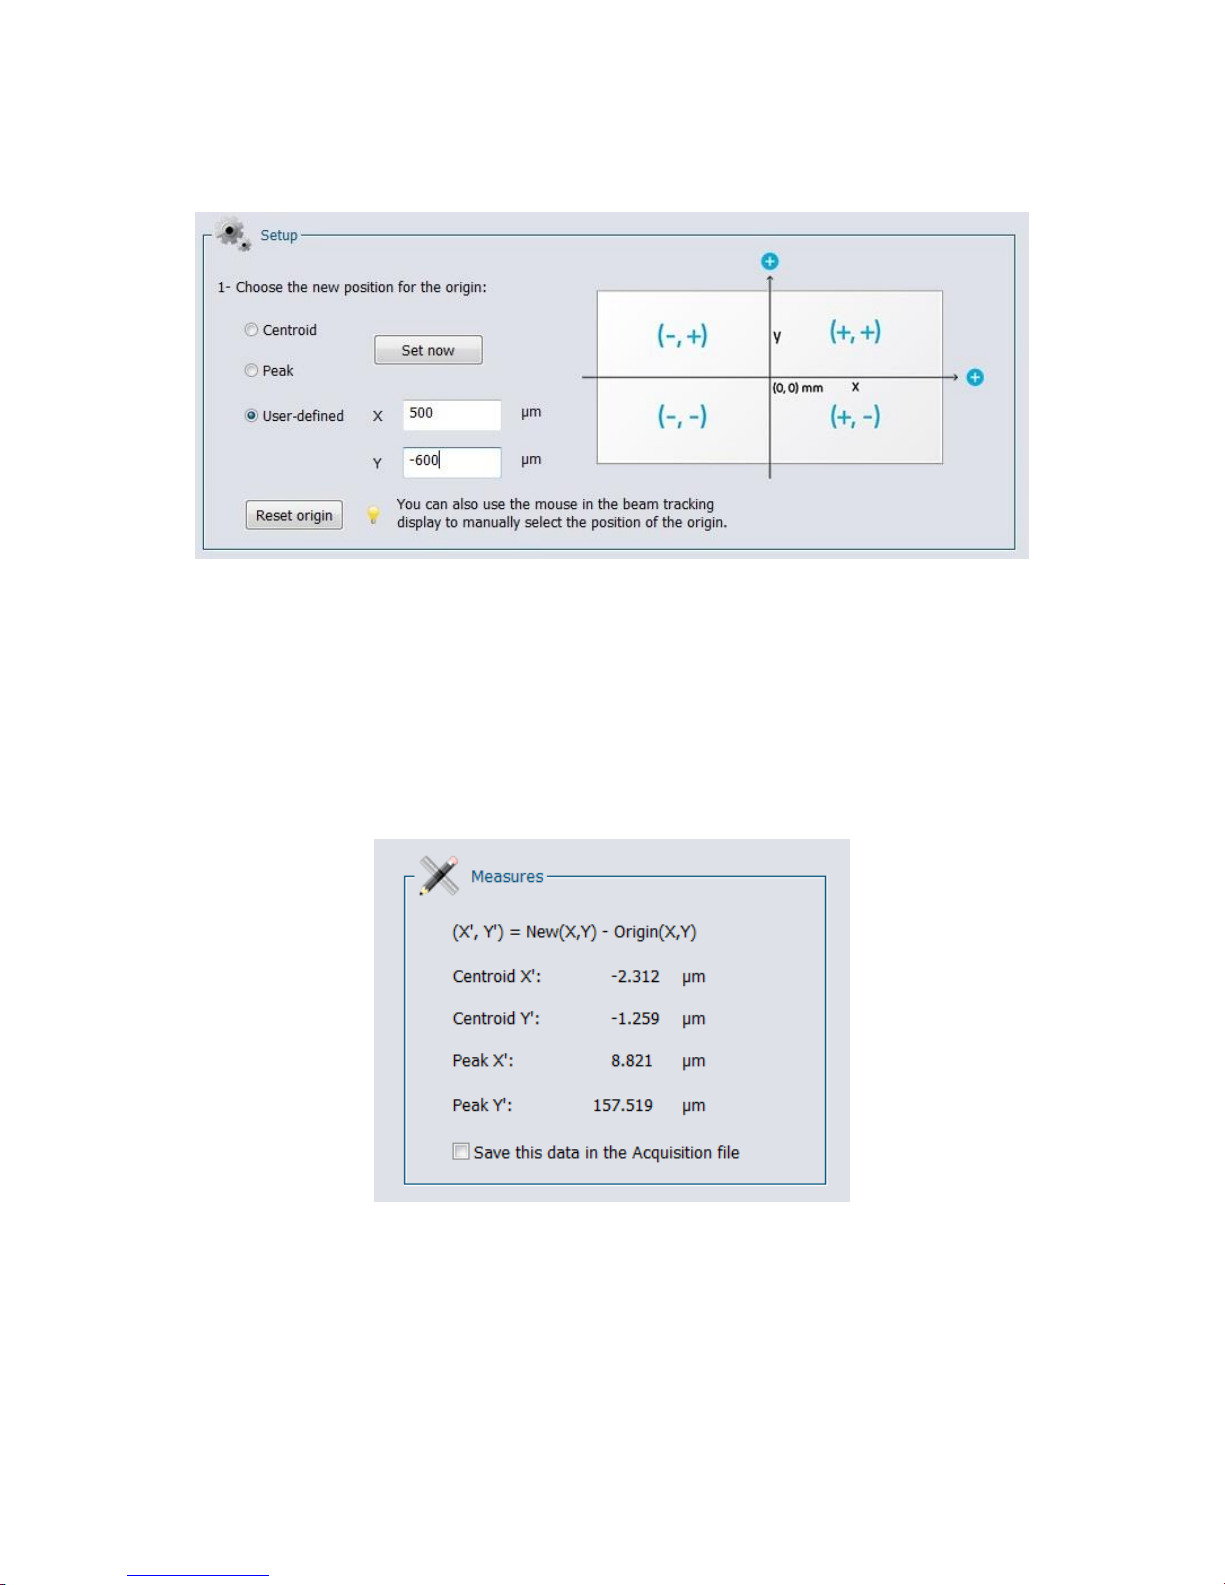
Beamage Series User Manual Revision 9.0 53
point, the coordinate values for both X and Y axes will automatically be set beside “User-defined” in the
“Relative Position” tab.
Figure 5-14 Coordinates Defined by User
To set the origin back to its default position (0,0), click on the “Reset origin” button below “User-defined”.
This will also automatically select the default option “Centroid” for the origin position.
5.5.2. Measures
Once the origin position is determined by the user, the software will calculate the difference between the
coordinates of this new position and the latest computed centroid or peak coordinates. The results are
displayed in the “Measures” section of the “Relative Position” tab.
Figure 5-15 Measures Section
It is possible to save the data in the Acquisition file. To do so, select the “Save this data in the Acquisition
file” option at the bottom of the “Measures” section.
Page 55
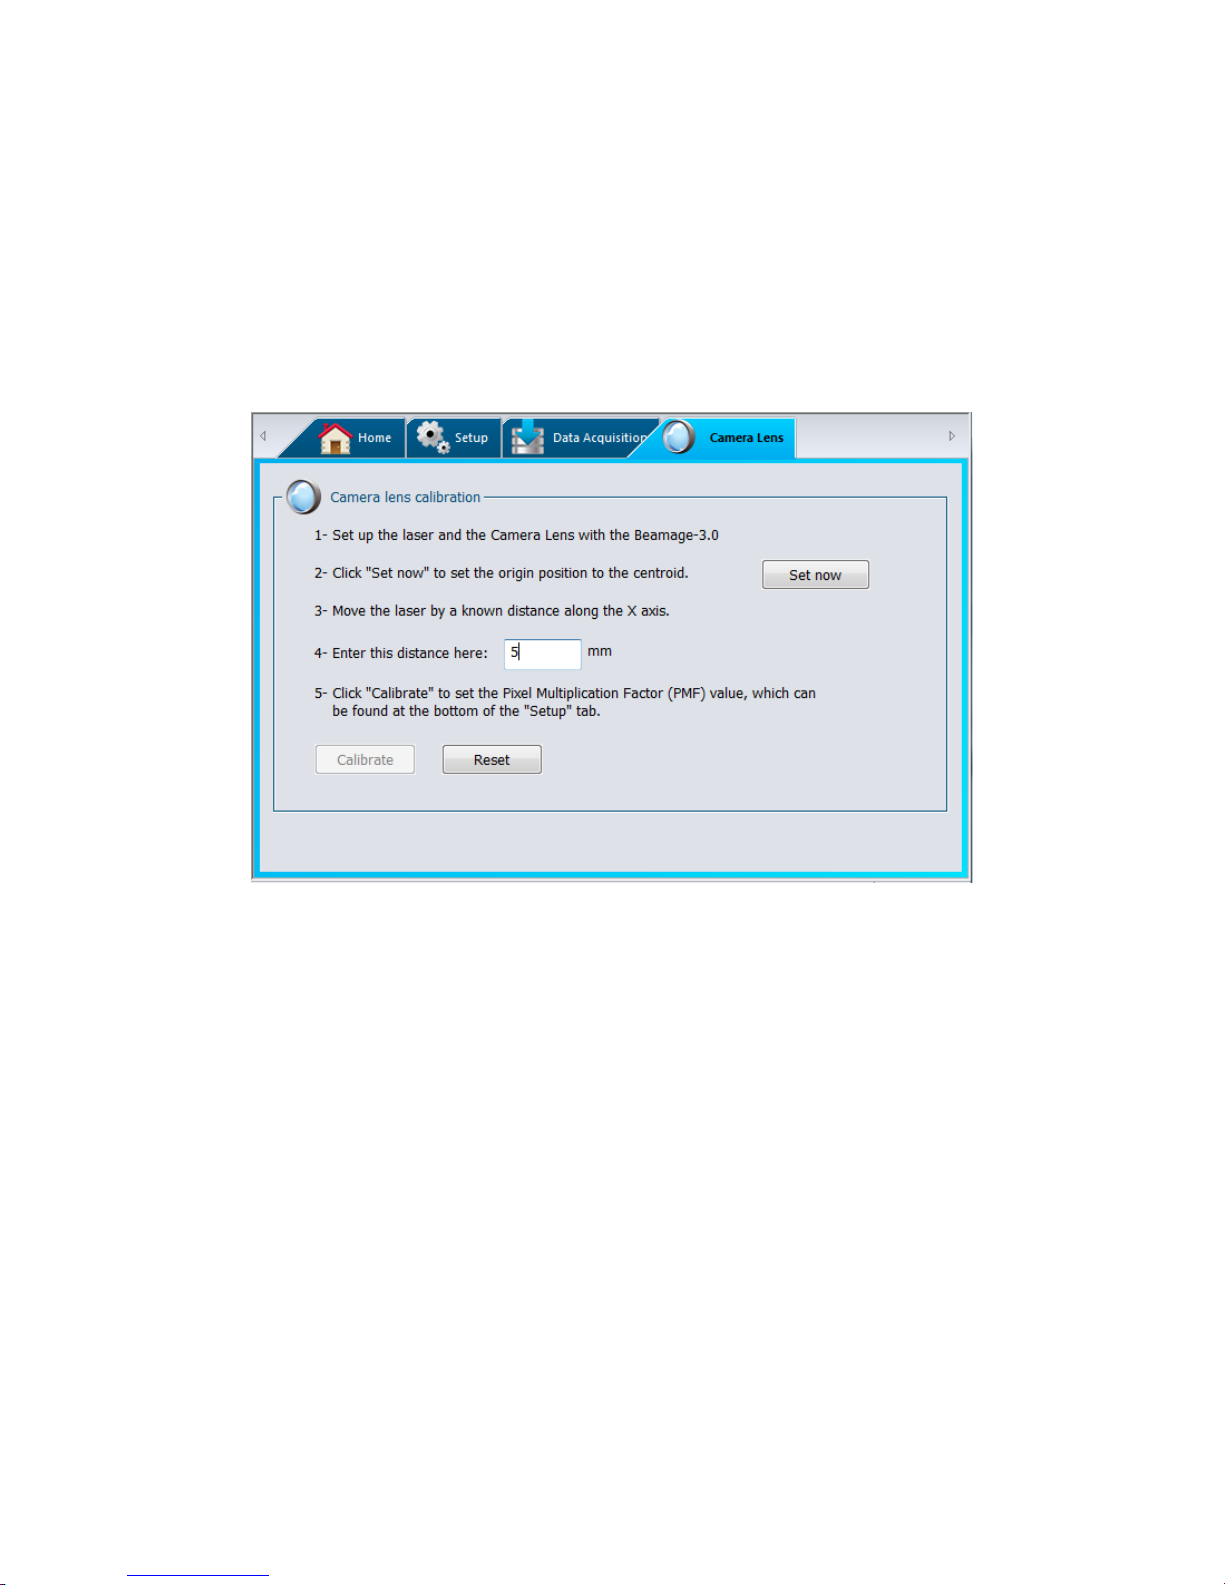
Beamage Series User Manual Revision 9.0 54
5.6. CAMERA LENS
Prior to profiling a beam with a camera lens, one must adjust the Pixel Multiplication Factor of the lens
(see section 5.2.8).
The “Camera lens calibration” section allows the user to calibrate the PC-Beamage software when a
camera lens is used with the Beamage. This panel is accessible by clicking “Calibrate” in the “Pixel
Multiplication Factor” section in the “Setup” panel or in the “Show/Hide Options” in the Ribbon.
Figure 5-16 Camera Lens Calibration Section
1. Set up the laser and the camera lens with the Beamage.
2. Click on “Set now” to set the centroid to the current position
Page 56
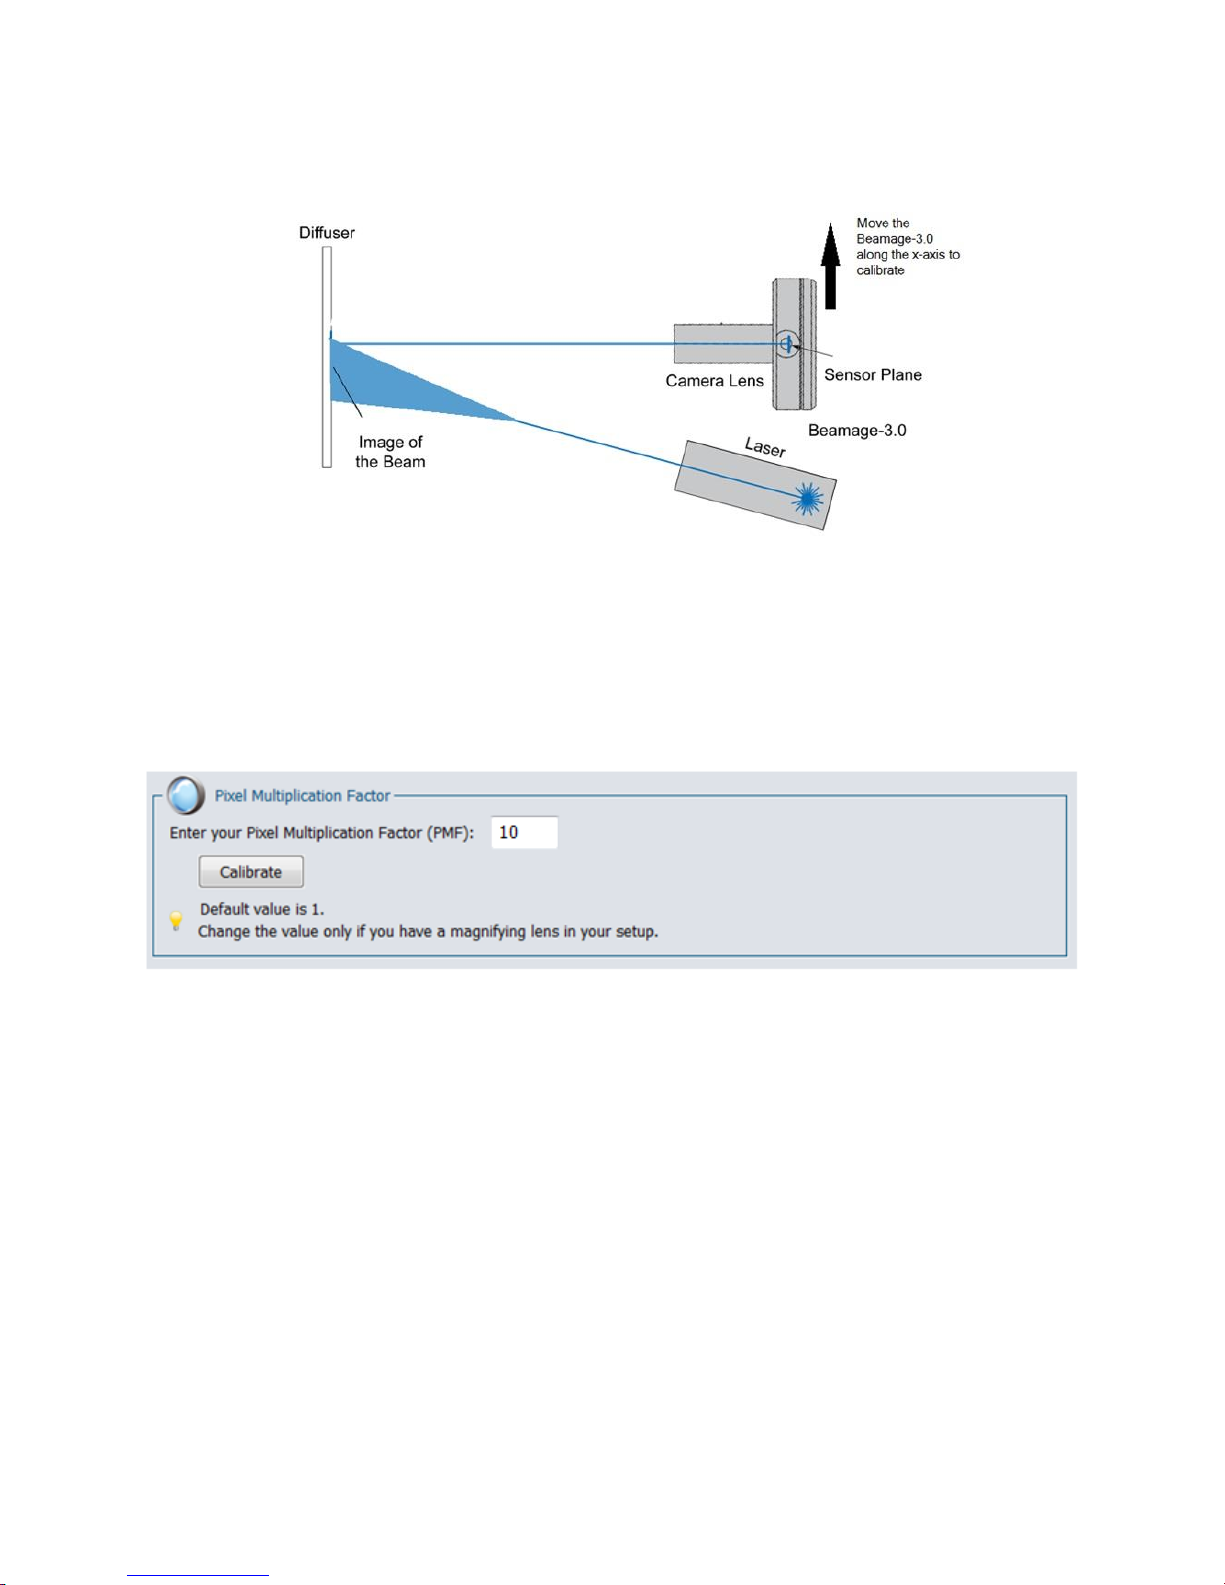
Beamage Series User Manual Revision 9.0 55
3. Then, move the laser source (or the Beamage camera) by a known distance along the X axis,
parallel to the diffuser.
Figure 5-17 - Camera Lens Calibration Moving Direction
4. Enter this distance (in mm) in the appropriate box and press enter.
5. Finally, click on the “Calibrate” button to automatically set the Pixel Multiplication Factor (PMF)
value found in the bottom of the “Setup” tab. Once the PMF is set, the beam dimensions will be
adjusted to compensate for the magnification of the camera lens (Beam Tracking Display).
Figure 5-18 Pixel Multiplication Factor Section
6. To return to original values for the Pixel Multiplication Factor, click on “Reset”
5.7. FIXED CROSSHAIR
5.7.1. Center Setup
To activate the fixed crosshair center option, go to the “Home” panel, in the “Main Controls” section and
choose the Fixed option for the crosshair center. This will automatically open the “Fixed Crosshair” panel.
Page 57
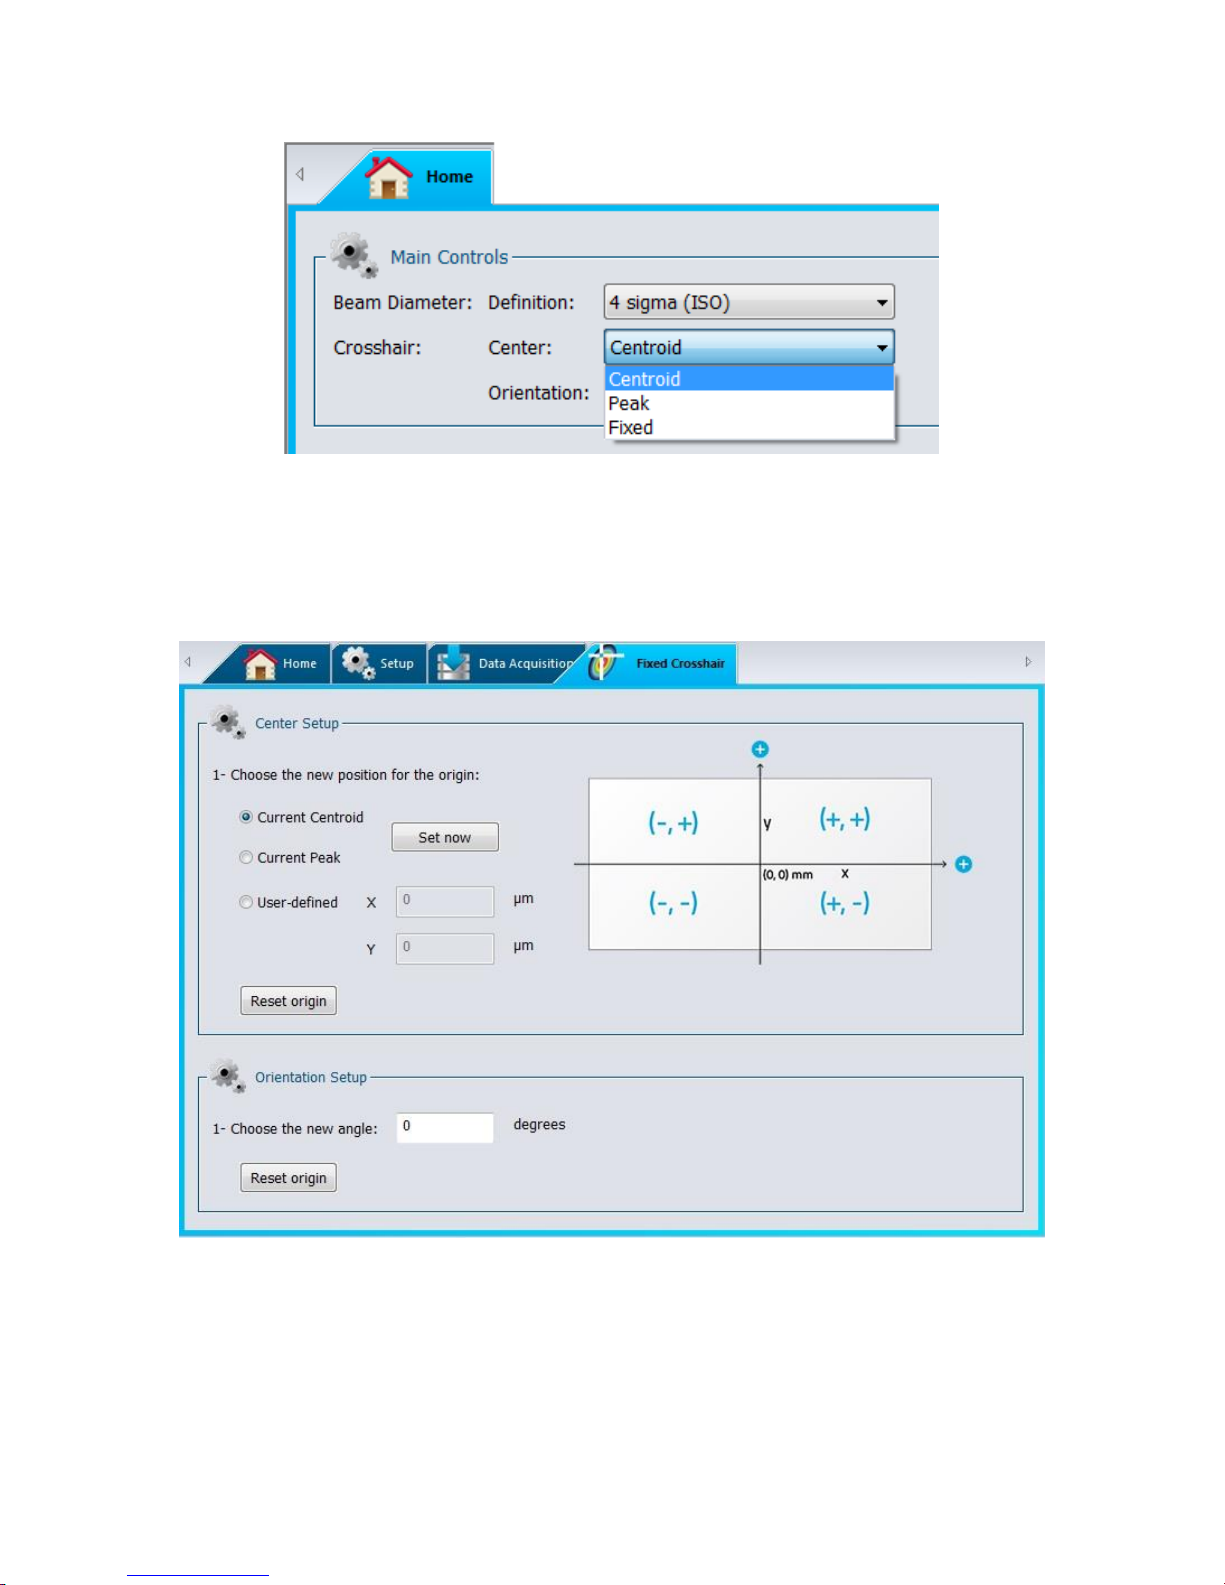
Beamage Series User Manual Revision 9.0 56
Figure 5-19 Fixed Crosshair Center Section
The “Center Setup” section, which displays the coordinate system of the sensor on the right side, allows
the user to select the parameter that will be considered as the origin of the crosshairs (0,0).
By selecting “Centroid” and clicking “Set now”, the user chooses to position the origin of the crosshairs at
the calculated centroid position (center of energy). By selecting “Peak” and clicking “Set now”, the user
chooses to position the origin of the crosshairs at the calculated peak energy position (highest measured
value). The option “User-defined”, allows the user to manually enter the origin of the crosshairs at a
defined position in both the X and Y axes.
Figure 5-20 Fixed Crosshair Section
Page 58
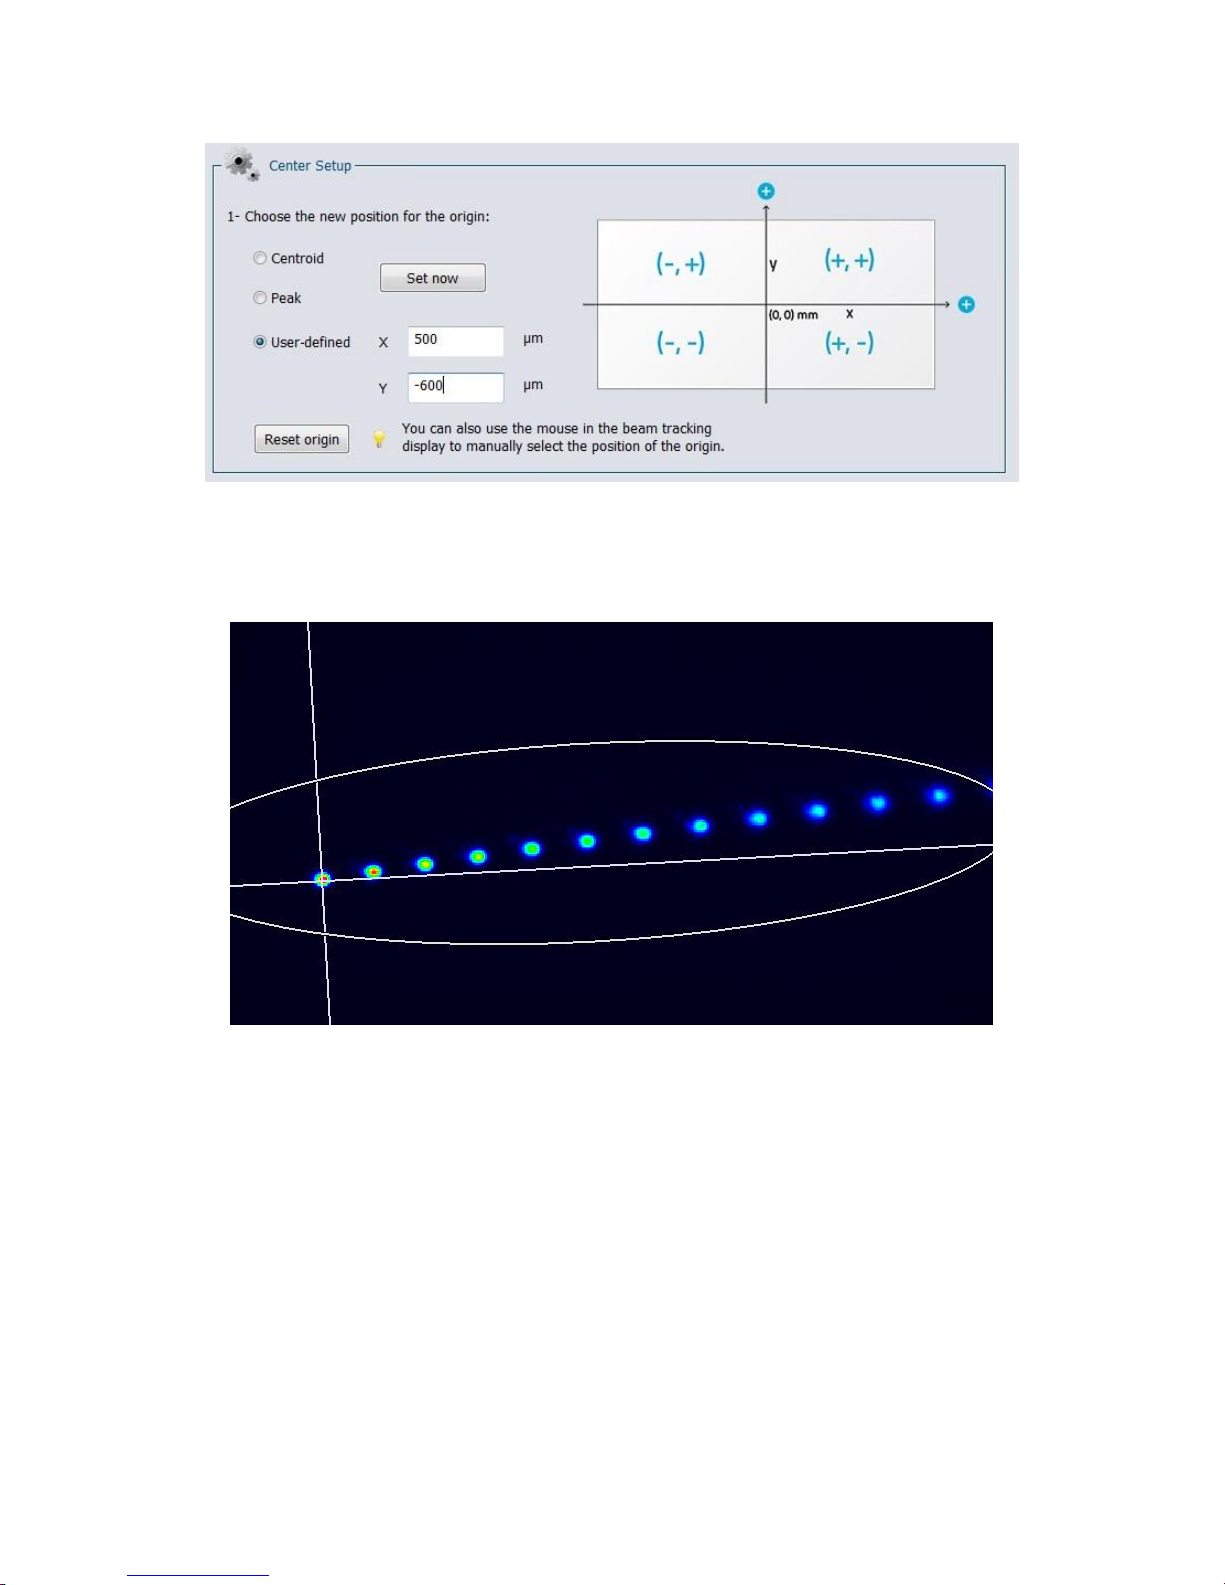
Beamage Series User Manual Revision 9.0 57
Figure 5-21 User-Defined Origin
Once the origin of the crosshairs is determined by the user, the software will be able to see the crosshairs
from this particular origin in the 2D Display.
Figure 5-22 Fixed Crosshairs at Peak Position in the 2D Display
Page 59
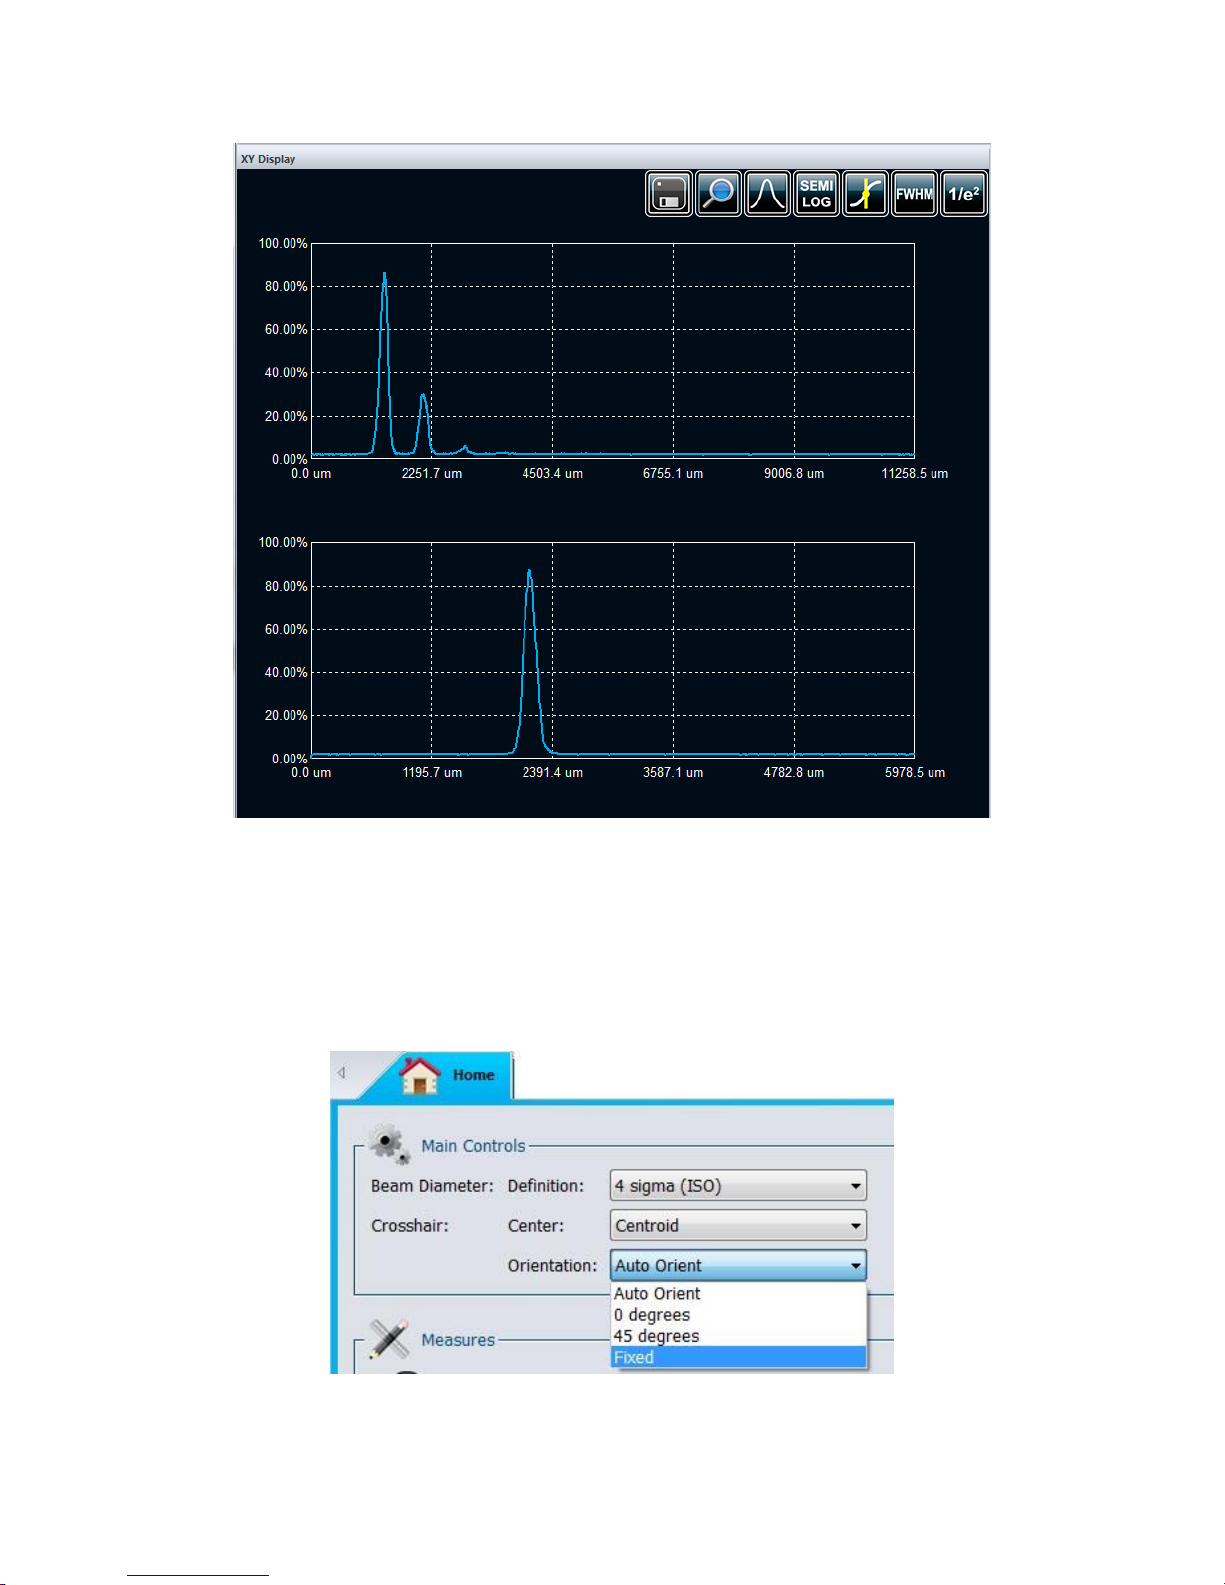
Beamage Series User Manual Revision 9.0 58
Figure 5-23 Fixed Crosshairs at Peak Position in the XY Display
5.7.2. Orientation Setup
To activate the fixed crosshair orientation option, go to the “Home” panel, in the “Main Controls” section
and choose the Fixed option for the crosshair orientation. This will automatically open the “Fixed
Crosshair” panel.
Figure 5-24 Fixed Crosshair Orientation Section
Page 60
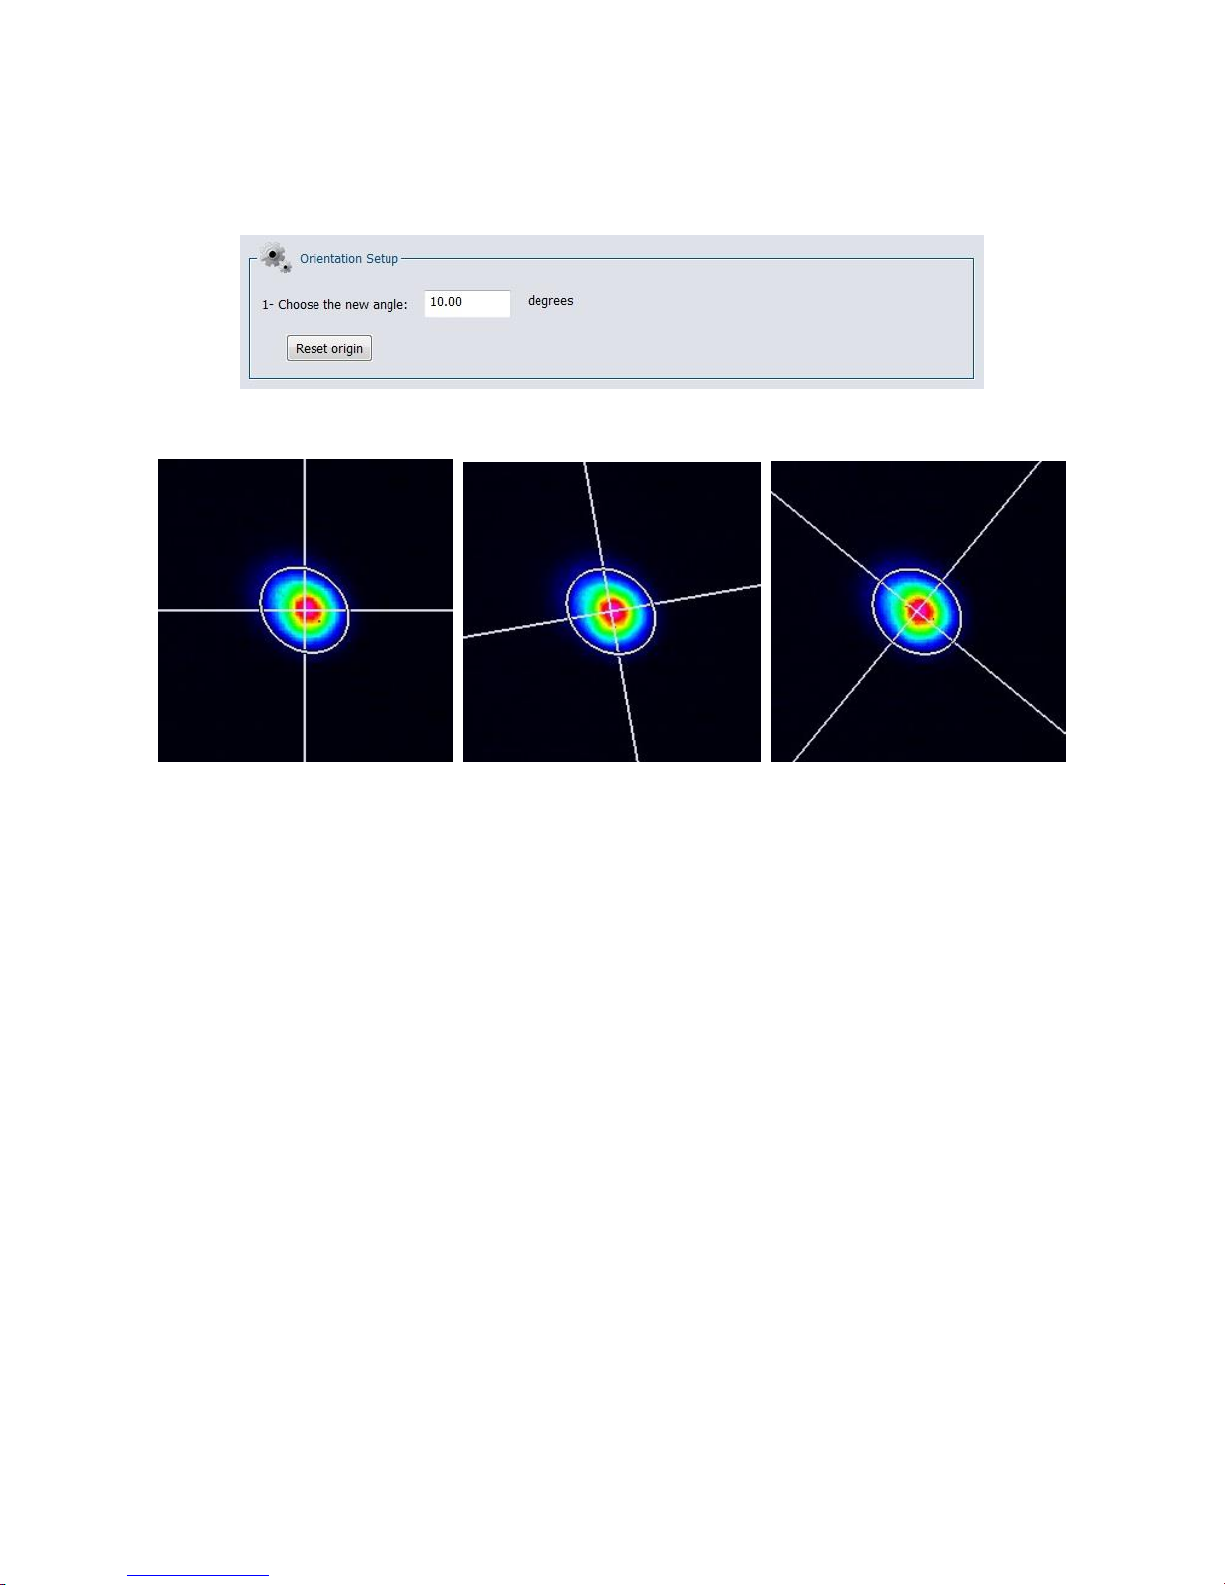
Beamage Series User Manual Revision 9.0 59
The “Orientation Setup” section allows the user to set the crosshair orientation. Once the orientation of
the crosshairs is determined by the user, the software will be able to see the crosshairs at this particular
angle with respect to the sensor’s main axes.
Figure 5-25 User-Defined Crosshair Orientation
0.00 degrees 10.00 degrees Auto Orient
Figure 5-26 Different Crosshair Orientations for the Same Beam
Page 61
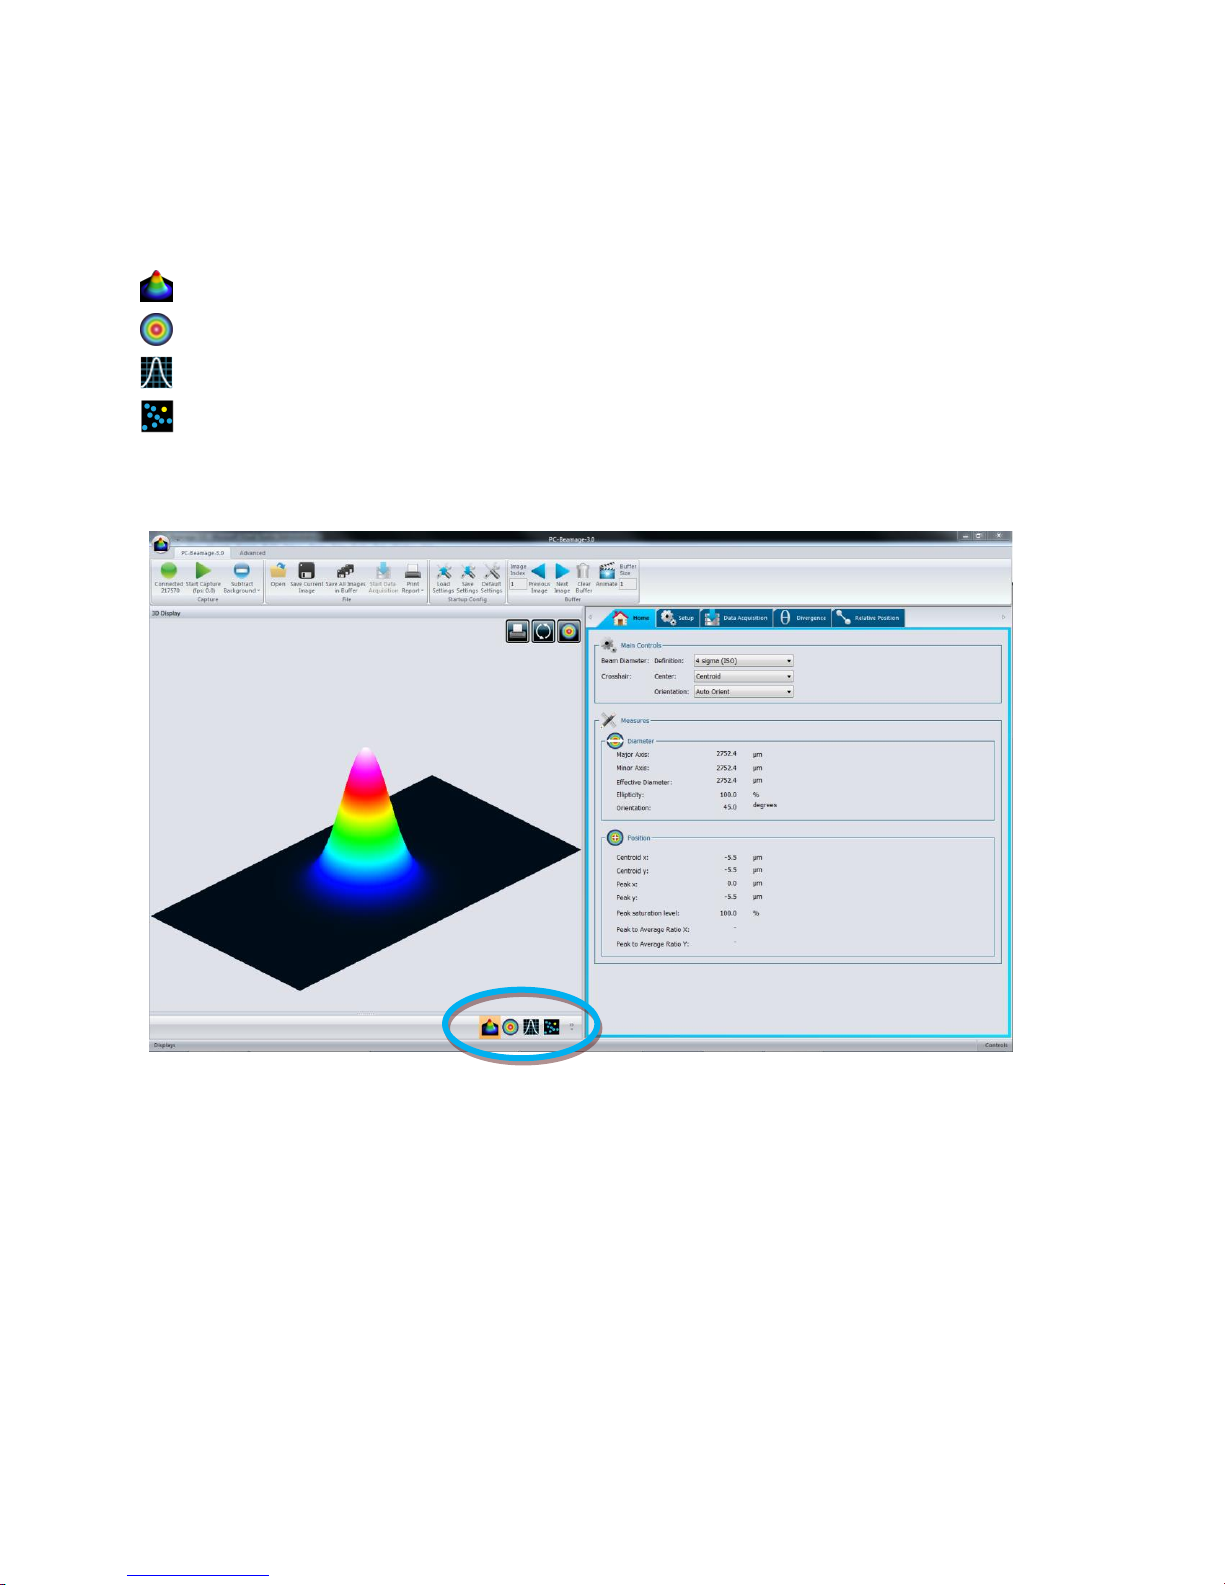
Beamage Series User Manual Revision 9.0 60
3D Display: A real time display of the beam intensity in a 3D representation.
2D Display: A real time display of the beam intensity in a 2D representation.
XY Display: A real time display of the beam’s XY cross-sectional graphs along the crosshairs.
Beam Tracking Display: A real time display of the beam’s position stability
6. DISPLAY PANEL
The PC-Beamage offers four different graphical displays to view and analyze the laser beam.
To choose the desired display mode, click on the corresponding icon in the lower control bar under the
display panel.
Figure 6-1 Display Panel
6.1. 3D DISPLAY
The 3D Display represents the beam’s intensity in three dimensions. False coloring is added to increase
the contrast. The color legend used for the various intensity levels is available in the “Main Controls”
ribbon (refer to section 4.8.1).
To rotate the image, hold down the left button on the mouse and move the mouse. The scroll button on
the mouse zooms the image in or out. It is also possible to zoom in the image by pressing the “+” key on
the keyboard and similarly, it is possible to zoom out the image by pressing the “-“ key on the keyboard.
Pressing the Ctrl button while holding down the left mouse button will pan the 3D image along its Y axis.
Doing the same procedure with the Shift button pans the 3D image along its X axis.
Page 62
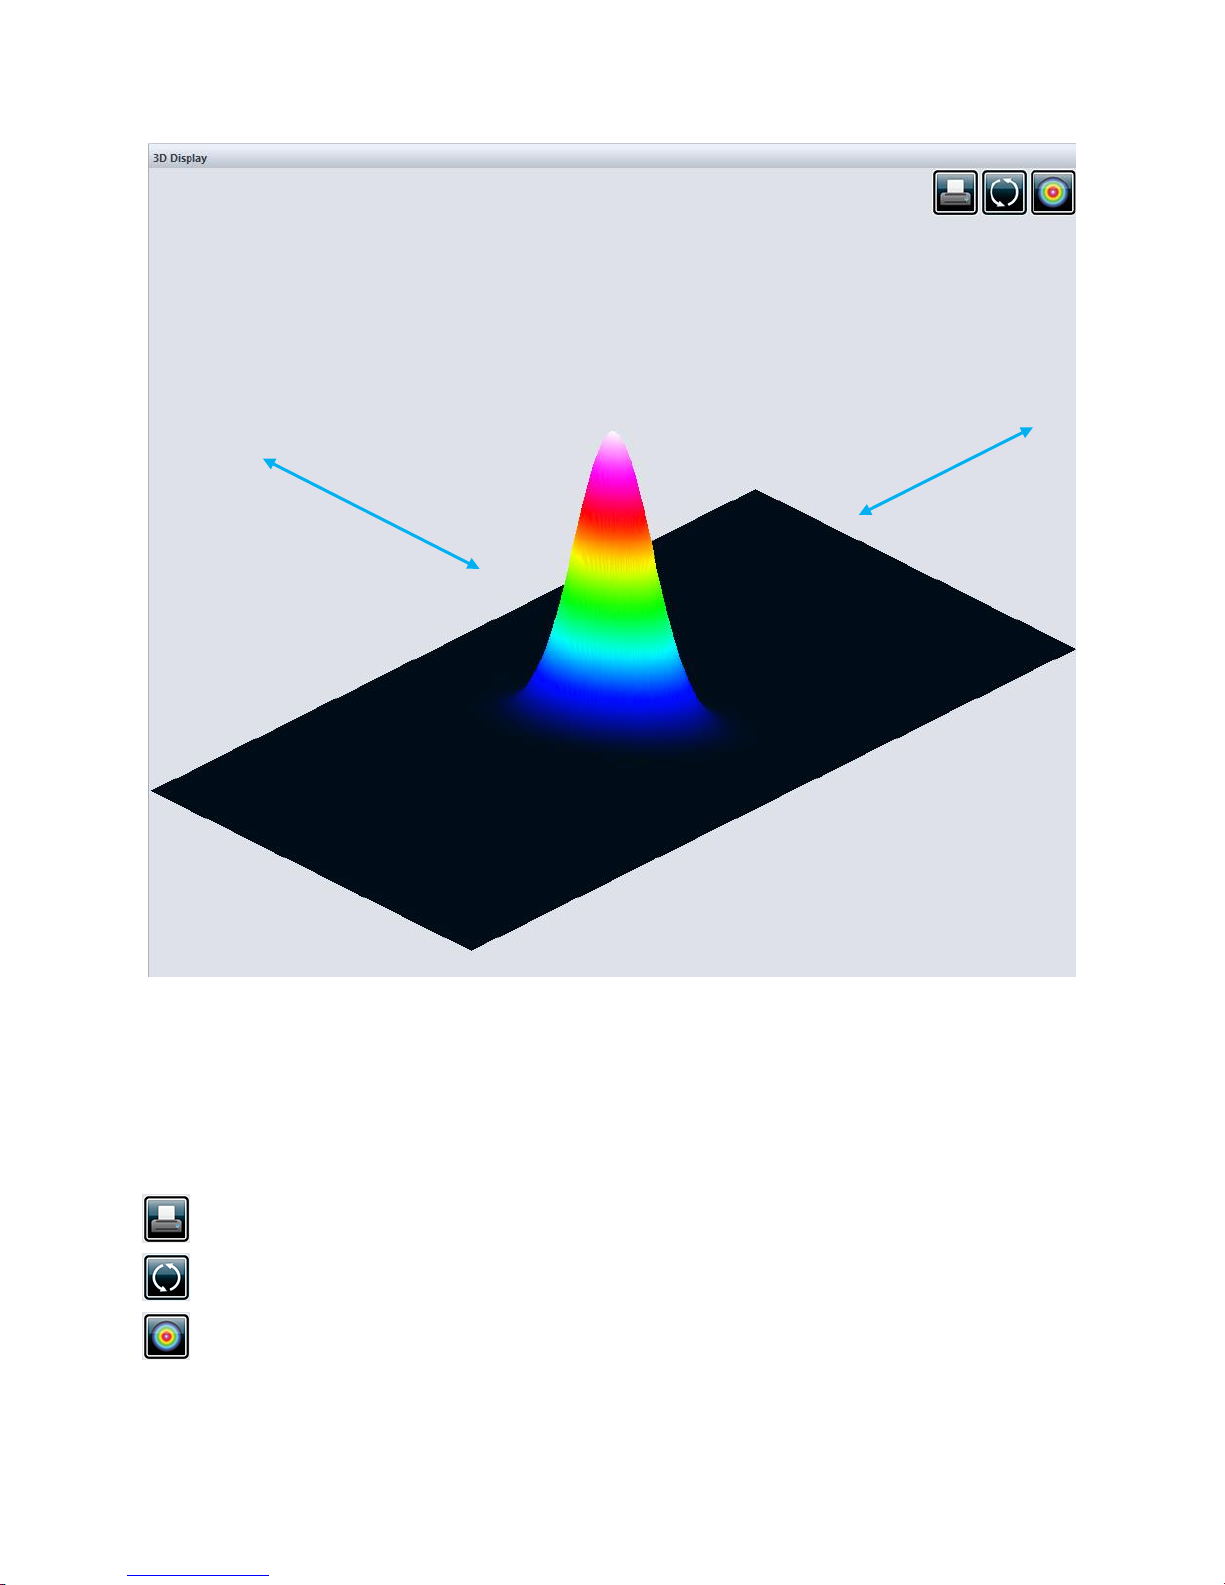
Beamage Series User Manual Revision 9.0 61
Print Screen: Saves a *.BMP image of the current 3D display.
Reset View: Resets the display to its original parameters.
Top View: Views the 3D image from the top, creating a top-view projection.
Y axis
x axis
Figure 6-2 3DDisplay
6.1.1. 3D Display: Controls
The toolbar buttons on the upper right corner control the 3D image.
Page 63
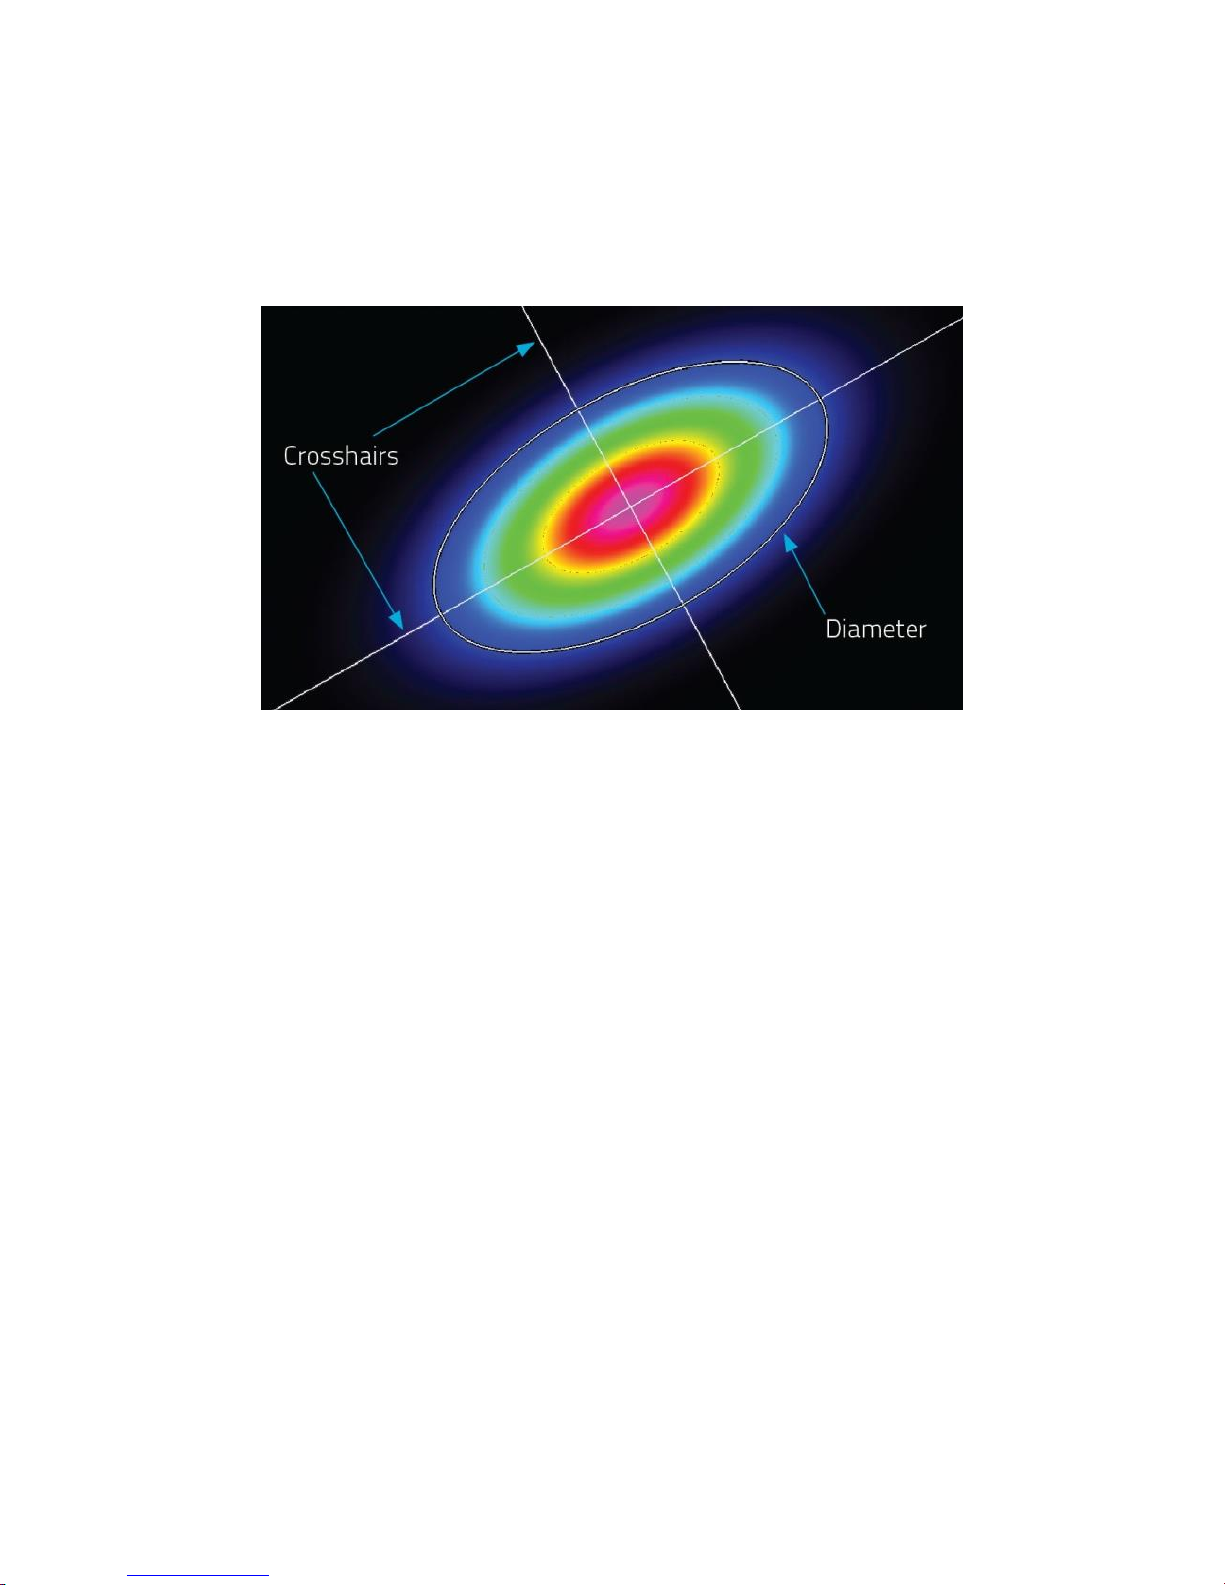
Beamage Series User Manual Revision 9.0 62
6.2. 2D DISPLAY
The 2D Display represents the beam’s intensity in two dimensions. False coloring is added to increase
the contrast. The color legend used for the various intensity levels is available in the “Main Controls”
ribbon (refer to section 4.8.1). The 2D display also features the crosshairs (set to the major and minor
axis or along specified angles).
Figure 6-3 2D Display Showing Crosshairs and Diameter Positions
To optimize the software’s performance, the resolution of the 2D image is downsampled when the
Beamage is streaming. Nonetheless, the computation is done on all transferred pixels. For images larger
than 1000x1000 only 1/16 pixels are displayed, for images larger than 500x500 only 1/4 pixels are
displayed and for smaller images all pixels are displayed. When the Beamage is stopped or in the
animate mode, all pixels are always displayed regardless of the image size.
Page 64
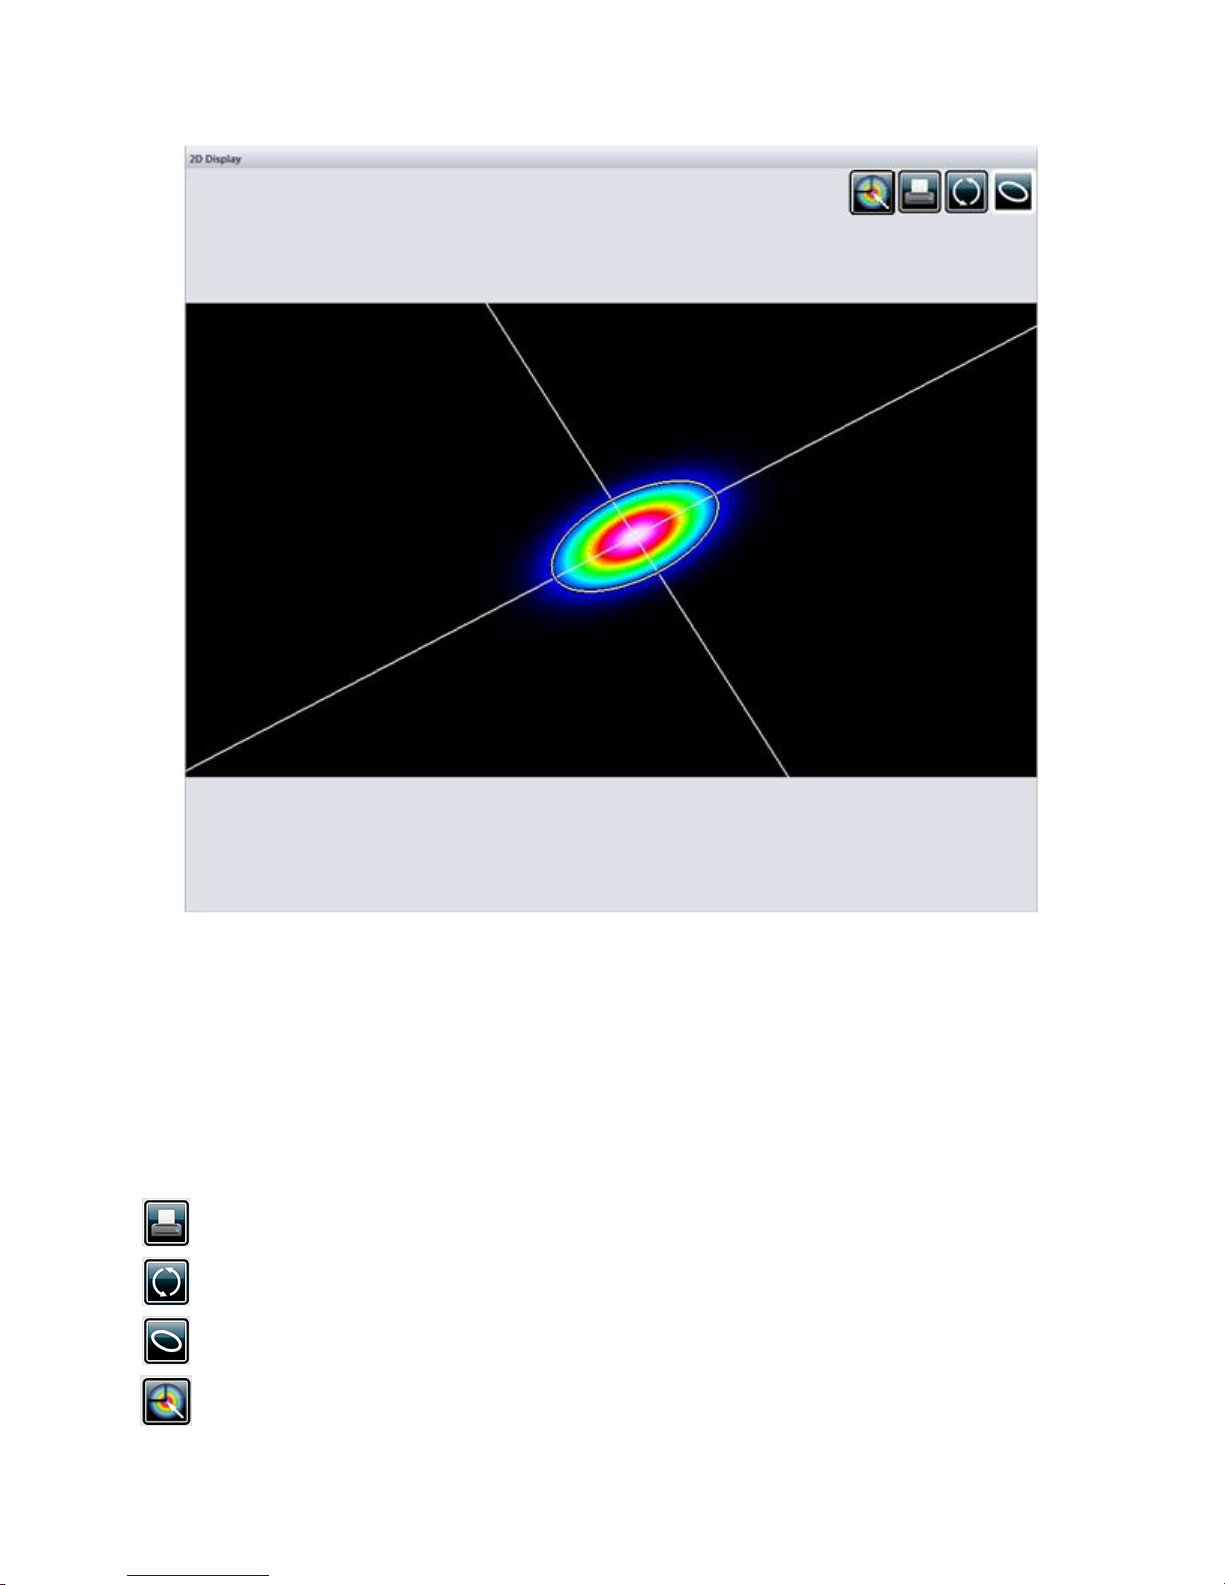
Beamage Series User Manual Revision 9.0 63
Print Screen: Saves a *.BMP image of the current 2D display.
Reset View: Resets the view settings to its original parameters.
Show/Hide Diameter: Displays the ellipse corresponding to the beam diameter (refer to section
5.1.1.1).
Select Active Area: Selects with cursor an active area.
Figure 6-4 2D Display
To translate the image, hold down the left button on the mouse and move the mouse. The “up arrow”,
“down arrow”, “left arrow” and “right arrow” will also move the image accordingly. The scroll button on the
mouse zooms the image in or out. It is also possible to zoom in the image by pressing the “+” key on the
keyboard and similarly, it is possible to zoom out the image by pressing the “-“ key on the keyboard.
6.2.1. 2D Display: Controls
The toolbar buttons on the upper right corner control the 2D image.
Page 65
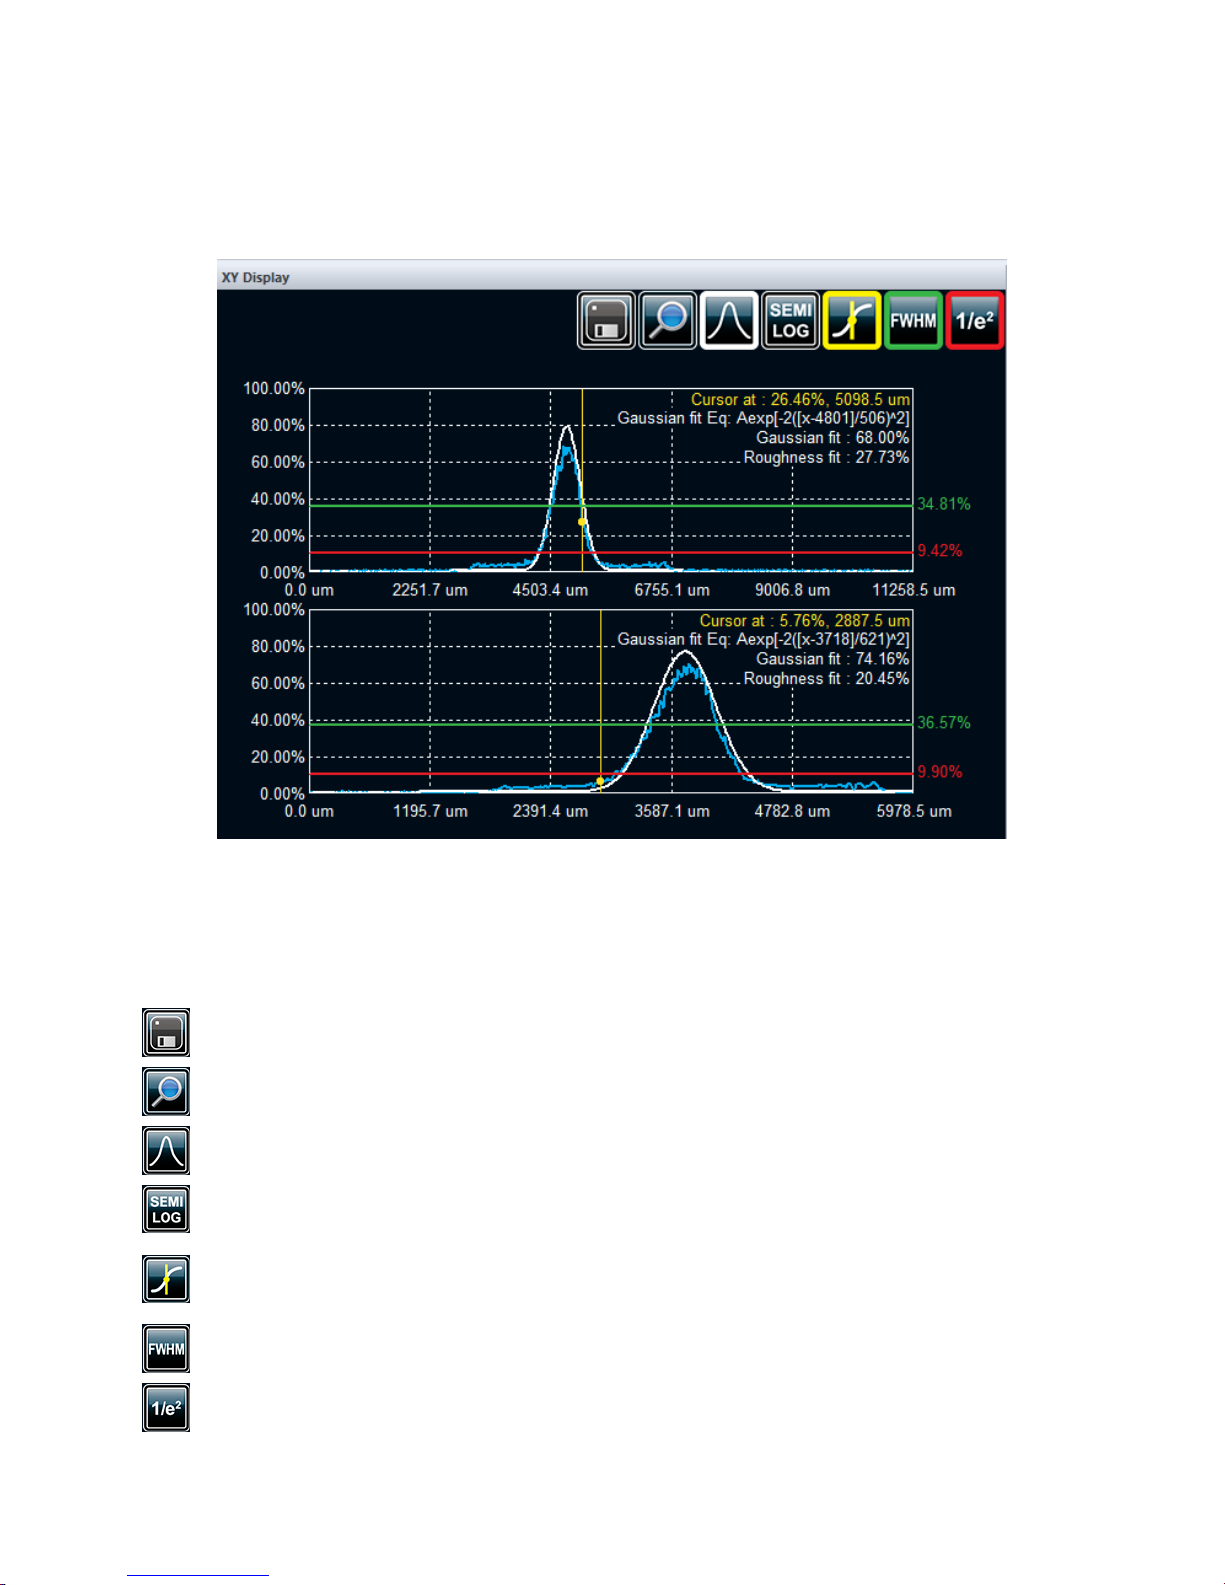
Beamage Series User Manual Revision 9.0 64
Save: Saves the crosshair information in a *.TXT file. If the “Gaussian Fit” was activated, the
crosshair information of the Gaussian fit will also be saved in the file.
Zoom: Activates the zoom for both graphics individually. Zooming can be done by selecting an
area with the left mouse button. Double-clicking the image returns it to the original state.
Gaussian Fit: Shows/Hides the best fitted Gaussian along the experimental curve. Refer to
section 6.3.2 for more information.
Semi-Log: Transforms the linear graphics to semi-logarithmic graphs to enhance the details in the
low intensity parts of the beam.
Cursor Position: Shows/Hides a cursor on each graph with their intensity and position value in
the graph’s upper right corner. The cursors are positioned by clicking on the desired spots with the
left mouse button.
FWHM: Shows/Hides the level corresponding to the half maximum value.
1/e2: Shows/Hides the level corresponding to the 1/e2 value.
6.3. XY DISPLAY
The “XY display” plots cross-sectional graphs of the beam along the crosshairs. The crosshairs position
and orientation are defined in the “Home” tab (refer to section 5.1.1.2)
Figure 6-5 XY Display
6.3.1. XY Display: Controls
The toolbar buttons on the upper right corner control the XY graphics.
Page 66
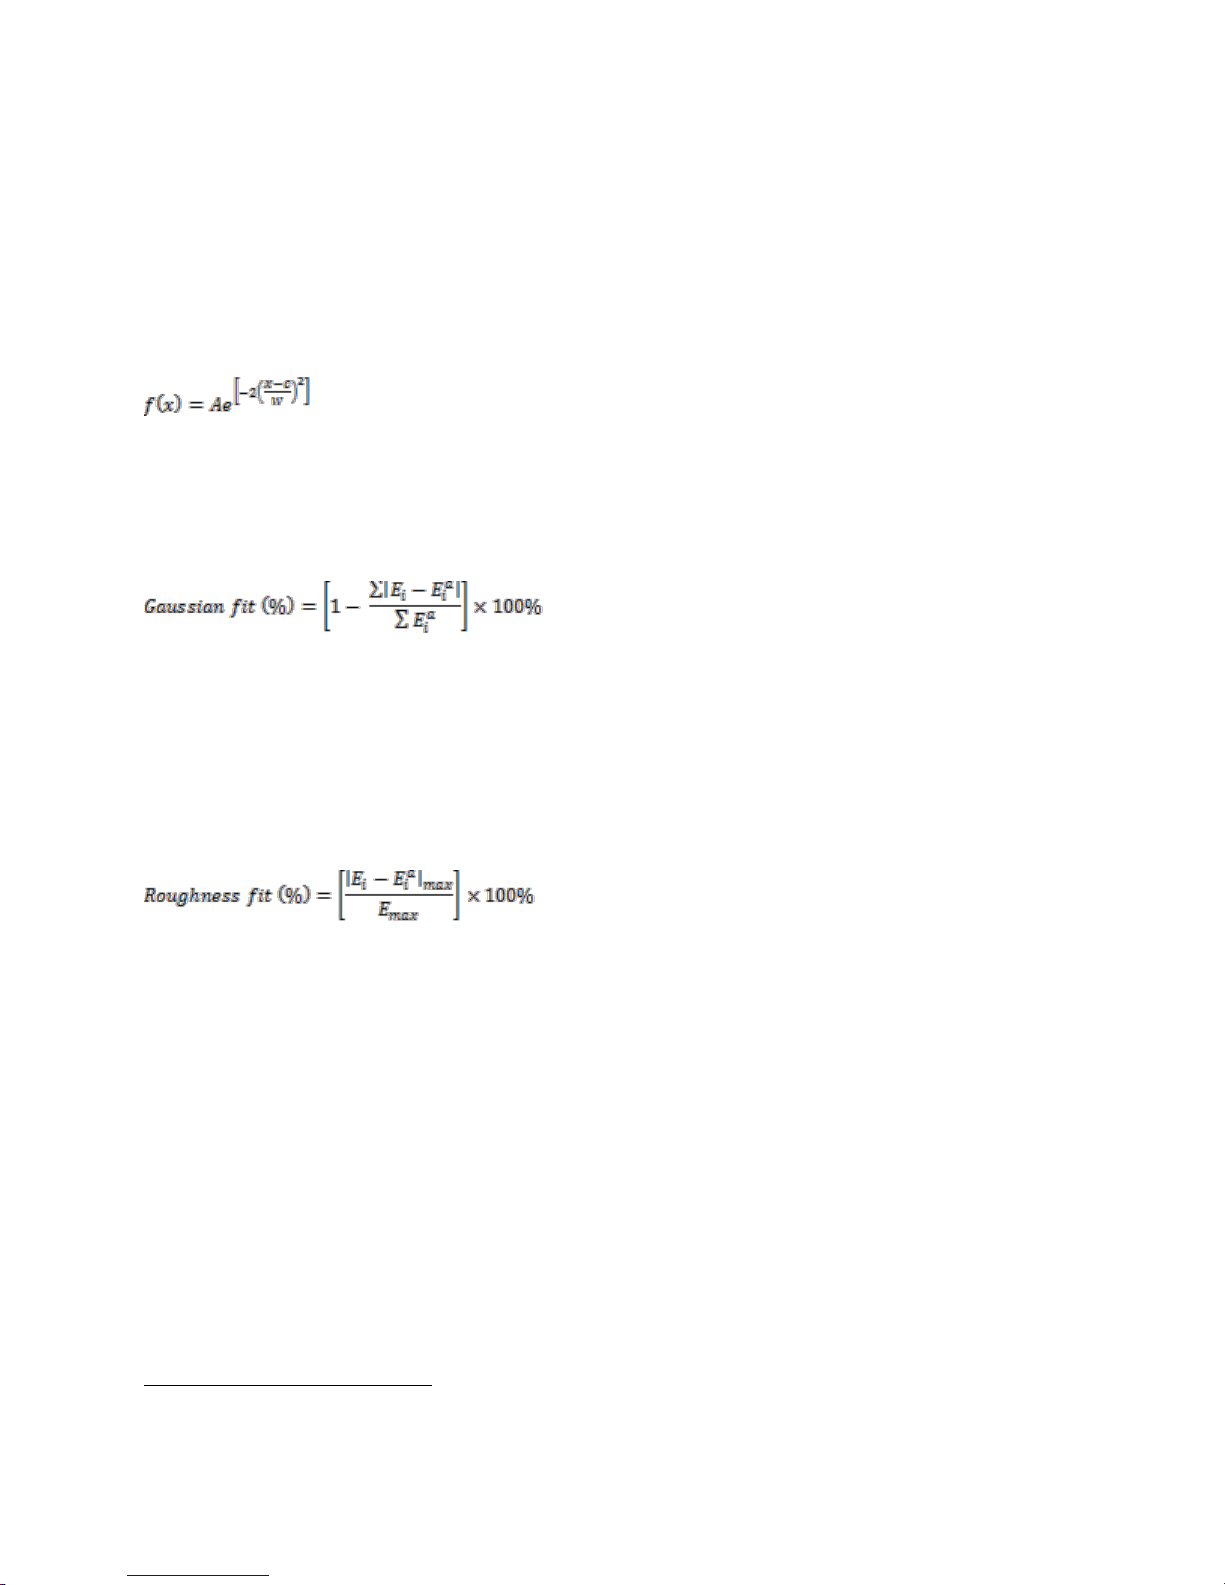
Beamage Series User Manual Revision 9.0 65
2
6.3.2. Gaussian Fit
The “Gaussian Fit” function fits the best Gaussian curve on the experimental data. When the “Gaussian
Fit” is activated, it displays three information on the graphic’s upper right corner.
6.3.2.1. The Gaussian equation
The first information to be displayed is the equation of the fitted Gaussian. The Gaussian equation is
defined by:
where w is the beam’s radius, c its centroid.
6.3.2.2. The Gaussian Fit factor
The Gaussian Fit factor is defined as:
where E is the experimental curve and Ea is the theoretical Gaussian curve.
The closer to 100%, the better the Gaussian fit.
6.3.2.3. The Roughness Fit factor
The Roughness Fit factor is the maximum deviation between the theoretical Gaussian curve and the
measured curve, as defined by ISO13694:20002:
where E is the experimental curve and Ea is the theoretical Gaussian curve.
The closer to 0%, the better the Gaussian fit.
International Organization for Standardization, ISO 13694 :2000 Laser and laser-related equipment –
Test methods for laser beam power (energy) density distribution, Geneva
Page 67
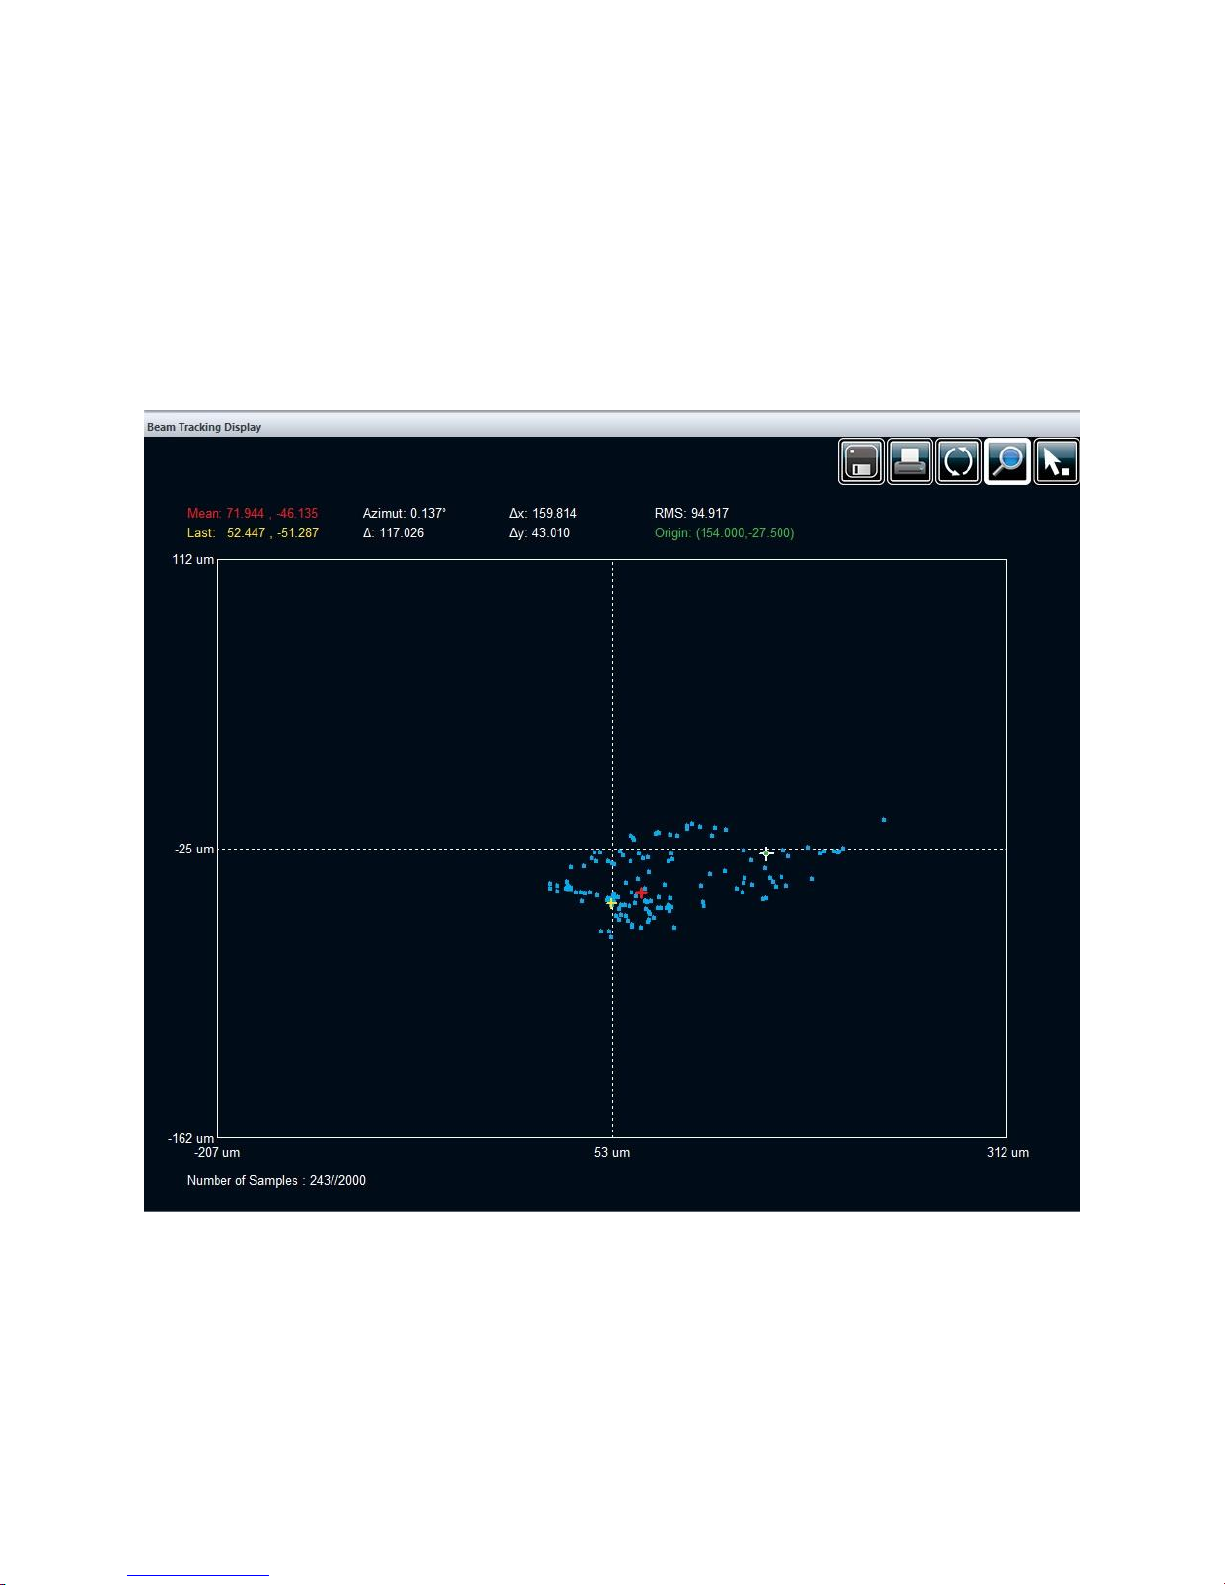
Beamage Series User Manual Revision 9.0 66
6.4. BEAM TRACKING DISPLAY
The “Beam Tracking Display” shows the variation of the position of the centroid on the sensor. The yellow
cross represents the last calculated centroid position while the blue dots represent the previous ones. A
dot is added to the chart at each computation. The buffer can memorize as many as 2000 calculations.
The buffer is circular, which means that once it is full, it replaces the oldest value in memory by a new
one. The mean position of all the centroid positions is represented by a red cross and the origin position
is represented by a large white cross with a green center.
Useful ISO 11670 compliant values appear above the chart. They give an indication on how much the
beam drifts from its mean position.
Mean: Coordinates of the mean position of the centroid.
Last: Coordinates of the last calculated position of the centroid.
Azimuth: Orientation for which the drift is maximal.
Figure 6-6 Beam Tracking Display
Page 68
Beamage Series User Manual Revision 9.0 67
Save: Saves all the centroid coordinates available in the buffer in a *.TXT file.
Print Screen: Saves a *.BMP image of the current beam tracking display.
Reset Buffer: Erases all the data from the buffer and clears the chart.
Zoom: Activates the zoom. Zooming can be done by selecting an area with the left mouse button
and de-zooming can be done by double-clicking the image.
Set Origin Point: Sets the origin point (0, 0) of the sensor for the relative positioning, Please refer
to section 4.6.5.2.
3
Δ: Overall beam positional stability
Δx: Beam positional stability in the azimuth direction.
Δy: Beam positional stability perpendicularly to the azimuth.
RMS : RMS standard deviation value of the centroid’s position (not ISO measure)
Origin: Relative position of the centroid
The beam positional stability values are based on the standard deviation concept3. Small values
represent small deviations and a good stability.
Please refer to Appendix A for ISO mathematical definitions of the quantities listed above.
6.4.1. Beam Tracking Display: Controls
The toolbar buttons on the upper right corner control the beam tracking plot.
International Organization for Standardization, ISO 11670:2003 Laser and laser-related equipment –
Test methods for laser beam parameters – Beam positional Stability, Geneva
Page 69

Beamage Series User Manual Revision 9.0 68
7. LABVIEW DRIVER
7.1. PC-BEAMAGE LABVIEW EXAMPLE VI’S
The PC-Beamage Software can be controlled from LabVIEW using the VI Library supplied by Gentec-EO.
They are individual VIs to implement each of the supported control and measurement functions. There is
also an example VI that demonstrates how to use the individual VIs to build a standalone LabVIEW
application. Before using the VIs, the PC-Beamage Software must be running, and the LabVIEW Pipe
must be opened.
The VIs can be grouped into 6 basic categories.
1. Connection VIs
2. Control VIs
3. Measurement VIs
4. Display VIs
5. Activation VIs
6. Miscellaneous VIs
7.1.1. Connection VIs
Verify DLL.
This VI checks to ensure the required DLL file is present in the directory in which the LabVIEW VIs are
located.
Connect to PC Beamage.
This VI connects to the LabVIEW pipeline opened by the PC-Beamage software.
Disconnect from PC Beamage.
This VI disconnects from the LabVIEW pipeline opened by the PC-Beamage software.
7.1.2. Control VIs
Control Stop Capture.
This VI stops the capture from the PC-Beamage software and the Beamage USB Camera. Running this
VI is the same as pressing the Stop Capture button in the software.
Control Start Capture.
This VI starts the capture from the PC-Beamage software and the Beamage USB Camera. Running this
VI is the same as pressing the Start Capture button in the software.
The following Control VIs are Main Controls.
Control 4 Sigma.
This VI sets the Beam Diameter Definition Control in the PC-Beamage Software. Running this VI is the
same as pressing the selecting the 4 Sigma (ISO) control in the software.
Control FWHM.
This VI sets the Beam Diameter Definition Control in the PC-Beamage Software. Running this VI is the
same as pressing the selecting the FWHM control in the software.
Page 70

Beamage Series User Manual Revision 9.0 69
Control 1OVRe^2.
This VI sets the Beam Diameter Definition Control in the PC-Beamage Software. Running this VI is the
same as pressing the selecting the 1/e2 along crosshairs (13.5%) control in the software.
Control 86%.
This VI sets the Beam Diameter Definition Control in the PC-Beamage Software. Running this VI is the
same as pressing the selecting the 86% effective diameter (D86) control in the software.
Control Centroid.
This VI sets the Crosshair Center Control in the PC-Beamage Software. Running this VI is the same as
pressing the selecting the Centroid control in the software.
Control Peak.
This VI sets the Crosshair Center Control in the PC-Beamage Software. Running this VI is the same as
pressing the selecting the Peak control in the software.
Control Auto.
This VI sets the Crosshair Orientation Control in the PC-Beamage Software. Running this VI is the same
as pressing the selecting the Auto Orient control in the software.
Control Zero.
This VI sets the Crosshair Orientation Control in the PC-Beamage Software. Running this VI is the same
as pressing the selecting the 0 degrees control in the software.
Control 45.
This VI sets the Crosshair Orientation Control in the PC-Beamage Software. Running this VI is the same
as pressing the selecting the 45 degrees control in the software.
7.1.3. Measurement VIs
The measurement VIs for the Diameter and Position. Position VIs have separate VIs for the X and Y
measurements. Running the selected VI returns the reading from the software.
7.1.3.1. Diameter VIs.
Measure Effective Diameter
Measure Effective Diameter
Measure Ellipticity
Measure Orientation
Measure Peak Saturation
Measure Major Axis
Measure Minor Axis
Page 71

Beamage Series User Manual Revision 9.0 70
7.1.3.2. Position VIs.
These measurements are on the XY Display. Use the Display VIs to choose the XY Display and the
Activate VIs to set the software before requesting measurement data from the software.
Measure X 1OVRE^2 and Measure Y 1OVRE^2
Measure X Centroid and Measure Y Centroid
Measure X FWHM and Measure Y FWHM
Measure X Gaussian Equation and Measure Y Gaussian Equation
Measure X Gaussian Fit % and Measure Y Gaussian Fit %
Measure X Peak to Average and Measure Y Peak to Average
Measure X Peak and Measure Y Peak
Measure X Roughness Fit and Measure Y Roughness Fit
These measurements are on the TRACK Display. Use the Display VIs to choose the TRACK Display
before requesting measurement data from the software.
Measure X Last and Measure Y Last
Measure X Mean and Measure Y Mean
Measure X Delta and Measure Y Delta
Measure Azimuth
Measure Delta
Measure Number of Samples
Measure RMS
7.1.4. Display VIs.
These VIs decide which display the PC-Beamage software will use. Using them is the same as pressing
one of the four display buttons on the bottom of the software screen.
Display 2D. Switches to the 2 D display screen.
Display 3D. Switches to the 3 D display screen.
Display XY. Switches to the XY display screen.
Display TRACK. Switches to the Beam Track display screen.
Page 72

Beamage Series User Manual Revision 9.0 71
7.1.5. Activate VIs.
These VIs select which measurement the PC-Beamage software will use. Using them is the same as
pressing one of the four buttons on the top of the XY Display software screen. The Cursor Control Button
is not implemented in this release of LabVIEW VIs. You must run each of these VIs at last one time
before requesting the respective measurement.
Activate Gaussian.
Running this VI has the same effect as pressing the Gaussian button in the XY Display.
Activate LOG.
Running this VI has the same effect as pressing the SEMI LOG button in the XY Display.
Activate LIN.
Running this VI has the same effect as releasing the SEMI LOG button in the XY Display.
Activate FWHM.
Running this VI has the same effect as pressing the FWHM button in the XY Display.
Activate 1OVRE.
Running this VI has the same effect as pressing the 1/e2 button in the XY Display.
7.1.6. Miscellaneous VIs.
Query PC Beamage Version.
Returns the PC-Beamage software version.
Query Serial Number.
Returns the serial number of the camera that is currently connected to the software.
Read PC Beamage.
Interfaces with the DLL file to read data from the software.
Write PC Beamage.
Interfaces with the DLL file to write data to the software.
Stay or Go.
This VI is used to determine the behavior of the example application when it exits. If the example is being
run in the LabVIEW Development environment, it will stay in memory and stay loaded on exit. If it is being
run as an executable file, it will unload and clean memory when it exits.
Page 73
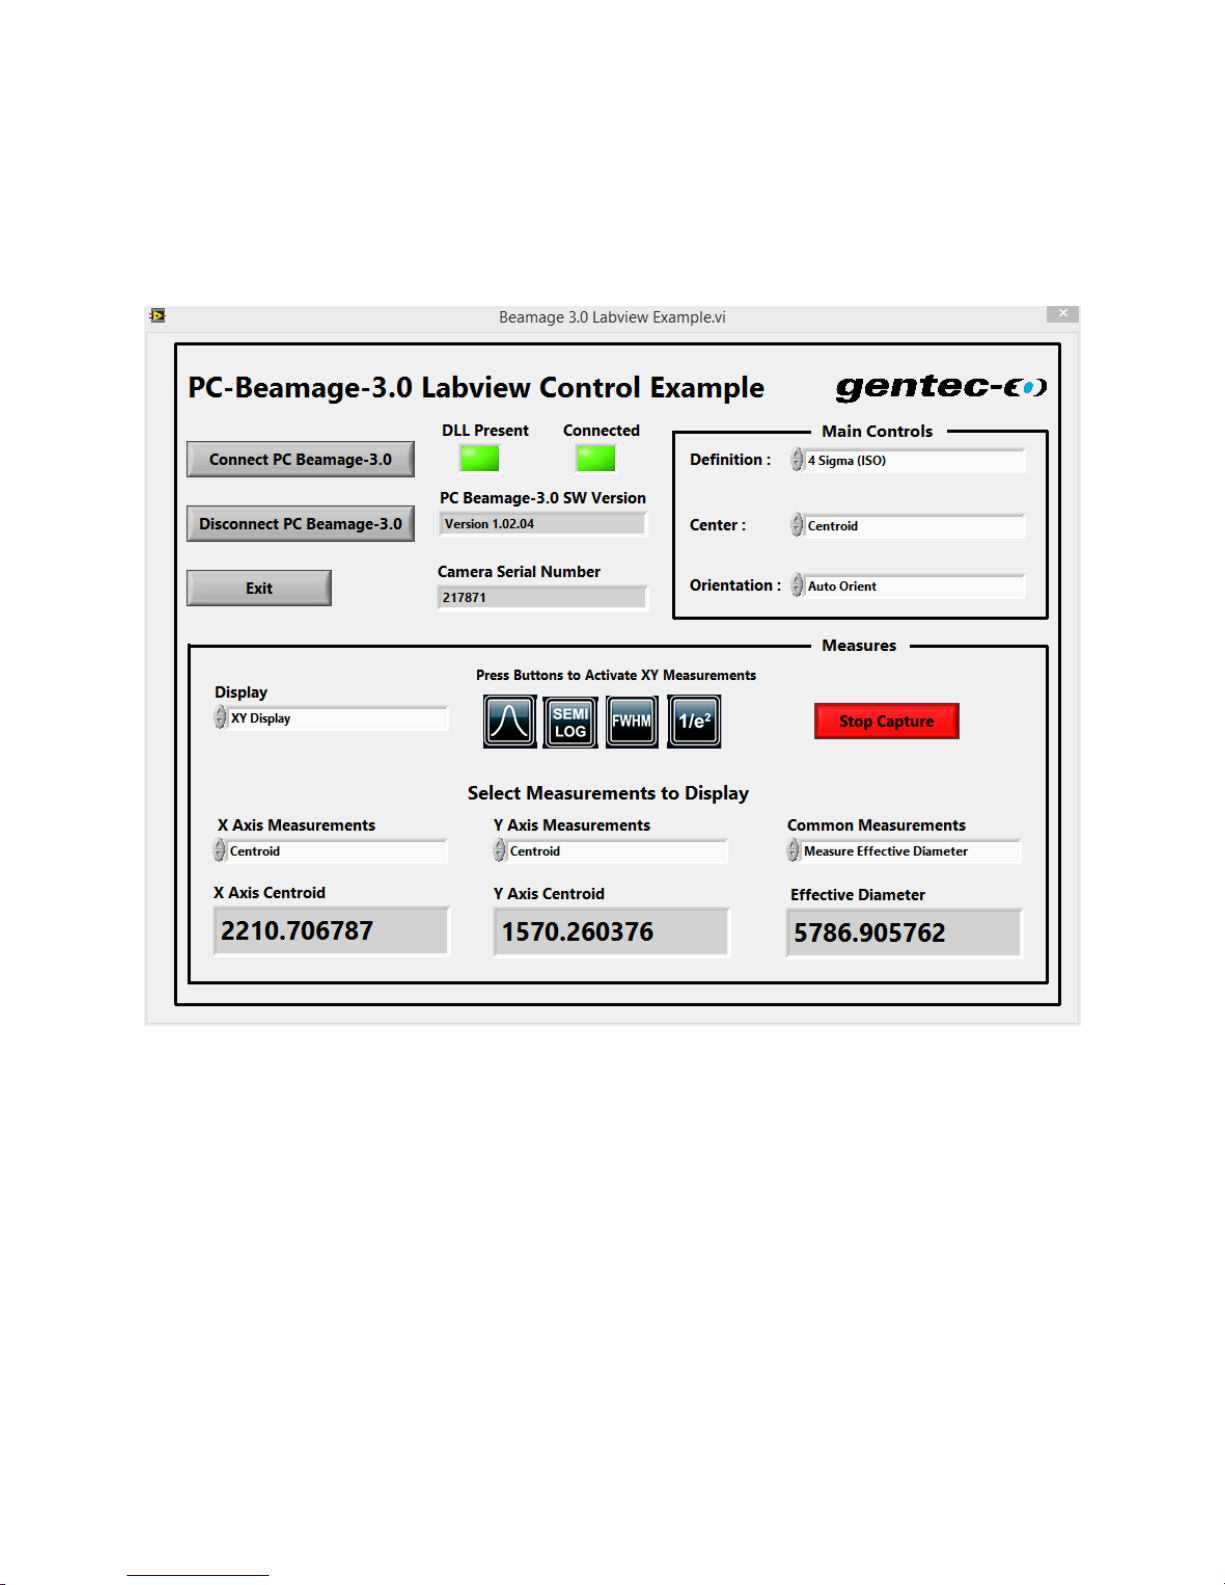
Beamage Series User Manual Revision 9.0 72
7.1.7. The Example VI.
The VIs have all been used to create an example software. The front panel of this example is shown
below.
The example is written to be easy to use and understand so as to aid in the development of custom
LabVIEW software. It uses an event structure to show the various controls. To use the example:
1. Copy the VIs into the folder of your choice, along with the supplied DLL file.
2. Start LabVIEW and run the example VI.
3. The VI will check to ensure the DLL is present. A warning will be issued if it cannot be located,
and the required location will be displayed. Place the DLL in that location.
4. Plug a Beamage Camera into a USB port on the PC in use. Start PC-Beamage and let it connect
to the camera.
Figure 7-1 - Beamage LabVIEW Example
Page 74

Beamage Series User Manual Revision 9.0 73
5. Under the Show/Hide Options menu item, select Start LabVIEW Pipeline. The PC-Beamage
software will verify the connection. You may now minimize the PC-Beamage software as LabVIEW
can now control the functions.
6. Press the Connect PC Beamage button on the LabVIEW software. The Connected LED will turn
on. The VI will ask the PC-Beamage for some information, and the software Version and Serial
Number indicators will appear.
7. Press the Start Capture button. The Selected measurements will activate. Use the Main, Display,
Activate buttons, and Measurements controls to select the desired measurements. The Activate
buttons are only visible when the XY Display is selected.
8. Pressing Disconnect or Exit will automatically stop all measurements and close the LabVIEW
pipeline.
Page 75

Beamage Series User Manual Revision 9.0 74
8. TROUBLESHOOTING AND TIPS
8.1. WHILE TRYING TO INSTALL PC-BEAMAGE, THE FOLLOWING MESSAGE APPEARS: THE
PROGRAM CAN’T START BECAUSE MSVCR100.DLL IS MISSING […]
You must download the missing dll from Microsoft software and install it on your computer:
32 bit: http://www.microsoft.com/download/en/details.aspx?id=5555
64 bit: http://www.microsoft.com/download/en/details.aspx?id=14632
8.2. BEAMAGE IS NOT DETECTED
Make sure the Beamage is connected to a USB 3.0 Super Speed port. The Beamage will work if plugged
directly in a USB 2.0 port at a slower transfer rate.
Close the software application, disconnect and reconnect the USB 3.0 to the Beamage and open the
software application. The LED indicator on the Beamage should blink in green and then in red before
turning on green. If the LED does not turn on at the software’s startup or if it does not turn on completely,
please contact your Gentec-EO representative or contact us at [email protected].
8.3. THE DISPLAY AREA IS COMPLETELY WHITE
Press the “Refresh” button and the display should come back.
8.4. CHANGING THE OPTICS IN FRONT OF THE BEAMAGE
Because the Beamage’s sensor does not have a coverglass, it is very sensitive to dust. Change the
optics in a clean environment and put the Beamage’s aperture facing down to minimize the dust.
8.5. SMALL BLACK SPOTS APPEAR ON THE IMAGE
If these small black spots do not change place even if you rotate the attenuation filter, it is probably dust
on the sensor. DO NOT TOUCH the surface of the chip to remove the dust as this will damage the
sensor. AT YOUR OWN RISK, you can use an oil-free air jet to blow the dust away or contact your
Gentec-EO representative.
8.6. IT IS NOT POSSIBLE TO START AN ACQUISITION. IT KEEPS OPENING A WARNING
MESSAGE INDICATING THAT 0 GB IS AVAILABLE ON HARD DRIVE
This is probably due to the fact the path in/ which the PC-Beamage was not installed in the default
C:\Program Files\GENTEC-EO\PC-Beamage directory.
8.7. THERE IS NO SERIAL NUMBER DISPLAYED IN THE CAMERA
Please close the PC-Beamage software program, wait a couple of seconds and open the PC-
Beamage again.
If the problem persists, please verify in Window’s Task Manager if there is only one PC-
Beamage.exe instance running. If more than one are running, end all processes and open PCBeamage again.
If the problem persists, please disconnect the Beamage and connect it again.
Page 76

Beamage Series User Manual Revision 9.0 75
If the problem persists, please contact your Gentec-EO representative or contact us at
8.8. THE DETECTED SERIAL NUMBER IS 000000
This happens when you connect a Beamage for the first time in a new USB port. The drivers need to be
installed each time a new Beamage is plugged for the first time in a new USB port. When this happens,
the PC-Beamage software often opens before the drivers are installed, indicating a 000000 serial
number. Close the PC-Beamage software and restart the application.
8.9. THE 10 BIT ADC LEVEL IS NOT AVAILABLE EVEN WHEN THE BEAMAGE IS
CONNECTED TO A USB 3.0 PORT
The 10 bit ADC level is only available when using a USB 3.0 port. If it is not available even when
connected on a USB 3.0 port, reboot the computer. If it is still not available, please contact your GentecEO representative or contact us at [email protected].
8.10. DO NOT DISCONNECT THE BEAMAGE WHILE IT IS STREAMING
The Beamage must not be disconnected when it is streaming.
8.11. TIPS TO INCREASE THE FRAME RATE
The Beamage’s frame rate greatly depends on the computer’s performances. Here are a few tips to
increase the frame rate:
Use a USB-3.0 port;
Use a computer with high performances (refer to PC Requirements section 1.2);
Use Windows 7 or Windows 8;
Follow the PC operating state for optimal conditions (refer to section 1.2)
Do not use Filters (refer to 4.6.1);
Do not use Image Averaging (refer to 5.2.3);
For a large beam, use Pixel Addressing (refer to 5.2.5);
For a small beam, use an Active Area (refer to 5.2.4);
Make sure you have a short exposure time;
Do not stream multiple Beamage units simultaneously.
Page 77
Beamage Series User Manual Revision 9.0 76
Standard
Description
Performance
Criteria
CISPR 11 :2009
+A1 2010
Industrial, scientific and medical equipment – Radio-frequency
disturbance characteristics – Limits and methods of
measurement
Class A
EN 61326 :2005/EN
61326 : 2006
Limits and methods of measurement of radio interference
characteristics of information technology equipment. Testing
and measurements of radiated emission
Class A
IEC 61000-4-2:2001
Electromagnetic compatibility (EMC) – Part 4: Testing and
measurements techniques- Section 2: Electrostatic discharge.
Class B
IEC 61000-4-3:2002
Electromagnetic compatibility (EMC) – Part 4: Testing and
measurements techniques- Section 3: Radiated, Radio
Frequency immunity.
Class A
9. DECLARATION OF CONFORMITY
Application of Council Directive(s): 2004/108/EC The EMC Directive
Manufacturer’s Name: Gentec Electro Optics, Inc.
Manufacturer’s Address: 445 St-Jean Baptiste, suite 160
(Québec), Canada G2E 5N7
European Representative’s Name: Laser Components S.A.S.
Representative’s Address: 45 bis Route des Gardes
92190 Meudon (France)
Type of Equipment: Laser Beam Diagnostic Equipment.
Model No.: Beamage
Year of test & manufacture: 2012
Standard(s) to which Conformity is declared:
EN 61326 :2005/EN 61326 : 2006/ Emission generic standard
I, the undersigned, hereby declare that the equipment specified above
conforms to the above Directive(s) and Standard(s).
Place: Québec (Québec)
Date : December 13, 2012
(President)
Page 78
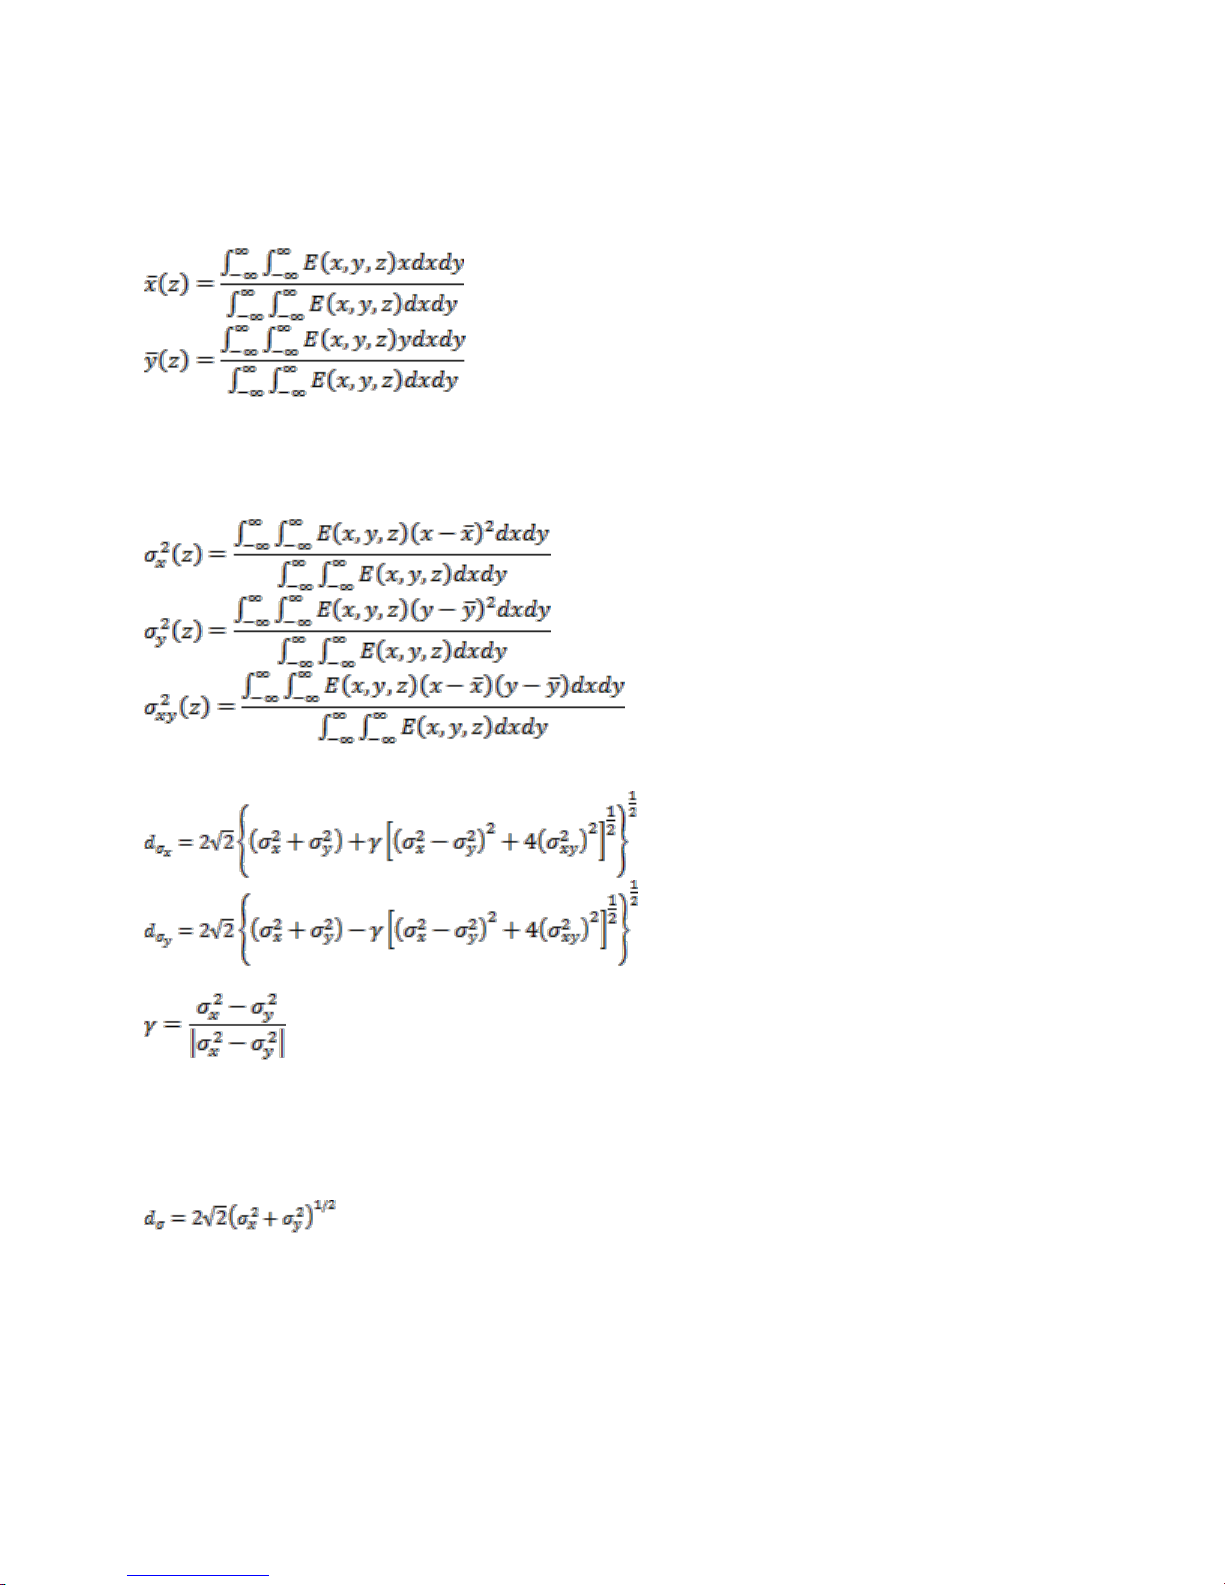
Beamage Series User Manual Revision 9.0 77
APPENDIX A. ISO11146 AND ISO11670 DEFINITIONS
The beam centroid coordinates are given by:
The beam widths are defined as an “extent of a power density distribution in a cross section of beam
based on the centered second order moments of the power density distribution.”
The second order moments of power density distribution are given by:
The beam widths are given by:
where:
The major axis is the width’s maximum whereas the minor axis is the width’s minimum.
The effective diameter of the beam is an “extent of a circular power density having an ellipticity greater
than 0.87. […] If the ellipticity is larger than 0.87, the beam profile may be considered to be of circular
symmetry at that measuring location and the beam diameter can be obtained from:”
The beam ellipticity is the “ratio between the minimum and maximum widths”
The beam orientation is the “angle between the x-axis […] and that or the principal axis of the power
density distribution which is closer to the x-axis.” From this definition, the angle is comprised between 45°
and -45°.
Page 79
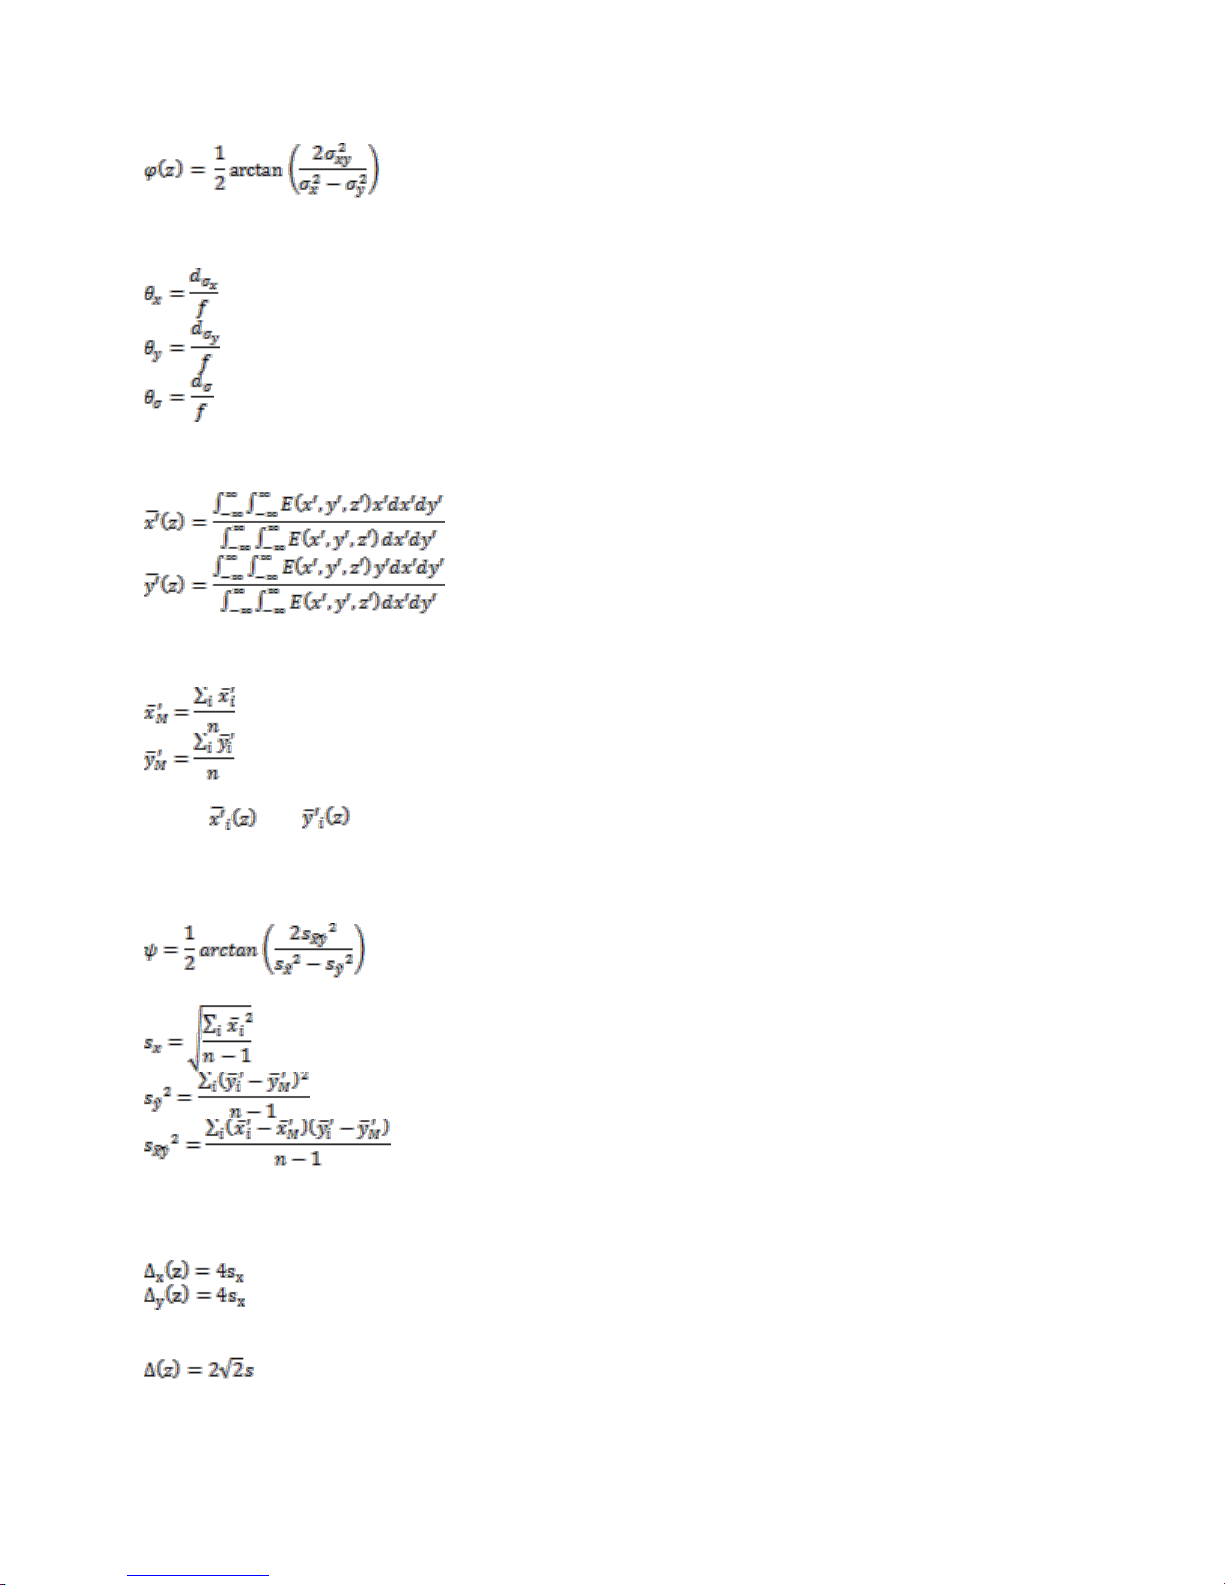
Beamage Series User Manual Revision 9.0 78
The beam’s divergences transformed by an aberration-free focusing element of focal length f are given
by the following equations:
In the laboratory or usual system of coordinates (X’,Y’,Z’), the coordinates of the latest calculated position
of the centroid for both X’ and Y’ axes are given by the following equations:
The coordinates of the mean position of all computed centroids for both X’ and Y’ axes are thus defined
by the following equations, which are simple arithmetic means,
Where and are the centroid coordinates for X’ and Y’ axes already saved in the buffer, and n
the number of computed centroid positions saved in the buffer.
The azimuth angle, which is the angle between the usual X’ axis and all computed centroids, is given by
the following equation:
where we have the following definitions:
In the beam axis coordinate system (X,Y,Z), the beam positional stability values in the azimuth direction
(X) and perpendicularly to the azimuth direction (Y), which are 4 times the standard deviations of all
computed centroid values, are given by the following equations:
The overall positional stability is given by:
Page 80
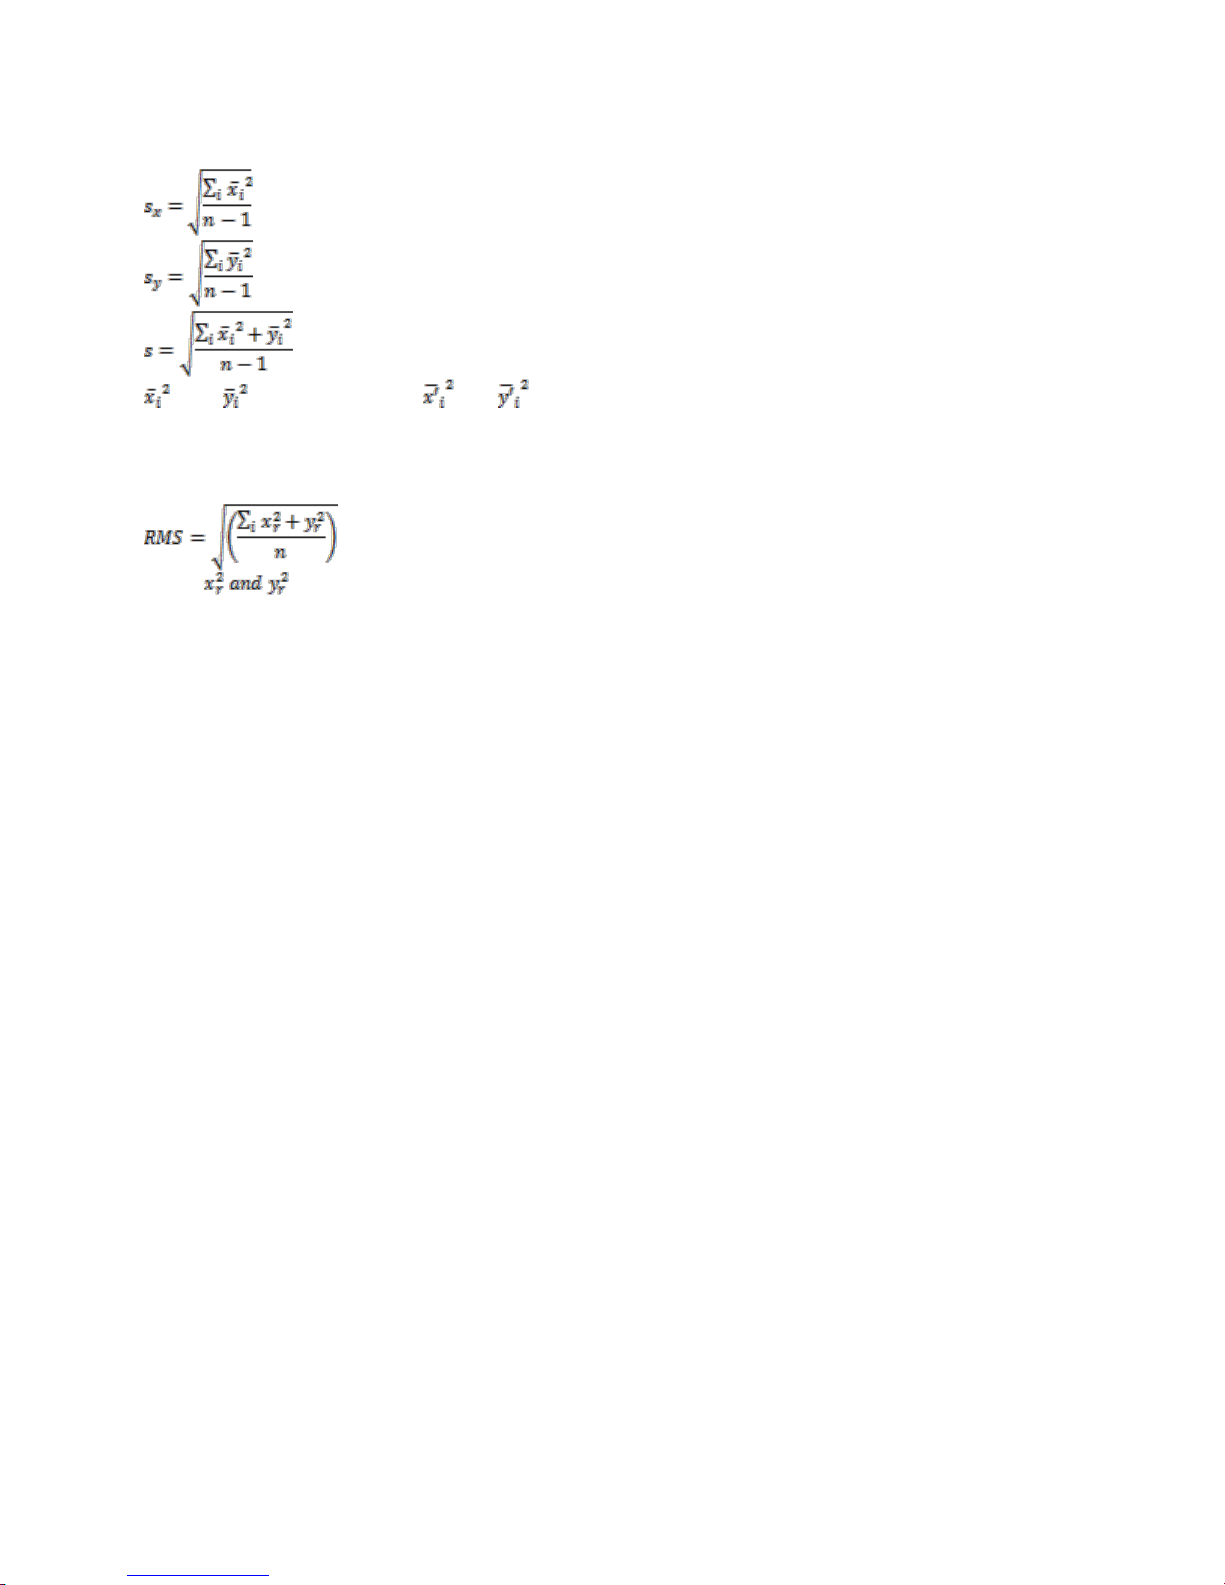
Beamage Series User Manual Revision 9.0 79
In the previous 3 equations, the standard deviations are defined by the following equations:
and are derived from and by transformation of coordinates. (X’,Y’,Z’) is the usual or
laboratory coordinate system and (X,Y,Z) is the beam axis coordinate system.
The RMS standard deviation value of the centroid position, which is not an ISO standard, is given by the
following equation:
where are relative values.
Page 81
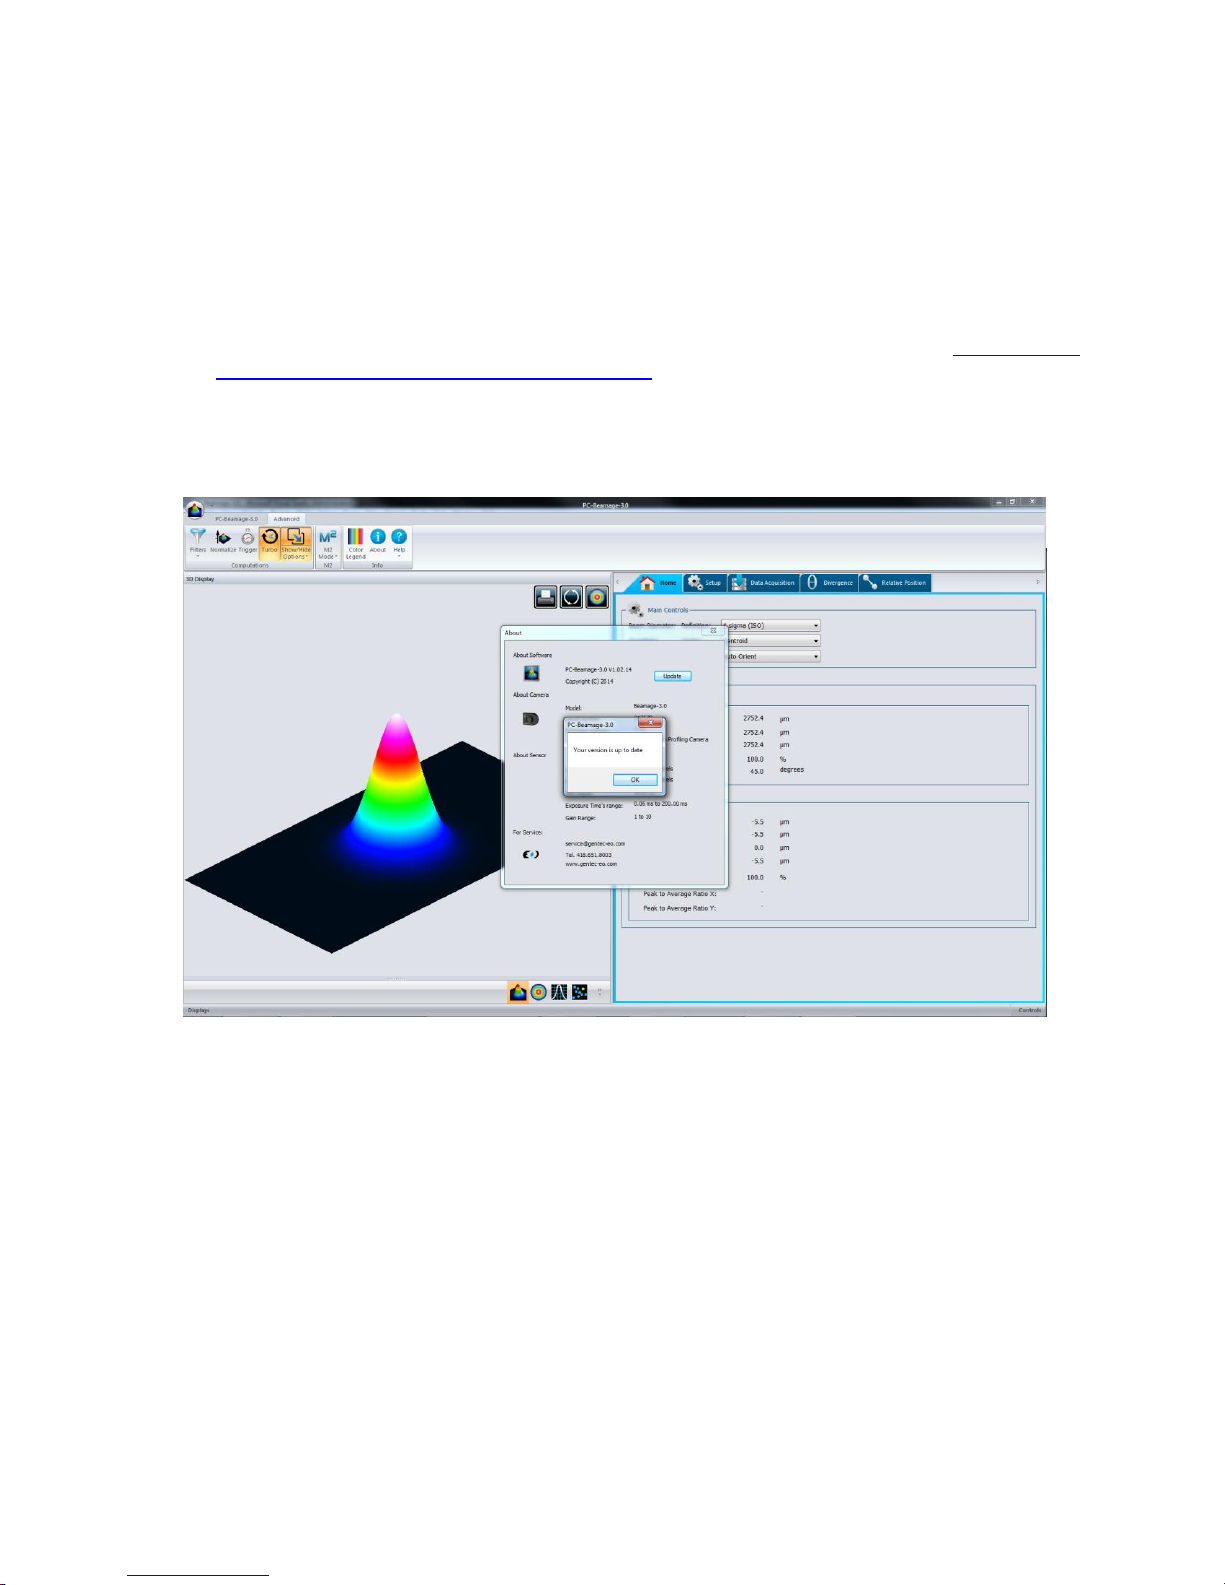
Beamage Series User Manual Revision 9.0 80
APPENDIX B. BEAMAGE-3.0 DRIVER INSTALLATION QUICK GUIDE
1) Do not connect the Beamage’s USB cable to your computer before installing the appropriate
software and drivers. The camera will not be recognized if so.
2) The latest available version of PC-Beamage must be installed before setting the drivers. It can be
downloaded from the Downloads tab in the bottom of the following web page: https://gentec-
eo.com/products/beam-diagnostics/Beamage-3.0.
3) If the software is already installed on your computer, please make sure it is the latest available
version of PC-Beamage. To do so, open the PC-Beamage software and click on About. Another
window will appear and you will be able to Update the software.
Figure B- 1: PC-Beamage
Page 82
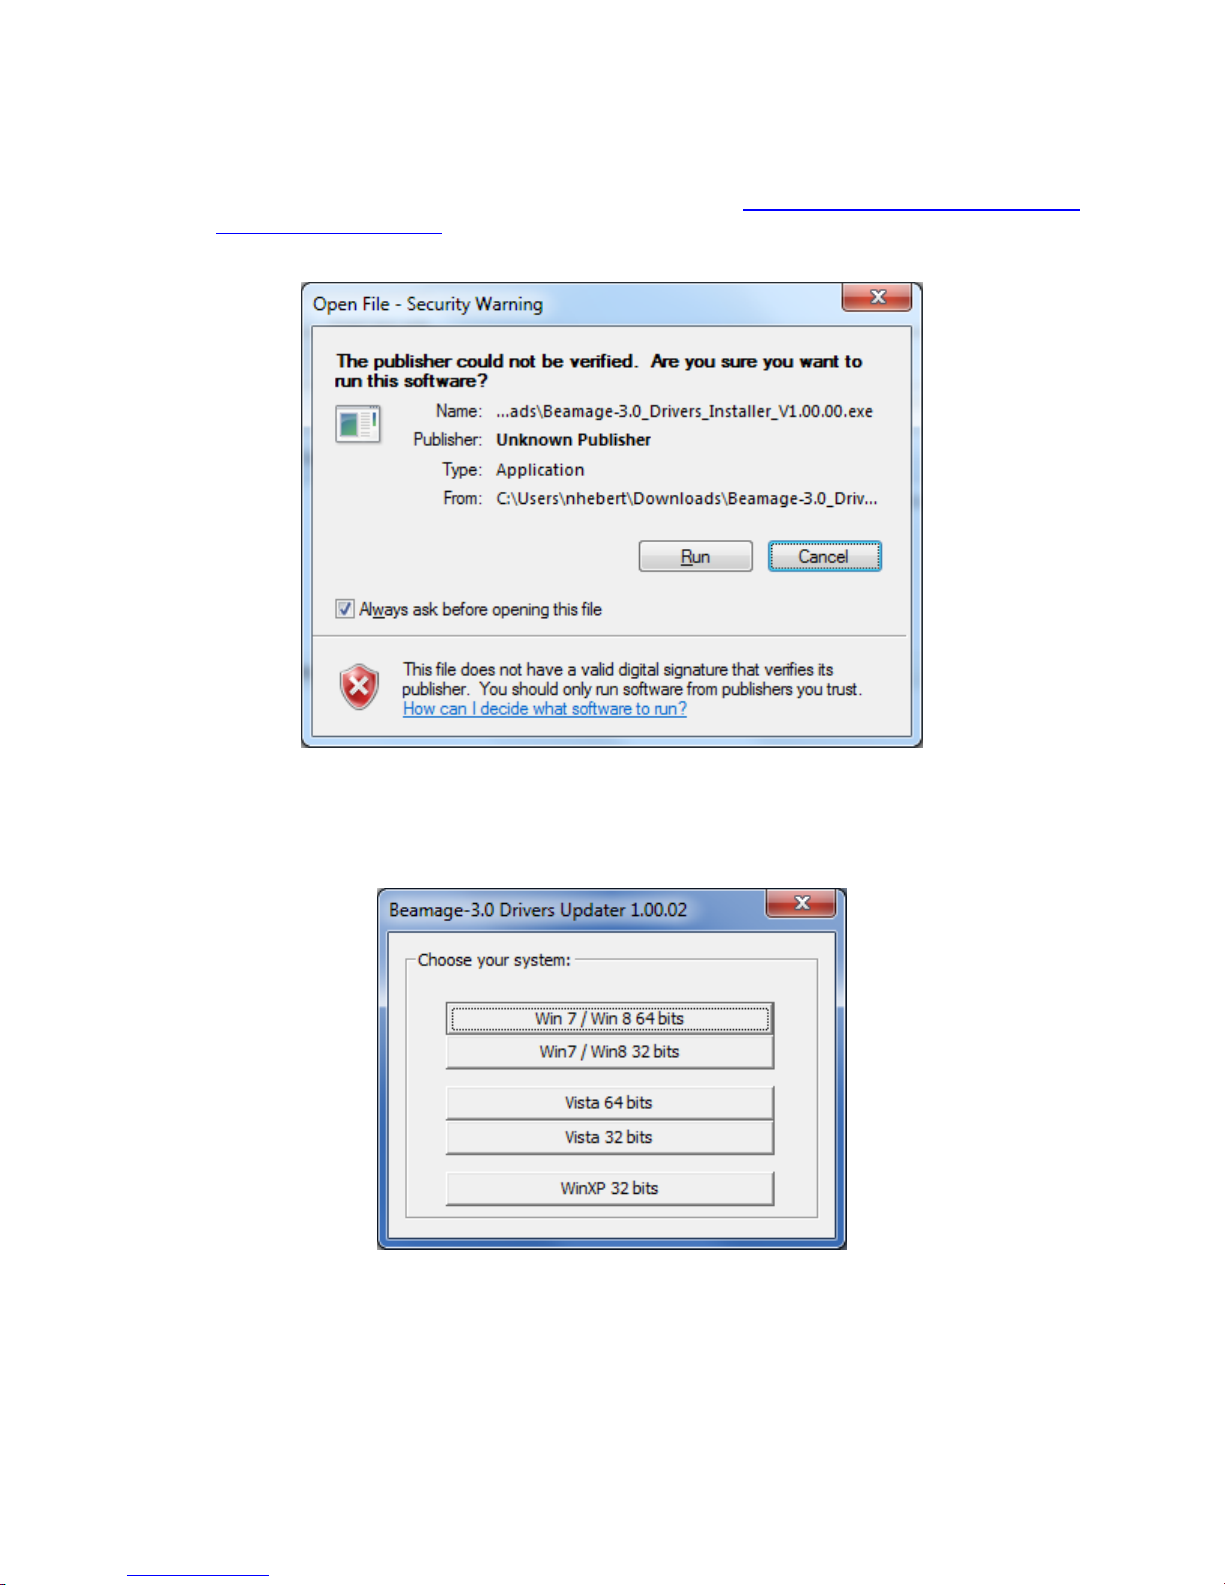
Beamage Series User Manual Revision 9.0 81
4) You can now open the Drivers Installer. The latest version can be downloaded from the
Downloads tab at the bottom of the following web page: https://gentec-eo.com/products/beam-
diagnostics/Beamage-3.0. Once the file is opened, a security warning should appear. Click on
Run.
Figure B- 2: Security Warning
5) Choose the option that corresponds to your operating system. Please note that Windows XP is
not officially supported and thus Gentec-EO does not provide assistance if this OS is used.
Figure B- 3: Choose your system
To find out what is your operating system, click on the Start (Windows home screen) button and
type in System in the search field. Click on System under Control Panel. A window will appear,
indicating which operating system is used. The x64 choices are applicable to 64-bit systems while
the x86 choices are applicable to 32-bit systems.
Page 83
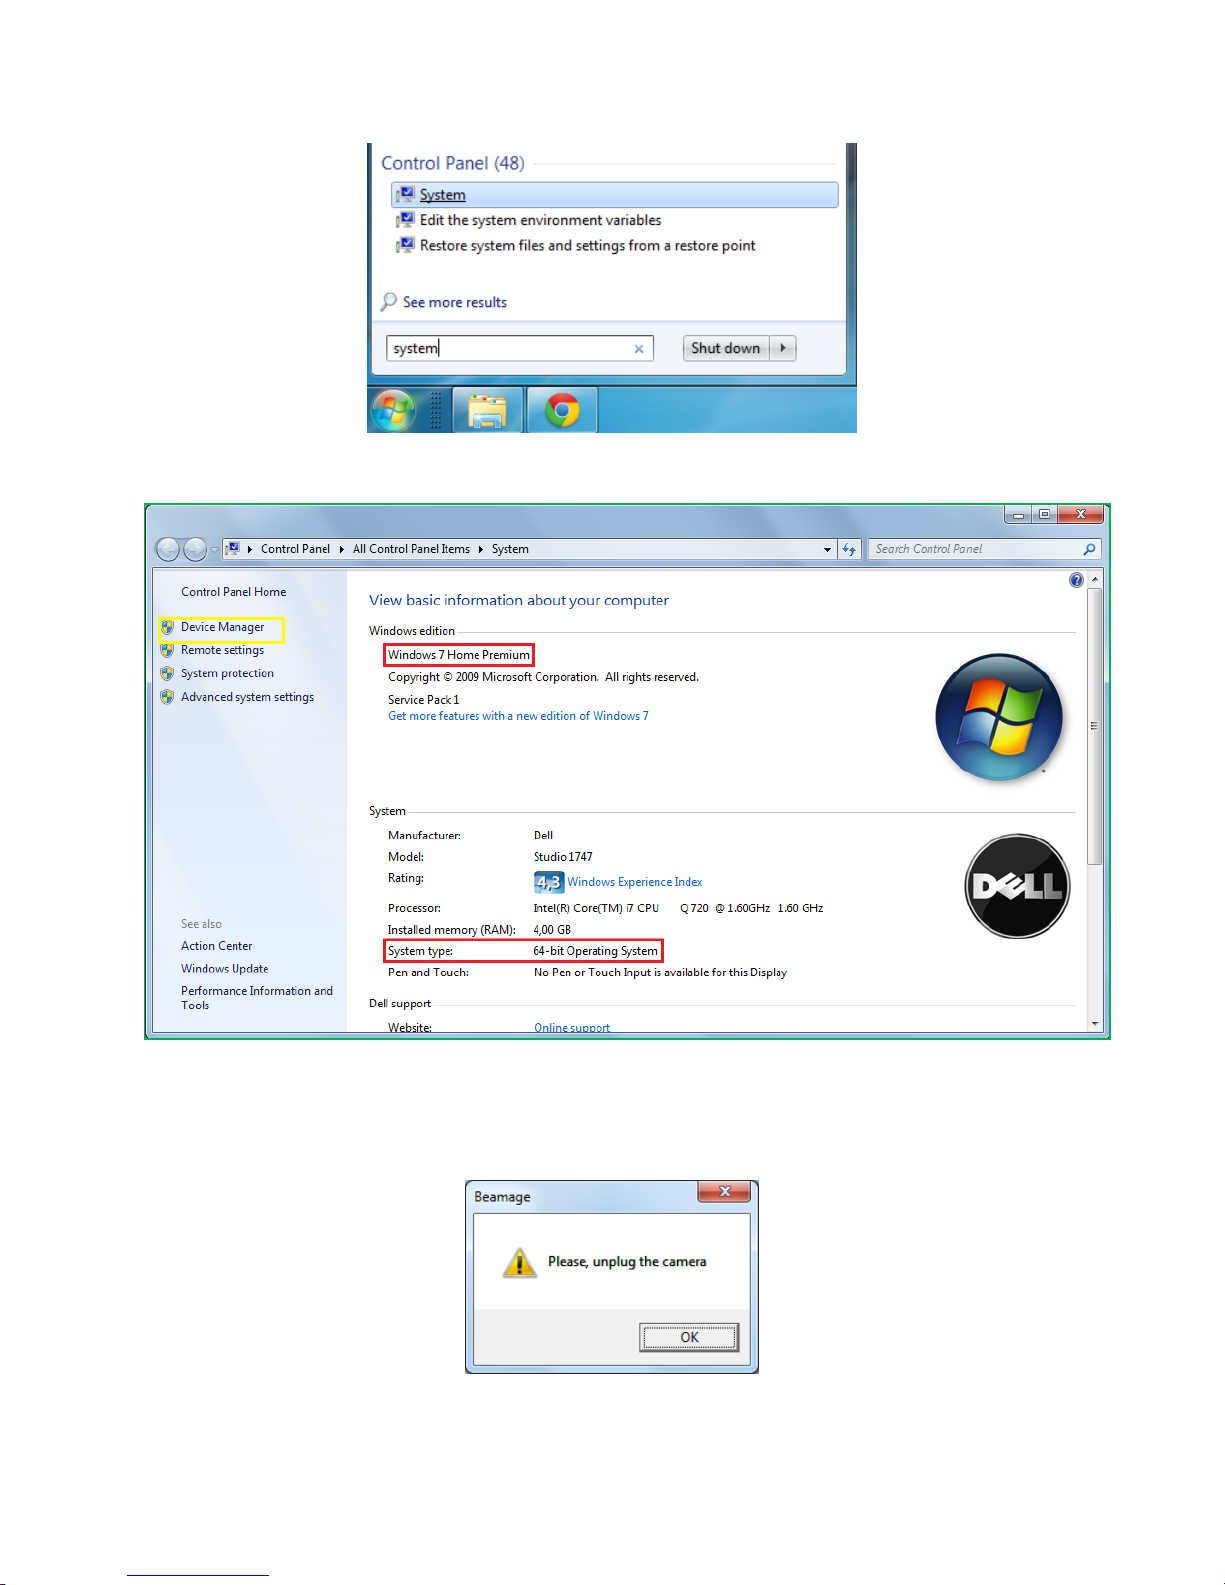
Beamage Series User Manual Revision 9.0 82
Figure B- 4: Search for “System”
6) After choosing the operating system, you will be asked to unplug the camera. If you followed the
former steps, the camera should already be unplugged. Click on OK.
Figure B- 5: System information
Figure B- 6: Unplug the camera
Page 84
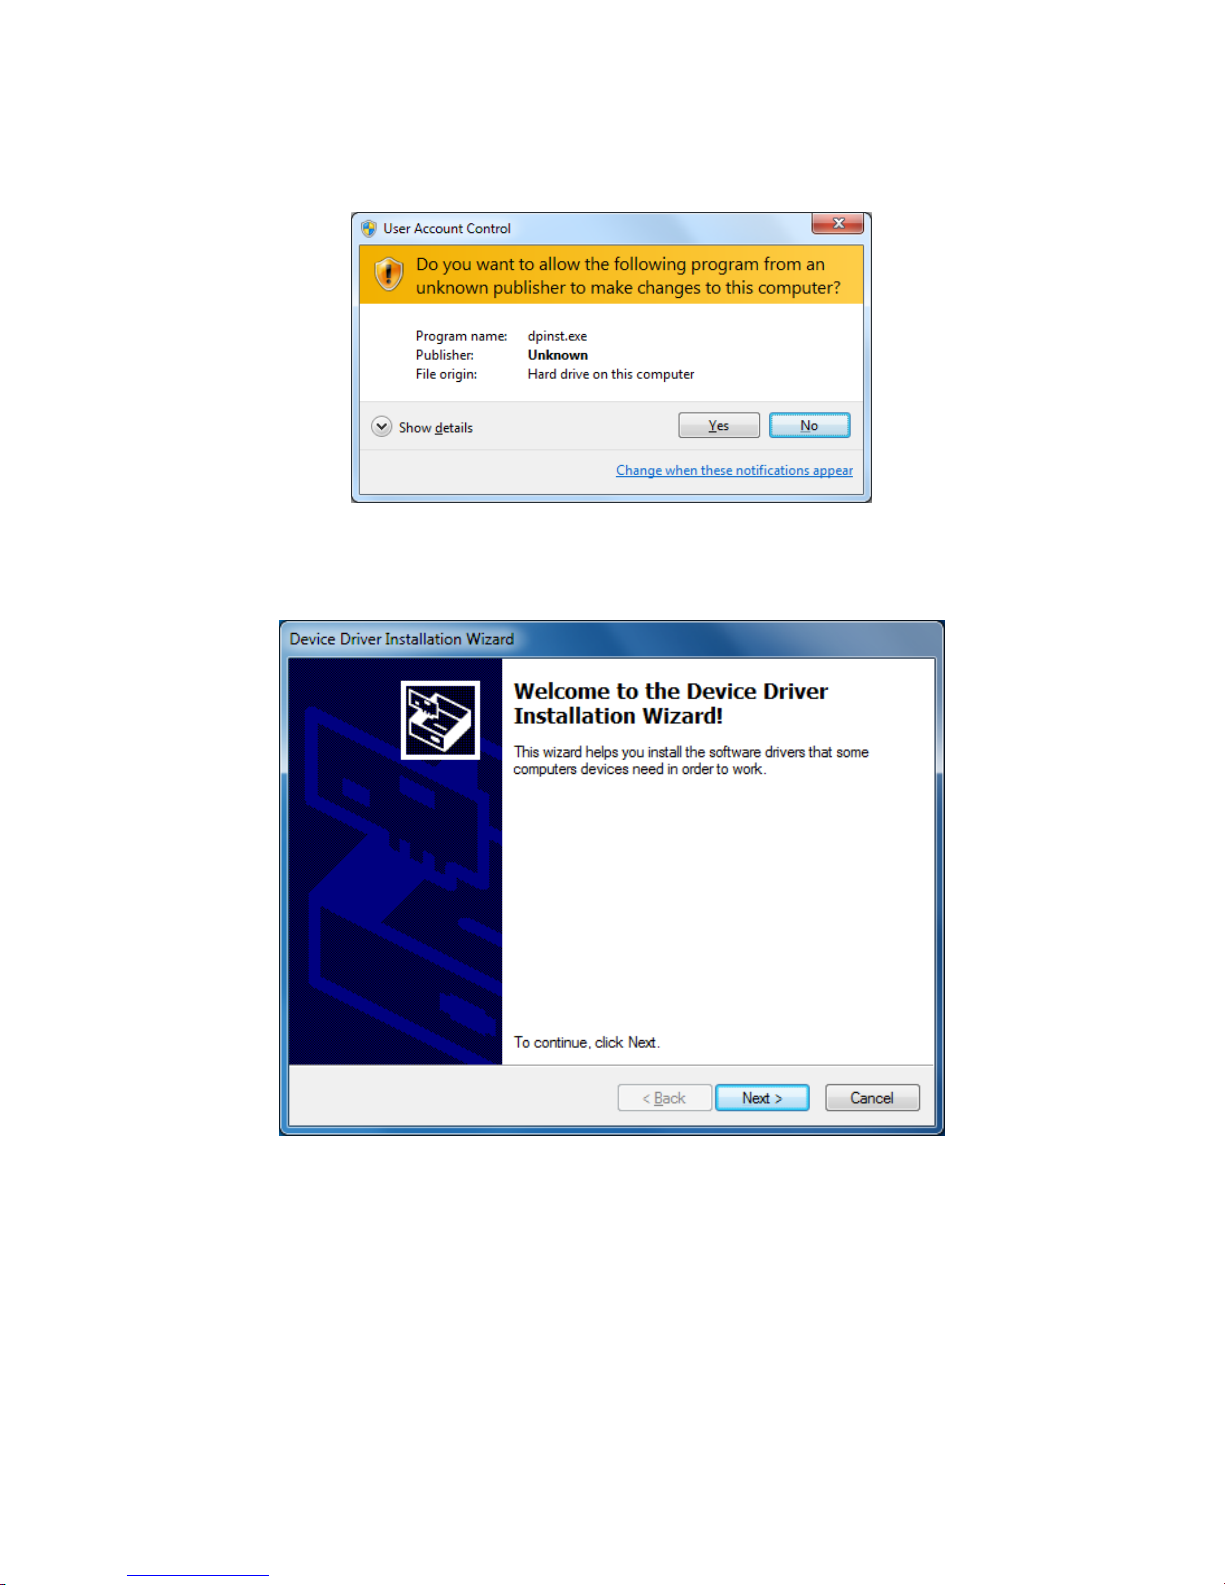
Beamage Series User Manual Revision 9.0 83
7) You will be asked if you want to allow the program to make changes to your computer. Click on
Yes.
Figure B- 7: User Account Control
8) The driver installation wizard will appear. Click on Next.
Figure B- 8: Device Driver Installation Wizard
Page 85
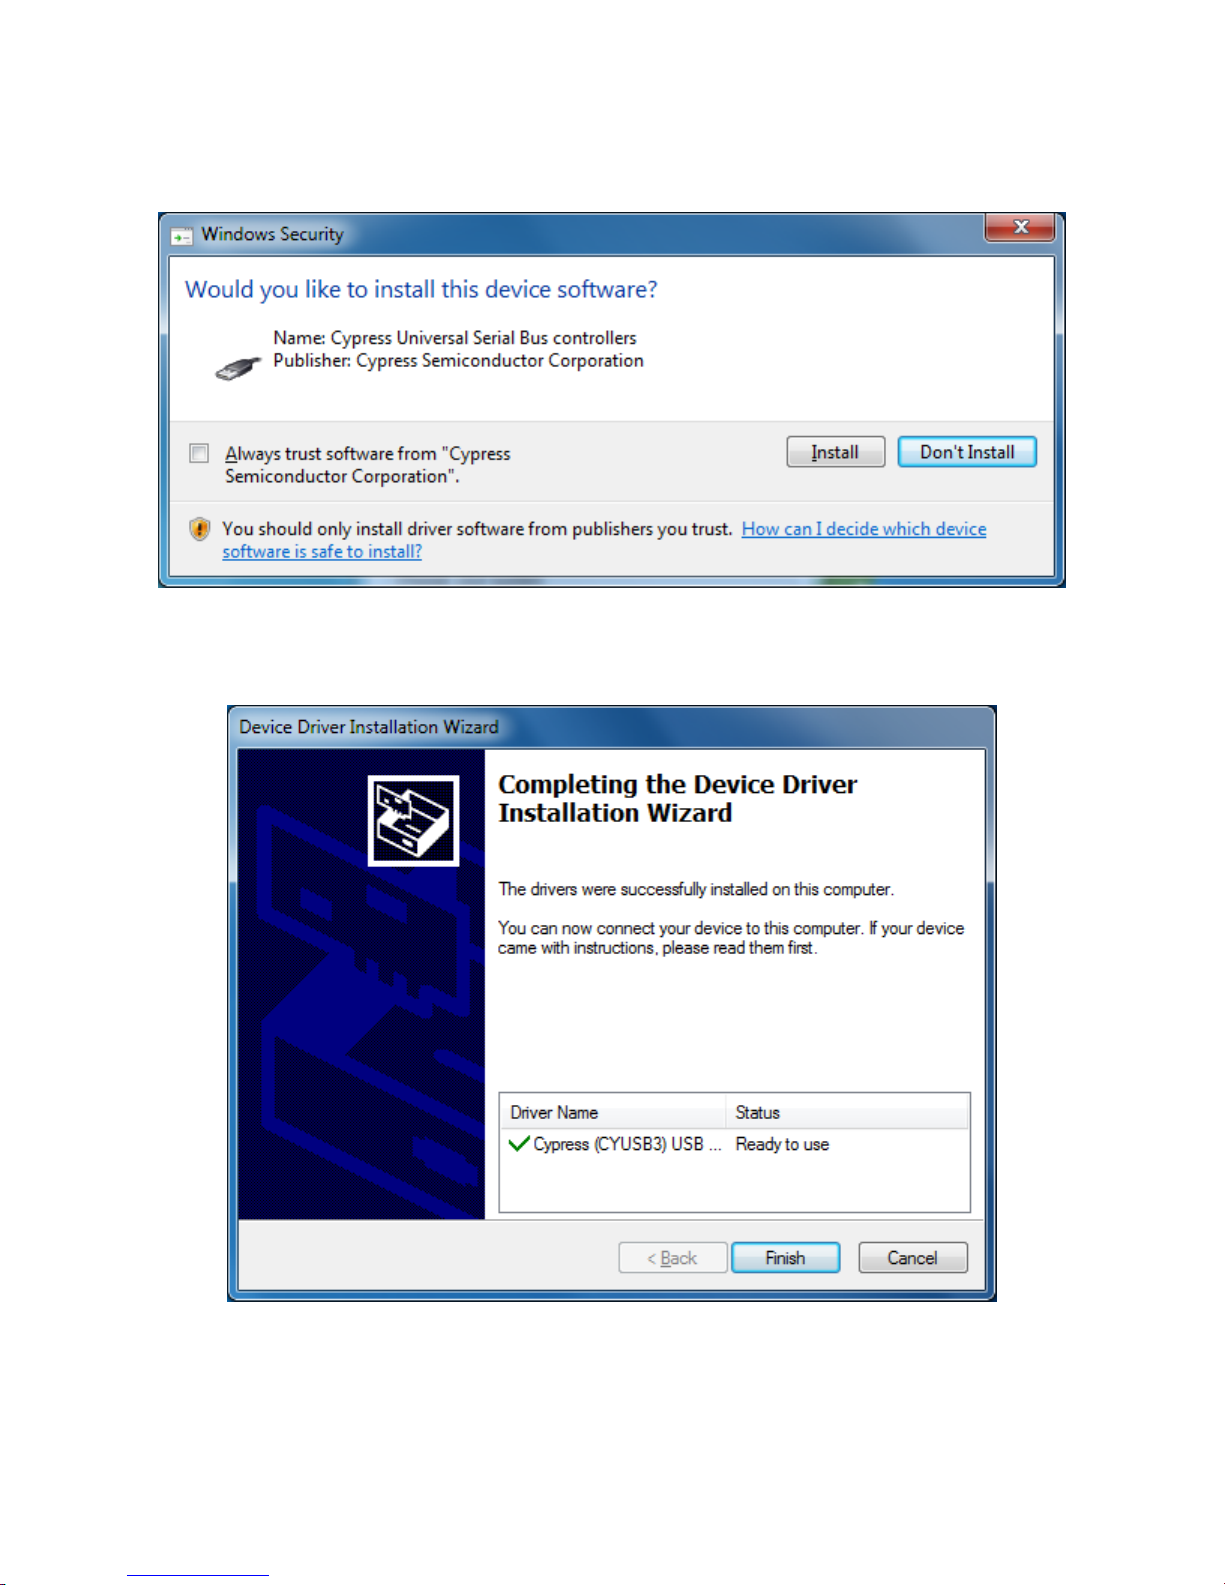
Beamage Series User Manual Revision 9.0 84
9) To confirm that you want to install the device software, click on Install.
Figure B- 9: Confirmation Window
10) Once the installation is completed, click on Finish.
11)
Figure B- 10: Installation Completed
Page 86
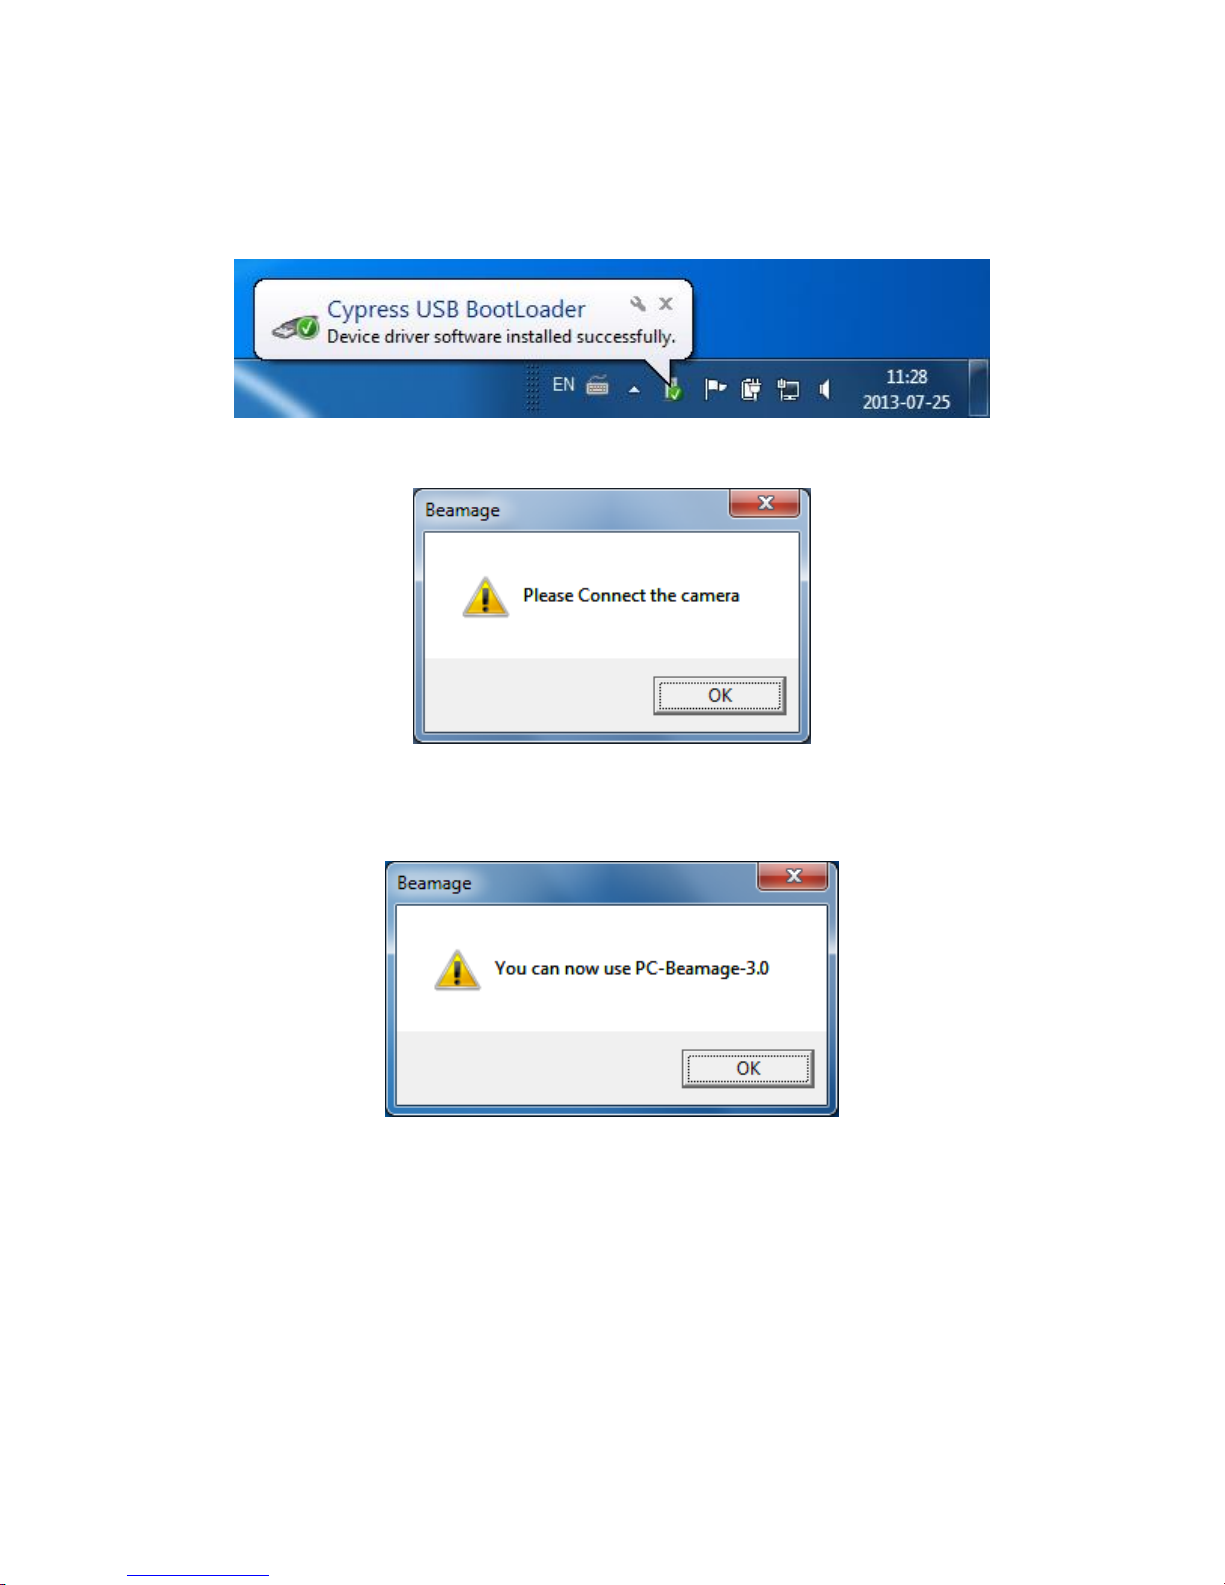
Beamage Series User Manual Revision 9.0 85
12) You will be prompted to connect the camera. Connect it through your USB port, but DO NOT
CLICK ON OK RIGHT AWAY. Wait for the following message to appear at the bottom right of
your screen before clicking on OK.
Figure B- 11: Driver installed successfully (1)
Figure B- 12: Connect the camera
13) Another window will inform you that you can now use PC-Beamage. Click on OK.
Figure B- 13: You can now use PC-Beamage
14) To allow the device to be recognized by your computer, unplug and plug back the USB cable.
Page 87
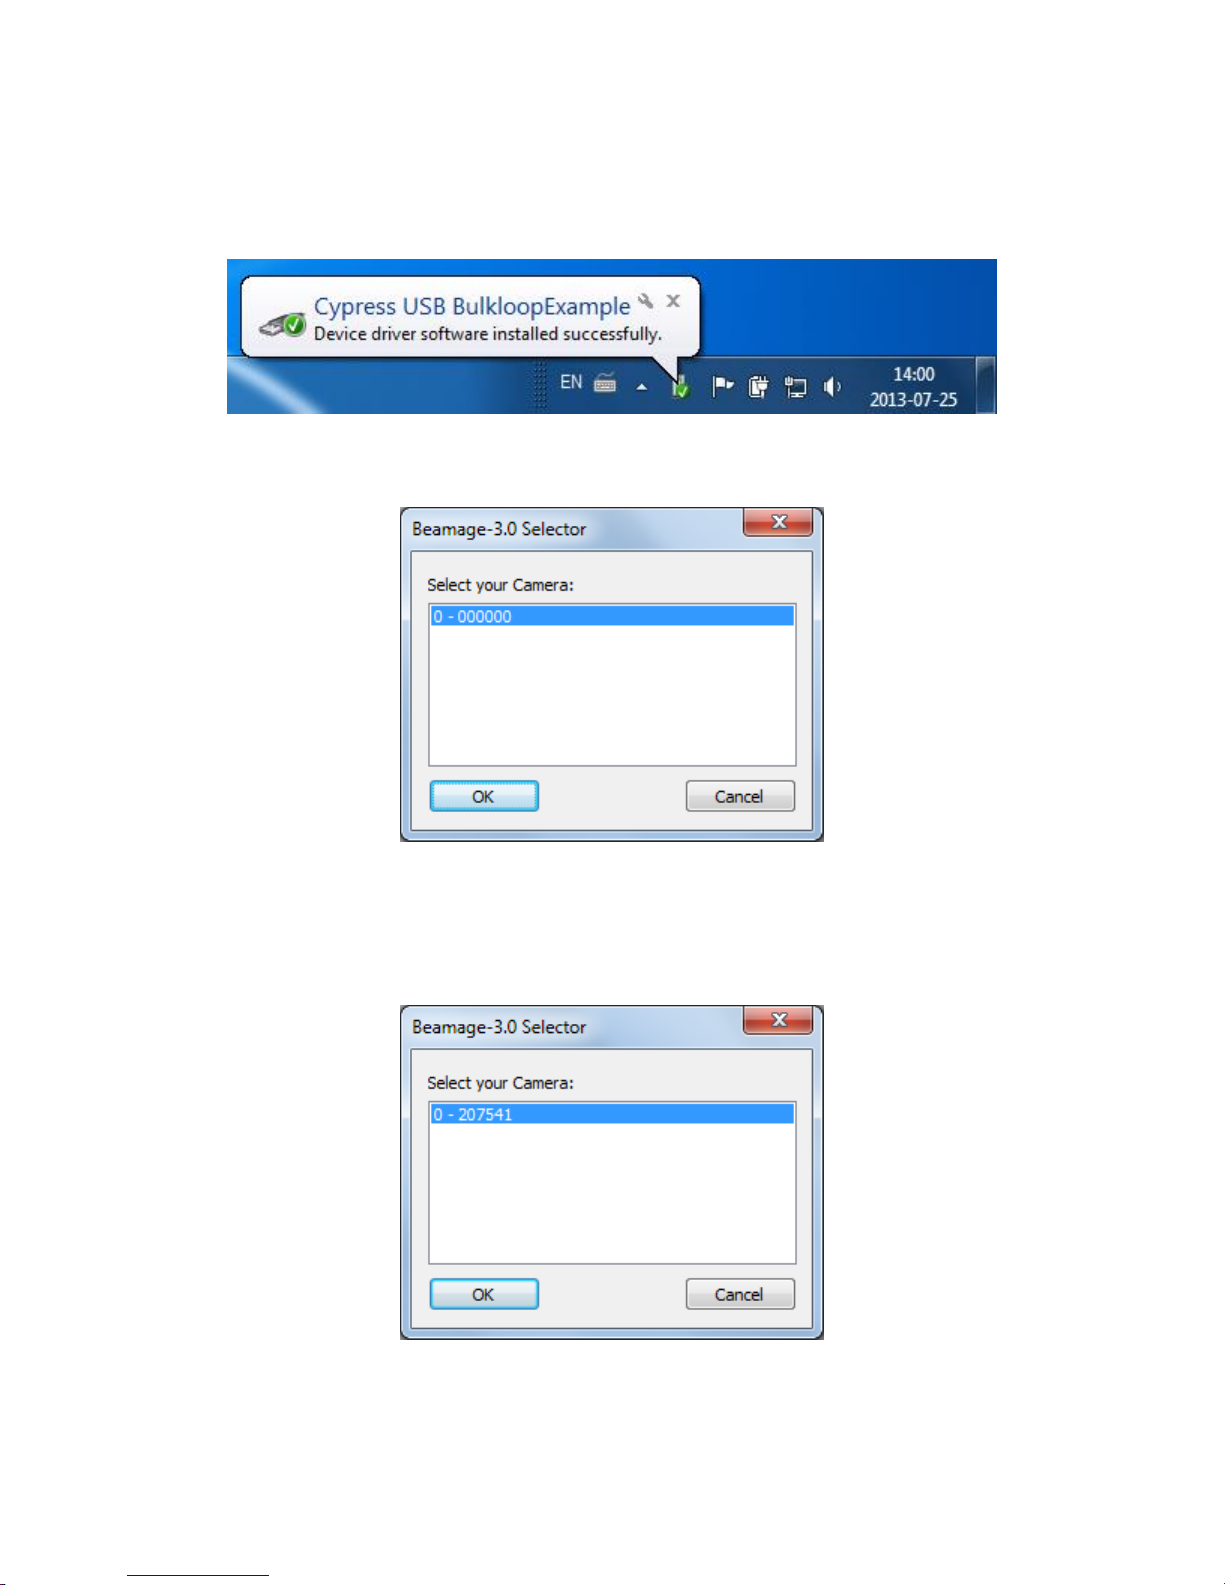
Beamage Series User Manual Revision 9.0 86
15) Start the PC-Beamage application. A camera selector will appear, with a series of zero as the
single option. Meanwhile, the last driver will be installed. Wait for the following message to appear
at the bottom right of your screen. Click on OK in and close the application.
Figure B- 14: Driver installed successfully (2)
Figure B- 15: Camera Selector (1)
16) Restart the PC-Beamage application. Select your camera and click on OK. The 6 digits following
the dash correspond to the serial number of your device. You are now ready to use your
Beamage.
Figure B- 16: Camera Selector (2)
Page 88
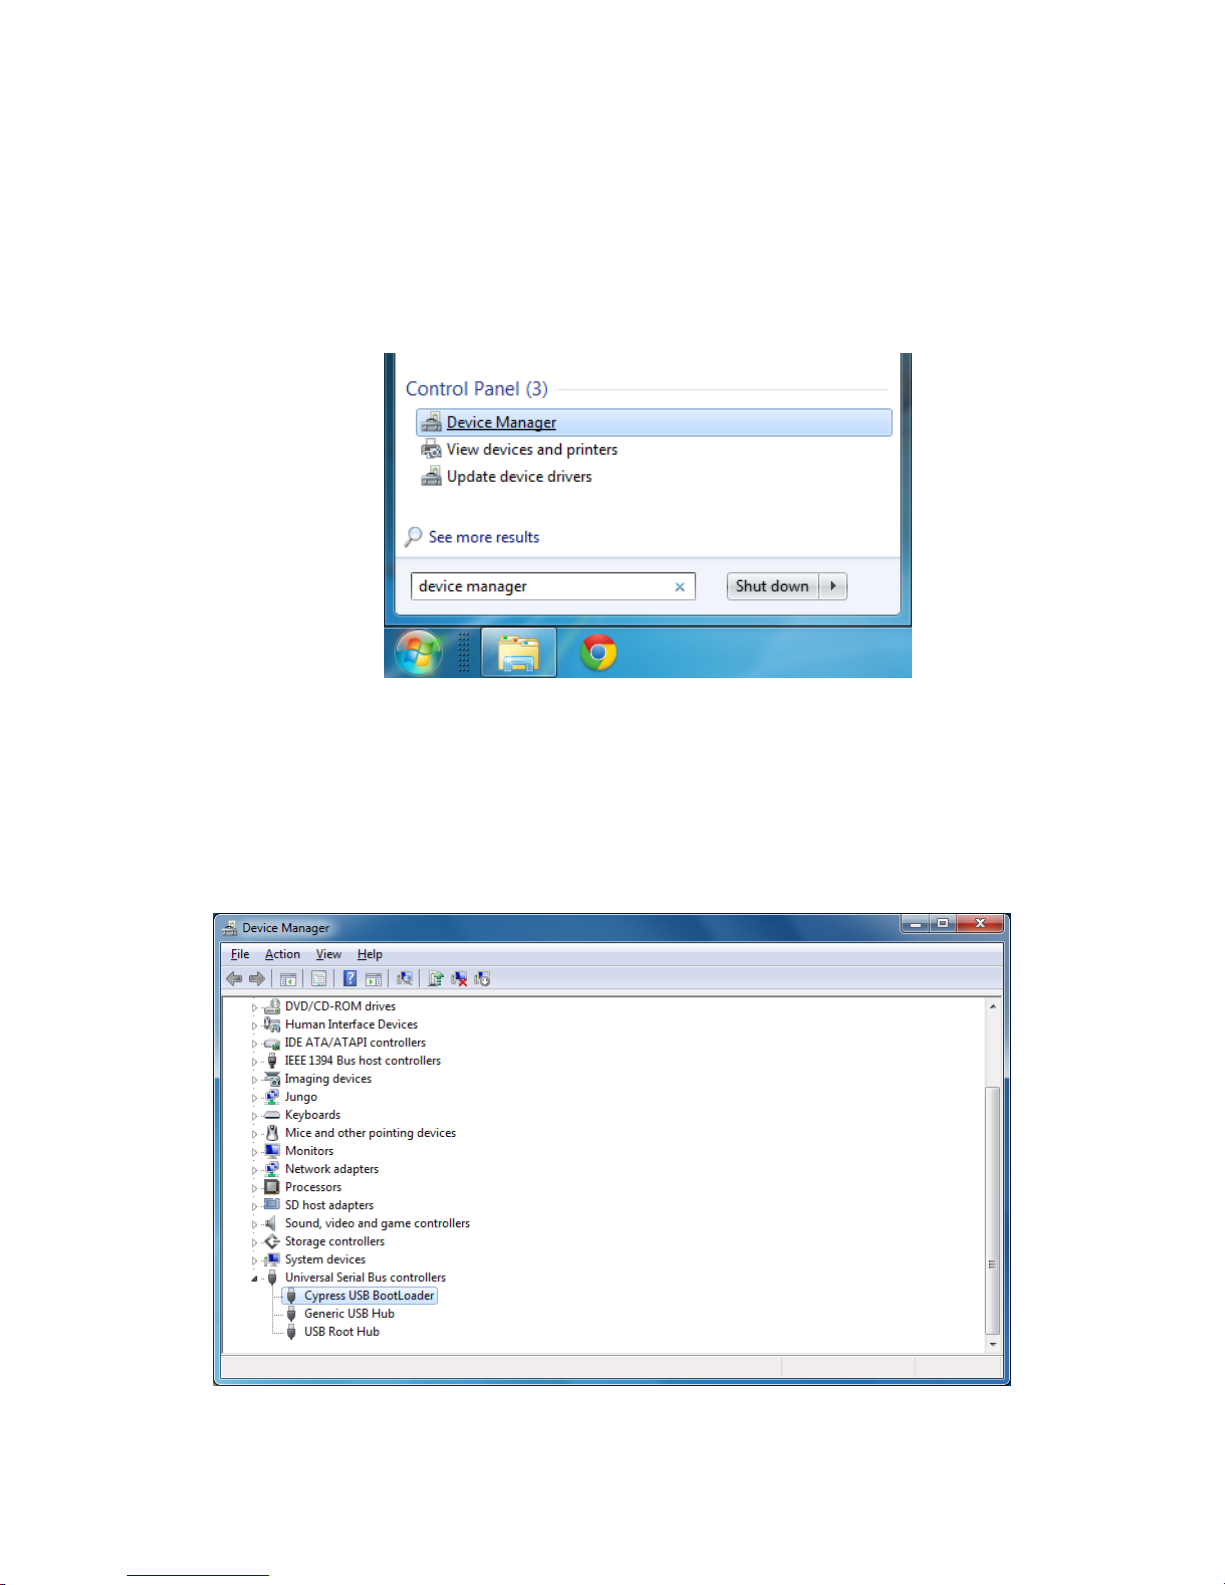
Beamage Series User Manual Revision 9.0 87
Verify that the driver has been correctly installed
It is not necessary to follow these steps to install the USB drivers. They are verification steps only.
1) Open your Device Manager. To open the Device Manager, click on the Start (Windows home
screen) and type in Device Manager in the search field. Click on Device Manager under Control
Panel. Be careful not to click on Devices and Printers instead of Device Manager.
Figure B- 17: Search for “Device Manager”
You can also open the Device Manager through the System Window
2) Close the PC-Beamage application (if it is already opened). Connect the Beamage camera to
your computer. If everything went well until now, the device Cypress USB BootLoader should be
marked by a yellow warning in the Device Manager. It should be located under Universal Serial
Bus controllers.
Figure B- 18: Cypress USB BootLoader
Page 89
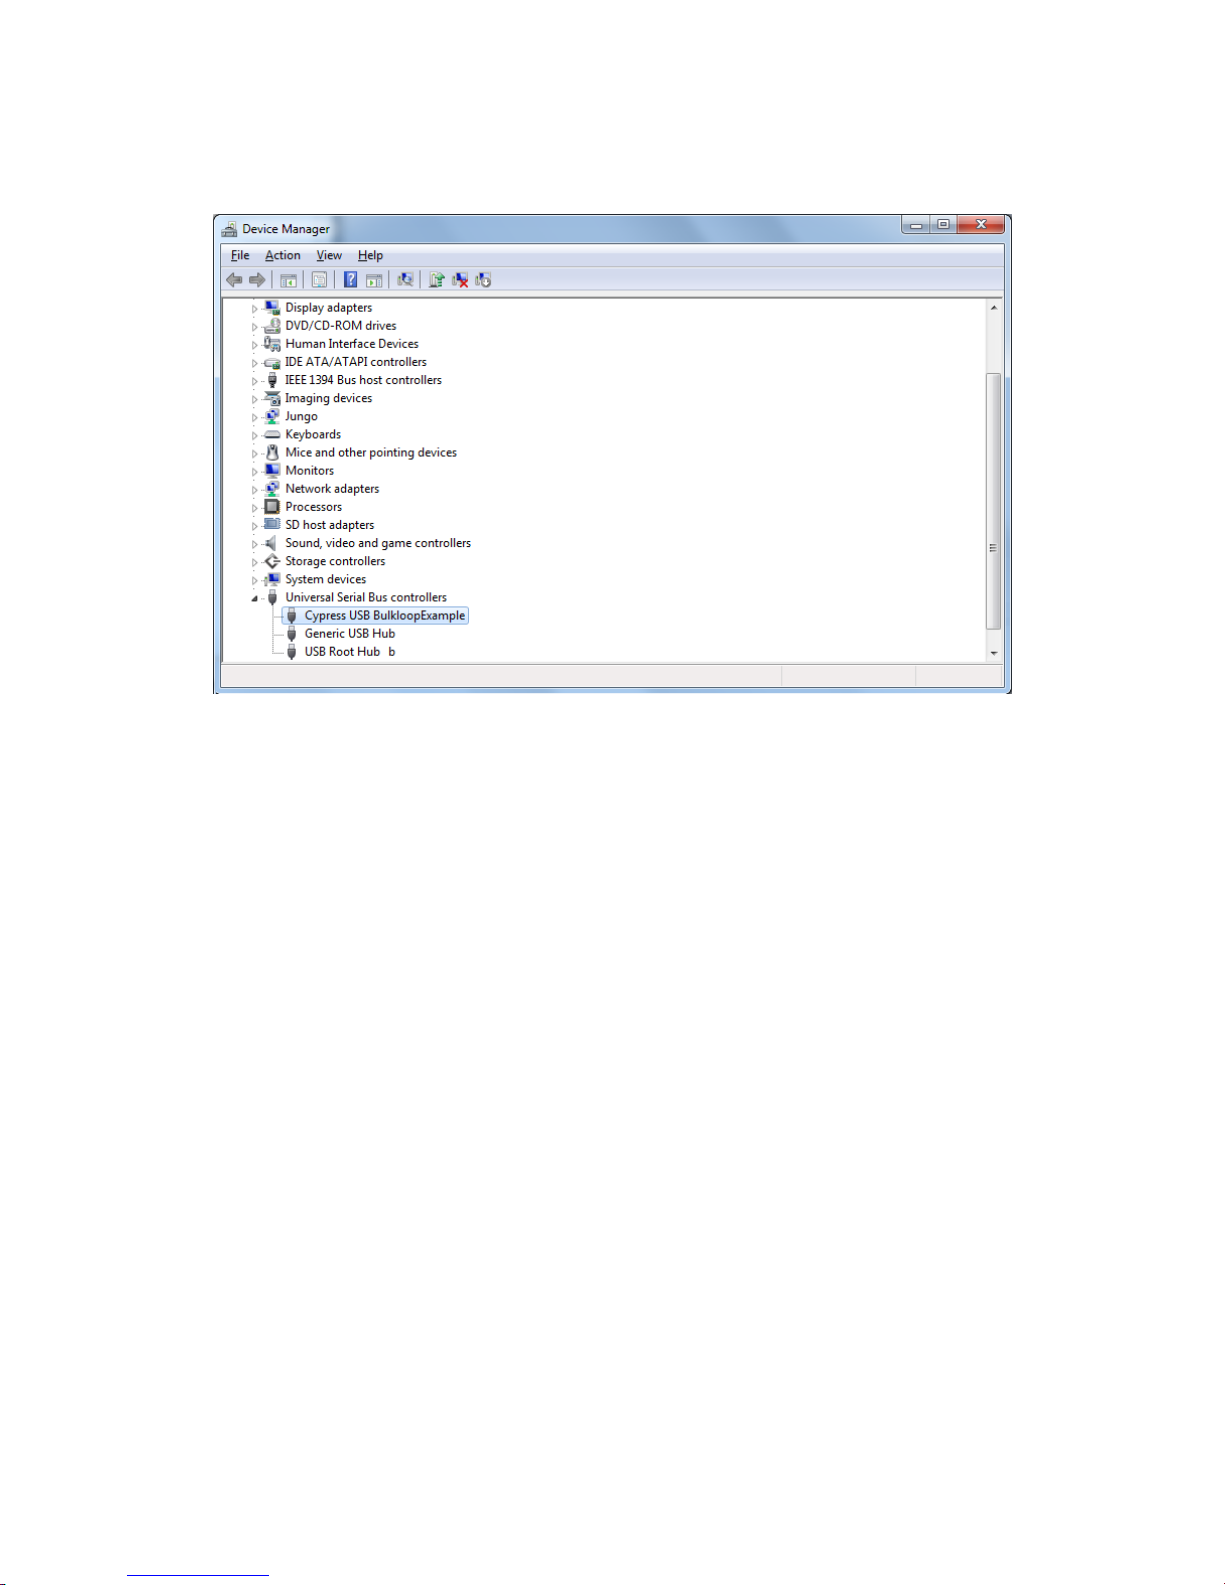
Beamage Series User Manual Revision 9.0 88
3) Open PC-Beamage and make sure Cypress USB BootLoader has been replaced by Cypress
USB BulkloopExample.
Figure B- 19: Cypress USB BulkloopExample
Page 90
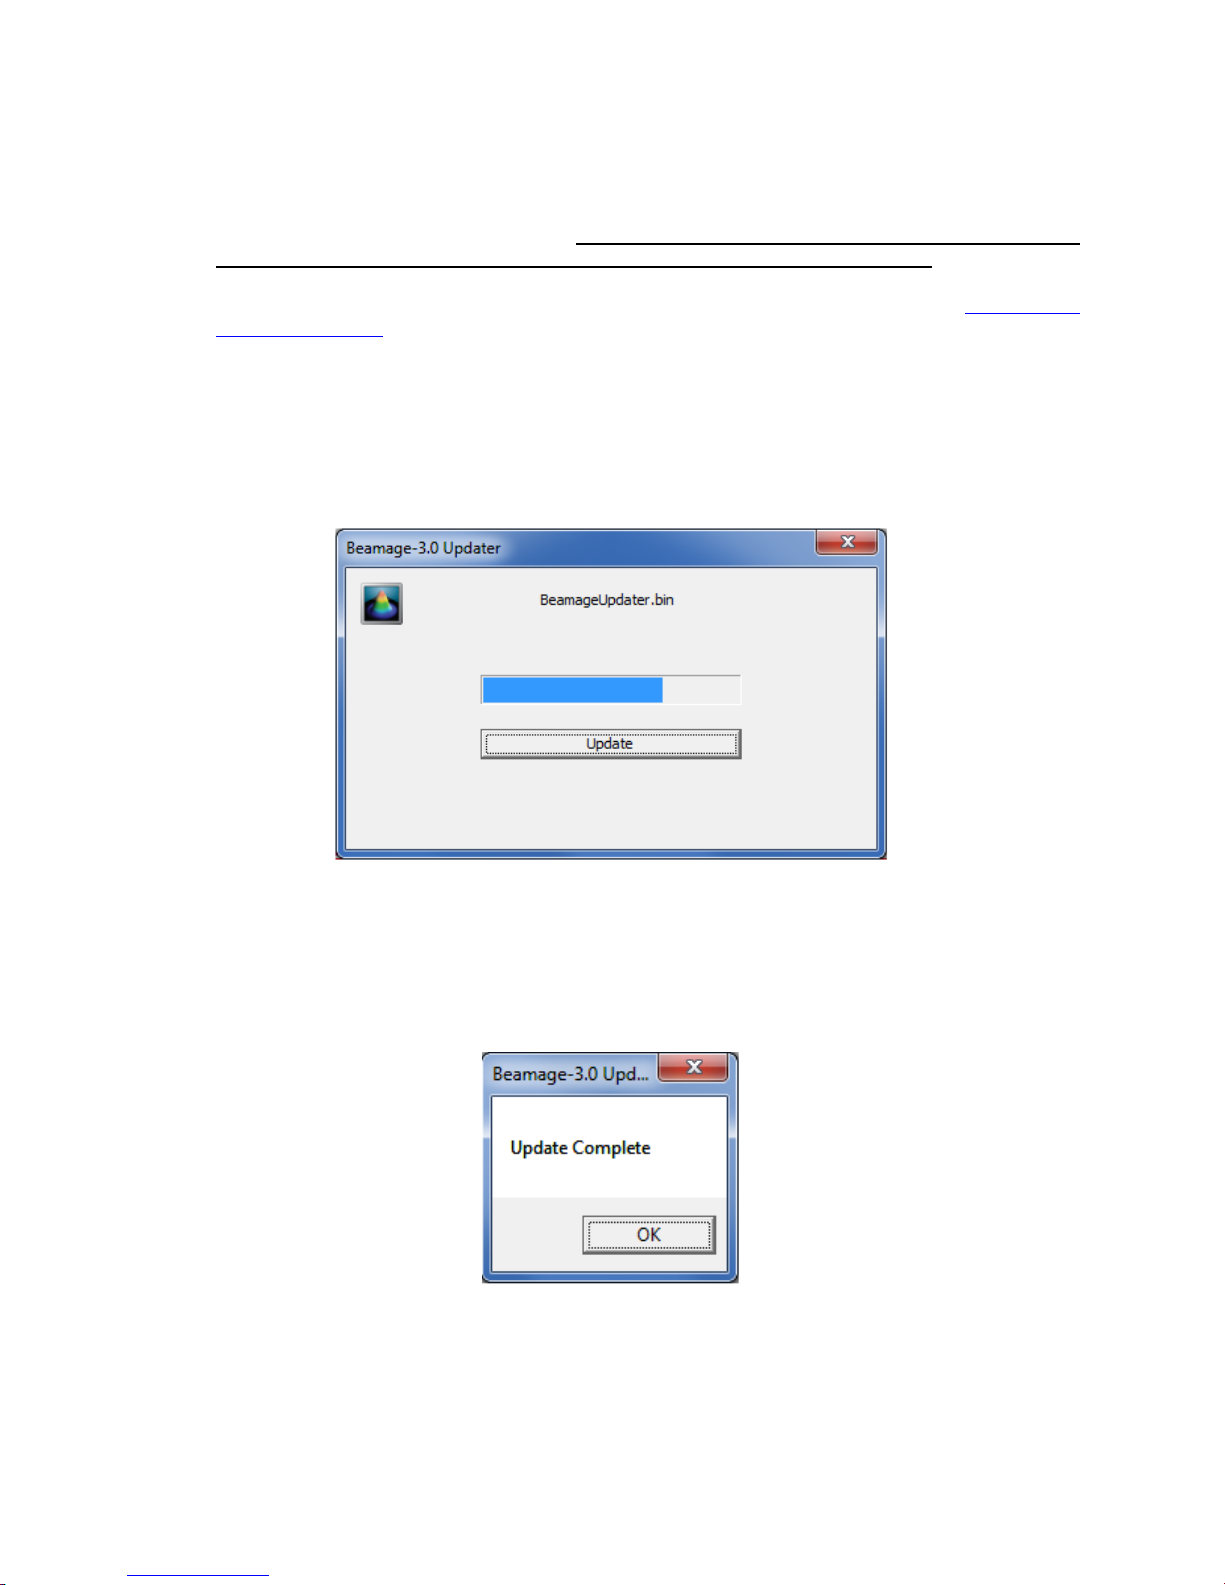
Beamage Series User Manual Revision 9.0 89
APPENDIX C. BEAMAGE FIRMWARE INSTALLATION QUICK GUIDE
1) If the software version of the PC-Beamage is not compatible with the Beamage’s firmware
version, an error message will appear. If so, it is important to update the firmware version
and to reinstall the drivers in order to use the PC-Beamage’s new functions.
2) First, download the latest BeamageUpdater available on Gentec-EO’s website at www.gentec-
eo.com/downloads.
3) Connect the Beamage to your computer. If the Beamage is already connected, please disconnect
and reconnect it.
4) Run the Beamage-3.0 Updater.
5) Click on “Update”.
Figure C-1
6) The Beamage-3.0 Updater might ask you to reset the Beamage. If so, please disconnect and
reconnect the Beamage and click on “Update” again.
7) Once this is done, a message box will appear. Click on OK.
Figure C-2
8) Once the Bemage-3.0’s firmware is up to date, update the drivers by following the steps
described in Appendix B. Please note that even if the drivers were previously installed, the new
software and firmware versions need a new driver installation.
Page 91

Beamage Series User Manual Revision 9.0 90
APPENDIX D. RECYCLING AND SEPARATION PROCEDURE FOR WEEE
This section is used by the recycling center when the Beamage reaches its end of line. Breaking the
calibration seal or opening the Beamage’s case will void the warranty
The complete Beamage contains:
1 Beamage
1 USB 3.0 cable with screw locks
1 BNC to SMA connector
1 Software CD-ROM
SEPARATION
Plastic: Aperture cap, SMA cap.
Metal: Beamage’s case, screws, SMA connector, BNC to SMA connector, ND filter holder.
Wires: USB cable.
Printed circuit board: inside the Beamage.
Glass: ND filter.
CD: CD-ROM.
DISMANTLING PROCEDURE
Remove the 3 screws on the BEAMAGE’s back cover with an Allen key.
Remove the 1 screw holding the PCB’s with a flat screw driver.
Cut the wire between the PCB and the SMA connector.
Remove the ND filter and remove the glass with a spanner wrench.
Page 92

Beamage Series User Manual Revision 9.0 91
APPENDIX E. COMPLETE LIST OF SAVED SETTINGS
Image buffer size
Smoothing filter activated
Despeckle filter activated
IR filter activated
Normalize option activated
Trigger option activated
Turbo option activated
Divergence tab is activated
Relative position tab is activated
Camera lens calibration tab is activated
Fixed crosshair tab is activated
XY display options :
o Gaussian activated
o Semilog activated
o Data cursor activated
o FWHM activated
o 1/e2 activated
Measure tab options:
o Beam diameter definition
o Crosshair center choice
o Crosshair orientation choice
Setup tab options:
o Is auto exposure time activated
o Exposure time
o Image rotation
o Image flip vertical
o Image flip horizontal
o Image buffer averaging
o Active area :
Choice
Left
Top
Center activated
Width
Height
o Pixel addressing mode
o Camera numerical gain
o Camera bit depth
o Magnification factor
Acquisition tab options:
o Acquisition mode
o Duration:
Days
Hours
Minutes
Seconds
o Sample rate images
o Sample rate:
Days
Hours
Minutes
Seconds
Page 93

Beamage Series User Manual Revision 9.0 1
o Acquisition filename
Divergence tab options:
o Focal distance
Relative position tab options:
o Relative position mode
o X baseline position
o Y baseline position
o Save to log activated
Camera lens calibration tab options:
o X baseline position
o Moving distance in X
o Is calibrated activated
Fixed crosshair tab options:
o Fixed crosshair mode
o X crosshair baseline position
o Y crosshair baseline position
o Crosshair angle
Page 94
Beamage Series User Manual Revision 9.0 1
o
 Loading...