

Page 1
DATA LOGGING
HOT WIRE ANEMOMETER with
CFM/CMM and 30:1 IR THERMOMETER
USER’S MANUAL
CIH30DL
Please read this manual carefully and thoroughly before using this product.
Page 2

TABLE OF CONTENTS
Introduction . . . . . . . . . . . . . . . . . . . . . . . . . . . . . . . . . . . . . . . . . . . . . . . . 3 –4
Key Features . . . . . . . . . . . . . . . . . . . . . . . . . . . . . . . . . . . . . . . . . . . . . . . . . . 4
Safety Instructions . . . . . . . . . . . . . . . . . . . . . . . . . . . . . . . . . . . . . . . . . . . . . 5
What’s in the Case . . . . . . . . . . . . . . . . . . . . . . . . . . . . . . . . . . . . . . . . . . . . . 5
Product Overview . . . . . . . . . . . . . . . . . . . . . . . . . . . . . . . . . . . . . . . . . . . 5 –7
Setup Instructions . . . . . . . . . . . . . . . . . . . . . . . . . . . . . . . . . . . . . . . . . . . . . . 8
Install Battery . . . . . . . . . . . . . . . . . . . . . . . . . . . . . . . . . . . . . . . . . . . . 8
Operating Instructions . . . . . . . . . . . . . . . . . . . . . . . . . . . . . . . . . . . . . . 8 – 21
Getting Started . . . . . . . . . . . . . . . . . . . . . . . . . . . . . . . . . . . . . . . . . 8 –9
Measuring Air Speed and Temperature . . . . . . . . . . . . . . . . . . . . . . . . 9
Measuring Airflow Volume . . . . . . . . . . . . . . . . . . . . . . . . . . . . . . . . . . 9
Measuring Surface Temperature . . . . . . . . . . . . . . . . . . . . . . . . . . . . . 10
Holding and Storing Measurements . . . . . . . . . . . . . . . . . . . . . . . . . . 10
Displaying Maximum, Minimum and Average Values . . . . . . . . 10 – 11
Recalling and Erasing Stored Measurements . . . . . . . . . . . . . . 11 – 12
Using the Advanced Settings Menu . . . . . . . . . . . . . . . . . . . . . . 12 – 13
Data Logging with a Computer . . . . . . . . . . . . . . . . . . . . . . . . . . 14 – 21
Install Software and Drivers . . . . . . . . . . . . . . . . . . . . . . . . . 14 – 15
Connecting the Meter to Your Computer . . . . . . . . . . . . . . . . . . . 15
Viewing Real-Time Measurements on the Dashboard . . . . . 15 – 17
Using the Meter to Log Data . . . . . . . . . . . . . . . . . . . . . . . . . 17 – 18
Uploading Record Data . . . . . . . . . . . . . . . . . . . . . . . . . . . . . . . . . 18
Viewing Record Data Graphically . . . . . . . . . . . . . . . . . . . . . 19 – 20
Uploading and Viewing Data Logs . . . . . . . . . . . . . . . . . . . . 20 – 21
Specifications . . . . . . . . . . . . . . . . . . . . . . . . . . . . . . . . . . . . . . . . . . . . . . . . 22
Maintenance Tips . . . . . . . . . . . . . . . . . . . . . . . . . . . . . . . . . . . . . . . . . . . . . 23
Warranty Information . . . . . . . . . . . . . . . . . . . . . . . . . . . . . . . . . . . . . . . . . . 23
Return for Repair Policy . . . . . . . . . . . . . . . . . . . . . . . . . . . . . . . . . . . . . . . . 23
Appendix . . . . . . . . . . . . . . . . . . . . . . . . . . . . . . . . . . . . . . . . . . . . . . 24 – 25
2
Page 3

INTRODUCTION
Thank you for purchasing General Tools & Instruments’ CIH30DL Data Logging Hot Wire
Anemometer with CFM/CMM and 30:1 IR Thermometer. Please read this user’s manual
carefully and thoroughly before using the instrument.
The CIH30DL is a professional-grade, handheld hot wire anemometer that can not only
measure the speed of air exiting the grille or register of an HVAC/R system or blower or fan,
but also convert those readings to airflow volume measurements in units of CFM (cubic feet
per minute or ft
possible because the meter allows the user to enter the free area dimensions of grilles and
output ductwork.
The instrument can also measure the temperature of cooling or heating air, as well as
surface temperatures. Air temperatures from 32° to 158°F (0° to 70°C) are measured by a
thermistor located next to the hot wire sensor at the end of a 6 ft. (1.8m) long telescoping
metal probe and cable. Surface temperatures from -25° to 999°F (-32° to 538°C) are
measured by an integral infrared (IR) thermometer with a distance-to-spot (D:S) ratio of 30:1.
A hot wire anemometer measures air speed in the following way. When the instrument is
powered on, direct current is passed through its hot wire sensor for about 15 seconds. After
the sensor has been warmed to a constant temperature, the instrument detects how much
current is required to maintain that temperature as wind passing across the sensor acts to
cool it. The amount of current required is directly proportional to the square of the wind
speed.
Hot wire anemometers are as accurate as vane anemometers, but hot wire units are better
able to measure very slow air currents because they have no moving parts and therefore
no inertia. For example, the CIH30DL can measure air speeds as low as 2 ft/min. A typical
vane anemometer of comparable quality and accuracy cannot measure air speeds lower
than 80 ft/min.
The CIH30DL has a large backlit display with three readouts: one shows air speed or airflow
volume, another is for IR temperature, and the third is dedicated to air temperature.
Normally, each of these readouts shows real-time measurements, which can be held (frozen)
and read later to enable work in dark areas. End users can opt to have the readouts show
maximum, minimum or average measurements instead. End users also can store up to nine
sets of the three readings (air speed or airflow volume, air temperature and IR temperature)
in an internal nonvolatile memory and recall them at any time in chronological order.
In addition to storing the nine sets of readings, the CIH30DL also can capture—over long
periods of time—and time-stamp up to 20,000 air speed/airflow volume, air temperature
and surface temperature measurements at a user-selected sampling rate from 5 seconds
to 1 hour. These time-stamped readings, called data logs, can be copied to a PC running
Windows
computer, the logs can be displayed as graphs or tables, formats that make it easy to spot
trends or unexpected excursions in readings.
3
/min) or CMM (cubic meters per minute or m3/min). The conversions are
®
7, Windows®Vista or Windows®XP via an included USB cable. Once in the
Windows®7, Windows®Vista and Windows®XP are registered trademarks of Microsoft Corporation.
3
Page 4

The CIH30DL can be configured to display air speed in any of five Imperial or metric units,
airflow volume in CFM or CMM, and temperature in degrees Fahrenheit or Celsius. The
instrument’s IR thermometer, which can be precisely aimed by a low-power laser pointer,
has a default emissivity setting of 0.95 that is adjustable from 0.1 to 1.0 in increments of
0.01.
The meter is normally powered by one “9V” battery (included). To enable long-term data
logging, the meter also can be powered by a 110V or 220V AC supply. When the meter is
powered by the battery, it automatically shuts off after 10 minutes of inactivity to extend
battery life. When running on AC power, the auto power off period is extended to 30 minutes
when the meter is not in data logging mode. When the meter is running on AC power in data
logging mode, the auto power off function is disabled to enable logging sessions longer than
30 minutes. When the meter is connected to a computer via the included USB cable, the
meter is powered through the computer's USB port. In this mode, the Auto Power Off
function is disabled. This prevents unexpected meter shutoffs from interrupting data uploads.
KEY FEATURES
• Measures and displays air speed or airflow volume in several Imperial or metric units
• Simultaneously measures and displays ambient temperature from 32° to 158°F
(0° to 70°C) in °F or °C with ±2% accuracy
• Measures air speeds from 2 ft/min to 7874 ft/min (20 mm/sec to 40 m/sec) with
±3% accuracy
• Measures airflow volumes from 0 to 2.5 million CFM (0 to 72,000 CMM) with
±3% accuracy
• Displays maximum, minimum or maximum air speed plus temperature
• Also has 30:1 infrared thermometer for remote, non-contact measurement of surface
temperatures from -25° to 999°F (-32° to 538°C) with ±3% accuracy and adjustable
emissivity
• Telescoping probe and cable extend reach of hot wire sensor and thermistor to up to
6 ft. (1.8m)
• Jumbo backlit LCD with three readouts
• Stores/recalls up to nine sets of three readings in nonvolatile memory
• Time-stamps and saves up to 20,000 data points at user-selected sampling rate from
5 seconds to 1 hour
• Included USB cable and interface/data logging software enable transfer of stored data
logs from the meter’s internal memory to a PC for tabular or graphic display and
analysis
• Data hold and auto power off functions
4
Page 5

SAFETY INSTRUCTIONS
CAUTION!
The CIH30DL’s targeting laser is a Class 2 type that emits less than 1mW of power between
630nm and 660nm. Avoid direct eye contact with laser light radiation. U.S. law prohibits
pointing a laser beam at aircraft; doing so is punishable by a fine of up to $10,000 and
imprisonment.
WHAT’S IN THE CASE
The CIH30DL and its accessories come in a custom molded plastic case. The instrument
itself has two main components: a handheld meter with a digital display, and a telescoping
metal probe with two sensors at one end and a plug for connecting the probe to the meter
at the other. Also in the case are the following accessories:
• A USB cable for connecting the meter to a Windows computer, enabling the meter to
upload captured air speed, airflow volume and surface temperature data. This cable
has a mini B-type plug at one end and an A-type plug at the other.
• An AC adapter and power cable for connecting the meter to a 110V or 220VAC supply
to enable long-term data logging. This cable has a mini B-type plug at one end and a
socket with a spring-loaded latch at the other. The latch makes it easy to attach and
detach either of two kinds of plugs: one with American-style blades and the other
with European-style round prongs. One plug of each type is included in the case.
• A “9V” Alkaline battery.
• A plastic bag containing: 1) a CD with Windows-compatible software and drivers for
using the CIH30DL with a PC running Windows7 (32- or 64-bit), Windows Vista or
Windows XP; 2) a Certificate of Traceable Calibration; and 3) this user’s manual.
PRODUCT OVERVIEW
Fig. 1 shows the labels and positions of the controls and connectors on the front and
top of the CIH30DL. Fig. 2 shows all possible indications on the LCD. Familiarize yourself with
the controls’ functions and the meanings of the display indications before moving on to the
Setup Instructions.
1. (Power) button
2. LCD with three readouts
3. (Record) button: When pressed briefly, stores values shown on all three readouts in
one of nine nonvolatile memory locations, and then advances the location counter by one.
When pressed and held for 3+ seconds, begins logging measurement data (air speed or
airflow volume, air temperature and IR temperature) at preset sampling time. Logs are
stored in the meter’s internal memory space (as opposed to in nonvolatile memory). Also
used to change fields when setting sampling time, date or time and to clear the meter’s
internal data logging memory space.
5
Page 6
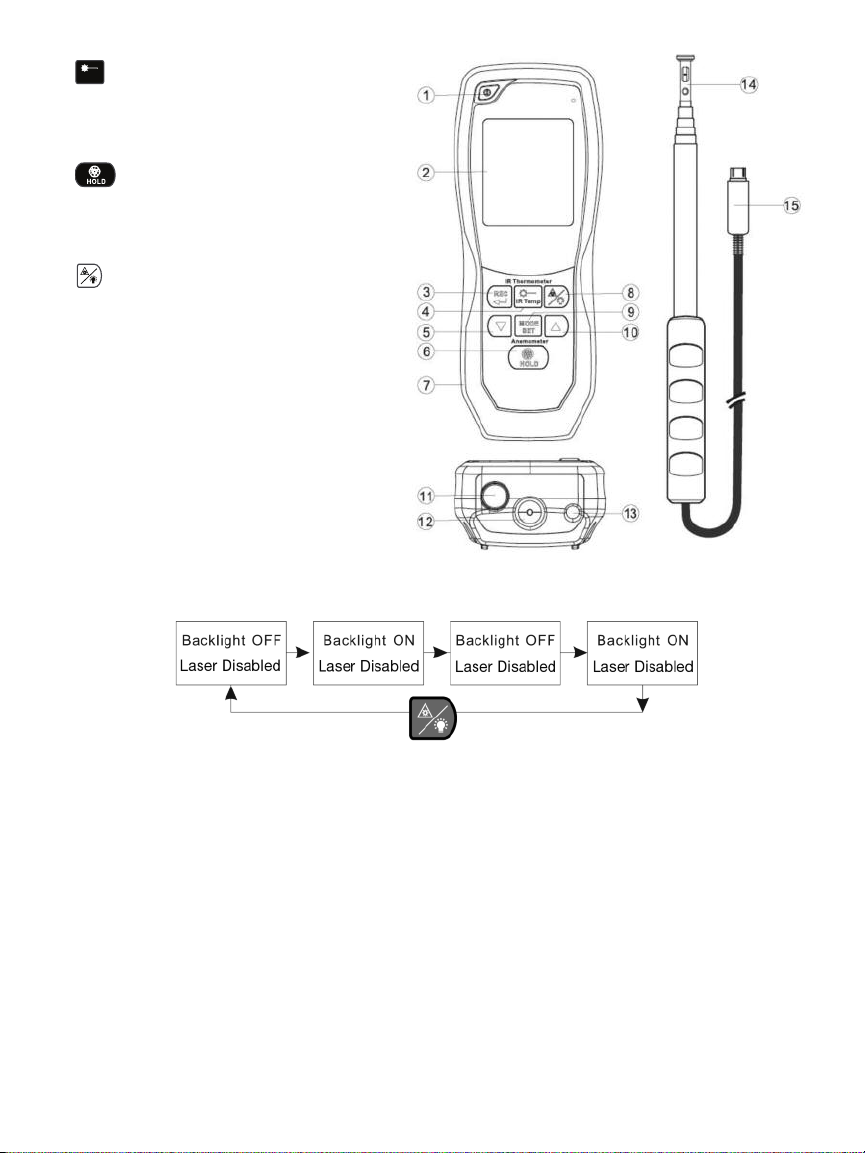
4. button: Activates laser pointer when
TempIR
enabled (unless readouts are displaying
recalled values)
5. ▼ button
6. (Anemometer HOLD) button:
Freezes air speed and airflow volume
readings only
7. AC power/USB cable jack (on left side)
8. A two-function button: Laser
pointer enable/disable and backlight
on/off. Pressing button four times cycles
through the four possible combinations
of states (see figure below). After the
backlight is activated, it stays on for 15
seconds and then automatically shuts
off.
Fig. 1. The CIH30DL’s controls and
connectors
TOP
9. MODE SET button: When pressed briefly and repeatedly, cycles readouts to show: realtime measurements; maximum, minimum and average readings; and recalled stored
measurements.
When pressed and held for 3+ seconds (unless readouts are displaying recalled values),
places meter in advanced setup mode. In this mode, the user can change default
measurement units, enter a grille area, set the data logging sampling time and the current
date and time, and clear the meter’s data logging memory space.
10. ▲ button
11. Hot wire probe socket
12. IR measuring window
13. Laser pointer port
14. Hot wire probe head
15. Hot wire probe plug
6
Page 7
TempIR
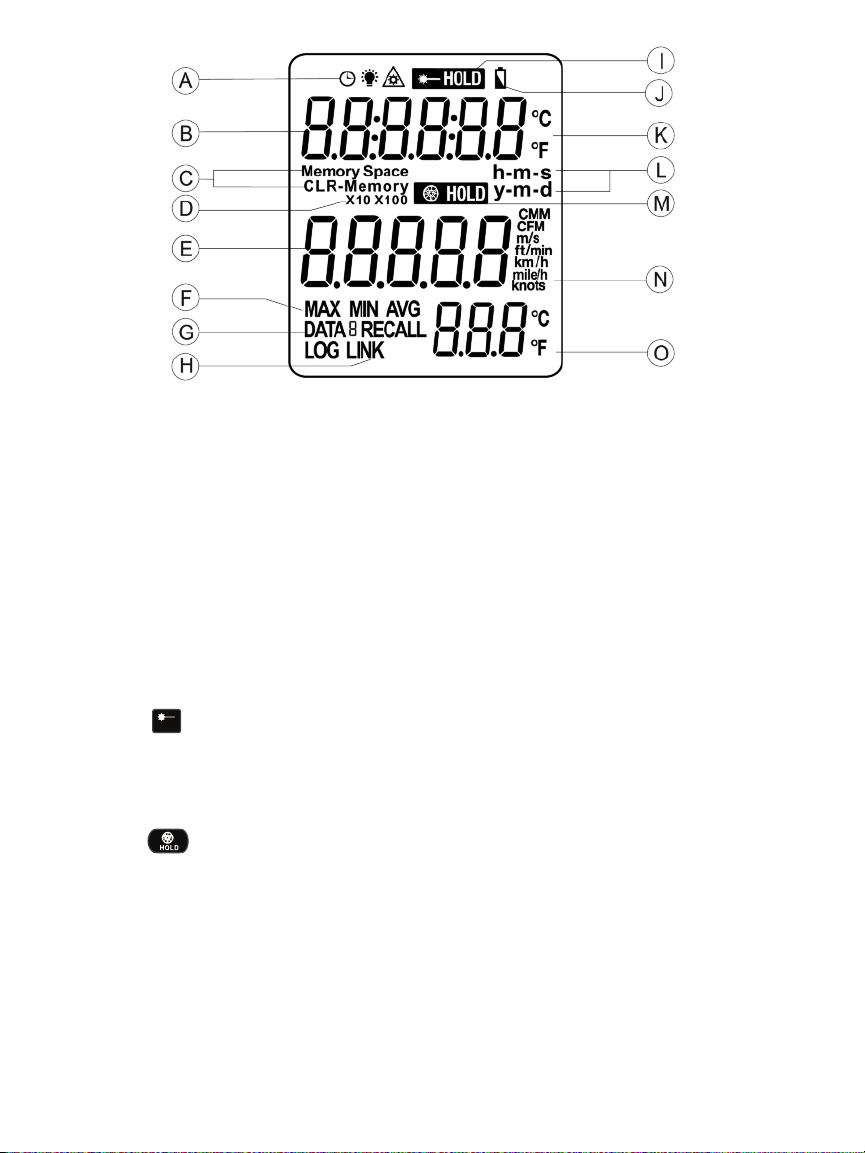
Fig. 2. All possible display indications
A Clock, backlight on and laser pointer enabled icons
B Secondary readout
C Memory Space/CLR (clear) and Memory indications
D X10 and X100 indications
E Primary readout
F MAX, MIN and AVG display indications
G DATA [#] RECALL and DATA LOG indications
H [PC] LINK indication
I [IR Temperature] HOLD indication
J Battery charge indicator
K IR temperature measurement unit (°C or °F)
L Time and date field indications
M [Anemometer] HOLD indication
N Air speed and airflow volume measurement units
O Tertiary readout
7
Page 8
SETUP INSTRUCTIONS
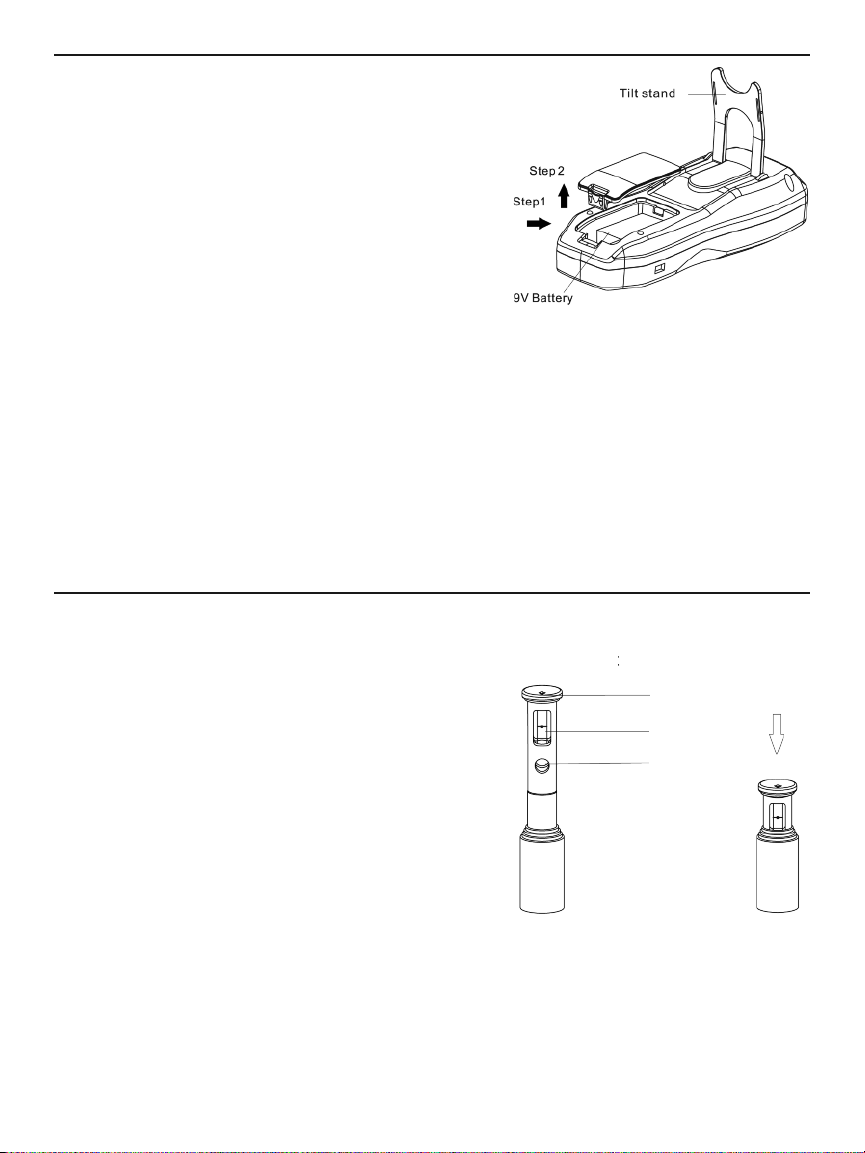
INSTALL BATTERY
The meter’s battery compartment is accessible
from the back of the unit (Fig. 3).
Before installing the 9V battery included in the
carrying case, remove the plastic covering its
terminals. Open the battery compartment by
pushing the tab at the bottom of its cover forward
(Fig. 3, Step 1). Lift the cover and set it aside
(Step 2). Then plug the battery into the wired
socket inside the compartment. The terminals of
Fig. 3. The back of the CIH30DL
the battery and the socket mate in only one way,
with the smaller male terminal plugging into the
larger female terminal. Replace the battery compartment cover and push down on its bottom
until it snaps shut.
The CIH30DL also can be powered by connecting it to an AC outlet or a computer's USB port.
There is no reason to do so unless you plan to use the meter for extended data logging
sessions. Connecting the meter to an external power supply does not charge the included
“9V” Alkaline battery, which is not rechargeable.
See “Data Logging with a Computer”, beginning on p. 14, for ways to connect the CIH30DL
to an external power source.
OPERATING INSTRUCTIONS
GETTING STARTED
To prepare the CIH30DL for use, line up the hot wire
probe plug (Fig. 1, Callout 15) with the hot wire probe
socket on the top of the meter (Callout 11) so the
black arrow on the probe connector faces the back of
the meter. Then insert the probe plug into the socket.
Before extending the telescoping probe, extract
the probe head (Callout 14) from the probe body
by grasping the round black plastic end piece
(Fig. 4 left, top callout) with two fingers and pulling
slowly. Take care not to touch either the hot wire air
speed sensor or the air temperature sensor within
the head; both are extremely delicate. Pull out the
probe head to expose 1 inch of probe body. Exposing
the probe head now will allow you to telescope the
probe to any length later by grasping its body rather than its delicate head.
Following each measurement session, carefully push the probe head back into the probe
body (Fig. 4, right) in order to protect the sensors.
Ready For Use
Black plastic
end piece
Hot wire air
speed sensor
Air temperature
sensor
Not in Use
Fig. 4. The probe head assembly
8
Page 9
To power on the meter, press the button. The display will initially show the clock icon at
DATA
F
F
ft/min
upper left and numbers on the primary readout counting down from 15. The numbers track
the time needed to heat the hot wire to prepare it for use. After 15 seconds, the meter will
be ready for use. It will automatically enter “normal” (air speed or airflow volume +
temperature) measurement mode and display a screen similar to Fig. 5. By default, the
primary (middle) readout shows real-time air speed in ft/min and the tertiary (lower) readout
shows real-time air temperature in degrees Fahrenheit. The secondary (upper) display also
uses °F as its default unit.
To change the default air speed or temperature unit, skip
ahead to “Using the Advanced Settings Menu,” beginning on p. 12.
MEASURING AIR SPEED AND TEMPERATURE
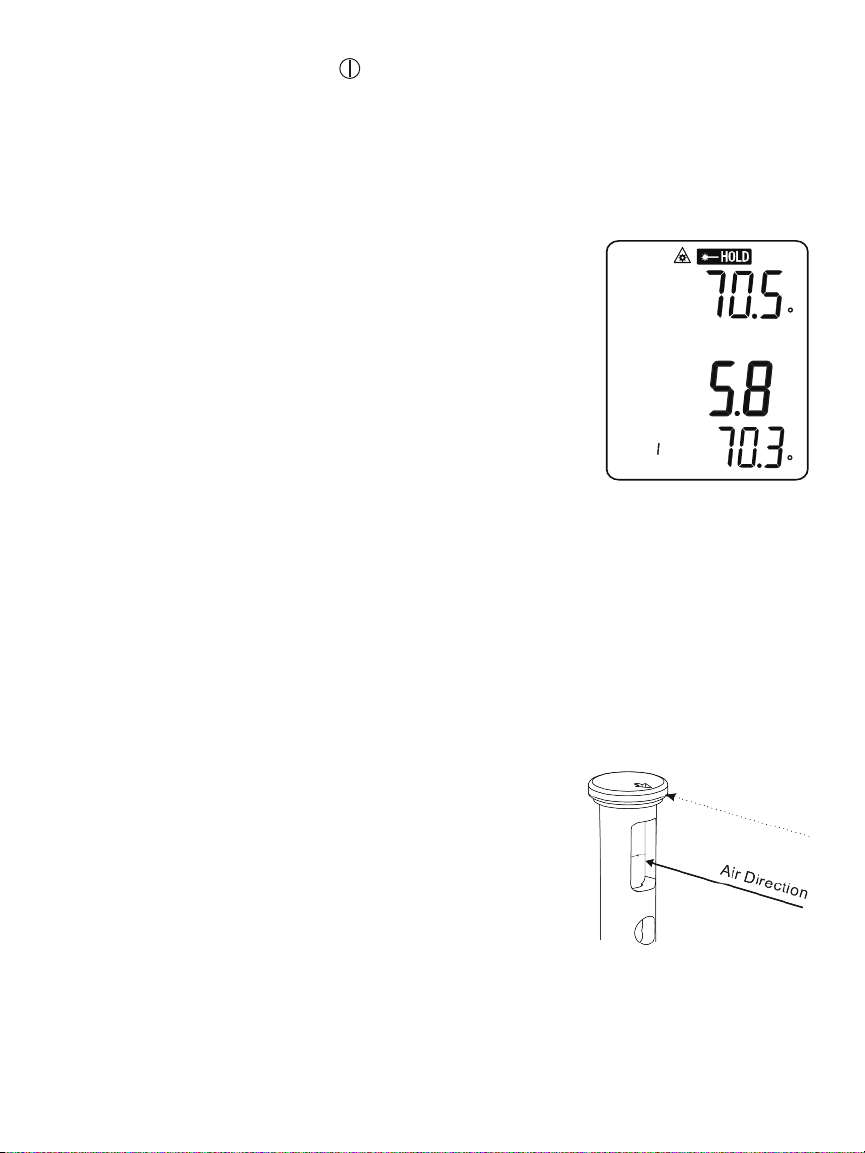
To measure the speed and temperature of a blower’s
or HVAC system’s output, fully extend the telescoping hot wire
probe and position the head of the probe in the airstream leaving
the system’s duct or register. Be sure the black arrow on the round
black plastic end piece points in, or opposite to, the direction of air
flow (see Fig. 6). The primary (middle) readout will show the air
speed in ft/min and the tertiary (bottom) readout will show the
temperature of the airstream in °F.
Fig. 5. The initial display
after powering on
When making air speed or airflow volume measurements, it’s
important to make sure the air flows directly through the larger window in the probe
head containing the hot wire. If some of the airflow goes around the cavity, the hot wire
will not be cooled to the maximum extent, and air speed and airflow volume measurements
will consequently be low. To ensure that the hot wire is perpendicular to the airflow, slowly
twirl the probe while watching the primary (middle) readout. When the highest values are
seen, the hot wire is fully perpendicular to the flow of air.
MEASURING AIRFLOW VOLUME
To prepare to measure the amount of air exiting a duct,
grille or register, first measure its area. Then skip ahead to
“Using the Advanced Settings Menu” beginning on p. 12.
Following the instructions in Fig. 8, use the MODE SET button
and the ▼ and ▲ buttons to 1) place the meter in airflow
volume measurement mode and 2) enter the area of the duct,
grille or register.
Once you have measured and entered the area, fully extend the
telescoping hot wire probe and position the head of the probe
in the airstream. Make sure the hot wire window is
perpendicular to the airstream, as when measuring air speed.
The primary (middle) readout will show the airflow volume
in the default unit of CFM (cubic feet/minute) and the tertiary
(bottom) readout will show the temperature of the airstream in °F.
Fig. 6. How to orient the
hot wire probe
9
Page 10

MEASURING SURFACE TEMPERATURE
TempIR
TempIR
TempIR
To use the meter’s IR thermometer to measure the surface temperature of an object
from a distance, make sure the meter is in “normal” measurement mode, with the
primary (middle) readout tracking air speed or airflow volume and the tertiary (lower)
readout tracking air temperature. Then make sure the laser pointer is enabled (indicated by
the icon at the top of the display). It may be necessary to press the button once or
twice to enable the pointer.
With the laser pointer enabled, point the top of the meter at an object or surface and press
the button. The IR thermometer will measure the surface temperature and show it on the
secondary (upper) readout. Note that releasing the button turns off the laser pointer and
causes the measurement to be held (indicated by the return of the HOLD icon above the
measurement). All IR temperature measurements are automatically held on-screen until the
button is pressed again or the meter is powered off—whichever comes first.
To improve your surface temperature measurements, learn to determine how close to the
target the CIH30DL must be so the area whose temperature you wish to measure is within
the spot area of the meter’s IR thermometer. Refer to the Appendix, which begins on p. 24,
for the theory and practice of making accurate IR measurements.
HOLDING AND STORING MEASUREMENTS
To hold any pair of measurements (air speed + temperature or airflow + temperature) made
by the sensors in the probe head, press the button. This will freeze the value shown on
the primary readout and cause the HOLD icon to appear above it. Held measurements
are erased when the meter is powered off. To release the hold, press the button again.
The CIH30DL contains enough nonvolatile memory to store nine sets of three readings (air
speed or airflow volume, air temperature and surface temperature. To store a set of three
measurements, first make sure the meter is in “normal” measurement mode or
measurement hold mode. Then note the number to the right of the word DATA at the lower
left of the display and briefly press the button. Doing so will store the values shown by all
three readouts in the indicated memory location and then advance the location counter by
one. The new number (DATA X +1) is the memory location that will be used the next time the
button is pressed.
While the readings are being stored, the meter will continue to operate in normal
measurement mode. In contrast to held readings, readings stored in nonvolatile memory are
not erased when the meter powers off. However, a reading will be overwritten if its memory
location is next in the queue when the button is pressed.
DISPLAYING MAXIMUM, MINIMUM AND AVERAGE VALUES
The MODE SET button is the gateway to two multi-option menus. The menu that opens
depends on how long you press the button. Pressing the MODE SET button briefly lets you
choose to display values other than real-time measurements on the three readouts. Pressing
and holding the button opens up the Advanced Settings Menu, which is detailed in the next
section, beginning on p. 12.
10
Page 11

Fig. 7 is a flowchart of the menu made available by briefly pressing the MODE SET button.
Starting from normal measurement mode, one press of the button makes all three readouts
show the maximum values of the three main parameters measured since the meter was
powered up. The term MAX appears at the lower left of the display to indicate what the
readings represent.
Normal Measuring Mode
Three readouts show maximum
values since power on
MODE
SET
Three readouts show minimum
values since power on
Three readouts show average
values since power on
Three readouts show the
parameters stored together at
the same in nonvolatile memory
Fig. 7. The menu made available by briefly
pressing the MODE SET button
Pressing the MODE SET button again switches the readouts to show the minimum (MIN)
values of the three parameters measured since the meter was last powered on. Pressing the
button a third time switches the readouts to show the average (AVG) values of the three
parameters.
RECALLING AND ERASING STORED READINGS
Pressing the MODE SET button a fourth time begins retrieval and display of the
measurements stored in nonvolatile memory. The first set of three values retrieved are the
three measurements most recently stored. Their memory location is indicated by the word
DATA and a number from 1 to 9 at the lower left of the display. The word RECALL appears at
the right of the number to indicate that the three readouts are showing stored values.
11
Page 12

To retrieve other triple sets of measurements in either order (newest to oldest, or oldest to
newest), use the ▼ and ▲ buttons, respectively. For example, if the first set of values
retrieved (the most recently stored) is tagged DATA2, pressing the ▼ button would retrieve
the values stored in memory location DATA1. These represent the next oldest measurements,
compared to DATA2. To continue retrieving data using a reverse timeline (newest to oldest),
continue to press the ▼ button.
To retrieve measurement data using a forward timeline (oldest to newest), use the ▲ button.
Whichever timeline you choose, when you reach memory location DATA0 (either by moving
up from DATA9 or down from DATA1) the display will change radically. DATA0 RECALL will
appear on the bottom line and all three readouts will show dashes instead of measurement
values and units. That’s because DATA0 is a non-storing memory location. In addition, the
letters CL and CLE will be superimposed on the dashes of the secondary and primary
readouts. Also, the words “Memory Space CLR-Memory” will appear in the space between
CL and CLE.
This unique display gives you the opportunity to bulk-erase the meter’s nonvolatile memory.
To do so, press the button. This will cause the entire primary readout (the letters CLE
superimposed on dashes) to flash continuously, indicating that all stored measurements have
been erased. To confirm the erasure, repeatedly press either the ▼ or ▲ button and note
that all DATA [X] RECALL displays now show three readouts with dashes rather than
measurement values.
To return the meter to normal measurement mode after bulk-erasing the nonvolatile
memory, press the MODE SET button.
USING THE ADVANCED SETTINGS MENU
Pressing and holding the MODE SET button for 3+ seconds opens up the meter’s second
multi-option menu, the Advanced Settings Menu. Figure 8 is a flowchart of the options made
available from this menu by subsequent brief presses of the MODE SET button. Once you
have entered the Advanced Settings Menu (indicated by the word SET on the bottom line of
the display), moving to the next box down the flowchart requires only a brief press of the
MODE SET button. Pressing and holding the MODE SET button exits the Advanced Settings
Menu and returns the meter to operating in normal measurement mode.
Unlike the first virtual menu accessible from the MODE SET button, the Advanced Settings
Menu gives you only six seconds to choose an option at each decision box moving down the
flowchart. If no button is pushed within six seconds, the menu closes and the meter resumes
operating in normal measurement mode. Once you gain experience using the meter, you will
find that six seconds is sufficient to exercise any option presented by the menu.
12
Page 13

Fig. 8. The Advanced Settings Menu
Normal Measuring
mode
Air Speed or Airflow
Volume mode
Air speed unit
Airflow
volume unit
Temperature unit
Enter area of
grille or register
Change emissivity
setting
Sampling time of
data log
Clear data
logging memory
MODE
SET
Press and hold the MODE SET button for 3+ seconds to enter/exit menu
from/to normal measuring mode.
Press the ▼or ▲button to select CMM, CFM (for Airflow Volume mode)
or m/s, ft/min, km/h, mile/h, knots (for Air Speed mode). When your
choice flashes, press the MODE SET button to store it.
Press the ▼or ▲button to select m/s, ft/min, km/h, mile/h or knots.
When your choice flashes, press the MODE SET button to store it.
Press the ▼or ▲button to select CMM or CFM. When your choice
flashes, press the MODE SET button to store it.
Press the ▼or ▲button to select °F or °C. When your choice flashes,
press the MODE SET button to store it.
Press (and hold, if convenient) the ▼or ▲button to adjust the value on
the primary readout to the measured area. The area can be adjusted from
0.01 to 322.92 ft
increments of 0.001 m
SET button to store it.
Use the ▼or ▲buttons to change the emissivity setting (by 0.01 per
button press, from 0.10 to 1.00) from the default setting of 0.95.
Use the button to toggle between the minutes and seconds fields of
the time shown on the secondary readout. Use the
(holding them, if convenient) to adjust the flashing value within each field.
The sampling time can be set to any value between 5 seconds (00:00:05)
and 59 minutes, 59 seconds (00:59:59). After entering the desired
sampling time, press the MODE SET button to store it.
Press the button to clear the meter’s internal data logging memory.
Doing so resets the five-digit Memory Space counter and causes it and
the text CLR-Memory above it to flash, confirming the erasure. After six
seconds, the meter will automatically exit the Advanced Settings Menu
and enter normal measuring mode.
2
in increments of 0.01 ft2, or from 0.001 to 30m2in
2
. After entering the correct area, press the MODE
▼
and ▲buttons
Use the button to toggle between the year, month and day fields of the
Set current date
Set current time
date shown on the secondary readout. Use the
them, if convenient) to adjust the flashing value within each field. After
entering the current date, press the MODE SET button to store it.
Use the button to toggle between the hours, minutes and seconds
fields of the time shown on the secondary readout. Use the
buttons (holding them, if convenient) to adjust the flashing value within
each field. Remember to use the 24-hour format when setting the hour.
After entering the current time, press the MODE SET button to store it.
▼
and ▲buttons (holding
▼
and
▲
13
Page 14

DATA LOGGING WITH A COMPUTER
In addition to making and displaying real-time air speed, airflow volume and temperature
measurements and storing up to nine sets of these readings in nonvolatile memory, the
CIH30DL also can make and time-stamp up to 20,000 measurements over extended periods
of time at user-selected sampling rates. These measurements, called data logs, are stored
in a separate internal memory. They can be uploaded to a PC using the USB cable and
interface/driver/data logging software provided with the instrument.
After uploading, the data logs can be analyzed for trends and anomalies using the software’s
presentation options. Examples include graphical and tabular displays of data that make it
easy to spot excursions of air temperature or gradual decreases in airflow volume over time.
Install Software and Drivers
1. Place the installation disc, shiny side
down, in your computer’s CD/DVD
drive and close the drawer.
2. Double-click the icon "Run setup.exe",
or the icon representing the disc to
initiate AutoPlay. The screen shown in
Fig. 9 will appear.
3. Click Next to install the anemometer's
application program (Anemometer AP,
Version 3) in your C:\Program Files
(x86) folder in a new subfolder named
<ST73X>. (If you want to install the
software elsewhere, click Browse and
choose another location.) Doing so will
also install software for other National
Fig. 9. The initial software installation
screen
Instruments products in another new
Program Files subfolder named <National Instruments>.
4. On the next dialog box (the National Instruments Software License Agreement),
click the circle to the left of “I accept the License Agreement” and then click Next.
5. On the next dialog box (the License Agreement), again left-click the circle to the left
of “I accept the License Agreement” and then left-click Next.
6. On the next dialog box (Start Installation), click Next. On some computers, the two
software installations may take as long as 20 minutes.
7. When the next dialog box (Installation Complete) notifies you that “The installer has
finished updating your system,” click Next.
8. The next dialog box prepares for installation of the PL-2303 USB-to-Serial driver on
your computer. Click Next to continue.
9. When the next dialog box (InstallShield Wizard Complete) appears, click Finish.
14
Page 15

10. You may or may not be prompted now to restart your computer to complete
installation of the Anemometer Application. If you are prompted to do so, click
Restart.
Whether or not you restart, note that an Anemometer Application icon has been
added to your desktop, start button, or both locations. To facilitate access to the
program, right-click on whichever icon has been added and pin it to both locations
and your taskbar. You can now eject the installation disc and store it with your other
important software.
Connecting the Meter to Your Computer
Before using the CIH30DL to log data, familiarize yourself with how the meter and the
software you have just installed work together.
To begin, connect the meter to your computer by plugging the mini B-type plug of the
included USB cable into the jack on the left side of the meter (Fig. 1, Callout 7). Next, insert
the A-type plug at the other end of the cable into an open USB port of your computer. Power
on the meter and wait 15 seconds for the hot wire sensor to heat up to operating
temperature.
The first time you connect the meter to your computer, the system tray at lower right will
pop-up two notifications: 1) “Installing Device Driver Software”, followed by “Prolific USB-toSerial COMM Port ((COM[X])) Device Driver Software Installed Successfully”. Depending on
which Windows OS you are running and which USB port you have chosen, the “X” in
“(COMX)” may be any number from 1 to 9. Write down the number shown in the
notification. Knowing the number will speed up each subsequent connection of the meter
to your computer—as long as you use the same USB port each time.
The interface/data logging software is now ready to be used with the CIH30DL.
Viewing Real-Time Measurements
on the Dashboard
The software installations should have added an
“Anemometer AP” or “Anemometer Application” icon
to your Start button and/or desktop, and/or an “IR-A"
icon to the Quick Start (left) section of the taskbar at
the bottom of your computer screen.
Open the Anemometer AP program via the icon on the
Start button, desktop or Taskbar. Two overlaid screens
will appear (see Fig. 10).
The larger, bottom screen is called a dashhboard and
it serves the same purpose as the dashboard of a
vehicle: displaying all important measurements in one
place. The smaller, top screen will show a pulldown
menu of COM port selections at right, with a default
COM port selection of COM4.
Fig. 10. The startup Anemometer
Application screen
15
Page 16

Fig. 11. the Anemometer
Application's dashboard
To access the dashboard, you must use this pulldown to select the number of the COM port
you are using to connect the meter. This is the number you were advised to write down
earlier. If you have forgotten it, you can still identify the “correct” port by trial and error.
Selecting the correct COM port will illuminate the green STATUS light on the small overlaid
screen and make the CONNECT virtual button available to press. You may need to refresh the
COM Port window until the number of the COM port into which you plugged the USB cable
appears.
Once the STATUS light on the smaller screen illuminates, click on CONNECT. A successful
connection will cause the smaller screen to disappear, enabling the dashboard (Fig. 11) to
appear in full and begin mirroring real-time readings on the meter’s LCD. The connection will
also cause the word LINK to appear on the bottom line of the meter’s LCD.
WARNING!
If your computer is running the 64-bit version of Windows7, NEVER disconnect the
CIH30DL from the computer (by unplugging either end of the USB cable) without
first closing the Anemometer AP (IR-A) application. Disconnecting the meter while
the application is running will cause your computer to crash (shut down hard, with
the same consequences as losing power or pressing and holding the POWER
button) every time. When your computer crashes, all open applications will close
immediately and all of your unsaved work will be lost.
If you do not know which version of Windows7 you are running, right-click the
“My Computer” icon on your desktop or double-click “Computer” in Windows
Explorer. In the “System” section, the “System type” line will indicate whether you
are running the 32-bit or 64-bit version of Windows7.
16
Page 17

On the dashboard, the default units are °F for temperature and m/s for air speed. To change
the air speed unit, left-click the red box containing m/s and select one of the four other units
as the default. To switch to °F as the IR and air temperature unit, click on °F in the red box.
These defaults must be reset each time you the open the program.
Using the Meter to Log Data
Before logging data, close the Anemometer AP program and disconnect the CIH30DL
from your computer in that order (see Warning on p. 16). You should then use the
Advanced Settings Menu (see p. 12 and following) to set the current time and date in the
meter. Doing so will give the data you log an absolute temporal reference point, making it
more credible and valuable. The Advanced Settings Menu also allows you to use air speed
and temperature units other than the default m/s and °F, respectively.
Finally—and most important—the Advanced Settings Menu enables you to determine the
optimum value of sampling time for the purposes of your application. Using the shortest
setting of 5 seconds may result in too much essentially identical data being stored in
memory, potentially limiting its capacity to capture important events such as an unexpected
excursion of temperature or humidity. Conversely, using the longest sampling time setting of
59 minutes, 59 seconds will likely cause important events to go undetected.
If you are an experienced data logger, you already know how to choose the optimum
sampling time for your application. If you are a novice, pick a sampling time closer to the
minimum than the maximum sampling time, on the assumption that the meter probably has
enough memory (20,000 sets of readings) to store all the data you ask the meter to log—
unless you use it to log data for months, rather than weeks or days.
Because most data logging is done over a long period of time, General recommends that you
change the meter’s power supply from its 9V battery to an external source of AC power
before beginning a logging session. Running on AC power enables the meter to log data
indefinitely, not just until the battery discharges.
To switch to AC power, attach the correct type of plug for your locale (American-style
blades or European-style round prongs) to the socket of the supplied power cable. The top of
each plug has square corners. Push the lip on the plug’s top edge at an angle into the slot in
the top of the socket’s cavity (marked by an arrow). Then push the bottom of the plug down
and into the cavity until the spring-loaded latch secures it. Finally, insert the mini B-type plug
end of the power cable into the USB jack on the side of the meter (Fig. 1, Callout 7) and plug
the other end into an AC outlet.
To begin logging data, extend and secure the probe as the application dictates and then
press and hold the REC button for at least 3 seconds. This will cause the phrase DATA LOG
to appear on the bottom of the meter’s LCD.
To stop logging data, press and hold the REC button again. This will cause the DATA LOG
indication to disappear. Once the meter exits Data Logging mode, it will automatically power
off in 30 minutes (assuming you plugged it into an AC outlet for the logging session, as
recommended earlier). Finally, disconnect the cable applying AC power from both the meter
and the AC outlet. Using the instructions above as a guide, reconfigure the power cable as a
USB cable by detaching the power plug from the socket at the cable’s mini-A plug end.
17
Page 18

Be aware that after you reconfigure the power cable as a USB cable and before you connect
the meter to your computer, the meter will automatically resume drawing power from its
internal battery. The switch will re-enable the Auto Power Off function, which will then
automatically power the meter off if no buttons on it are pushed within any 10-minute
interval.
When you connect the meter to your computer via the USB cable for the purpose of
uploading data (the subject of the next section), the meter will begin drawing power from the
computer’s USB port. The connection will disable the Auto Power Off function to prevent
unexpected interruptions of data transfers between the meter and your computer.
Uploading Record Data
At any time after ending a data logging session, connect the meter to your computer by
inserting the mini-B plug at one end of the cable into the jack on the side of the meter, and
the mini-A plug at the other end into an open USB port of your computer. Power on the meter
and open the Anemometer AP program.
Once the meter is connected to your computer, you can upload two different kinds of data to
the PC. The first kind—“Record” data—comprises sets of three parameters (air velocity, air
temperature and IR temperature) whose newest values represent real-time measurements
and which stretch backward in time from the present. The data is “rolled over” (oldest values
are overwritten to make room for newer values) continuously. Record data is analogous to
video data that a digital video recorder (DVR) records continuously as long as it is powered
on. On most consumer DVRs, you can retrieve video received at any time from the present
until one hour ago (unless the channel is changed). On the CIH30DL, the length of the
corresponding “reverse time” interval is a function of the default sampling time.
To upload this Record data, click on the STOP UPLOAD virtual button under RECORD at the
bottom of the dashboard (see Fig. 11). The button label will change to UPLOAD. Wait a
minute or two, and then click on UPLOAD.
You will then be prompted to choose a storage location for this .txt/.xlsx Data Record file. You
can also rename the file now. To avoid confusing this file and other files, General suggests
that you add the date as a suffix to the generic “Data Record” file name and store the file on
your computer’s desktop. Once you have done so, click the OK button of the dialog box.
Locate the file on your desktop, double-click on its icon, and open the file in Microsoft Excel,
Microsoft Notepad or Microsoft WordPad. Depending on the version of Excel you are using,
you may be prompted to verify the integrity of the file (by clicking Yes) prior to opening it.
Note the tabular format of the data as well as the column headings and the time stamps (the
third column in Notepad and WordPad, and Column C in Excel). As explained earlier, Record
data comprises three sets of readings (IR Temperature, Air Velocity and Air Temperature) that
are expressed in default units and displayed in chronological order starting at the time the
meter was connected to your computer and ending at the present time. Also note from the
table that Record data is captured as often as several times per second (some
hour:minute:second time stamps have up to three entries, while others have none or one).
18
Page 19

Viewing Record Data Graphically
You can also view Record data by using the
dashboard’s integrated chart function. With the
meter connected to your computer (indicated
by a green light at the upper left of the
dashboard and the word LINK on the bottom
line of the meter’s LCD, click on the OPEN
virtual button under CHART at the bottom of
the dashboard. A screen similar to Fig. 12 will
appear on your computer’s display. Note that
only two parameters (air velocity and air
temperature) are plotted because they are the
only values that the meter captures
automatically when powered on and operating
unattended in Data Logging mode. The IR
temperature data contained in the tables
generated by uploaded .txt/.xlsx Data Record
files are not plotted.
The dashboard’s chart function is useful for
quickly viewing trends in ambient air speed
and temperature values captured by the probe
since the meter was last powered on. Unlike
Record data, the data in plots generated by the
dashboard’s chart function are not—and
cannot be—given absolute date and time
stamps.
You can, however, make this plotted data
easier to correlate with tables of uploaded
Record data by changing the plots’ x-axis label
via the dashboard. To do so, right-click on any
of the three icons in the graph palette (below
the m/s and °F buttons shown in Fig. 12).
Using the pulldown menu, select Visible
Items, and left-click Scale Legend to put a
check mark to its left. You can also change the
units of the air speed and temperature plots by
clicking their red virtual buttons. As an
example, compare Fig. 13 to Fig. 12. On Fig.
13, the scale legend has been changed from
Numbers to Sample No., and the unit of air
speed measurement has been changed from
m/s to ft/min.
Fig. 12. The initial CHART display,
activated from the dashboard
13. A modified CHART display
19
Page 20

Other selections in the pulldown menus that appear when you right-click on any of the three
icons of the graph palette can be used to:
• Make other chart items visible
• Auto-scale plots along their X and Y axes
• Export images
• Copy data
• Change the way that plots are updated
• Add descriptions and tips to charts
It is also possible to left-click on two of the three icons of the graph palette. Doing so enables
you to manipulate Record data plots using two powerful techniques: zooming and panning:
• If you left-click on the center icon of the graph palette—the Zoom button—six
display options will appear for selection. Clicking on the icon in the middle of the
bottom row turns the left button of your computer’s mouse, touch pad or trackball
into a “zoom lens” through which you can greatly increase the resolution of the data
in plots of air velocity and air temperature vs. time.
• Left-clicking on the right icon of the graph palette turns your mouse, touch pad or
trackball into a panning control. Doing so changes the icon of your cursor into a hand.
When placed within a plot area, moving the hand left or right shifts the time axis
forward or backward.
The remaining two sets of three interactive icons on the dashboard are located at the bottom
left, below the plots. The icon at left—a lock—is called the Scale Lock button. Left-click it
to toggle in and out of autoscaling for each plot. To the right of the Scale Lock button are
two icons—called Scale Format buttons—that you can right-click to configure the format,
precision and mapping mode of plotted data, set the visibility of the scale and scale label,
and change the grid and plot colors.
Uploading and Viewing Data Logs
To upload your data logs, click on the STOP UPLOAD virtual button under DATALOG at the
bottom of the dashboard. When you do so, the button label will change to UPLOAD and the
orange segment of the progress bar running horizontally across the middle of the dashboard
will turn green and slowly grow longer to the right. When the bar stops growing, click on
UPLOAD.
As was the case for Record data, you will then be prompted to choose a storage location for
this .txt/.xlsx DataLog file. Add the date as a suffix to the generic “DataLog” file name and
store the file on your computer’s desktop. Once you have done so, click the OK button of the
dialog box.
Locate the file on your desktop, double-click on its icon, and open the file in Microsoft Excel,
Microsoft Notepad or Microsoft WordPad. As before, depending on the version of Excel you
are using, you may be prompted to verify the integrity of the file (by clicking Yes) prior to
opening it.
20
Page 21

Note the tabular format of the data as well as the column headings and the time stamps (the
third column in Notepad and WordPad, and Column C in Excel). Like Record data, Data Logs
comprise three sets of readings (IR Temperature, Air Velocity and Air Temperature) that are
expressed in default units and displayed in chronological order. Unlike Record data, the
time stamps of Data Logs begin when you started data logging and stop when you stopped
logging. Also, unlike Record data, Data Log data points are captured at the sampling rate you
selected (or the previous default sampling rate, if you chose not to select a new rate) before
beginning a data logging session.
Finally, note that when you upload data logs, all logs in the instrument’s memory are
uploaded, not just the logs of your most recent session. To clear the data logging memory
in the CIH30DL, follow the instruments for the “Clear Data Logging Memory” box of the
flowchart (Fig. 8) on p. 13.
Instructions for optimizing the graphical presentation of data logs are beyond the scope of
this manual. Using Excel, rather than Notepad or WordPad, to open data log files offers the
most options for viewing flexibility.
21
Page 22

SPECIFICATIONS
Air Speed Measurement Range 2 ft/min to 7874 ft/min (20 mm/sec to 40 m/sec)
Air Speed Measurement Basic Accuracy ±3% of reading
Air Speed Measurement Resolution 0.1 ft/min; 0.01 m/s; 0.01 km/h; 0.01 mph;
Airflow Volume Measurement Range 0 to 2.5 million CFM (0 to 72,000 CMM)
Airflow Volume Measurement Basic Accuracy ±3% of reading
Airflow Volume Measurement Resolution 1 CMM; 1 CFM from 0 to 99,999 CFM;
Air Temperature Measurement Range 32° to 158°F (0° to 70°C)
Air Temperature Measurement Basic Accuracy ±3% of reading
Air Temperature Measurement Resolution 0.1°F (0.1°C)
IR (Surface) Temperature Measurement Range -25° to 999°F (-32° to 538°C)
IR Temperature Measurement Accuracy ±5.4°F (3°C) from -25° to -4°F (-32° to 20°C);
IR Temperature Measurement Resolution 0.1°F (0.1°C)
IR Thermometer Emissivity Adjustable from 0.1 to 1.0 in increments of 0.01.
IR Thermometer Distance-to-Spot Ratio 30:1
Airflow Register Area Range 0.01 to 322.92 ft
Sampling Time Range 5 seconds to 59 minutes, 59 seconds
Internal Measurement Storage Capacity 9 sets of 3 readings
Internal Data Log Storage Capacity 20,000 points
Auto Power Off After 10 minutes of inactivity on battery power;
Backlight Duration 15 seconds
Display Size 1.69 x 2.4 in. (33 x 51mm)
Operating Temperature 32° to 122°F (0° to 50°C) @ 10 to 90% RH
Storage Temperature 14° to 140°F (-10° to 60°C)
Dimensions of Instrument 7.24 x 2.75 x 1.57 in. (184 x 70 x 40mm)
Weight of Instrument 12.36 oz. (350g)
Extended Length of Telescoping Probe and Cable 70.8 in. (1.8m)
Power Source 1 “9V” battery (included)
Dimensions of Protective Carrying Case 10.88 x 10.50 x 2.88 in. (276 x 267 x 73mm)
Weight of Instrument, Accessories and Case 45.5 oz. (1.29kg)
0.01 knots
10 CFM from 100,000 to 999,999 CFM;
100 CFM from 1,000,000 to 2,500,000 CFM
±3.6°F (2°C) from -4° to 212°F (-20° to 100°C);
2% of reading from 212° to 999°F (100° to 538°C)
Default value is 0.95
2
in increments of 0.01 ft2,
or 0.001 to 30m2in increments of 0.001 m
2
after 30 minutes of inactivity on AC power;
disabled when meter is running on AC power in
Data Logging mode
22
Page 23

MAINTENANCE TIPS
Remove the battery before storing the meter for an extended period of time.
Do not drop or disassemble the meter or immerse it in water.
WARRANTY INFORMATION
General Tools & Instruments’ (General’s) CIH30DL Data Logging Hot Wire Anemometer with
CFM/CMM and 30:1 IR Thermometer is warranted to the original purchaser to be free from
defects in material and workmanship for a period of one year. Subject to certain restrictions,
General will repair or replace this instrument if, after examination, the company determines it
to be defective in material or workmanship. The warranty period begins on the date of
purchase. You are encouraged to register your product online. General will extend your
warranty an additional 60 days if you register at www.generaltools.com/ProductRegistry.
This warranty does not apply to damages that General determines to be from an attempted
repair by non-authorized personnel or misuse, alterations, normal wear and tear, or
accidental damage. The defective unit must be returned to General Tools & Instruments or to
a General-authorized service center, freight prepaid and insured.
Acceptance of the exclusive repair and replacement remedies described herein is a condition
of the contract for purchase of this product. In no event shall General be liable for any
incidental, special, consequential or punitive damages, or for any cost, attorneys’ fees,
expenses, or losses alleged to be a consequence of damage due to failure of, or defect in
any product including, but not limited to, any claims for loss of profits.
Register now at www.generaltools.com/ProductRegistry to receive a 60-day extension to
your warranty.
RETURN FOR REPAIR POLICY
Every effort has been made to provide you with a reliable product of superior quality.
However, in the event your instrument requires repair, please contact our Customer Service
to obtain an RGA (Return Goods Authorization) number before forwarding the unit via prepaid
freight to the attention of our Service Center at this address:
General Tools & Instruments
80 White Street
New York, NY 10013
212-431-6100
Remember to include a copy of your proof of purchase, your return address, and your phone
number and/or e-mail address.
23
Page 24

APPENDIX
mm
inches
25@750
1@30
D:S=30:1
50@1500
2@60
75@2250
3@90
Numbers indicate spot size@distance
The field of view of the CIH30DL’s IR thermometer
HOW TO MAKE ACCURATE IR MEASUREMENTS
The CIH30DL has a distance-to-spot (D:S) ratio of 30:1. This means that the target
area (spot) whose infrared radiation (temperature) is being measured increases in
diameter by 1 inch for every 30 inches you move away from the target. Conversely,
the diameter of the target area measured decreases by 1 inch for every 30 inches you
move closer to the target.
All IR thermometers (IRTs), including the CIH30DL, take the average temperature of all
objects within a circular target area (spot). Although the distance “D” in the D:S ratio
is defined as a linear value and the “S” defines the diameter of the spot (see above
figure), the critical parameter is the target area. Depending on the distance to the
target (the object whose temperature you want to measure), the target area may
include both the target and background objects near or behind the thermometer’s
field of view, which defines the target area or spot.
To explain the relationship between D:S ratio and measurement accuracy, consider
how the CIH30DL would be used to measure the temperature of a small AC motor
suspected of overheating. The motor measures approximately 1 ft. x 1 ft., so it has an
area of 1 ft
reading will have a large error. At this distance, the target area is 3 ft
CIH30DL will measure not just the temperature of the motor, but also the temperature
of the physical surroundings in its field of view, and average the two readings.
How inaccurate would the measurement be? If the motor’s operating temperature is
200°F and the background temperature is 75°F, and the motor’s area is half the
target area at the measurement distance, the following equation gives the average
temperature of the target area:
Tavg = (Tmotor + Tbackground) ÷ 2
Solving for Tavg, we get (200 + 75) ÷ 2 or 137.5°F., which is what the CIH30DL would
display. In other words, trying to measure the temperature of the motor from 90 ft.
away introduced an error of (200-137.5) ÷ 200, or 31% into the measurement. In this
case, the measured temperature was 31% below the motor’s actual temperature
because the background is cooler than the motor.
2
. If the CIH30DL is used to make the measurement from 90 ft. away, the
2
. Therefore, the
24
Page 25

To eliminate measurement error, the CIH30DL must be moved close enough so the
motor is the only object in the target area of its IRT (see below figure). For a motor
with an area of 1 ft
2
and using an IRT with a D:S ratio of 30:1, the optimum
measurement distance would be 30 ft.
For best results, the targeted area (spot) should fall within the target’s boundaries
wall
Measuring a motor’s temperature from the wrong (top) and right (bottom) distance
25
Page 26

NOTES
__________________________________________________________________________
__________________________________________________________________________
__________________________________________________________________________
__________________________________________________________________________
__________________________________________________________________________
__________________________________________________________________________
__________________________________________________________________________
__________________________________________________________________________
__________________________________________________________________________
__________________________________________________________________________
__________________________________________________________________________
__________________________________________________________________________
__________________________________________________________________________
__________________________________________________________________________
__________________________________________________________________________
__________________________________________________________________________
__________________________________________________________________________
__________________________________________________________________________
__________________________________________________________________________
__________________________________________________________________________
__________________________________________________________________________
26
Page 27

NOTES
__________________________________________________________________________
__________________________________________________________________________
__________________________________________________________________________
__________________________________________________________________________
__________________________________________________________________________
__________________________________________________________________________
__________________________________________________________________________
__________________________________________________________________________
__________________________________________________________________________
__________________________________________________________________________
__________________________________________________________________________
__________________________________________________________________________
__________________________________________________________________________
__________________________________________________________________________
__________________________________________________________________________
__________________________________________________________________________
__________________________________________________________________________
__________________________________________________________________________
__________________________________________________________________________
__________________________________________________________________________
__________________________________________________________________________
27
Page 28

GENERAL TOOLS & INSTRUMENTS
80 White Street
New York, NY 10013-3567
PHONE (212) 431-6100
FAX (212) 431-6499
TOLL FREE (800) 697-8665
e-mail: sales@generaltools.com
www.generaltools.com
CIH30DL User’s Manual
Specifications subject to change without notice
NOTICE - WE ARE NOT RESPONSIBLE FOR TYPOGRAPHICAL ERRORS.
©2014 GENERAL TOOLS & INSTRUMENTS
MAN# CIH30DL
3/21/14
 Loading...