

Page 1
SCOUT & vbSeries
Instrument Reference Guide
SCOUT100-Ex, SCOUT140-Ex
vb5, vb6, vb7, vb8
25 September 2014
Page 2

GE
Measurement & Control
COPYRIGHT © 2014 Bently Nevada, Inc & GE Energy (New Zealand) Ltd.
All rights reserved
No part of this document may be reproduced, stored in a retrieval
system, or transmitted in any form or by any means, electronic,
mechanical, photocopy, recording or otherwise without the prior written
permission of Bently Nevada.
The information provided in this document is subject to change without
notice. Names and data used in examples are fictitious unless otherwise
noted. This document is distributed as is, without warranty of any kind,
either expressed or implied, respecting the contents of this document,
including but not limited to implied warranties for the document’s
quality, performance, merchantability, or fitness for any particular
purpose. Neither GE Energy (New Zealand) Ltd, nor its employees,
dealers, agents or distributors shall be liable to the user of this document
or any other person or entity with respect to any liability, loss or damage
caused or alleged to be caused directly or indirectly by this document.
Trademarks
The following are trademarks of Bently Nevada, Inc, a wholly owned
subsidiary of General Electric Company:
• Registered trademarks — Ascent, Bently Nevada, Commtest,
Keyphasor, vbOnline, vbSeries
• Trademarks — Ranger, System 1
Other trademarks and registered trademarks are the property of their
respective owners.
Printed in New Zealand. Uncontrolled when transmitted electronically.
Page 3

GE
Measurement & Control
Additional Information
This manual does not contain all the information required to operate
and maintain the product. Refer to the Ascent Reference Guide for the
required information (available from Help menu in Ascent).
Product Disposal Statement
Customers and third parties, who are not member states of the
European Union, who are in control of the product at the end of its life or
at the end of its use, are solely responsible for the proper disposal of the
product. No person, firm, corporation, association or agency that is in
control of product shall dispose of it in a manner that is in violation of
any applicable federal, state, local or international law. GE Energy (New
Zealand) Ltd is not responsible for the disposal of the product at the end
of its life or at the end of its use.
Page 4

Section 1 — Introduction
i
Contents
SECTION 1 — INTRODUCTION ....................................................................... 1
FLEX FEATURES ...........................................................................................................................2
PRECAUTIONS..............................................................................................................................4
HAZARDOUS LOCATIONS ..........................................................................................................6
CSA Certification — vbSeries Instruments ..........................................................6
IECEx / ATEX Certification — SCOUT Instruments ...........................................8
INSTRUMENT CONNECTIONS ................................................................................................. 11
FRONT PANEL BUTTONS ........................................................................................................ 12
LED INDICATORS ..................................................................................................................... 13
CHARGE BATTERY PACK ......................................................................................................... 14
BATTERY FEATURES ................................................................................................................. 15
REMOVE BATTERY PACK ......................................................................................................... 16
CABLE TEST .............................................................................................................................. 17
OPERATING OVERVIEW ........................................................................................................... 18
Onsite Analysis .............................................................................................................. 19
Recording Routes ......................................................................................................... 20
Balancing ......................................................................................................................... 21
Keypad Entry .................................................................................................................. 22
SECTION 2 — INSTRUMENT FUNDAMENTALS ........................................... 23
SWITCH INSTRUMENT ON OR OFF ....................................................................................... 23
USE MAIN MENU ..................................................................................................................... 24
RETURN TO PREVIOUS MENU ................................................................................................ 24
USE NAVIGATION KEYS AND ICONS ..................................................................................... 24
SELECT MENU ITEMS............................................................................................................... 26
Select Option .................................................................................................................. 26
Jump To End of List ..................................................................................................... 26
Scroll through Multi-column List .......................................................................... 27
Cancel Option ................................................................................................................ 27
Display Hint Labels and Detailed Help .............................................................. 28
Display Alternative Options..................................................................................... 30
Enter Characters........................................................................................................... 31
Example — Rename Folder ..................................................................................... 32
ADDITIONAL ICONS ................................................................................................................. 34
SECTION 3 — SENSORS ................................................................................. 35
CONNECT SENSOR TO INSTRUMENT .................................................................................... 35
MOUNT SENSOR ...................................................................................................................... 35
Page 5

Section 1 — Introduction
ii
SET UP ACCELEROMETER........................................................................................................ 36
Permanent Mounting ................................................................................................. 37
SET UP TACHOMETER .............................................................................................................. 38
TACHOMETER SIGNAL FROM KEYPHASOR® ........................................................................ 40
Manual Keyphasor Threshold settings .............................................................. 42
USE STROBE LIGHT ................................................................................................................. 45
SECTION 4 — MEASUREMENT TYPES AND THEIR USES ........................... 46
SPECTRUM ................................................................................................................................ 46
Strobe Output................................................................................................................. 48
Read Speed of Connected Strobe ........................................................................ 50
WAVEFORM .............................................................................................................................. 51
DEMODULATION ...................................................................................................................... 52
Analyze Demodulation Data .................................................................................. 54
DEMOD SPECTRUM ................................................................................................................. 55
6PACK ....................................................................................................................................... 55
Streamlined Parameter Settings .......................................................................... 56
6Pack Demodulation Processing ......................................................................... 57
TACHOMETER DISPLAY ........................................................................................................... 58
TIME SYNCHRONOUS AVERAGING ........................................................................................ 59
BUMP TEST ............................................................................................................................... 60
COAST-DOWN/RUN-UP ......................................................................................................... 61
Tips for Coast-down/Run-up recordings.......................................................... 61
Deactivate Saving Waveform Data for Coast-down/Run-up
Measurement ................................................................................................................. 62
Take Coast-down/run-up Measurement.......................................................... 63
CROSS CHANNEL PHASE ........................................................................................................ 64
Recommendations for Cross Channel Phase................................................. 65
Fault Types and their Phase Relationships ..................................................... 66
Measuring Cross Channel Phase.......................................................................... 69
Setup .................................................................................................................................. 69
Measure Cross Channel Phase .............................................................................. 70
1 — Plan Cross Channel Spectrum (ODS) Recording Routine ................ 71
2 — Setup ......................................................................................................................... 72
3 — Take Cross Channel Spectrum (ODS) Recording ................................. 75
4 — Review Data .......................................................................................................... 77
REVIEW DATA IN ODS SOFTWARE ....................................................................................... 78
LONG TIME WAVEFORMS ....................................................................................................... 80
Measure Long Time Waveforms........................................................................... 80
View Long Time Waveforms on Computer ..................................................... 82
ORBIT PLOT .............................................................................................................................. 83
Use Orbit Plot Measurement Mode ..................................................................... 86
Page 6

Section 1 — Introduction
iii
Take Orbit Plot Measurement on Route ............................................................ 88
MODAL IMPACT TESTING........................................................................................................ 89
1 — Plan Impact Test Routine ................................................................................ 90
2 — Setup ......................................................................................................................... 90
3 — Perform Trial Impact ......................................................................................... 93
Disable Warning Messages .................................................................................... 95
4 — Perform Actual Modal Impact Test ............................................................ 95
Specify Locations and Directions for Saved Impacts..................................... 97
5 — Review Data .......................................................................................................... 98
KEYPAD ENTRY ......................................................................................................................... 99
ORDER TRACKING................................................................................................................. 101
Take Order Tracked Measurement ................................................................... 102
AVERAGE VALUE MEASUREMENTS .................................................................................... 106
TAKE MULTI-CHANNEL SIMULTANEOUS MEASUREMENTS ............................................ 106
Set up Sensors and Channels ............................................................................. 107
Save Multi-channel Measurements ................................................................. 108
SECTION 5 — SET MEASUREMENT OPTIONS ........................................... 110
SET MEASUREMENT UNITS AND SPECTRUM SCALING ................................................... 110
SET MEASUREMENT PARAMETERS ..................................................................................... 112
CREATE YOUR OWN PARAMETER SETS.............................................................................. 114
ASSIGN SENSORS TO CHANNELS ....................................................................................... 115
SPECTRUM PARAMETERS ..................................................................................................... 116
Fmax ................................................................................................................................ 117
Spectral Lines .............................................................................................................. 118
Fmin ................................................................................................................................. 118
Tach Trigger ................................................................................................................. 118
Averaging ...................................................................................................................... 118
Number of Averages ............................................................................................... 119
Averaging Types ....................................................................................................... 119
Average Overlap....................................................................................................... 119
Windowing ................................................................................................................... 120
Choose Window Type ............................................................................................. 120
WAVEFORM PARAMETERS................................................................................................... 120
Equivalent Fmax ........................................................................................................ 121
Number of Samples ................................................................................................. 121
Duration ......................................................................................................................... 121
ADDITIONAL MEASUREMENT PARAMETERS ..................................................................... 121
SECTION 6 — TAKE RECORDINGS ............................................................. 122
WALKTHROUGH — TAKE RECORDINGS............................................................................ 122
TAKE INDIVIDUAL AND MULTIPLE RECORDINGS.............................................................. 123
Individual recording ................................................................................................. 123
Page 7

Section 1 — Introduction
iv
Multiple recording ..................................................................................................... 123
SAVE RECORDINGS ............................................................................................................... 124
REVIEW RECORDING ............................................................................................................ 125
Review Current Recording .................................................................................... 125
Review Stored Recording ...................................................................................... 126
DELETE RECORDING ............................................................................................................. 127
ATTACH NOTE ....................................................................................................................... 127
BASELINE RECORDINGS ....................................................................................................... 128
SECTION 7 — ANALYZING MEASUREMENTS ONSITE ............................. 129
TIPS FOR TAKING MEASUREMENTS ................................................................................... 130
WALKTHROUGH — TAKE MEASUREMENT ........................................................................ 131
CHANGE DEFAULT MEASUREMENT SETTINGS ................................................................. 133
CHARTS .................................................................................................................................. 134
ANALYZE MEASUREMENTS.................................................................................................. 135
Cursors ........................................................................................................................... 136
Show or Hide Harmonics ...................................................................................... 138
Zoom ............................................................................................................................... 139
VIEW MULTIPLE CHARTS ..................................................................................................... 140
Select Chart .................................................................................................................. 140
Display Single Chart................................................................................................. 140
CHANGE CHART VIEW ......................................................................................................... 141
Select Chart Layout .................................................................................................. 141
Change Multi-chart Layout Display ................................................................... 141
SET Y AXIS (AMPLITUDE) SCALE ......................................................................................... 142
Fixed Y Axis scale options ..................................................................................... 143
AMPLITUDE DISPLAY UNITS ................................................................................................ 144
vdB ................................................................................................................................... 145
adB ................................................................................................................................... 145
SET RPM ............................................................................................................................... 145
Enter RPM manually ................................................................................................ 145
Enter RPM using 1X peak ...................................................................................... 146
VIEW ORDERS ....................................................................................................................... 147
VIEW REVOLUTIONS ............................................................................................................. 148
SAVE MEASUREMENT ........................................................................................................... 148
Save to Existing Machine ...................................................................................... 149
Save to New Machine ............................................................................................. 150
CHANGE SCREEN CONTRAST WHILE IN MEASURE MODE ............................................ 151
SECTION 8 — SEND AND RECEIVE INFORMATION ................................. 152
TRANSFER RECORDINGS FROM INSTRUMENT TO ASCENT ............................................. 152
TRANSFER FOLDERS FROM ASCENT TO INSTRUMENT .................................................... 154
Page 8

Section 1 — Introduction
v
Resend Updated Folder ......................................................................................... 155
Retain Stored Recordings ...................................................................................... 155
Retain Baseline Recordings on Instrument ..................................................... 155
SYNCHRONIZE TIME ZONE ON INSTRUMENT AND COMPUTER ..................................... 156
EXPORT OR IMPORT DATA USING USB FLASH DRIVE .................................................... 157
Export Data using USB Flash Drive .................................................................. 158
Import Data using USB Flash Drive.................................................................. 159
REMOTE COMMS FUNCTIONALITY ...................................................................................... 159
Receive Data from Remote Comms Server .................................................. 160
Send Data from Instrument to Remote Comms Server ......................... 161
CONNECT TO WI-FI NETWORK .......................................................................................... 162
Set up wireless network ........................................................................................ 163
Connect instrument to wireless network ...................................................... 165
Specify preferred wireless connection ........................................................... 166
Using Wi-Fi with your smart phone ................................................................. 167
UFF EXPORT ......................................................................................................................... 168
SECTION 9 — WORKING WITH ROUTES ................................................... 169
WHAT IS A ROUTE? .............................................................................................................. 169
WALKTHROUGH — TAKE RECORDINGS USING ROUTE .................................................. 170
USE BAND ALARMS AND BASELINE OVERALLS ON ROUTE ........................................... 173
View Alarm Bands Configured in Ascent....................................................... 175
RECORD MULTIPLE CHANNELS ON ROUTE ...................................................................... 176
Axis Mode ...................................................................................................................... 177
Point Mode ................................................................................................................... 178
Complete Setup.......................................................................................................... 179
TRIAXIAL MEASUREMENTS .................................................................................................. 179
ENTER MACHINE SPEED ON ROUTE .................................................................................. 182
View Machine and Point Speed Details.......................................................... 184
SKIP ROUTE ENTRIES AND MACHINES .............................................................................. 184
LOCATE SKIPPED ROUTE ENTRIES ..................................................................................... 185
TRACK PROGRESS THROUGH ROUTE ................................................................................ 186
SAVE ROUTE RECORDING ................................................................................................... 187
Select Save mode for recording ......................................................................... 188
Select Recording to Review .................................................................................. 189
RETAKE RECORDING ............................................................................................................ 190
DELETE ROUTE RECORDING ............................................................................................... 191
TAKE OFF-ROUTE RECORDING .......................................................................................... 192
EDIT OR DELETE ROUTE....................................................................................................... 192
SECTION 10 — CREATE, EDIT, AND DELETE ITEMS ................................. 193
STORAGE CAPACITY AND RECORDING VOLUME.............................................................. 193
Page 9

Section 1 — Introduction
vi
ORGANIZE AND STORE RECORDINGS ................................................................................ 194
FOLDERS ................................................................................................................................ 196
Create Folder ............................................................................................................... 196
Change Selected Folder ......................................................................................... 196
Rename Folder ........................................................................................................... 196
Delete Folder ............................................................................................................... 197
Restore Deleted or Overwritten Folder ........................................................... 197
MACHINES ............................................................................................................................. 198
Create Machine Structure ..................................................................................... 199
Create Parameter Set.............................................................................................. 200
Change Sensor ........................................................................................................... 201
Add Structure to Existing Machine ................................................................... 201
Copy Machine Structure ........................................................................................ 202
Rename Machine Structure ................................................................................. 203
Delete Machine Structure...................................................................................... 204
SENSORS ................................................................................................................................ 205
Define or Edit Sensors ............................................................................................. 205
Bias Voltage Check ................................................................................................... 207
Set Default Sensor .................................................................................................... 208
Change Sensor Temporarily ................................................................................. 209
Change Default Sensor .......................................................................................... 209
Delete Sensor .............................................................................................................. 209
NOTES .................................................................................................................................... 209
Create Note .................................................................................................................. 210
Edit Note ........................................................................................................................ 210
Attach Note .................................................................................................................. 211
View Note ...................................................................................................................... 211
Detach Note ................................................................................................................. 211
Delete Note Permanently ...................................................................................... 212
DELETE ALL RECORDINGS IN FOLDER ............................................................................... 212
DELETE ALL STORED INFORMATION .................................................................................. 213
SECTION 11 — BALANCING ROTORS ........................................................ 214
METHODS FOR BALANCING ROTORS ................................................................................ 214
BALANCING PROCESS .......................................................................................................... 215
BALANCING TIPS ................................................................................................................... 216
TACHOMETER ........................................................................................................................ 216
SUGGESTED TRIAL WEIGHT MASS AND LOCATION ........................................................ 217
MANUALLY ENTER BALANCING DATA............................................................................... 217
SET UP BALANCING JOB...................................................................................................... 218
Balance Planes and Weight Positions ............................................................ 219
Balance Planes ......................................................................................................... 219
Page 10

Section 1 — Introduction
vii
Weight Position (Reference Mark) ....................................................................... 219
# Sensors....................................................................................................................... 221
Channel Position ...................................................................................................... 222
Averages ........................................................................................................................ 223
Machine Information ............................................................................................... 224
Rotor Weight, Diameter, and Speed .................................................................. 224
Reference Mark......................................................................................................... 225
Filter Bandwidth ........................................................................................................ 226
Weight Orientation ................................................................................................... 226
Tach Trigger ................................................................................................................. 227
Weight Lin Dist ........................................................................................................... 227
Store Units .................................................................................................................... 227
COMBINE AND SPLIT TRIM WEIGHTS ................................................................................ 227
Combine/Adjust Weights ...................................................................................... 228
Split Weight .................................................................................................................. 229
ADJUST WEIGHTS FOR NEW RADIUS LOCATION ............................................................ 231
REVIEW PREVIOUS BALANCING JOBS ............................................................................... 232
SECTION 12 — BALANCING WALKTHROUGH .......................................... 233
STEP 1 — SET UP NEW BALANCE JOB ............................................................................. 234
STEP 2 — TAKE INITIAL READING ...................................................................................... 235
STEP 3 — TAKE TRIAL READING ........................................................................................ 237
STEP 4 — BALANCE ROTOR................................................................................................ 240
STEP 5 — PERFORM TRIM BALANCING ............................................................................ 241
STEP 6 — VIEW OR SAVE BALANCING JOB ..................................................................... 242
Save balance job ....................................................................................................... 243
SECTION 13 — GENERAL SETUP OPTIONS ............................................... 244
SET DATE AND TIME ............................................................................................................. 244
Adjust Date or Time Format................................................................................. 245
SELECT LOCAL TIME ZONE .................................................................................................. 245
DAYLIGHT SAVING AUTOMATIC ADJUSTMENT ................................................................ 246
ADJUST SOUND VOLUME.................................................................................................... 247
SET INSTRUMENT LANGUAGE ............................................................................................. 247
ADJUST SCREEN CONTRAST ............................................................................................... 247
SWITCH BACKLIGHT ON/OFF ............................................................................................ 248
ESTIMATE REMAINING OPERATING TIME .......................................................................... 248
CONSERVE BATTERY POWER .............................................................................................. 249
Set Backlight Timeout ............................................................................................. 249
Set Sleep Mode Timeout ........................................................................................ 250
Change Default Sleep Mode Timeout ................................................................ 250
Switch Instrument On ............................................................................................. 250
Set Complete Powerdown Timeout ................................................................. 251
Page 11

Section 1 — Introduction
viii
MANAGE INSTRUMENT MEMORY ....................................................................................... 251
Check Available Memory ....................................................................................... 252
Instrument Memory Warnings ........................................................................... 252
80% Memory Capacity Warning ....................................................................... 253
95% Memory Capacity Warning ......................................................................... 254
100% Memory Capacity Warning ...................................................................... 254
Free up Instrument Memory ................................................................................ 255
Reformat Memory Card ......................................................................................... 256
Empty Recycle Bin .................................................................................................... 257
Overwrite Primary Database with Mirror Backup .................................... 258
DISPLAY SYSTEM INFORMATION ........................................................................................ 259
UNLOCKABLE FEATURES ..................................................................................................... 260
UPGRADE INSTRUMENT FIRMWARE — PROFLASH ......................................................... 261
PROFLASH PROCEDURE ....................................................................................................... 262
SECTION 14 – TROUBLESHOOTING .......................................................... 263
RESET INSTRUMENT ............................................................................................................. 263
TROUBLESHOOT NETWORK COMMUNICATIONS ............................................................. 264
Set Ethernet Network Address ........................................................................... 265
Reset Network Values to Factory Default ........................................................ 265
ETHERNET CONNECTION LOST IN WINDOWS VISTA ...................................................... 266
INDEX ............................................................................................................. 267
Page 12

Section 1 — Introduction
1
Section 1 — Introduction
You can use this Reference Guide in conjunction with the Ascent
Reference Guide. Please read this guide before operating your Bently
Nevada SCOUT or Commtest vbSeries Portable Vibration Analyzer and
keep it for future reference. This guide applies to the following
instrument models:
• SCOUT100-Ex
• SCOUT140-Ex
• vb5
• vb6
• vb7
• vb8
Although this guide makes use of common vibration analysis and
balancing concepts, it is not intended as a comprehensive guide or
training manual. Please ensure you have the relevant knowledge and
experience to carry out the procedures described. It is essential to follow
all appropriate safety precautions when working near rotating
machinery.
Page 13
Section 1 — Introduction
2
Flex Features
Some of the features available with the 2013 release are included by
default for some new models, and available for purchase with other
older models. When you purchase an additional Flex feature, you will
receive a license for it which you can activate via Ascent.
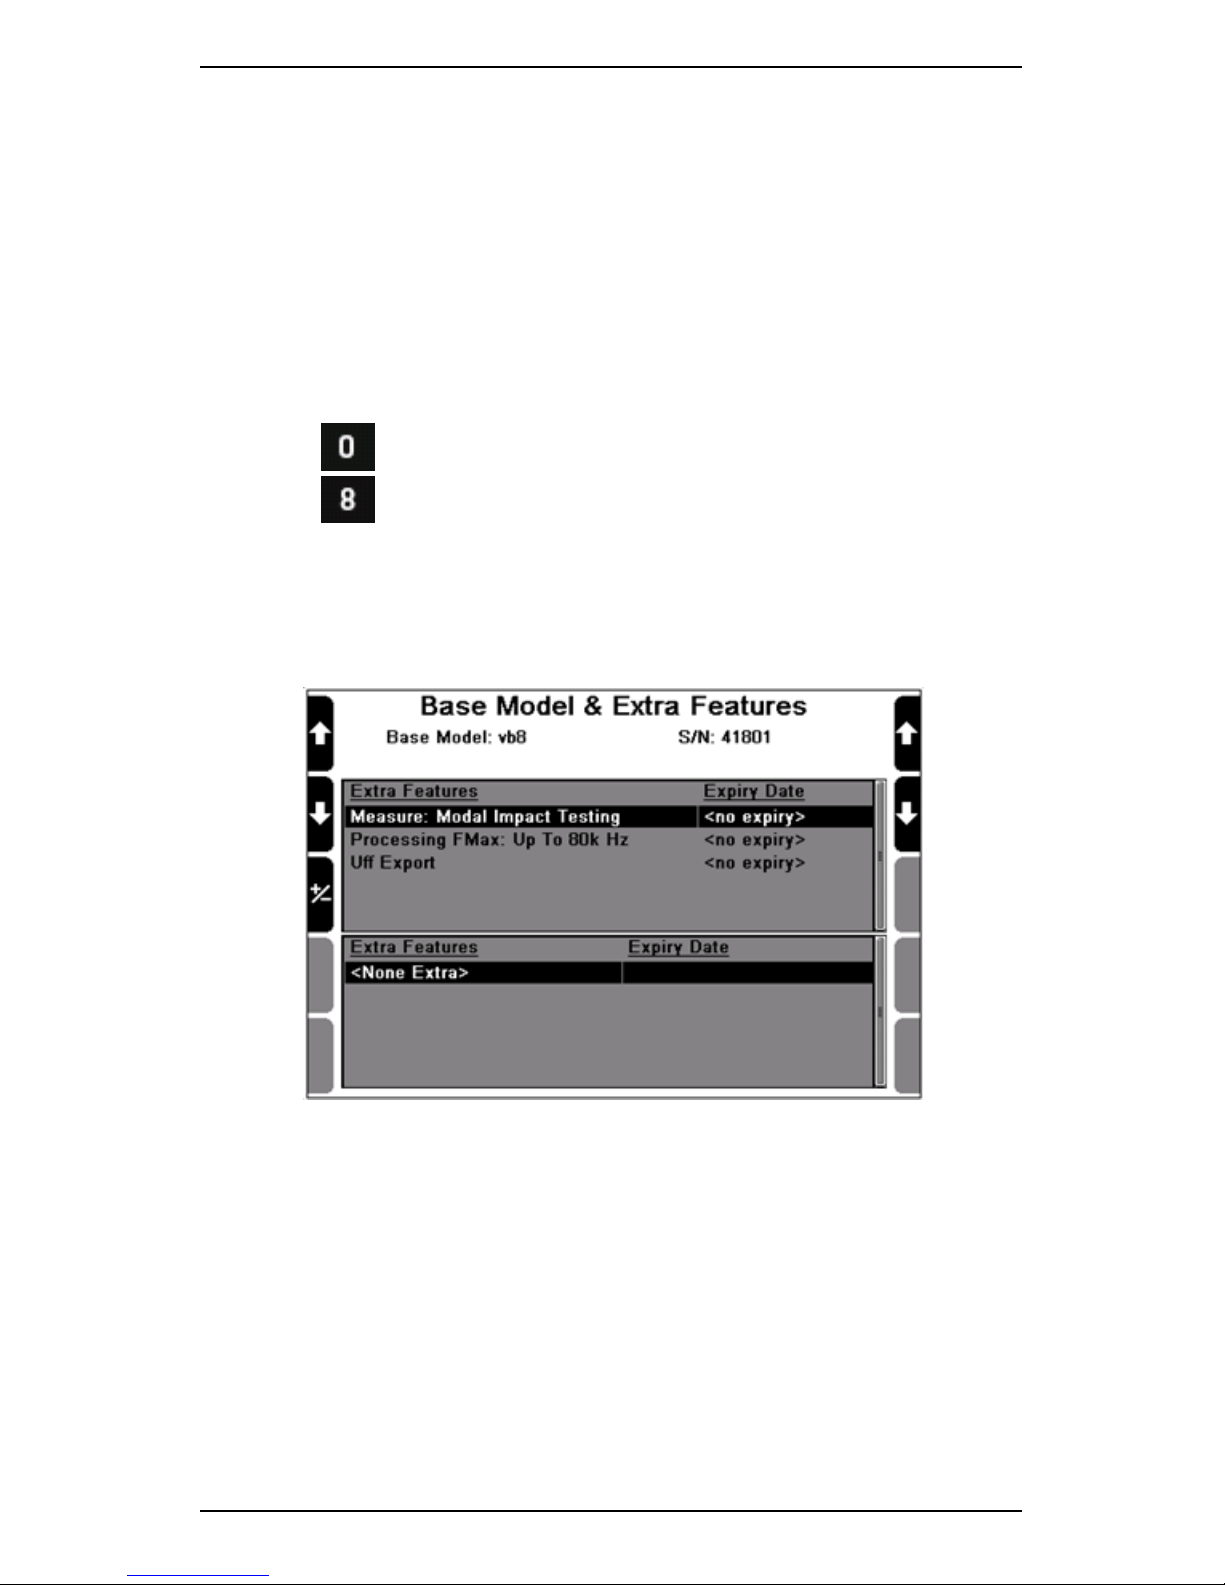
If you purchase a Flex feature, you can easily review the licensing status
of these at any time. To do this:
1. Press Options.
2. Press Model + Features.
MORE: Contact your local sales representative to arrange a license
for a feature you wish to add.
MORE: Refer to your Ascent Reference Guide to learn how to apply
our license in Ascent.
Checking the licensing details for any additional features
Page 14
Section 1 — Introduction
3
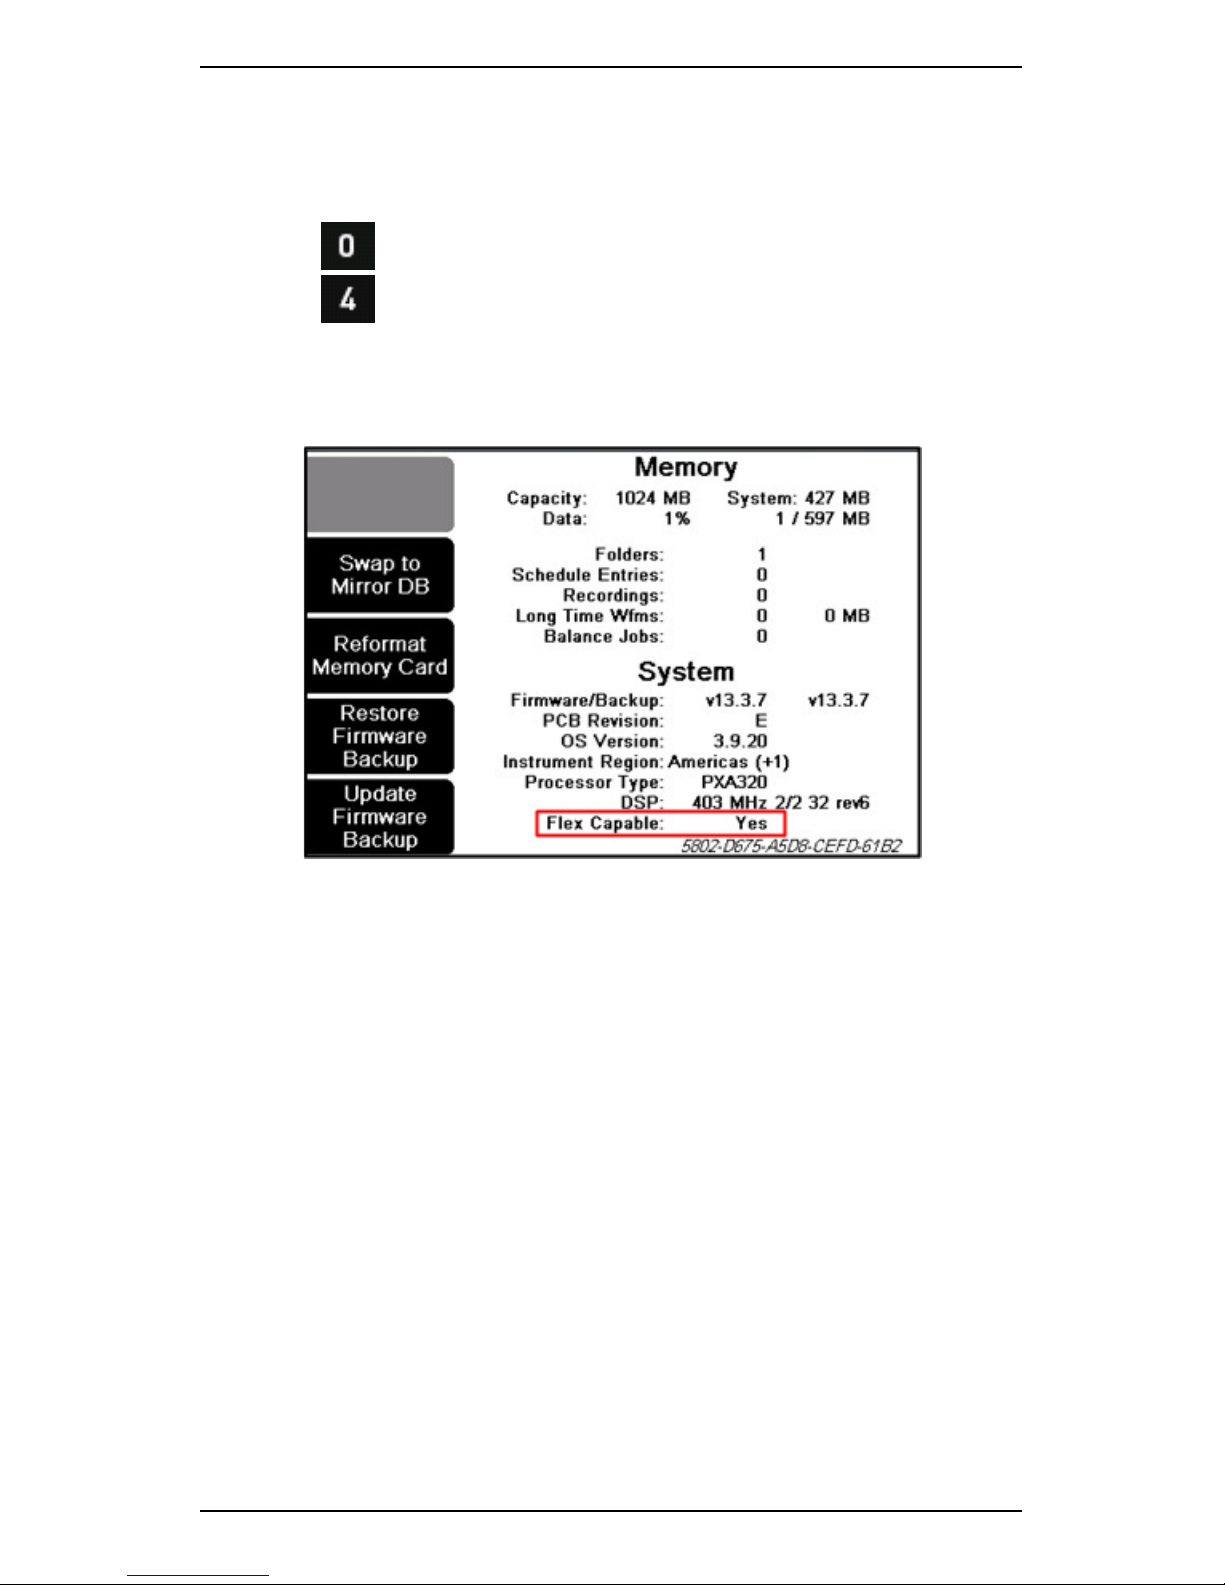
Some older instruments are not automatically compatible with Flex
features. To check whether your instrument is currently configured to
support the addition of Flex features:
1. Press Options.
2. Press Memory & System — The Flex Capable listing at the
bottom of the screen indicates either Yes or No.
MORE: Contact Commtest Support if your instrument is currently
not set up to support Flex features.
Determining whether your instrument is currently set up to
support the addition of Flex features
Page 15
Section 1 — Introduction
4
Precautions
Ensure you read and understand this section before operating your
instrument. Pay attention to all warnings and recommendations to
prevent data loss, data inaccuracy, damage to the instrument, or injury
to you.
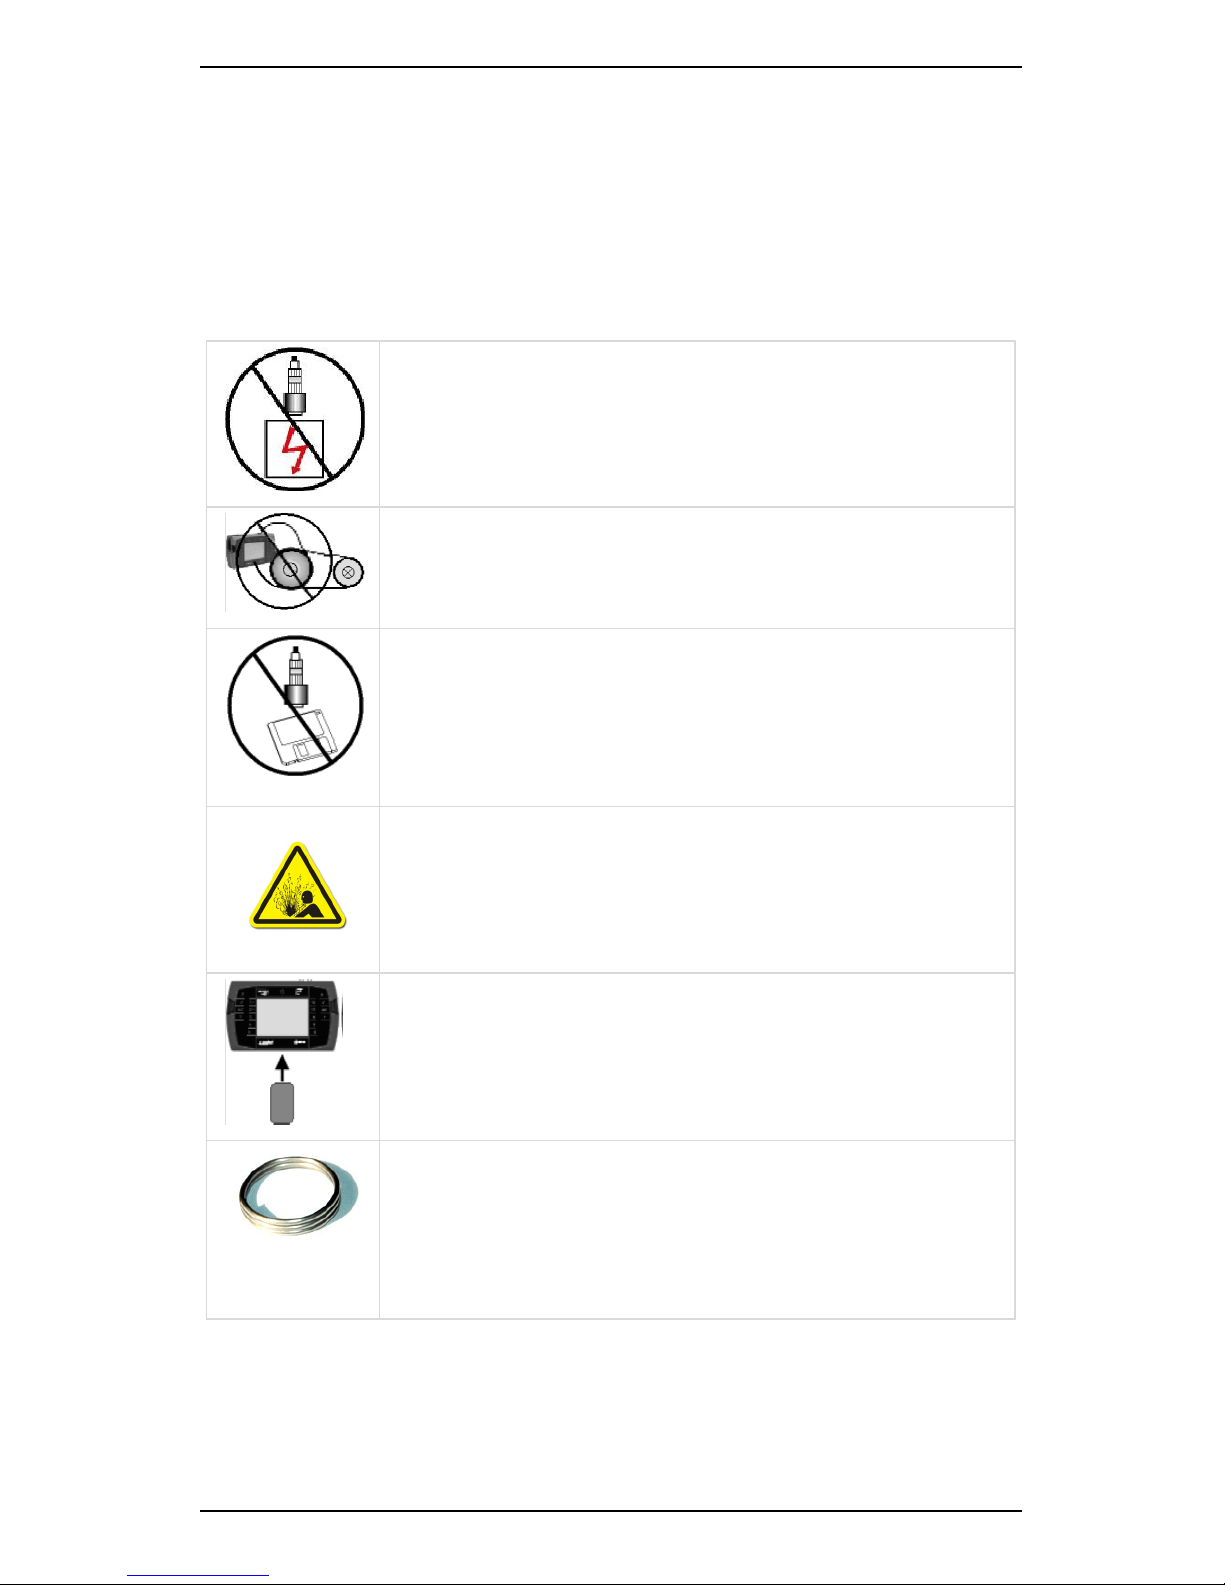
Do NOT attach sensors to any object with a high
potential voltage — I.e. a voltage that exceeds 50 V DC
or 32 V AC or the Safety Extra Low Voltage (SELV)
defined by your local power authority.
Ensure the cables and neck strap cannot become
entangled with any rotating or moving machinery.
Do NOT bring any objects that are sensitive to
magnetic fields near the magnetic mounting bases
(e.g. cardiac pacemakers, credit cards, floppy disks,
video tapes, audio cassette tapes, or mechanical
watches).
Explosion Hazard — When working in a hazardous
area with risk of flammable gases, all precautions and
limitations explained in the following Hazardous
Locations section must be followed.
Do NOT detach the battery pack from the instrument
for more than 10 minutes. This will erase the
instrument's date and time (it will retain all recordings
and other information).
Neck straps must be connected to the instrument
using the 2.5 turn stainless steel rings provided. The
strap must NOT be connected directly to the unit. This
will defeat the 10 kg safety release provided by the
rings. Replacement rings are available.
Page 16
Section 1 — Introduction
5
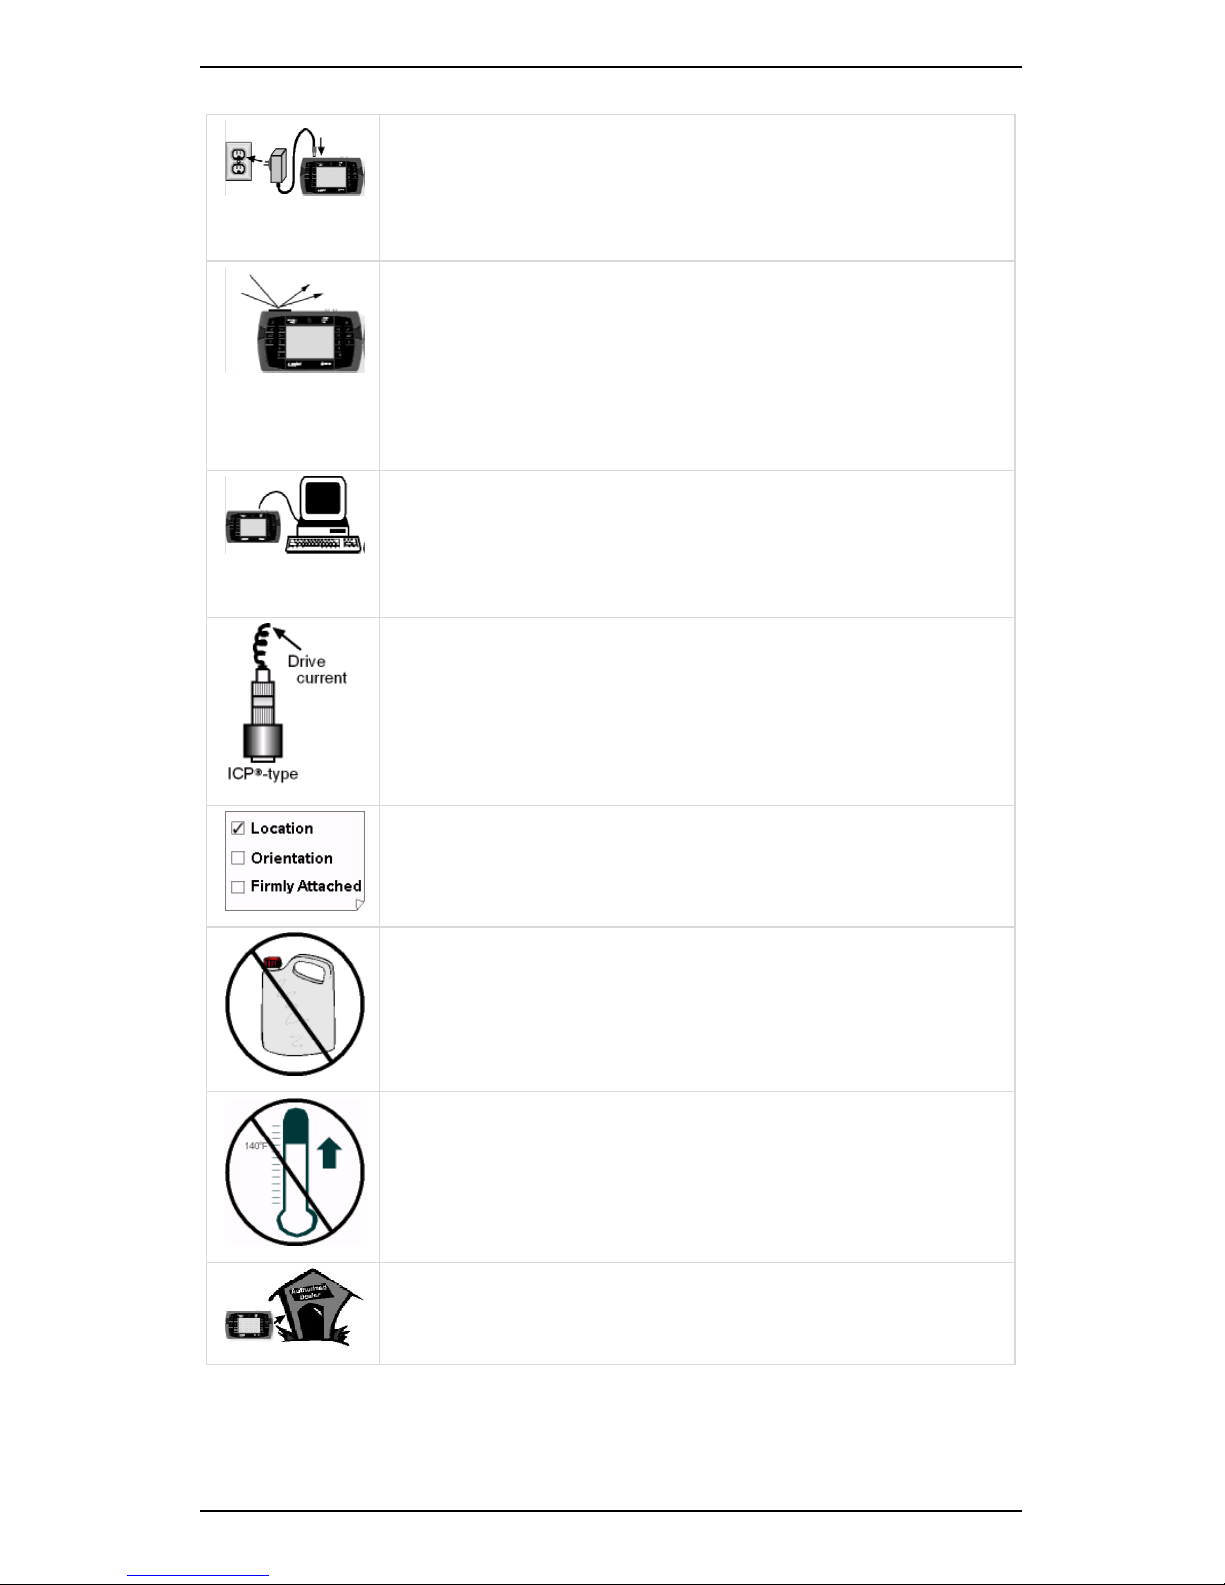
Only use an approved power adapter — 12 V 3 A
output, center positive. Do NOT use the plug-pack
transformers supplied with previous instrument
versions. Doing so will damage these transformers.
The cover over the comms and charger connectors
provides an essential seal. The cover must be in place
whenever you use the instrument in an industrial
environment. Failure to comply with this
requirement might void your warranty. IP65 rating
only applies while the cover is securely in place.
Transfer information stored in the instrument to a PC
before reprogramming (PROFLASHING) the instrument
with new firmware. PROFLASHING the instrument will
delete all stored information.
To obtain accurate measurements, ensure the drive
current is switched on when using an IEPE/ICP®-type
accelerometer.
Mount the sensor correctly before taking
measurements. This will ensure your readings are
accurate and consistent.
Use a mild detergent diluted with warm water to
clean your instrument. Do NOT use abrasive or
polishing substances, hydrocarbons, petrochemicals,
or solvents, as these will degrade the plastic casing.
Do NOT place the instrument or magnetic mounting
base where the temperature might exceed 140°F
(60°C). This will degrade the battery pack and magnet.
If your instrument malfunctions, return it to an
authorized dealer. Do NOT attempt to repair the
instrument yourself as this will void your warranty.
Page 17

Section 1 — Introduction
6
Hazardous Locations
SCOUT and vbSeries instruments are rated differently for hazardous
environments — SCOUT instruments hold an IECEx/ATEX rating, while
vbSeries instruments are CSA-certified.
CSA Certification — vbSeries Instruments
Your Portable Vibration Analyzer has been approved by the Canadian
Standards Association (CSA) for use in hazardous locations that meet the
following classifications — Class I; Division 2; Groups A, B, C, and D.
These instruments are clearly identified with the CSA logo and a
Hazardous Locations information panel. The Class I Division 2
classification is officially defined in the Canadian Electrical Code, part 1.
In summary, it is a location in which volatile flammable gases or vapors
are present but confined within closed systems from which they can
escape only in case of accidental rupture or abnormal operation; or in
which ignitable concentrations of gases are normally prevented by
positive pressure or mechanical ventilation, and which might become
hazardous through abnormal operation of the ventilation equipment.
The approval specifically covers use in the United States of America and
any other countries which recognize the CSA certification.
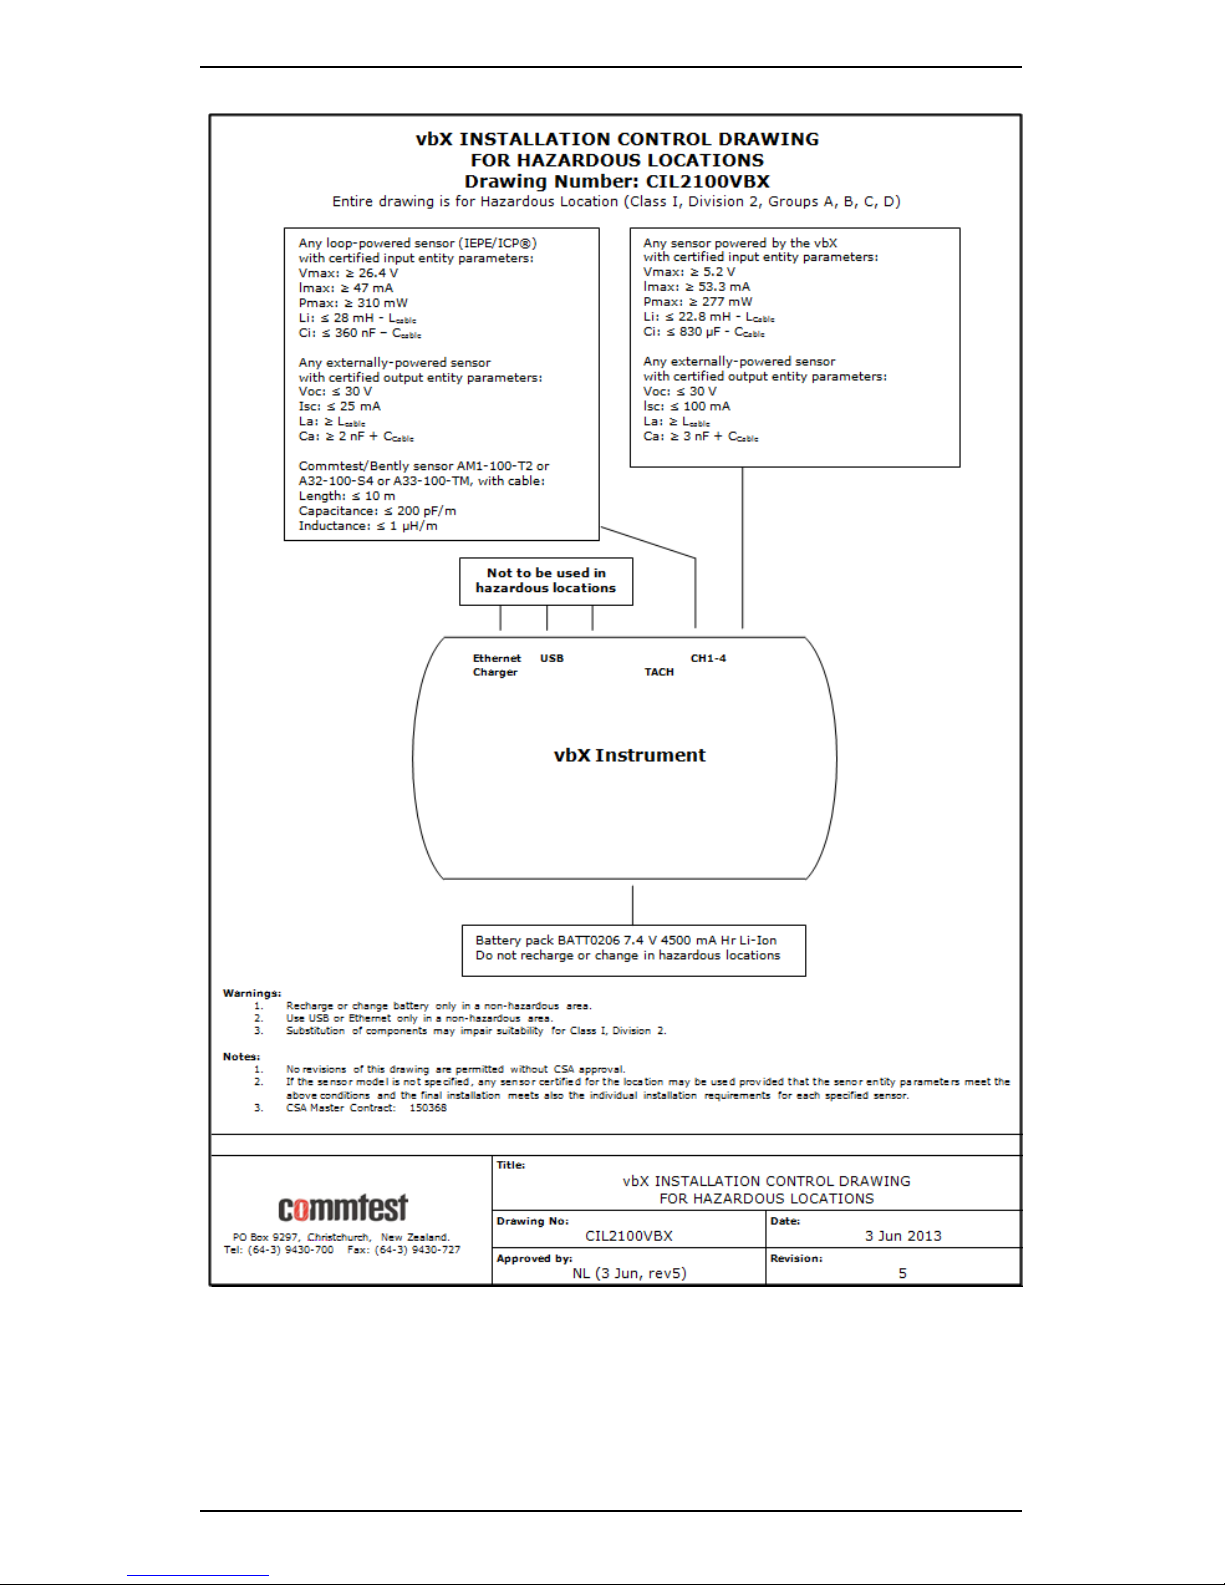
When using a certified instrument in a hazardous location, the
installation must comply with the Installation Control Drawing for
Hazardous Locations, including all its footnotes and warnings.
Your instrument will be supplied, complete with appropriate sensors for
use in Class I Division 2 environments. As indicated in the diagram, you
can use alternative sensors, provided these are certified for use in these
locations, and provided their entity parameters meet the limits shown in
the drawing.
Page 18
Section 1 — Introduction
7
Installation Control Drawing for Hazardous Locations
Page 19
Section 1 — Introduction
8
IECEx / ATEX Certification — SCOUT Instruments
SCOUT100-Ex and SCOUT140-Ex portable vibration analyzers are IECEx /
ATEX certified — Identified by the logo on the rear instrument
label.
If you need to use your instrument in hazardous areas, please ensure it
is the appropriate variant for your country. Refer to the following pages
for the hazardous area usage instructions.
The logo on the rear label indicates your instrument has been
approved for use in hazardous locations with the following classification:
II 3 G Ex ic IIB T4 Gc
• Group II = non-mining
• Category 3 = Zone 2
• Atmosphere G = Gas
• Protection method ic = intrinsic safety for zone 2
• Explosion Group IIB = gases such as Ethylene
• Temperature Class T4 = surface will not exceed 135°C
• Protection level c = Zone 2
The approval covers use in Europe (under ATEX) and any other countries
that recognize the IECEx certification.
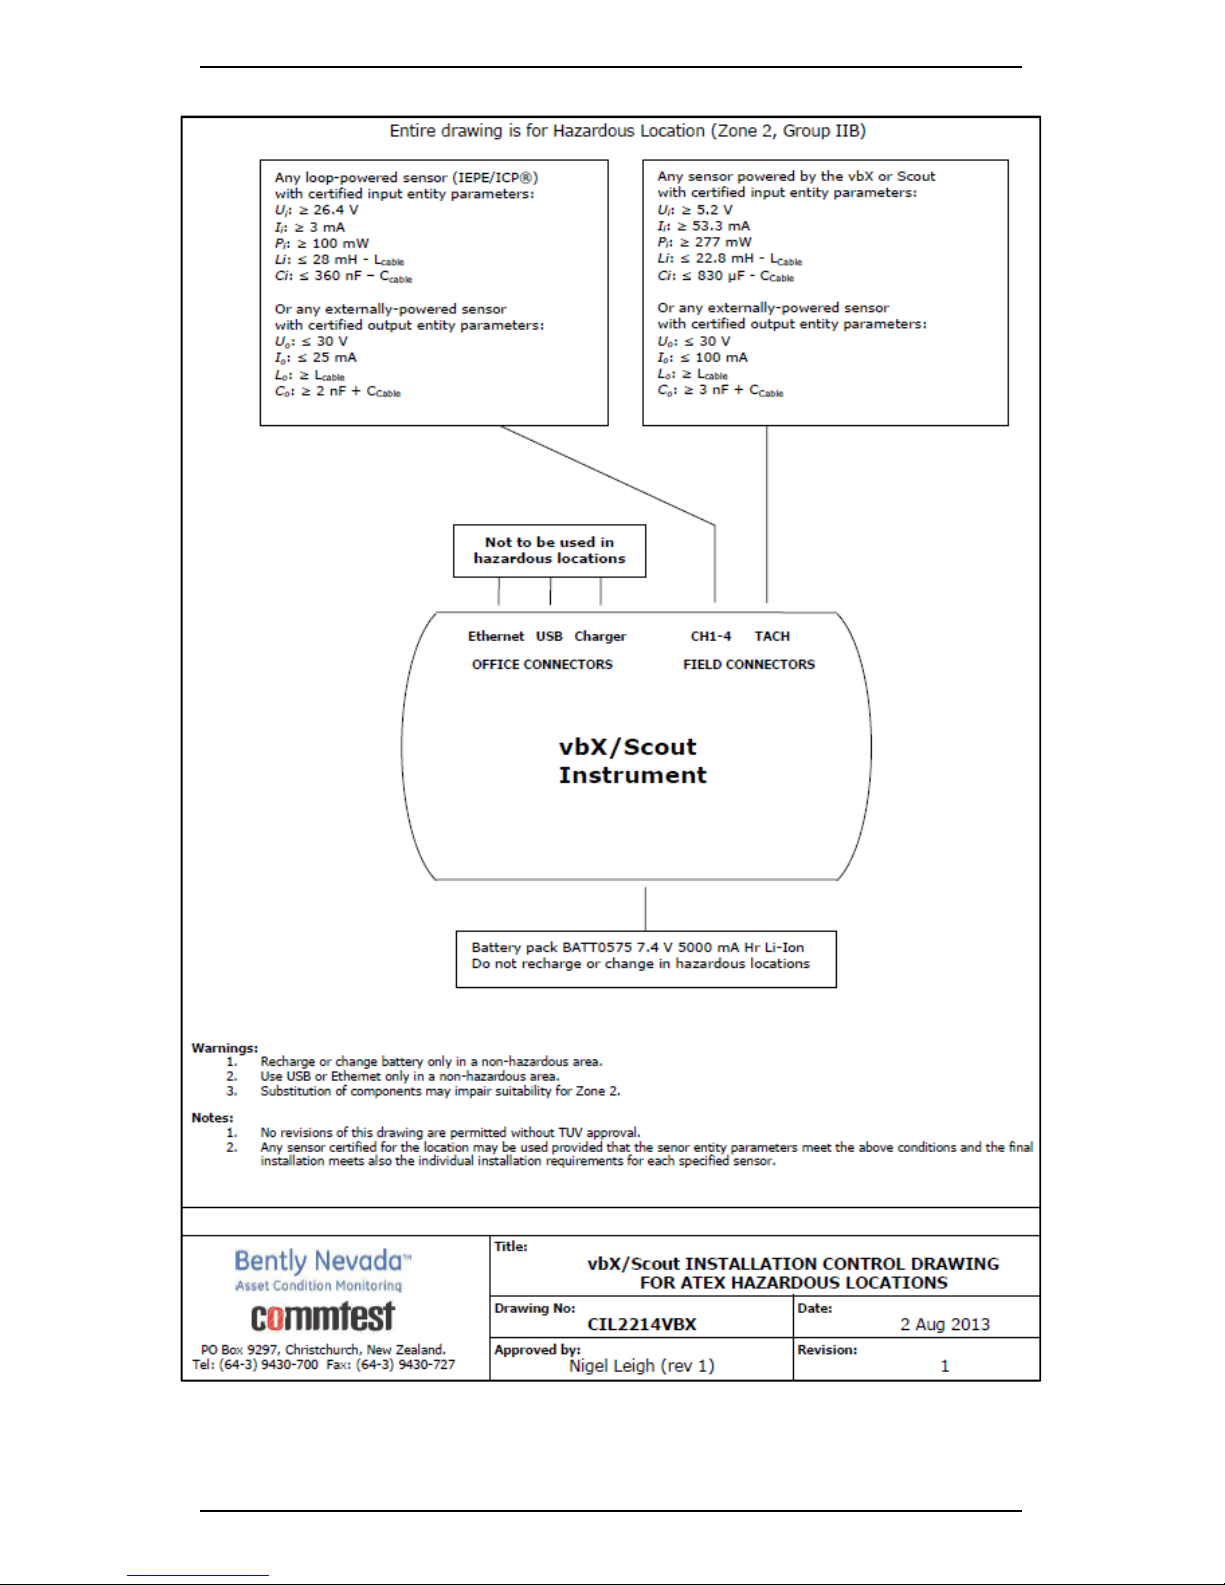
When using a certified instrument in a hazardous location, the
installation must comply with the following Installation Control Drawing
for ATEX Hazardous Locations GE2214VBX , including all its footnotes
and warnings.
Your instrument will be supplied, complete with appropriate sensors for
use in Zone 2 environments. As indicated in the following drawing, you
can use alternative sensors, provided these are certified for use in these
locations, and provided their entity parameters meet the limits shown in
the drawing.
Page 20
Section 1 — Introduction
9
Installation Control Drawing GE2214VBX for ATEX Hazardous Locations
Page 21
Section 1 — Introduction
10
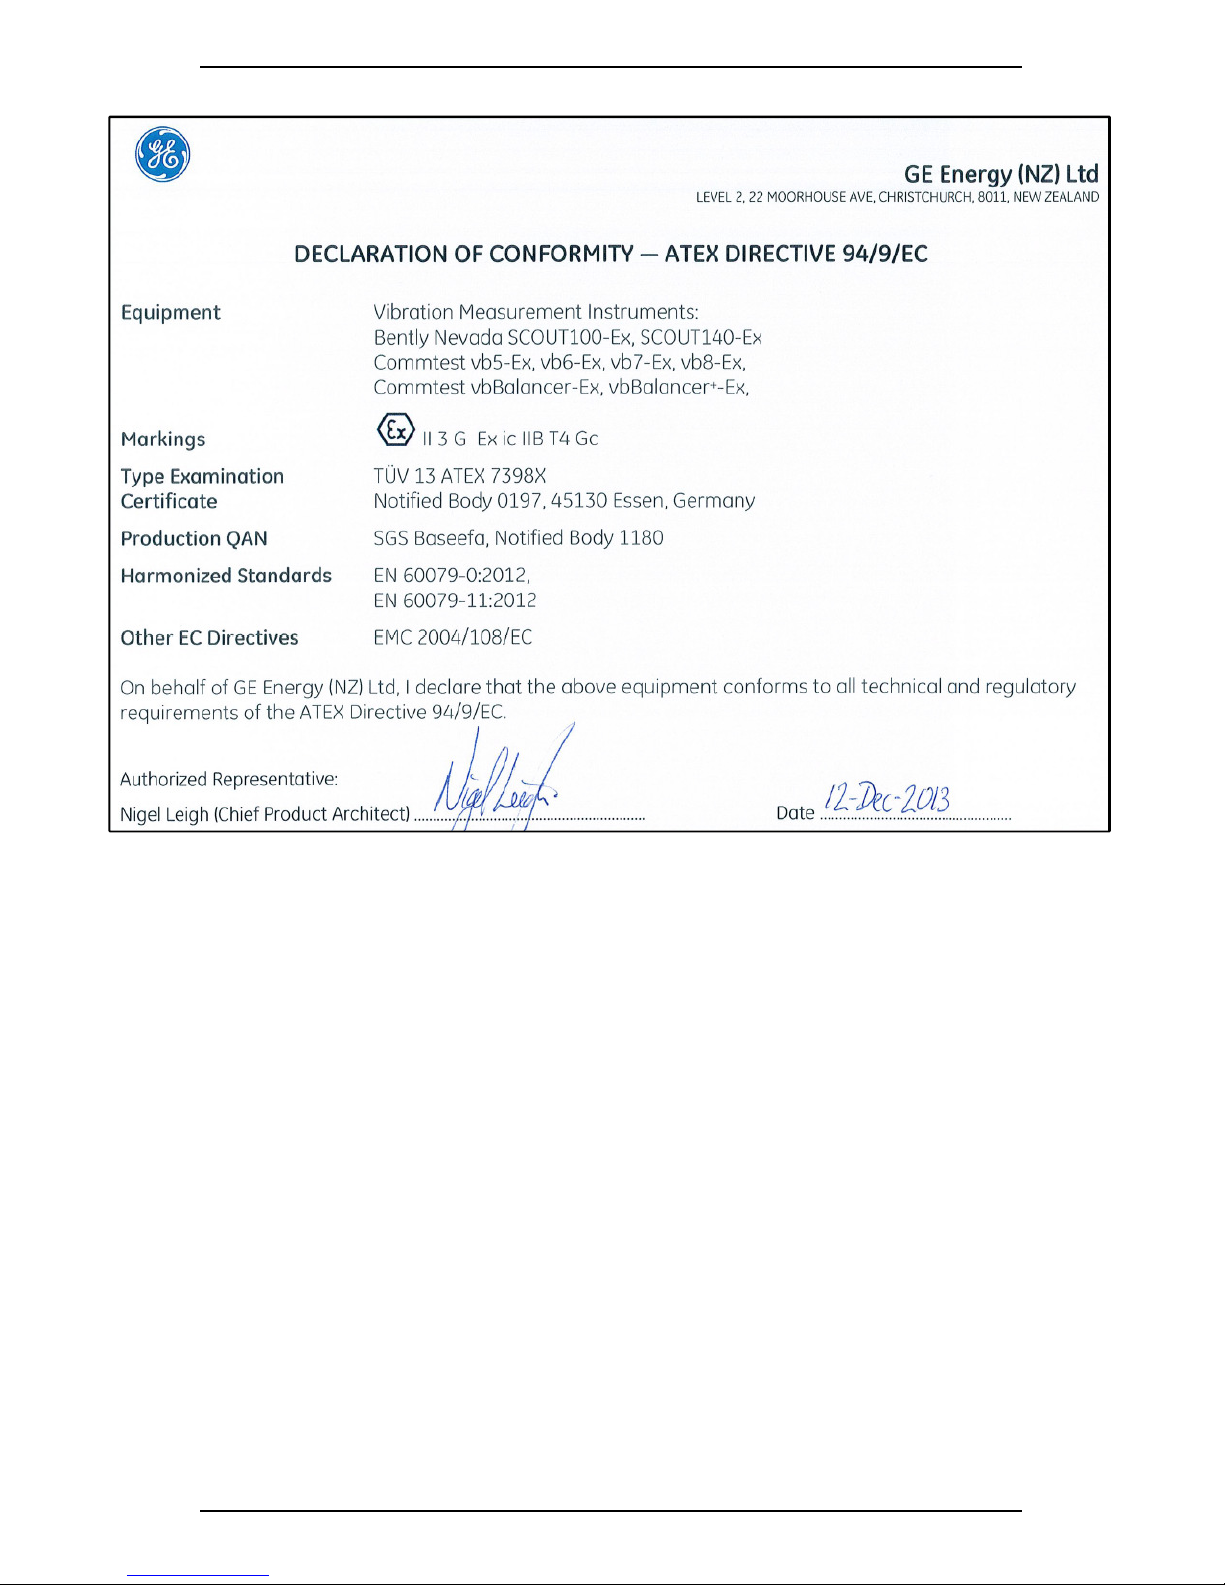
IECEx / ATEX Declaration of Conformity
Page 22
Section 1 — Introduction
11
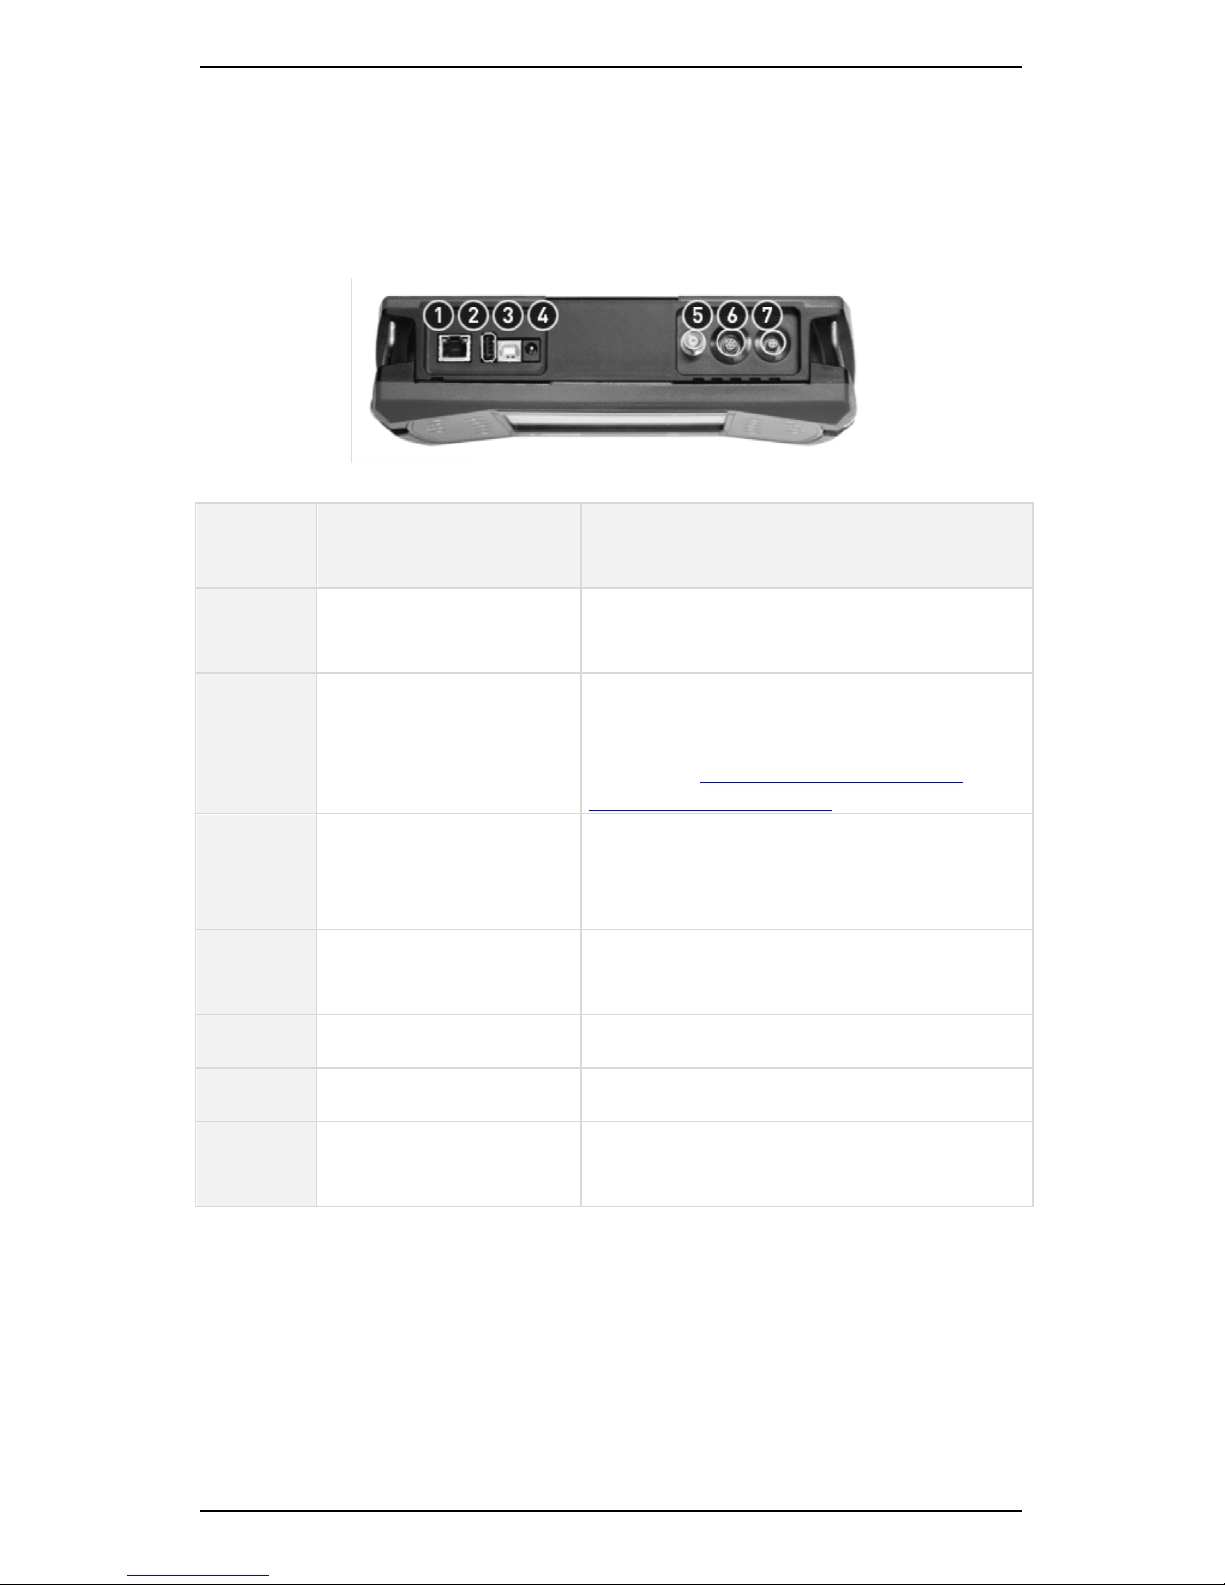
Instrument Connections
The top panel of the instrument is equipped with the following
connectors:
Top panel
Label
number
Feature Description
1 Ethernet port Connects to a standard 8P8C (RJ45)
male plug terminator
2 USB host port Connects to an external USB memory
device for data import and export
MORE: See Export/Import Data via an
External USB Flash Drive.
3 USB socket Provides a data connection between
the instrument and an Ascent
software host computer
4 Charger power socket
(12 Volt 3 Amp input)
Enables you to power the instrument
and charge the its battery pack
5 BNC sensor input Channel 1
6 BNC sensor input Channel 2
7 LEMO four-pin
tachometer input
IMPORTANT! Ensure the protective rubber cover is securely
fastened over the instrument communication ports while you
collect data in the field. Failure to do this may void your warranty.
The IP65 rating only applies while the rubber cover is securely
fastened.
Page 23
Section 1 — Introduction
12
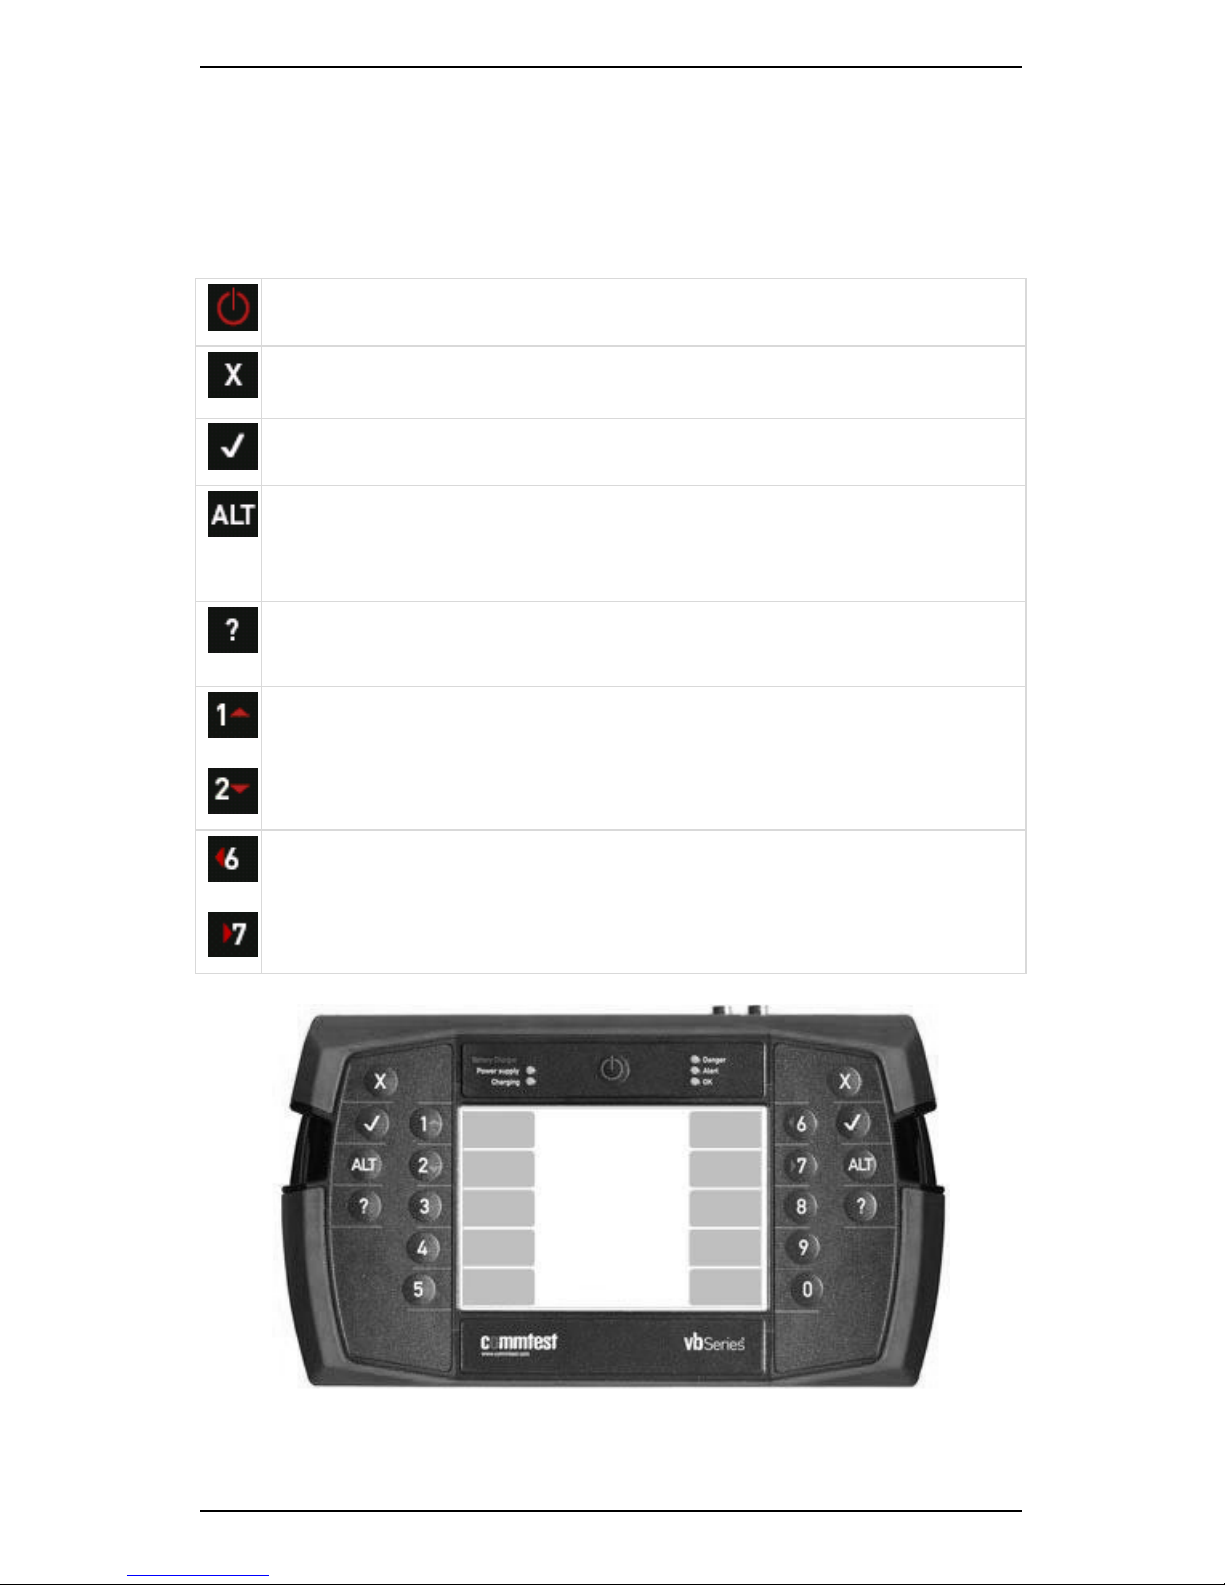
Front Panel Buttons
The table outlines the functions of the buttons on the front panel of your
instrument.
Switch the instrument On/Off.
Cancel/Go Back — A long press takes you back to the main menu.
Accept/Go Forward to the next menu.
Activate alternate functions for each key — In some menus, keys
can perform several functions. To see the available options, press
ALT and toggle the key functions.
Help key — Access easy-to-see hint labels. A long press displays
detailed contextual help text.
Navigate up/down through a list — Press and hold to move more
rapidly through a list.
Navigate left/right — Expands and collapse a level in the navigator
and directs movement between split-screen menus (e.g. Record
Review menu).
Buttons on front panel of your instrument
Page 24

Section 1 — Introduction
13
LED Indicators
There are five LED indicators on the front panel of your instrument.
These indicate the instrument's current state and warn you of any
measurement problems.
Instrument LEDs
Power
supply
(GREEN)
Illuminates when power is supplied to the instrument from
the power adapter.
Charging
(RED)
Indicates the instrument battery is charging.
Danger
(RED)
Illuminates when:
• A DSP or critical error occurs.
• A measurement is less than 25% or greater than
200% of the preset baseline value.
MORE: See Baseline Recordings.
• The sensor bias voltage is outside the specified
range.
Alert
(AMBER)
Illuminates when a measurement is less than 50% or
greater than 150% of the preset baseline value.
OK (GREEN)
Indicates that a measurement is being, or has been,
collected successfully. No error or alert has been triggered.
Page 25

Section 1 — Introduction
14
Charge Battery Pack
To charge your battery pack:
1. Ensure the power adapter you are using is suitable (i.e. 12 Volt, 3
Amp output, center positive).
NOTE: The power adapter supplied with your instrument has the
correct DC voltage.
2. Connect the AC power adapter included with your instrument to a
powered outlet (100-240 Volt, 50/60 Hz).
NOTE: You can also use the optional car adapter charging lead to
charge the battery pack in a vehicle with a 12 V negative-chassis
power system.
3. Connect the adapter's DC output to your instrument's charger
power socket — The instrument's Power Supply and Charging LED
indicators illuminate to indicate that the instrument is charging.
NOTE: The battery will be fully charged in approximately 3 hours.
NOTE: Ensure you charge the fast-charge Lithium Ion battery pack
for at least 1 hour before or during its initial use.
Page 26

Section 1 — Introduction
15
Battery Features
Your instrument is powered by a rechargeable custom Lithium Ion
battery pack with a normal operating range of 6.5 - 8.4 V.
It is equipped with an internal backup energy source to protect your
data and settings in case the battery pack is momentarily removed from
the instrument. The backup remains charged by the battery pack,
provided the battery is functioning correctly. Your instrument includes a
number of features that help ensure the battery pack is always
sufficiently charged.
The table outlines the battery behavior in its different states.
Battery state Behavior
Below 7 Volts Instrument automatically switches off the back
light to prevent further power drainage. It
displays a flashing battery icon to indicate the
battery needs to be recharged.
At 6.5 Volts Instrument automatically powers down.
Charge of 25% or less Instrument enters Complete Powerdown mode
when powered off (rather than Sleep mode).
Page 27
Section 1 — Introduction
16
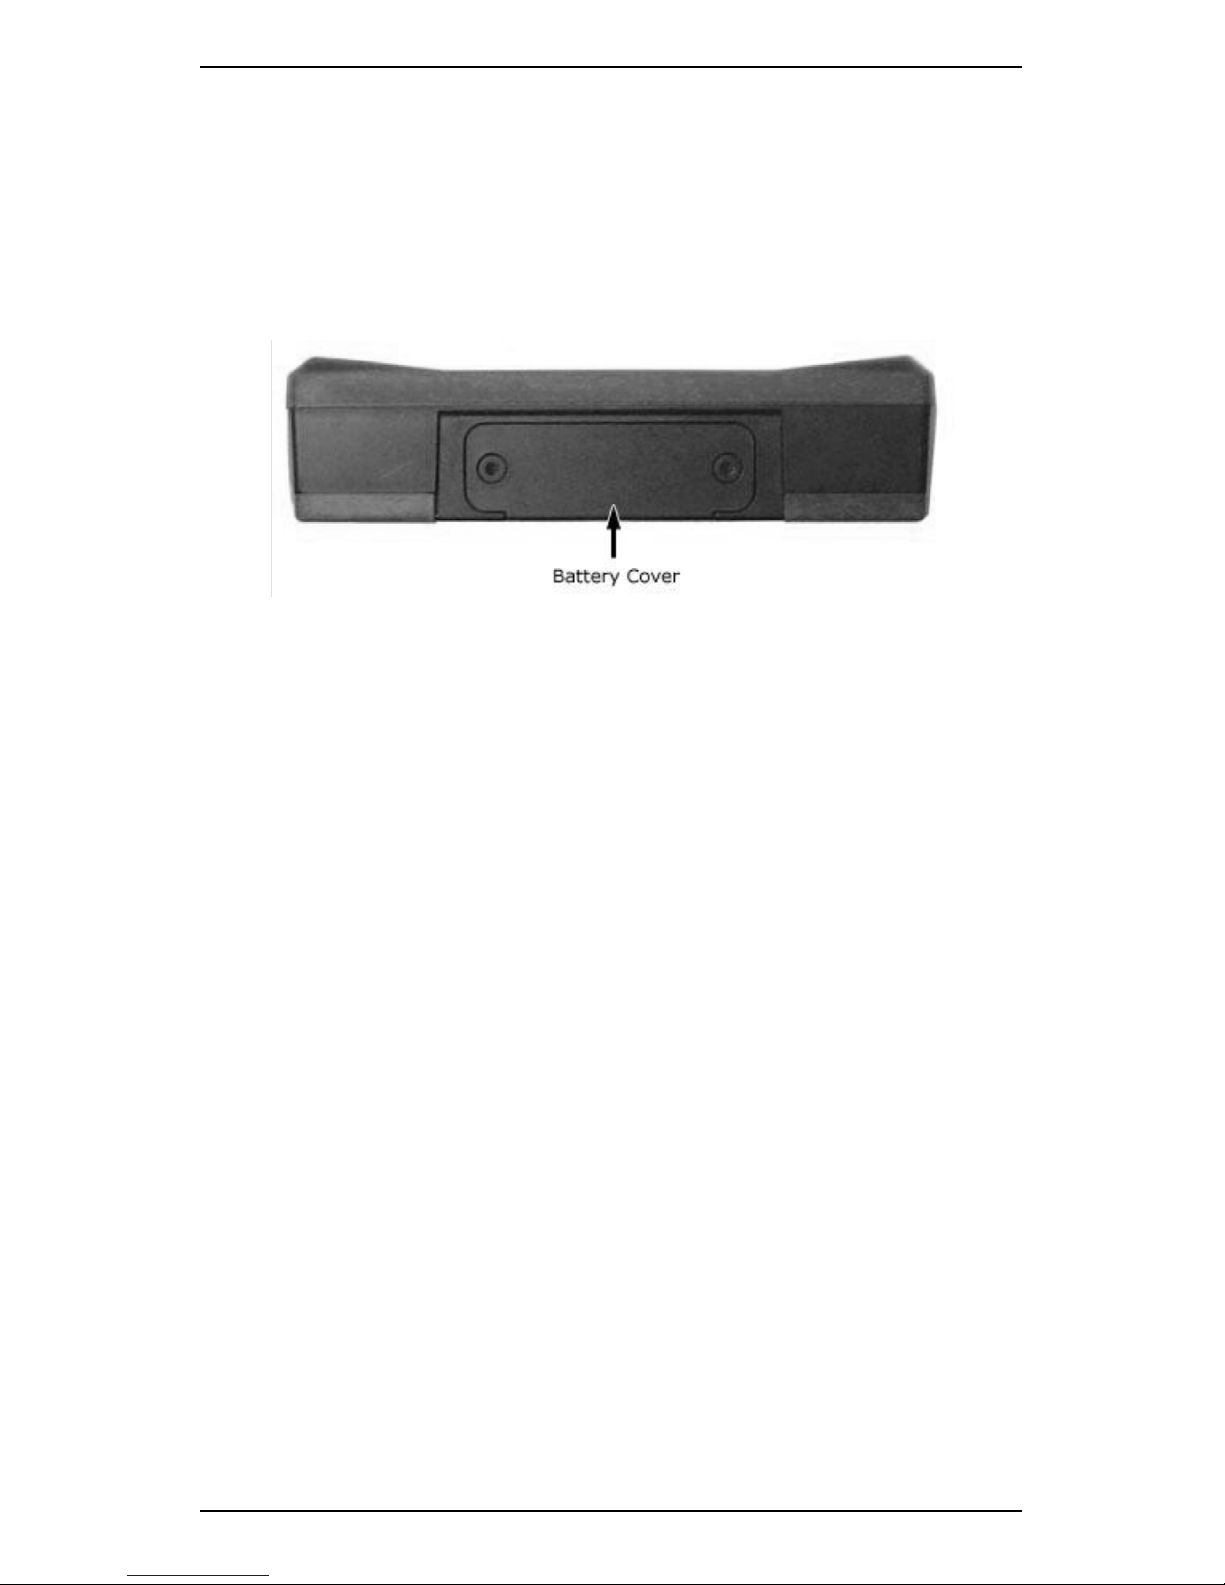
Remove Battery Pack
To remove the battery pack from your instrument:
1. Use a 2 x Phillips head to loosen the screws that attach the battery
cover to the bottom panel of the instrument.
2. Set the battery cover aside and extract the battery.
WARNING! Do NOT detach the battery pack from the instrument
for more than 10 minutes. This will cause the instrument date/time
to be reset. Stored measurement data or recordings will NOT be
lost.
WARNING! Ensure power is NOT supplied to the instrument when
you remove the battery. Unplug any connected power adapters
before removing the battery.
WARNING! You should NOT re-insert a damaged battery in your
instrument. Dispose of damaged batteries responsibly and in
accordance with local regulations. Do NOT disassemble the
battery or use fire to dispose of it. Replacement batteries are
available from authorized distributors (part number BATT0206).
Page 28
Section 1 — Introduction
17
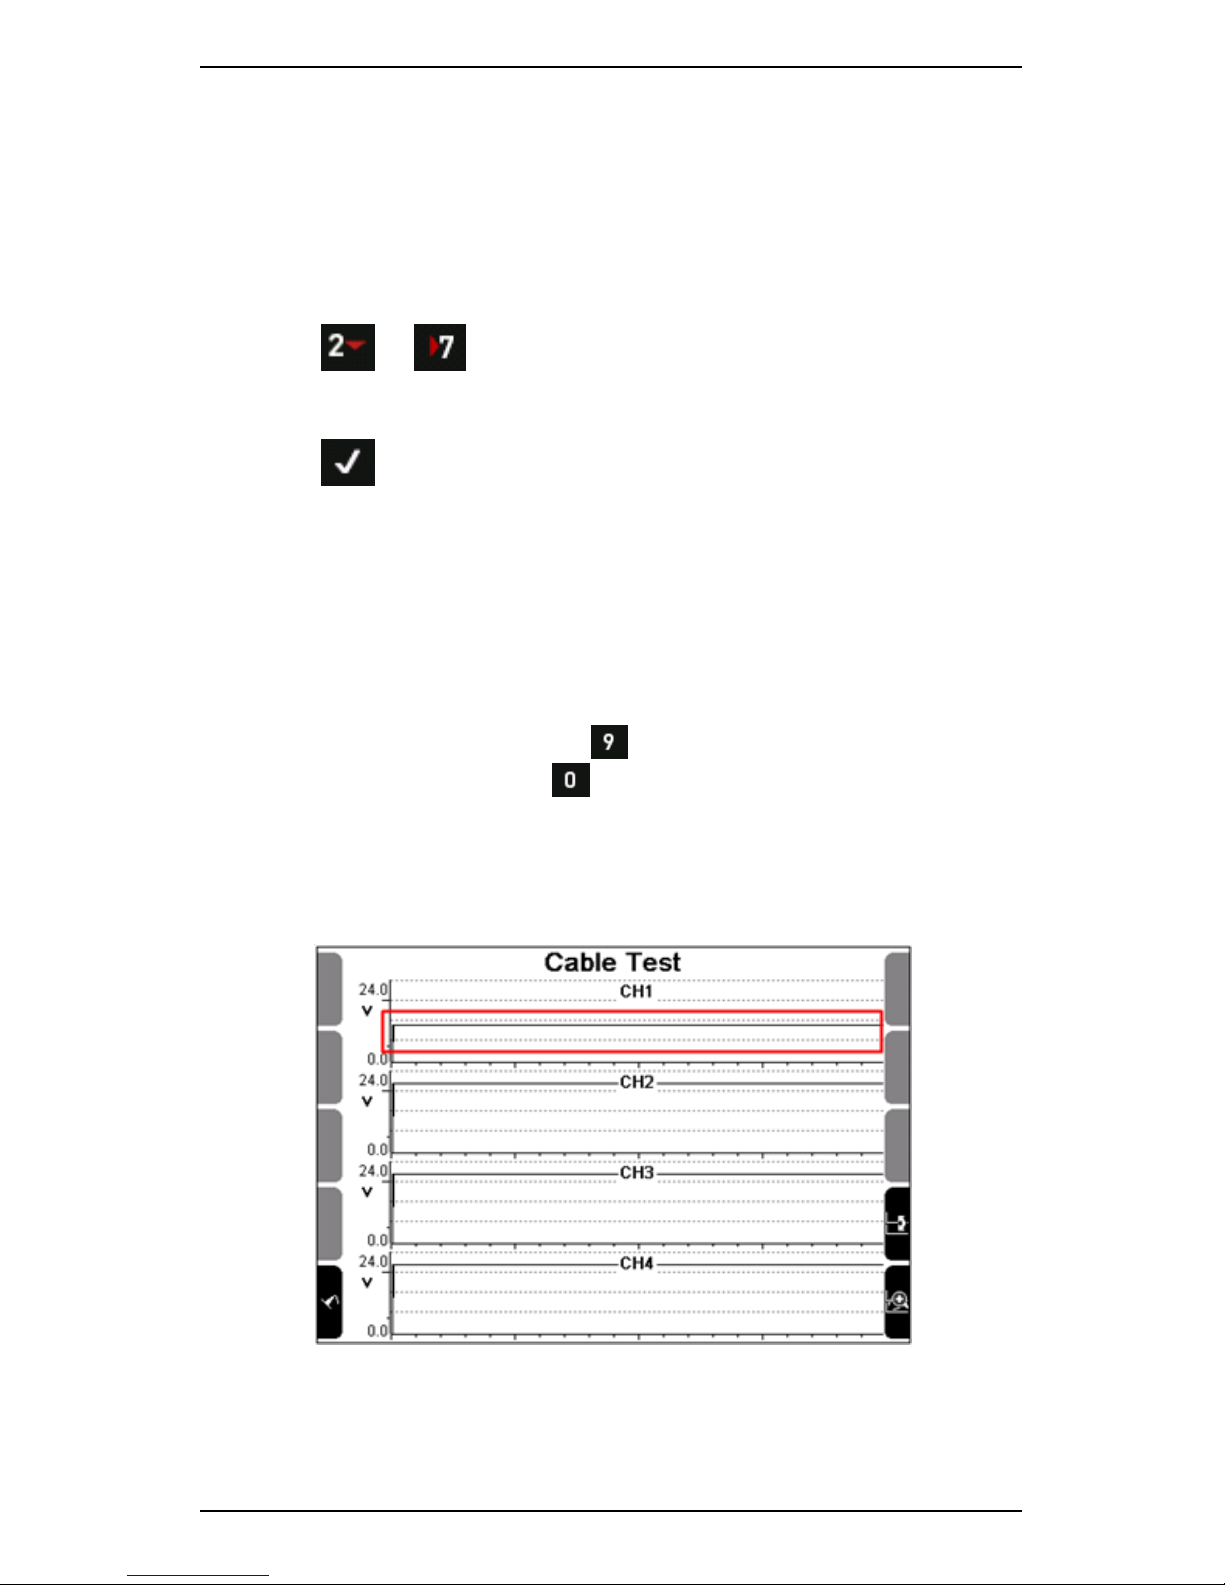
Cable Test
To display a live bias voltage graph of all connected channels and
determine whether your sensors and cables are working correctly:
1. Secure your sensor so that it does not move — You could attach it to
a machine that is not running or hold it with a clamp.
2. Press or Measure.
3. Use the navigation keys provided to scroll down and select Cable
Test.
4. Press — The current voltage displays in real time.
5. Move the cable joints to determine whether there is an intermittent
short:
• Consistent data (e.g. a straight line) indicates the cable is
working correctly.
• Varying data (e.g. a varying line) indicates there is a problem
with the cable.
TIP: You can view the data that displays for a particular channel in
more detail. To do this, press to toggle and select the channel
you wish to view > Press to access an enlarged view of the
data.
NOTE: You can run a cable test for any standard sensor that is
supported by your instrument, including accelerometers, velocity
sensors, and proximity probes.
Cable test reveals sensor is functioning correctly
Page 29
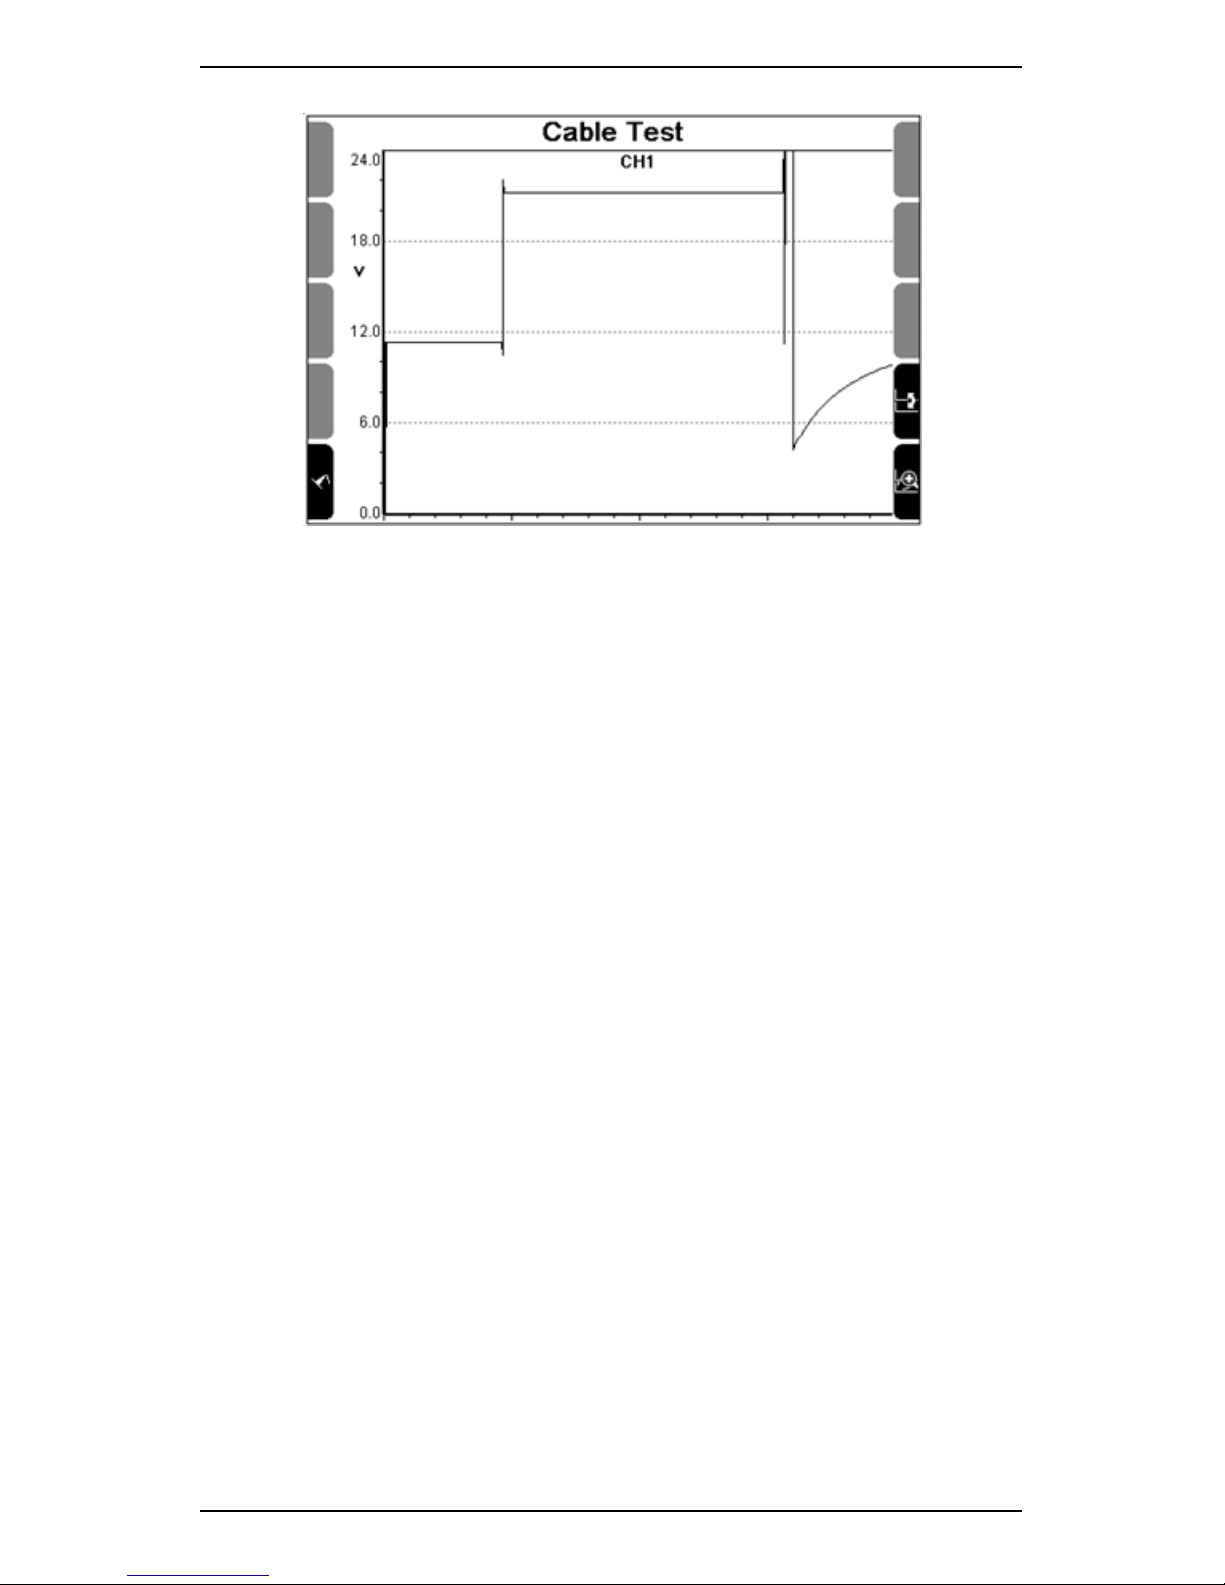
Section 1 — Introduction
18
Enlarged view of selected channel reveals problematic sensor connection
Operating Overview
You can use your instrument to:
• Take live, free run measurements for onsite analysis of vibration
spectra and waveforms.
• Record routes and store vibration data for transfer to a PC (off-
site analysis).
• Use keypad entry to enter additional machine information and
process inputs.
• Balance machines using single and dual plane methods.
Page 30
Section 1 — Introduction
19
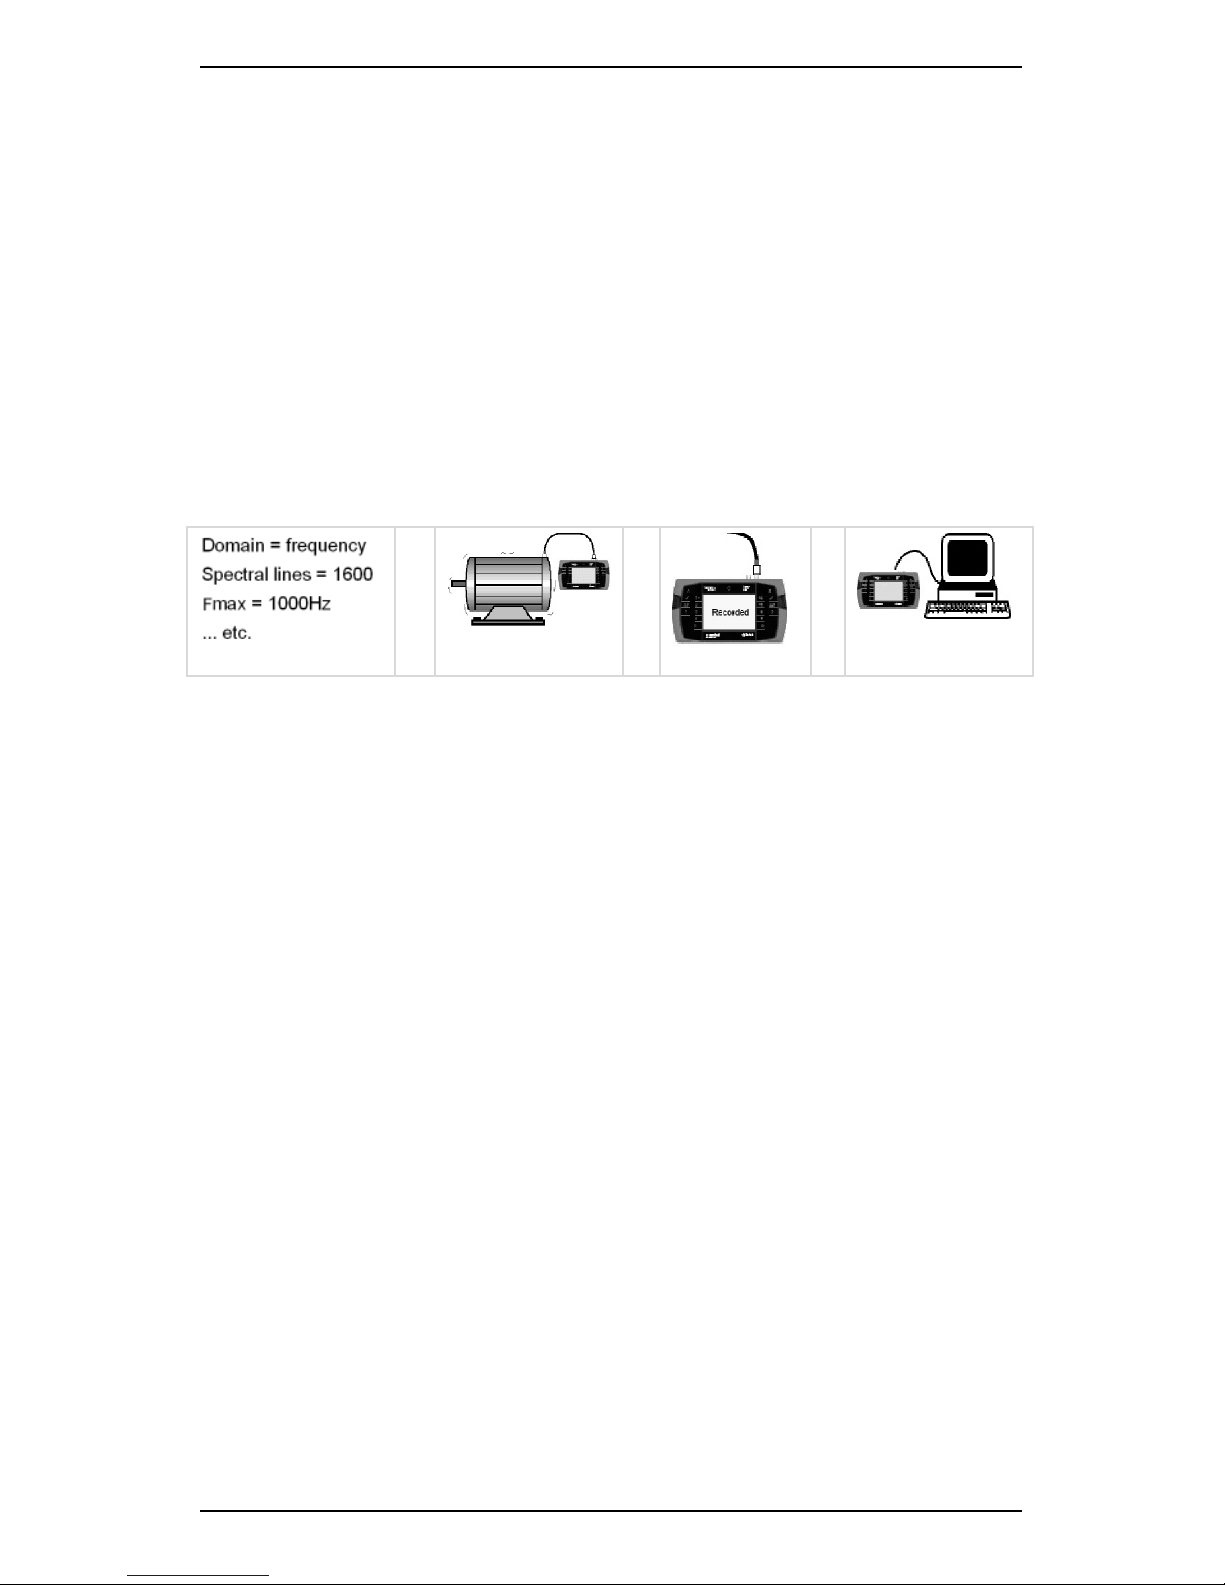
Onsite Analysis
You can use your instrument to measure vibration spectra and
waveforms. You can then analyze your data onsite immediately. This is
ideal for one-off investigations that fall outside your regular scheduled
monitoring route.
To do an onsite analysis:
1. Set measurement parameters on your instrument.
2. Measure and analyze the spectrum or waveform.
3. Record the data to memory (optional).
4. Transfer the data to your computer for further analysis (optional).
>
>
>
Page 31

Section 1 — Introduction
20
Recording Routes
You can take vibration recordings for all monitored machines and
transfer these to your computer for analysis.
Your instrument can guide you through a predefined data recording
sequence known as a route. You can create a route on your computer
and transfer it to your instrument.
Recording routes is particularly useful if you routinely monitor a large
number of machines. It enables you to build up a history of machine
states and conditions over time.
To record a route:
1. Create a recording route on your computer.
MORE: See the Ascent Reference Guide for instructions.
2. Transfer the route to your instrument.
3. Collect data for each item on the recording route as prompted by
your instrument.
4. Transfer the collected data to your computer for further analysis.
>
>
Page 32

Section 1 — Introduction
21
Balancing
Depending on your instrument, you can analyze and correct rotating
mass imbalance problems where they occur. A rigid rotor can be
balanced in one or two planes. To address a balancing problem where it
occurs:
1. Take an initial measurement of the imbalance.
2. Attach a trial weight to the balancing plane.
3. Take another measurement.
TIP: For dual-plane balancing, do the same for the second plane.
4. Attach correction weights to the balancing planes as recommended
by your instrument.
5. Take a measurement in each plane to confirm the rotor is balanced.
NOTE: You can use Trim Balancing to remove any residual
imbalance.
TIP: You can swap the display so that the rotation shown on the
screen matches the rotation of the shaft you are looking at.
>
>
>
Page 33

Section 1 — Introduction
22
Keypad Entry
You can create keypad entries to define process input values such as
current or flow rates. You can enter process input values manually using
the keypad (instead of attaching a sensor to your machine). You can
then transfer the data you have collected to your computer, along with
your normal measurements.
If you include keypad entries in a route, your instrument will prompt you
to enter values at specific points along the route. Keypad entries can
also be used as onscreen reminders to perform machine checks (e.g. for
checking temperature and pressure).
To collect and record entries using the keypad:
1. Create keypad entries as part of a recording route.
2. Transfer your entries to your instrument.
3. Enter the values for each keypad entry item (when prompted to do
so by your instrument).
4. Transfer the values and recordings you have collected to your
computer for analysis.
>
>
Page 34

Section 2 — Instrument Fundamentals
23
Section 2 — Instrument Fundamentals
This section explains how to:
• Switch your instrument on and off
• Navigate around menus and select menu items
• Enter and edit characters and punctuation
• View hint labels for the buttons on your screen
• Access more detailed help for a feature
Switch Instrument On or Off
You can press the power button to switch your instrument on or
off.
NOTE: If your instrument is switched on and it has a battery state
above 25%, it will enter Sleep mode when you press the power
button. If the battery has less than 25% charge remaining,
your instrument will enter Complete Powerdown Mode when you
switch it off.
When you switch your instrument on, the main menu displays the
following details:
• The remaining battery charge amount
• Today's date and time
• The serial number and firmware version
• Your user-defined description
• The name of the currently selected folder
TIP: You can press and hold either cancel button to return to
the main menu.
Page 35

Section 2 — Instrument Fundamentals
24
Main menu that displays when you switch your instrument on
Use Main Menu
To navigate around the menu, press the key of the task you want to
perform. For example, you can press to take measurements, and
to review recordings.
Return to Previous Menu
You can press the cancel button to return to the previous menu. If
you have opened several submenus, pressing this key will return you to
each previous menu item.
You can press and hold the cancel button to return to the main
menu.
Use Navigation Keys and Icons
You can use the arrow icons on the keypad and screen to:
• Navigate backwards and forwards through menus
• Move up and down and across lists
• Expand and collapse structures that contain other items
Page 36

Section 2 — Instrument Fundamentals
25
The table outlines the functions of the navigation keys and icons.
Move the selection bar in the required direction.
Move the selection bar to the top of a single column list.
Move one column to the left in a multi-column list.
Move the selection bar to the bottom of a single column list.
Move one column to the right in a multi-column list.
Expand the highlighted machine structure to show its points,
locations, and parameter sets.
Move to the right of the screen in a split-screen menu.
Collapse the highlighted machine structure so that only the top
level displays.
Move to the left of the screen in a split-screen menu.
When you are working with large numbers of machines, you can
use the collapse icon to collapse the machine structures
displayed. This will speed up navigation, enabling you to move the
selection bar from machine to machine, instead of scrolling
through each individual parameter set, location, or point.
Using the collapse icon
Page 37

Section 2 — Instrument Fundamentals
26
Select Menu Items
When several menu items are available, these will display in list format,
along with arrows on the screen. You can press the arrow keys to scroll
up, down, or across a multi-column list.
Select Option
To select an option from a list:
1. Use the arrows keys to move the selection bar until your option is
highlighted,
2. Press to select the required option.
Using the arrow keys to navigate to the required menu item
Jump To End of List
Left and right arrows display on the right of your screen when several
menu options are available. If required, you can:
• Press to jump to the first list entry.
• Press to jump to the final list entry.
Page 38

Section 2 — Instrument Fundamentals
27
To jump directly to the end of a list:
1. Open the main menu.
TIP: You can press and hold the cancel button to return to the
main menu from a submenu.
2. Press button to access the Measure menu.
3. Press button to select the Spectrum Waveform menu.
4. Press button to drill down for more details about the Spectrum
Waveform Left and right arrows display on the right of the screen.
5. Press button to select the first list entry, or button to
select the final list entry.
Using the left and right arrows to navigate to the required menu item
Scroll through Multi-column List
You might find lengthy lists displayed in several columns. Where this
happens, you can jump across columns and scroll up or down.
Cancel Option
You can press the cancel button to cancel an option and return
you to the previous menu.
TIP: You can press and hold the cancel button to return to the
main menu.
Page 39

Section 2 — Instrument Fundamentals
28
Display Hint Labels and Detailed Help
The functions on your screen have hidden hint labels and more detailed
snippets of help attached to them. To give you more screen space, the
help is hidden by default.
To access the hint labels and more detailed snippets of help:
1. Open the main menu.
TIP: Press and hold the cancel button to return to the main
menu from a submenu you have open.
2. Open the required menu (e.g. press button to open the Record
Review menu).
3. Press the help key to display the associated hint labels.
4. Press and hold the help key to display more detailed help.
5. Press the help key again to hide the detailed help text.
6. Press any key to hide the hint labels.
Page 40

Section 2 — Instrument Fundamentals
29
Viewing hint labels
Accessing more detailed help
Page 41

Section 2 — Instrument Fundamentals
30
Display Alternative Options
For several of the menu options, one key can perform more than one
function. When an additional menu option is available, an icon will
display at the top of the screen.
You can press the key to access a different set of options.
View of menu before pressing
View of menu after pressing
Page 42

Section 2 — Instrument Fundamentals
31
Enter Characters
The names you enter can be up to 50 characters long. These can contain
a mixture of upper and lower case letters, spaces, numbers, and
punctuation.
To enter letters and numbers, press the keys repeatedly to cycle through
the characters until you reach the one you want to use.
EG: To enter the number 7, press four times.
You can insert spaces between words, change from upper to lower case,
and delete or insert special characters as required.
Pressing to display hint labels will help you use the various editing
commands.
TIP: If you press a different key, the cursor will jump to the next
space. If you need to use a character that is on the same key as
the previous character, pause for a moment until the cursor moves
forward. This will ensure you do NOT overwrite your text.
TIP: Press if you make a mistake and wish to delete a
character.
Page 43

Section 2 — Instrument Fundamentals
32
Example — Rename Folder
This example explains how to rename a folder:
1. Open the main menu.
2. Press Folders & USB Export.
3. Press to change the folder name.
4. Press > Press to clear the current folder name.
5. Press the buttons provided to select the required letter.
EG: Press three times to enter the letter F.
6. Press to enter a space between words.
7. Press to access the punctuation options
8. Press > Press to display the advanced editing menu —
You can use this to change case, delete characters, and more.
9. Press to save your changes once you have finished entering
text.
Entering characters
Page 44

Section 2 — Instrument Fundamentals
33
Using the advanced options
Page 45

Section 2 — Instrument Fundamentals
34
Additional Icons
There are additional icons you can use to manage your machines and
other items.
TIP: Press to display the hint labels for a function.
The table lists the additional icons you can use to manage your
machines.
Icon Function
Create a new machine
Create a new point
Create a new location
Create a new parameter set
The table lists the additional icons you can use to manage any item.
Icon Function
Create a new item
Edit the selected item
Delete the selected item
Copy the selected item into memory
Paste the copied item to the highlighted position
Page 46

Section 3 — Sensors
35
Section 3 — Sensors
This section explains how to use the sensors that are compatible with
your instrument. You will learn:
• How to use the accelerometer and tachometer supplied with
your instrument
• How to mount a sensor correctly
Connect Sensor to Instrument
You can connect a sensor to the instrument via a BNC connector.
BNC connector
To attach a sensor cable plug to a BNC connector, insert the cable and
gently turn it clockwise.
To remove a sensor cable plug from a BNC connector, grip the end of
the cable plug, gently twist it anti-clockwise, and pull it up.
WARNING! Do NOT pull the sensor cable to remove the BNC
connector. Doing this can damage the cable.
Mount Sensor
The sensor mounting you choose will affect the accuracy (and therefore
repeatability) of your vibration measurements.
For walkathon data collection, accelerometers are usually mounted
using the supplied magnetic base. However, for optimal high frequency
results, you can stud-mount these (see Permanent Mounting).
NOTE: Ensure you mount tachometers, displacement sensors,
proximity probes, and current sensors according to the
manufacturer's instructions.
Page 47

Section 3 — Sensors
36
Set up Accelerometer
To set up your accelerometer:
1. Plug the accelerometer connector into the BNC sensor input of your
instrument.
2. Screw the accelerometer into the magnetic base.
3. Attach the accelerometer to the measurement point using these
guidelines:
• Attach the accelerometer to a sturdy, rigidly mounted, non-
flexible structure, where vibration from the rotating part of the
machine will be accurately transmitted.
• Do NOT attach sensors to sheet metal, guards, or any machine
structure that is NOT closely coupled to the source of vibration
in the spinning rotor. The vibration of this kind of structure will
be different to the vibration source.
• The attachment structure must be at least 10 times heavier
than the accelerometer itself. Do NOT mount the accelerometer
on lightweight motors or similar parts as the weight of the
accelerometer will distort the vibration signal. Use a smaller
accelerometer for small structures.
• To avoid distorted signals, attach the accelerometer as closely
as possible to, and in line with, the centerline of the bearings.
• The mounting surface should be flat and smooth where the
accelerometer makes contact. Attach the accelerometer using
the magnetic accelerometer base supplied or a threaded stud
on the machine surface. The accelerometer should NOT move
independently of the machine part it is attached to.
• Ensure the accelerometer is oriented correctly. Vibration can
vary significantly with direction.
• If you are undertaking an ongoing study of a particular
measurement point, always attach the accelerometer at exactly
the same position you used for previous measurements
TIP: Mark the position if necessary.
• Keep the accelerometer clear from other cables to ensure it is
NOT twisted, kinked, or tangled.
Page 48

Section 3 — Sensors
37
Permanent Mounting
To mount a sensor using the stud method:
1. Follow the specifications shown in the diagram below to prepare a
mounting spot on the machine.
2. Unscrew the magnetic base from the sensor.
3. Screw the sensor onto the threaded stud.
TIP: We recommend you use a thread locking compound.
CAUTION! Do NOT use a wrench to tighten the accelerometer. This
may damage the sensor.
Stud mounting spot
Page 49

Section 3 — Sensors
38
Set up Tachometer
A tachometer collects information about a machine's rotation speed. It
provides you with an exact reading of machine speed as a
measurement is taken. This is more accurate than using a default RPM
because a machine's speed can vary significantly under different loads.
The tachometer also provides information on the angle at which the
rotor is vibrating. The angle is measured from a fixed reference mark on
the rotor called the phase angle. To balance a rotor, you need to
consider the amplitude of vibration and the phase angle. The amplitude
shows the severity of the imbalance. The phase angle indicates the
geometry of the imbalance.
WARNING! The laser tachometer is a class 2 laser product. Do
NOT stare into the laser beam.
To set up your tachometer:
1. Screw the block grip extension of the tachometer into the end of the
mounting base articulated arm.
2. Plug the cable socket into the tachometer connecting pins > Turn
the locking ring to make the connection secure.
3. Locate the TACH input on your instrument > Attach the other end of
the cable to this (the LEMO end).
4. Stop the rotor.
5. Cut out a small strip of the reflective tape supplied (approximately 5
mm x 15 mm (0.2" x 0.5").
6. Stick this piece of reflective tape to a machine part that rotates at
the rotor speed (e.g. the shaft).
NOTE: This trigger spot should provide a pronounced increase in
reflection as it passes under the tachometer light beam. The tape
width must be at least double the diameter of the light beam spot.
7. Mount the tachometer magnetic base to a stationary portion of the
machine, close to the trigger spot.
8. Position the tachometer slightly away from the center line of the
rotating machine part so that reflections from the surface of the
machine part do NOT interfere with it.
9. Start the rotor > Wait until it is running at normal running speed.
10. Open the main menu on your instrument.
11. Press to access the Measure menu.
Page 50

Section 3 — Sensors
39
12. Press to access the Tach menu.
13. Press to access the Tach Type > Toggle this setting to
Standard (if you are using the supplied tachometer). — The screen
will display the rotor running speed in RPM and Hz. These values will
continuously update but should stabilize, indicating that the
tachometer is triggering reliably. If the RPM does NOT stabilize,
adjust the position of the tachometer.
Ideal sensor positioning
Preparing to take a tachometer reading
Page 51

Section 3 — Sensors
40
Tachometer Signal from Keyphasor®
If your machine has a proximity-probe-based tachometer (tach) sensor
(e.g. Keyphasor®), you can use this as the tach signal for your
instrument. The sensor should have a buffered front-panel BNC output.
This will ensure your instrument's measurements do NOT interfere with
pre-existing speed measurements.
TIP: You can purchase Keyphasor® LEMO connector tach cables
through your local reseller.
You should adjust the Keyphasor® proximity sensor gap so the driver
box output is -8 V +/- 2 V (i.e. -6 V to -10 V) when the sensor is over the
shaft. This is the normal mid-range position for these sensors. When the
sensor is over the keyway, its output will be -14 V to -22 V (depending on
the make and model).
A number of enhancements are available for instruments with serial
numbers 45000 and higher when taking recordings with a Keyphasor
tachometer:
• There are two additional Keyphasor voltage threshold levels,
making it easier to choose an appropriate threshold for the
machine’s Keyphasor probe gap. The previous single threshold
level was found to be incompatible with some Keyphasors that
had non-standard gap settings. When you take a recording
using a Keyphasor tachometer, your instrument will let you
know if a recording is tach-triggered but no pulses are detected.
You will then be shown the RPM measurements obtained at
each threshold level and be prompted to select the one that
provides the best measurement of the machine’s speed. When
the recording is received into Ascent, your Keyphasor threshold
level selection will be retained for future recordings on that
machine.
• The Tachometer input of these instruments is also sensitive to
both positive and negative signal pulses. Consequently there is
no longer a requirement to use the special Keyphasor Tach
cable (black strain relief, product code KEY70258). Instead you
can use either that cable or the TTL Tach cable (red strain relief,
product code TTL70259).
Page 52

Section 3 — Sensors
41
• In addition to the existing Tach Trigger and Off tachometer
modes, it is possible to set the mode to RPM Only for all
instruments and threshold levels (standard and Keyphasor). You
can use the RPM mode when you need the tachometer to
record machine running speed, but do not require tach
triggering (e.g. when you take coast-down recordings on a
machine with rolling element bearings). The disadvantage of
selecting Tach Triggering is that spectral averaging will average
away the non-synchronous peaks. This is not ideal when you
are trying to find rolling–element bearing faults. Additionally, in
Tach Trigger mode, the tach signal must be present. This means
the recording cannot be completed if the tach is disconnected
or faulty. In contrast, RPM Only mode records the speed if this is
available. Consequently, if the tach signal is not present, the
recording is still completed and its RPM value is set to the
machine’s default speed.
The additional Keyphasor thresholds are available for the following
measurement types:
• Spectrum/Waveform
• Demodulation
• Time synchronous Averaging
• Bump Test
• Coast Down/Run-up
• Long Time Waveform
• Orbit Plot
Page 53

Section 3 — Sensors
42
Manual Keyphasor Threshold settings
If a recording is tach-triggered but no pulses are detected, your
instrument will prompt you to select the appropriate Keyphasor
threshold settings. However, you can also access these settings
manually if required. To do this:
1. Use the KEY70258 or TTL70259 cable to connect the TACH input of
your instrument to the buffered output of the Keyphasor proximitor.
2. Press or Measure.
3. Select the required measurement type > Press .
4. Press Tach.
5. Select the required threshold.
6. Press Tach to select ONE of these options:
• RPM only — If you only want to record the machine speed (if
available) and do NOT require phase data, tach triggering, or
time synchronous averaging.
• Triggered — If you want to capture phase and/or perform time
synchronous averaging. You can also select this option if you
are recording an Orbit plot and require revolution markers.
7. Use the keys provided to select the required threshold.
TIP: Use the default 13V setting if you are using a Keyphasor but
are unsure which threshold to select. Press Off if you will NOT
be using any form of tachometer. Press for help.
Page 54

Section 3 — Sensors
43
Selecting the appropriate voltage for your tachometer and machine
Page 55

Section 3 — Sensors
44
Semi-automatic Keyphasor Threshold Selection
If a recording is tach-triggered but no pulses are being detected, your
instrument will prompt you to select the appropriate Keyphasor
threshold.
If you are performing a Tachometer Display measurement, you can also
bring up the same semi-automatic selection screen. To do this:
1. Press or Measure.
2. Select Tachometer Display > Press .
3. Press Tach Threshold — Your instrument scans through the
3V, 8V, 13V, and 18V threshold levels, displaying the RPM value
detected at each one.
4. Use the keys provided to select the threshold that delivers a stable
RPM reading and matches the expected speed of the machine you
are testing — The threshold value you selected will be used for all
subsequent recordings on the machine you are measuring.
NOTE: Your instrument will increase the duration between
thresholds to find lower RPM values. This process can take just
over a minute. A value of zero will display if there is no RPM value.
Correcting the threshold setting for your tachometer and machine
Page 56

Section 3 — Sensors
45
Use Strobe Light
If you have a strobe light with an output signal, you should be able to
connect it to the tachometer input of your instrument.
If your strobe light has a BNC connector and a TTL output (0 to 5 V), you
can purchase a suitable cable (with a LEMO connector) from your
distributor.
MORE: For more information on other types of connectors and
signals, see Strobe Output and the Frequently Asked Questions.
Page 57

Section 4 — Measurement Types and their Uses
46
Section 4 — Measurement Types and
their Uses
This section describes how to set up and take different measurement
types. You will learn:
• How to take different types of measurements
• The uses of different measurement types
Spectrum
A vibration spectrum is a chart of vibration amplitude versus vibration
frequency. The vibration spectrum of a machine component shows the
frequencies at which the component is vibrating and the amplitude of
vibration for each of these frequencies.
Spectra consist of discrete spectral lines displayed at fixed frequency
intervals. The height of each spectral line represents the amplitude of
vibration at that frequency. The more spectral lines in a spectrum, the
higher the resolution of the spectrum.
NOTE: Higher spectrum resolutions use more memory.
Simplified version of discrete vibration spectrum
Page 58

Section 4 — Measurement Types and their Uses
47
The key parameters you need to set are the number of spectral lines and
the Fmax. Doing so will ensure all crucial information is captured. To set
these parameters:
1. Open the main menu.
2. Press to access the Measure menu.
3. Press to access the Spectrum Waveform.
4. Use the arrow keys on the left to select an existing parameter set or
press to create a new set > Set the parameters as required.
5. Press to start measuring.
Page 59

Section 4 — Measurement Types and their Uses
48
Strobe Output
Your instrument can be used to regulate the output frequency of an
attached strobe lamp. Alternatively, it can be used to read the output of
a strobe as a tachometer signal. This capability is helpful when
identifying the source of vibration and unbalance in high speed
machinery. It is also useful as a means of visually inspecting the
condition of equipment while it is in motion.
Depending on the capabilities of the strobe, machine speeds of up to
140 Hz, 8400 CPM are supported. Some strobe models may only support
frequencies below approximately 80 Hz, 4800 CPM.
NOTE: This feature requires a LEMO-to-strobe (LEMO to twin 3.5
mm plugs) cable and a suitable externally-controllable strobe
lamp.
Ensure you connect only one 3.5 mm plug at a time (either the black
Read or red Drive plug. Connecting both Read and Drive plugs to the
strobe's input and output sockets will typically force the strobe into
external Drive mode. This will disable the strobe's ability to read and
provide a tachometer signal to the instrument.
NOTE: To read tachometer speed from a strobe, the strobe’s output
must be set to output a positive signal (NOT a negative one). This is
only required on some strobe models, such as some Monarch
models. Read the strobe's operating instructions for details.
Page 60

Section 4 — Measurement Types and their Uses
49
To regulate the speed of a connected strobe:
1. Connect the LEMO-to-strobe cable's LEMO plug to the instrument's
tachometer socket.
2. Connect the red Drive 3.5 mm plug to the strobe lamp's input socket.
3. Ensure the Read plug is disconnected.
4. Connect a vibration sensor to the instrument's vibration sensor input
(LEMO or BNC) and to the equipment you wish to measure.
5. Press Measure > Press Spectrum Waveform.
6. Press Spectrum Waveform — The Spectral Lines and WFM
Buffer screen will open.
7. Press Spec Wfm repeatedly until Spectrum displays.
8. Press to return to the Spectrum Waveform screen.
9. Press twice to start the measurement.
10. Wait until the spectrum measurement stabilizes,
11. Use the Cursor Left and Cursor Right keys to move the
dotted vertical cursor line to a spectral peak below 140 Hz, 8400
CPM.
TIP: For more precise positioning of the cursor, zoom into the
spectrum display using the X Axis Zoom key.
NOTE: The 1X peak should typically be the largest peak on
normally functioning rotating equipment.
12. Press ALT then Extended Commands to open the Extended
Graph Commands window.
13. Select Strobe Light > Press — A strobe icon will display over
the vertical cursor line on the spectrum display.
14. Point the strobe lamp at the rotating equipment and activate — The
rotating component matching the frequency selected on the
spectrum display will appear to freeze in place, or move slowly,
allowing a visual inspection.
Page 61

Section 4 — Measurement Types and their Uses
50
15. To change the frequency of the strobe light to another peak, or to
fine-tune the frequency, select another spectral peak on the graph
using the cursor keys — The strobe light frequency will change to
match the new peak's frequency > Cycle through each spectral peak
to identify the components generating vibrations at each frequency.
NOTE: Clearing the cursors (ALT then ) will NOT disable the
strobe cursor. To cancel the cursor you must exit the spectrum
measurement screen.
Read Speed of Connected Strobe
To read the speed of a connected strobe:
1. Connect the LEMO-to-strobe cable's LEMO plug to your instrument's
tachometer socket.
2. Connect the black Read 3.5 mm to the strobe lamp's output socket
— Ensure the Drive plug is disconnected and the strobe is set to
Positive Signal Mode (POS) if required by the strobe model.
3. Activate the strobe lamp and adjust the output rate as required.
NOTE: The strobe frequency must be kept below 140 Hz, 8400
CPM.
4. Press Measure > Press Tach.
5. Press Tach Type repeatedly to set the tachometer to Standard
— The current frequency of the strobe light will display.
Page 62

Section 4 — Measurement Types and their Uses
51
Waveform
Waveforms show how vibration levels change over time. A vibration
waveform chart represents a series of equally spaced discrete sample
points connected by straight lines. The chart shows the vibration level
(amplitude) at each time interval during the measurement period. The
more sample points in a spectrum, the higher the resolution of the
waveform (but the more memory used).
The key parameters you need to set are the duration and number of
samples.
The duration determines the equivalent Fmax value. If you later transfer
the waveform to Ascent and display it as a spectrum, the Fmax value will
be used on the chart.
The number of samples controls the number of spectral lines used when
you transfer the waveform to Ascent and display it as a spectrum.
To access this measurement type:
1. Press or Measure.
2. Press Spectrum Waveform.
3. Press the arrow keys on the left to select an existing parameter set
(or press to create a new set).
4. Set the parameters as required.
5. Press to start measuring.
Page 63

Section 4 — Measurement Types and their Uses
52
Demodulation
The demodulation process looks for repetitive patterns created by
impact events that lie embedded within a time waveform. The process
works by extracting the low amplitude, high frequency impact signals
and then tracing an 'envelope' around these signals to identify them as
repetitions of the same fault. The resulting spectrum, with the low
frequency data removed, will now clearly show the high frequency
impact signals and harmonics.
Demodulation is also useful as an early warning device as it detects
bearing tones before they are visible in a normal spectrum.
The high frequency signals that demodulation aims to extract are very
localized, therefore extra care must be taken to ensure the
accelerometer is set up correctly. Ensure that the:
• Accelerometer is mounted close to the signal source.
• Accelerometer is well coupled, using either stud mounting or a
very strong magnet on bare metal. A handheld probe or stinger
is NOT recommended.
• Accelerometer mounting is consistent between visits, otherwise
trend plots of overall RMS values will be meaningless.
The bandwidth you select determines which range of frequencies the
demodulation process will use. If possible, your instrument will suggest a
suitable demodulation bandwidth using the machine's default RPM
when configuring a demodulation recording.
For most standard speeds (above 1000 RPM), a bandwidth of 2 - 10 kHz
will typically be recommended and automatically selected when you
open the Bandwidth window ( Bandwidth after selecting a
measurement type of Demod).
Page 64

Section 4 — Measurement Types and their Uses
53
The table includes typical bandwidth recommendations that may be
made by your instrument, based on the default machine speed:
Demod Bandwidth Recommended Speed Range
250 Hz - 10 kHz <100 RPM
500 Hz - 10 kHz 100 - 300 RPM
1 kHz - 10 kHz 300 - 1000 RPM
2 kHz - 10 kHz 1000 - 3000 RPM
4 kHz - 10 kHz >3000 RPM
To view the full range of available bandwidths on the instrument, select
Show Complete List at the bottom of the bandwidth selection list.
If a default machine speed has NOT been configured, your instrument
will NOT be able to recommend a bandwidth. You will need to manually
select a bandwidth option suitable for the application. In this case, you
can use the following steps to determine an appropriate bandwidth:
1. Press Measure > Press Spectrum Waveform to take a
quick snapshot spectrum measurement.
2. Press to create a new parameter set > Set the store units to
Acceleration and the Fmax to 20 000 Hz (1200 kCPM).
3. Press to start measuring.
4. Examine the chart for a region of broadband high frequency noise
(haystack).
5. When you set up your demodulation measurement, select a
bandwidth that includes the haystack but excludes any large
individual peaks.
IMPORTANT! It is very important that all the large-amplitude/lowfrequency peaks are rejected. If no significant haystacks are
displayed, we recommend a standard bandwidth of 2 - 10 kHz
(120 - 600 kCPM). Proceed with the demodulation measurement
when you have determined an appropriate bandwidth.
Page 65

Section 4 — Measurement Types and their Uses
54
Broadband high frequency noise (haystack)
Analyze Demodulation Data
Measuring, recording, and viewing data is exactly the same for a
Frequency/Acceleration spectrum. You can also transfer the
demodulation spectra to Ascent and analyze it with the same
techniques used for normal spectra (e.g. trend plots, alarms, fault
frequencies, bearings, and gears).
Here are some points to remember when analyzing demodulation data:
• Bearing tones that appear in the demodulated spectrum but
NOT in the normal spectrum are a good early warning indicator
of insufficient lubrication (and other problems).
• As the bearing deteriorates, the baseline noise level increases
and bearing tones develop running speed sidebands.
• In the final stages of bearing wear, the bearing tones may
become less prominent as cracks and pits become more
rounded and distributed over the race.
Page 66

Section 4 — Measurement Types and their Uses
55
Demod Spectrum
To use the Demod Spectrum:
1. Press or Measure.
2. Press Demod.
3. Use the arrow keys on the left to select a parameter set or press
to create a new one > Set the parameters as required.
NOTE: Ensure you set the bandwidth first, as this will determine the
range of available Fmax values.
4. Press to start measuring.
6Pack
6Pack supports up to six measurements. You can take these
simultaneously from a single data stream/channel (across a maximum
of three channels). All standard condition monitoring data can be
acquired in one step, in the time normally required to take a single
conventional recording.
A 6Pack recording may include some or all of the following
measurement types for each recorded channel:
• High Frequency Spectrum
• High Frequency Waveform
• Low Frequency Spectrum
• Low Frequency Waveform
• Demodulation Spectrum
• Demodulation Waveform
Page 67

Section 4 — Measurement Types and their Uses
56
To take a 6Pack measurement:
1. Press or Measure.
2. Press 6Pack.
3. Use the arrow keys on the left to select a parameter set or press
to create a new set.
4. Set the parameters as required.
5. Press Spectrum Waveform, HF Fmax (Dmax), or
Demod Band (Dmin).
6. Use keys , , and to select the measurement types
you wish to record.
7. Press to begin sampling.
NOTE: The six recording types that comprise a 6Pack
measurement are saved as a single recording for each channel,
not as individual High Frequency, Low Frequency, and
Demodulation.
Streamlined Parameter Settings
The following simplifications have been applied to 6Pack measurements:
• The sensor type must be Accelerometer.
• The High Frequency and Demodulation measurements are
measured in Acceleration units only.
• All spectra and waveforms have the same resolution (maximum
3200 lines, 40 kHz for single channel and 1600 lines, 20 kHz for
dual channel).
• The Demod Bandwidth upper limit is automatically set to equal
the HF Fmax.
• Averaging type, number, and overlap are the same for all
spectra.
• Fmin and Demodulation Fmin are the same.
• Fmax and Demod Fmax are the same.
NOTE: Several charts will display when you use the 6Pack feature,
especially when you measure with two channels.
MORE: See View Multiple Charts for more information on multi-
chart layout options.
Page 68

Section 4 — Measurement Types and their Uses
57
6Pack Demodulation Processing
6Pack measurements use a slightly different Demod algorithm to the
one used when taking ”Demod” measurements (the classic algorithm).
The new algorithm performs ‘enveloping’ around the high frequency
impact events, in much the same way a user does by eye when viewing
a high frequency waveform. By contrast, classic Demod relies on
rectification and low pass filtering to achieve a similar result. The new
algorithm works very well over a wide range of impact signals, but uses
far less computing power than classic Demod. This allows the 6Pack
system to operate at full 40 kHz speed on two channels simultaneously,
providing twelve processed outputs.
The new algorithm has been carefully calibrated so that its response to
typical impacting signals is very close to that of classic Demod. You
should NOT see a marked difference when switching to the 6Pack
method.
Page 69

Section 4 — Measurement Types and their Uses
58
Tachometer Display
Tachometer Display shows an updating readout of the machine speed. It
can also display the amplitude and phase angle of the 1X vibration the
instrument. This can be used to:
• Verify the machine running speed.
• View the phase angle of the vibration relative to the tach signal.
• Take a quick preview of the out of balance level.
• Connect the tachometer that will be used to measure the RPM
— Attach a vibration sensor if you wish to see the vibration
amplitude.
1. Press or Measure.
2. Press Tach.
3. Press to select the standard tachometer or Keyphasor®
sensor — The Tachometer Reading menu will display a continuously
updating RPM and the equivalent value in Hz.
4. To see the amplitude and phase angle relative to the tachometer
signal:
a. Press Tach + Vibration > Change any parameters as
required.
b. Press to take the reading.
Comparing the amplitude and phase angle with the tachometer signal
Page 70

Section 4 — Measurement Types and their Uses
59
Time Synchronous Averaging
Time synchronous averaging is a useful vibration analysis technique for
distinguishing between spectral peaks that are very close to the
machine's running speed (but not exact harmonics of it).
After performing a large number of averages, peaks that are whole
number multiples of the running speed will still be visible. Those that are
non-synchronous will be cancelled out from the spectrum.
The key parameters you need to set are the duration, number of
samples, and number of averages.
The duration determines the equivalent Fmax value. If the waveform is
later transferred to Ascent and displayed as a spectrum, this Fmax value
will be used on the chart. The number of samples controls the number of
spectral lines used when the waveform is transferred to Ascent and
displayed as a spectrum.
TIP: We recommend you use 16 or more averages in order to
remove non-synchronous peaks from the final spectrum.
NOTE: You must use a tachometer or Keyphasor® to trigger your
measurements.
To conduct time synchronous averaging:
1. Connect the tachometer or Keyphasor® that will be used to trigger
your measurements.
2. Press or Measure.
3. Press Time Synch Avg.
4. Use the arrow keys on the left to select a parameter set or press
to create a new set.
NOTE: If you are creating a new parameter set, select the number
of samples, duration, and tach trigger source. Press and
to set the number of averages.
5. Set the parameters as required.
6. Press to start measuring.
Page 71

Section 4 — Measurement Types and their Uses
60
Bump Test
The bump test is a useful vibration analysis technique. You can use it to
help identify resonance frequencies in a machine's structure. This test
requires bumping (i.e. hitting) the machine structure when the machine is
stopped, while taking a peak hold measurement. Careful selection of the
mallet or hammer is required, along with the strength and direction of
the bump to ensure that suitable frequencies are injected into the
structure without causing damage.
Bump test measurements are taken in free run mode and use peak hold
averaging. Your instrument will take continuous samples and update the
peak value for each spectral line whenever a line exceeds its previous
value.
To perform a bump test:
1. Press or Measure.
2. Use the arrow keys on the left to select Bump Test > Press .
3. Use the arrow keys on the left to select a parameter set or press
to create a new set.
4. Set the parameters as required.
5. Press to begin sampling and bump the machine with a
hammer.
6. Repeat step 5 several times.
Page 72

Section 4 — Measurement Types and their Uses
61
Coast-down/Run-up
Coast-down and run-up measuring involves taking a series of recordings
with a short delay between them. You can use this technique to study
the resonance behavior of a machine as its speed gradually increases
during power-up, or decreases during coast-down.
Tips for Coast-down/Run-up recordings
We recommend using a tachometer to obtain the RPM reading for each
measurement as this will aid interpretation.
You can set the recording interval as a time interval between recordings
or a change in machine RPM. We suggest setting it to a change in
machine RPM, with the RPM Difference set to machine speed / 20. This
will result in approximately 20 recordings being taken during a complete
coast-down or run-up.
Several recordings are taken during a coast-down or run-up. If you
intend to repeat the process several times on a machine, we
recommend you save each set of recordings to a separate location so
you can easily distinguish between these.
Page 73

Section 4 — Measurement Types and their Uses
62
Deactivate Saving Waveform Data for Coastdown/Run-up Measurement
When you take a Coast-down/Run-up recording, the waveform data is
saved along with the spectrum data. However, this means the pace at
which you can take these recordings is slower. If you do not need to
collect the waveform data, we recommend you specify this when setting
up the recording. Doing so will enable you to take recordings much more
rapidly during the machine coast-down/run-up.
To deactivate this option and ensure only spectrum data is saved:
1. Press or Measure.
2. Locate and select the Coast-down/Run-up measurement type >
Press .
3. Press Spectrum Waveform.
4. Press Spec Wfm repeatedly to toggle between EITHER of these
options:
• Spec + Wfm — Spectrum and Waveform data will be saved
when you take a coast-down/run-up measurement.
• Spectrum — Only Spectrum data will be saved when you take a
coast-down/run-up measurement.
5. Press to confirm your selection.
Page 74

Section 4 — Measurement Types and their Uses
63
Choosing to save only spectrum data when doing a
coast-down/run-up recording
Take Coast-down/run-up Measurement
To take a coast-down/run-up measurement:
1. Press or Measure.
2. Use the arrow keys on the left to highlight Coast-down/Run-up >
Press .
3. Use the arrow keys on the left to select a parameter set > Press
to create a new set.
4. Set the parameters as required.
5. Press > Select the machine location to save measurements to.
6. Press again to start measuring.
7. After the first spectrum has been recorded, switch off the machine,
or begin ramping its speed up or down.
8. Once the machine has stopped rotating, or its speed has been fully
adjusted, press to stop measuring and return to the Coast-
down/Run-up menu.
NOTE: The measurement location will contain several
measurements. You can transfer these to Ascent and display them
as a waterfall chart. If you used the tachometer as well, you can
also display your measurements as a bode plot.
Page 75

Section 4 — Measurement Types and their Uses
64
Cross Channel Phase
Phase analysis is an effective way to diagnose machine faults such as
misalignment, resonance, soft foot, and looseness. Phase analysis is also
useful for distinguishing faults that look like imbalance but are actually
caused by something else. For example, misalignment can show up at
1X RPM, similar to imbalance. Knowledge of the phase relationships of
various machine faults will help confirm the existence of a specific
machine fault and help prevent misdiagnosis.
Cross Channel Phase is a convenient method of taking phase
measurements. It does NOT require the use of a tachometer or reflective
tape. Instead, phase is measured between two sensors.
NOTE: When taking measurements, be aware of the direction each
sensor is facing. If you are measuring across the coupling in the
axial direction, you will probably turn the sensors in opposite
directions, thereby introducing an additional 180° phase change.
Remember to take this into consideration when analyzing the
phase measurements.
Page 76

Section 4 — Measurement Types and their Uses
65
Recommendations for Cross Channel Phase
When conducting a cross channel phase analysis, we recommend you:
1. Determine the exact frequency of interest. To do this, you can use
spectra to identify high amplitude peaks at specific frequencies.
2. Position the channel 1 sensor in a location which has high vibration
at this frequency. Do NOT move this sensor once testing has started.
3. Try out different locations with the channel 2 sensor, noting the
phase and amplitude relationships compared to the fixed channel 1
position.
4. Repeat steps 2 and 3 at any other locations of interest.
Page 77

Section 4 — Measurement Types and their Uses
66
Fault Types and their Phase Relationships
The table outlines fault types and their phase relationships.
FAULT TYPE DESCRIPTION PHASE RELATIONSHIP
Misalignment
General High amplitude peaks will appear at 1X,
2X, and sometimes 3X the running
speed. Look for a 180° (± 30°) phase
change across the coupling in the axial
direction (for angular misalignment) or
radial direction (for parallel, offset
misalignment).
Bearing misalignment (cocked bearing)
will cause a twisting motion in the axial
direction. Look for a 180° (± 30°) phase
change from the top to the bottom of
the bearing housing, or from one side to
the other.
Imbalance
General A high amplitude peak will appear at 1X
the running speed. Confirm that the
phase difference from horizontal to
vertical on the bearing is close to 90° (±
40°). The phase difference between left
and right horizontal locations should be
within 30° of the phase difference
between left and right vertical
locations. If the phase is unstable, there
may be another reason for a large
running speed vibration (e.g. looseness
or misalignment).
You can investigate the degree of
couple imbalance versus force
imbalance by looking at the phase
difference between the two sides of the
machine. If there is little couple
imbalance, only a single plane
correction may be required to balance
the rotor.
Page 78

Section 4 — Measurement Types and their Uses
67
Resonance
Flexible
structures
High amplitude peaks will appear
where natural resonance frequencies of
the structure coincide with excitation
frequencies (e.g. 1X, other low orders of
running speed, or blade pass
frequency).
Look for a 0° phase change when both
sensors are positioned in the same
direction between two stationary
points. The phase change will be 180°
when there is a stationary point
between the sensors.
Variable speed
machines
You can vary the machine speed to
investigate resonance. A phase shift of
180° will occur as machine speed is
increased from below a resonance to
above it. A 90° phase shift will be
present at the resonant frequency. If a
machine is running close to resonance,
any small speed variation will cause
large phase shifts.
At a bearing Look for a change from the normal 90°
phase difference in the horizontal and
vertical directions at 1X. When a natural
frequency is close to 1X in either
direction, that phase angle may be
heading for its 90° phase change. This
means the two phases may no longer
be 90° apart (assuming the structure
has a different natural frequency in
either direction).
Page 79

Section 4 — Measurement Types and their Uses
68
Eccentric belt
pulley
General A high amplitude peak will appear at 1X
the running speed of the pulley. Look
for a phase change of either 0° or 180°
between the horizontal and vertical
readings. This indicates straight line
motion instead of the usual 90°
difference. This symptom is similar to
bearing resonance (described above).
However, in this case, the direction of
maximum vibration will be in line with
the two belts.
Mechanical
looseness
General High amplitude peaks will show up at
several multiples of the running speed
and sometimes even multiples of 0.5X
running speed (e.g. 1.5X, 2.5X), etc. Look
for fluctuating phase readings at a
location from one recording to the next.
Also compare the phase readings at 30°
increments around a bearing housing.
The phase will be significantly different
at each angle.
Soft foot A high amplitude peak will show up at
1X the running speed. Look for a 90° to
180° phase change between the
machine foot and its concrete base. The
soft foot may also have a different
phase measurement from the other
feet.
Page 80

Section 4 — Measurement Types and their Uses
69
Measuring Cross Channel Phase
The Cross Channel Phase measurement option has been enhanced. It’s
easier to change the speed of interest during the recording. This could
be the actual speed of the machine or the frequency of interest.
Additionally you can choose the required filter bandwidth you wish to
monitor, and the number of averages you wish to take. While recording,
a graph displays on your screen, showing your data. You can adjust the
position of the cursor on this graph to access more details about a peak
of interest, including phase and coherence data.
Setup
To select your preferred settings for a cross channel phase recording:
1. Connect two sensors to the appropriate machine locations.
2. Assign two sensors and enable both channels:
a. Press > Press Sensor Setup.
b. Create or select your sensors as required.
c. Press to continue.
NOTE: The lowest channel will be used as the reference channel.
For example, if you have enabled CH2 and CH3, CH2 will be used
as the reference channel.
3. Press or Measure.
4. Use the navigation keys provided to locate and select Cross
Channel Phase > Press .
5. Press Store Units > Select ONE of these units according to
your requirements:
• Acceleration
• Velocity
• Displacement
6. Press .
7. Press Speed/Freq of Interest.
8. Enter the required rpm value > Press .
9. Press Filter Bandwidth > Select the required bandwidth.
Page 81

Section 4 — Measurement Types and their Uses
70
10. Press Number of Averages > Select the required number of
averages.
NOTE: Coherence calculations require spectral averaging to be
performed. This means if you set the number of averages to 1,
Coherence will not display.
Measure Cross Channel Phase
To measure cross channel phase:
1. Press or Measure.
2. Use the navigation keys provided to locate and select Cross
Channel Phase > Press .
3. Select the required parameter set you have set up > Press —
Recording will start automatically.
4. Press to display labels for the additional viewing options:
5. Press to zoom in to the Y axis.
6. Press to expand the Y axis.
7. Press to zoom in to the X axis.
8. Press to expand the X axis.
9. Press to move the cursor left.
10. Press to move the cursor right.
11. Press to change the display of the sensor orientation.
NOTE: The instrument will perform a spectral peak search on the
reference channel at the frequency entered. The frequency of the
actual peak displays in the top right of the screen. The instrument
then looks at exactly the same frequency on the other response
channels and displays the phase difference Delta <value> Ø2/Ø1
(CH2 - CH1). The instrument also displays the phase angles and
amplitudes of both channels at your chosen peak frequency.
Page 82

Section 4 — Measurement Types and their Uses
71
Measuring cross channel phase
Cross Channel Spectrum (ODS)
This section explains how to use the Cross Channel Spectrum (ODS)
measurement mode. This process is similar to modal impact testing. It
involves:
1. Planning and noting the locations and directions for your recordings.
2. Setting up your channels and sensors to measure the frequency you
are interested in.
3. Taking recordings at the specific locations and directions used.
4. Reviewing the data:
• On your instrument
• In Ascent
• In Operating Deflection Software (ODS) such as ME’scope
MORE: Contact your local sales representative for more details
about this feature.
1 — Plan Cross Channel Spectrum (ODS) Recording
Routine
We recommend you draw a quick sketch of the machine you are
investigating and number the points you plan to measure “1”, “2”, “3”,
etc. Doing so will ensure you can specify the names, locations, and
directions for your readings once you have taken these.
Page 83

Section 4 — Measurement Types and their Uses
72
2 — Setup
Before you can use your instrument to take a Cross Channel Spectrum
(ODS) recording, you will need to specify the appropriate settings for your
channels and sensors. You will need at least two sensors enabled for this
type of recording. The lowest channel (e.g. CH1) will be used as the
reference channel.
To set up your channels and sensors:
1. Press or Measure.
2. Use the navigation arrows to select Cross Channel Spectrum (ODS)
> Press .
3. Select your preferred FRF unit — Accelerance / Mobility /
Compliance:
a. Press Store Units.
b. Use the navigation arrows to select your preferred unit > Press
.
NOTE: This selection is the modal equivalent of choosing between
acceleration, velocity, and displacement. Consequently,
Accelerance is the better choice for very high frequencies, while
compliance is the better option for very low frequencies.
Frequency Response Function (FRF) units are derived automatically
based on your unit selection.
4. Specify your preferred spectral lines and samples:
a. Press Spectrum Waveform.
b. Use the navigation arrows to select the required option > Press
.
Page 84

Section 4 — Measurement Types and their Uses
73
5. Select the required Fmax setting — Ensure this value covers any
frequencies at which the machine could exhibit mechanical
resonance:
a. Press Fmax Fmin.
b. Use the navigation arrows to select the required option > Press
.
NOTE: If required you can press to disable automatic
incrementing of the reference sensor (lowest channel number) as
you take your recordings (NOT recommended).
6. Press to access additional setup options:
a. Press Number of Averages to change the default number
of averages taken.
b. Press Point Name Increment to change the default
interval at which points will automatically increment.
c. Press Average Overlap repeatedly to toggle and select
the required percentage.
d. Press Window to toggle between Hanning and
Rectangular options.
e. Press Sensor Setup to set up your channels and sensors
as required.
7. Press to exit when you have finished selecting the required
parameters — You can now start recording.
Page 85

Section 4 — Measurement Types and their Uses
74
Selecting the required parameter settings
Page 86
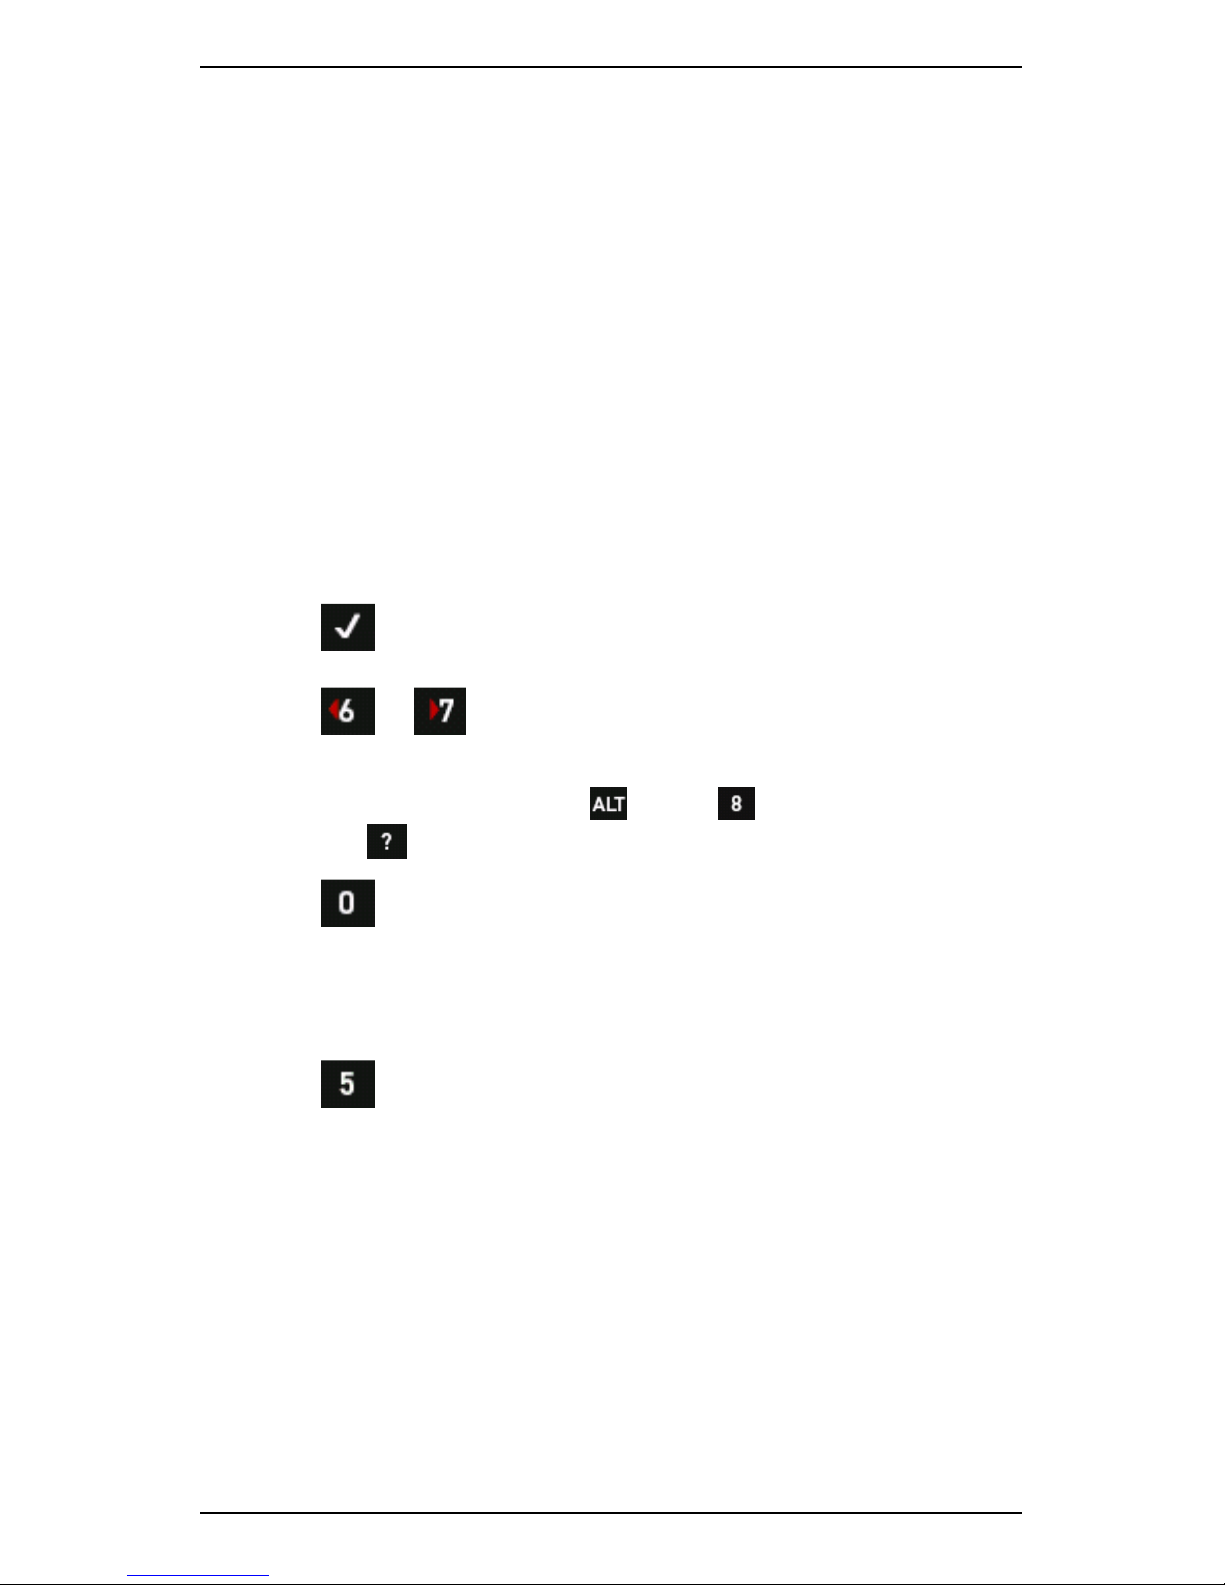
Section 4 — Measurement Types and their Uses
75
3 — Take Cross Channel Spectrum (ODS) Recording
Once you have selected your parameter set you can start taking Cross
Channel Spectrum (ODS) recordings according to the labeled machine
test plan you have created. Your instrument keeps track of the
recordings for each point. However, when you save your recordings you
will need to specify the points and directions you used for these so keep
your test plan close at hand.
To take a Cross Channel Spectrum (ODS) recording:
1. Position your reference sensor at a location on the machine where
there is a strong vibration signal at all frequencies of interest.
Position your roving sensor according to the measurement plan you
drew up.
2. Select the required parameter set listed on the left.
3. Press to start a recording with these parameters.
4. Wait for the sensor to settle — Recording will start automatically.
5. Press or to display the cursor — Use the navigation
arrows to move the cursor to a peak of interest.
TIP: To hide the cursor, Press > Press Clear Cursors.
(Press to display the instrument labels).
6. Press to toggle between displaying:
• Two graphs, one showing data from the reference channel, the
other showing data from your second channel.
• The default view of three graphs showing coherence, FRF, and
Phase data.
7. Press to save the recording.
Page 87

Section 4 — Measurement Types and their Uses
76
8. Specify the locations and directions for the readings you have
saved:
a. Press Machine Name > Select or specify the machine you
performed the impact test on (e.g. Rotor 1) > Press .
b. Press to specify the reference point you used during the
recording > Press .
c. Press to select the point for the other channel you used >
Press .
d. Press to specify the direction you used for your reference
sensor > Press .
e. Press to specify the direction you used for your other
sensor > Press .
9. Press to save your data and move to the next point, or to
exit.
Taking a Cross Channel Spectrum (ODS) recording
Page 88

Section 4 — Measurement Types and their Uses
77
4 — Review Data
Once you have taken Cross Channel Spectrum (ODS) recordings you can
review your data:
• On your instrument press or Record Review.
• In Ascent
• In ODS software such as ME’scope
Reviewing a Cross Channel Spectrum) recording on your instrument
Page 89

Section 4 — Measurement Types and their Uses
78
Review Data in ODS software
If you are using ODS software such as ME’scope, you can import the
modal impact and Cross Channel Spectrum (ODS) data stored on your
instrument into this program and conduct a more detailed analysis.
When importing modal impact data into ODS software such as
ME’scope, construct the model using the sketch you drew, along with the
numbered points.
To review the data in ODS software such as ME’scope:
1. Securely connect a USB flash drive to your instrument's USB host
port.
TIP: Ensure the USB flash drive you are using has enough storage
space and that any write protect tabs are unlocked.
2. Press Folders & USB Export on the main menu — The USB
Flash Drive screen opens.
NOTE: If you have NOT yet attached a USB flash drive, do this now
and press USB Flash Drive.
3. Press to export the data in Universal File Format (UFF) format.
4. Use the navigation buttons to select the required machine > Press
.
5. Use the navigation buttons to select the required modal impact or
Cross Channel Spectrum (ODS) recordings > Press .
6. Disconnect the flash drive.
7. Connect the memory stick to the PC running the ODS software.
8. Use the standard data import functionality provided in the ODS
software to import the data.
Page 90

Section 4 — Measurement Types and their Uses
79
Exporting data to an external USB flash drive
Importing data into ME’scope
Page 91

Section 4 — Measurement Types and their Uses
80
Long Time Waveforms
Long time waveforms enable you to take a continuous recording over a
long time period (several hours, if required). This is useful for capturing
transients. Once you have started measuring, recordings are taken
continuously until your specified time period has elapsed, or you stop the
measurement manually. The length of time you can record for depends
on the Equivalent Fmax. This determines the sample rate/lines of
resolution and the available memory remaining in the instrument.
Measure Long Time Waveforms
Duration is the total amount of time available for recording and is
displayed in seconds. You can record for the full length of time available
or set a shorter time period. Your chosen time period is shown on top,
while the available time is shown in brackets below this value.
The Equivalent Fmax (which determines the maximum frequency
displayed on your screen) will affect the available recording time. A high
Fmax reduces recording time, while a low Fmax increases the total
amount of time available for recording.
While your instrument is recording, you can display the signal on your
screen as a waveform. Alternatively, you can convert it to a spectral
display by pressing Display Type & Resolution and selecting your
preferred display type.
Page 92

Section 4 — Measurement Types and their Uses
81
To measure long time waveforms:
1. Press or Measure.
2. Use the arrow keys on the left to highlight Long Time Waveform >
Press .
3. Use the arrow keys to select a parameter set or press to create
a new set.
4. Set the parameters as required > Press .
5. Use the navigation keys to select a location to save your data to.
NOTE: Each input channel must either be saved to a unique
location, or not saved.
6. Press to start measuring.
NOTE: During measuring, the number at the top of your screen
indicates how many recordings have been taken. Spectrum and
waveform measurements are displayed simultaneously by default.
NOTE: When measuring is complete, your screen will display a
waveform block (or spectrum if you selected this option). It will also
show a trend in the overall power of the last recording.
7. To view the power in another recording, use the arrows on the right
to move the cursor.
8. If you used a speed sensor, the top chart can also display the trend
in machine speed — Press to toggle between overall power
and RPM.
NOTE: When measuring is finished, the selected measurement
location will contain several individual recordings.
NOTE: When the waveforms are later transferred to the software
and displayed as spectra, the equivalent Fmax value will be used
on the chart. The actual sampling rate is 2.56 times higher than
this Fmax value.
Page 93

Section 4 — Measurement Types and their Uses
82
Measuring long time wave forms
View Long Time Waveforms on Computer
When you have finished recording, the selected measurement location
will contain several individual sample recordings. Once you have
transferred these to your computer, you can use the waveform analysis
tools to create a high resolution spectrum of the recordings. To do this,
select Analyze > Partial Waveform Analysis or Freq. Based Waveform
Analysis.
MORE: See the Ascent Reference Guide.
You can combine up to 100 sample recordings in a single long time
waveform chart in Ascent. For example, if individual recordings taken on
your instrument used 4096 samples, the maximum long time waveform
length displayed in Ascent would include 409,600 samples, resulting in
160,000 lines of resolution (409,600 divided by 2.56).
Page 94

Section 4 — Measurement Types and their Uses
83
Orbit Plot
An orbit plot shows the motion of the center of mass of a shaft. You can
plot a shaft's vibration in two directions simultaneously (e.g. vertical and
horizontal) to get a trace of the motion of that shaft.
A perfectly balanced shaft with no movement in any direction produces
a dot in the middle of the plot. Unbalanced or misaligned machinery
may exhibit as circular orbits, figure eights, leaning orbits, or flat orbits.
Rub or looseness may display as indents around the circumference of
the orbit plot, or small loops around the larger plot orbit. You can use
orbit plots to detect abnormal movements of the shaft in the bearing
(e.g. unbalance, misalignment, or rubbing against a drive casing. The
shaft movement will give you an indication of its cause. For example, if
there is a lot of up/down movement, the machine feet might not be
bolted down tightly enough.
Two probes are used when taking and analyzing enhanced orbit plot
recordings. These are nominally referred to as X and Y. By convention,
when viewing the machine from the driver to the driven end, the Y probe
is positioned 90 degrees counter-clockwise from the X probe.
The direction of shaft rotation is not important for the X and Y position.
You just need to ensure you view the machine from the driver to the
driven end. For example, the Y probe will be positioned 90 degrees
counter-clockwise from the X probe regardless of the actual angles and
positions used.
Page 95

Section 4 — Measurement Types and their Uses
84
The sensors used to take the measurements should be displacement
probes. This is because we are measuring the physical movement of the
shaft, not its speed. (You can take the readings with an accelerometer if
no displacement probes are available but there will be a small loss of
accuracy in the displayed plot when the signals are integrated.) The
number of samples and measurement duration you choose determines
the resolution and length of the orbit recording. We suggest 1024
samples and a duration that covers 4-6 revolutions of the machine
being tested. For example, an 890 RPM system (14.8 Hz) has 1 revolution
every 67 milliseconds (6 x 67ms = 402 ms). If you choose 400 ms for the
duration, you will just capture 6 revolutions of the machine.
NOTE: Severe rub or looseness can produce random orbit plots.
Once the recordings have been received in Ascent, you can select a
recording from either location > Select Chart > Orbit+Waveform. The
recording at the other location is automatically selected for plotting
when you choose the orbit plot option.
NOTE: If you have modified the legacy Orbit chart, this might also
display on the Chart menu
Page 96

Section 4 — Measurement Types and their Uses
85
The availability of orbit plot functionality depends on your licensing
agreement. If you have the enhanced orbit plot functionality you will also
be able to:
• Position your probes at custom angles (e.g. 45 degrees from
vertical) and include the direction of the shaft rotation for
display and analysis.
• Record tach pulses for any tach-triggered waveform recording,
using one average.
• Easily take orbit plot recordings on a route you have set up in
Ascent.
NOTE: When using your instrument to collect data on route, if the
route includes corresponding recordings for two different axes on
the same bearing, these will be collected as an orbit recording.
MORE: Contact your sales representative.
Page 97

Section 4 — Measurement Types and their Uses
86
Use Orbit Plot Measurement Mode
To take an orbit plot measurement:
1. Press or Measure.
2. Use the arrow keys on the left to highlight Orbit Plot > Press .
3. Use the arrow keys on the left to select an existing parameter set or
press to create a new one.
4. Set the parameters as required.
5. Configure your sensors by pressing > Sensor Setup.
6. Enable two sensors > press .
NOTE: Ideally the sensors used to take the measurements should
be displacement probes. This is because you are measuring the
physical movement of the shaft. If required, you can also take the
measurements with accelerometers (if no displacement probes are
available). These measure the movement of the bearing housing,
not the shaft.
7. Press Number of Samples > Select an appropriate number of
samples.
TIP: We recommend 1024 samples.
8. Press Wfm Duration Total Time > Select a measurement
duration.
TIP: We recommend 4-6 revolutions. You could select Revs
followed by the number of revolutions or an equivalent duration in
seconds/milliseconds.
9. Press Tach Trigger repeatedly to select the required tach
mode.
NOTE: If OFF is selected, you will be prompted to enter the
machine's RPM manually before you start measuring.
10. Press to begin sampling — The sensors will settle and the orbit
plot will display.
Page 98

Section 4 — Measurement Types and their Uses
87
11. Press again once the plot has stabilized — A single waveform
orbit measurement displays.
NOTE: Filtering is NOT supported on your instrument. You can use
Ascent for advanced analysis.
12. Press Save to save the two waveform measurements used to
generate the orbit plot.
NOTE: You must specify the vertical and horizontal channels in
order to correctly view the orbit plot in Ascent.
NOTE: The circle icon indicates the start position of the waveform.
The triangle indicates the end.
13. Press Change View to toggle between orbit plot and waveform
views.
Orbit plot
Page 99

Section 4 — Measurement Types and their Uses
88
Take Orbit Plot Measurement on Route
Before you take an orbit plot measurement on route you will need to
enable two sensors. To do this:
1. Press Options.
2. Press Sensor Setup.
3. Enable two sensors > press .
NOTE: Ideally the sensors used to take the measurements should
be displacement probes. This is because you are measuring the
physical movement of the shaft. If required, you can also take the
measurements with accelerometers (if no displacement probes are
available). These measure the movement of the bearing housing,
not the shaft.
To take an orbit plot measurement on route:
1. Press or Route.
2. Select the route you have set up and imported from Ascent.
3. Press to toggle to the Axis/Point Mode to Multi-Axis (X & Y for
Orbit).
4. Press the buttons on the left of the Multi-Channel On Route screen to
specify you X and Y axes.
5. Press the buttons on the right of the Multi-Channel On Route screen
to specify all the other the axes you wish to record > Press .
6. Select the axis point you wish to take a recording for > Press to
begin sampling.
7. Press again once the plot has stabilized — A single waveform
orbit measurement displays.
NOTE: Filtering is NOT supported on your instrument. You can use
Ascent for advanced analysis.
8. Press Save to save the two waveform measurements used to
generate the orbit plot.
NOTE: You must specify the vertical and horizontal channels in
order to correctly view the orbit plot in Ascent.
NOTE: The circle icon indicates the start position of the waveform.
The triangle indicates the end.
Page 100

Section 4 — Measurement Types and their Uses
89
9. Press Change View to toggle between orbit plot and waveform
views.
Preparing to take an orbit plot recording on route
Modal Impact Testing
This section explains how to do modal impact testing on your
instrument. This process involves:
1. Planning and noting the locations and directions for your impact
test.
2. Setting up your parameters, hammer, and sensors to measure the
frequency you are interested in.
3. Performing trial impacts with your hammer on the machine you are
investigating — This trial phase provides an opportunity to
experiment with different hammer tips and force of impact to
ensure you are prepared to take high quality recordings.
4. Performing actual impacts in Run mode and recording the specific
locations and directions used.
5. Reviewing the data:
• On your instrument
• In Ascent
• In ODS software such as ME’scope
MORE: Contact your local sales representative for more details
about this feature.
MORE: Learn more about the fundamentals of modal testing.
 Loading...