

Page 1

CardioSys
Operator’s Manual
Version 4.1
227 498 02 GA(e) Revision A
Page 2

Contents
The product CardioSys bears the CE marking
-0366
indicating its compliance with the provisions of the Council
Directive 93/42/EEC about medical devices and fulfills the
essential requirements of Annex I of this directive.
The product fully complies with the electromagnetic immunity requirements of standard EN 60601-1-2 “Electromagnetic Compatibility – Medical Electrical Equipment”.
The device is in radio-interference protection class B in
accordance with EN 55011.
The EC Declaration of Conformity covers only the accessories
listed in the “Equipment” section.
This manual reflects software version 4.1.
© Marquette Hellige GmbH 1999
Postfach 600265
D-79032 Freiburg
Germany
Tel. +49 761 45 43 0
Revision History
This document is subject to the Marquette Hellige change order system. The revision code, a letter that follows the document
part number, changes with every update of the manual.
Part No./Revision Code Date Comment
227 498 02-A 10 Feb. 1999 Initial Release
MS-DOS and Windows are trademarks of Microsoft Corp.
2 CardioSys V4.1 227 498 02-A
Page 3

Contents
1. Introduction
2. General Information on System Operation
3. Selecting and Admitting a Patient, Retrieving Stored
Examinations
4.1 The Resting ECG
4.2 The Exercise ECG
4.3 The STAT ECG
4.4 The Spirometry Test
4.5 Ambulatory Blood-Pressure Measurement
4.6 Late Potential Analysis
4.7 External Programs
5. Deleting Examinations, Quitting the Program
6. System Services Menu
7. Cleaning, Disinfection and Maintenance
8. System Messages and Troubleshooting Tips
9. Technical Specifications
10. Equipment List, Order Information
Appendix
Index
227 498 02-A CardioSys V4.1 3
Page 4

General Information
Contents
General information
* This manual is an integral part of the instrument and
describes its normal use. It should always be kept close to
the equipment. Observance of the manual is a prerequisite for proper instrument performance and correct
operation and ensures patient and operator safety.
* The symbol m denotes: Refer to Operator’s Manual!
It serves as an indicator for important facts to be noted
when operating the instrument.
* Information which refers only to certain versions of the
instrument is accompanied by the catalog number(s) of
the instrument(s) concerned. The catalog number is
given on the instrument nameplate.
* For detailed safety information, please refer to section
1.3 “For your safety”.
* Patient safety, specified measuring accuracy, and interfer-
ence-free operation can be guaranteed only if original
Marquette Hellige devices are interconnected (e.g. basic
units and plug-in modules).
* The warranty does not cover damages resulting from the
use of accessories and consumables from other manufacturers.
* Marquette Hellige is responsible for the effects on safety,
reliability, and performance of the equipment, only
– if assembly operations, extensions, readjustments,
modifications, or repairs are carried out by
Marquette Hellige or by persons authorized by
Marquette Hellige.
– if the instrument is used in accordance with the
instructions for use.
* All publications are in conformity with the instrument
specifications and IEC publications on safety of electromedical equipment valid at printing date. All rights are
reserved for instruments, circuits, techniques, and names
appearing in the manual.
* On request Marquette Hellige will provide a service
manual.
* Only use accessories which are listed in this manual and
which have been tested in combination with the device
(e.g. patient cables, electrodes, transducers, sensors,
consumables, etc.). If you use accessories or consumables
from other manufacturers, Marquette Hellige does not
guarantee safe operation or functioning of the device.
4 CardioSys V4.1 227 498 02-A
* The Marquette Hellige quality management system
complies with the DIN EN ISO 9001 and EN 46001
Standards.
Page 5

Introduction to CardioSys
1. Introduction to CardioSys
In this section you will find
– an overview of the CardioSys features and capabilities
and of the available software options
– a survey of the CardioSys system components
– points to note during system operation
– instructions on putting the system into operation
227 498 02-A CardioSys V4.1 5
Page 6

1.1 Program Features
Introduction to CardioSys
CardioSys is a PC-based system for ECG recording, spirometry tests and ambulatory blood-pressure examinations. The
following options are available to enhance the program functions:
Basic Software Package (RESB)
– 12-lead ECG acquisition (resting ECG, STAT ECG)
– recording of spirometry tests
– downloading of data from TONOPORT IV/IVa (am-
bulatory blood pressure)
– downloading of data from electrocardiographs EK 53,
EK 56, EK 512, CardioSmart
– data management for all operating modes
– BDT interface
Resting ECG Measurement (RESM)
– measurement of 12 ECG leads acquired simultaneously
– tabular presentation of the measured values
– editing of measuring marks
– direct comparison of 2 resting ECGs
3-Lead Exercise ECG (ERG1)
– 3-lead recording and display
– control of all Marquette Hellige ergometers
– creation of custom protocols and phases (depending on
ergometer model)
Upgrade for 12-Lead Exercise ECG (ERG2)
– optional recording of 3, 6 or 12 ECG leads
– 12-lead ST measurement
– automatic or manual determination of the J+X point
– presentation of the ST medians
– presentation of the resting ECG complex and of the
current ST beat for direct comparison
– arrhythmia analysis and presentation during the test
Storage of the Full-Disclosure ECG (EGMO)
– continuous storage of up to 12 ECG leads
– color-coded arrhythmias
– any segment of the full-disclosure ECG can be zoomed
and stored
Resting ECG Interpretation (RESI)
– interpretation of the measured resting ECG with detailed
explanations
– medication and the patient’s age are taken into account
– reanalysis after modification of the measuring marks
6 CardioSys V4.1 227 498 02-A
Exercise Test Expert Mode (ERG3)
– optional presentation of ST level and slope in the form
of a bar diagram or ST medians with reference marks
– manual editing of the E, J, and J+X points
– scrolling to previous stages during the exercise test
– direct cross-referencing from trends to full-disclosure
ECG (final report)
Page 7

Introduction to CardioSys
In-Test Reports (ESTA)
– automatic or manual printout during the exercise test via
laser printer or thermal printer
– report formats for laser printer: medians + 12-lead ECG
(approx. 4 seconds)
– report formats for thermal printer:
• 10-second segments of the 12-lead ECG in different
formats
• comparative medians + 12-lead ECG
• continuous rhythm (6 or 12 leads)
Late Potential Analysis (AVER)
– recording of ventricular late potentials
– recording of the standard vectors X, Y, Z (uncorrected)
– manual editing of QRS onset and offset
Data Storage on File Server (NETS)
– storage of the procedure data on the network file server
Monitoring of Remote Test Stations (ERGM)
– during the exercise test data are continuously sent via the
network
– the following data can be viewed at any of the work-
stations in the network:
• station name
• 6-lead ECG, leads selectable
• information on the exercise test and on the ergometer
• HR and blood pressure
• ST measurement results (resting beat, current beat)
Task List (OMAN)
– patient selection on task list
– task list created by host program (hospital information
system, medical reimbursement program, etc.)
– supports BDT format
– examination results are returned to the requesting system
ECG History (ECGH) requires hardlock
– display of the median beats from up to 5 selectable
resting ECGs for visual comparison or printout
– 3D presentation of the medians for serial comparison
Review Manager (REVM) requires hardlock
– users can review and confirm the examination results
– name of the physician who confirmed the results is
automatically entered in the patient file
– display of examination procedures according to different
criteria (confirmed, unconfirmed, all)
Cardio Mailbox (CBOX) requires hardlock
– transmission of multiple procedures via a modem to
CardioSys/CardioSoft
– storage of multiple procedures on storage medium
– reception of multiple procedures via a modem (from
CardioSys/CardioSoft or CardioSmart)
227 498 02-A CardioSys V4.1 7
Page 8
Introduction to CardioSys
1.2 System Configuration and
Function, Setting Up the PC
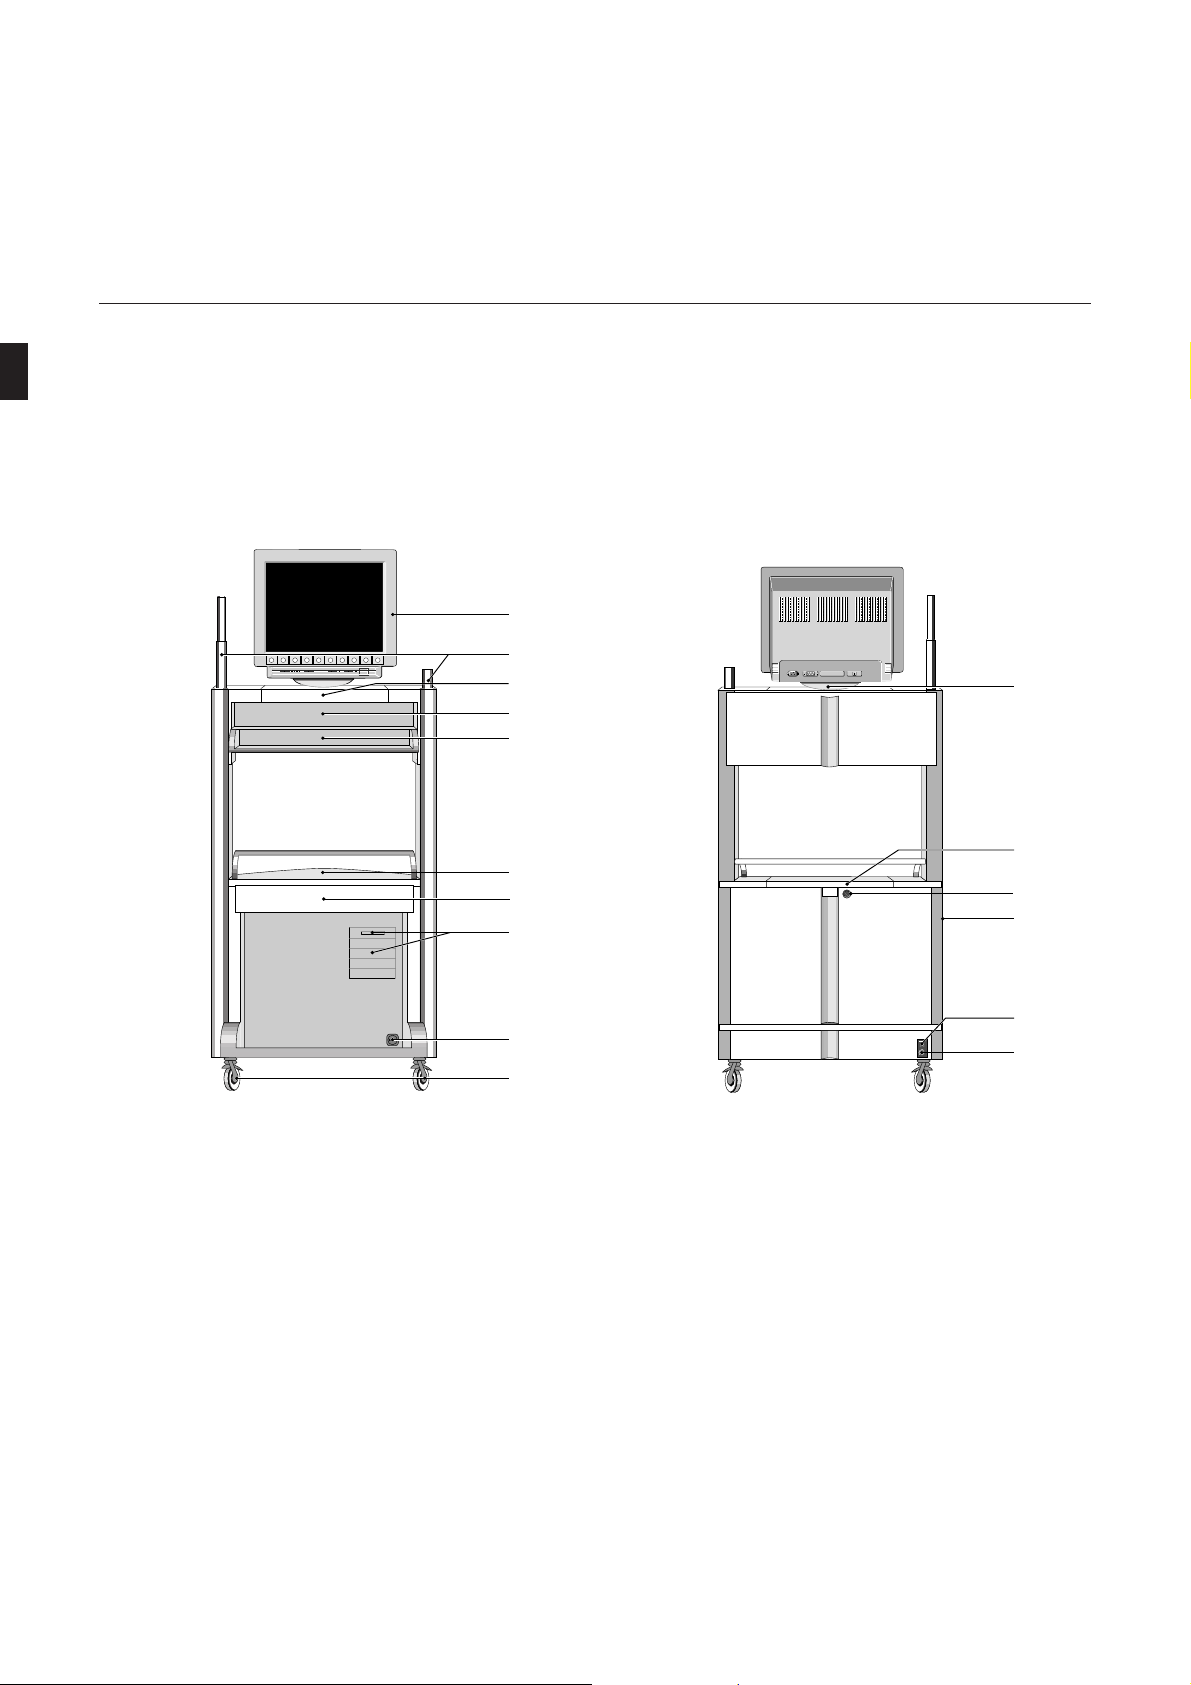
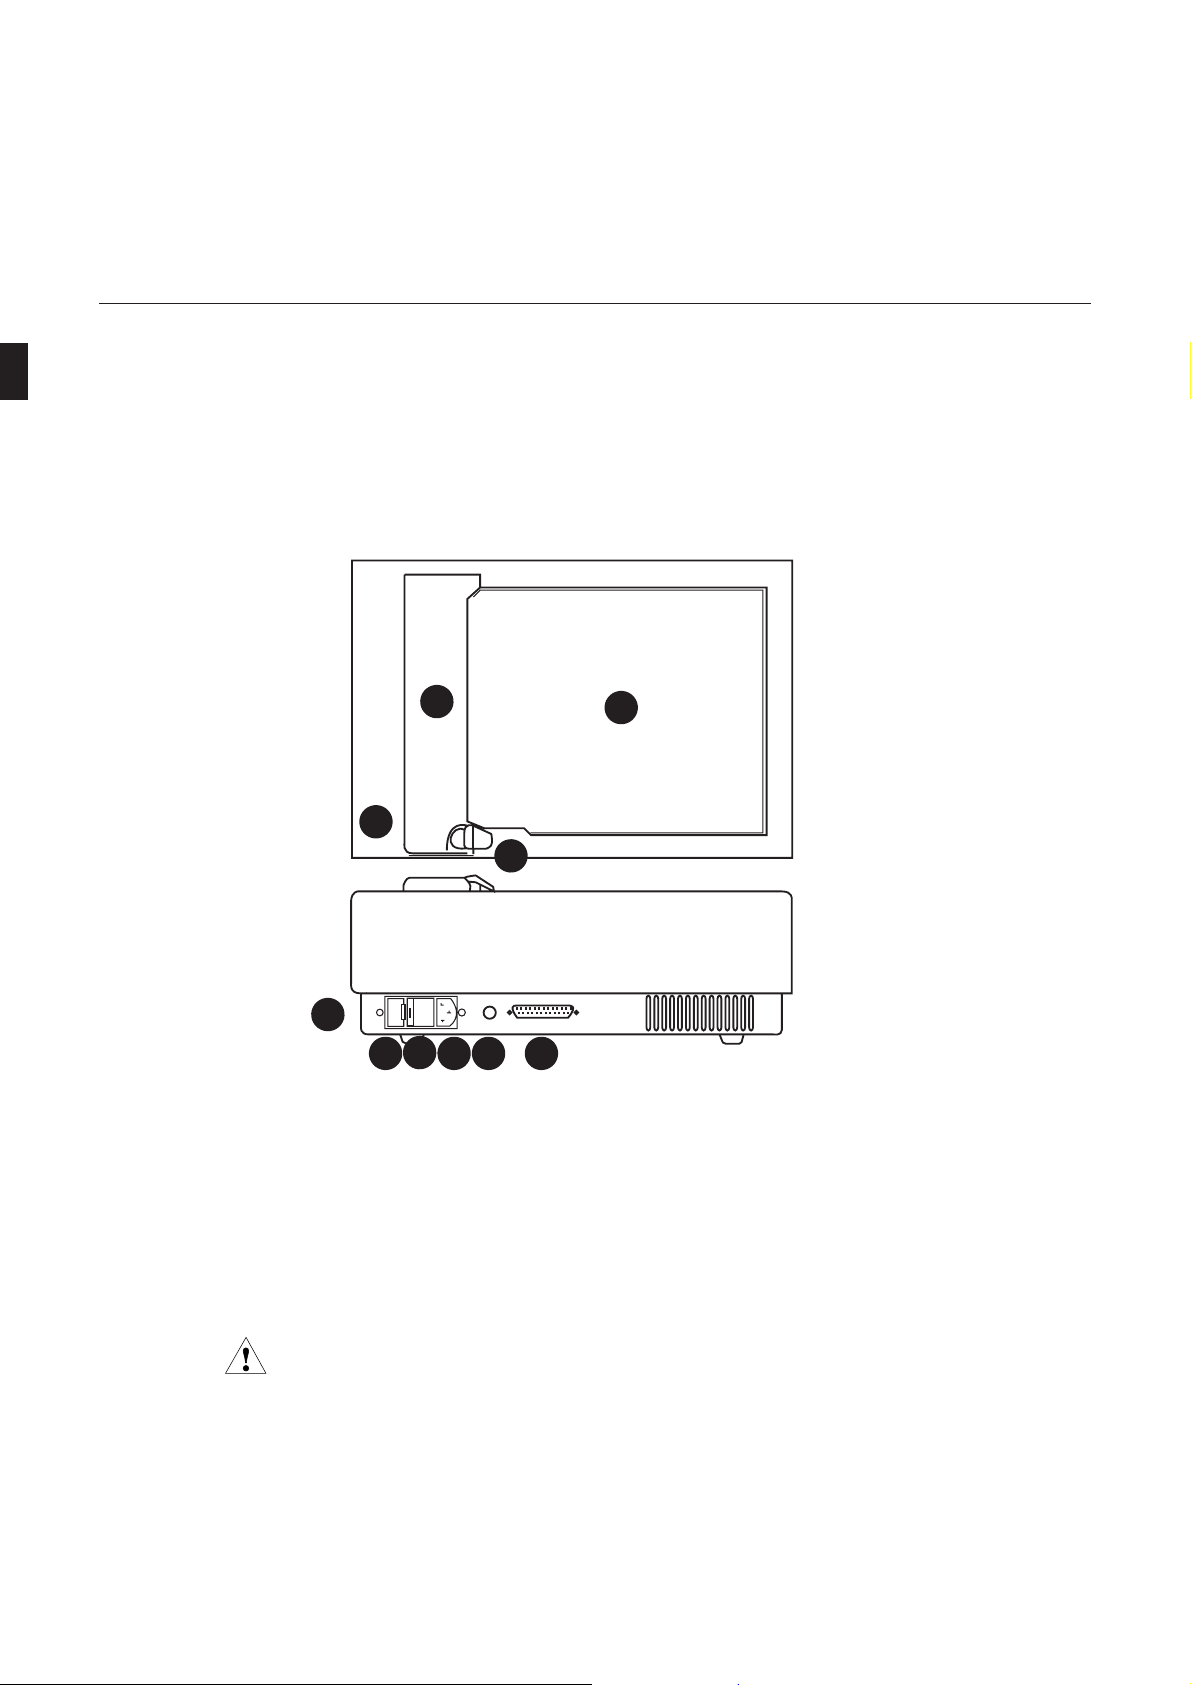
CardioSys is a system cart centering around a PC and software
programs. Figure 1-1 shows the CardioSys system cart.
1
F2 F3 F4 F5 F6 F7 F8 F9 F10F1
Figure 1-1. CardioSys system cart
1 Monitor
2 Supports for electrode application system or
respiration flow sensor
3 Monitor support
4 Tray for PC keyboard
5 Tray for function keyboard and mouse
6 Tray (e.g. for printer)
7 Accessory drawer
8 Power button, floppy disk drive and drive bays
(streamer, MO drive)
2
3
4
5
6
7
8
9
10
11
12
13
14
15
16
9 Shelf with power connector for defibrillator
10 Conductive castors (front castors locking)
11 Monitor retaining strip
12 Connection panel (under lid)
13 Lid lock
14 Power switch (removes power from the system)
15 Power input with instrument fuses
16 Potential equalization pin
8 CardioSys V4.1 227 498 02-A
Page 9
Introduction to CardioSys
g
The lid should only be opened by Marquette
Warnin
Hellige staff or by factory-trained personnel.
Biocompatibility
The parts of the product described in this operator
manual, including all accessories, that come in contact
with the patient during the intended use, fulfill the
biocompatibility requirements of the applicable standards. If you have questions in this matter, please contact Marquette Hellige GmbH or its representatives.
The system comes pre-installed and is ready for operation.
All connections for system components and peripheral devices
(including the patient cable) are located under the lid (12)
which can be opened with a tool only.
The program is a Windows application. Its scope can be
expanded by activation of individual optional programs. This
manual describes the program with all options included. If
you have not purchased one or the other option, simply skip
the corresponding sections.
Being familiar with PC programs may be a help, but in this
manual you will find everything you need to know about
using a mouse and a PC keyboard.
Whenever you are unsure about a program function or operating step, just click on the Help button to obtain online
information.
Access to the program is restricted to registered users. At the
time a user is registered, the password and the user’s rights are
assigned (user, physician, with or without the right to make
system changes).
227 498 02-A CardioSys V4.1 9
Page 10
1.3 For Your Safety
g
g
Introduction to CardioSys
The safety information given below is divided into the categories “Danger”, “Warning” and “Caution”.
indicates an imminently hazardous situation
which, if not avoided, will result in death or
Danger
serious injury.
indicates a potentially hazardous situation
which, if not avoided, could result in death or
Warnin
serious injury.
indicates a potentially hazardous situation
which, if not avoided, may result in minor or
Caution
moderate injury and/or damage to the equipment.
provides application tips or other useful informa-
☞
tion to assure that you get the most from your
equipment.
CardioSys is a class I system.
☞
Before connecting the device to the power line,
check that the voltage and frequency ratings of
Caution
the power line are the same as those indicated
on the system’s nameplate. If this is not the
case, do not connect the system to the power
line.
Do not use extension cables with multiple
Warnin
power outlets to connect the system to the
power line.
Before putting the system into operation visually inspect all connecting cables for signs of
Danger
damage. Damaged cables and connectors must
be replaced immediately.
When disconnecting the system from the power
line, remove the plug from the wall outlet first.
Danger
Then you may disconnect the power cord from
the device. If you do not observe this sequence,
there is a risk of coming into contact with line
voltage by inserting metal objects, such as the
pins of electrode leads, into the sockets of the
power cord by mistake.
10 CardioSys V4.1 227 498 02-A
Page 11
Introduction to CardioSys
g
g
g
g
g
Caution
Warnin
Warnin
CardioSys can be operated on an uninterruptible power supply (UPS). The UPS should
not be disconnected from the power line for
prolonged periods of time to prevent deep
discharging of the battery. For this reason,
switch the CardioSys system off and on with the
system’s own power switch and do not use the
switch of the UPS or the main power switch of
the office.
As a general rule, the UPS must first be connected to the power line and switched on; then
you may switch on CardioSys.
Do not switch on the CardioSys system during
a power outage.
Only the CardioSys system may be connected to
the UPS.
The UPS must be installed within the medically used room, but outside the patient environment.
Observe the information given in the UPS user
manual.
The power socket of the CardioSys system cart
is reserved for a defibrillator for recharging of
the defibrillator battery (max. power 30 VA).
All devices of a system must be connected to the
same power supply circuit. Devices which are
not connected to the same circuit must be
electrically isolated when operated (electrically
isolated RS232 interface).
Set up the device in a location which affords
sufficient ventilation. The ventilation openings
Caution
of the device must not be obstructed. The
ambient conditions specified in the “Technical
Specifications” section must be ensured at all
times.
The system should be set up to provide the opera-
☞
tor an unobstructed view of the control panel.
Devices intended for emergency application
must not be stored or transported at tempera-
Danger
tures which cause moisture condensation at the
application site. Wait until all moisture condensation has evaporated before using the
device.
If the system is used as an emergency device, a
Warnin
second ECG recorder must be available.
The device is not intended for intracardiac
Warnin
application.
The device is not suitable for operation in areas
Warnin
where an explosion hazard may occur. Explosion hazards may be caused by the use of flammable anesthetics, skin-cleansing agents and
disinfectants. Great care must be exercised
when the monitor is used in an oxygen-enriched
atmosphere. The atmosphere is considered to be
oxygen-enriched when the room air contains
more than 25% of oxygen or nitrous oxide.
227 498 02-A CardioSys V4.1 11
Page 12
Introduction to CardioSys
g
g
g
g
g
g
Warnin
Warnin
Warnin
Warnin
The patient signal input is labelled with the
symbol, indicating that it is protected
against damage resulting from defibrillation
and electrocautery. Nevertheless extreme care
must be taken when devices which are directly
connected to the patient remain applied during
defibrillation. The distance between ECG electrodes and defibrillation paddles should be at
least 6 in./15 cm. If in doubt, disconnect the
patient cable from the device while applying the
defibrillation pulse.
Magnetic and electrical fields are capable of
interfering with the proper performance of the
device. For this reason do not operate the
system in the vicinity of equipment emitting
strong electromagnetic radiation (X-ray equipment, diathermy systems or MRI devices).
Only use the original Marquette Hellige patient cable. Do not connect other signal sources
to the cable.
With all peripheral devices connected,
CardioSys represents a medical system. It
fulfills the requirements of the system standard
IEC 60601-1-1. The entire system may be
operated in the patient environment.
Warnin
Danger
Warnin
If the system cart is installed in the patient environment, only the special printer modified by
Marquette Hellige and equipped with an additional protective earth connection (potential
equalization) may be operated. Observe the assembly instructions supplied with the printers.
For stress-test examinations, a defibrillator
and a pacemaker, regularly checked for proper
functioning, must be readily accessible.
Extreme care must be exercised when using
medical electrical equipment. Many parts of
the man/machine circuit are conductive, such
as the patient, connectors, electrodes, transducers. It is very important that these conductive parts do not come into contact with other
grounded, conductive parts when connected to
the isolated patient input of the device. Such
contact would bridge the patient’s isolation
and cancel the protection provided by the
isolated input. In particular, there must be no
contact of the neutral electrode and ground.
12 CardioSys V4.1 227 498 02-A
Page 13
Introduction to CardioSys
g
g
g
g
g
Warnin
Danger
Devices may only be interconnected with each
other or to parts of systems when it has been
made certain that there is no danger to the
patient, the operators, or the environment as a
result. In those instances where there is any
element of doubt concerning the safety of
connected devices, the user must contact the
manufacturers concerned or other informed
experts as to whether there is any possible
danger to the patient, the operator, or the
environment as a result of the proposed combination of devices. Standards IEC 60601-1-1/
EN 60601-1-1 must be complied with in all
cases.
Liquids must not be allowed to enter the devices. Devices into which liquids have penetrated must be checked by a service technician
before being used again.
Medical technical equipment such as the
☞
CardioSys system must only be used by persons
who have sufficient knowledge, who have received
adequate training in the use of such equipment
and who are capable of applying it properly.
Before using the system, the operator is obliged
Warnin
to verify that it is in correct working order and
operating condition.
The operator must be familiar with the operation of the system.
Caution
Verify the performance of the system once a
month.
Caution
Dispose of the packaging material, observing
Warnin
the applicable waste control regulations and
keeping it out of children’s reach.
Chemicals required for the application or
maintenance of the devices must under all
Danger
circumstances be stored, prepared and kept at
hand in the containers provided by the manufacturer. Failure to observe this instruction
At the end of its service life, CardioSys and its
accessories must be disposed of in compliance
Caution
with the applicable waste control regulations.
If you have any questions in this matter, please
contact Marquette Hellige GmbH.
may result in severe consequences for the pa-
Warnin
tient.
Warnin
CardioSys is not intended for use as a vital
signs physiological monitor.
Only use bicycle ergometers and treadmills that
fulfill the applicable IEC 60601-1 requirements. CardioSys and the associated bicycle
ergometer or treadmill must be connected to
the same power supply circuit via separate wall
outlets.
227 498 02-A CardioSys V4.1 13
Page 14

Introduction to CardioSys
g
Warnin
Only modems complying with the requirements
of IEC 60950 or UL1950 may be connected to
the system. Furthermore, the regulations applicable in the respective countries must be observed.
The modem must be set up inside the medically
used room, but outside the patient environment.
Literature
Medical Device Directive
EN60601-1/1990 + A1:1993 + A2:1995: Medical electrical
equipment. General safety standards
EN60601-1-1/9.1994 and A1 12.95: General safety standards. Standards for the safety of medical electrical systems.
IEC Publication 513/1994: Fundamental aspects of safety
standards for medical equipment.
ROY, O.Z.: Summary of cardiac fibrillation thresholds for
60-Hz currents and voltages applied directly to the heart.
Med. & Biol. Engn. & Computing 18: 657...659 (1980).
14 CardioSys V4.1 227 498 02-A
Page 15

Introduction to CardioSys
1.4 Putting the System Into Operation, Testing the Performance
* Before using the system for the first time, please read the
information given in section 1.3 “For your Safety”.
* Turn on power with the main power switch (14).
* Switch on the system with the power button on the front
panel (press for approx. 1 second).
Upon power up the PC runs automatic self tests. When the
program detects any malfunctions, an error message is displayed. If no problem exists, you will see the usual Windows
screen.
The ECG program too runs a self test when a signal acquisition screen is called up. If you do not see any error messages,
the program and the computer are intact. Error messages may
also appear during program operation.
– Do not run more than one other Windows application
at the same time as CardioSys.
– Do not activate a Windows screen saver.
– Run a daily backup of your data (Appendix, sec-
tions 3.1).
– Quit the program in the prescribed manner (Chapter 5.
“Deleting Examinations, Quitting the Program”) before
switching off the system with the power button (8).
Turn off power with the main power switch (14) only
when the CardioSys cart will not be used for a prolonged
period of time
227 498 02-A CardioSys V4.1 15
Page 16
Introduction to CardioSys
1.5 Putting the Thermal Printer AR 200 Into Operation
Controls and indicators of the thermal printer are shown in
Figure 1-2.
2
1
3
5
7
6
Figure 1-2. Controls and indicators of the thermal printer
1 Green indicator, is lit when the printer is
connected to the power line
Yellow indicator, is lit to indicate a problem
2 Paper guide
3 Paper tray door latch (lift latch to open door)
4 Paper tray door (the printer stops when the door
is opened)
When the door is open, take care to
Caution
insure no small objects enter the printer.
910
8
4
5 Specification labels
6 Instrument fuses
7 Power button (printer is turned on with the
system’s main power switch)
8 Power input
9 Potential equalization pin
10 Parallel port
Top View
Rear Panel View
16 CardioSys V4.1 227 498 02-A
Page 17
Introduction to CardioSys
Caution
Explanation of Symbols as Used on the Printer
printer problem
interface
T3, 15A/250V
fuse
Chart-Paper Loading
Before loading chart paper, make sure that the
printer is switched off (button 7, Figure 1-2).
Caution
The indicators will go off after a few seconds.
* Pulling upward on the paper tray door latch (3, Figure
1-2), open the paper tray door.
* Remove the cardboard backing of the old pad.
* When inserting the new pad, be aware of the following
points:
– the last sheets of the paper pad have a red stripe, so
this side of the pad should be at the bottom of the
tray
– the black squares should be facing down and lo-
cated on the side of the printer nearest the paper
tray door latch
– place the pad, including the cardboard backing, on
the tray and remove the cardboard on the top.
* Pull the first sheet of the pad straight out over the paper
guide, at the same time closing the paper tray door.
* Turn on the printer.
Do not attempt to operate the printer without
thermal paper.
Do not pull on the sheets to remove them from
the printer.
After loading a new pad, press keys
)
+
to ensure that the next printout
9 ]
Ctrl
+
starts at the top of the page.
The thermal printer AR 200 does not require
an additional protective earth connection
Caution
(device in compliance with IEC 60601).
227 498 02-A CardioSys V4.1 17
Page 18
Introduction to CardioSys
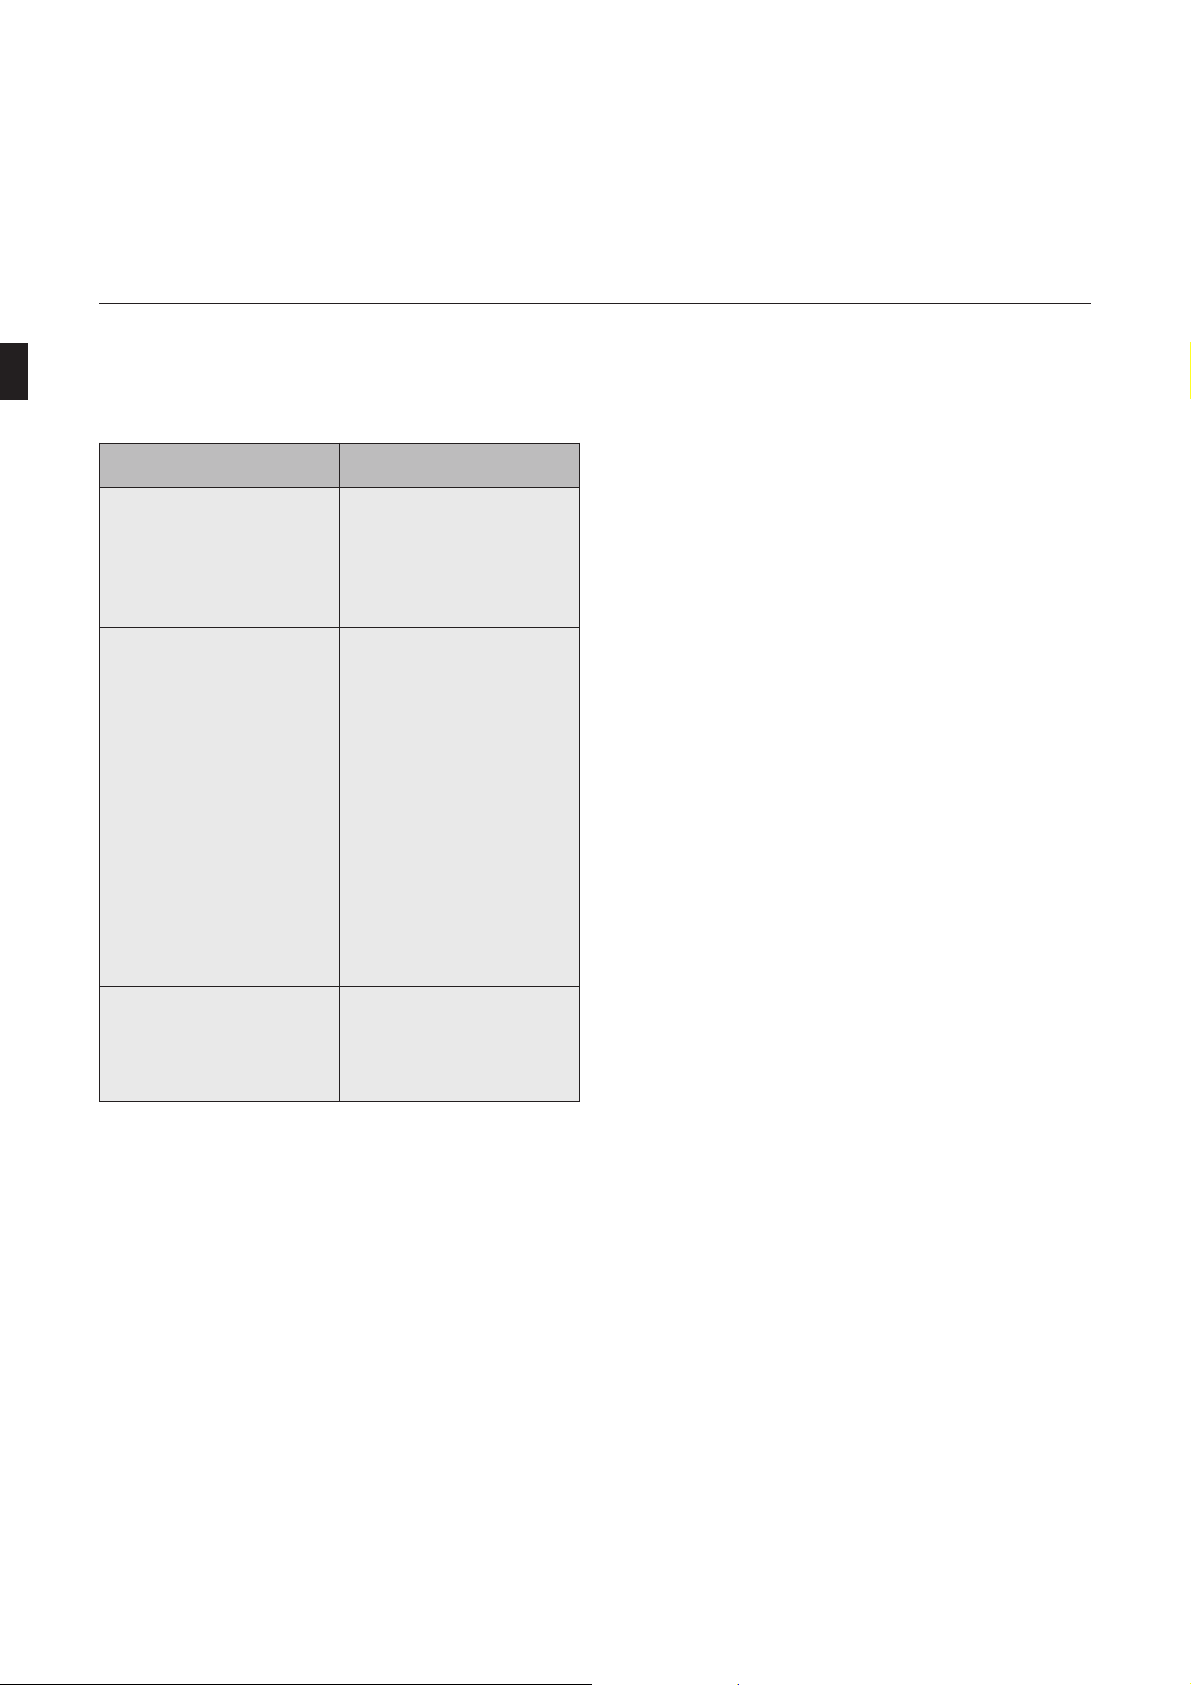
Printer Problems (Thermal Printer)
melborP ydemeR
neergdnatnirptonseoD
delebalDEL rewoP tonseod
thgil
.no
neergdnatnirptonseoD
delebalDEL rewoP tilsi
.repapfo
tubrepapsevomrepaP
tnirptonseodredrocer
Reinstalling the Thermal Printer Driver
Usually the printer driver is installed. If it needs to be reinstalled, proceed as follows:
sielbacrewoptahtkcehC
.detcennocylreporp
sySoidraCehtfikcehC
.nosirewopmetsys
neewtebselbackcehC
dnametsyssySoidraC
-erotdeenyaM(.retnirp
).metsysehttoob
tuosiretnirpehtfikcehC
ehtrednuthguacsparcs
.daehtnirp
sahrepaptahtkcehC
.kramnoitanigaptcerroc
* Exit the application to Windows.
sihctiwsrewoptahtkcehC
* From the Program Manager screen, call up
– Main Group
– Control Panel
– Printers.
* Select “Add Printer”.
* Select “Install unlisted or updated driver”.
* Select “Install...”.
repapynaeraerehtfikcehC
* Place the disk with the printer driver into the diskette
.dedaolyltcerrocnisirepaP
drive and click on “OK”.
* Check the “Default printer” box.
* Select “Close”.
* Restart the application.
18 CardioSys V4.1 227 498 02-A
Page 19

General Information on System Operation
2. General Information on System
Operation
This section describes some basic facts on program operation. You will learn
– how to use the program with a mouse
– how to enter data via the PC keyboard
– how to start the program
– how to select the language
227 498 02-A CardioSys V4.1 19
Page 20
General Information on System Operation
2.1 Operating the Program with a
Mouse
All operating steps required to run the program can be performed with a mouse. The screen layout permits swift program operation, and text entries via the keyboard have been
reduced to a minimum. The system allows you to create
libraries for various situations, which you can copy from the
list to the respective text boxes in a dialog window, using the
mouse.
If you are already familiar with the functions and handling of
a PC mouse, you can skip this paragraph.
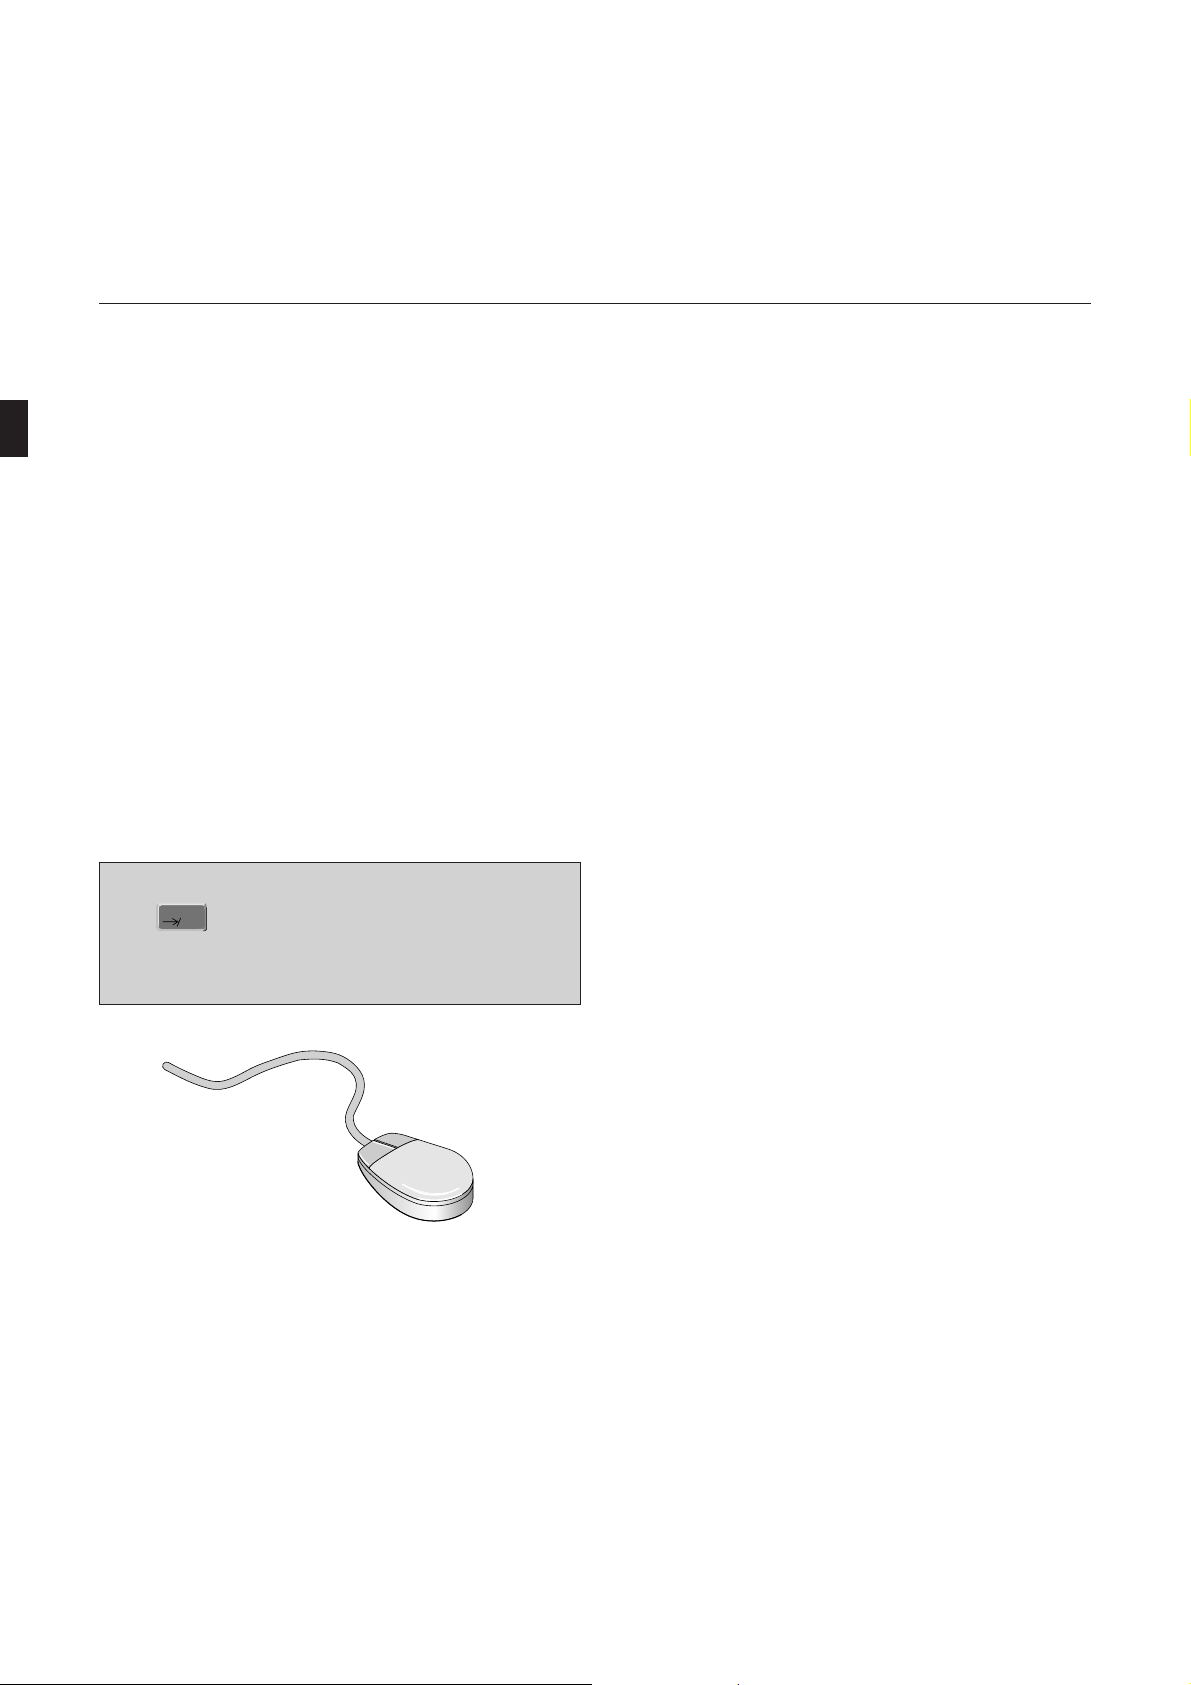
Some General Remarks on the PC Mouse
When entering text via the keyboard, use the
☞
key to move from text box to text box. This
will save time as your hands can stay on the
keyboard all the time.
Figure 2-1. Mouse buttons
20 CardioSys V4.1 227 498 02-A
An arrow or mouse pointer appears on all screens. This
mouse pointer moves around on the screen as you move the
mouse on the table. Sliding the mouse to the right, for instance, shifts the pointer to the right.
The program can be used with a two or a three-button mouse
(Figure 2-1). The buttons are operated with the index finger
and the middle finger. The left button (index finger) controls
almost all functions, while the right button (middle finger) is
seldom used.
Page 21
General Information on System Operation
Patient
Procedure System Services Help
Baker, Dave, 41yrs REST ECG/ Signal Acquisition
Test Information
Setup
aVR
aVL
aVF
X 35 HZ X 50 HZ
Hellige
Freeze ECG Options
10 mm/mV
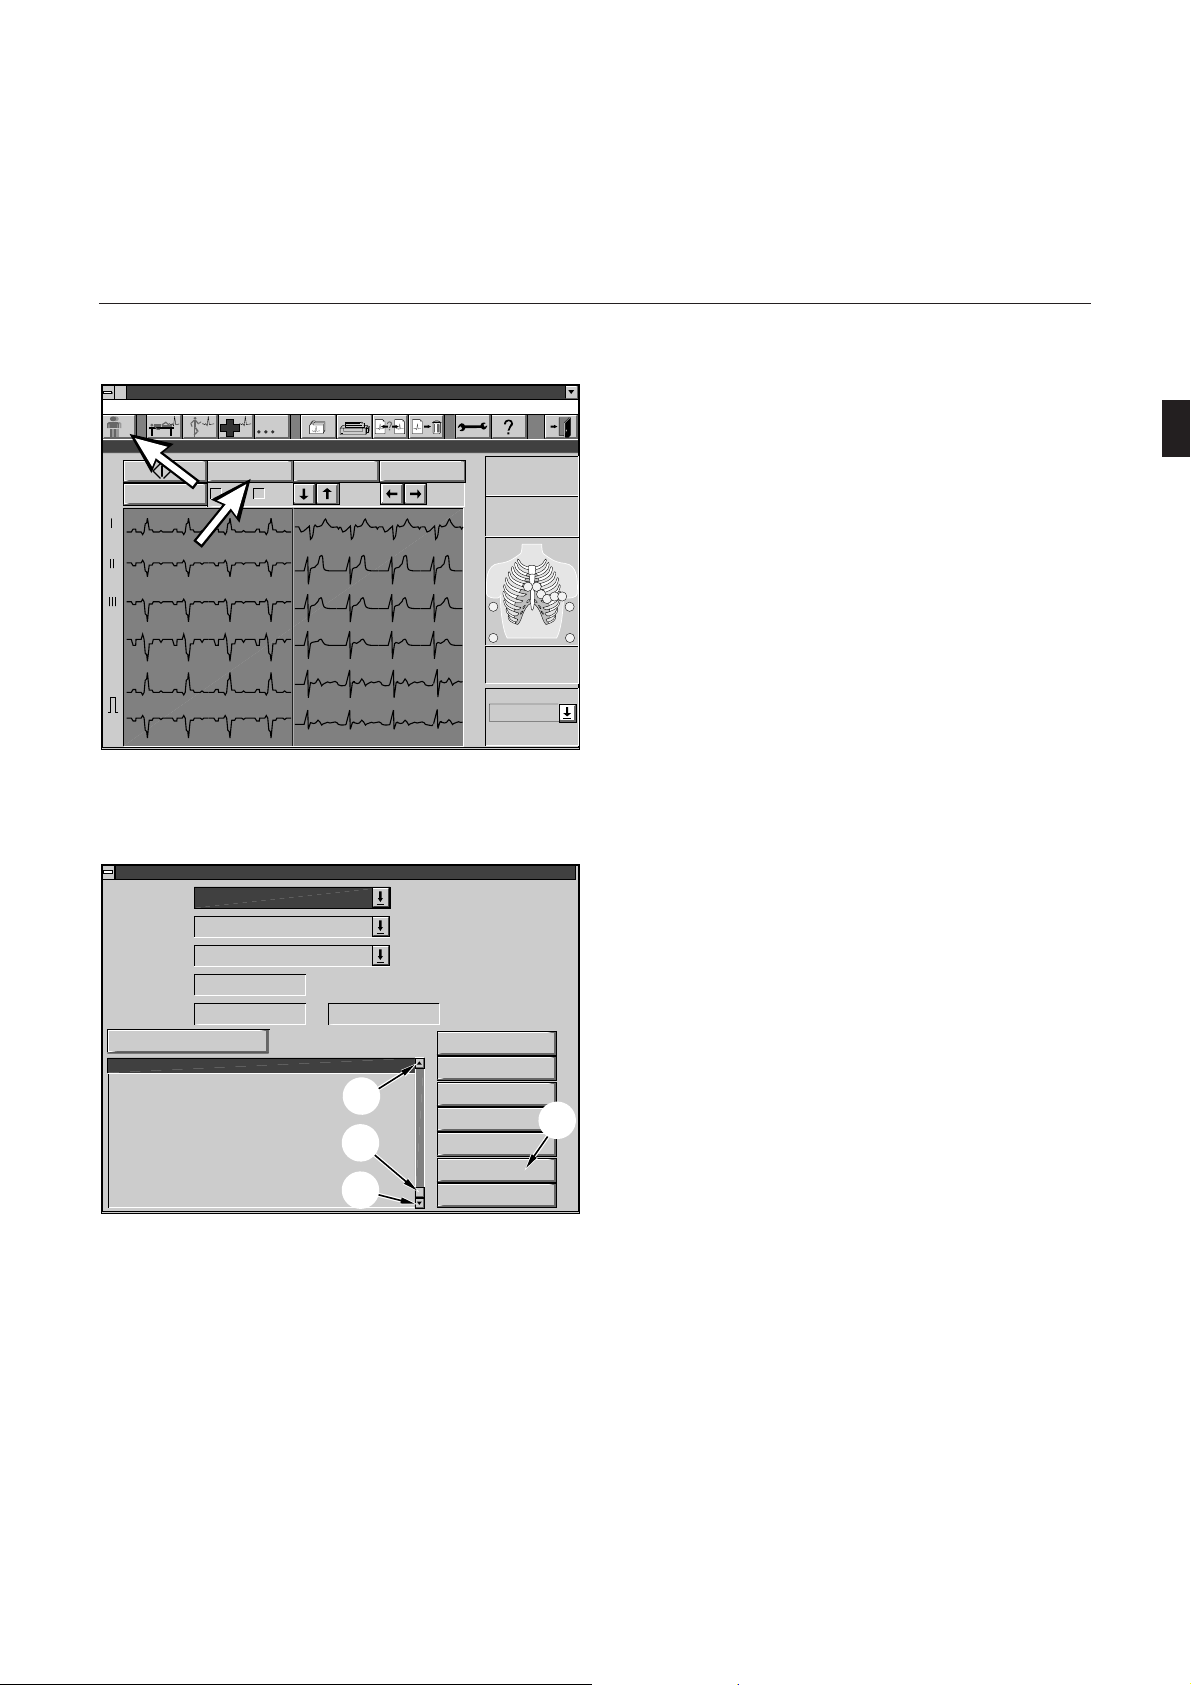
Figure 2-2. Screen with operating controls
Select Procedure
Patient
Procedure all
Status
Location
Date (from - to)
Show new procedure list
12/04/1996 03:38:17pm 0 Exercise Test
12/04/1996 03:29:24pm x 0 Exercise Test
12/04/1996 03:10:13pm 0 Exercise Test
12/04/1996 03:00:11pm * 0 Exercise Test
11/20/1996 10:53:39am 0 Exercise Test
Baker, Dave, 41yrs
all
-
1
3
2
Figure 2-3. Excerpt from the procedure list
1 moves the list down (line by line)
2 moves the list up (line by line)
3 allows you to scroll to a general location in the list
4 clears the window without saving entries
»
25 mm/s
V1
V2
V3
V4
V5
V6
Combined Report…
HR (BPM)
SYS/DIA (mmHg)
R
Lead Sequence
STANDARD
Display
Confirm
Send
Delete
Cancel
Help
1 2
Spline
ON
3
85
5
4
4
The icons displayed on the monitor screen resemble the
operating controls on a conventional ECG recorder
(Figure 2-2).
To select a function you place the mouse pointer on the
respective icon and press the left mouse button. You will see
that the key on the screen is “pressed” at the same time.
6
L
Pressing a mouse button is also called “clicking”. When, later
FN
on in this manual, you are asked to “double-click” this means
that you should press the left mouse button twice in rapid
succession.
On many screens you will see windows offering various
selections (Figure 2-3).
To select an option, move the mouse pointer to the item and
press the left mouse button. This selects the item, and the
window disappears.
When a list of selections is too long to fit in the window, the
window has a scroll bar at its right edge. Clicking the arrow at
the upper end of the scroll bar moves the list down one by
one (1, Figure 2-3), clicking the lower arrow moves the list up
(2, Figure 2-3).
A so-called scroll box between the two arrows allows you to
move quickly through the list by clicking the scroll box,
holding the mouse button depressed, and dragging the box up
or down (3, Figure 2-3).
227 498 02-A CardioSys V4.1 21
Page 22
General Information on System Operation
Select Procedure
Patient
Procedure all
Status
Location
Date (from - to)
Show new procedure list
12/04/1996 03:38:17pm 0 Exercise Test
12/04/1996 03:29:24pm x 0 Exercise Test
12/04/1996 03:10:13pm 0 Exercise Test
12/04/1996 03:00:11pm * 0 Exercise Test
11/20/1996 10:53:39am 0 Exercise Test
Baker, Dave, 41yrs
all
-
1
3
2
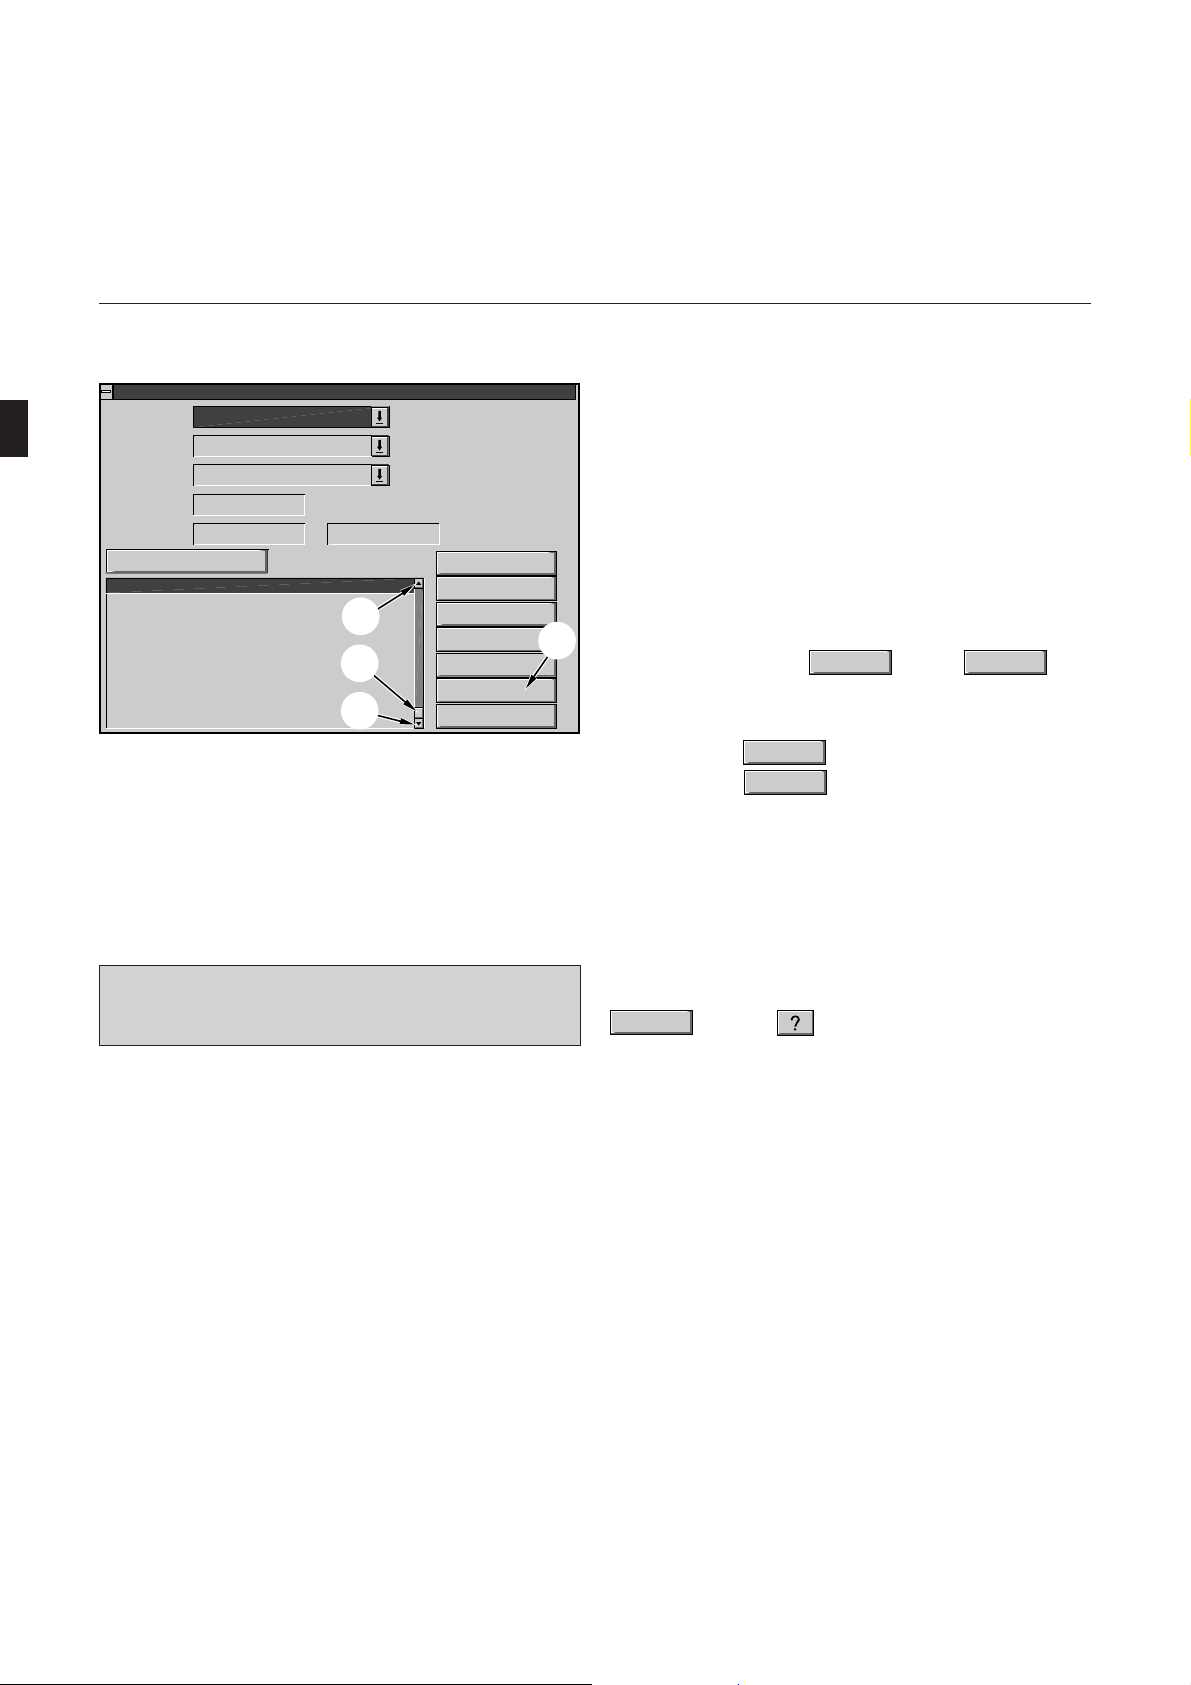
Figure 2-3. Excerpt from the procedure list
1 moves the list down (line by line)
2 moves the list up (line by line)
3 allows you to scroll to a general location in the list
4 clears the window without saving entries
Display
Confirm
Send
Combined Report…
Delete
Cancel
Help
The scroll box also indicates which section of the list is currently displayed. If the box is just below the upper arrow you
see the top portion of the list, if the box is in the middle of
the scroll bar, the middle portion of the list is on display, etc.
When you see an horizontal scroll bar below a picture, the
two arrows and the scroll box allow you to shift the picture
left or right.
4
Some screens which offer various selections can be cleared by
two methods: either with
OK
or with
Cancel
(Figure 2-3).
When you select
tions made, with
OK
the program accepts the selec-
Cancel
, the selections will be ignored.
If you wish to highlight text click the first letter of the text
block, hold the left mouse button down and drag the pointer
to the last letter. Then release the mouse button. The marked
text is displayed in reverse video.
You clear the HELP window by clicking “File”
☞
and “Exit”.
To obtain information on program operation, click the
Help
button or .
22 CardioSys V4.1 227 498 02-A
Page 23
General Information on System Operation
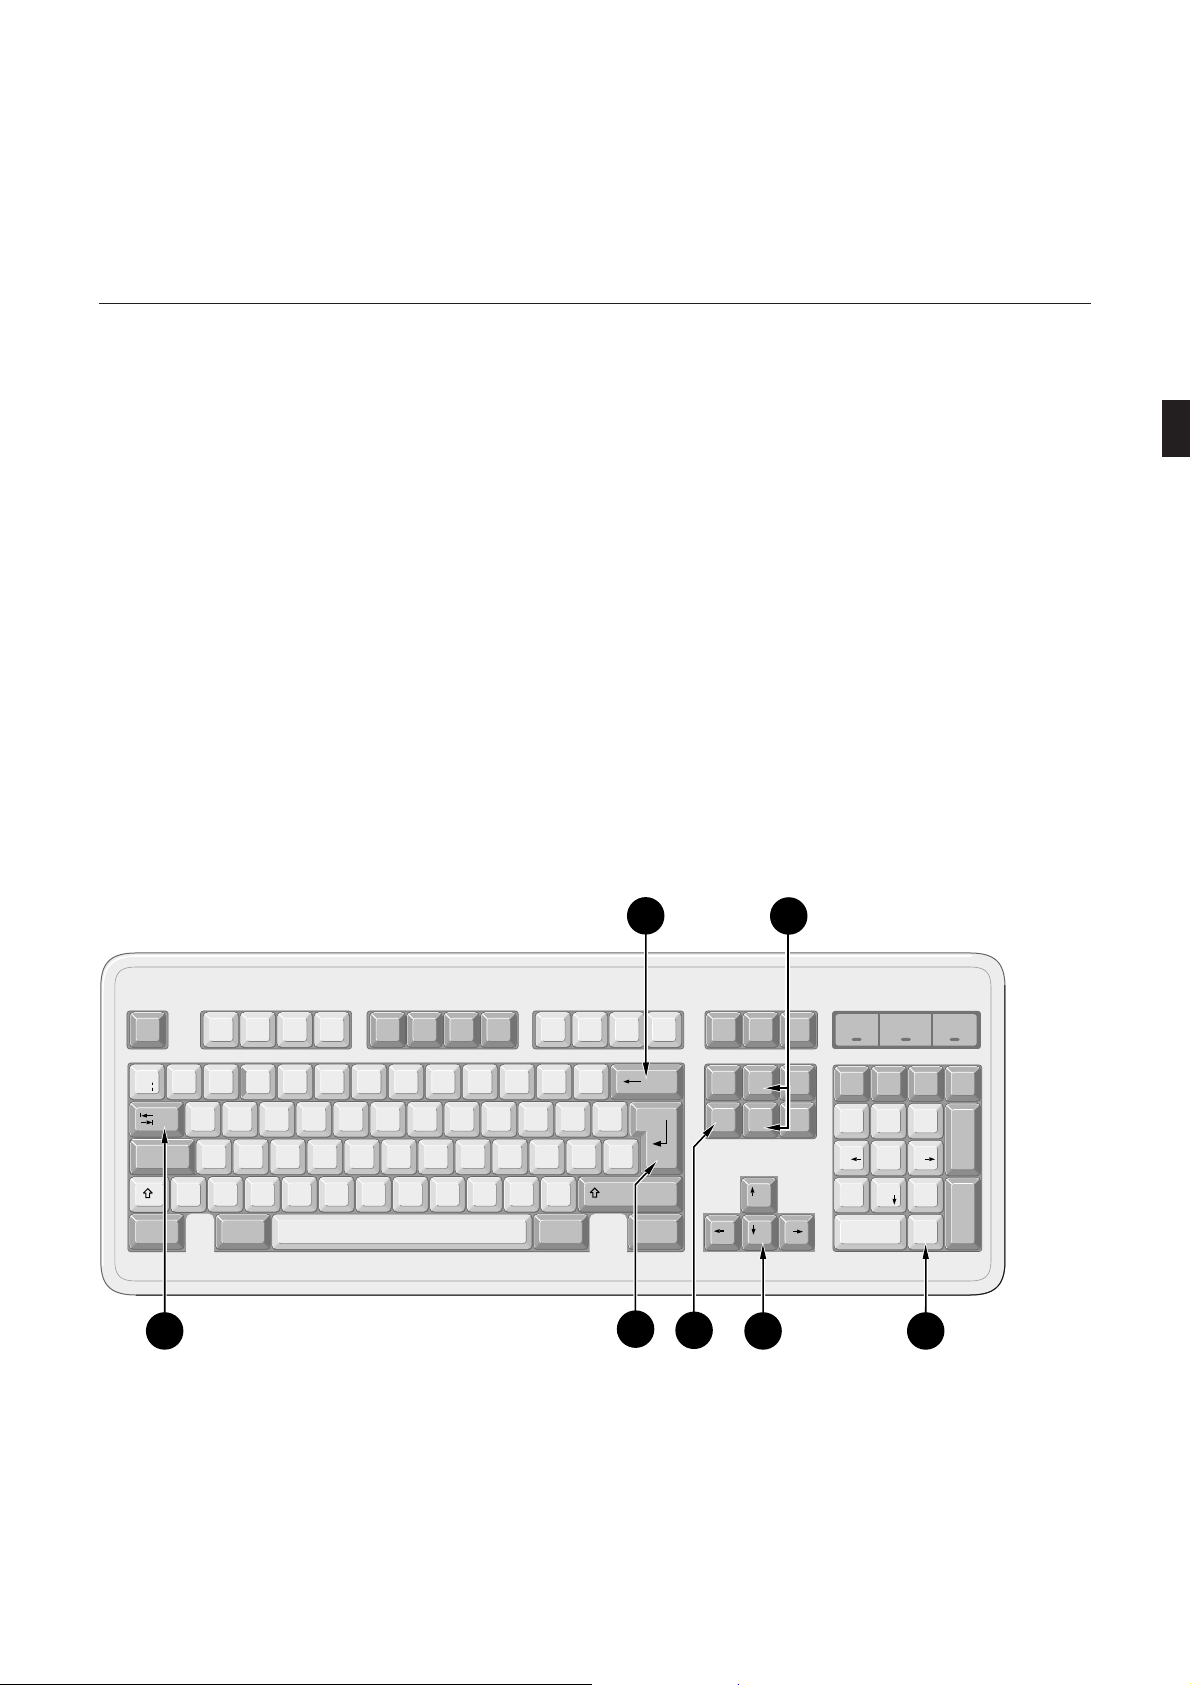
2.2 The Most Important Keyboard
Controls
Use the keyboard to enter text and numbers. The following is
a description of functions which you do not know from a
conventional typewriter. If you are already familiar with a PC
keyboard, you may skip this section.
* The Backspace key (1, Figure 2-4) clears the characters
from left to right, one by one.
* The cursor keys (5, Figure 2-4) are used to move the
cursor up, down, right and left to any desired position in
the text, for instance, to insert text (Ins key)
F6F5 F7 F8F2F1 F3 F4 F10F9 F11 F12Esc
* or to delete text (Del key) (3, Figure 2-4).
* The Home and End keys (2, Figure 2-4) move the
cursor to the first and last position in the text.
* With Return (4) and on Windows screens with TAB (6)
you move the cursor to the beginning of a new, blank
line.
Scroll
Lock
2
Num
Lock
Caps
Lock
Scroll
Lock
1
Print Pause
¬
!
1"2£3$4
`
Caps Lock
|
\
%
5
&
^
6
7*89)0_-
MNBVCXZ
(
<,>
LKJHGFDSA
.
+
=
}
{
POIUYTREWQ
:
;
]
[
~
@
#
'
?
/
CtrlCtrl Alt GrAlt
4
Insert
Delete
3
Home
End
Page
Page
Down
÷
Num
Up
Lock
Home
O
Ins
x
987
PgUp
654
321
PgDn
,
Del
356
_
+
Enter
Figure 2-4. The keyboard
227 498 02-A CardioSys V4.1 23
Page 24
Start program
Start program
marquette HELLIGE CardioSoft (Supervisor)
120/80
General Information on System Operation
2.3 Starting the Program,
Explanation of the Function
Keys and Selecting the
Language
marquette HELLIGE CardioSoft
4.1e
Figure 2-5. Title screen
When the password function is enabled (section
☞
6.1 “System Configuration –> General”) enter the
user name and password first.
The program may be configured to default to an
☞
operating mode, such as resting ECG. In this case
you will see the patient selection screen instead of
the title screen. Chapter 3 “Selecting and Admitting a Patient” explains how to retrieve a patient
from the database.
Starting the Program
* Turn on the system and start the program by double-
clicking on . The title screen (Figure 2-5) appears.
When the password function is enabled in the System
Configuration (tab “General”), you will see the user
registration window.
Enter the name and password and click on the
button.
24 CardioSys V4.1 227 498 02-A
Page 25
General Information on System Operation
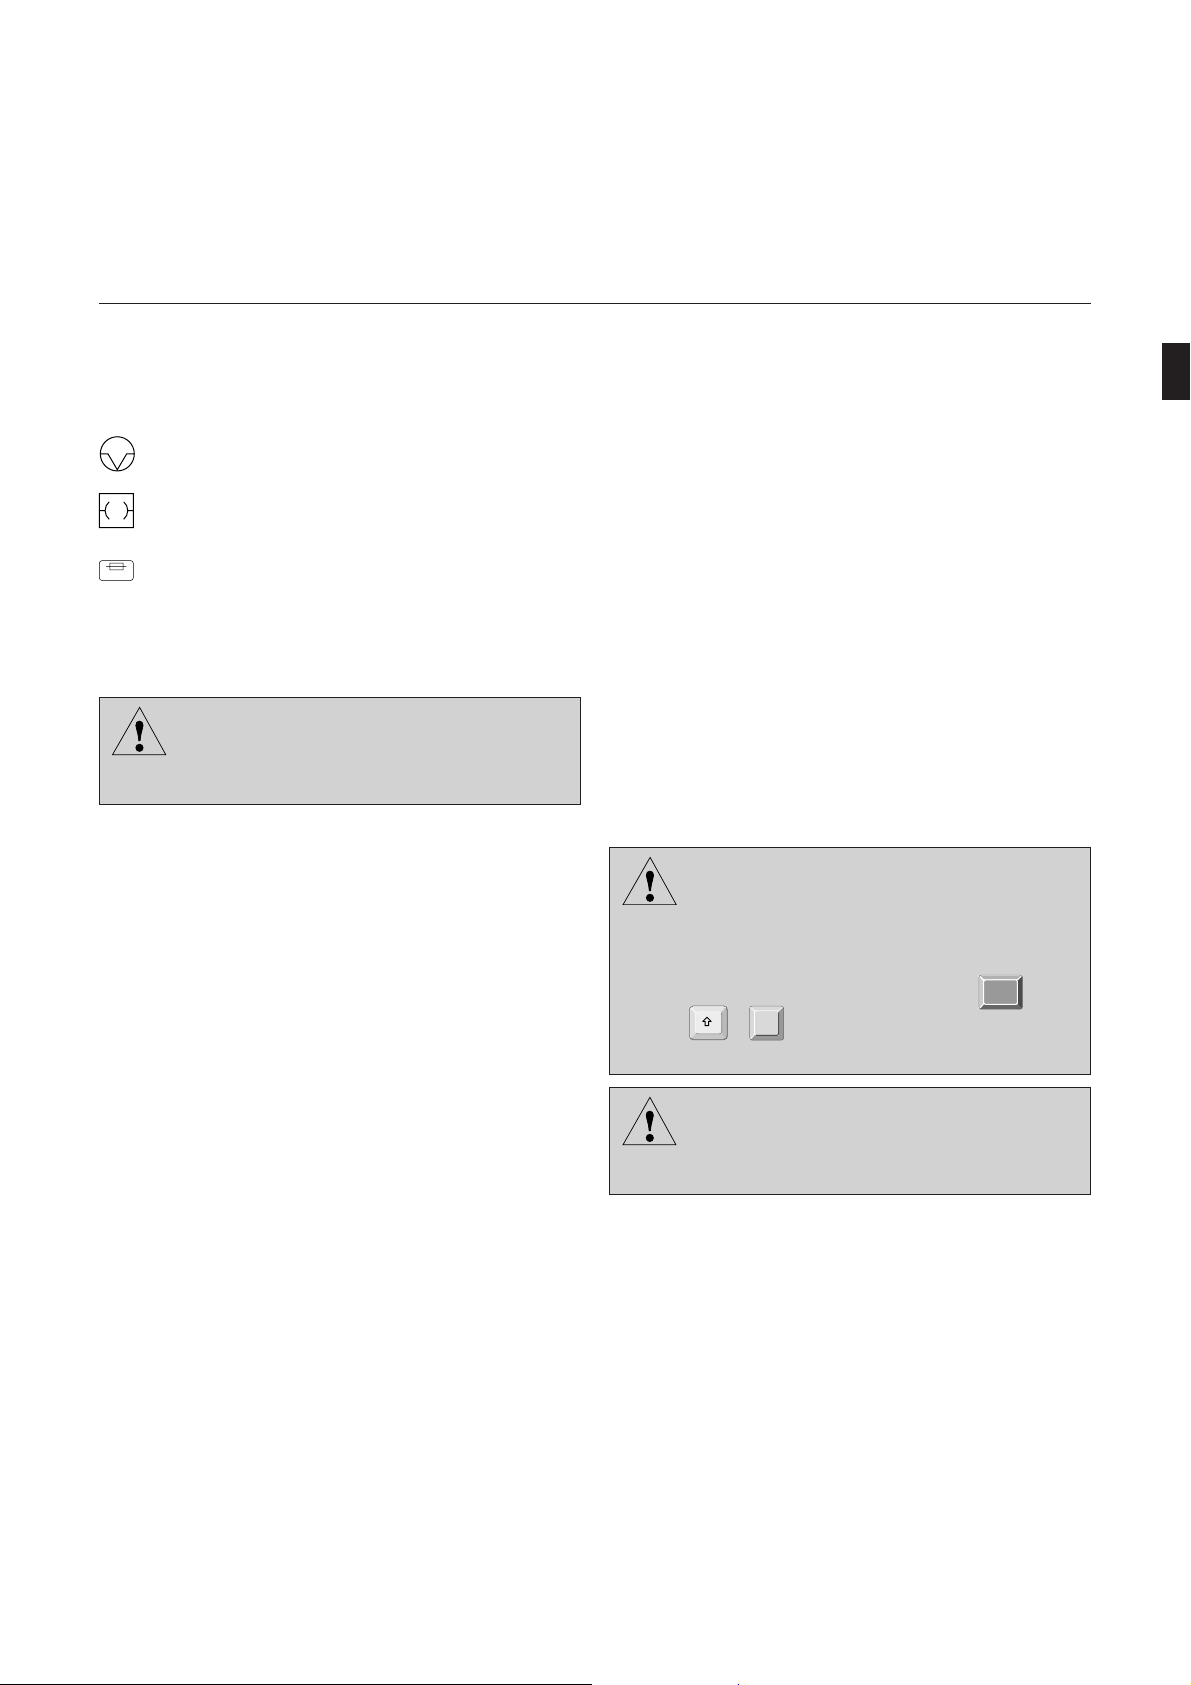
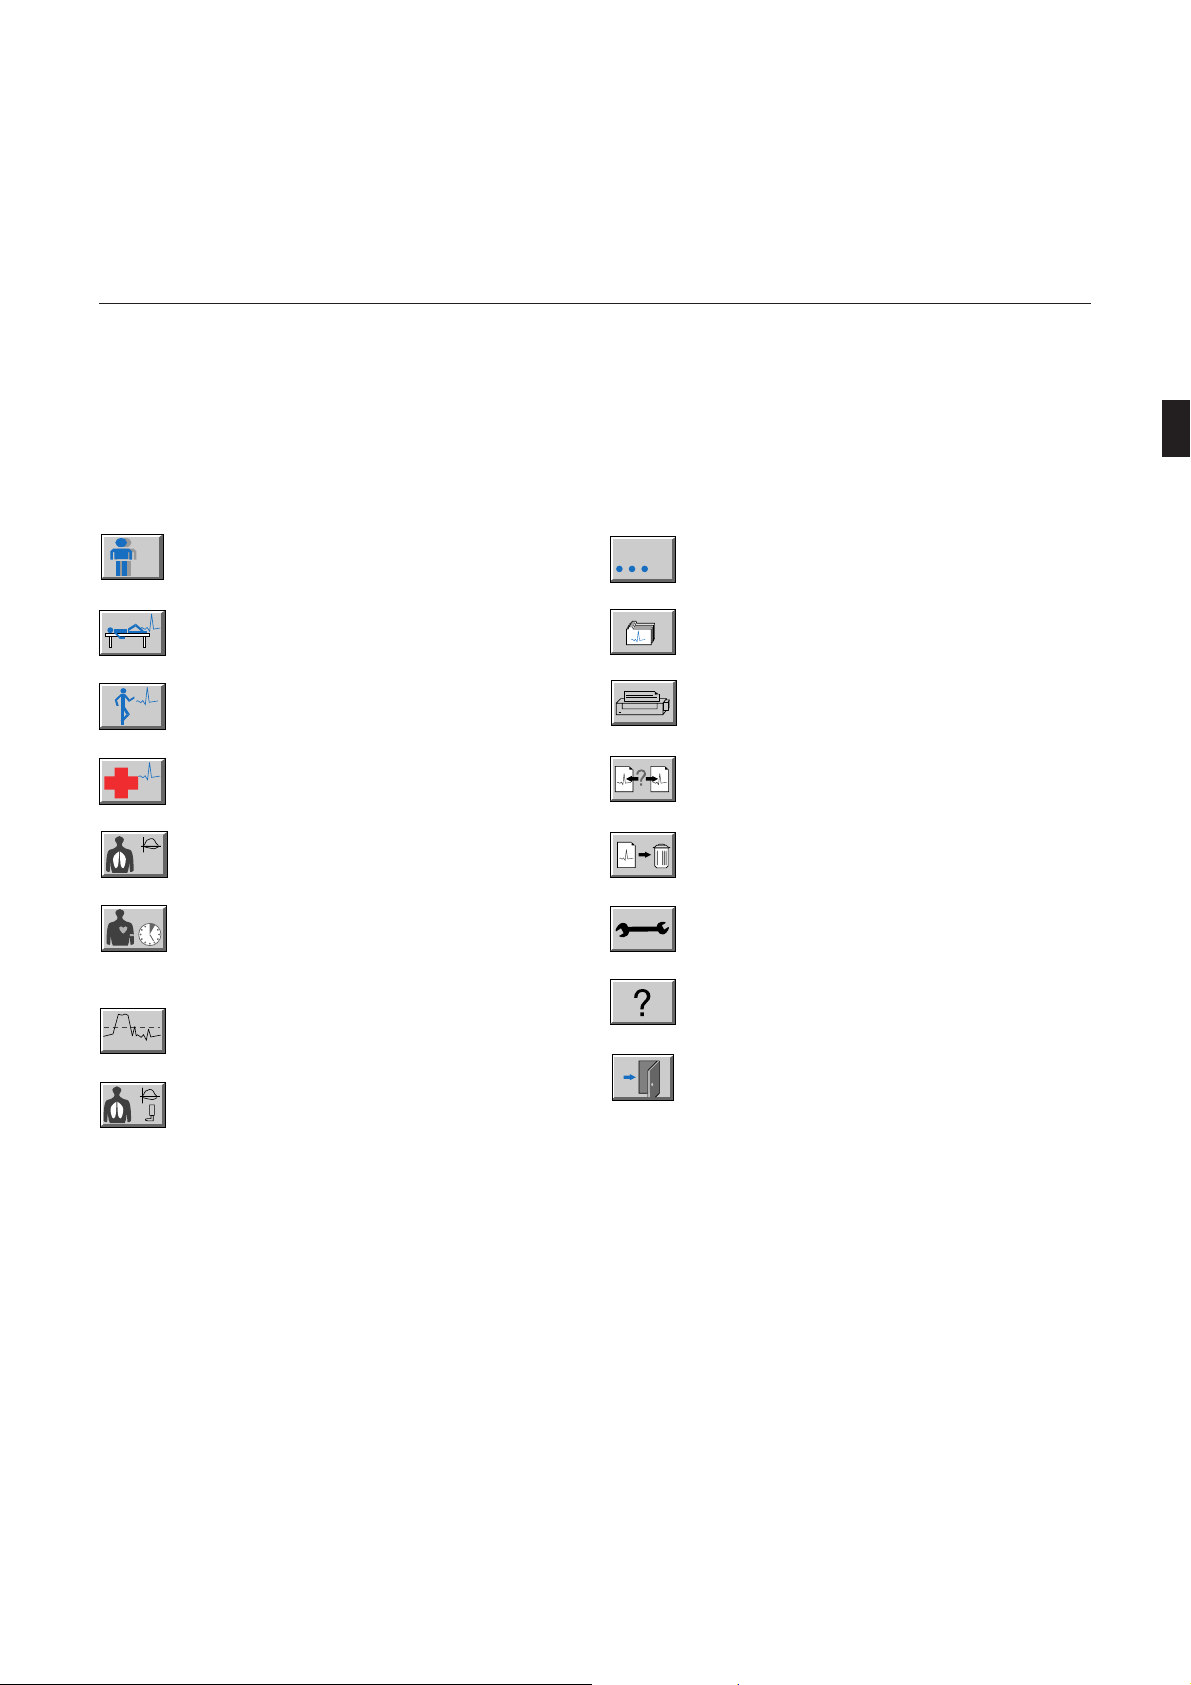
Explanation of the Function Keys
The function keys are used to call up the different program
functions:
Opens a window for patient selection or for
admission of a new patient (section 3.1, 3.2)
Recording of a resting ECG (section 4.1)
Recording of an exercise ECG (section 4.2)
Recording of a STAT ECG (section 4.3)
Initiates a pulmonary function test (section 4.4)
Initiates the ambulatory BP program for program-
120/80
ming of the BP monitor and data evaluation
(section 4.5)
Initiates the late potential analysis program (section 4.6)
Initiates a bronchodilation test (section 4.7)
…
Calls up further examination procedures
Opens a window for selection of stored procedures
Opens the printer menu and allows you to print
the displayed procedure
Allows you to compare the current procedure with
another one
Allows you to delete the displayed procedure
Calls up system services (chapter 6)
Calls up the online help function
Allows you to quit the program
227 498 02-A CardioSys V4.1 25
Page 26
General Information on System Operation
Patient
(Unbenannt)
System
Configuration
Procedure
Procedure
Copy Patient
Records
Hellige
System Services Help
PPG Hellige PPG Hellige System Services Menu
Archiving
Compression
HELLIGE CARDIOSOFT
T1.0a
Voice
Recorder
from ECG
System/ECG
Recorder
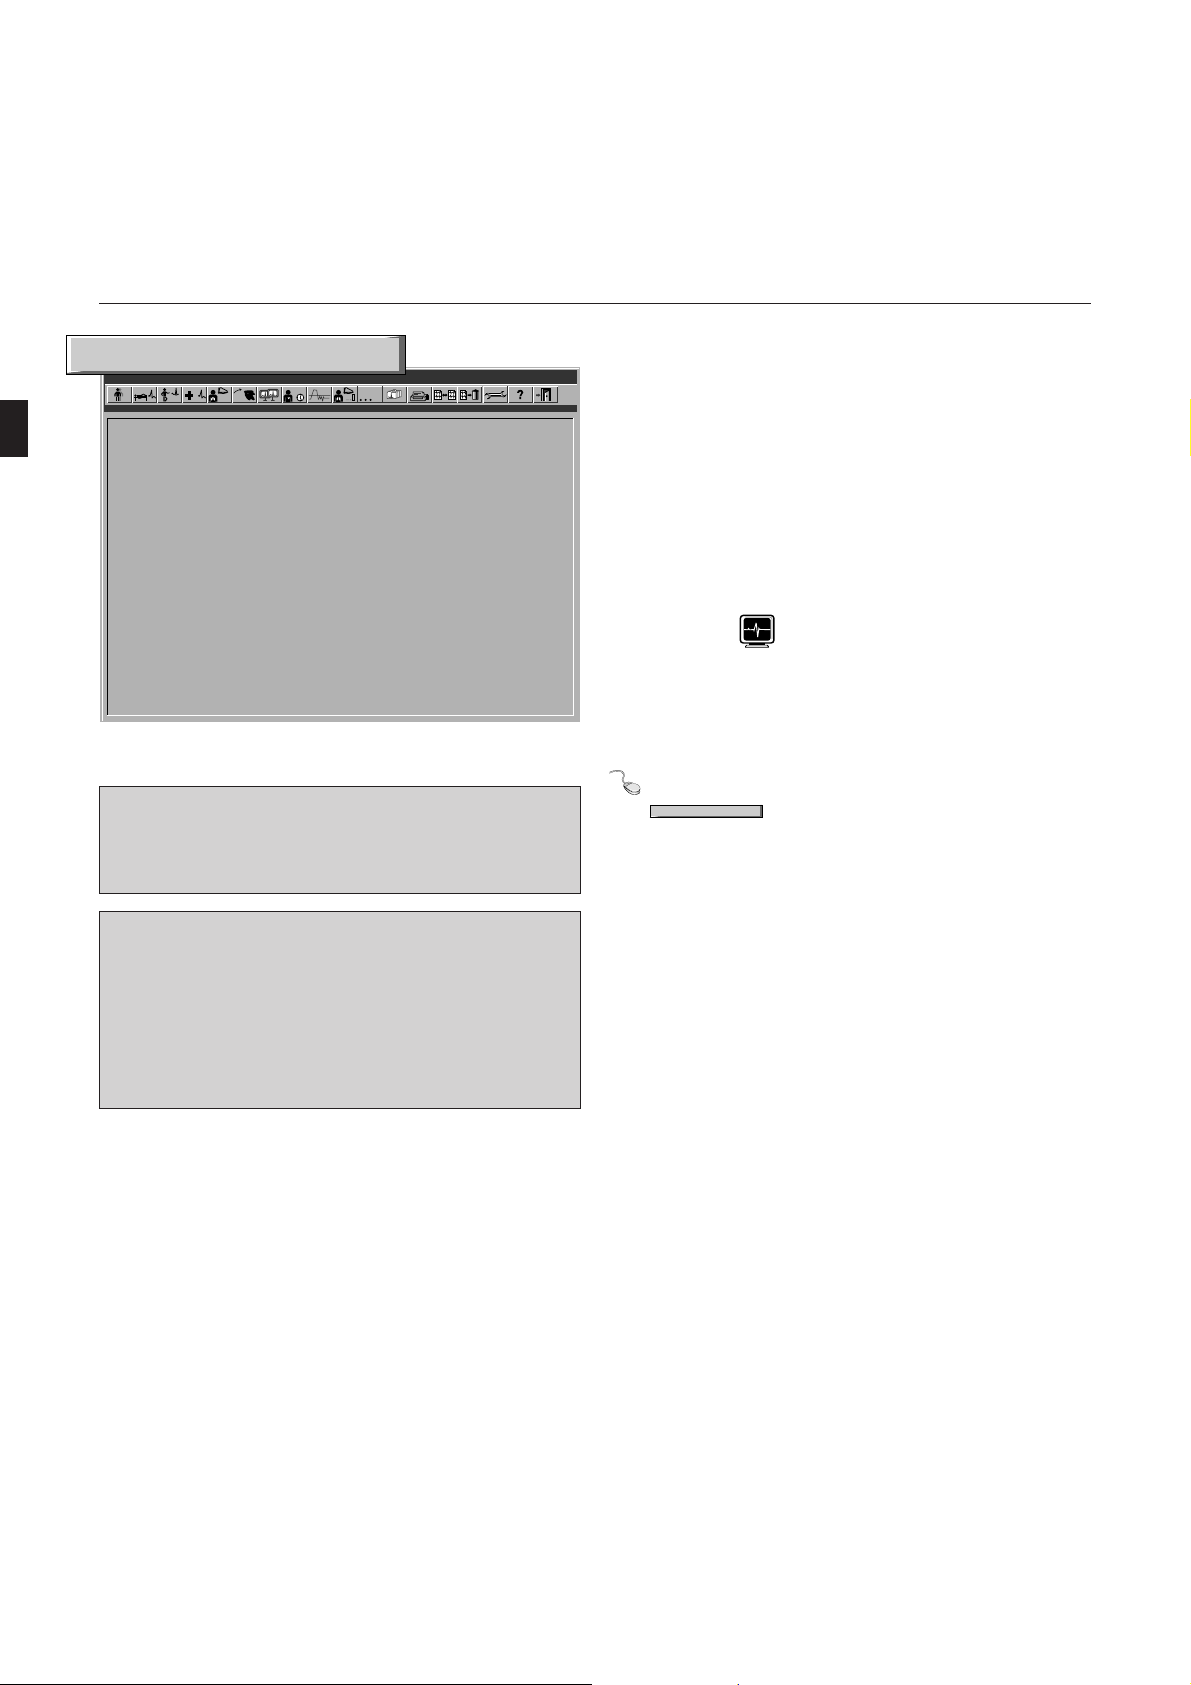
Figure 2-6. System services selection window
System Configuration
General Modem MUSE
Institution Name and Address
Name
Street
City
Remote Cart Name
Remote Cart Name
Physician
Technician
Default Procedure
Trace Background
Screen Diagonal
Remote Test Screen
Test Patient (temporary)
Anti-Aliasing of ECG Waveforms Patient Selection prior to STAT ECG
Enable Test Information Window
System Configuration
Save
Load
Print
Option Code
black-yellow (antial.)
15 in
NETBIOS-Protocol
Country Settings
For Service only
Archive Patient
Records
ID
ID
Windows control menu
(Restart program for changes to become
effective)
Menu labels
Enable Password Function
Setup
Load
Save
HelpCancel
Database…
User List…
Modify password…
Icon Bar…
OK
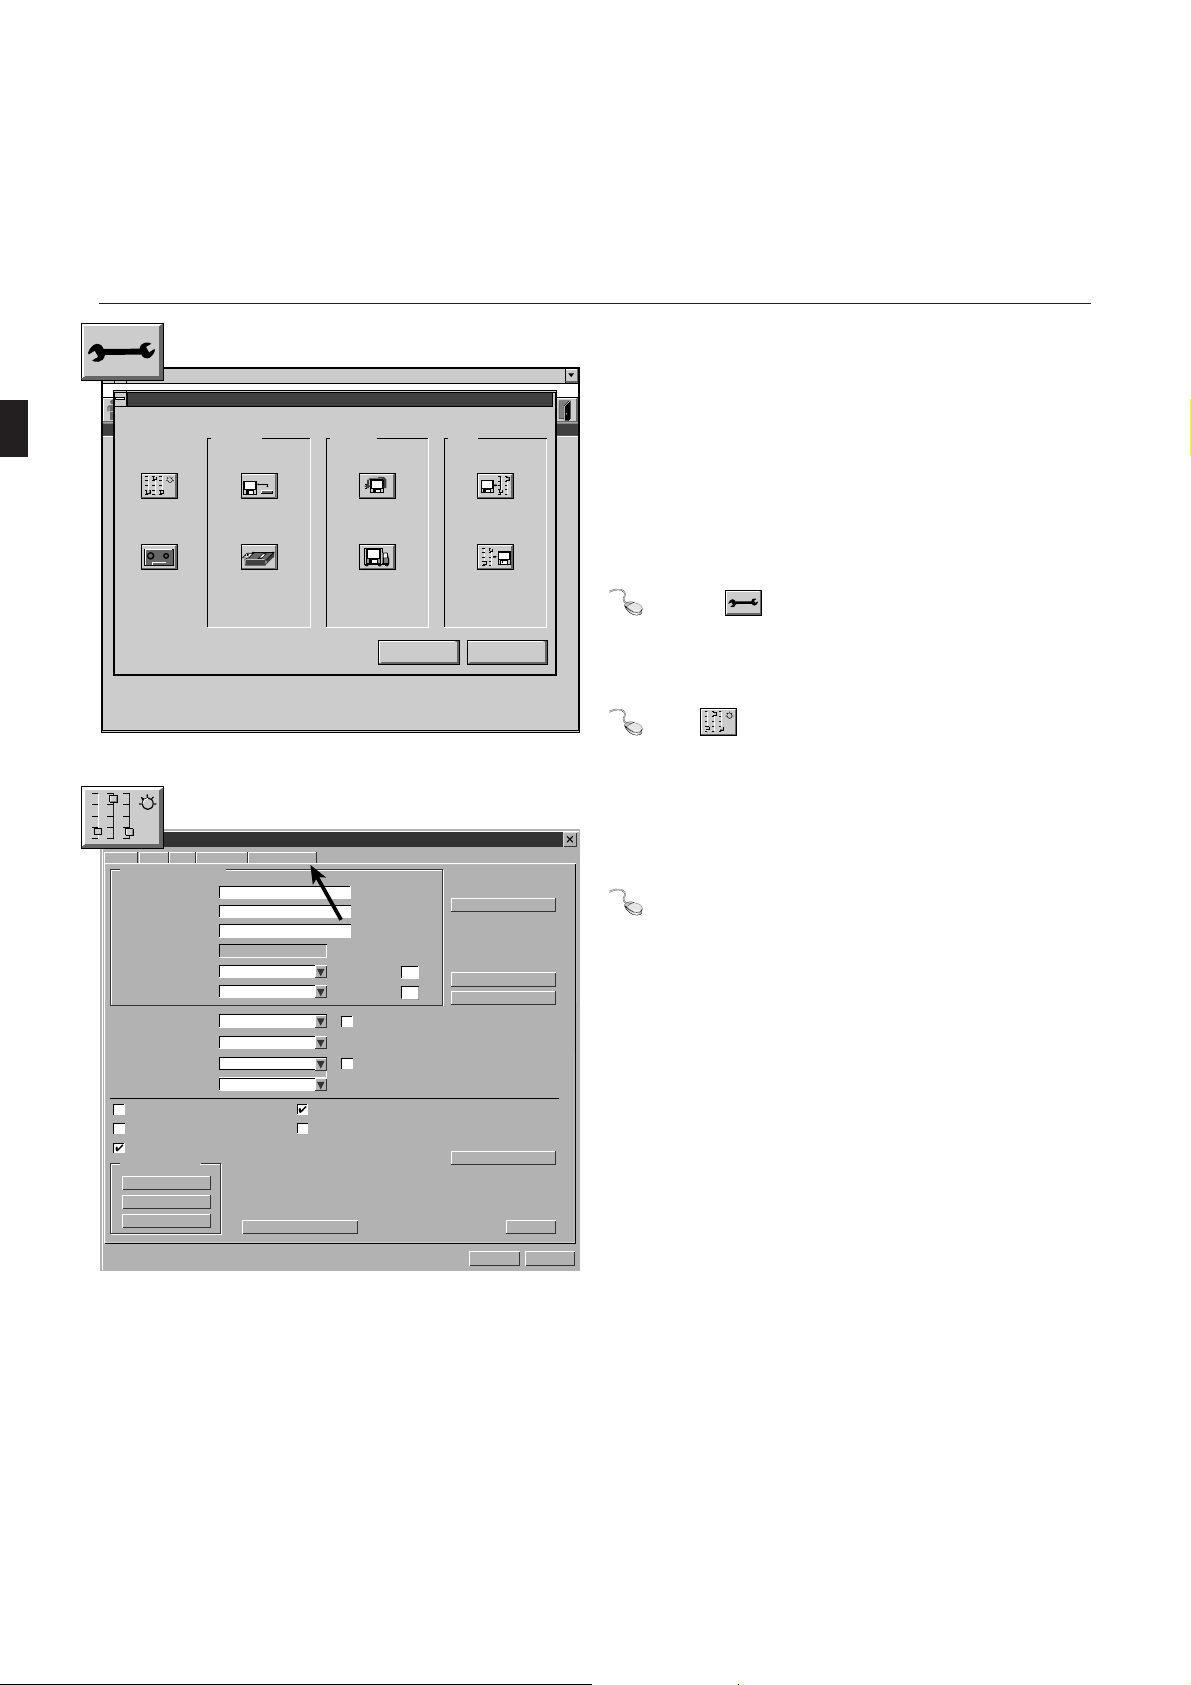
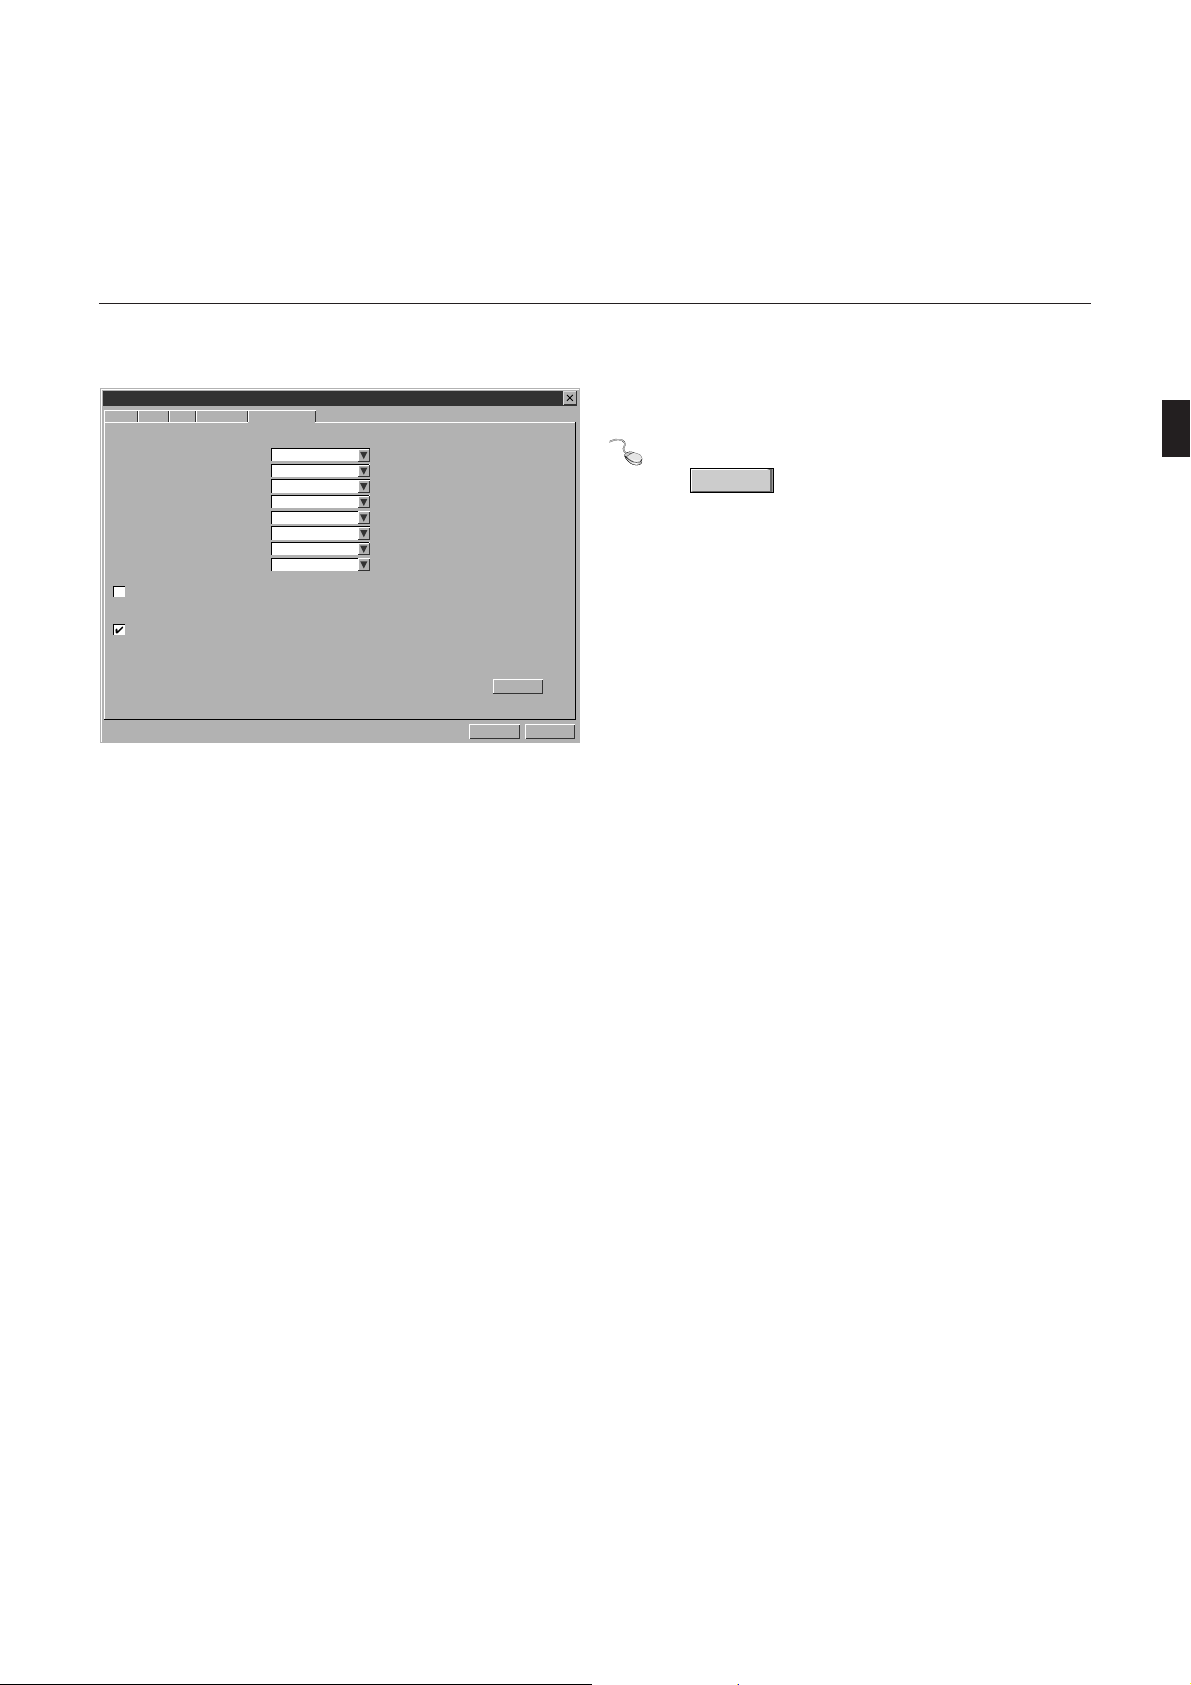
Selecting the Language
The program offers different languages for the user interfaces
and for the printed reports.
To select one of the languages, proceed as follows:
Click the button.
The window showing the system services opens (Figure 2-6).
Select .
You will see Figure 2-7. (This paragraph describes language
selection only. Other settings to be made in this window are
discussed in section 6.1)
Select the “Country Settings” tab (arrow, Figure 2-7).
Help
Cancel
Figure 2-7. System configuration menu – “General” tab
26 CardioSys V4.1 227 498 02-A
Page 27
General Information on System Operation
System Configuration
General Modem MUSE Option Code Country Settings
Language
Time Format
Date Format
Unit of Measure
Speed Unit
ST Level
Line Frequency
Lead Label
Enable Swedish Patient ID
Enable Card Reader
English
24-Hour Format
DD.MM.YYYY
cm, kg
km/h
mV
50 Hz
IEC
Help
Cancel
OK
Figure 2-8. System configuration menu – “Country Settings” tab
A screen similar to Figure 2-8 appears.
Select your language from the “Language” list box and
click
OK
to quit the menu.
227 498 02-A CardioSys V4.1 27
Page 28

For your notes
General Information on System Operation
28 CardioSys V4.1 227 498 02-A
Page 29

Selecting and Admitting a Patient, Retrieving Stored Examinations
3. Selecting and Admitting a Patient,
Retrieving Stored Examinations
In this section you will find information on
– how to select a patient from the database
– how to admit a new patient to the system
– how to retrieve examinations stored for a specific
patient
227 498 02-A CardioSys V4.1 29
Page 30
Selecting and Admitting a Patient, Retrieving Stored Examinations
1 2 3 4
Select patient (local database)
Search for …
Last Name Patient ID
Last Name
Master
Miller
Richards
Roberts
Shields
Stevenson
Thompson
next page…
New Patient…
Last Name
Patient ID
Gender
Race
First Name
Jim
Jane
Chantal
Jennifer
Stuart
Robert
Anthony
Master
8738999
Male
Date of Birth
10/05/1949
06/04/1943
03/12/1977
07/27/1977
11/11/1912
11/22/1966
09/19/1932
First Name
Date of Birth
Height
Weight
Patient ID
8738999
654987
7766699
543876
765321
333999
665544
Jim
10/05/1949
176
66/0
MM/DD/YYYY
in
lb
Pacemaker
12 1113
Figure 3-1. Patient selection screen
1 Displays more patients
2 Bar cursor, highlighting selected patient
3 Text box for patient’s last name
4 Click to select highlighted patient and go to the
title screen
5 Click to enter new patient data
6 Clears the patient data
7 “Unnamed” button (the test will not be assigned
to a patient)
8 Click to display the online help screen
9 Clears the menu (entries are not saved)
10 Displays the title screen
11 Click to save the data to the database
12 Pacemaker patient: yes X, no
13 Patient data window
Depending on the system configuration you will
☞
be working with the local database or with the
database of the MUSE CV system.
Select
New Patient
Delete
Unnamed
Help
Cancel
Close
Accept
3.1 Retrieving a Patient From the
Database
An examination procedure can be assigned to a patient only
when this patient has been retrieved from the database or
5
when the patient is admitted to the system first. Similarly, you
6
have to select a patient from the database before recalling one
7
of the procedures stored for this patient (“Unnamed” allows
8
you to run a procedure without assigning it to a patient).
9
10
Click on to display the patient selection screen.
Local Database (Figure 3-1)
Type the last name or ID number of the patient whose
record you wish to retrieve (it is sufficient to enter the
first letters or numbers).
Click at (1) to display a new page of patient records.
Check the patient data. If it needs to be changed:
– type over the old text, and
– click
Accept
.
To select the highlighted patient record
– click
Select
, or
– press .
As an alternative, you can select a patient record by
double-clicking on the name.
30 CardioSys V4.1 227 498 02-A
Page 31

Selecting and Admitting a Patient, Retrieving Stored Examinations
If you are working with the keyboard only;
– enter the patient name,
– press the key twice, and
– confirm the selection with .
Selecting a Patient from the MUSE CV System Database
Refer to chapter 6 for instructions on configuring
☞
the system for communication with the MUSE CV
system database.
In a network environment, do not access the same
patient file from more than one workstation.
Use only standard ASCII letters (A through Z)
and numbers (0 through 9) when entering information for the MUSE CV system.
Do not activate the Shift Lock key on the key-
☞
board when using the bar code wand.
When working with the MUSE CV system database, remember the following limitations:
it is not possible to search the database for a patient by
the patient ID number
patients can be admitted or deleted at the MUSE CV
system database only
patient data can be edited at the MUSE CV system
database only
Entering Patient ID with the Bar Code Wand
Click on the “Patient ID” text box.
Place the wand on the recording, at least 10 bars’
breadths to the left of the bar code.
Tilting the wand moderately, drag it across the bar code
at an even pace. If necessary, use a ruler as an aid.
227 498 02-A CardioSys V4.1 31
Page 32

Selecting and Admitting a Patient, Retrieving Stored Examinations
Select patient (local database)
Search for …
Last Name Patient ID
Last Name
Master
Miller
Richards
Roberts
Shields
Stevenson
Thompson
next page…
New Patient…
Last Name
Patient ID
Gender
Race
First Name
Jim
Jane
Chantal
Jennifer
Stuart
Robert
Anthony
Master
8738999
Male
Date of Birth
10/05/1949
06/04/1943
03/12/1977
07/27/1977
11/11/1912
11/22/1966
09/19/1932
First Name
Date of Birth
Height
Weight
Patient ID
8738999
654987
7766699
543876
765321
333999
665544
Jim
10/05/1949
176
66/0
Figure 3-2. Patient data entry screen
1 Click to enter new patient data
2 Text box for patient’s last name
3 Pacemaker patient: yes X, no
4 Confirms the entered data
5 Click to enter patient data via card reader
Patient
Procedure System Services Help
Baker, Dave, 41 yrs REST ECG/ Signal Acquisition
Test Information
Setup
X 40 HZ X 50 HZ
Hellige
Freeze ECG Options
10 mm/mV
MM/DD/YYYY
in
lb
Pacemaker
»
25 mm/s
1 4 52 3
HR (bpm)
SYS/DIA (mmHg)
V1
Select
New Patient
Delete
Unnamed
Card Reader…
Cancel
Close
Accept
85
3.2 Admitting a New Patient
Click
Enter the patient’s last name, and press the key to
move to the next box, etc.
Use the spacebar to apply or remove the checkmark in
the Pacemaker checkbox.
Click
database (or press the key and then the spacebar).
To admit a patient with the card reader click
and follow the displayed instructions (the card reader
function must be enabled in the System Configuration
menu, but this function is not supported by all keyboards).
☞
New Patient
(1, Figure 3-2).
Accept
to save the new patient file to the
The first letters of the first and last names are
automatically capitalized. Enter only ASCII
characters and numbers for the MUSE CV system.
Card Reader…
V2
1 2
3
6
5
R
Lead Sequence
STANDARD
Spline
4
L
FN
ON
aVR
aVL
aVF
V3
V4
V5
V6
Figure 3-3. Headline with the selected patient’s name
32 CardioSys V4.1 227 498 02-A
Page 33

Selecting and Admitting a Patient, Retrieving Stored Examinations
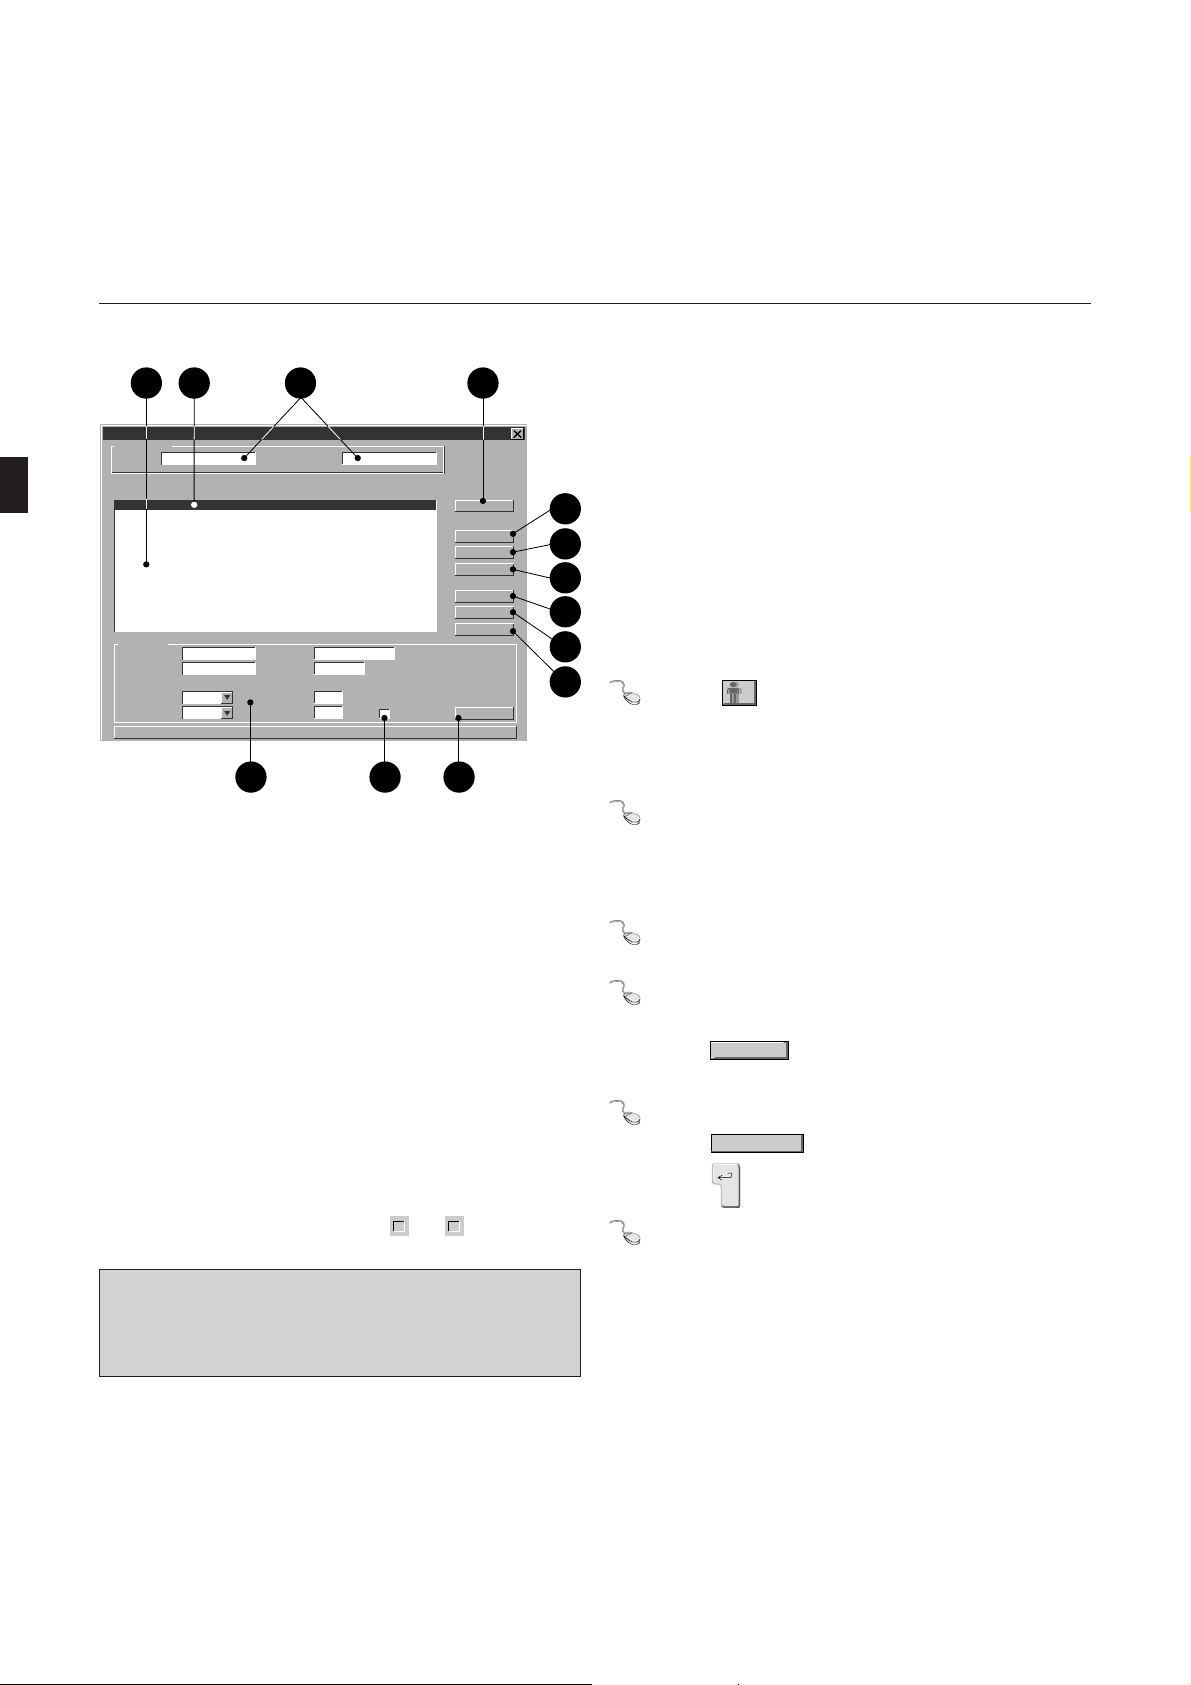
1 6 82 10
Select Test
Patient Baker, Dave, 41 yrs Test all
Date (from - to) DD.MM.YYYY
Location
Show new list
04.12.1998
04.12.1998
15:14:53
11:40:4300
Right-Heart Catherization
STAT ECG
4
3 9
5 7
Status all
Figure 3-4. Window for selection of stored tests
1 Selected patient (only this patient’s records are
displayed)
2 Choose “all” if you want to see all stored tests
3 Selection of the search filter (date range)
4 Selection of the search filter (tests recorded at a
special location)
5 Displays list when all search filters were set
6 Selected test
7 Click arrow to scroll through list
8 Control buttons
Displays the selected test
Displays a combined report
Allows the selected test to be confirmed
Saves the test for MUSE (to the database or
storage medium, as configured)
Allows transmission of procedures
Clears a test
9 Selection of the search filter (confirmed, uncon-
firmed or all tests)
10 Selection of the search filter (only resting ECGs,
only STAT ECGs, only exercise tests)
View
Combined Report …
Confirm
Transfer to MUSE
Send
Delete
Cancel
Help
3.3 Editing Stored Tests
Tests stored in the database can be retrieved
– to be reviewed
– to be assessed
– to be transmitted
– for creation of a combined report
– to be deleted.
Selecting a Test
Before you are able to edit test data, you will have to select a
test from the database. You can either display a list of all
stored tests or of the tests stored for a specific patient.
Select the patient.
Click on .
A list appears showing all the examination procedures stored
for the selected patient (Figure 3-4). If you wish to see all
stored procedures,
Click on (2, Figure 3-4) and select “all”.
227 498 02-A CardioSys V4.1 33
Page 34

Selecting and Admitting a Patient, Retrieving Stored Examinations
1 6 82 10
Select Test
Patient Baker, Dave, 41 yrs Test all
Date (from - to) DD.MM.YYYY
Location
Show new list
04.12.1998
04.12.1998
15:14:53
11:40:4300
Right-Heart Catherization
STAT ECG
4
3 9
5 7
Status all
Figure 3-5. Window for selection of stored tests
1 Selected patient (only this patient’s records are
displayed)
2 Choose “all” if you want to see all stored tests
3 Selection of the search filter (date range)
4 Selection of the search filter (tests recorded at a
special location)
5 Displays list when all search filters were set
6 Selected test
7 Click arrow to scroll through list
8 Control buttons
Displays the selected test
Displays a combined report
Allows the selected test to be confirmed
Saves the test for MUSE (to the database or
storage medium, as configured)
Allows transmission of procedures
Clears a test
9 Selection of the search filter (confirmed, uncon-
firmed or all tests)
10 Selection of the search filter (only resting ECGs,
only STAT ECGs, only exercise tests)
View
Combined Report …
Confirm
Transfer to MUSE
Send
Delete
Cancel
Help
You can set various filters to display only those tests that meet
specific criteria:
– test type (only resting ECG, only spirometry tests, only
STAT ECGs (click (10, Figure 3-5), then select the
test type)
– tests that were confirmed by a physician or unconfirmed
tests (9, Figure 3-5). Confirmed tests are marked with
an x.
– tests that were recorded at a special location (4, Figure
3-5). This could be an external ECG recorder or a
particular test lab. Please refer to section 6.1 “System
Configuration” for details on how to set the location
number.
– tests that were recorded in a specific time range (3,
Figure 3-5). Enter the beginning of the range in the box
at left and the end in the box at right (click in the box
first), observing the date format (DD.MM.YYYY or
MM/DD/YYYY).
When you have set all filters, either press on the PC
keyboard or click the
Show new list
button.
Tests marked with an asterisks are stored on an external
storage medium. Follow the instructions displayed on the
screen to restore these test data.
You can select multiple procedures by clicking on
☞
the procedure and holding the
Ctrl
key depressed
at the same time.
34 CardioSys V4.1 227 498 02-A
Page 35

Selecting and Admitting a Patient, Retrieving Stored Examinations
Displaying Tests
Double-clicking on a test is a quick method to
☞
select it from the database.
When working in a network environment, it is not
☞
possible to display the same test at more than one
workstation at a time.
If multiple tests are highlighted when you first
☞
display the test records list, these are records that
were sent from an ECG recorder and they may not
be assigned to the correct patient, or a record was
repeatedly sent and assigned to different patients.
Select a test and clear the window with
The test report will be displayed. For details on the individual
report documents, please refer to section 4.1.4.
Confirming Tests
A test is considered confirmed, when a physician has reviewed
the test evaluation and “signed” it electronically with his/her
name. It is possible to confirm tests more than once.
Select a test and clear the window with
The screen automatically displays the report page with the
interpretation statements. Please refer to section 4.1.4 for
details on how to evaluate a test.
View
Confirm
.
.
227 498 02-A CardioSys V4.1 35
Page 36

Selecting and Admitting a Patient, Retrieving Stored Examinations
Send procedures
Number of selected procedures: 2
Transmission via modem
Telephone Number
External User Name
External User Password
Save procedure to storage medium
Medium Directory
a:\
Modify…
Figure 3-6. “Send procedures” window
The addressee must be registered as “External
☞
user” at the receiving system (section 6.1 “System
Configuration”).
When sending data via the modem, please verify
☞
the modem settings (section 6.1 “System Configuration”).
OK
Cancel
Sending Procedure Data
You can transmit one or several procedures via a modem or
save them to a storage medium.
Select the procedure(s) (multiple procedures can be
highlighted by holding either or
Ctrl
down when
clicking on them).
Click on
Send
to clear the window.
Figure 3-6 will appear.
If you wish to send the data via modem, select “Transmission via modem” and enter the telephone number,
name and password of the external user at the receiving
end. Then select
OK
to clear the window.
If you wish to save the data to a storage medium, select
“Save procedure to storage medium”. Then select
OK
to clear the window.
If the system cannot access the selected disk drive
☞
a:\, data will be saved to the hard drive c:\.
You can change the directory by clicking on
dow opens showing the available directories.
Modify…
: a win-
36 CardioSys V4.1 227 498 02-A
Page 37

Selecting and Admitting a Patient, Retrieving Stored Examinations
Print
Patient
Untersuchung
Combined Report
Baker
19.12.1995, 15:40:06, Before Bronchodilation
No Respiratory Problem
15.12.1995, 15:22:59, Ambulatory Blood Pressure:
24h Average sys/dia [mmHg]
101.5/ 75.1
syst. BP readings above 135 mmHg [%]
2.1
diast. BP readings above 85 mmHg [%]
0.0
Day-Time Average sys/dia [mmHg]
101.5/ 75.1
15.12.1995, 15:17:35, Resting ECG:
suspected left ventr. hypertrophy
because [R+S] in [V5] and QRS angle < -15°
minor left axis deviation
because QRS angle between -30° and 0°
negative T-wave [lateral]
1
Hilfsfunktionen Hilfe
Combined Report
Figure 3-7. Combined report
1 Arrow buttons and scroll boxes to reposition the
text (up, down, right, left)
2 Button to delete text
3 Button to reinsert text
4 Button to initiate a printout of the combined report
5 Button to cancel the combined report
Hellige
Combined Report
A
1
2
A
C
B
You can select several tests of one patient, compile these in a
combined report and print it out. This function is not available when the records of all patients are displayed.
3
Select the patient.
4
5
Print
Cancel
Select multiple tests by holding either or
down when clicking on a test.
Click on
Combined Report
.
Figure 3-7 shows an example of a combined report.
A combined report can be edited and printed, but it can not
be saved.
If you wish to add text, position the cursor at the appropriate position and click. Then type the text.
Ctrl
If you wish to delete text, highlight it, then click on
.
A
Deleted text can be inserted in any desired position. To
do so, place the mouse cursor at the appropriate point
and click. Then click on
A
.
C
B
The arrow buttons and scroll boxes (1) can be used to
reposition the text (up, down, right, left).
The
button is used to initiate the printout of the
combined report.
227 498 02-A CardioSys V4.1 37
Page 38

Selecting and Admitting a Patient, Retrieving Stored Examinations
Patient
Untersuchung
Holter ECG: 19.10.1995 • 13:00:30
(Unbenannt)
Interpretation (summary)
no pathological findings
Figure 3-8. Summary
Hellige
Hilfsfunktionen Hilfe
External Procedure Summary
CancelDetailed Report
For examinations made with an external program, you will see
a procedure summary (Figure 3-8), when you press the
OK
button.
Delete Stored Tests
Delete
The
button allows you to remove the highlighted
test(s) from the database.
Sending Test Data to the MUSE CV System
Use only standard ASCII letters (A through Z) and numbers
(0 through 9) when entering information for the MUSE CV
system.
Once transferred to the MUSE CV system, the tests cannot
be edited any more.
Data sent to MUSE can be viewed with the MUSE Browser
and printed. Note: Before printing, always set the printer to
the landscape format.
If you enable “Start modem connection before transfer” on
the MUSE tab of the System Configuration menu, the system
may still find an active modem connection while it tries to
establish a new connection. Windows NT will inform you of
this condition. Terminate the existing connection (Hangup)
and resend the data.
38 CardioSys V4.1 227 498 02-A
Page 39

The Examination Procedures
Select
Unnamed
Select patient (local database)
Search for …
Last Name Patient ID
Last Name
Master
Miller
Richards
Roberts
Shields
Stevenson
Thompson
next page…
New Patient…
Last Name
Patient ID
Gender
Race
First Name
Jim
Jane
Chantal
Jennifer
Stuart
Robert
Anthony
Master
8738999
Male
Date of Birth
10/05/1949
06/04/1943
03/12/1977
07/27/1977
11/11/1912
11/22/1966
09/19/1932
First Name
Date of Birth
Height
Weight
Patient ID
8738999
654987
7766699
543876
765321
333999
665544
Jim
10/05/1949
176
66/0
Figure 4.0-1. Patient selection screen
MM/DD/YYYY
in
lb
Pacemaker
Select
New Patient
Delete
Unnamed
Help
Cancel
Close
Accept
4. The Examination Procedures
The following sections describe the different examination
procedures possible with CardioSys (resting ECGs, exercise
tests, STAT ECGs, etc.) in detail.
When you click on one of the procedure selection buttons,
the patient selection screen opens, allowing you to retrieve a
patient from the database or to enter a new patient (sections
3.1 and 3.2). The advantage of this approach is that you can
immediately select the examination procedure without having
to choose a patient first.
On the patient selection screen the bar cursor is always on the
patient selected last. So, if you wish to perform multiple tests
on the same patient, all you have to do is click on the
button or press .
If you prefer to run an unassigned procedure, click on
.
Choose
Close
to display the title screen.
If you run the program in conjunction with a hospital information system (HIS), the
Order List
button will also appear,
enabling you to display a list of requested procedures (this
function requires the optional “Order List” module, refer to
Appendix 2 “Operation in Conjunction with a Medical
Reimbursement Program/Hospital Information System”).
227 498 02-A CardioSys V4.1 39
Page 40

For your notes
The Examination Procedures
40 CardioSys V4.1 227 498 02-A
Page 41

The Resting ECG
4.1 The Resting ECG
This section describes all operating steps necessary to
– apply the electrodes to the patient and connect the
– enter the test information (indication, medication,
– record the ECG
– call up the report pages for on-screen review
– print the report pages
patient
comments, etc.)
– compare two resting ECGs
– set up the system
The brief operating instructions at the end of this section
sum up what you have to do to record a resting ECG.
227 498 02-A CardioSys V4.1 41
Page 42

The Resting ECG / The Basics
Test Information
Library: Reason for Test Reason for Test
Therapy outcome control
Routine test
Clarify chest discomfort
Confirm/Rule out CAD
Angina Pectoris
Post-MI
Preop. Diagnosis
Blood Press.(mmHg)
Medication
Comment
Physician:
Technician:
ABE F
sys
»
dia
Figure 4.1-1. Test information window
A
B
A
4.1.1 The Basics
C
Choose the icon to activate the resting ECG mode.
After selection of a patient, the window for entry of the test
information will open (Figure 4.1-1), if you have chosen this
feature in the system configuration (refer to section 6.1 “System Configuration”). We recommend that you apply the
…
OK
Cancel
Help
electrodes to the patient as explained in section 4.1.2 prior to
entering the test information.
42 CardioSys V4.1 227 498 02-A
Page 43

Figure 4.1-2. Applying plate electrodes
The Resting ECG / Applying the Electrodes
4.1.2 Applying the Electrodes
Careful application of the electrodes is a prerequisite for
obtaining interference-free ECGs. The signal acquisition
screen immediately gives you a visual indication of your
electrode technique and of the signal quality (provided the red
R electrode is applied).
For quick, reliable and trouble-free application of the electrodes we recommend our Electrode Application System (refer
to the Electrode Application System user manual).
As an alternative you can use the conventional plate elec-
trodes on the limbs and the suction electrodes on the thorax.
Applying Plate Electrodes (Limbs)
The red R electrode is the reference electrode.
☞
Placement and signal quality of all other electrodes can be assessed on the signal acquisition
screen only when this electrode is applied.
227 498 02-A CardioSys V4.1 43
Plate electrodes are applied by means of a rubber strap; electrode paper is the recommended contact medium for this type
of electrode.
* Moisten the electrode paper with tap water and place it
between skin and electrode.
* Secure the electrode with the rubber strap (Figure 4.1-2)
so that it cannot shift during the recording; take care not
to strangulate blood vessels in the process.
Page 44

The Resting ECG / Applying the Electrodes
Applying Suction Electrodes (Thorax)
* Shave application points, if necessary.
C1
C3R
C4R
C2
C3
C5
C4
C8
C4R
C3R
C1
C2C3
C4
Figure 4.1-3. Chest electrode application points
N black
R red
C1 white
C2 white
C3 white
C4 white
C5 white
C6 white
L yellow
F green
right leg
right arm
left arm
left leg
Figure 4.1-4. Connecting the patient cable
(10-wire, standard ECG leads)
C7
C5
C1
* Moisten electrode paper with tap water and place it
between skin and electrode. Electrode cream or gel can
C6
be used here instead of the paper. Especially when the
chest is a little hairy, cream or gel helps to seal.
Electrode Application Points for Standard Leads
(I, II, III, aVR, aVL, aVF, V1 to V6)
Four limb and six chest electrodes must be applied for acquisi-
C6
tion of the standard leads. Attach the limb electrodes above
the wrists and ankles. Figure 4.1-3 shows the chest lead
application points:
C1 in the 4th intercostal space at the right sternal edge
C2 in the 4th intercostal space at the left sternal edge
C3 at the level of the 5th rib midway between C2 and C4
C4 in the 5th intercostal space on the left midclavicular line
C5 on the left anterior axillary line between C4 and C6
C6 on the mid-axillary line at the level of C4
C7 in the 5th intercostal space on the left posterior axillary
line
C2
C3
C5
C6
C4
C8 in the 5th intercostal space on the left scapulary line
C3R opposite C3, on the right side of the thorax
C4R opposite C4, on the right side of the thorax
C8
C7
C6
C5
C4
C2C3
C1
* Connect the 10-wire patient cable as shown in Fig-
ure 4.1-4.
44 CardioSys V4.1 227 498 02-A
Page 45

correct incorrect
Figure 4.1-5. Arranging the patient cable
The Resting ECG / Applying the Electrodes
* Arrange the patient cable as shown in Figure 4.1-5 and
connect it to the system (type CF signal input: highly
isolated, suitable for intracardiac application, defibrillation-proof).
227 498 02-A CardioSys V4.1 45
Page 46

The Resting ECG / Applying the Electrodes
Figure 4.1-6. Electrode application points for NEHB leads
Nstattachment point of the 2nd rib to the right
sternal edge
Naxin the 5th intercostal space on the left posterior
axillary line (identical with C8)
Napin the 5th intercostal space on the left mid-
clavicular line (identical with C4)
N black
R red
C1 white
C2 white
C3 white
Nst
C4 white (Nap)
C8 Nax
C5 white
C6 white
L yellow
F green
right leg
right arm
left arm
left leg
Nst
C1
C2C3
C1
Nst Nap
C2
C3
C5
C6
C4
(Nap)
Nax
C8
C7
C6
C5
C4
Figure 4.1-7. Connecting the patient cable (12-wire, NEHB leads)
Electrode Application Points for NEHB Leads
Figure 4.1-6 shows the application points for the NEHB
electrodes. Connect the 12-wire patient cable as shown in
Figure 4.1-7 (Nap is identical with C4).
* If necessary disable the anti-drift system and the filters
(muscle and AC line filter) to view the unfiltered “raw”
ECG signal (sections 4.1.4 and 4.1.7).
As an alternative the NEHB leads can also be acquired with the
10-wire patient cable. In this case, select the sequence High,
Right or Left as described in section 4.1.7 (“Modifying the
Lead Sequence”) and change:
I to D
II to A
III to J.
Apply the R electrode to Nst
the L electrode to Nax (C8)
the F electrode to Nap (C4).
It is not possible to record chest leads at the same
☞
time as NEHB leads.
Please observe the information given in sections
☞
7.1 “Artifact Due to Poor Electrode Application”,
7.2 “ECGs of Pacemaker Patients” and 7.3 “ECG
Recording During Defibrillation” in the appendix.
46 CardioSys V4.1 227 498 02-A
Page 47

The Resting ECG / Entering the Test Information
Test Information
Library: Reason for Test Reason for Test
Therapy outcome control
Routine test
Clarify chest discomfort
Confirm/Rule out CAD
Angina Pectoris
Post-MI
Preop. Diagnosis
ABE F
»
1
3
Blood Press.(mmHg)
Medication
Comment
Physician:
Technician:
Figure 4.1-8. Test information screen
sys
dia
5
1 Reason for Test Library
2 The patient’s reason for test
3 Blood pressure readings
4 Medications
5 Boxes for entry of comments and of the physi-
cian’s and technician’s names
A
B
A
2
4.1.3 Entering the Test Information
C
The test information screen offers menus and text boxes for
entry of all data relevant for the resting ECG procedure.
On this screen you can
4
…
OK
Cancel
Help
– enter the reason for the test
– enter blood pressure readings
– select the medication
– enter comments
– register the physician’s and technician’s names.
227 498 02-A CardioSys V4.1 47
Page 48

The Resting ECG / Entering the Test Information
A Reason for Test can easily be copied by dou-
☞
ble-clicking.
Copying Reason for Test from the Library to the Patient
Window
The reason for test library contains a list of standard statements that you can copy easily into the patient’s window. The
library can be expanded or edited as required.
Click on a statement to highlight it.
Click the button.
If you wish to delete a copied reason or part of it, highlight the words in question and click A.
The deleted words can be inserted in another position by
placing the cursor there and clicking
A
.
C
B
You can enter a reason for test directly by moving the
cursor to the desired position and typing the text.
Expanding or Editing the Reason for Test Library
Click
ABE F
.
This will open the library window (Figure 4.1-9).
ABE F
Therapy outcome control
Routine test
Clarify chest discomfort
Confirm/Rule out CAD
Angina Pectoris
Post-MI
Preop. Diagnosis
Modify Library: Reason for Test
OK
Cancel
Help
Move the cursor to the desired position in the list and
click the mouse button.
Enter a standard statement and press on the keyboard. The cursor moves to the beginning of the next
line.
Figure 4.1-9. Editing the Reason for Test library
48 CardioSys V4.1 227 498 02-A
Page 49

The Resting ECG / Entering the Test Information
In this manner you may enter all reasons for a test .
When you’re done, click on
window.
Entering Blood Pressure Readings
OK
to clear the
Click to display and increase the value, or
☞
click to decrease the value.
Blood pressure readings are either entered directly via the
keyboard or they are selected and changed in steps of
5 mmHg by clicking the arrow boxes. When you first click
the arrows you will see default pressures of 120 mmHg (sys)
and 80 mmHg (dia).
Move the cursor to the sys box and click the left mouse
button.
Enter the value via the keyboard.
Enter the diastolic value in the same manner.
227 498 02-A CardioSys V4.1 49
Page 50

The Resting ECG / Entering the Test Information
Test Information
Library: Reason for Test Reason for Test
Therapy outcome control
Routine test
Clarify chest discomfort
Confirm/Rule out CAD
Angina Pectoris
Post-MI
Preop. Diagnosis
Blood Press.(mmHg)
Medication
Comment
Physician:
Technician:
ABE F
»
none
unknown
digitalis
diuretics
psychotherap. agents
steroids
beta-blockers II
beta-blockers III
antiarrhythmics Ia
antiarrhythmics Ib
antiarrhythmics Ic
antiarrhythmics III
Ca antagonist, verapamil type
sys
Ca antagonist, nifedipine type
dia
Figure 4.1-10.List of medication groups
The physician is responsible for assigning drugs to
☞
a medication group.
Medications…
Medication Group
none
unknown
digitalis
diuretics
psychotherap. agents
steroids
beta-blockers II
beta-blockers III
antiarrhythmics Ia
antiarrhythmics Ib
antiarrhythmics Ic
antiarrhythmics III
Ca antagonist,verapamil type
Ca antagonist,nifedipine type
Medication
Drug Name
-->
-->
-->
-->
-->
-->
-->
-->
-->
-->
-->
-->
-->
-->
A
B
A
Selecting a Medication, Assigning a Drug Name to a -
C
Medication Group
You can select a medication from a list of 14 items . You
can also select a second medication and assign specific drugs
to the medication groups to include these in the list instead of
the group name ….
Making a Selection
…
OK
Cancel
Help
Click on to open the medication list box (Figure
4.1-10).
Select one of the medications.
If you wish to select a second medication or to assign a
drug name to a medication group, click on … and
select the medication as described above.
Assigning Drugs to a Medication Group
Click on
Medications…
.
A window opens, showing 14 items (Figure 4.1-11). There is
a drug name window for each of these groups. Click on the
respective text box, if you wish to enter a name. Then type the
drug name.
Furthermore, you are free to arrange the medication groups
any way you want. To do so
Help
OK
Cancel
Click on the at the end of the group name box.
Figure 4.1-11. Assigning a drug to a medication group
50 CardioSys V4.1 227 498 02-A
Page 51

The Resting ECG / Entering the Test Information
Medication
none
none
unknown
digitalis
diuretics
psychotherap. agents
steroids
beta-blockers II
beta-blockers III
antiarrhythmics Ia
antiarrhythmics Ib
antiarrhythmics Ic
antiarrhythmics III
Ca antagonist,verapamil type
Ca antagonist,nifedipine type
nitrates
ACE
alpha-blockers
cytostatics
-->
-->
-->
-->
-->
-->
-->
-->
-->
-->
-->
-->
-->
-->
Drug NameMedication Group
Figure 4.1-12. Editing the medication group
Help
OK
Cancel
This brings up a new window where you can choose one of
the group names (Figure 4.1-12).
Click on the drug name box and enter the name
Click on
OK
to clear the window.
Entering Comments
If you wish to enter a comment on the test procedure, click in
the “Comment” text box and key in the text.
Physician’s/Technician’s Name
The names of the physician and ECG technician can either be
entered here (click in the text box and type the name), or they
can be selected from the list of the registered system users
(section 6.1 “System Configuration”).
Click on and choose a name from the list by clicking
on it.
Exiting the Test Information Screen
Once you have entered all test information, you can either
Pressing the key on the PC keyboard also
☞
clears the window and saves the entries.
– clear the window with
OK
and start recording the
resting ECG or
– clear the window with
Cancel
(in this case the test
information will be ignored and are not assigned to the
test)
227 498 02-A CardioSys V4.1 51
Page 52

The Resting ECG / Recording A Resting ECG
OK
Patient
Procedure System Services Help
Baker, Dave, 41yrs REST ECG/ Signal Acquisition
Test Information
Setup
aVR
aVL
aVF
X 40 HZ X 50 HZ
6
7
Figure 4.1-13.Signal acquisition screen for the resting ECG
1 Control buttons
2 Current heart rate
3 Blood pressure readings
4 Applied electrodes
green: properly applied
yellow: not properly applied
white: site not used
red: electrode off or lead break
5 For selection of the lead sequence
6 Leads impaired by poor signal quality
7 Calibration pulse
Hellige
Freeze Traces Options
1
10 mm/mV
25 mm/s
2
3
4
5
»
HR (BPM)
SYS/DIA (mmHg)
V1
130/80
V2
V3
R
V4
V5
Lead Sequence
STANDARD
V6
Cubic Spline
4.1.4 Recording A Resting ECG
85
1 2
3
4
ON
Once you have entered the test information and cleared the
window with
OK
, the signal acquisition screen for the
resting ECG (Figure 4.1-13) will appear. Take a few seconds
to become familiar with the details shown on this screen
before proceeding to recording the resting ECG.
6
5
L
FN
The resting ECG signal acquisition screen
This screen (Figure 4.1-13) shows:
– the current heart rate (2) and the blood pressure readings
(3) (if entered manually, section 4.1.3)
– the applied electrodes and the signal quality (4). Further-
more an arrow (6) points to the leads which are impaired
by improper electrode application or which cannot be
recorded due to disconnected electrodes (or due to a
break in the patient cable).
– the selected lead sequence (5)
– the selected sensitivity (the 1-mV calibration pulse (7) is
valid for all channels).
The applied electrodes are shown on the torso only
☞
for the “Standard” and “CABRERA” lead sequences. In all other cases there is only a schematic representation of the electrodes. The reference electrode R (red) must be applied for the
lead-check function to work properly.
This program allows you to select specific system settings
similar to a conventional ECG recorder. You can enable or
disable muscle and AC line filters, select different sweep
speeds and sensitivities, etc. Furthermore, you can set up the
system to suit your personal needs and preferences. These
settings will be retained and are activated each time the system
is turned on (section 4.1.7 “Setup”).
52 CardioSys V4.1 227 498 02-A
Page 53

Setup
Test Information
The Resting ECG / Recording A Resting ECG
Settings selected from the Setup menu will be
☞
retained and are automatically activated each
time the system is turned on.
Patient
Procedure System Services Help
Baker, Dave, 41yrs REST ECG/ Signal Acquisition
Test Information
Setup
aVR
aVL
aVF
X 40 HZ X 50 HZ
Hellige
Freeze Traces Options
10 mm/mV
»
25 mm/s
HR (BPM)
SYS/DIA (mmHg)
V1
V2
V3
R
V4
V5
V6
1 2
3
Analyzing…
85
5
4
Click
Select
Options >>
to display the system settings buttons.
to display the setup menu (section
4.1.7).
The buttons and allow you to change the display
of the ECG leads: either you see 5-second segments of all
12 leads at a time, or you see 10-second segments of
groups of 6 leads.
The 40 Hz box switches a muscle filter on and off
The 50 Hz check box switches an AC filter on and off
(X = AC filter on).
6
L
FN
The arrows at mm/mV select the gain (2.5, 5,
10, 20, 40 mm/mV).
The arrows at ... mm/s select the sweep speed (25 or
50 mm/s).
Figure 4.1-14.Resting ECG acquisition screen with control
The entire ECG recording is controlled with the four buttons:
buttons and “Analyzing...” message
Please remember that a filter may also suppress
☞
Freeze Traces
Options >>
.
diagnostically relevant information, as it limits
the frequency bandwidth. Therefore you should
not switch filters on indiscriminately.
If “Manual Override” is enabled in the Setup
☞
menu (section 4.1.7), the system starts recording
the ECG even when not all electrodes are applied.
227 498 02-A CardioSys V4.1 53
Page 54

The Resting ECG / Recording A Resting ECG
Patient
Procedure System Services Help
Baker, Dave, 41yrs REST ECG/ Signal Acquisition
Test Information
X 40 HZ X 50 HZ
Setup
aVR
aVL
aVF
Hellige
Freeze Traces Options
10 mm/mV
»
25 mm/s
HR (BPM)
SYS/DIA (mmHg)
V1
V2
V3
R
V4
V5
V6
Analyzing…
Figure 4.1-14.Resting ECG acquisition screen with control
buttons and “Analyzing...” message
Recording and Evaluating the ECG
The program continually saves 10-second segments of the
85
1 2
3
4
incoming ECG. When you click the button, the
most recent 10 seconds of the ECG signal will be analyzed.
Thus, before initiating the analysis, you can make sure that
the quality of the ECG signal to be evaluated is adequate.
6
5
L
If you wish to modify the sweep speed or the filter settings
FN
(muscle, AC line filter), click on
Options >>
to display the
second row of controls.
Click
Freeze Traces
to freeze and release the signal traces. The
freeze function does not affect channel 1.
Click to initiate the procedure. The message
“Analyzing...” which appears in the bottom right-hand corner
for about 6 seconds tells you that the signal is being analyzed
(Figure 4.1-14).
At the end of the analysis you will automatically see the first
page of the procedure report showing the 10-second ECG
strips (Figure 4.1-15).
The resting ECG report includes the following documents
which are described in detail on the following pages:
– the ECG traces (Figure 4.1-15/4.1-16)
– the test summary (Figure 4.1-20)
– medians (dominant, subdominant) (Figure 4.1-22)
– arrhythmia review (Figure 4.1-25)
– interpretation (Figure 4.1-27)
54 CardioSys V4.1 227 498 02-A
Page 55

The Resting ECG / Evaluating the ECG
Patient
Procedure System Services Help
Baker, Dave, 41 yrs REST ECG / 10-s-ECG
10 mm/mV 25 mm/s
1 32 54
aVR
aVL
aVF
Hellige
V1
V2
V3
V4
V5
V6
40 Hz 50 Hz
6
77
Figure 4.1-15. ECG trace display (2 x 6 leads)
1 Button to call up the optional 6-lead display (2 screens)
2 Buttons to change the gain and sweep speed
3 Button to zoom the ECG
4 Buttons to call up the other report pages (scrolling page by page)
5 Button to directly access specific pages
6 Procedure parameters
7 Buttons to display other time intervals
Patient
Procedure System Services Help
Hellige
ECG Trace Display
You can choose among three different formats for presentation of the ECG:
– 2 x 6 leads (Figure 4.1-15)
– 1 x 6 leads (Figure 4.1-16)
– 3 x 4 leads
Depending on the selected format and sweep speed the entire
ECG (10 seconds) may take up several screens. The default
format is the presentation of all 12 leads (Figure 4.1-15).
Measurements can be performed on all ECGs (amplitude/
intervals/slope) (refer to the next section entitled “Zooming
and Measuring the ECG”).
Click (forward) or (backward) (7) to display
another time window.
Click (2) to select another signal size.
Click and (2) to select another sweep speed.
Baker, Dave, 41 yrs REST ECG / 10-s ECG
10 mm/mV 25 mm/s
Click and (1) to display the 6 leads/screen
format (Figure 4.1-16).
40 Hz 50 Hz
aVR
aVL
aVF
2.01.0 3.0 4.0 5.0 6.0 7.0 8.0 9.0
Figure 4.1-16. ECG display, 6 leads/screen
227 498 02-A CardioSys V4.1 55
Page 56

The Resting ECG / Evaluating the ECG
Patient
Procedure System Services Help
Baker, Dave, 41 yrs REST ECG / 10-s ECG / Zoom
aVL
Hellige
1
3
701 ms
7
0.20.1 0.3 0.4 0.5 0.6 0.7
Figure 4.1-17.Zooming the ECG
1 Buttons to display the same segment in another
channel
2 Button to obtain a hardcopy of the displayed
screen
3 Measured amplitude
4 Button to quit the zoom display
5 Buttons to display the other report pages
(scrolling page by page)
6 Button to directly access specific pages
7 Scroll box to move the trace segment
Zooming and Measuring the ECG
Zooming
40 mm/mV 200mm/s 40 Hz 50 HzAmplitude 1.5 mV
4
5 62
The zoom function allows you to display a portion of the
ECG at a larger scale.
Click .
Move the cursor to the region of interest that you want
to zoom, and click. Your display looks similar to the one
shown on Figure 4.1-17.
Click to display the same time window in another lead. The label of the selected lead is shown below
the arrow buttons (Figure 4.1-17).
Drag the scroll box 7 (Figure 4.1-17) along the scroll bar
to displace the trace segment vertically and horizontally.
To obtain a true-to-scale hardcopy of the displayed
screen, click on the icon (the hardcopy includes the
caliper marks).
56 CardioSys V4.1 227 498 02-A
Page 57

The Resting ECG / Evaluating the ECG
Patient
Procedure System Services Help
Baker, Dave, 41 yrs REST ECG / 10-s ECG / Zoom
aVL
Reference Point 1
0.20.1 0.3 0.4 0.5 0.6 0.7
Hellige
701 ms
Figure 4.1-18. ECG measurement
40 mm/mV 200mm/s 40 Hz 50 Hz
Reference Point 2
Measuring the ECG
On all zoomed ECG displays you can measure amplitudes
(mV), intervals (ms) and slopes (mV/s).
As soon as you place the cursor in the ECG area, it
becomes a caliper.
Position the cursor on the first reference point and click.
A green caliper now marks reference point 1. Then
position the cursor on the second reference point and
click again. A yellow line connecting these two points
appears along with the measured value (Figure 4.1-18).
The result is given in mV for the amplitude, in ms for
the time interval, and in mV/s for the slope.
Click the right mouse button to delete a reference point
or an entire measurement.
On the zoomed display the position of the cursor is continuously indicated in mV at 3 (Figure 4.1-17), measured from
the grid line at the center.
Click to cancel the zoom display. The original
display reappears.
227 498 02-A CardioSys V4.1 57
Page 58

The Resting ECG / Evaluating the ECG
Go to…
Test Summary
ECG Traces
Medians (dom.)
Medians (subd.)
Arrhythmia Review
Interpretation
Cancel
Figure 4.1-19. Table of contents of the resting ECG report
Displaying Other ECG Report Pages
You can either scroll through all ECG report pages, or access
specific pages directly.
Click to scroll forward or to scroll backward
through the report.
Click to display the table of contents from which
you can choose specific report documents for review
(Figure 4.1-19).
Select the desired document by clicking.
The key functions described above are available for all documents. An explanation of the report pages follows on the next
few pages.
58 CardioSys V4.1 227 498 02-A
Page 59

The Resting ECG / Evaluating the ECG
Patient
Baker, Dave, 41 yrs REST ECG / Test Summary
Reason for Test
Measurements Summary
supraventr premature (SVPB)
left axis deviation
Medication
Comment
Physician Dr. Williams
Technician Dorothy
Test Summary
Procedure System Services Help
ABE F
because premature beat with same morphology
because QRS angle between -90° and -30°
Hellige
Figure 4.1-20. Test Summary
Age 48 years
Sex Male
Race Caucasian
Height 175 cm
Weight 80.0 kg
Blood Pressure
HR 84 BPM
QRS 106 ms
QT 392 ms
QTC 330 ms
PQ 180 ms
P 136 ms
RR 708 ms
PP 705 ms
Sokolov 3,50 mV
QTD 20 ms
< QRS -25°
< T 50°
< P 25°
-90
90
The Test Summary
The test summary (Figure 4.1-20) provides a survey of
Reason for Test (from the test information)
Measurements Summary (excerpt from interpretation, Figure
4.1-27)
Medication/Comment/Physician/Technician (from the test
information)
0
Patient Data
Blood Pressure (from the test information)
QRS, QT, QTC, PQ, RR, PP interval (from the “Measure-
ments”)
SOKOLOV LYON index: S (V1) + R (V5) or S (V1) + R (V6),
whichever is greater (from the “Measurements”)
QTD (QT dispersion): max. difference between max. QT
duration and min. QT duration of all leads
Vector angles
QRS, T and P angle (from the “Measurements”)
If you wish to add or edit procedure data, click on
ABE F
Changing the medication will cause the program to
reanalyze the ECG.
227 498 02-A CardioSys V4.1 59
.
Page 60

The Resting ECG / Evaluating the ECG
Patient
Procedure System Services Help
Baker, Dave, 41 yrs REST ECG / Test Summary
ABE F
Reason for Test
Export Data
Measurements(Analysis Program)
supraventr premature (SVPB)
because premature beat with same morphology
left axis deviation
because QRS angle between -90° and -30°
Medication
Comment
Physician Dr. Williams
Technician Dorothy
Export data to clipboard
Export data to file
Hellige
Figure 4.1-21. Data Export window
Age 48 years
Sex Male
Race Caucasian
Height 175 cm
Weight 80.0 kg
Blood Pressure
OK
HR 84 BPM
QRS 106 ms
Cancel
QT 392 ms
QTC 330 ms
PQ 180 ms
P 136 ms
RR 708 ms
PP 705 ms
Sokolov 3,50 mV
QTD 20 ms
< QRS -25°
< T 50°
< P 25°
-90
90
Data Export
The icon allows you to export the most important data
pertaining to the resting ECG procedure to the clipboard or
to any file. Data exported to the clipboard, for instance, can
be inserted in a text file with the “Edit” —> “Paste” command.
Click .
Select either “Export data to clipboard” or “Export data
0
to file”.
Click on
OK
.
Data from the clipboard can be imported in a word processing program with the “Paste” command.
For data exported to a file you will have to specify the target
directory and confirm it with
OK
.
60 CardioSys V4.1 227 498 02-A
Page 61

The Resting ECG / Evaluating the ECG
Medians (dom.)
Patient
Procedure System Services Help
Baker, Dave, 41 yrs REST ECG / Dominant Medians
20mm/mV
I
Measurements Reanalysis
aVR
Hellige
V1
2 31
II
III
Figure 4.1-22. Medians
Measurements
Patient
Procedure System Services Help
Baker, Dave, 41 yrs REST ECG / Measurements (dom. median)
QRS 102 ms P 122 ms NB 12
QT 444 ms RR 700 ms QTD 46 ms
QTC(H) 522 ms PP 700 ms
PQ 178 ms Sokolov 1.83 mV
aVL
aVF
V2
V3
1 Button to change the signal size
2 Button to display the measured values
3 Button to display the re-analysis screen
Hellige
Return… Reanalysis
< QRS -25°
< T 50°
< P 25°
Medians (dominant/subdominant)
The dominant (and, if present, the subdominant) medians of
all leads are displayed together on one screen (Figure 4.1-22).
V4
V5
V6
-90
aVR
aVL
0 I
II
III
90
aVF
The reference marks are shown as well. You are free to perform additional measurements as on the zoom display.
With the buttons you can change the signal size
(default: 20 mm/mV).
Click
Measurements
to display the measured values (Figure
4.1-23).
Click
Reanalysis
to display a screen which allows you to
adapt the analysis criteria to your needs (Figure 4.1-23).
Figure 4.1-23. Measurements (results obtained with the HEART
measurement program)
227 498 02-A CardioSys V4.1 61
Page 62

The Resting ECG / Evaluating the ECG
Reanalysis
Patient
Procedure System Services Help
Baker, Dave, 41 yrs REST ECG / Reanalysis (dom.median)
Select…
Reset Measurements Return… ECG Analysis
Hellige
40 Hz 50 HzV4
1
Figure 4.1-24.The reanalysis screen
1 active lead (highlighted)
If the program was unable to locate the begin-
☞
ning and end of the P wave (e.g. in the presence
of atrial fibrillation), the reference marks will be
dashed. In this case the user can click on them
with the right mouse button and drag them to
the appropriate position. The user-selected
marks are solid instead of dashed. It is possible
to restore the original position of the reference
marks by double-clicking on them.
Amplitude 0.10 mV
QRS 104 ms 102 ms
QT 394 ms 392 ms
PQ 174 ms 175 ms
P 132 ms 132 ms
Reanalysis (HEART ECG Measurement Program)
Click
Reanalysis
to call up the reanalysis screen (Figure
4.1-24).
Here you see the medians of all leads superimposed. The
reference marks determined by the system are located below
the ECG baseline, those above the baseline can be moved
with the mouse. A table in the top right-hand corner lists the
time intervals.
You can perform the same measurements as on the zoomed
display (amplitudes, intervals, slopes). The amplitude of the
cursor position is continuously displayed in the top line of the
table.
For a reanalysis of the ECG you can change the following
settings:
– You select the leads from which the average beats for
determination of the measurement marks are to be
derived and which are superimposed (
Select…
).
– From these leads you choose one whose median complex
is to be highlighted (buttons und ).
– You move the reference marks above the baseline to any
desired position (mouse).
– You perform a reanalysis (
ECG Analysis
– You cancel the reanalysis results (
62 CardioSys V4.1 227 498 02-A
).
Reset
).
Page 63

The Resting ECG / Evaluating the ECG
First select the leads from which you want to derive the
median complex for determination of the reference marks.
Only those beats will be superimposed.
Click
Select…
. A window opens showing all leads.
Select the leads (check mark = lead is selected).
Click
OK
to clear the window.
Click the arrow button or to select the lead to be
highlighted (1, Figure 4.1-24).
The measurement marks can be moved as follows:
Position the cursor on the mark to be moved (above the
baseline).
Click the mark and, holding the mouse button depressed, drag it to its new position. Now release the
mouse button. The time interval is updated in the table.
When all marks are in the correct position, click
ECG Analysis
for a reanalysis of the ECG.
Click
Reset
and then
ECG Analysis
, if you wish to
restore the original analysis results.
227 498 02-A CardioSys V4.1 63
Page 64

The Resting ECG / Evaluating the ECG
Arrhythmia Review
Patient
Procedure System Ser vices Help
Baker, Dave, 41 yrs REST ECG / Arrhythmia Review
Cycles >>
Determine HR
QRS Complexes 13
I
Hellige
1 2
10 mm/s 40 Hz 50 Hz
3
2.0 3.0 5.0 6.0 7.0 8.0 9.04.0
1.0
Mean RR Interval 726 ms
800 800
500 500
700 700 700 700700 700 700
Figure 4.1-25.Arrhythmia review
1 number of identified QRS complexes
2 HR
3 displayed lead
4 mean RR interval
4
700
HR 82 BPM
PVC
760
Arrhythmia Review
On the arrhythmia review screen (Figure 4.1-25) you see a
10-second segment of one lead at a time, including the identified events, such as PVC or PSVC.
A bar diagram below the signal trace indicates the deviation of
the RR interval from the mean RR interval.
When first called up, the display shows the lead that you
selected in the configuration menu. All other leads can be
selected with the arrow buttons and .
Furthermore you can determine the heart rate.
Measuring the Heart Rate in a Normal ECG
Click on the QRS complex at the beginning of the
interval to be measured; the system automatically positions the cursor in the correct place.
Click on the QRS complex at the end of the interval. A
line marks the measured interval and the resulting heart
rate is displayed.
64 CardioSys V4.1 227 498 02-A
Page 65

Cycles
The Resting ECG / Evaluating the ECG
Arrhythmia Review
Patient
Procedure System Ser vices Help
Baker, Dave, 41 yrs REST ECG / Arrhythmia Review
Cycles >>
Determine HR
QRS Complexes 13
III
1.0
Mean RR Interval 726 ms
800 800
500 500
1
Number
2.0 3.0 5.0 6.0 7.0 8.0 9.04.0
700 700 700 700700 700 700
Hellige
10 mm/s 40 Hz 50 Hz
HR 85 BPM
700
Figure 4.1-26. Calculating the heart rate
HR 85 BPM
PVC
760
Measuring the Heart Rate in the Presence of
Atrial Fibrillation or Flutter
In this situation you will have to define a cardiac cycle yourself.
Click
A window opens where you can enter the number of cycles
over which you want to measure the heart rate.
Click above Number to adjust the number of cycles.
Position the cursor at the beginning of the interval to be
measured and click.
Count the number of cardiac cycles, position the cursor
at the end of the interval and click again. The interval is
marked with a yellow line and the heart rate for this
interval is displayed (Figure 4.1-26).
.
Click the right mouse button to delete a single reference
point or an entire measurement.
227 498 02-A CardioSys V4.1 65
Page 66

The Resting ECG / Evaluating the ECG
Interpretation
Patient
Procedure System Services Help
Baker, Dave, 41yrs REST ECG/ Interpretation
ABE F
Measurements Summary
Statement Library
suspected left ventr. hypertrophy
because (R+S) in [V5] and QRS angle < -15°
minor left axis deviation
because QRS angle between -30° and 0°
negative T-wave (lateral)
because T <= -0.1 mV in [V6]
R/S inversion area between V1 and V2
Hellige
»
A
C
B
A
Interpretation
Figure 4.1-27. Interpretation screen
You can copy individual lines by double-clicking.
☞
Interpretation
The interpretation screen is split into two windows. The one
on the left shows the interpretation as derived by the system
or the library of interpretative statements, while the one on
the right is reserved for the physician’s interpretation. The
physician’s interpretation has priority over the system interpretation (for printing or in the procedure summary). Only
when the procedure is assigned to a patient can the physician’s
interpretation be entered.
When writing the physician’s interpretation you can first of
all choose between the interpretation from the analysis program and the statement library, then you can copy parts or all
of these statements to the right window. In the window at the
right you can edit these statements again, using the A icon
to cut text and the
place. You may also add any comments. Furthermore, you
can record a spoken comment, using the icon, provided
that a sound card has been implemented in your system and
that you have a microphone. This comment will be saved to
the corresponding patient file. It can be played back by clicking the icon.
A
icon to reinsert the text in any other
C
B
The interpretation is shown to be confirmed only after it was
signed by a physician ( ).
First select the information to be displayed: the program
measurements or the statement library (Figure 4.1-27).
If you wish to copy phrases to the right, highlight the
respective passages, then click .
To enter text directly into the window on the right,
move the cursor to the desired position, click the mouse
button and type the text.
66 CardioSys V4.1 227 498 02-A
Page 67

ABE F
The Resting ECG / Evaluating the ECG
Patient
Procedure System Services Help
Baker, Dave, 41yrs REST ECG/ Interpretation
ABE F
Measurements Summary
Statement Library
suspected left ventr. hypertrophy
because (R+S) in [V5] and QRS angle < -15°
minor left axis deviation
because QRS angle between -30° and 0°
negative T-wave (lateral)
because T <= -0.1 mV in [V6]
R/S inversion area between V1 and V2
Physician
Dr. Williams
2
Hellige
Review
»
A
A
C
B
Interpretation
Cancel
1
OK
10 mm/mV 25 mm/s
3
Figure 4.1-28. Interpretation screen with confirmation window
and ECG
1 Displays the list of registered physicians
2 Displays the other ECG leads
3 Removes the ECG leads
Confirming an Interpretation
The interpretation of a recorded ECG is confirmed only after
it has been reviewed and electronically signed by a physician
(marked with a “X” in the procedure list).
Click on (Figure 4.1-28) to display the window for
entry of the physician’s name.
Select the name from the list (open the list box with )
or enter a name via the keyboard.
Editing the Statement Library
The
icon becomes active as soon as you display the
statement library (1, Figure 4.1-27).
Click on
to open the window for entry of interpre-
ABE F
tative statements.
Key in new text or edit the existing phrases.
Select
OK
to clear the window.
Adding the ECG Waveforms
The icon can be used to display the ECG waveforms in
the bottom half of the interpretation screen (Figure 4.1-28).
Three leads are always displayed at a time. The other leads can
be viewed with (2, Figure 4.1-28). Click on or
to clear the ECGs.
227 498 02-A CardioSys V4.1 67
Page 68

The Resting ECG / Comparing Resting ECGs
Patient
Procedure Hilfsfunktionen Hilfe
Baker, Dave, 48 J Ruhe-EKG / Interpretation
R/S inversion area between V1 and V2
Procedure 1
10.08.1996 11:32:23
Procedure 2
10.08.1996 11:32:51 Resting ECG
Measurements(Analyseprogramm)
10.08.1996 11:12:45 Resting ECG
supraventr premature (SVPB)
10.08.1996 11:07:42 Resting ECG
because premature beat with same morphology
10.08.1996 11:40:18 Resting ECG
10.08.1996 11:35:29 Resting ECG
left axis deviation
because QRS-angel >= 90 Grad
because QRS-angel <= 90 Grad
negative T-wave (lateral)
because T <= 0.1 mV in (VG)
Hellige
Compare Test
»
A
C
B
A
Interpretation (Analyseprogramm)
OK
Cancel
Figure 4.1-29. Window for selection of a resting ECG
OK
Patient
Procedure System Services Help
Baker, Dave, 41 yrs REST ECG / Compare / 10-s ECG
Procedure 1 10.08.1996 · 11:32:51
Procedure 2 11.07.1996 · 10:30:06
Hellige
10 mm/mV 25 mm/s 40 Hz 50 Hz
4.1.5 Comparing Resting ECGs
You can compare the following details of two resting ECGs
– the 10-second ECG
– the median complexes (dominant and sub-dominant)
– the interpretation
At the same time it is possible to compare the median complexes of at least 3 and up to 6 ECGs.
Comparing Two Resting ECG
The system offers you to compare the present resting ECG
with another one stored in the database.
For the example below we assume that you wish to compare
the recent ECG with an earlier recording of the patient. Of
course, you are free to call up any ECG (section 3.3 “Editing
Stored Examinations”) and compare it with any other ECG as
described below:
1 2 43
10 mm/mV 25 mm/s 40 Hz 50 Hz
Click .
A window will open listing all of the patient’s resting ECGs
(Figure 4.1-29).
2.01.0 3.0 4.0 5.0 6.0 7.0 8.0 9.0
Select a recording and click
OK
to clear the
window.
Figure 4.1-30.Comparing two resting ECGs
The comparison screen appears (Figure 4.1-30).
1 Buttons to select the ECG leads
2 Procedure dates and times
3 Zoom button to display an enlarged ECG
segment (both traces superimposed)
It is possible to select multiple ECGs at the same
☞
time. To do so, hold the
Ctrl
key down while
clicking on the procedures.
4 Buttons to display the medians
68 CardioSys V4.1 227 498 02-A
Page 69

The Resting ECG / Comparing Resting ECGs
Patient
Procedure System Services Help
Baker, Dave, 41 yrs REST ECG / Compare / Zoom
Procedure 1 10.08.1996 · 11:32:51
Procedure 2 10.08.1996 · 11:32:51
Hellige
40 Hz 50 Hz
1
4
Figure 4.1-31. Comparing two zoomed ECG segments
1 Displays the same QRS complexes in other
leads
2 Displays the average beats, returns you to the
10-s ECG or to the interpretation
3 Moves ECG 2 up and down
4 Moves ECG 2 to the right and left
For each ECG the screen shows 3 leads at a time (25 mm/s,
10 mm/mV). ECG 1 is displayed in the top half, ECG 2
below. Click buttons and to display the other ECG
leads.
The button allows you to select a portion of the ECG
2
and display it at a larger scale. Identical segments of the two
procedures are superimposed.
3
Click .
Move the cursor to the region of interest (the cursor
becomes a magnifying glass) and click. You will see a
display similar to that shown in Figure 4.1-31.
You can move ECG 2 up/down/right/left, using buttons
and .
You can perform measurements on the ECG (amplitudes, intervals, slopes) as described in section 4.1.4
“Measuring the ECG”.
Clicking returns you to the 10-second ECG segments.
The median complexes and the interpretation can be
compared in the same way. Click and to
display them.
227 498 02-A CardioSys V4.1 69
Page 70

The Resting ECG / Comparing Resting ECGs
Patient
Procedure System Services Help
Baker, Dave, 41yrs REST ECG / Comparison of Medians
10mm/mV I...aVF
1
12.10.1996
11:08:14
6
12.10.1996
10:13:09
08.10.1996
10:43:43
I
II
2
Hellige
III
3 4
ST values
aVR
Figure 4.1-32.Comparing median complexes
1 Changes the signal size
2 Displays the other 6 leads
3 Displays/removes the ST values
4 Activates the zoom function
5 Prints the screen
6 Procedure date
aVL
10 mm/mV 25 mm/s
5
aVF
Comparing Median Complexes from Multiple Resting
ECGs
Click .
A window opens showing all resting ECGs of the patient in
question (Figure 4.1-29).
Select 2 to 5 ECGs and click on
OK
to clear the
window.
The next screen shows the median complexes of the selected
procedures (Figure 4.1-32).
The signal size (amplitude) can be changed with (1,
Figure 4.1-32). Other leads can be selected with (2).
If you wish to have the ST values annotated, check
ST values
Another useful function is the presentation of a large-scale
single median complex together with the same ST beat of the
other leads in the form of a so-called 3D graph:
.
First, click on , then on the ST beat you wish to see.
A display similar to Figure 4.1-33 will appear.
70 CardioSys V4.1 227 498 02-A
Page 71

The Resting ECG / Comparing Resting ECGs
Patient
Procedure System Services Help
Baker, Dave, 41yrs REST ECG / Comparison of Medians
12.10.1996 - 11:08:14
0,05 mV
II
0,10 mV/s
Hellige
1 2 3 4
Figure 4.1-33. Zoomed display
1 For display of the median complex as shown
from the other leads
2 To return to the ST comparison screen
3 To print out the screen display
4 To activate the 3D presentation
3D graph
40 mm/mV 200 mm/s
On this screen you can check
3D graph
(4, Figure 4.1-33) to
view a three-dimensional presentation of the beat (Figure
4.1-34).
Patient
Procedure System Services Help
Baker, Dave, 41yrs REST ECG / Comparison of Medians
12.10.1996 - 11:08:14
II
1 2 3 4
Hellige
+-
3D graph
40 mm/mV 200 mm/s
Figure 4.1-34.3D presentation
1 For display of the same beat as shown from the
other leads
2 To return to the ST comparison screen
3 To increase or reduce the distance between the
waveforms
4 To return to the zoomed display
08.10.1996 - 08:08:15
09.10.1996 - 12:25:04
12.10.1996 - 11:08:14
5
5 To select another viewing angle
227 498 02-A CardioSys V4.1 71
Page 72

The Resting ECG / Printing the Resting ECG
Print
Sütterlin, Franz, 48 J Ruhe-EKG / Vergleichen / 10 Sekunden
Pages to print 1
Aufnahme 1 10.08.1994 · 11:32:51
Aufnahme 2 10.08.1994 · 11:32:51
X Standard Page
ECG Format
continuous 10 sec.
Gain
2
10
Interpretation
(Physician/Program)
1
Rhythm Lead II
ECG Grid 5 mm
Number of Copies 1
Display Format
Measurements
Gain
mm/mV mm/mV
Dom. Median
Subdom. Median
10
Interpretation
(Physician/Program)
0
1
Barcode/Patient ID (22 chrs)
EPSON EPL 5700 (LPT1)
Procedure Date:
10-sec. ECG segment
10 mm/mV 25 mm/s 35Hz 50 Hz
Leads/Page
12
Gain
10
Speed
Modify…
mm/mV
25
mm/s
10 mm/mV 25 mm/s 35Hz 50 Hz
0
Figure 4.1-35.Resting ECG print setup screen
1 Number of pages of the entire report
2 Document selected for printout
01.08.94 · 11:40:23
Interpretation
System
X Physician
0
Print
Cancel
Save
Help
4.1.6 Printing the Resting ECG
The scope of the printed report is determined on the print
setup screen (Figure 4.1-35).
Click to call up the print setup screen.
The report includes the following documents:
– Standard Page
– Medians
– 10-second ECG segments
– Interpretation
Clicking the box in front of each of these documents includes
them in or excludes them from the report (check mark =
included). The length of each document and of the overall
report is also indicated.
Print
The
The
button initiates the printout.
Save
button saves the current settings.
Standard Page (Figure 4.1-36)
For the ECG display you can choose between:
continuous 10 sec: first 5-second segment of the first set of
six leads, second 5-second segment of
the second set of six leads or
sync 5 sec/ synchronized segments of all 12 leads
sync 2.5 sec: (the first 5 seconds or the first 2.5sec-
onds)
Figure 4.1-36. Report page, standard format
72 CardioSys V4.1 227 498 02-A
Page 73

The Resting ECG / Printing the Resting ECG
medians: the dominant average beats (medians)
continuous 2.5 sec: 3 leads each of second 1 to 2.5, 2.5 to
2 x 6 ch. 50 mm/s: 2 pages, the first set of 6 leads from
w/o. Arrhy 25 mm/s: without rhythm strip
w/o. Arrhy 50 mm/s: without rhythm strip
portrait: the standard page is printed in the
will be printed
5, 5 to 7.5, 7.5 to 10
second 1 to 5, the second set of 6 leads
from second 5 to 10
vertical (portrait) format.
H1: 12 median complexes + V1, II, V5, V2,
V3, V4
H1: 12 median complexes + I, II, III, V1,
V2, V5
Dom. Median/Subdom. Median (Figure 4.1-37)
You can print a page with the dominant average medians and
with the subdominant medians, if these were found as well.
For more information, you may add either the measurements
or the ST profile.
Figure 4.1-37. Report page, medians
227 498 02-A CardioSys V4.1 73
Page 74

The Resting ECG / Printing the Resting ECG
10-second ECG segment (Figure 4.1-38)
Here you set up the system for printout of the full 10-second
ECG. You can choose to print either 6 or 12 leads/page and
you select the gain and paper speed. The resulting number of
pages to be printed is indicated.
Interpretation (full) (Figure 4.1-39)
In this window you set up the system for printout of the full
interpretation (interpretation as derived by the system and/or
physician’s interpretation).
Figure 4.1-38. Report page, 10-s ECG segments
Figure 4.1-39. Report page, interpretation
Rhythm Lead
The standard page and the interpretation page include the 10second ECG strip of the rhythm lead. However, you can
select another channel to be printed.
Printer
Selection of the printer model and port (LPT) to which the
printer is connected.
Barcode/Patient ID
The patient ID no. can be annotated on the report in the
form of a barcode. This allows you to scan the code with a
barcode reader and thus assign the report to the correct patient.
74 CardioSys V4.1 227 498 02-A
Page 75

Setup
The Resting ECG / System Defaults
Setup
Speed (mm/s) 25
Gain (mm/mV) 10
Lead check noise level low
QTC Calculation Hegglin-Holzmann
Lead Sequence STANDARD
Rhythm Lead II
Print after Analysis
Report
Figure 4.1-40. Setup menu
Modify
Hellige
Setup
X 1-mV Cal Pulse
Audible LEAD OFF Alarm
Manual Override
Modify
40-Hz Filter
50-Hz Filter
Spline
OK
Cancel
Help
4.1.7 Setup
From the setup menu you can select a number of system
settings to suit your personal needs and preferences. These
settings will be retained. They are automatically activated each
time the system is turned on.
Click
(Figure 4.1-40).
Use this screen to select your personal system settings.
Adjustments are made in three different ways:
1 There is an arrow at the end of a box ( ).
Clicking this arrow will open a window which offers
various options. Select the desired setting by clicking the
mouse button.
to display the setup menu screen
2 There is a check box in front of the function. Click the
box to enable or disable the function (X function
enabled).
3 Click the
Modify…
button (for instance, to select the Lead
sequence).
Speed
selects the trace sweep speed
Gain
selects the signal size (amplitude)
227 498 02-A CardioSys V4.1 75
Page 76

The Resting ECG / System Defaults
Lead check noise level
This is a measure of the quality of the acquired signal (signalto-noise ratio). When there is too much signal noise at the
electrode, the electrode is displayed yellow on the signal
acquisition screen. The setting that you select here (low,
middle, high) changes the threshold as of which the electrode
is displayed yellow (high sensitivity to noise = low threshold).
1-mV Cal Pulse
display of 1-mV calibration pulse: yes or no (X yes)
Audible LEAD OFF Alarm
audible signal when an electrode is disconnected: yes or no
(X yes)
Manual Override
When the function is enabled, the program will start the
signal acquisition, even if not all electrodes are applied.
Speed (mm/s) 25
Gain (mm/mV) 10
Lead check noise level low
Hellige
Setup
X 1-mV Cal Pulse
Audible LEAD OFF Alarm
Manual Override
QTC Calculation
Equation for calculation of the QT interval: HEGGLINHOLZMANN or BAZETT.
Lead Sequence
QTC Calculation Hegglin-Holzmann
Lead Sequence STANDARD
Rhythm Lead II
Print after Analysis
Report
STANDARD
STANDARD
CABRERA
HIGH
Modify
NEHB
RIGHT
LEFT
Modify
Figure 4.1-41. Lead sequence selection window
40-Hz Filter
50-Hz Filter
Anti-Drift System
OK
Cancel
Help
In the lead sequence window you can assign the leads to the
recording channels. Six lead sequences are predefined. Four of
these (sequences 3 to 6) can be modified.
STANDARD: I, II, III, aVR, aVL, aVF, V1...V6
fixed
CABRERA: aVL, I, -aVR, II, aVF, III, V1...V6
HIGH: I, II, III, aVR, aVL, aVF, V1'...V6'
NEHB: I, II, III, aVR, aVL, aVF, D, A, J, I, II, III
RIGHT: I, II, III, aVR, aVL, aVF, V4R, V3R, V1, V2, V3, V4
LEFT: I, II, III, aVR, aVL, aVF, V4, V5, V6, V7, V8, V9
76 CardioSys V4.1 227 498 02-A
Page 77

The Resting ECG / System Defaults
Modify…
Hellige
Lead Sequence
Sequence
I
II
III
aVR
aVL
aVF
V1'
Modify
V2'
V3'
V4'
V5'
V6'
Lead Sequence
Modify
Defaults
Hellige
Defaults
HIGH
Speed (mm/s) 25
Gain (mm/mV) 10
Lead check noise level low
QTC Calculation Hegglin-Holzmann
Lead Sequence STANDARD
Rhythm Lead II
Print after Analysis
Report
Lead
I
1
II
2
III
3
aVR
4
aVL
5
aVF
6
V1
7
V2
8
V3
9
V4
10
V5
11
V6
12
Figure 4.1-42. Modifying the lead sequence
HIGH
Speed (mm/s) 25
Gain (mm/mV) 10
Lead check noise level low
QTC Calculation Hegglin-Holzmann
Lead Sequence STANDARD
Rhythm Lead II
Print after Analysis
Report
Lead Sequence
I
I
II
III
aVR
aVL
aVF
V1
V2
V3
V4
V5
V6
D
A
J
Figure 4.1-43. Modifying the lead sequence
X 1-mV Cal Pulse
Audible LEAD OFF Alarm
Manual Override
Modify
OK
Cancel
Help
X 1-mV Signal
Audible LEAD OFF Alarm
Modify
OK
Cancel
Help
40-Hz Filter
50-Hz Filter
Anti-Drift System
OK
Cancel
Help
40-Hz Filter
50-Hz Filter
Anti-Drift System
OK
Cancel
Help
Modifying the Lead Sequence
Click to the right of Lead Sequence to open the lead
sequence selection window (Figure 4.1-41).
Click the sequence that you wish to modify (lead sequences 3 to 6 only).
Modify…
Click
to open a window showing all channels
(Figure 4.1-42). There is a window for each of the
channels indicating the lead currently assigned to that
channel. To select another lead click to display all
available leads (Figure 4.1-43).
Select the new lead to be recorded in the respective
channel.
Enter up to 4 characters in the “Designation” column to
label the lead.
Once you have assigned a new lead to each of the channels,
you can enter a name for the lead sequence in the headline.
Move the cursor to the text box and click.
Enter a name and select
Click
OK
(modifications are saved) or
OK
to clear the window.
Cancel
(modifications are ignored) to clear the configuration
screen.
227 498 02-A CardioSys V4.1 77
Page 78

The Resting ECG / System Defaults
Rhythm Lead
rhythm or reference lead
Print after Analysis
Do you wish to print the report set up on the screen mentioned above immediately after the ECG analysis or not.
Report Modify
Here you determine the scope of the report printed with the
“Print after Analysis” command. The special configuration
screen is described in detail in section 4.1.6 “Printing the
Resting ECG”.
40-Hz Filter
enables or disables muscle filter (X muscle filter on)
50-Hz/60-Hz Filter
enables or disables AC filter (X AC filter on)
Spline
Enables or disables the Cubic Spline algorithm (automatic
baseline correction, X Spline on); the algorithm causes a
signal delay of 4 seconds. On the signal acquisition and
control screen the algorithm can be disabled temporarily to
view the undelayed ECG signal.
78 CardioSys V4.1 227 498 02-A
Page 79

The Resting ECG / Brief Operating Instructions
4.1.8 Recording a Resting ECG
(Brief Operating Instructions)
Turn on system and display the resting ECG
screen
Enter new patient or retrieve patient from the
database
Apply electrodes and check signal quality
OK
Enter test information
mm/mV
Select procedure parameters (sweep speed, sensitivity, lead sequence)
Watch ECG traces and – when the most recent 10
seconds are without artifacts – start recording
Save procedure (when patient data were entered,
the system saves the recording automatically)
The ECG traces are displayed
Scroll through the procedure report pages or call
them up directly from the table of contents
Print the ECG
Proceed to next procedure or
Quit program
227 498 02-A CardioSys V4.1 79
Page 80

For your notes
The Resting ECG
80 CardioSys V4.1 227 498 02-A
Page 81

The Exercise ECG
4.2 The Exercise ECG
This section describes the operating steps necessary to
conduct an exercise test. You will learn how to
– apply the electrodes and connect the patient
– enter the test demographics (indication, medication,
comments, etc.)
– select a protocol and run the exercise test
– call up the report pages for on-screen review
– print reports
– specify system defaults that will be activated each time
the system is turned on
– monitor remote test stations
– conduct an exercise test, using the function keypad
The brief operating instructions at the end of the section
sum up what you have to do to record an exercise ECG.
227 498 02-A CardioSys V4.1 81
Page 82

The Exercise ECG / Some Basic Facts
Test Information
Library: Reason for Test
History of chest discomfort
Evaluate effect of medication
Evaluate effect of CABG
Evaluate effect of PTCA
Evaluate functional capacity
Stress echo study
Stress thallium study
Rule out/confirm CAD
Post-MI study
...
Blood Press [mmHg]
Medication
Comment
Physician:
Technician:
Referring Physician:
ABE F
sys
»
dia
Reason for Test
Protocol
Target HR(%)
…
Bruce
100
A
Cancel
Help
A
B
180/min
OK
C
Figure 4.2-1. Dialog window for entry of the test information
4.2.1 Some Basic Facts
Before recording your first exercise ECG, go to the
☞
defaults screen and choose the basic system settings
(section 4.2.7 “Exercise Test Setup”). These settings will be retained and are automatically
activated each time the system is turned on.
Click on to start the program
After you have selected the patient, the system displays the
dialog window for entry of the test information (Figure 4.2-1)
(unless this option was deselected in the System configuration). We recommend applying the electrodes to the patient,
following the instructions given in section 4.2.2, before
entering the test demographics.
82 CardioSys V4.1 227 498 02-A
Page 83

The Exercise ECG / Applying the Electrodes
4.2.2 Applying the Electrodes
C3R
C4R
C1
C3
C4
C5
C6
obtaining an interference-free ECG. The signal acquisition
screen immediately gives you a visual indication of your
C2
electrode technique and of the signal quality, provided the red
R electrode is applied.
Careful application of the electrodes is a prerequisite for
C8
C7
For quick, reliable and trouble-free application of the elec-
C4R
C3R
C1
C2C3
C4
C6
C5
trodes we recommend our Electrode Application System (refer
to the Electrode Application System operator’s manual).
As an alternative you can use our disposable electrodes
(919 200 31, pkg. of 200).
Skin Preparation
* Shave the electrode application points, if necessary.
Figure 4.2-2.Electrode application points
C1 in the 4th intercostal space at the right
* Carefully degrease the application points with a cotton
swab soaked in benzine.
sternal edge
C2 in the 4th intercostal space at the left sternal
edge
C3 at the level of the 5th rib midway between
C2 and C4
C4 in the 5th intercostal space on the left
midclavicular line
C5 on the left anterior axillary line between C4
* Prep the application points with skin prepping paste
(EPICONT). To do so, apply a small amount of paste to
the tip of a cotton swab. Place the tip against the skin at
the electrode site and twirl the swab 4 to 5 times between
your thumb and index finger, lightly pressing on the swab.
and C6
C6 on the mid-axillary line at the level of C4
* Connect the electrode leads to the electrodes.
C7 in the 5th intercostal space on the left
posterior axillary line
C8 in the 5th intercostal space on the left
scapulary line
* Remove the backing paper from the electrodes and press
the electrodes firmly into place.
R, L on the right and left shoulders
N, F above the right and left kidneys
227 498 02-A CardioSys V4.1 83
* Secure each electrode lead with surgical tape.
Page 84

The Exercise ECG / Applying the Electrodes
N black
R red
C1 white
C2 white
C3 white
C4 white
C5 white
C6 white
L yellow
F green
above right kidney
on right shoulder
on left shoulder
above left kidney
C2
C1
C3
C5
C6
C4
C8
C7
C6
C5
C4
C2C3
C1
Figure 4.2-3. Connecting the patient cable (10-wire, standard
ECG leads)
Please observe the information given in sections
☞
7.1 “Artifact Due to Poor Electrode Application”,
7.2 “ECGs of Pacemaker Patients” and 7.3 “ECG
Recording During Defibrillation” in the appendix.
* Secure the patient cable with a holder 303 441 61 (bicy-
cle ergometer) or with a strap 923 096 72 (treadmill).
Electrode Application Points for Standard Leads
(I, II, III, aVR, aVL, aVF, V1 to V6)
Four limb and six chest electrodes are usually required for the
acquisition of the standard leads. In stress testing, however,
we recommend attaching the limb electrodes on the shoulders
(where there are no muscles) or above the kidneys (Figure
4.2-2).
* Connect the patient cable as shown in Figure 4.2-3.
* Secure the electrode distributor of the patient cable
(chest strap or holder).
The red R electrode is the reference electrode.
☞
Placement and signal quality of all other electrodes can be assessed on the signal acquisition
* Connect the patient cable to the device (type CF signal
input: highly isolated, suitable for intracardiac application, defibrillation-proof).
screen only when this electrode is applied.
84 CardioSys V4.1 227 498 02-A
Page 85

The Exercise ECG / Entering the Test Information
Test Information
Library: Reason for Test
History of chest discomfort
Evaluate effect of medication
Evaluate effect of CABG
Evaluate effect of PTCA
Evaluate functional capacity
Stress echo study
Stress thallium study
Rule out/confirm CAD
Post-MI study
...
Blood Press [mmHg]
Medication
Comment
Physician:
Technician:
Referring Physician:
ABE F
1
5
sys
Reason for Test
»
Protocol
Target HR(%)
dia
…
7
Figure 4.2-4. Test Information dialog window
1 The standard reasons for test
2 The patient’s reason for test
3 Test protocol
4 Target HR in %
5 Blood-pressure readings
6 Medication
7 Dialog boxes for comments, the physician’s name
and the technician’s (user’s) name
6
Bruce
100
2
A
4
Cancel
Help
A
B
180/min
OK
4.2.3 Entering the Test Information
C
3
The test information window allows you to make all entries
and settings relevant to the test.
These are:
– the reason(s) for the test
– the test protocol
– the target heart rate
– the blood-pressure readings
– the medication(s)
– comments
– the names of the physician, of the referring physician
and/or user (ECG technician).
227 498 02-A CardioSys V4.1 85
Page 86

The Exercise ECG / Entering the Test Information
ABE F
History of chest discomfort
Evaluate effect of medication
Evaluate effect of CABG
Evaluate effect of PCTA
Evaluate functional capacity
Stress echo study
Stress thallium study
Rule out/confirm CAD
Post-Ml study
…
…
…
Modify Library: Reason for Test
OK
Cancel
Help
Figure 4.2-5. Window for entry of standard reasons for test
A reason for test is easily copied from the library
☞
to the right window by double-clicking!
Copying Reasons for Test to the Patient Indication Window
Highlight the statement by clicking.
Click the button.
If you wish to delete a copied statement or part of it,
highlight the words in question and click
.
A
The deleted words can be inserted in another position by
placing the cursor there and clicking
A
.
C
B
You can also enter a reason for test directly by moving
the cursor to the desired position and typing the text.
Editing the Library
Click
ABE F
.
This will open the library window (Figure 4.2-5).
Move the cursor to the desired position in the list and
click the mouse button.
Enter a reason for test, and press on the keyboard.
The cursor moves to the beginning of the next line.
In this manner you may enter up to 12 standard reasons.
When the window is full, it will not accept any more
entries. Click
86 CardioSys V4.1 227 498 02-A
OK
to clear the window.
Page 87

The Exercise ECG / Entering the Test Information
Test Information
Library: Reason for Test
History of chest discomfort
Evaluate effect of medication
Evaluate effect of CABG
Evaluate effect of PTCA
Evaluate functional capacity
Stress echo study
Stress thallium study
Rule out/confirm CAD
Post-MI study
...
Blood Press [mmHg]
Medication
Comment
Physician:
Technician:
Referring Physician:
ABE F
sys
»
dia
Figure 4.2-6. Protocol selection window
Reason for Test
Protocol
Target HR(%)
…
Bruce
Bruce
Bruce
100
ModBruce
Naughton
Ellestad
ModBalke
USAFSAM
SlowUSAFSAM
Cornell
A
Cancel
Help
A
B
180/min
OK
Selecting a Test Protocol
C
The program defaults to the test protocol specified in the
Exercise Test Setup (section 4.2.7). On this screen, however,
you can choose another protocol for the present test.
Click on .
The protocol list box opens (Figure 4.2-6).
Click on the protocol you wish to use.
Adjusting the Target HR
The target heart rate that the patient is expected to attain
during the test can either be adjusted manually, or the system
will calculate this value automatically (section 4.2.7 “ExerciseTest Setup ”). Furthermore, you can change the calculated or
entered value (e.g. 90% of 180 = 162). This setting will be
retained.
Entering Blood-Pressure Readings
Blood-pressure readings are either entered directly via the
keyboard or they are selected and changed in steps of 5 mmHg
by clicking on the arrow boxes. In the systolic box, the values
start from 120 mmHg, in the diastolic box, from 80 mmHg.
Move the cursor to the “sys” box and click the left mouse
Click on to display and increase the value, or
☞
button.
click on to decrease the value.
Enter the value via the keyboard.
Proceed in the same manner to enter the diastolic value.
227 498 02-A CardioSys V4.1 87
Page 88

The Exercise ECG / Entering the Test Information
Test Information
Library: Reason for Test
History of chest discomfort
Evaluate effect of medication
Evaluate effect of CABG
Evaluate effect of PTCA
Evaluate functional capacity
Stress echo study
Stress thallium study
Rule out/confirm CAD
Post-MI study
...
Blood Press [mmHg]
Medication
Comment
Physician:
Technician:
Referring Physician:
none
unknown
medication stopped
nitrates
beta-blockers
…
ABE F
sys
Reason for Test
»
Protocol
Target HR(%)
dia
…
Figure 4.2-7. List of medication groups
The physician is responsible for assigning drugs to a
☞
medication group.
Bruce
100
A
Cancel
Help
A
B
180/min
OK
Selecting a Medication, Assigning a Drug Name to a
C
Medication Group
You can select a medication from a list of medications . You
can also select 4 more medications and assign specific drugs to
the medication groups to include these in the list instead of
the group name. The window permits entry of the medication
dose ….
Making a Selection
Click on to open the medication list box (Figure
4.2-7).
Select one of the medications.
To select additional medications, to enter a medication
dose or to assign drug names to medication groups, click
…
.
Assigning Drugs to a Medication Group
Medications…
Medication Group Drug Name
none
unknown
medication stopped
nitrates
beta-blockers
diuretics
anti-hypertensives
digitalis
Ca antagonists
antiarrhythmics
glycoside
Medication
–>
–>
–>
–>
–>
–>
–>
–>
–>
–>
–>
–>
OK
Cancel
Click on
Medications…
.
A window opens, showing several medication group names
(Figure 4.2-8). There is a drug name window for each of these
groups. Click on the respective text box, if you wish to enter a
name. Then type the drug name.
Furthermore, you are free to arrange the medication groups
any way you want. To do so
Click on the at the end of the group name box.
Figure 4.2-8. Assigning a drug to a medication group
88 CardioSys V4.1 227 498 02-A
Page 89

The Exercise ECG / Entering the Test Information
Medication
Medication Group Drug Name
none
none
none
unknown
unknown
medication stopped
medication stopped
nitrates
nitrates
beta-blockers
diuretics
beta-blockers
anti-hypertensives
diuretics
digitalis
Ca antagonists
anti-hypertensives
antiarrhythmics
digitalis
glycoside
Ca antagonists
antiarrhythmics
glycoside
–>
–>
–>
–>
–>
–>
–>
–>
–>
–>
–>
–>
Figure 4.2-9. Editing the medication group
OK
Cancel
This brings up a new window where you can choose one of
the group names (Figure 4.2-9).
Click on the drug name box and enter the name
Click on
OK
to clear the window.
Entering Comments
If you wish to enter a comment on the test procedure, click in
the “Comment” text box and key in the text.
Physician’s/User’s Name
The names of the physician and user can either be entered
here (click in the text box and type the name), or they can be
selected from the list of the registered system users (section
6.1 “System Configuration”).
Click on and choose a name from the list by clicking
on it.
Exiting the Test Information Screen
Once you have entered all test information, you can either
– clear the window with
OK
and start conducting
the exercise test or
– clear the window with
Cancel
(in this case the test
demographics will be ignored and are not assigned to the
test) to display the preacquisition screen
227 498 02-A CardioSys V4.1 89
Page 90

The Exercise ECG / Entering the Test Information
From the preacquisition screen, you can
– check the signal quality
– return to the test information screen
– access the system setup screen
– temporarily modify the selected phase with
Modify…
(enter test information before modifying the test phase,
otherwise the changes will be lost).
Please refer to section 4.2.7 for a detailed explanation of the
preacquisition screen and the exercise-test setup.
If you select
OK
to clear the window, the entries just
made will be assigned to the present test procedure and the
preacquisition screen will appear. In the next section we will
explain how an exercise test is conducted.
90 CardioSys V4.1 227 498 02-A
Page 91

The Exercise ECG / Running an Exercise Test
I
Baker, Dave, 41 yrs. Exercise Test
>>
Phase
6
>>
5
Lead CheckBP/Comment Freeze ECG
14
16
3
13
4
Hold Stage
1
00:42
00:42
11
V1
V2
V3
V4
V5
V6
WHO
#1
2
12
10
Print Event Mark ST/Medians Trends ECG Strips
Figure 4.2-10. Signal acquisition screen for a bicycle exercise test
1 Time elapsed in current phase
2 Time elapsed in stage
3 Stage number
4 Current phase and button to modify the protocol
5 Buttons to hold the stage and to proceed to the next stage
6 Button to proceed to the next phase
7 Current load and revolutions/minute, buttons to increase or
decrease the load in steps of 5 Watts
8 Windows indicating the heart rate and the rate-pressure
product (RPP) (HR in red when max. HR is exceeded),
diagram of the % of the max. HR
9 Blood-pressure values (with some ergometers the cuff pressure
is indicated here during a BP measurement)
10 Button to abort the test
11 Button to initiate a printout (laser printer or thermal-array
printer)
12 Button for entry of comments and blood pressure
13 Button to mark an event episode (the episode is saved at the
same time)
14 Button to verify the ECG signal quality (all leads)
15 Button to freeze and release the signal traces
W
RPM
+
-
0
7
+
-
Interpretation
15
QRSL
12345s
V6/Scan
19
1,88 mV/s
0,07 mV
E
10 mm/mV 25 mm/s
X ADS
HR[BPM]
% of 179
RPP
SYS/DIA (mm/Hg)
VPB/min
J
20
1,88
0,07
J+60 ms
21
8
9
Rest
85
17
18
4.2.4 Running an Exercise Test
The signal acquisition screen appears when you have entered
the test information and clear the dialog window with
1
OK
. For bicycle ergometers the screen is similar to
Figure 4.2-10, for treadmills it is similar to Figure 4.2-11.
Please take a few seconds to become familiar with all the
details shown on this screen, before proceeding to start the
test.
16 Buttons to display the ST profiles and medians, the trends
and the stored ECG
17 Results of the arrhythmia analysis (complex ectopy in red)
and number of VPB/min
18 ST median beat window and ST analysis results (resting
beat analysis results are shown with a different color)
19 Button for selection of another lead
20 Buttons for adjustment of the E, J, and J+X point (only
when “Manual” has been selected in the Defaults menu)
21 Procedure parameters and buttons to modify the signal
sensitivity and to temporarily disable the ADS (anti-drift
system)
227 498 02-A CardioSys V4.1 91
Page 92

The Exercise ECG / The Signal Acquisition Screen of an Exercise Test
I
Baker,Dave, 41 yrs. Exercise Test
>>
Phase
6
>>
5
Lead CheckBP/Comment Freeze ECG
14
16
3
13
4
Hold Stage
1
00:42
00:42
Print Rhythm Event Marker ST/Medians Trends ECG Strips
11
V1
V2
V3
V4
V5
V6
P-Bruce
Supine
2
12
10
+
-
Stop Treadmill
7
+
%
15
VPB
Start Treadmill
-
Interpretation
HR[BPM]mph
85
8
9
RPP
SYS/DIA (mm/Hg)
VPB/min
17
12345s
1,88
0,07
Rest
J+60ms
J+60 ms
18
V6/Scan
19
1,88 mV/s
0,07 mV
E
J
20
10 mm/mV 25 mm/s
X ADS
21
Figure 4.2-11.Signal acquisition screen for a treadmill exercise
test
1 Time elapsed in current phase
2 Time elapsed in current stage
3 Stage number/name
4 Current phase and button to modify protocol
5 Buttons to hold the stage and to proceed to the next stage
6 Button to proceed to the next phase
7 Current speed and grade, buttons to increase or decrease the
speed and the grade
8 Buttons to start and stop the treadmill (protocol continues)
9 Windows indicating the heart rate, rate-pressure product
(RPP) and the blood pressure
10 Button to abort the test
11 Button to initiate a printout (laser printer or thermal-array
printer)
12 Button for entry of comments and blood pressure
13 Button to mark an event episode (the episode is saved at the
same time)
14 Button to verify the ECG signal quality (all leads)
15 Button to freeze and release the signal traces
The Signal Acquisition Screen of an
Exercise Test
The signal acquisition screen (Figure 4-11) of the exercise test
1
presents the following information:
– the current load and RPM or speed and grade (7)
– the current stage (3) and the time elapsed in that stage (2)
– the current phase (4) and the time elapsed in that phase (1)
– the heart rate, RPP and blood pressure (9)
– the results of the arrhythmia analysis (complex ectopy in
red) and number of VPB/min (17)
– the ST analysis results compared with the resting beat
analysis results (18) (“Scan” indicates that the lead with
the most prominent ST depression is displayed (leads I,
aVR, aVL, V1 and V2 are not considered))
– various procedure parameters (21)
16 Buttons to display the ST profiles and medians, the trends
and the stored 12-lead ECG
17 Results of the arrhythmia analysis (complex ectopy in red)
and number of VPB/min
18 ST median beat window and ST analysis results (resting
beat analysis results are shown with a different color)
19 Button for selection of another lead
20 Buttons for adjustment of the E, J, and J+X point (only
when “Manual” has been selected in the Defaults menu)
21 Procedure parameters and buttons to modify the signal
sensitivity and to temporarily disable the ADS (anti-drift
system)
92 CardioSys V4.1 227 498 02-A
Page 93

The Exercise ECG / The Elements of an Exercise Test
The Elements of an Exercise Test
Ergometers without Digital Communication Interface
(e.g., MEDITRONIC M 400)
With these ergometers, the test follows the stored test phases.
This is to say that the initial load and load increase displayed
in the protocol have to be adjusted manually at the ergometer.
Manual modifications of the protocol (load increase or selection of the next test phase) must also be repeated at the ergometer.
On the setup screen (section 4.2.7) select the “internal”
ergometer.
If you wish to obtain a recording at the end of each load
stage only, set the “ECG Rec. Inter. EI” to the duration
of the load stage.
Select a protocol and adjust the required initial load at
the ergometer.
Click the button. Wait for the first ST meas-
urement to be displayed which is to be saved as the
reference beat at rest (option) (18, Figure 4.2-10 and
Figure 4.2-11).
As trend values are saved at 30-second intervals, we recommend that you wait approx. 30 seconds before starting to
pedal.
Phase
Then press the
>>
button and ask the test subject to
start pedalling.
227 498 02-A CardioSys V4.1 93
Page 94

The Exercise ECG / The Elements of an Exercise Test
Window (2) in Figure 4.2-10/4.2-11 indicates the remaining
time in the current stage, while window (1) shows the time
elapsed in that phase.
At the end of the load stage, the load increase displayed by the
program must be adjusted at the ergometer. As a general rule
you are required to repeat all load changes at the ergometer as
demanded by the program.
During the test you can
Stage
Hold
>>
+ 5
Phase
>>
(upon comple-
advance to the next load stage with
continue at the same load with
modify the load in steps of 5 Watts with
advance to the recovery phase with
tion of the last stage, the program automatically activates
the recovery phase)
terminate the test with .
and
- 5
Pre-Test Test Phase Recovery Phase
>>
Change load as
required by
protocol
Adjust initial load
of selected
protocol
Test Information
Phase
Prot. 1 Pedal!
Select protocol.
Check recording
interval
When analyzing
ST segment, wait
for 1st results to
be displayed
>>
Stage
>>
Hold
Automatic, when
last stage is
completed, or
manual
Phase
Figure 4.2-12. Program sequence with MEDITRONIC M 400
94 CardioSys V4.1 227 498 02-A
Page 95

The Exercise ECG / The Elements of an Exercise Test
Ergometers without Digital Communication Interface but with Remote Start Capability (e.g., MEDITRONIC M 40)
As above, but there is no need to select the next phase manually at the ergometer, as this is done by the remote start signal.
On the setup screen (section 4.2.7) select the “intern.
remote start” ergometer.
If you wish to obtain a recording at the end of each load
stage only, set the “ECG Rec. Inter. EI” to 00:00 min.
For “Time in stage” (TS) enter a time which is considerably longer than the corresponding value at the ergometer.
Select a protocol and adjust the corresponding initial
load at the ergometer.
Click the button. Wait for the first ST measurement to be displayed (option) (18, Figure 4.2-10/
4.2-11).
As trend values are saved at 30-second intervals, we recommend
that you wait approx. 30 seconds before starting to pedal.
Phase
Then press the
>>
button and ask the test subject to
start pedalling. If your ergometer sends a remote start
impulse when the patient starts pedalling, there is no
Phase
need to click the
>>
button.
Window (2) in Figure 4.2-10 indicates the remaining time in
the current stage, while window (1) shows the time elapsed in
that phase.
During the test you can
modify the load in steps of 5 Watts with
- 5
; do not forget to make the same adjustments at the
+ 5
and
ergometer
Phase
advance to the recovery phase with
>>
(upon completion of the last stage, the program automatically activates
the recovery phase)
terminate the test with .
Pre-Test Test Phase Recovery Phase
Adjust initial load
and load increase /
stage of selected
protocol
Test Information
Phase
Prot. 1 Pedal!
Select protocol.
Check recording
interval
When analyzing
ST segment, wait
for 1st results to
be displayed
>>
+5 Phase
Automatic, when
last stage is
completed, or
manual
Interactive load
change (+5 W) and
adjust load for
recovery phase
>>
Figure 4.2-13. Program sequence with MEDITRONIC M 40
227 498 02-A CardioSys V4.1 95
Page 96

The Exercise ECG / The Elements of an Exercise Test
Ergometers with Digital Communication Interface (ERGOCOMP EC 560/ECB 561 / ERGOLINE 900/900L, EC 1200 V3.52)
The EC 1200 will display the version number when turned
on. The following explanations refer to version 3.52 or higher
(upgrade, if possible). For older versions, see section “M 700
and EC 1200”.
With these ergometers the selected protocol fully controls the
test procedure. The ergometer operating controls are inoperative. Only blood pressure measurements can be taken manually. Refer to Appendix 6 “Connecting External Devices”.
EC 1200
Blood pressure intervals are valid only for external BP meters
(appendix, section 6). BP meters must be connected directly
when used with EC 1200 version 3.52 and higher. They are
controlled by the stage time. The BP intervals are ignored.
On the setup screen (section 4.2.7) select
“ERGA” for EC 560/ECB 561,
“ERG 900” for ERGOLINE 900/900L and
“EC 1200 (V3.52)” for EC 1200 version 3.52 or higher.
With ERG 900, select the recovery phase “recovery ERG
900” (25 W, 1 minute, then 0 W) only if you expect to
do a low-impact test. The BP meter will then respond
more promptly to the load decrease.
Select a protocol.
Click the button.
A blood pressure measurement is now taken automatically, if
configured. Wait until the readings are available or until the
first ST measurement is displayed (option) (18, Figure 4.2-10).
As trend values are saved at 30-second intervals, we recommend that you wait approx. 30 seconds before starting to
pedal.
* Ask the test subject to start pedalling.
Pre-Test Test Phase Recovery Phase
Test Information
Prot. 1 Pedal
Select protocol.
Check recording
interval
When analyzing
ST segment, wait
for 1st results to
be displayed
+ 5
Hold
Phase
>>
Automatic, when
last stage is
completed, or
manual
Figure 4.2-14. Program sequence with ERGOCOMP EC 560/ECB 561
96 CardioSys V4.1 227 498 02-A
Page 97

The Exercise ECG / The Elements of an Exercise Test
Window (2) in Figure 4.2-10 indicates the remaining time in
the current stage, while window (1) shows the time elapsed in
that phase.
During the test you can
When the number of revolutions is low, the
☞
EC 1200 will automatically activate a load of
15 Watts and increase the load to the old value
when the speed picks up again. During that time,
Stage
the buttons
>>
, + and – are inactive and the
program will not proceed to the next load stage.
hold the stage with
Hold
(must be pressed 5 s before the
end of a stage at the latest).
Stage
advance to the next load stage with
>>
(ERGOLINE 900/900L only)
modify the load in steps of 5 Watts with
+ 5
and
- 5
(with EC 1200 V3.52: next stage, previous stage, but
never below initial load)
Phase
advance to the recovery phase with
>>
(upon completion of the last stage, the program automatically activates
the recovery phase)
terminate the test with .
227 498 02-A CardioSys V4.1 97
Page 98

M 700 and EC 1200
The Exercise ECG / The Elements of an Exercise Test
M 700
In conjunction with M 700 ergometers too, the selected
protocol fully controls the test procedure. During a test, load
During the test you can
* modify the load at the ergometer, but only for your own
custom-programmed phases
changes are only possible at the ergometer and only for the
Phase
user-programmed phases. If you wish to create custom
* advance to the recovery phase with
>>
protocols you will have to use the phases stored in the ergometer.
On the setup screen (section 4.2.7) select the “ERGS”
* terminate the test with .
EC 1200
ergometer.
This ergometer comes with 7 preprogrammed phases (6
If you wish to obtain a recording at the end of each load
stage only, set the “ECG Rec. Inter. EI” to 00:00 min.
Select a protocol.
exercise phases, 1 recovery phase). In addition there are five
free phases.
In the program, 10 protocols have been created from these
phases. You are free to modify these protocols as needed.
Click the button.
Phase No. Name on Ergometer Display
A blood pressure measurement is now taken automatically, if
configured. Wait until the readings are available or until the
first ST measurement is displayed (option) (18, Figure 4.2-10).
8 OWN PROGRAM 1
9 OWN PROGRAM 2
10 OWN PROGRAM 3
11 OWN PROGRAM 4
* Ask the test subject to start pedalling.
12 OWN PROGRAM 5
1 WHO
Window (2) in Figure 4.2-10 indicates the remaining time in
the current stage, while window (1) shows the time elapsed in
that phase.
2 ICSPE
3 ST. FRANCE
4 WHO NEW
5 HOLLMANN
6 REHA
7 not available for EC 1200
32 RECOVERY
98 CardioSys V4.1 227 498 02-A
Page 99

The Exercise ECG / The Elements of an Exercise Test
If you call up an unconfigured phase (see above), the ergometer runs idle.
On the setup screen (section 4.2.7) select the “ERGS”
ergometer.
If you wish to obtain a recording at the end of each load
stage only, set the “ECG Rec. Inter. EI” to 00:00 min.
Select a protocol.
Click the button.
Wait until the first ST measurement is displayed (option)
(18, Figure 4.2-10).
As trend values are saved at 30-second intervals, we recommend that you wait approx. 30 seconds before starting to
pedal.
Window (2) in Figure 4.2-10 indicates the remaining time in
the current stage, while window (1) shows the time elapsed in
that phase.
During the test you can
modify the load at the ergometer
Phase
advance to the recovery phase with
>>
terminate the test with .
* Ask the test subject to start pedalling.
Pre-Test Test Phase Recovery Phase
Interactive load changes only
Adjust initial load
and load increase /
stage of selected
protocol
Test Information
Prot. 1 Pedal
Select protocol.
Check recording
interval
When analyzing
ST segment, wait
for 1st results to
be displayed
at ergometer (with M700 only
for user-defined protocols)
Phase
>>
Figure 4.2-15. Program sequence with MEDITRONIC M 700 / ERGOCOMP EC 1200
227 498 02-A CardioSys V4.1 99
Page 100

The Exercise ECG / The Elements of an Exercise Test
The treadmill can be stopped at any time with the
☞
emergency stop button.
When using the treadmill model TM400E, it is
☞
important to adjust the same unit of speed measurement at the ergometer and at the CardioSys
system (km/h or mph).
If the speed is “0” in one of the stages, the tread-
☞
mill switches off and can only be restarted with
Start Treadmill
the
If the treadmill is stopped with the
☞
button.
button or with the emergency stop button, the
speed and grade readout is “**.*”. Wait until this
readout disappears before restarting the treadmill
Start Treadmill
with
.
Stop Treadmill
Treadmills
From the setup menu (section 4.2.7), item “Ergom./
Treadmill” select:
– “Internal Treadmill” for treadmills without digital
interface
– “Series 2000” for treadmills 1800, 1900, T2000
– “TM 400E” for Trackmaster treadmills TM 310,
TM 400E
Select a test protocol.
Click on .
At the beginning the program invokes the first stage (supine)
of the pre-test phase.
At this stage, the resting ECG of the supine patient is recorded. Continue collecting the ECG signal until you see the
first ST analysis results (18, Figure 4.2-11) or the results of
the first BP measurement.
Pre-Test Exercise Phase Recovery Phase
HoldStage
Test Information
Select protocol.
Check recording
interval
Stage
>>
When analyzing
ST segments or measuring
the blood pressure, wait for
1st results to be displayed
Start Treadmill
Phase
>>
>>
Phase
>>
Automatically
on completion
of last stage, or
manually
Figure 4.2-16. Program sequence for the treadmill test
100 CardioSys V4.1 227 498 02-A
 Loading...