

Page 1

COLOR SCANNING SONAR
MODEL
CSH-83/84
Page 2

9-52 Ashihara-cho,9-52 Ashihara-cho,
A
A
*00080806600**00080806600*
*00080806600**00080806600*
*OME13090F00**OME13090F00*
Nishinomiya, JapanNishinomiya, Japan
Telephone :Telephone : 0798-65-21110798-65-2111
Telefax :Telefax : 0798-65-42000798-65-4200
Your Local Agent/DealerYour Local Agent/Dealer
ll rights reserved.
ll rights reserved.
PUB.No.PUB.No. OME-13090OME-13090
(( DAMIDAMI ))
CSH-83/84CSH-83/84
Printed in JapanPrinted in Japan
FIRST EDITION :FIRST EDITION : NOV.NOV. 19971997
F :F : APR.APR. 05,200205,2002
* 0 0 0 8 0 8 0 6 6 0 0 ** 0 0 0 8 0 8 0 6 6 0 0 *
*OME13090F00**OME13090F00*
* O M E 1 3 0 9 0 F 0 0 ** O M E 1 3 0 9 0 F 0 0 *
Page 3
SAFETY INSTRUCTIONS
WARNING
Do not open the equipment.
Hazardous voltage which can
cause electrical shock exists
inside the equipment. Only
qualified personnel should
work inside the equipment.
Immediately turn off the power at the
switchboard if water leaks into the
equipment or something is dropped in
the equipment.
Continued use of the equipment can cause
fire or electrical shock. Contact a FURUNO
agent for service.
Do not disassemble or modify the
equipment.
Fire, electrical shock or serious injury can
result.
WARNING
Keep heater away from equipment.
A heater can melt the equipment’s power
cord, which can cause fire or electrical
shock.
Use the proper fuse.
Fuse rating is shown on the equipment.
Use of a wrong fuse can result in equipment
damage.
Do not operate the equipment with wet
hands.
Electrical shock can result.
Do not place liquid-filled containers on
the top of the equipment.
Fire or electrical shock can result if a liquid
spills into the equipment.
Immediately turn off the power at the
switchboard if the equipment is emitting
smoke or fire.
Continued use of the equipment can cause
fire or electrical shock. Contact a FURUNO
agent for service.
Make sure no rain or water splash leaks
into the equipment.
Fire or electrical shock can result if water
leaks in the equipment.
iiiiiiiiiiiii
i
Page 4

CAUTION
Do not exceed 18 knots when operating
the equipment and do not exceed 16
knots when lowering or raising the
transducer.
The transducer may become damaged.
The zinc block attached near the
transducer must be replaced yearly.
The junction between the transducer and
main shaft may corrode, which can result
in loss of the transducer or water leakage
inside the ship.
Do not use the equipment for other than
its intended purpose.
Use of the equipment as a stepping stool,
for example, may result in personal injury
or equipment damage.
Replace the monitor when the picture
becomes difficult to see.
The average life of the monitor is about
10 years. Replace it when the picture becomes difficult to see, to protect vision.
A warning label is attached to the equipment. Do not remove the label. If the
label becomes soiled or illegible, contact
a FURUNO agent or dealer.
ii
Page 5

TABLE OF CONTENTS
FOREWORD
A Word to CSH-83/84 Owners ...............................................................................................vii
Features...................................................................................................................................vii
System Configuration ............................................................................................................viii
CONTROL DESCRIPTION
Control Layout on Display Unit and Remote Control Box ...................................................1-1
Main Panel.............................................................................................................................1-2
Sub Panel 1 ............................................................................................................................1-4
Sub Panel 2 (data setting window) ........................................................................................1-5
Remote Control Box..............................................................................................................1-8
OPERATIONAL OVERVIEW
Turning the Power On/Off .....................................................................................................2-1
Adjusting Screen Brilliance, Control Panel Backlighting .....................................................2-1
Lowering the Transducer.......................................................................................................2-1
Selecting a Display Mode......................................................................................................2-2
Selecting a Display Range.....................................................................................................2-3
Setting the Tilt Angle.............................................................................................................2-3
Adjusting the Gain.................................................................................................................2-7
Measuring Range and Bearing to a Target.............................................................................2-7
FINE TUNING THE PICTURE
Eliminating Unwanted Feeble Echoes...................................................................................3-1
Suppressing Seabed Tail ........................................................................................................3-3
Suppressing Seabed and Sea Surface Reflections in Shallow Waters ...................................3-4
Rejecting Sonar Interference and Noise ................................................................................3-4
Adjusting Beamwidth ............................................................................................................3-6
MARKS AND DA T A
Marks, Data and Display Mode.............................................................................................4-1
Permanently Displayed Marks and Data ...............................................................................4-3
Erasable Marks and Data .......................................................................................................4-4
MENU OVERVIEW
USER Menu Operation..........................................................................................................5-1
USER Menu Description .......................................................................................................5-3
SYSTEM Menu Description .................................................................................................5-5
DATA SET Menu Description ...............................................................................................5-8
INIT SET/TEST Menu Description.....................................................................................5-11
iii
Page 6

FUNCTION KEYS
Programming the Function Keys ...........................................................................................6-1
Replaying a Function Key .....................................................................................................6-2
Function Key Fine Tuning.....................................................................................................6-2
Saving Function Key Settings to a Memory Card .................................................................6-3
Replaying Function Key Settings from a Memory Card .......................................................6-3
ADVANCED LEVEL OPERATION
Finding Fish School Center ...................................................................................................7-1
Tracking a Fish School (target lock)......................................................................................7-2
Detecting Fish Schools Aurally .............................................................................................7-7
The Fish Alarm......................................................................................................................7-8
Relocating Fish School for Easy Observation .......................................................................7-9
Comparing of Fish School Concentration ...........................................................................7-10
Measuring Fish School Speed .............................................................................................7-11
The Event Mark...................................................................................................................7-12
True Motion Display............................................................................................................7-14
Plotting Net Location Mark .................................................................................................7-15
Observing Net Behavior ......................................................................................................7-16
Target Slice Display.............................................................................................................7-17
PORT/STARBOARD, HORIZONTAL SLICE DISPLAYS
Port/Starboard Display ..........................................................................................................8-1
Horizontal Slice Display........................................................................................................8-2
MEMORY CARD OPERATIONS
Initializing Memory Cards.....................................................................................................9-1
Saving the Picture..................................................................................................................9-2
Transferring Echo Data from Internal Memory to Memory Card.........................................9-2
Saving Net Shooting Data .....................................................................................................9-3
Replaying Saved Data ...........................................................................................................9-4
Deleting Memory Card Contents...........................................................................................9-4
TURNING MARKS, DATA ON/OFF ..................................................................10-1
INTERPRETING THE DISPLAY
Seabed Echoes .....................................................................................................................11-1
Fish Schools.........................................................................................................................11-2
Sea Surface Reflections .......................................................................................................11-3
Wake ....................................................................................................................................11-3
False Echo by Sidelobe........................................................................................................11-4
Noise and Interference.........................................................................................................11-4
iv
Page 7

WARNINGS
Overvoltage Warning ...........................................................................................................12-1
Unretracted Transducer W arning.........................................................................................12-1
SELF TESTS
Opening the Self Test Menu ................................................................................................13-1
Self Test Description............................................................................................................13-2
Interface Unit CS-120A Self Test ........................................................................................13-5
INPUT DATA SELECTION
Selection of Data at Interface Unit CS-120A ......................................................................14-1
Setting Distances Between Net Sonde Transmitters............................................................14-2
MAINTENANCE
Display Unit Maintenance ...................................................................................................15-1
Hull Unit Maintenance ........................................................................................................15-2
MENU TREE..................................................................................................................A-1
SPECIFICATIONS..................................................................................................... SP-1
INDEX.............................................................................................................................. IN-1
v
Page 8

This page is intentionally left blank .
Page 9

FOREWORD
A W ord to CSH-83/84 Owners
Congratulations on your choice of the FURUNO CSH-83/84 Color Scanning Sonar . W e are
confident you will see why the FURUNO name has become synonymous with quality and
reliability.
For over 40 years FURUNO Electric Company has enjoyed an enviable reputation for quality marine electronics equipment. This dedication to excellence is furthered by our extensive global network of agents and dealers.
This equipment is designed and constructed to meet the rigorous demands of the marine
environment. However, no machine can perform its intended function unless operated and
maintained properly . Please carefully read and follow the recommended procedures for operation and maintenance.
We would appreciate hearing from you, the end-user, about whether we are achieving our
purposes.
Thank you for considering and purchasing FURUNO equipment.
Features
The FURUNO CSH-83/84 Color Scanning Sonar is a full-circle, multibeam electronic scanning sonar which detects and instantaneously displays fish schools and underwater conditions in 16 colors on a 15/21" non-glare, high resolution CRT screen.
The main features of the CSH-83/84 are
• Vivid 16-color display provides intuitive recognition of seabed and concentration, distribution and volume of fish schools.
• Markers and indications keep the operator abreast of fishing conditions.
• Remote control box provides for armchair control of major functions.
• New gain, range or tilt setting appears in large characters whenever corresponding control is adjusted.
• Function keys automatically setup the equipment to perform specific task.
• High power MOS FET transmitter ensures reliable operation under any condition.
• Automatic screen degaussing.
vii
Page 10
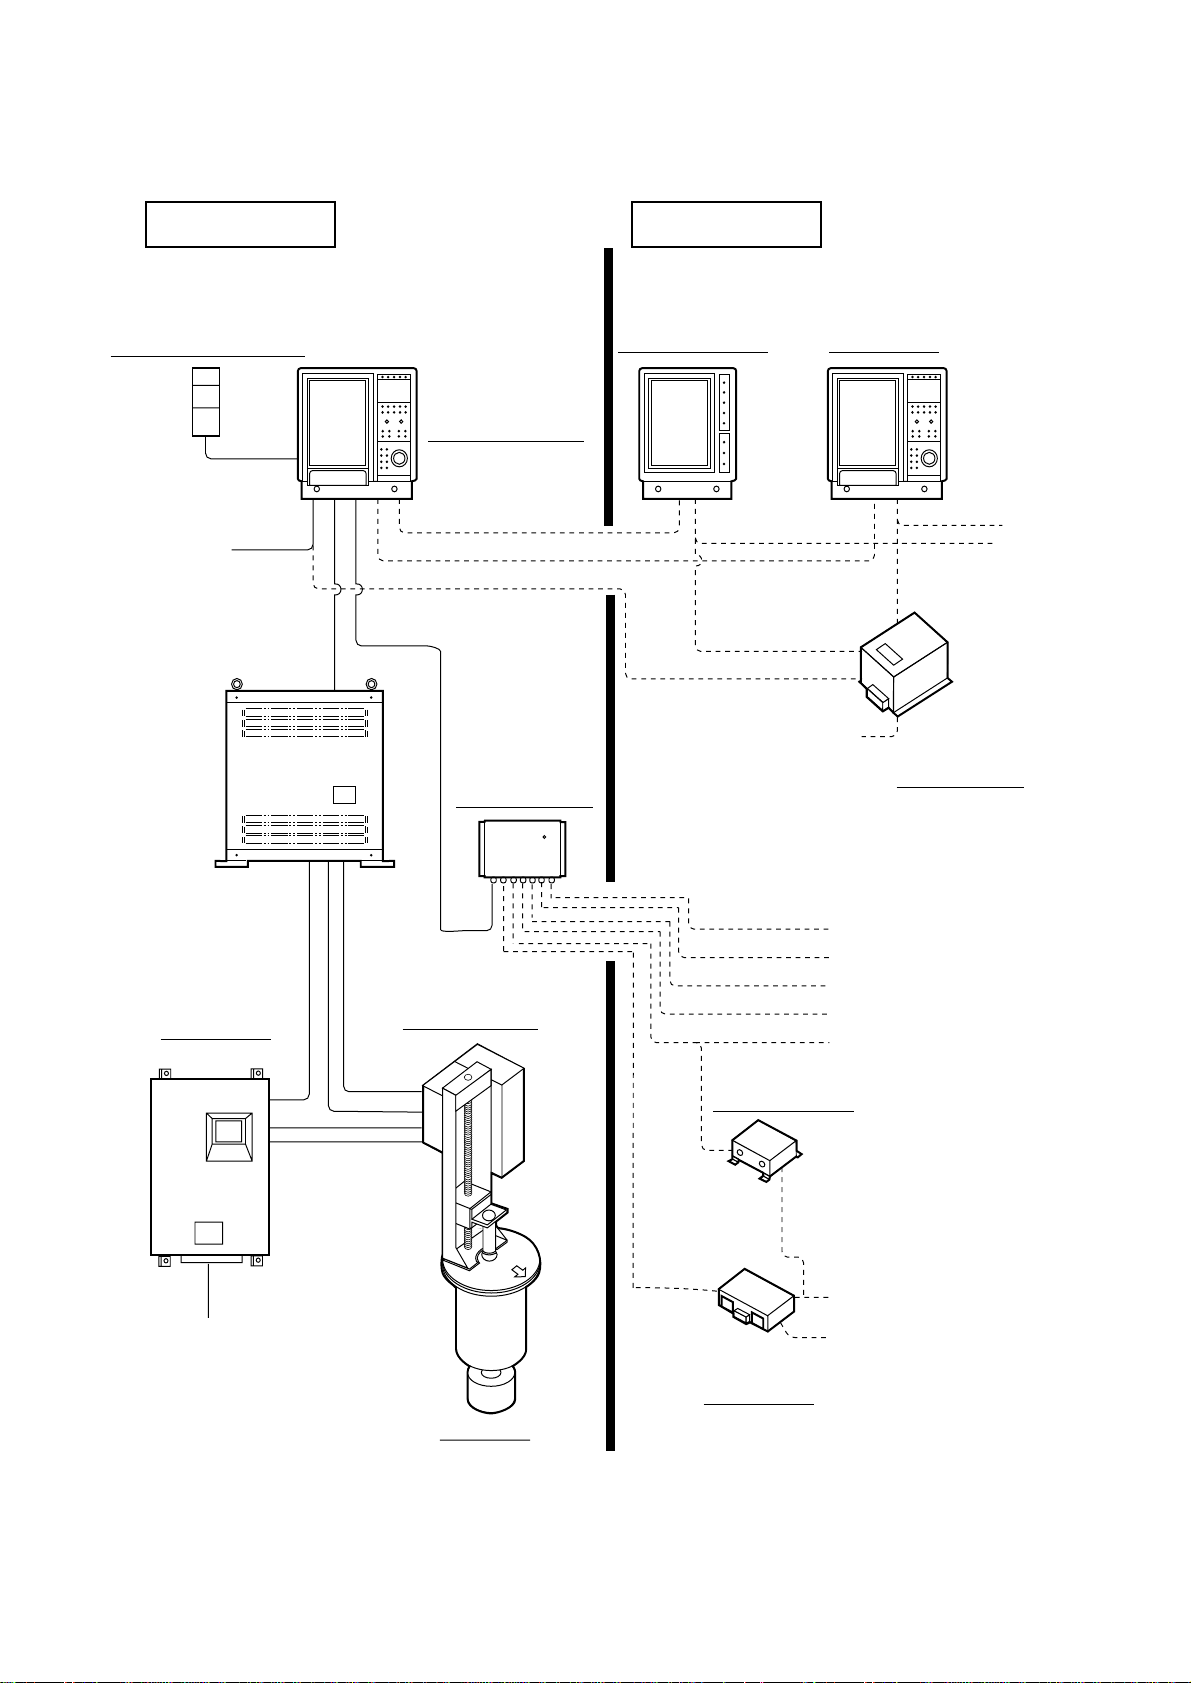
System Configuration
STANDARD OPTION
REMOTE CONTROL BOX
CSH-116
SHIP’S MAINS
100 VAC, 1φ,
50/60 Hz
TRANSMITTER UNIT
CSH-810
DISPLAY UNIT
CSH-230 (CSH-83)
CSH-2400 (CSH-84)
INTERFACE UNIT
CS-120A
REMOTE DISPLAY *
CSH-106
110/115/220/230 VAC,
1φ, 50/60 Hz
SUB DISPLAY *
CSH-236
STEP-DOWN
TRANSFORMER
PT-400
: CSH-83
only
SHIP’S MAINS
100 VAC, 1φ,
50/60 Hz
POWER
SUPPLY UNIT
CSH-880
SHIP’S MAINS
100/110/220 VAC, 1φ,
50/60 Hz
RECEIVER UNIT
CSH-820
HULL UNIT
CSH-81080 (800 mm stroke)
CSH-81120 (1200 mm stroke)
SPEED LOG
AD CONVERTER
NAVIGATOR
CURRENT INDICATOR
COLOR VIDEO SOUNDER
VI-1100A
INTERFACE UNIT
ECHO SOUNDER, COLOR
VIDEO SOUNDER
NET SONDE
FNZ JOINT BOX
CS-170
viii
Page 11
CONTROL DESCRIPTION
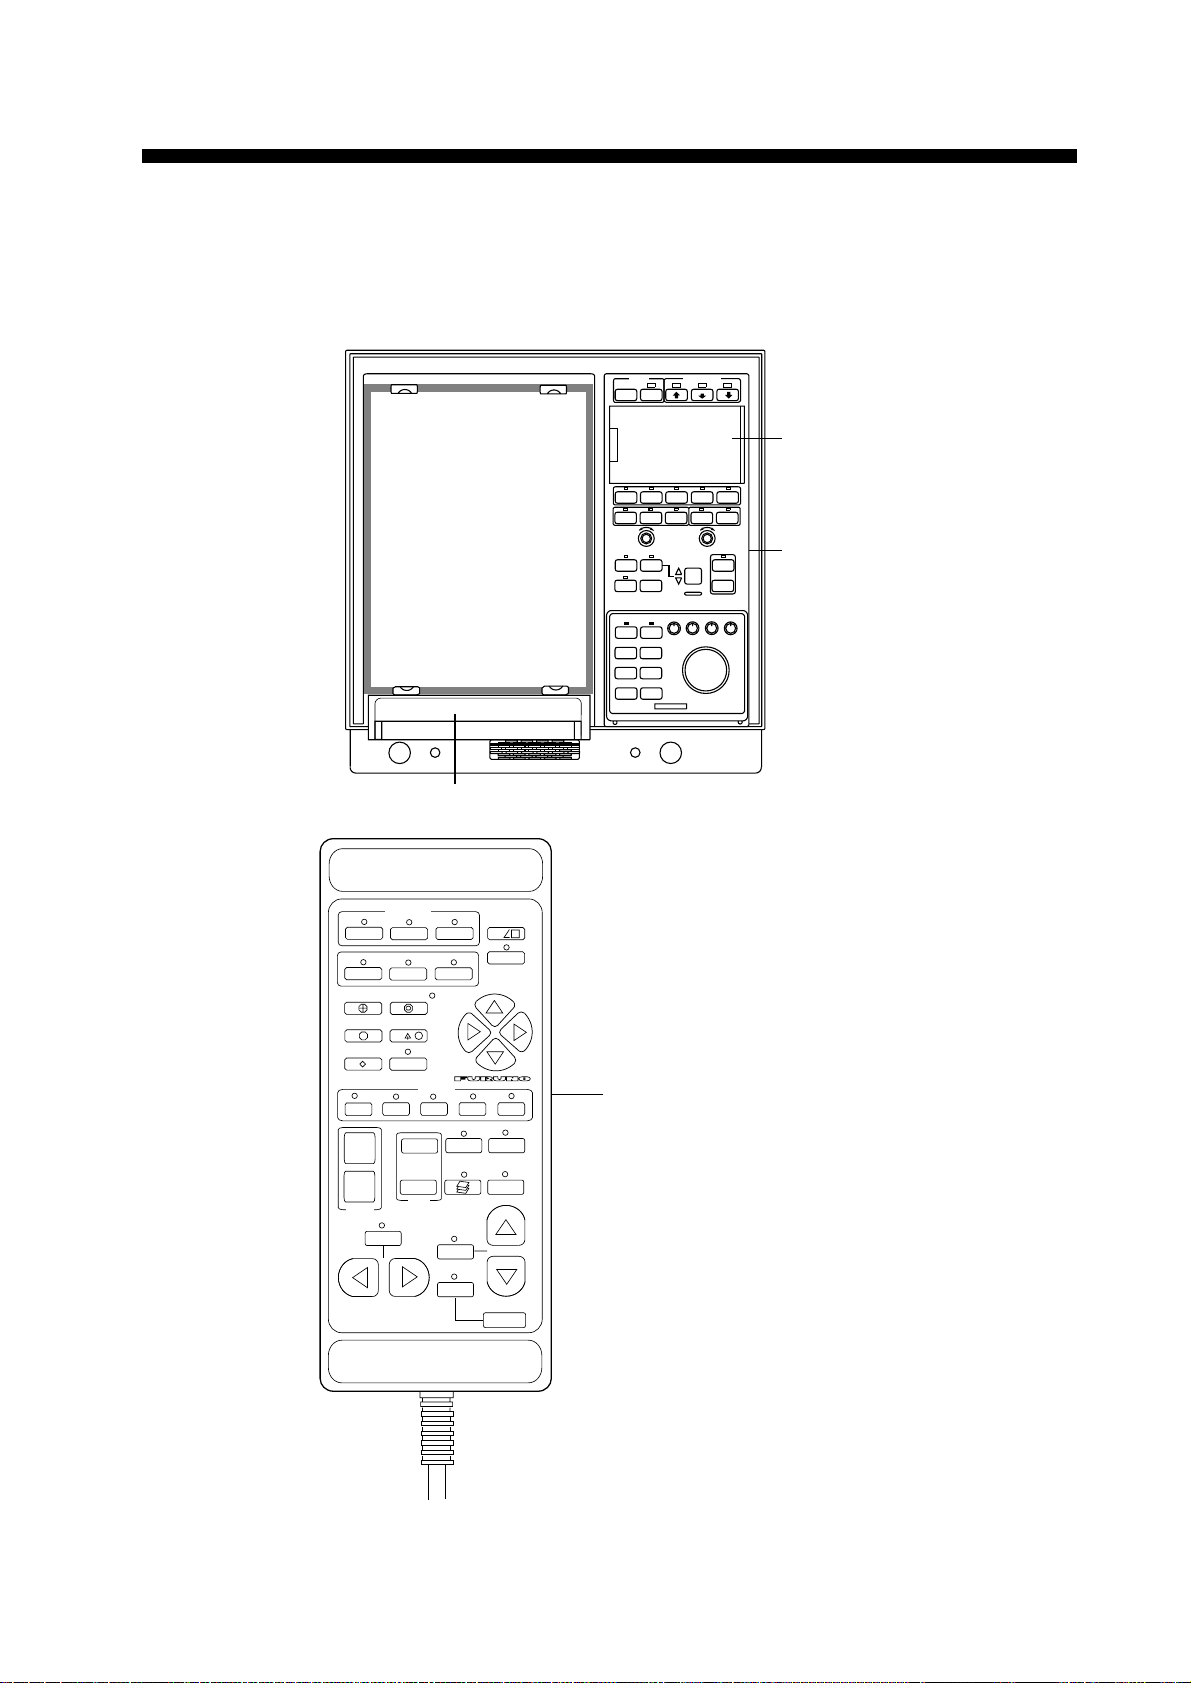
Control Layout on Display Unit and Remote Control Box
POWER TRANSDUCER
OFF ON
SUB PANEL 1
DISP SELECT
1
EVENT
TGT LOCK
ESTIMATE
NET COURSE
1
FISH
1
234
2
d
OFFCENT
FUNCTION
PUSH-OPEN
SUB PANEL 2
DATA
3
TX
dc
5
F1 F2 F3
NORM E/S HIST RECALL MEMO
-
TARGET
SLICE
SHOOT R/B
NET
COURSE
EVENT1 EVENT2
ESTI-
MATE1
FISH
-
-
+
RANGE GAIN
VERT
SCAN
TILT
SCAN DEPTH
TARGET
LOCK
DIM CONT BRILL AUDIO
ESTI-
MATE2
OFFCENT
+
+
AUTO
TILT
WIDTH
MAIN PANEL
REMOTE CONTROL BOX
+
–
RANGE
AUTO
TRAIN
GAIN
MEMO
SHOOT
+
–
AUTO
VERT
SCAN
TGT
SLICE
RECALL
TILT
SCAN DEPTH
Figure 1-1 Display unit and
remote control box
1-1
Page 12
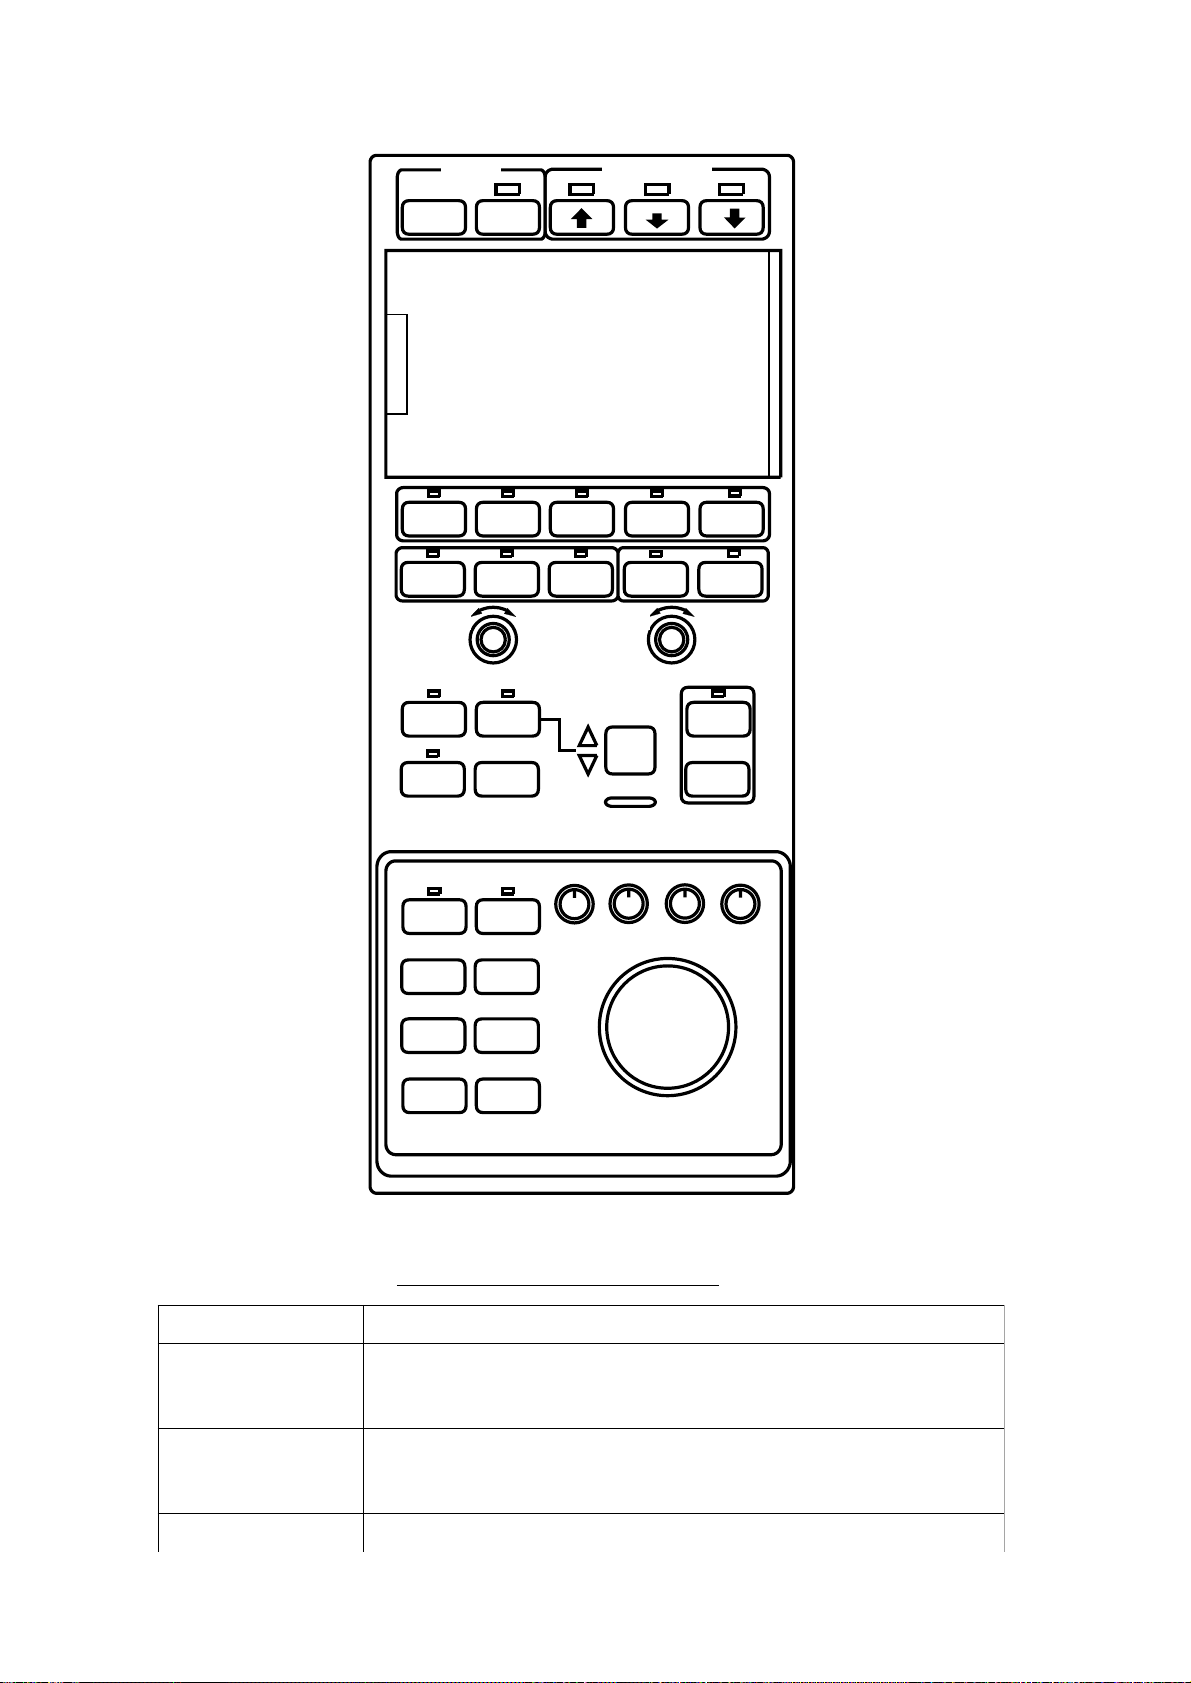
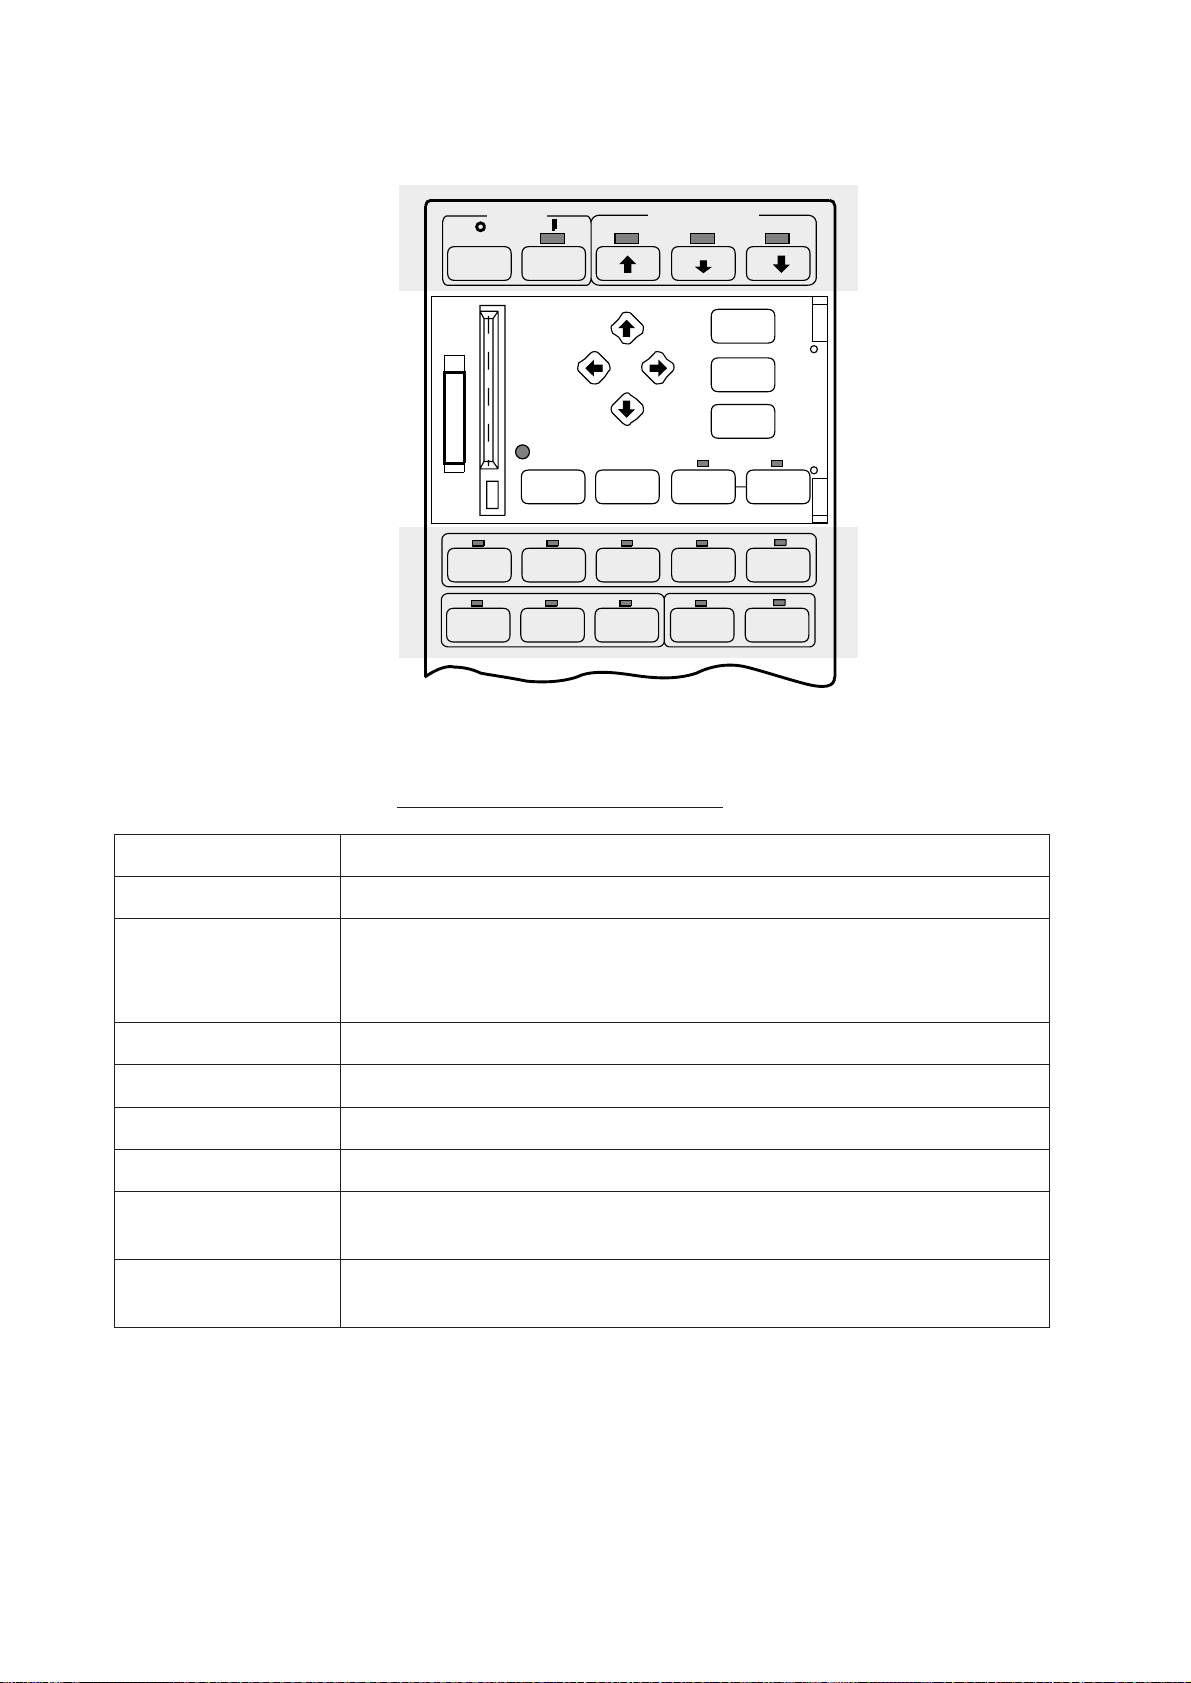
Main Panel
POWER TRANSDUCER
OFF ON
F1 F2 F3
NORM E/S HIST RECALL MEMO
-
+
RANGE GAIN
TARGET
SLICE
SHOOT R/B
NET
COURSE
EVENT1 EVENT2
ESTI-
MATE1
FISH
VERT
SCAN
TARGET
LOCK
ESTI-
MATE2
OFF-
CENT
DIM CONT BRILL AUDIO
-
-
TILT
SCAN DEPTH
+
AUTO
TILT
WIDTH
+
1-2
Figure 1-2 Main panel
Main panel control description
lortnoCnoitcnuF
,NOREWOP
FFOREWOP
RECUDSNART sedivorpyekworranwodllamsehT.recudsnartehtrewoldnaesiaR
worra.recudsnartehtsesiar
]+[,]-[,3F-1F .gninutenifedivorp]+[,]-[.margorpresuotgnidroccayalpsidpusteS
xTgnirudsthgilyekehtevobapmalehT.metsysehtnosnruT:NO
.ffodenrutsi1lenapbusniyekXTehtnehwsknilbdna
.recudsnartehtgnitcarterretfasserP.metsysehtffosnruT:FFO
PUehT.noisurtorplluf,yekworranwodegraleht;noisurtorp-dim
Page 13

lortnoCnoitcnuF
TSIH,S/E,MRON
)syekedoM(
OMEM,LLACER.erutcipdevassyalpeR:LLACER
EGNAR .yalpsidehtnosraeppadetcelesegnaR.egnaryalpsiderutcipastceleS
NIAG.ytivitisnesreviecerstsujdA
ECILSTEGRAT takrametamitseehtedisniohceehtsyalpsid,gnitlitcitamotuagnisU
NACSTREV.desutoN
TOOHS dnaskramednosten*,kramgnitoohstenehT.tsacsitennehwsserP
B/R tceleS.tegrataotpihsnwomorfatadgniraebdnaegnarsedivorP
rednuosohcE,S/E;erutcipranoslamron,MRON:edomyalpsidtceleS
.yalpsidlacirotsiH,TSIH;noitanibmoc
.noitcelestnerrucwohsotsthgilyekaevobapmaL
.yromemlanretnirodracyromemoterutcipsevaS:OMEM
.selgnatlittnereffidlareves
,kramgnitoohstenehT.krampihsnwoehttaraeppakramtnerruc*
ehtsakcarts'pihs*ehtnoevomkramtnerrucdnaskramednosten
nurecnatsid*emitdnasthgilhctiwsehtevobapmalehT.sevompihs
.ffodenrutsikramgnitoohstenehtlitnuyalpsidehtnosraeppa
).rosneslanretxeseriuqeR*(
stcennocenilA.yekB/Rehtsserpnehtdnallabkcarthtiwtegrat
.tegratotgniraebwohsotkramllabkcartdnakrampihsnwoneewteb
TLIT5-neewtebmaebgnidnuosehtfoelgnatlitehtsegnahC ° 06dna °.
TLITOTUA1ninwoddnapumaebgnidnuosehtstlityllacitamotuA ° 2ro ° spets
.nositlitcitamotuanehwsthgilyek
HTDIW.tlitcitamotuanihtdiwtlitsteS
ESRUOCTEN.tenfonoitacolskraM
KCOLTEGRAT.loohcshsifaskcarT
TNEVE htped,egnar,latnozirohdnifot,yalpsidehtnokramtneveebircsnI
.xoblortnocetomerfoyek
2,1ETAMITSE.sloohcshsifowtfoemuloverapmoC
HSIF.deepsloohcshsifserusaeM
TNEC-FFO.tegratdetcelessetacoleR
MID fossenthgirbehtdnaslenaplortnocehtfognithgilkcabehtstsujdA
.syekevobaspmaleht
TNOC.tsartnocneercsstsujdA
ehtevobapmalehT.yekHTDIWehtybdetceleselgnatlitehtnihtiw
TOOHSsadenoitcnufebnacyektnevE.tegrataotgniraebdna
LLIRB.ecnaillirbneercsstsujdA
OIDUA tegratasrotinomhcihw,rekaepsduolni-tliubfoemulovstsujdA
LLABKCART skramretneot,kramllabkcartehtfotnemevomneercs-noswolloF
.rekramgniraebehtgnolagniraeppa
.neercsehtretnec-ffodna
1-3
Page 14
Sub Panel 1
POWER
OFF
ON
CARD
REPLAY
TRANSDUCER
COLOR
NET
REPLAY
F4
RECALL
Figure 1-3 Sub panel 1
Sub panel 1 control description
MENU
END
HELP
TX
F5F3F2F1
MEMOHISTE/SNORM
lortnoCnoitcnuF
UNEM.unemehtsesolc/snepO
DNE dnanoitarepounemsetanimrettideyalpsidsiunemehtnehW•
PLEH.unemtnerrucrofnoitamrofnignitareposedivorP
YALPERDRAC.sgnittesunemdnalortnocderots-dracsyalpeR
ROLOC.seciohcruofgnomarolocyalpsidsegnahC
YALPERTEN otyeksserp,yalperoT.atadgnitoohstenderotsyllanretnisyalpeR
XT gnirudsthgilpmalehT.derewolsirecudsnartnehw,timsnartotsserP
.erutcipranosehtotlortnocsnruter
.unembussuoiverpotlortnocsnrutertiunembusaninehW•
.sunemnosmetitceleS
.niagayekehtsserpdna,yalperotmetitceles,tievobapmalthgil
.noissimsnart
1-4
Page 15
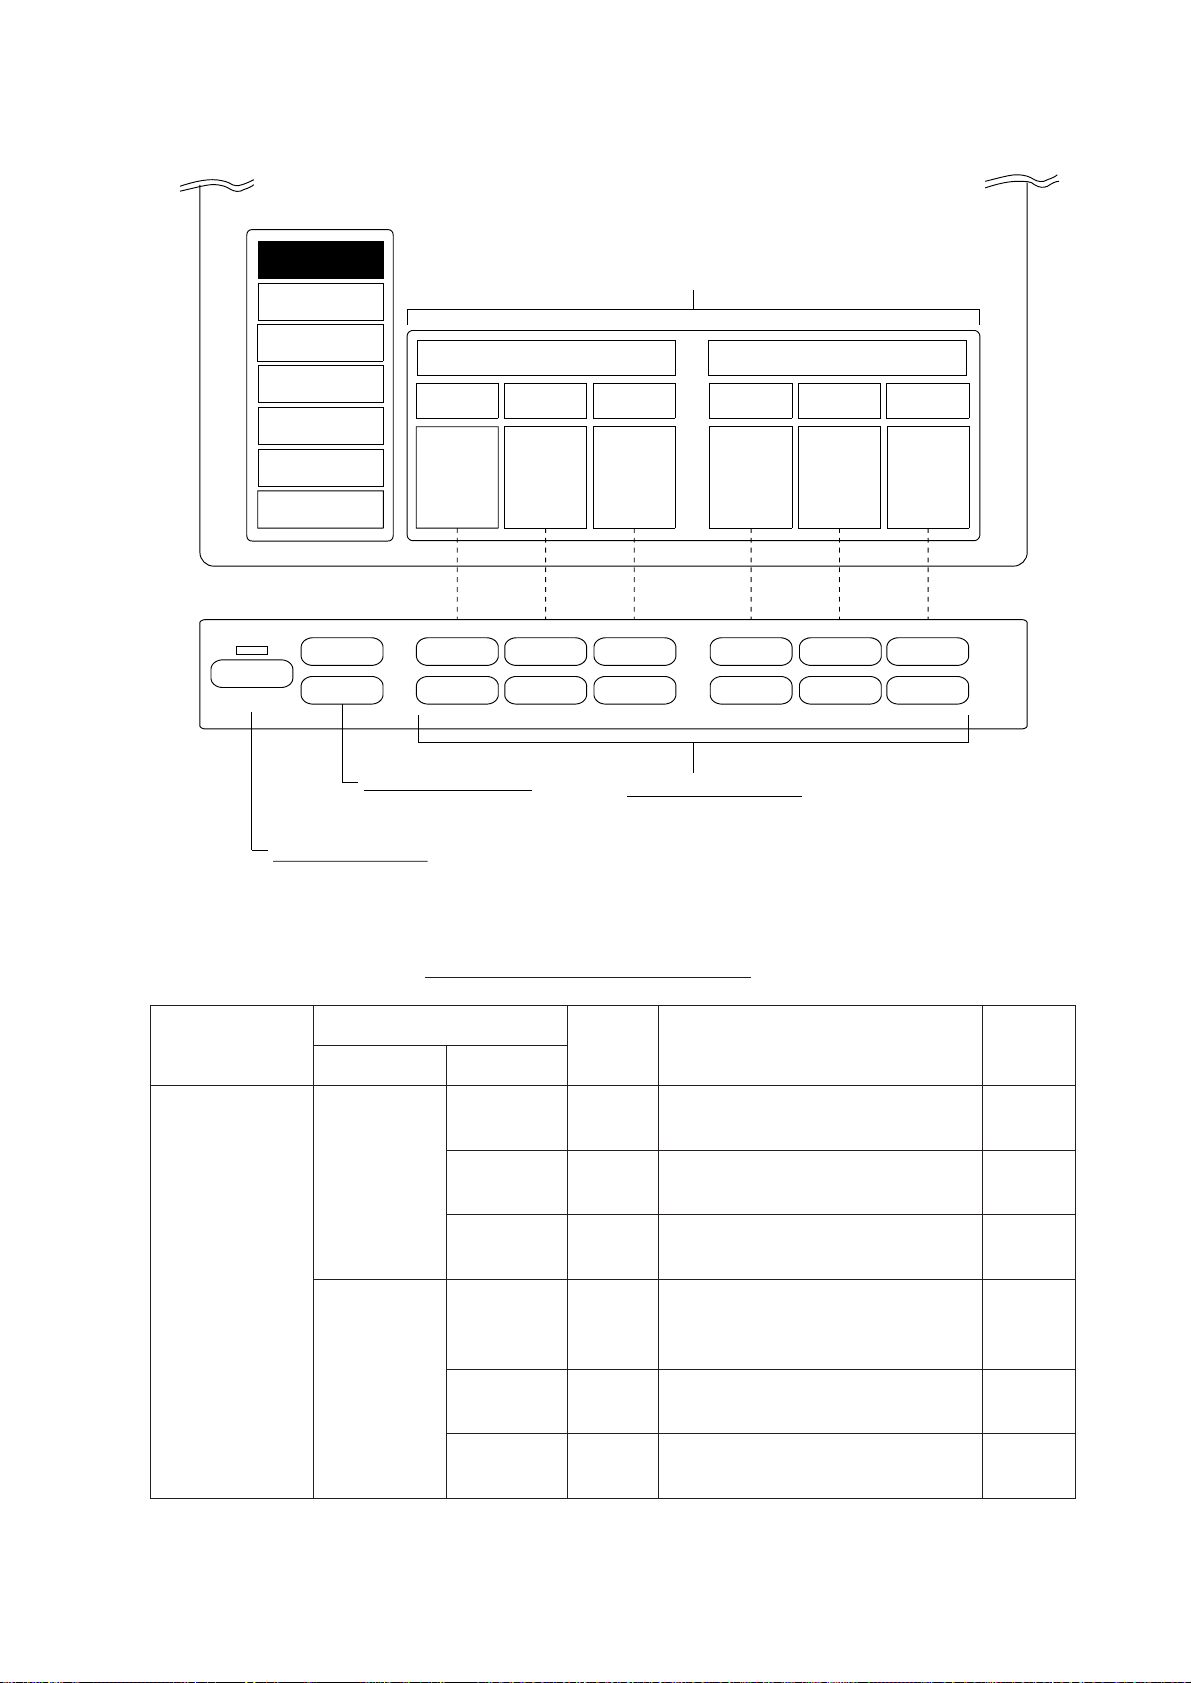
Sub Panel 2 (data setting window)
ITEM
(TVG•TX selected)
This example shows settings
of TVG and TX.
SONR•BEAM
OPER
P-SET
(TOGGLE)
TVG•TX
SIGNAL
ES
DELETE MK
AUTO
ALM•AUDIO
g
h
CURRENT SETTINGS for item selected (TVG•TX)
NEAR7MEDIUM
+ + + + + +
– – – – – –
Item selection keys
Select item.
TVG TX
8
FAR
9
Setting change keys
Change control setting.
CYCLE
7
PL
8
OUTPUT
9
OPER P-SET key
Opens/closes data setting window.
Figure 1-4 Sub panel 2
Sub panel 2 control description
niaM
metI
GVT
XT•GVT
TIM
metI
niaMbuS
-SNART
LP9–0
RAEN9–0
MUIDEM9–0
RAF9–0
ELCYC9–0
gnitteS
egnaR
.m001
.m004
.gnittes
noitpircseD
nihtiwniagreviecerstsujdA
neewtebniagreviecerstsujdA
.m004dnam001
dnoyebniagreviecerstsujdA
lamronsi9.elcycxTsteS
-orhcnys"0".)tsetsaf(gnittes
.PKlanretxehtiwsezin
lamronsi9.htgneleslupxTsteS
lamroN
gnitteS
5
5
5
9
9
(Continued on next page)
TUPTUO9–0
si9.rewoptuptuoxTsteS
.rewopmumixam
9
1-5
Page 16
niaM
metI
metI
niaMbuS
LN01–0.seohcedetnawnustcejeR3
LANGIS
SSECORP
CGA01–0
*CGA24–0
gnitteS
egnaR
noitpircseD
reviecersecuderyllacitamotuA
hcusseohcegnortstsniaganiag
siohcehsifostsujdA.debaessa
.debaesraendeyalpsid
fI.seohcedebaessesserppuS
sserppustonnacenolaCGA
.CGA2esu,seohcedebaes
lamroN
gnitteS
0
0
LANGIS
LANGIS
SSECORP
1SE
teN(
)redroceR
SE
1SE
teN(
)redroceR
EVRUC4–1
RI3–0
.sranosro
WOLGFA4–0
ohcefoegnarhtpedsteS
EGNAR
)GNRND(
NIAG01–0.ytivitisneseviecerstsujdA5
TFIHS
)GNRPU(
LN01–0
ROLOC9–0
RI
61
.soP
.gnidnuos
–0
m0001
,NO
FFO
drawnwodredrocerten
.deificepssroloc
.srednuosohcerosranos
-neserpsusrevlevelohcestceleS
rehgihehT.evrucrolocnoitat
eesotsitireisaeeht,gnitteseht
.neercsehtnoseohcekaew
-retnidnaesionmodnarstcejeR
srednuosohcerehtoybecneref
sihcihw,wolgretfaohcestsujdA
-evomohcegnihctawroflufesu
ehtgnittesehtrehgihehT.tnem
.sniamerwolgretfaehtregnol
foegnarsteS.erutciprednuos
ohcefohtpedtratsyalpsidsteS
foegnarsteS.erutciprednuos
.gnidnuosdrawpuredrocerten
ybdesuac(stodeulbstcejeR
.neercseritneno)retawytrid
nideyalpsidseohcesetanimilE
rehtoybecnerefretnisetanimilE
2
0
0
m061
m0
0
0
FFO
ETELED
KRAM
-ro+
KMETELED
ETELED
KRAM
KCART
HSIF.deteledsikcarThsiF
otyek
.esare
.kram
.htgnelllarevo
tneve,kramtnevegnoma
pihsnwo,kramhsif,kram
fo5/1seteledgnisserphcaE
*2AGC and HOR functions cannot be used together. If one is used the other is
automatically set to “0”.
(Continued on next page)
1-6
kramtsedlosesaregnisserphcaE
Page 17

niaM
metI
metI
niaMbuS
gnitteS
egnaR
noitpircseD
lamroN
gnitteS
RANOS2–1
RANOS
MAEB•RNOS
MAEB
OTUA
TLIT
OTUA
OTUA
NACS
TFIHS-F2–1
MT/PU
*ROH01–0
REV4–0
FFO/NOFFO,NOelgnatlitgninnacsffo/nosnruTFFO
HTDIW
FFO/NOFFO,NO
HTDIW
:EDIW ± 01-2 °, ± 61-4 °, ± 02-6 °
:WORRAN ± 4-1 °, ± 6-2 °, ± 8-3 °
dna ± 06 °.
.ranoslaudrof"2"
.esulamronrof
.maebehtreworraneht
.seohcemottob
gnomahtdiw ± 01 °, ± 02 °, ± 04 °
ro,ranoselgnisrof"1"esoohC
"1"esoohC.ycneuqerfxTstfihS
edomnoitatneserpstceleS
gnidaeH,)puN(pu-htroNgnoma
.)MT(noitoMeurT,)puH(pu
xRfohtdiwmaeblatnozirohsteS
,rebmunehtrehgihehT.maeb
fohtdiwmaeblacitrevsteS
ediwrof"2"dna"1".gnittes
ecafrusecuderot"3";maeb
eslafsserppusot"4";rettulc
,LBEgninnacsffo/nosnruT
.rotcesoiduasnacshcihw
gninnacscitamotuasesoohC
1
1
puH
0
lamronsi"0".maebnoissimsnart
0
±2° 01- °
FFO
± 01 °
FFO/NOFFO,NO.ffo/nomralahsifsnruTFFO
hsifhcihwtalevelohcesteS
51–0srebmuN.sdnuosmrala
HSIF
MRALA
OIDUA•MLA
OIDUA
LEVEL51–0
ENOZ
ROTCES
BREVER9–0
RETNEC
.nworb
+sserP
.yek
03 ° 06, ° 09, ° 081, ° 033dna °.
+sserP
.yek
.yek+dnallabkcart
.noitarebreverregnol
noitatneserp61otdnopserroc
ehtgnisu,enozmralasteS
gnomarotcesoiduasesoohC
,rotcesoiduafonoitceridsteS
.yek+dnallabkcartehtgnisu
*HOR and 2AGC functions cannot be used together. If one is used the other is
automatically set to “0”.
01
hsidder,51,eulbpeed,0:sroloc
03 °
noitarebreverfohtgnelsesoohC
sevigrebmunregraL.oiduarof
0
1-7
Page 18
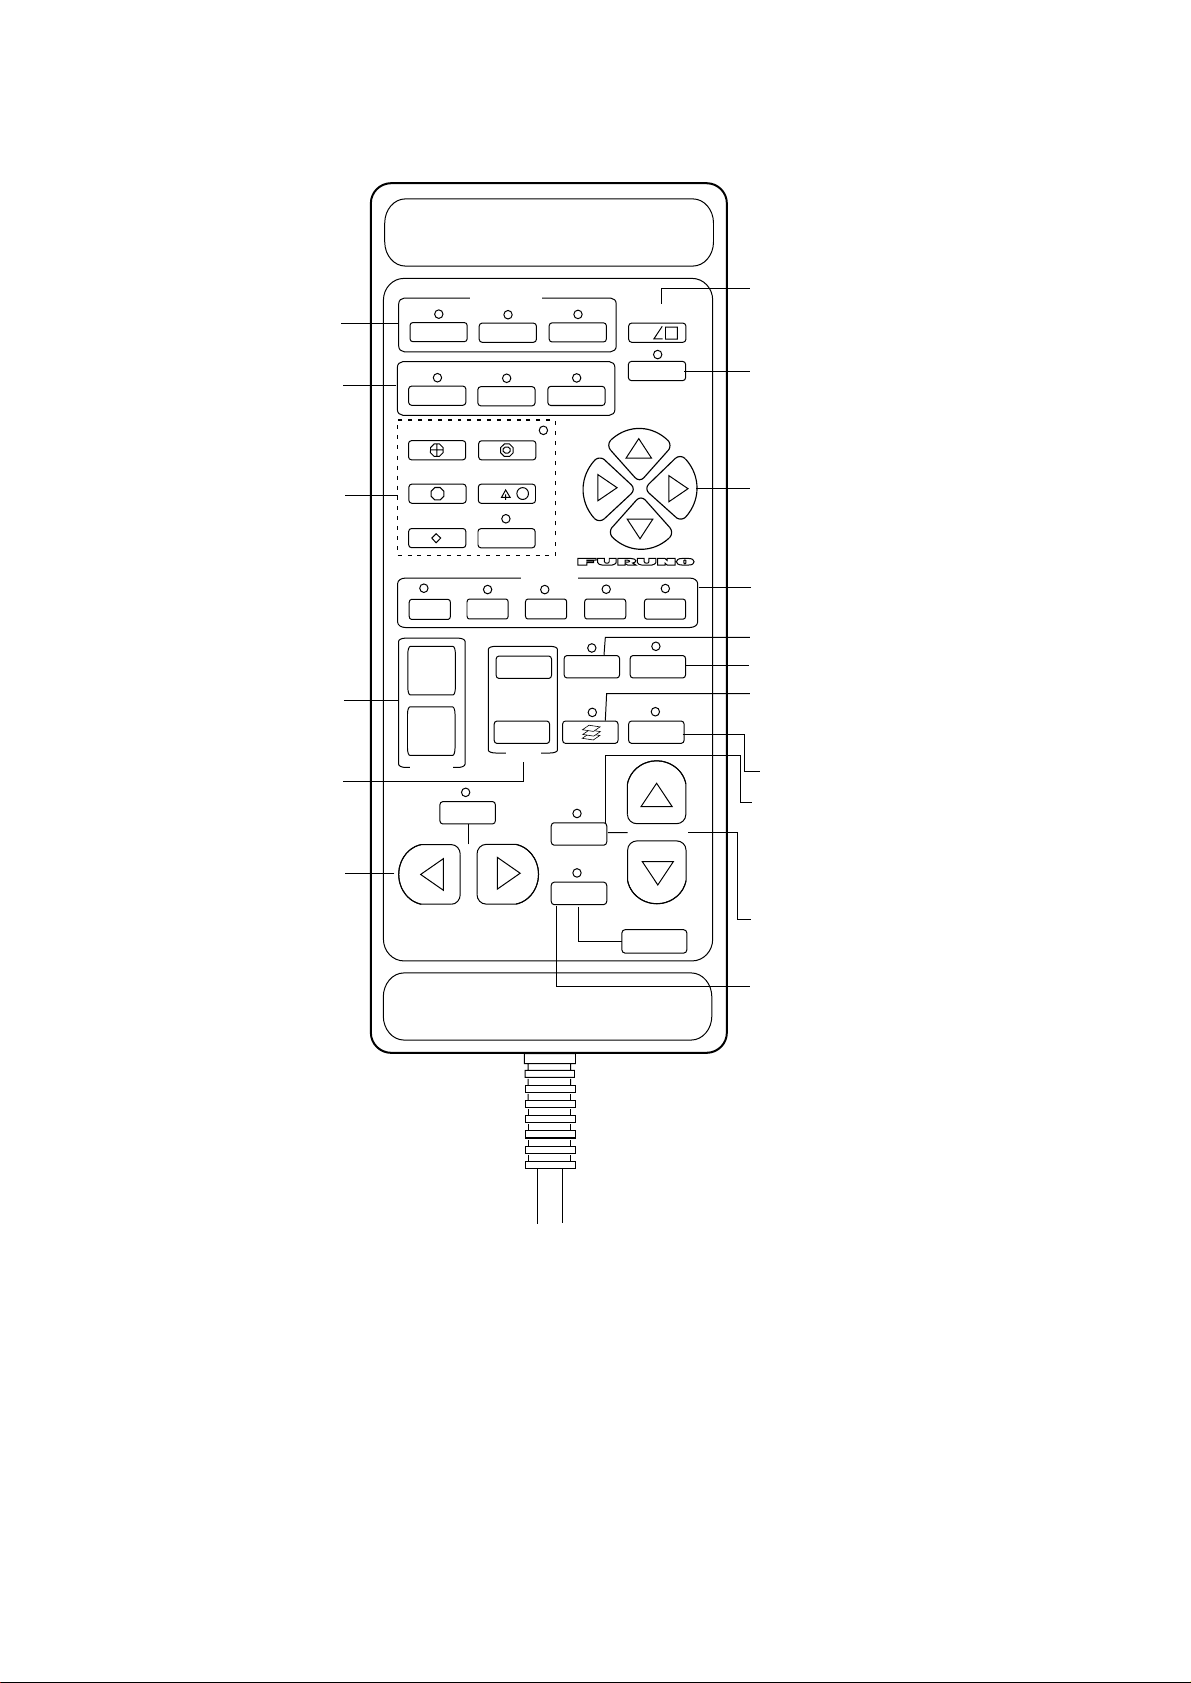
Remote Control Box
elects which display unit to
ontrol in multiple display unit
stallation.
ises/lowers the transducer.
: Raises transducer.
: Mid protrusion
: Full protrusion
Press to enter mark
shown on key or shift
screen center.
Selects display range.
Adjusts receiver sensitivity.
Not used.
1
➡
EVENT
ESTIMATE
1
FISH
1
+
–
RANGE
DISP SELECT
FUNCTION
+
3
➡
SHOOT
2
➡
TGT LOCK
NET COURSE
OFFCENT
234
–
GAIN
AUTO
TRAIN
TGT
SLICE
AUTO
VERT
SCAN
DATA
TX
5
MEMO
RECALL
TILT
SCAN DEPTH
Each press displays water
temperature or depth at screen
center for about five seconds.
Turns on transmitter.
Shifts trackball mark.
1-3: Same as 1-3 on main panel.
4-5: Same as - and + on main panel.
Displays the net shooting mark.
Saves picture to memory card.
Present a four (or five) angle view of
echo inside estimate mark. Light switch
to start.
Replays a stored picture.
Automatically tillts sounding
beam in 2° steps within tilt
angle selected by the WIDTH key.
Varies the tilt angle of the
sounding beam between -5°
and 60°.
Not used.
1-8
Figure 1-5 Remote control box
Page 19

OPERATIONAL OVERVIEW
CAUTION
Do not exceed speed noted in the specifications when operating the equipment
or lowering or raising the transducer.
The transducer may become damaged.
Do not press the c switch during
lowering of the transducer, and do not
press the
d or d switch during raising
of the transducer.
The equipment may become damaged.
Turning the Power On/Off
Turning the power on
Press the ON switch on the main panel. The lamp above the
switch should light. If it doesn’t press the TX switch on sub
panel 1.
Turning the power off
Retract the transducer with the c switch and then press the OFF
switch on the main panel.
Note: The transducer is automatically retracted into the tank even
if the OFF switch is pressed before retracting the transducer.
However, make it a habit to retract the transducer before turning
off the power.
Adjusting Screen Brilliance, Control Panel Backlighting
The BRILL control adjusts screen brilliance, and the DIM control adjusts control panel backlighting. These controls are on the
lower part of the main panel.
Lowering the Transducer
Press d or d switch. The lamp above the
switch blinks during lowering of the transducer and lights when the transducer is completely lowered. In normal use fully lower
the transducer. The transducer extends
*1200 mm below the ship’s hull, providing
stable and cavitation-free soundings. If the
transducer may become entangled in the net,
after shooting the net, for example, partially
raise the transducer with the
raises the transducer by 400 mm (transducer
extends *800 mm from ship’s hull).
d switch. This
*Hull unit with 800mm (full) and 600mm
(mid) protrusions are also available.
2-1
Page 20
Selecting a Display Mode
The CSH-83/84 provides three display modes: normal sonar picture, echo sounder(E/S) combination, and history display combination. Those modes may be selected with the NORM, E/S
and HIST keys.
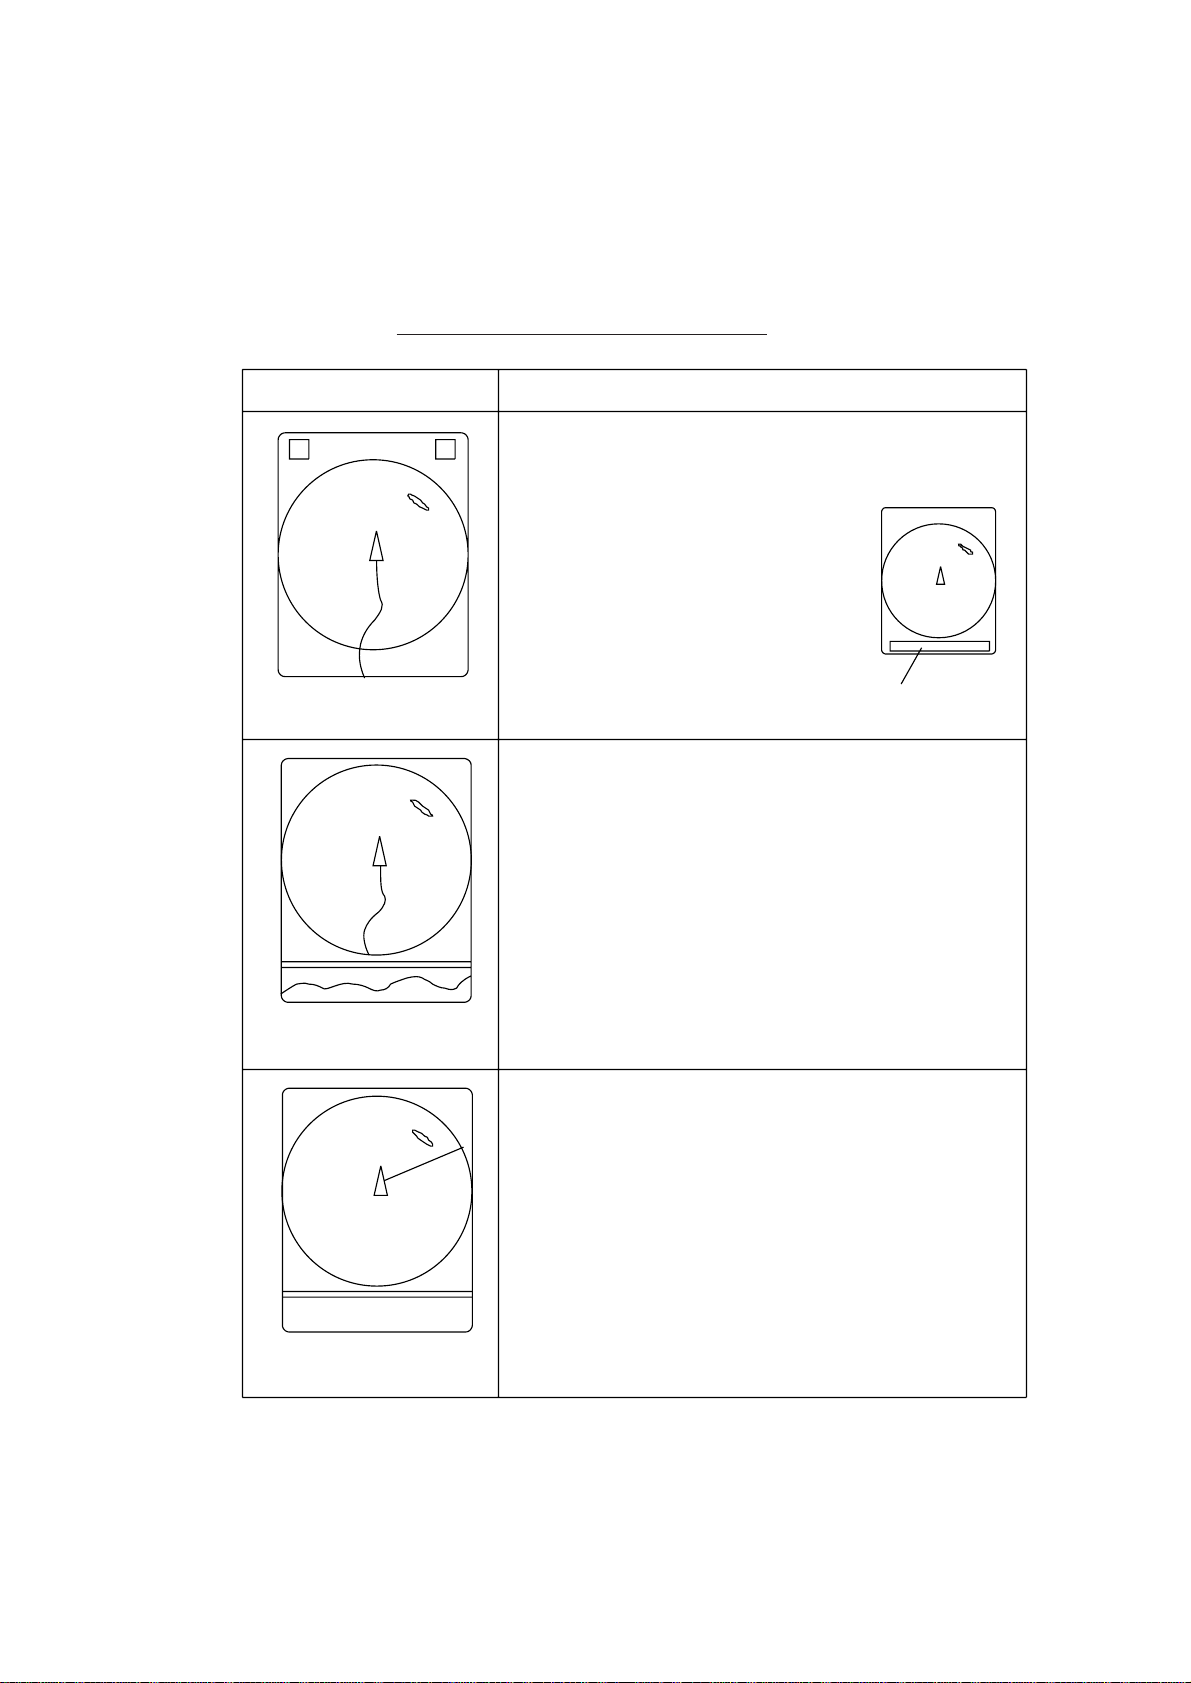
Table 2-1 Display mode description
Mode Description
The sonar picture appears over the entire screen.
This mode is useful for detecting and tracking fish
schools.
The default display area is 1.3 times
the range, but it can be changed to
1.6 times the range on "EXT KP/TM
DSP" in the SYSTEM menu.
Navigation information can be
displayed in the text window at
the screen bottom by turning on
NORMAL
"DATA DISPLAY" in the USER
menu.
Text window
E/S
Normal scanning picture appears on the upper 5/8
of the screen and the signal fed from the echo
sounder on the lower 3/8. This mode is suitable for
judging fish school concentration.
When two echo sounders are connected, each
pressing of the E/S key alternately selects echo
sounder 1 or echo sounder 2.
Note that a net recorder can be connected as echo
sounder 2; select it on the "ES" sub menu in the
INIT SET/TEST menu.
Normal scanning sonar picture appears on the upper
5/8 of the screen and the history display on the
lower 3/8. Three types of history displays are
available: Audio, Port/Starboard and Horizontal
Slice. You can select which one to display on the
USER menu.
2-2
HISTORY
Page 21

Selecting a Display Range
Operate the RANGE control to select a display range. The range
selected appears at the top of the screen.
Setting the T ilt Angle
The tilt angle shows the direction to which the sound wave is
emitted. When the sound wave is emitted horizontally, the tilt
angle is said to be zero degrees and when emitted vertically, 90
degrees.
T o set a tilt angle, operate the TIL T lever . W atch
the tilt angle indication at the top right corner
R400
T 15
Tilt
angle
on the screen. The tilt angle can be set in onedegree steps from -5 (upward) to 60° (downward) degrees.
Finding a proper tilt angle is important when searching for fish.
Seabed echo and tilt angle
Case 1: Tilt angle 30 to 40 degrees
This tilt angle will display the entire seabed since it is captured
by the full width of the beam.
Case 2: Tilt angle 10 to 20 degrees
This tilt angle will only display half the seabed since it is only
captured by the lower half of the beam.
Case 3: Tilt angle 0 to 10 degrees
This tilt angle may or may not capture the seabed since the re-
turning echo is weak.
2-3
Page 22
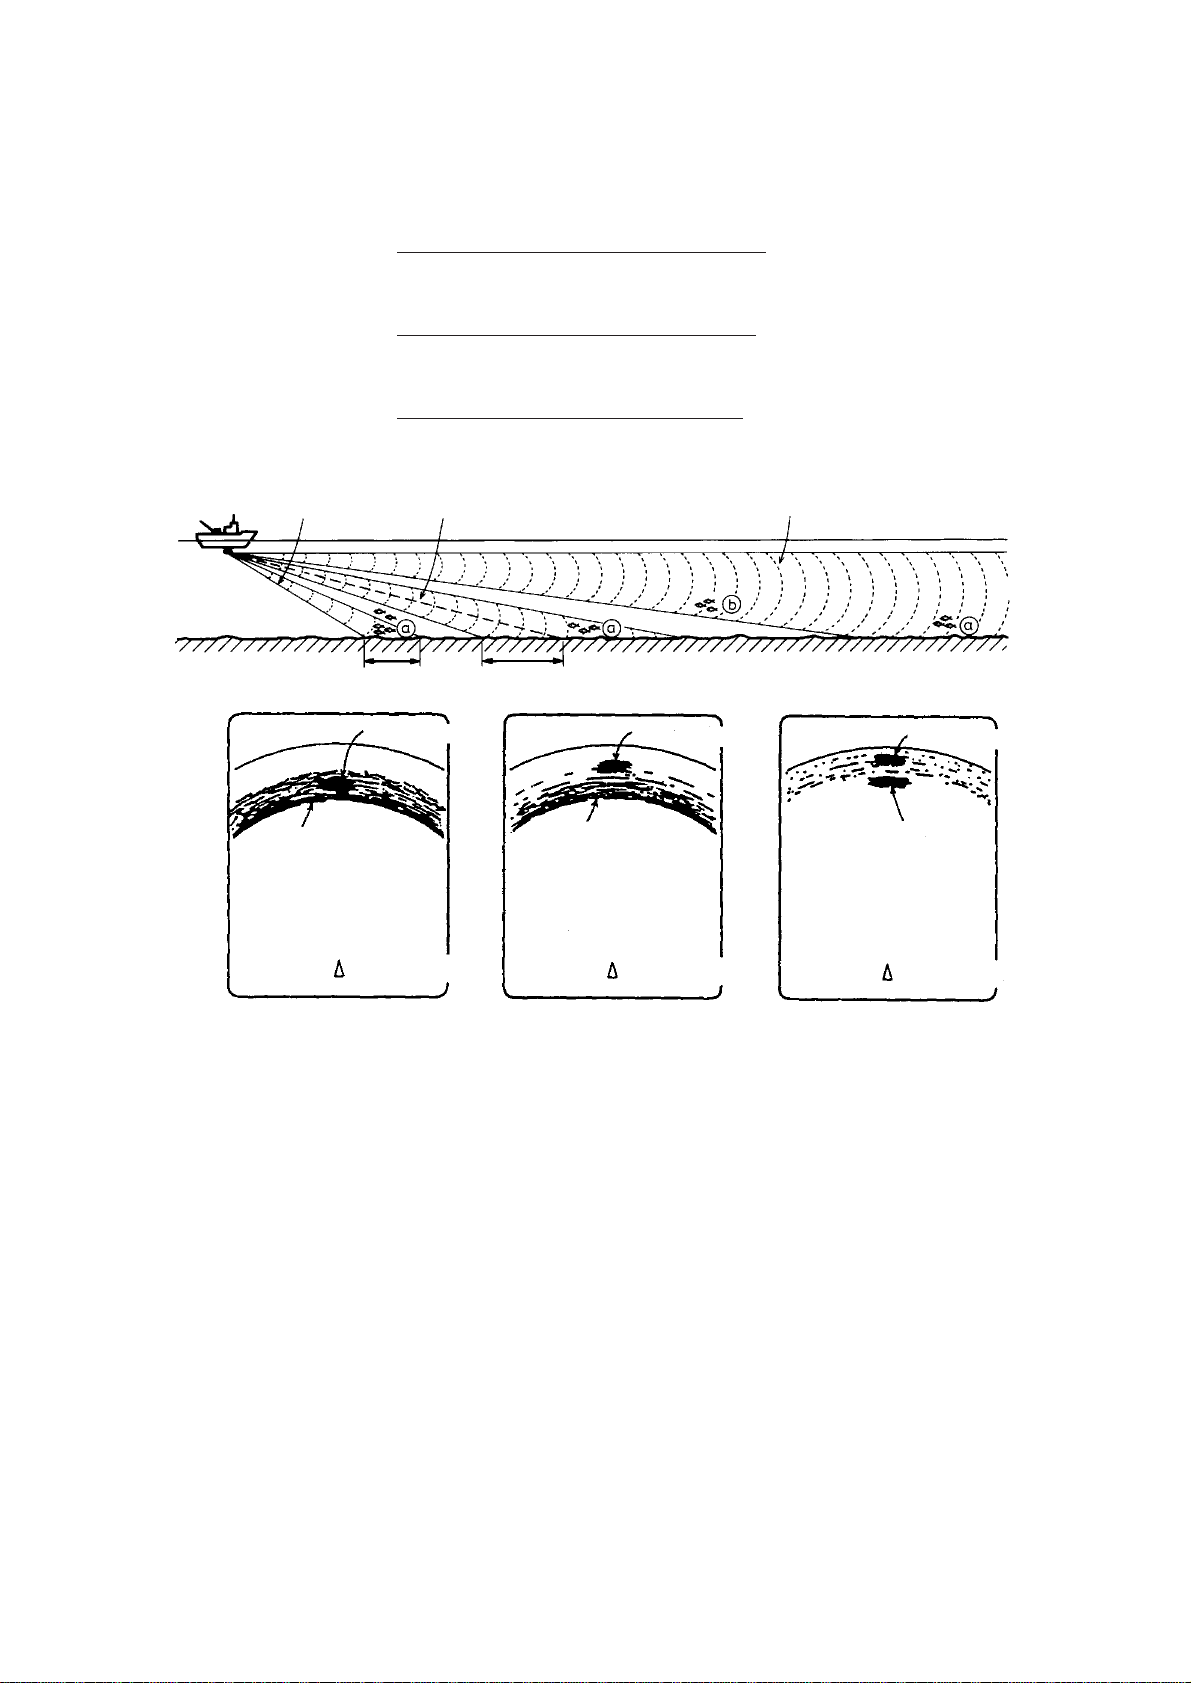
How to discriminate fish echoes from the seabed
The figure below illustrates how two fish schools a and b are
displayed on the screen using three different tilt angles.
Case 1: Tilt angle 30 to 40 degrees. Fish school is obscured by
the seabed.
Case 2: Tilt angle 10 to 20 degrees. Fish school is located above
the seabed (midwater).
Case 3: Tilt angle 0 to 10 degrees. Fish school is located close to
the seabed.
Case 1
Seabed
Case 2
Fish School a
Seabed
Case 1
Fish School a
Case 2
Figure 2-1 Fish echo and tilt angle
Case 3
Fish School a
b
Case 3
2-4
Points to consider
• Normally, a vertically distributed fish school is a better sonar
target than the seabed, because it reflects the transmitted pulse
back toward the transducer.
• In case 3, both fish schools a and b are presented. Gener-
ally speaking, however, midwater fish schools tend to be lar ger
than bottom fish schools and they are often displayed near the
seabed on the display.
• It is difficult to detect bottom fish when they are not distributed vertically.
Page 23
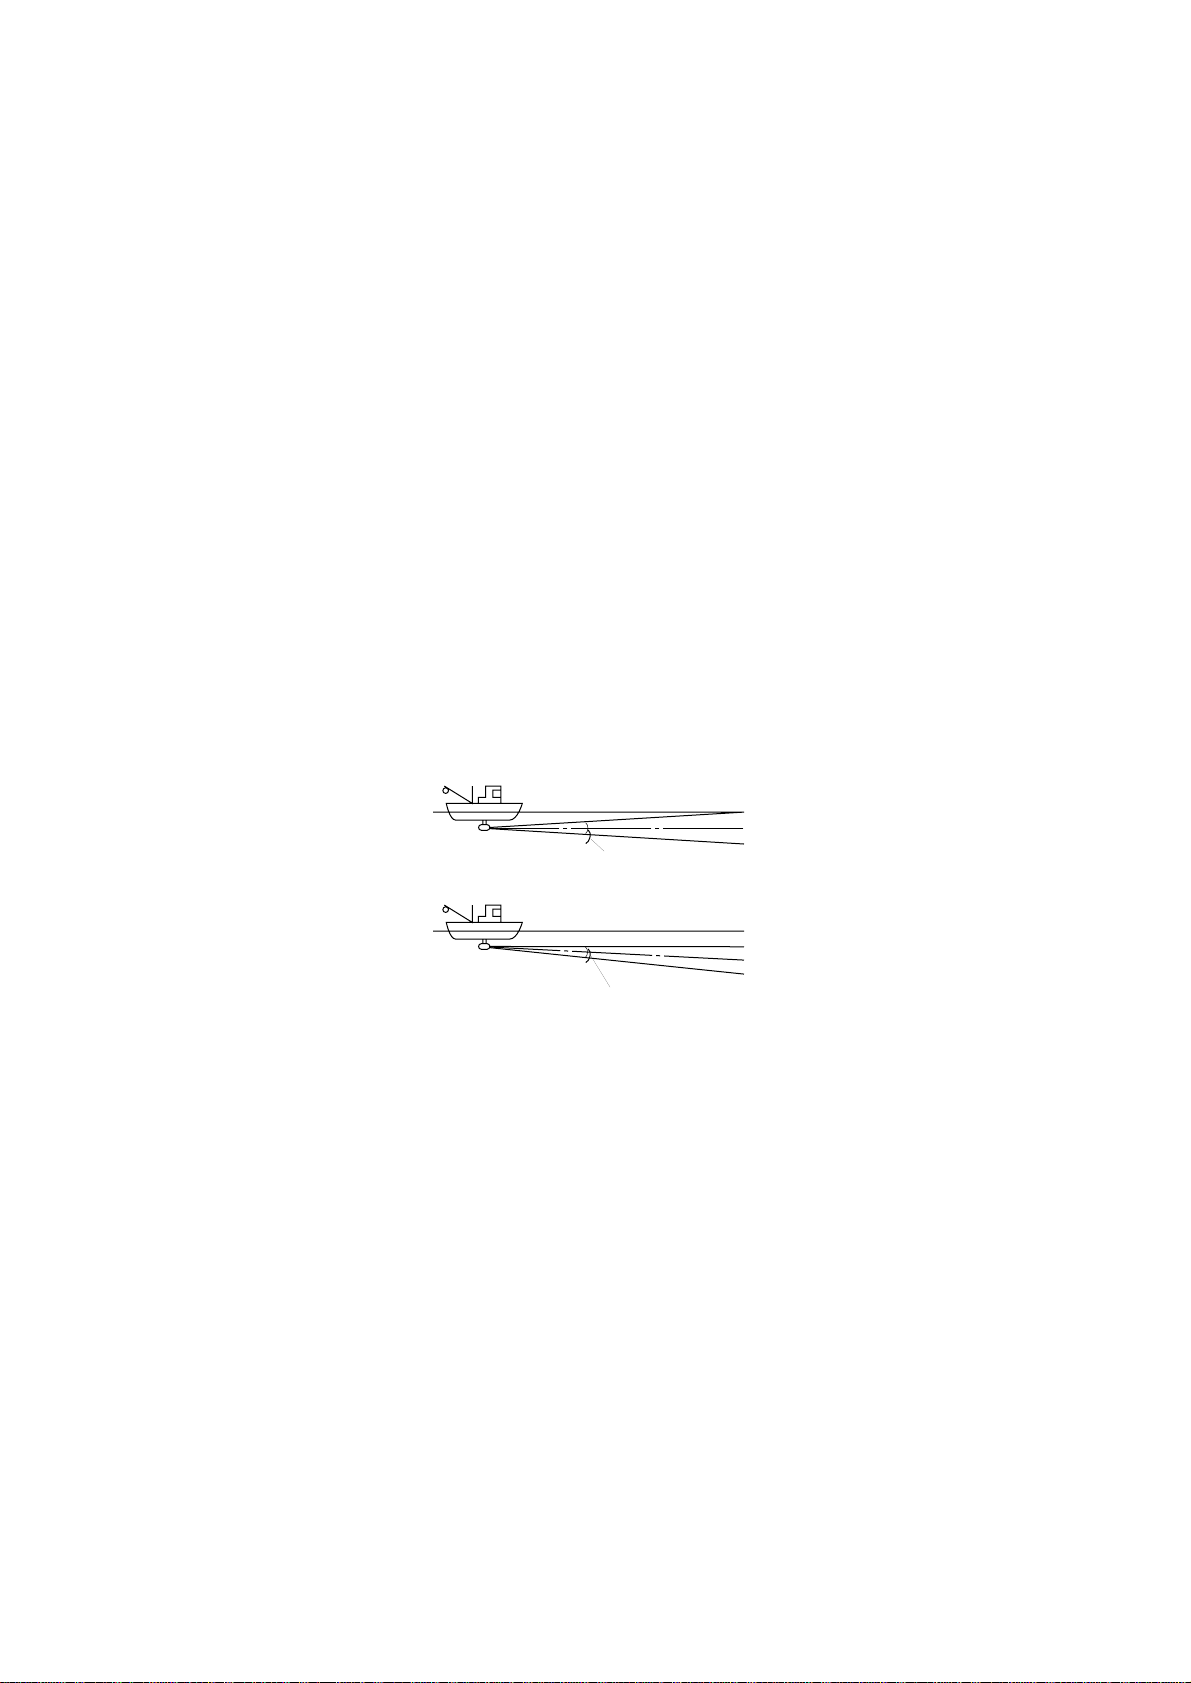
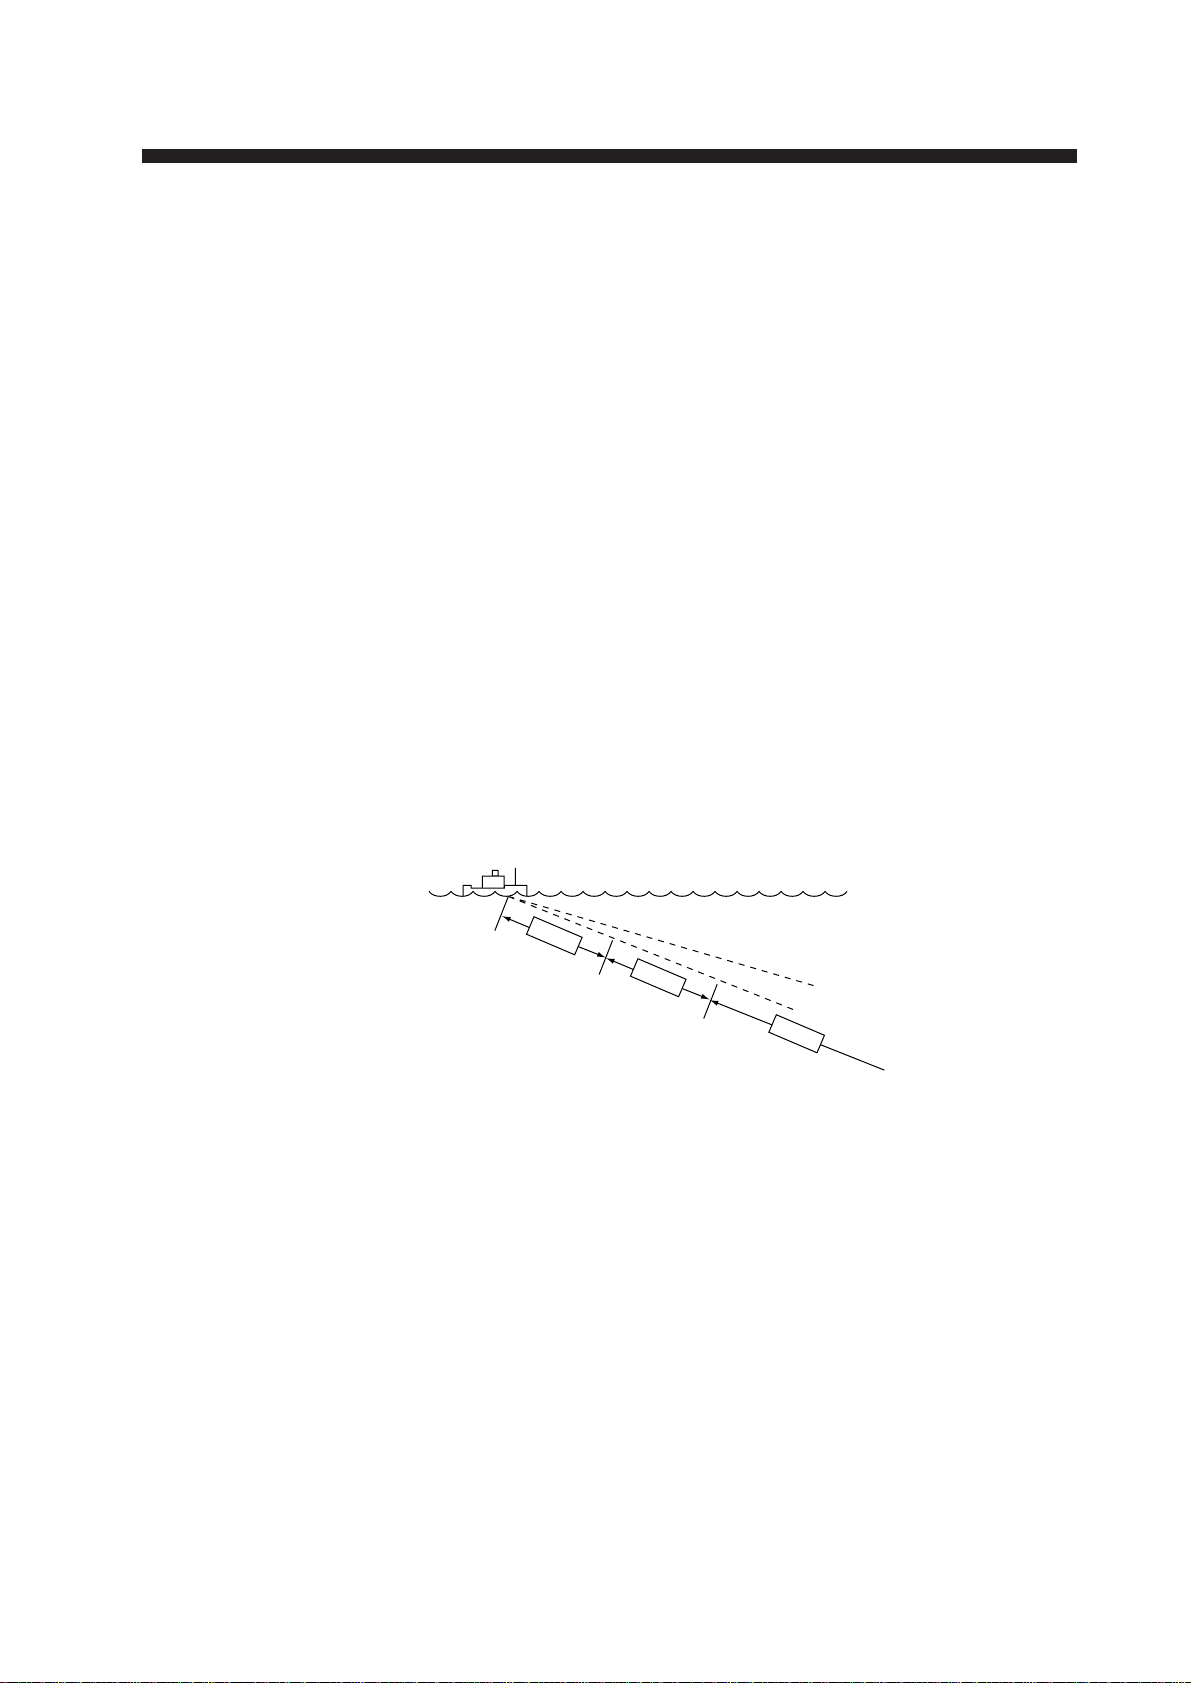
Tilt angle for surface fish
Sound emitted from the sonar transducer forms a circle-shaped
beam with a width of approximately 12 degrees in the vertical
direction (vertical beam width). The tilt angle is indicated by the
angle between the center line of the beam and the horizontal
plane. Then, if the tilt angle is set to 0 degrees, the center line is
parallel with the sea surface and one half of the emitted sound
goes upward, toward the sea surface.
This causes one half of the emitted sound to be reflected toward
the transducer and displayed on the screen as sea surface reflections. When the sea is calm, since the sound is reflected just like
a light hitting a mirror at a narrow incident angle, it propagates
away and the sea surface reflections become negligible.
However if the sea is not calm enough, they will become dominant and interfere with observation of wanted echoes. To minimize these sea surface reflections and to search surface fish
schools effectively, the tilt angle is usually set between 5 and 6
degrees so the upper portion of the beam becomes almost parallel with the sea surface. When the sea is rough, it is often set to a
little larger angle.
Surface
Tilt angle 0°
Tilt angle 5-6°
12°
Surface
12°
Figure 2-2 Tilt angle and sea surface reflections
2-5
Page 24
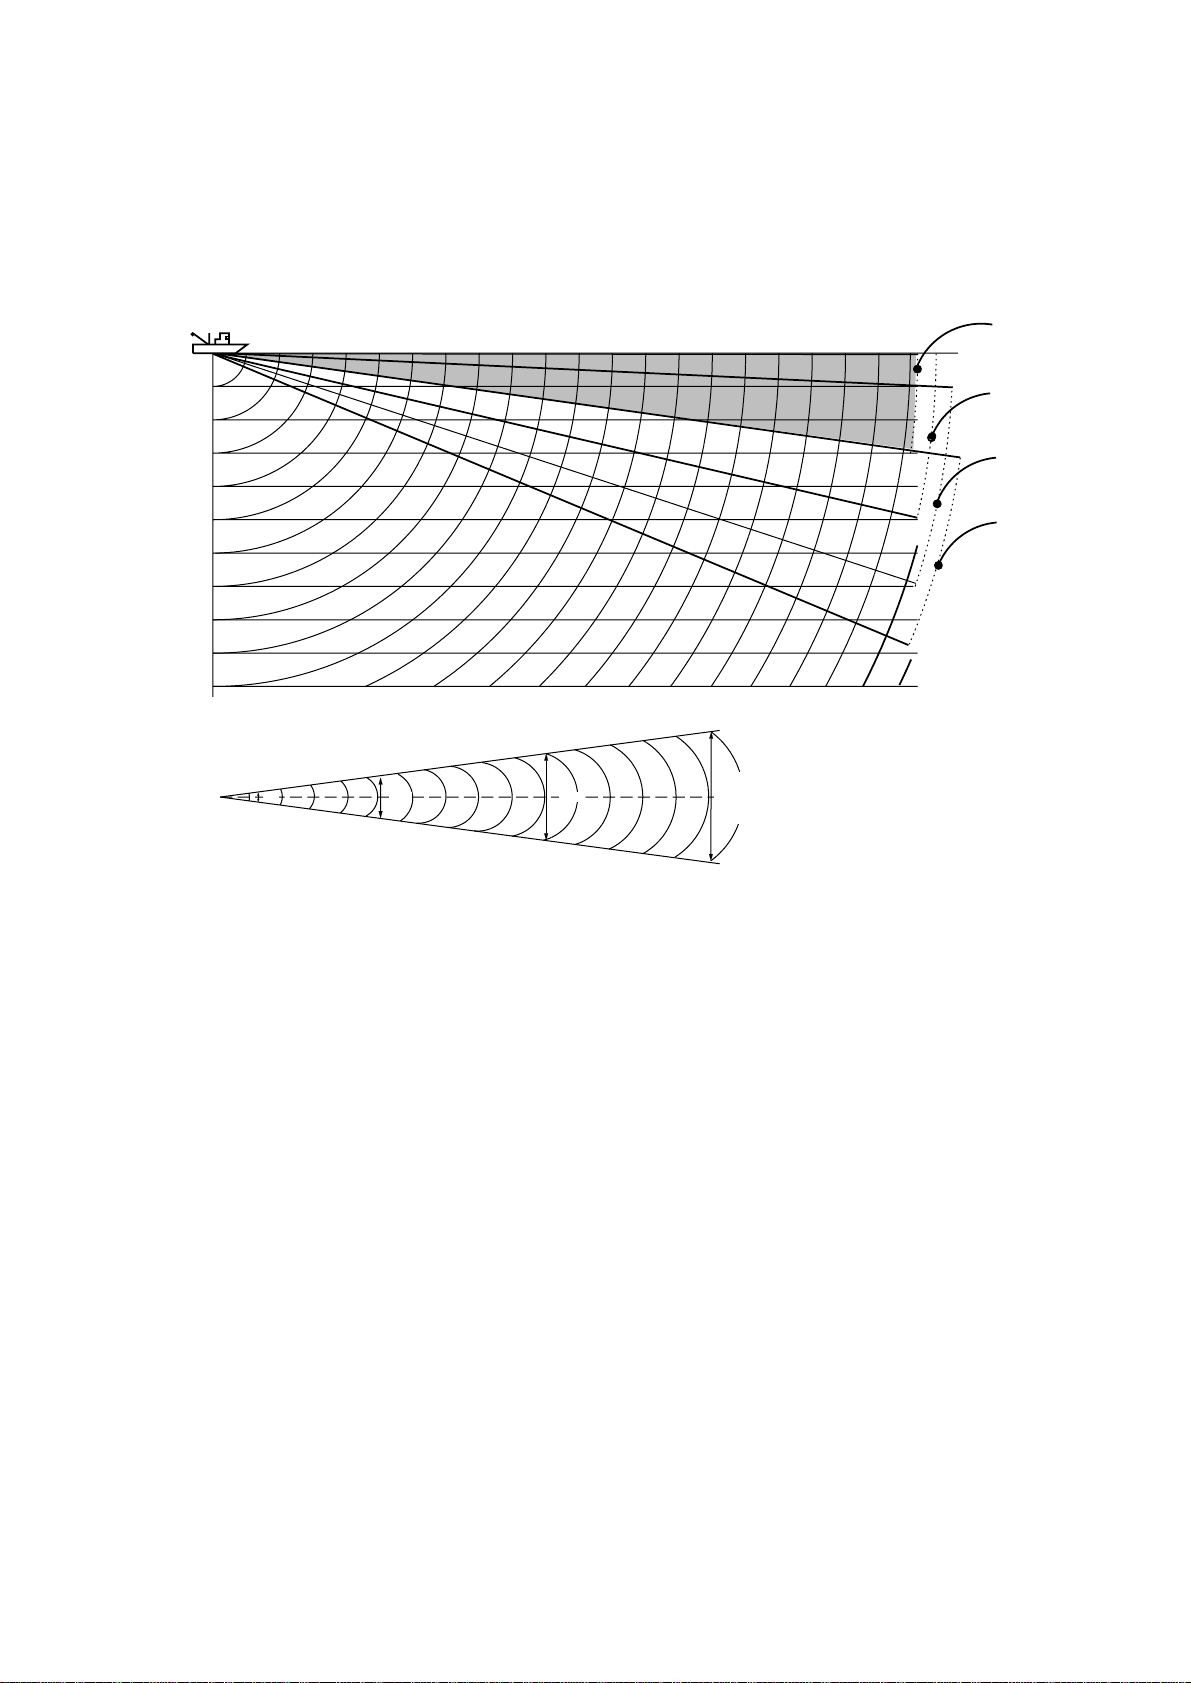
Suitable tilt angle
The figure below illustrates the relationship among tilt angle,
depth and detection range. Refer to it to find out the suitable tilt
angle for a given depth/detection range.
Tilt angle and beam coverage
20(40)
40(80)
60(120)
80(160)
100(200)
Depth (m)
200(400)
Vertical width of sonar beam
100 m100 m
12°
100
(200)
21 m
200
(400)
200 m
42 m
300
(600)
300 m
63 m
Range (m)
400
(800)
0°
5°
10°
15°
Figure 2-3 Tilt angle and beam coverage
2-6
Page 25
Adjusting the Gain
The GAIN control adjusts receiver sensitivity (gain). Adjust it
so fish echoes are clearly displayed with minimal noise on the
screen. Too high a setting not only displays excess noise and
makes it difficult to discriminate wanted echoes but also causes
seabed echoes to be painted in strong colors, resulting in echoes
being masked by seabed reflections. Normally, set the control
somewhere between positions “3” and “5”.
Gain low
Gain proper
Figure 2-4 Gain settings and resulting picture
Measuring Range and Bearing to a Target
Operate the trackball to place the trackball mark on the target
you want to measure the range and bearing. The range and bearing appear at the upper left corner on the screen.
ª
ª
ª
B
Figure 2-5 Location of range and bearing indications
Gain high
Note: The bearing is shown in either 360° or 180° indication
relative to ship’s heading. In the latter case, bearing (“B”) is
indicated as follows:
B P ------- on the port side
B S ------- on the starboard side
2-7
Page 26

2-8
Page 27
FINE TUNING THE PICTURE
Eliminating Unwanted Feeble Echoes
Echoes from targets such as seabed and fish return to the transducer in order of distance to them, and when we compare their
intensities at the transducer face, those from nearer targets are
generally stronger when their reflecting properties are nearly
equal. The sonar operator will be quite inconvenienced if these
echoes are directly displayed on the screen, since he can not
judge the actual size of the target from the size of echoes displayed on the screen. T o overcome this inconvenience, the TVG
function is incorporated. It compensates for propagation loss of
sound in water; amplification of echoes on short range is suppressed and gradually increased as range increases so that similar targets are displayed in the similar intensities irrespective of
the ranges to them.
The CSH-83/84 has three TVG functions, NEAR, MEDIUM
and FAR, and they mainly compensate for propagation loss on
short, middle and long ranges respectively, centered at the ranges
shown below . The higher the TVG setting the greater the amplification of echoes.
Near
About 100 m
Med
About 400 m
Far
Figure 3-1 Principle of TVG
The TVG is also used to suppress unwanted echoes and noise
which appear in a certain range area on the screen such as sea
surface reflections and cruising noise. To set TVG properly, do
the following:
How to adjust TVG
1. Open sub panel 2.
2. Select TVG•TX.
3. Set TVG NEAR, MEDIUM and FAR to 5.
(These are the standard settings and you can maintain them
in most casees.)
3-1
Page 28

4. When sea surface reflections or plankton layers disturb the
picture, decrease appropriate TVG option by one or two steps
by pressing – (minus) key.
5. Locate fish school on a long range setting (about 800 meters)
which is approaching own ship.
6. Adjust the tilt to keep the fish school in the center of the
sonar beam, namely, fish school is displayed in strongest
colors possible. Confirm that the fish echo is displayed in
the same color as it approaches. If the color suddenly changes
to weaker colors as the fish enters MEDIUM and NEAR areas, the TVG is improperly set. Adjust the TVG. If this again
produces sea surface reflections and noise try to remove them
with AGC and NL controls.
Note: If the above procedure does not produce satisfactory results, the TVG curve can be changed on the SYSTEM menu.
The 30 log is the normal setting. The 25 log setting is useful for
searching fish schools near shorelines or shallow waters.
Ask for FURUNO dealar for detail.
3-2
Page 29

Suppressing Seabed Tail
AGC (data setting window: SIGNAL, SIGNAL
PROCESS)
The AGC functions to automatically reduce the receiver gain
only against strong echoes such as the seabed or a large fish
school. Since weak echoes remain unaffected, a small fish school
becomes easier to detect. Adjust it so that the AGC works only
on seabed reflections. Do not set it too high; weak echoes may
be missed.
Pulselength (data setting window: TVG•TX,PL)
The pulselength control determines the length of the transmission pulse emitted into the water. While a longer pulse is advantageous for long range sounding, it has the disadvantage of being
poor in discrimination of targets, that is, ability to separate several closely located targets. When searching bottom fish, therefore, it is useful to shorten the pulselength in order to separate
fish echoes from seabed reflections. Decrease the
PULSELENGTH setting to shorten the pulselength. For search
of surface and midwater fish in which seabed reflections are not
so strong, use the longest pulselength “9”.
2AGC (data setting window: SIGNAL, SIGNAL
PROCESS)
While it is ideal to suppress seabed echoes with the AGC control alone there are some fishing grounds where this is not possible. (The high power sonar has the advantage of long-range
detection but this can also be a disadvantage, since weaker echoes may be hidden in strong, unwanted echoes such as the seabed.)
If you cannot suppress seabed echoes or sea surface reflections
by the AGC control alone, use the 2AGC control. Normally a
setting of 0 or 1 is suitable. For especially strong echoes, use a
setting of 1 or 2.
0: 2AGC function is off.
1 to 4: Larger the number, the greater the effect of
2AGC.
3-3
Page 30
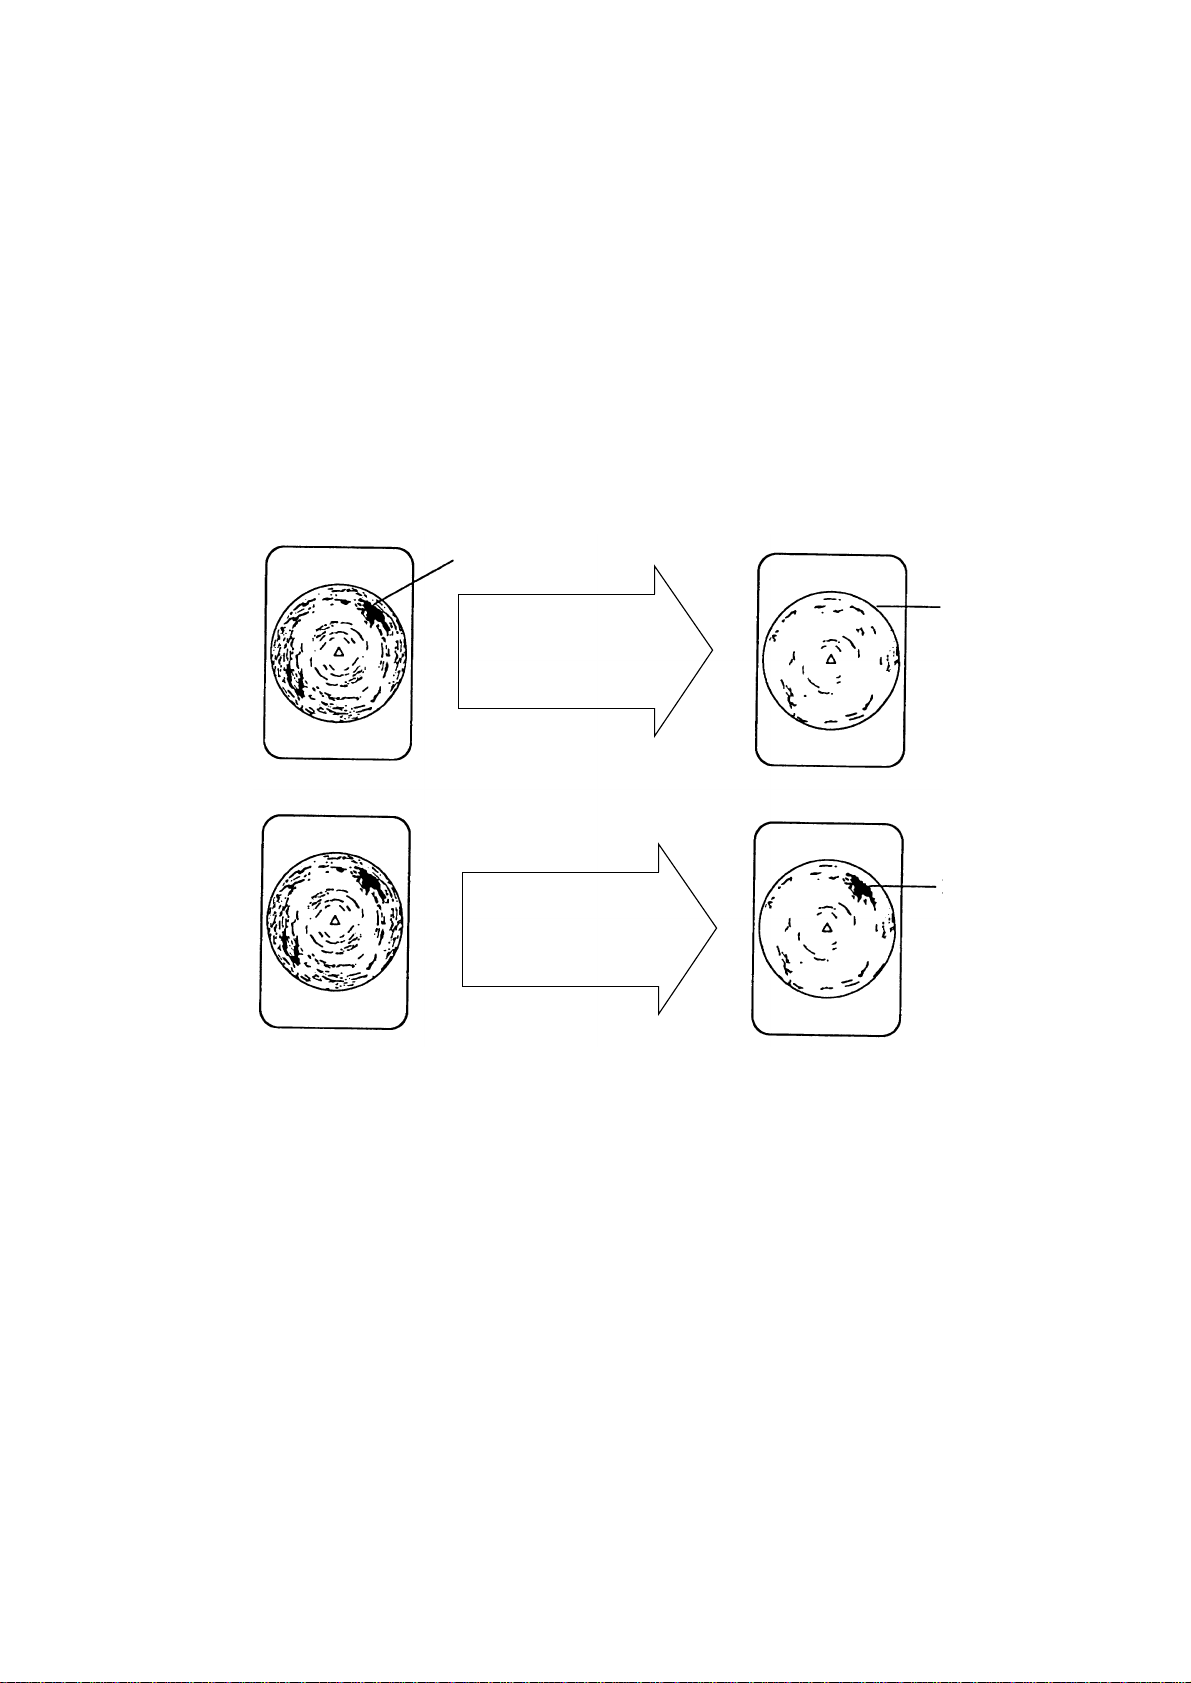
Suppressing Seabed and Sea Surface Reflections in Shallow Waters
Data setting window: TVG•TX, OUTPUT
In shallow fishing grounds with hard or rocky bottom, seabed
reflections often interfere with wanted fish echoes and they can
not be eliminated sufficiently with the aforementioned TVG and
AGC controls, especially when the TILT is set to a larger angle
in order to track fish schools approaching within 400 m. In such
cases try to reduce the output power by adjusting the OUTPUT
control instead of turning down the gain. The picture becomes
clearer when output power is reduced rather than when the GAIN
is decreased as illustrated below .
WRONG
METHOD
CORRECT
METHOD
Fish echo
TVG and AGC
adjusted with
OUTPUT kept high
Reduce OUTPUT
with GAIN kept
constant
Fish echo
weakened
Fish echo
Figure 3-2 How to suppress seabed and sea surface reflections
in shallow waters
Rejecting Sonar Interference and Noise
While observing the sonar picture, you may encounter occasional
or intermittent noise and interference. These are mostly caused
by on-board electronic equipment, engine or propeller noise, or
electrical noise from other sonars being operated nearby.
Identifying noise source
T o eliminate noise effectively , you should first identify the noise
source as follows:
3-4
Page 31

1. Turn off the TX switch and operate all on-board equipment
one by one while observing the picture.
2. Run the boat at various speeds to check if the noise is speed
dependent.
If neither of the above two steps has effect on the picture, adjust
one of the following:
Interference rejector (data setting window: SIGNAL,
SIGNAL PROCESS)
This control is similar to the interference rejector on echo sounders and radars. It is effective for rejecting random noise and sea
surface reflections in rough sea conditions. Set it so that noise is
just eliminated. Do not use an unnecessarily high setting since it
may also reject small wanted echoes.
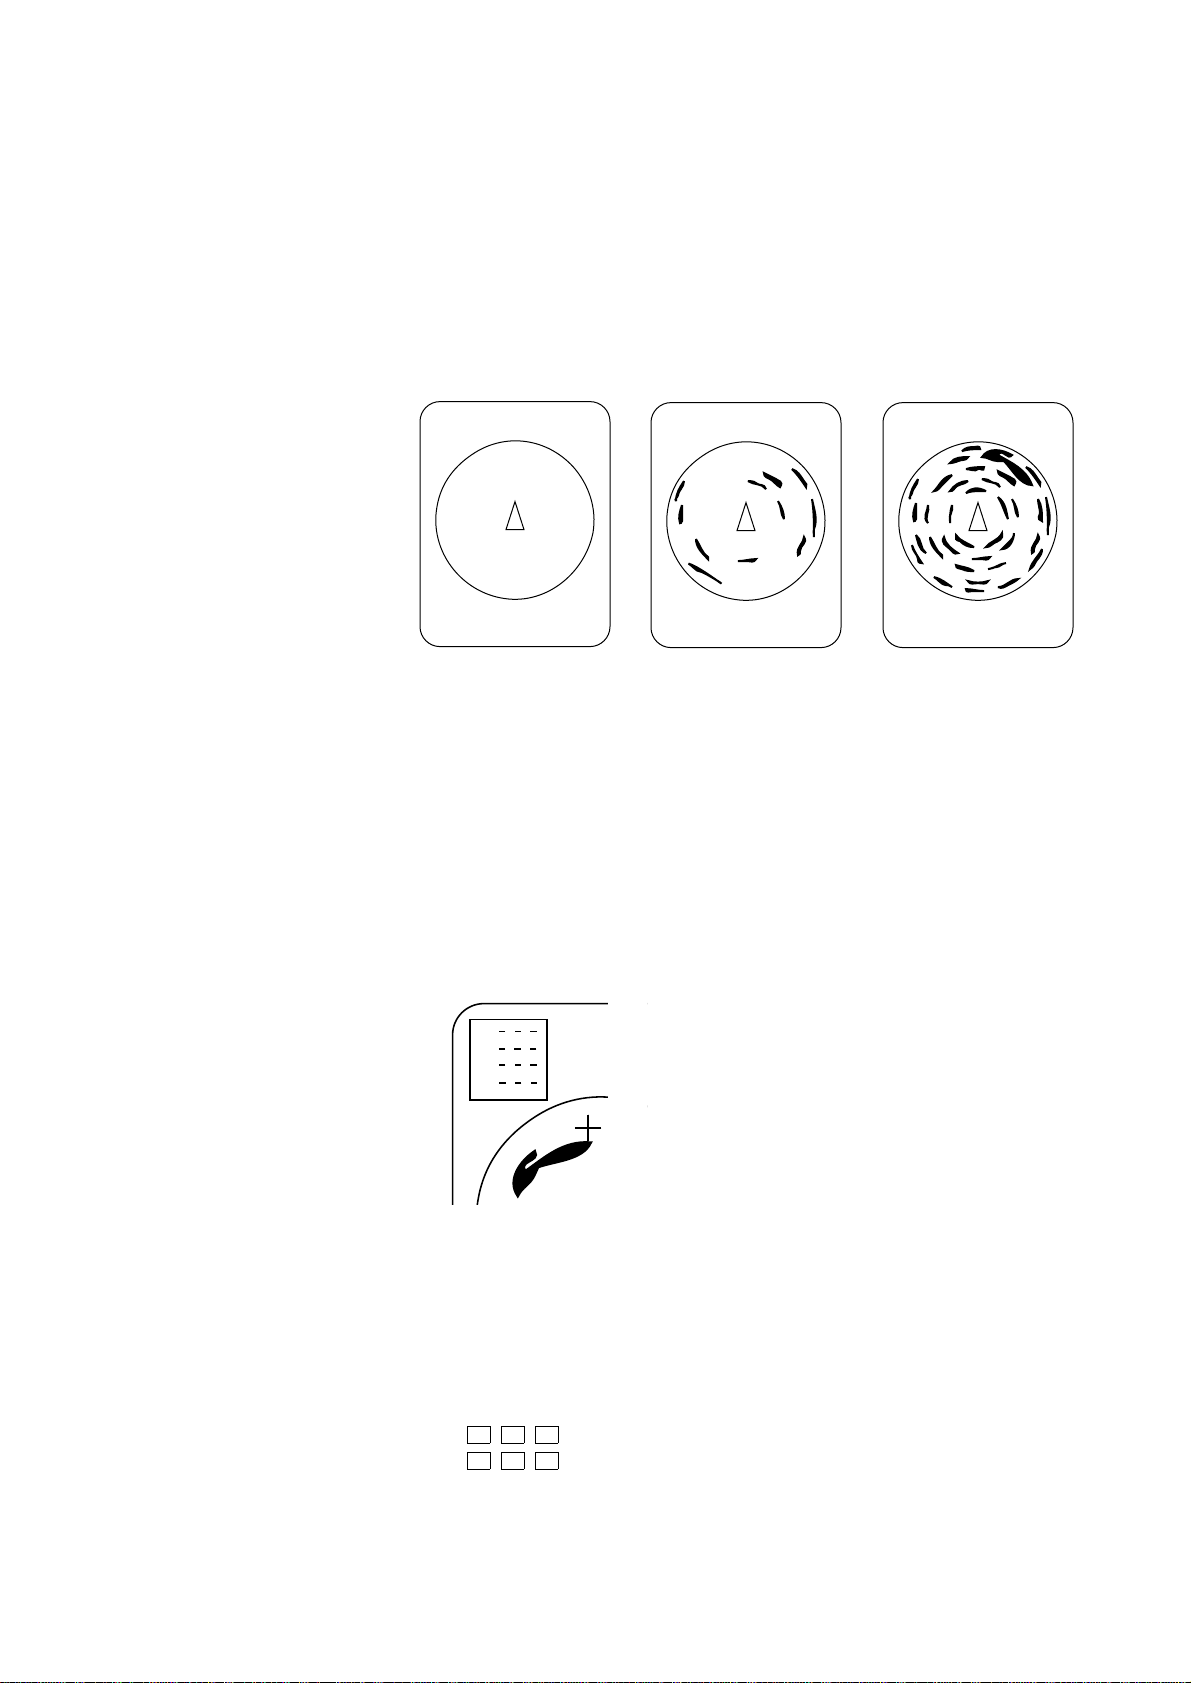
Changing Tx cycle (data setting window: TVG•TX,
CYCLE)
When other sonars operate nearby at the same transmission interval as that of own ship’s sonar , an interference ring caused by
other sonars is displayed. T o erase the interference ring from the
screen, reduce the CYCLE on the data setting window.
Interference
Tx cycle high Tx cycle lowered
Figure 3-3 How CYCLE works
Note: When the sonar is used in shallow water with the range
set between 60 m and 200 m and Tx cycle at “9”, seabed reflections caused by the 2nd-to-the-last transmission may appear on
near ranges. Reduce the Tx cycle setting to “2” or “3” to suppress them.
3-5
Page 32

Setting Noise limiter (data setting window: SIGNAL,
SIGNAL PROCESS)
W eak, unwanted reflections, colored light-blue or green, appear
when the water is dirty, plankton layers exists, or due to ship’s
noise. The noise limiter (NL) can reduce the effects of these
unwanted reflections–raising the setting causes them to become
bluish to background color . Normally a setting of 3 or 4 is sufficient.
Adjusting Beamwidth
Beamwidth can be adjusted at SONR•BEAM, BEAM on the
data setting window .
Table 3-1 Beamwidth adjustment menus
uneMnoitacilppA
ehtgnittesehtrehgihehT.esulamronrof"0"otteS
ROH
.snoitidnoc
0elgnatlitneewteB ° 31dna ° tlitehtrewoleht,
5-elgnatlit ° 06dna °.
REV
.snoitidnoc
.denerppussi
.puseogniag
;swollofsasegnahcaeraevitceffe
m001ot0:raeN
m004ot52:muideM
m001nahteroM:raF
.lamronnahtrediw
desuebyamlortnocsihT.maebehtreworran
sserppusotslortnocLNdnaCGAehthtiwrehtegot
.seohcedebaesdnasnoitcelferecafrusaes
.zHk88dna18,57ycneuqerFXTfoesacnI
lamronrofesU.gnittesdradnatssisihT:0
.)kaew(sesionecafrusaesehtsserppusotsisihT:1
.egnarraenrofCGAehtregnortseht,elgna
.evitceffeeromsiCGAtub,"1"evobasaemaS:2
neewtebevitceffesiCGAtub,"1"evobasaenaS:3
.evitceffeeromsiCGAtub,"3"evobasaemaS.4
.zHk701dna49ycneuqerFXTfoesacnI
lamronrofesU.gnittesdradnatssisihT:0
tuptuoehT.egnarrafgnitcetedrofdesusisihT:1
egnarraenfo)GVT(niagehtdnapuseogrewop
ehT.noitatneserpehtgnivorpmirofdesusisihT:2
gniviecerehtdnanetrohssihtgnelesluptuptuo
GVT.sesiovecafrusehtsserppusotsisihT.3
seogXRdnaXTrofhtdiwmaeblacitrevehT:4
3-6
Page 33

MARKS AND DA TA
Marks, Data and Display Mode
Normal display mode
Figure 4-1 Marks and data appearing in the normal display
mode
4-1
Page 34

Normal display mode w/text
Figure 4-2 Marks and data appearing in the normal display
mode w/text
Echo sounder combination
display
4-2
Figure 4-3 Marks and data appearing in the echo sounder
combination display mode
Page 35

History display
Figure 4-4 Marks and data appearing in the history display
mode
Permanently Displayed Marks and Data
Mark/Data Description
Trackball Mark Data
↓
→
↓
B °
Range Data
R
Trackball mark data:
→
: Slant range
→
: Horizontal range
↓
: Depth
B : Bearing
Bearing is shown in 360° or –180° indication system, relative to ship’s
heading. In the latter case, "B" is indicated as follows:
BP
BS
.... on the port side
.... on the starboard side
Shows the range scale set with the RANGE control.
*Requres external sensor.
Tilt Angle Data
T °
( )
(Continued on next page)
The tilt angle appears below the range. The tilt angle can be changed
in 1° steps within the range of -5° to 60°. In *target lock and automatic
tilt control, the instantaneous tilt angle appears in parentheses.
Accordingly, both are equal when target lock is on. In automatic tilt,
the upper indication shows the tilt angle set by the TILT lever and
the lower indication the instantaneous tilt angle at which the sonar
actually works.
4-3
Page 36

Mark/Data Description
Own Ship's Mark
Shows own ship's present position. The direction of the arrow shows
ship's heading. This mark moves with ship's movement in the * true
motion mode. On all other modes it is fixed at the screen center.
* North Mark
(or Heading Mark)
When the CSH-83/84 is connected to a gyrocompass the mark is called
the north mark and points North. If there is no gyrocompass input
it is the heading mark and points in the direction of own ship's heading.
Heading Data
This data requires gyrocompass input. Bearing is displayed in
32-azimuth (N, N/E, etc.). Bearing can also be displayed in figures
(for example, "360") by calling up the SYSTEM menu and selecting
BRG READOUT-Course.
Trackball Mark
Sets own ship's mark location for off-center display; sets location for
mark input. The trackball (or arrow keys on the remote control box)
controls this mark.
Erasable Marks and Data
Mark/Data Description
Latest Event
Mark
These marks depict important locations. With speed log and gyrocompass connection these marks follow ship’s movement. In the *true
motion mode they are stationary. Ten marks, one latest and nine event
marks, can be entered. When more than ten marks are entered the
Event Mark
1
1
Latest Event Mark
Data
oldest is erased to make room for the latest.
The position data of the latest event mark, that is, horizontal range (→),
current depth (↓) and bearing. ( ) shows the latest event mark’s
original depth, and remains unchanged regardless of ship’s movement
or tilt angle. When the event mark is erased the above data disappears
→
↓
( )
°
B
from the screen.
To erase an event mark, place the trackball mark on the event mark
and press the EVENT key.
(Continued on next page)
4-4
Page 37

Mark/Data Description
Latest Fish Mark
Fish Mark
Fish Mark
Fish Movement
→
→
C
S.
Bearing and Range
Marks
Bearing
marker
These marks are inscribed on the screen by pressing the FISH key.
Ten fish marks can be entered. Each time the key is pressed the fish
mark appearance changes on the screen as follows:
1st press of FISH key
2nd press of FISH key
3rd press of FISH key
4th press of FISH key
Fish movement from the fish speed mark ( ) to the latest fish
mark ( ) is shown by distance, course (C) and speed (S) at the lower
right corner of the screen.
These marks are used for monitoring echoes through the loudspeaker
and also for displaying horizontal slice picture. If the *target lock
function is on the bearing marks follow the movement of the target
lock mark.
Range and Bearing
This data appears when the bearing and range marks are displayed.
Mark Data
B ° R
Heading Mark
The heading mark is drawn with a dotted line. *Heading mark data
appears at the top of the screen.
Range Rings
The range rings are inscribed at intervals of 1/4 of the range in use.
Range ring data is also provided every two range rings. The range ring
interval can be changed from 1/4 to 1/2 through the menu.
100
200
Electronic Bearing
Scale
N
WE
S
The electronic bearing scale is available with gyrocompass connection.
It rotates with own ship’s movement.
(Continued on next page)
4-5
Page 38

Mark Description
*Ship’s Track Mark
With gyrocompass or speed log connection, own ship’s track is plotted
by a solid line. When the length of the line exceeds five times the
range the oldest part of the track is erased.
*Tidal
Current
Mark
3
2
1
This mark can be displayed with current indicator input. The tidal
current marks are displayed on the net shooting mark ( ) and net
sonde marks ( ). The tidal current markers shows tidal current
speed in three layers (1—3) selected on the tidal current indicator.
The tidal current speed is shown by the length of the tidal current mark.
Tidal Current Data
Normal mode
C1 : . M
C2 : . M
C3 : . M
Note however that no tidal current mark appears if the tidal current
speed is less than 0.2 kts. Current direction can be shown as "to" or
"from" by selecting CURRENT VEC-Current Flow Dir on the USER
menu. In the normal mode with text, speed, direction and depth of the
current are shown for three layers (C1, C2, C3). In the echo sounder
Combination mode
C1 : .
C2 : .
C3 : .
combination and history modes, only the speed appears (C1, C2, C3),
on the echo sounder combination or history display.
*Net Sonde Data When the net sonde is connected, the depth of the net sonde trans-
C1 :
C2 :
C3 :
mitters appears in the text window, echo sounder, or audio area.
Nav Data
S: .
C:
D:
T: .
Own Ship Data
° .N
° .E
Estimate Mark
The estimate mark gives relative fish quantity. Press the ESTIMATE
key. The estimate mark data appears below the mark. The fish amount
is assessed as between 0 and 100, where if the mark is filled with the
strongest echo color reddish brown, the amount is regarded as "100."
Estimate mark
data
The size of the estimate mark can be changed with MARK SIZE2Estimate Mark on the SYSTEM menu.
(Continued on next page)
With appropriate sensors speed (S), course (C), water depth (D) and
water temperature (T) can be displayed on the text window, echo
sounder combination display and history display.
With navigation input position can be displayed in latitude and longitude, in the normal mode only.
4-6
Page 39

Mark Description
Target Lock Mark The target lock mark automatically tracks the fish school selected
by the operator. This function requires speed and gyrocompass inputs.
or
Net Shooting Mark
Net Shooting Data
:
Net Sonde Mark
(10 pts. max)
E/S Picture Advance
Range Data
1 8 0 0
Press the SHOOT key at the instant you shoot the net to display the
net shooting mark on the display. The net shooting mark is drawn
at own ship’s position the moment the key is pressed and moves on the
own ship’s track mark with ship’s movement. In addition to the
mark, time elapsed and *distance run (in meters) appear from the
time the key is pressed. The mark and its data remain on the screen
until the SHOOT key is pressed again.
These marks appear on the *ship’s track mark in order at set intervals,
when a net sonde is connected. In the echo sounder combination
mode they also appear in the echo sounder picture, showing depth of
the net sonde transmitters with bars extending vertically from the marks.
Picture advance on the echo sounder combination mode automatically
changes to ship’s speed dependent (advance) rate from the moment
the SHOOT key is pressed, provided there is speed log input. The
E/S picture advance range data shows the distance between the right
and left edges of the echo sounder picture window in the ship’s speed
dependent advance. Since the net length plus wire length set on the
DATA SET menu is used as this distance data, the echograms
obtained during casting the net are displayed just across the E/S
window. Set net length and wire length on NET SONDE in the DATA
SET menu.
Control Setting
Color Bar
E/S Range Scale
When the switches listed below are operated the new setting is noted
at the top of the screen in larger characters for five seconds. The auto
tilt width and auto scan width also appear upon turning on the AUTO
TILT and AUTO SCAN functions.
Control, Display Control, Display
RANGE R
TILT T °
GAIN G .
TVG TVG .
AUTO TILT –
AUTO SCAN –
BRILL
DIM
TX TX .
The 16-color bar appears at the right-hand edge in the echo sounder
and history displays.
The range scale for the echo sounder picture appears in the echo
sounder combination mode. You can display it on the right or left
side of the screen by selecting ES/NET REC on the INIT SET/TEST
menu.
4-7
Page 40

4-8
Page 41

MENU OVERVIEW
Many functions are carried out through the menu system, which
consists of the USER, SYSTEM, DA T A SET and INITIAL SET/
DATA menus. The menu you will use most often is the USER
menu.
Menu
USER
SYSTEM
DATA SET
INIT SET/TEST
USER Menu Operation
The menu operating procedure is the same for all types of menus.
Below is the basic menu operating procedure for the USER menu.
1. Press the MENU key to open the USER menu.
How to open
Press MENU.
Press and MENU together.
Press and MENU together.
Press MENU and ON together.
(Press and hold down until the buzzer sounds.
All LEDs light while keys are held down.)
USER MENU
Select item with dc[ \ keys and press MENU key.
Press END key to close menu.
CARD UTILITY
DATA DISPLAY
CURRENT VEC
CARD ECHO DAT
MARK DSP 1
SAVE PICTURE
CARD NET DATA
MARK DSP 2
Figure 5-1 USER menu
FUNCTION KEY
HIST DSP/GRPH
5-1
Page 42

2. Operate the arrow keys in sub panel 1 to select a menu. As
you move through the menu, each item, initially shown as
blue on gray , reverses to gray on blue to show selection. For
example, select the HIST DSP/GRPH menu.
3. Press the MENU key to display menu selected.
USER MENU
Select item with dc[ \ keys and press MENU key.
Press END key to close menu.
HIST Window DSP
Fish Histogram
HIST DSP/GRPH
AUDIO
ON
PRT/STBD
OFF
H-Slice
Figure 5-2 HIST DSP/GRPH menu
4. Operate the up and down arrow keys in sub panel 1 to select
menu item, and the right and left arrow keys to select option.
5. Press the END key to close the menu. Press the key again to
display picture.
Note: The HELP key provides menu operating information.
Menu screen location and display mode
Menu screen location depends on display mode as shown in the
figure below.
Menu
Menu
Normal Mode
Combination Mode
Figure 5-3 Menu screen location and display mode
5-2
Page 43

USER Menu Description
Table 5-1 User menu description
uneMmetIuneMnoitpircseD
tsiL.dracyromemfostnetnocstsiL
DRAC
YTILITU
OHCEDRAC
TAD
TENDRAC
ATAD
YEKNOITCNUF
YALPSIDATAD
1PSDKRAM
evaS.dracyromemotsgnittesunemdnalortnocsevaS
eteleD.dracyromemmorfatadseteleD
ezilaitinI.dracyromemstamroF
evaSlanretniniderots(krametamitseedisniohcesevaS
evaS)yromemlanretniniderots(atadgnitoohstensevaS
retsigeRyalpsid,niag,egnarfosgnittesdezimotsucsevaS
1kraMtnevE
2kraMtnevE
kraMhsiF
ataDkcarTnO
wodniWtxeT
wodniWSE
gniraeB/egnaR
kraMgnidaeH
sgniRegnaR
elacSgniraeB
htdiWnacSotuA
.dracyromemot)yekOMEMybyromem
.dracyromemot
dna,unemmetsys,unemresu,FFO/NOXT,edom
.yeknoitcnufotunemtesatad
stceles"wodniWSE".ffo/noskramesohtsnruT
erahcihw,atadednostenroatadtnerrucladit
elihwyalpsidnoitanibmocS/Eehtnodeyalpsid
.tenehtgnitoohs
ffogninruttahtetoN.ffo/noskramesohtsnruT
.yalpsidatadehtffosnrutoslakramgniraeB/egnaR
2PSDKRAM
HPRG/PSIDTSIH
(Continued on next page)
kcarTs'pihS
tnemevoMteN
tolP
tcennoCKMhsiF
KMgnikcarThsiF
tolPkcarThsiF
wodniWTSIH
psD
margotsiHhsiFseohcerofnoitubirtsidytisnetniohceffo/nosnruT
.ffo/noskramesohtsnruT
:wodniwTSIHrofyalpsidfoepytsesoohC
.rotcesoiduanihtiwseohcesyalpsiD:OIDUA
dnatropdeificepsniseohcesyalpsiD:DBTS/TRP
.snoitceriddraobrats
foflahreppugnolaseohcesyalpsiD:ecilS-H
.kramegnar
.yalpsidecilStegraTehtnokrametamitseedisni
5-3
Page 44

uneMmetIuneMnoitpircseD
kraMpihSnwO
ceVtnerruC/w
kraMnoitisoPnwO
CEVTNERRUC
dohteMevaS.seohceevasotwohstceleS
ERUTCIPEVAS
ceVtnerruC/w
kraMtoohSteN
ceVtnerruC/w
riDwolFtnerruC
.dracyromem
.yromemlanretni
.yromemlanretniot
noitceriDwolFtnerruC.ffo/noskramesohtsnruT
."morF"ro"oT"sanoitceridtnerrucladitsyalpsid
otneercselohwnoataddnaseohcesevaS:elohW
otkrametamitseedisniseohcesevaS:KMtsE
neercselohwnoataddnaseohcesevaS:evaSKQ
5-4
Page 45

SYSTEM Menu Description
The SYSTEM menu can be displayed by pressing MENU and
c
together.
For help, press the HELP key.
uneMmetInoitpircseD
LANGIS
SSECORP
GVTRAFevruCGVTraFotevrucGVTRAFelbatiusstceleS
gnRohcEhtoomSegnarnilevelgnihtoomsohcestceleS
riCohcEhtoomSralucricnilevelgnihtoomsohcestceleS
roloCeteleDniesiondnaseohcederisednuetelednacuoY
rehgiheht,rebmunehtrehgihehT.noitcerid
siegnargnittesehT.tceffegnihtoomseht
.3ot0morf
rehgiheht,rebmunehtrehgihehT.noitcerid
ot0siegnargnittesehT.tceffegnihtoomseht
.3
lufesusisihT.yalpsidehtmorfsrolocniatrec
hsifegralgnitceteddnaesiongnitanimilerof
uoyfI.01ot1siegnargnittesehT.sloohcs
srolocnideyalpsidseohceeteledottnaw
rof,roloctsekaewht5ehtnahtrekaew
.4ottes,elpmaxe
tadnuosfossolnoitagaporprofetasnepmoc
.gnitteslamronehtsigol03.rehtrafrom001
mottobllamsgnihcraesrofelbatiuS:gol52
.eniltsaocraenroretawwollahsnihsif
gnittesdradnatS:gol03
PSDMTegnaRyalpsiDMTnoitomeurtehtniegnaryalpsidastceleS
KCOLTEGRATdohteMgnikcarTnikcartotmetitahwsenimretednoitposihT
(Continued on next page)
yalpsid,morf.R6.1dnaR3.1
busnepo,noitazinorhcnysPKelbaneoT:etoN
TIMSNARTdnaXT•GVTesoohc,2lenap
."0"otELCYCtesnehtdna
roohcehsif,kramkcoltegrat;kcoltegrat
.otuA
roloCohcEkcarTtegratehtnikcartotroloctsekaewehttceleS
.noitcnufkcol
timiLdeepShsiF.hsiffognikcartrof)tk(deepstimilsteS
erehtestimilsdeecxehsiffodeepsnehW
.dellecnacsikcoltegrat
wodniWkcarThsiFgnikcartfotuo)m01ot1(egnarstceleS
wodniwsihtfotuoskcarthsifnehW.wodniw
dnagnivomsitegratehtsegdujtnempiuqeeht
.gnitteslamronehtsi01.kcartstisecart
5-5
Page 46

uneMmetInoitpircseD
KCOLTEGRATetadpUdpShsiF.tuodaerdeepshsiffolavretnietadpustceleS
.gnittes
wodniWKLtegraT;)slexipni(wodniwkcoltegratfoezisstceleS
.)tsegral(821
TUODAERGRBesruoCgniraebdnaesruocroftuodaerfotinustceleS
063 ° .gniraebeurt
ataDtnerruCssapmoc23nituodaeratadtnerrucsyalpsiD
063,gniraeb ° 081,gniraebeurt ° evitaler
063ro,gniraeb ° .gniraebevitaler
kraMtnevEssapmoc23nituodaerkramtnevesyalpsiD
063,gniraeb ° 081,gniraebeurt ° evitaler
063ro,gniraeb ° .gniraebevitaler
skraMrehtOdnakramllabkcartfonoitacolsyalpsiD
081,gniraebeurt ° 063ro,gniraebevitaler °
.gniraebevitaler
,sdnoces03,sdnoces51morftcelesnacuoY
lamronehtsi06.sdnoces06ro,sdnoces54
x821ro,)egral(69x69,)lamron(46x46
rogniraebssapmoc23;skramhsifneewteb
063,gniraebssapmoc23nirekramgniraeb °
YALPSIDATADgnitteSlortnoCdna"ranoS".noitarepolamronrofFFOpeeK
ataDwodniWtxeTtayalpsidotatad)rosneslanretxe(sesoohC
1EZISKRAMkraMllabkcarT
kraMkcoLtegraT
1kraMtnevE
2kraMtnevE
kraMhsiF
noitisoppihSnwO
kraM
2EZISKRAMkraMpihSnwO
kraMtoohSteN
kraMetamitsE
rotceVtnerruC
sgniRegnaR
KMkcarTs'pihS
.ylnoesuyrotcafroferasnoitpo"kcoLTGT"
.atadelbaliavallasedivorp"1".mottobneercs
regralniatadsseledivorpsnoitporehtO
.sretcarahc
+;kramllabkcartfoepahsdnaezistceleS
llamsroegralnielbaliava,elgnatcerro,kram
.ezis
rofskramesehtfoezisehttcelesnacuoY
.llamsroegral
roegralrofskramesehtfoezisehttceleS
.llams
rofrotcevtnerrucehtfohtgnelehtstceleS
.trohsrognol
egnarfo)esuniegnarsemit(lavretnistceleS
.R2/1roR4/1;sgnir
s'pihsfo)esuniegnarsemit(htgnelsesoohC
.kcart
(Continued on next page)
5-6
Page 47

uneMmetInoitpircseD
CERTEN/SEevruCroloC1SErolocnoitatneserpsusrevlevelohcestceleS
sa
evruCroloC2SE.2rednuosohceroftpecxeevobasaemaS
ecnavdAerutciPohceehtrofdeepsecnavdaerutcipsteS
.yalpsidrednuos
toohStaecnavdAdeepss'pihsevahot"ednoS"sesoohC
erutciPceRteN;edomyalpsiderutcipredrocertenstceleS
.1rednuosohcerofevruc
suoucipsnocsatoneraseohcekaeW:raeniL
gnitanimileroflufesU.gnittesgolni
.seohcekaew
"regnorts"nidetniaperaseohcekaeW:goL
reisaeehtgnittesehtrehgihehT.sroloc
.yalpsidehtnoeesotseohcerekaewera
erutciprednuosohcefoecnavdatnedneped
ecnavdaevahot"PK"dnatengnitoohselihw
.noissimsnarthtiwdezinorhcnys
.gnidnuosnwodronwod/pu
YALPSIDTSIHhtdiWecilS-HreppugnolaseohcegnilpmasrofhtdiwstceleS
elpmaSDBTS/TRPgnilpmasrofwobs'pihsmorfelgnasteS
KCOLRETNIegnaR,tliT
kraMtnevE
kraMhsiF
kraMtoohSteN
kcoLtegraT
STLUAFEDstluafeDtesatad,resullaraelcotyekUNEMsserP
SREHTOyeKtnevEkramtneve;yek]TNEVE[fonoitcnufesoohC
tamroFataD;rotagivanroftamroftuptuoatadesoohC
ecilslatnozirohnirekramegnarfoflah
ehtrediwehtgnittesehtrehgihehT.yalpsid
.aeragnilpmas
.yalpsidDBTS/TRPniseohce
evitcepserhtiwsmetiesehtkcolretninacuoY
fI.48/38-HSCehtotdetcennocranosnosmeti
emityna,elpmaxerof,egnarehtkcolretniuoy
siti48/38-HSCehtnodegnahcsiegnareht
detcennocranosehtnodegnahcyllacitamotua
.asrevecivdna
tluafederotserdnasgnittessunemmetsysdna
.sunemmetsysllanosgnittes
.yrtnekramgnitoohstetsysenroyrtne
.reVAEMNro5.1.reV3810AEMN/FIC
.0.2
tliTotuA.worraNroediW;htdiwtlitotuatceleS
701dna49,18ehthtiwelbaliavasiworraN
.srecudsnartzHk
5-7
Page 48

DATA SET Menu Description
,
The DA TA SET menu can be display by pressing MENU + d.
For help, press the HELP key.
Menu Item Description
COLOR CURVE Sonar 1
Sonar 2
Echo Sounder 1
Echo Sounder 2
For each of these devices you may change
settings of echo level versus presentation color
curve, which you selected at either "CURVE"
at SIGNAL PROCESS on data setting
window or system menu. Note that Sonar 2 is
not used.
l. First select item to change on COLOR
CURVE sub menu, and then press the
MENU key.
Display
color
15
13
C
o
l
o
r
B
a
r
11
8
4
Level
setting
255
193
104
58
18
(Continued on next page)
,,
0
00 128 255
Level
2. Color curve can be changed at colors no. 4,
8, 11, 13 and 15. Press up or down arrow
key to set cursor on color no. you want to
change curve.
3. Press the right or left arrow key to change
value.
4. Press the END key to terminate color
curve setting. Then, the display shown
below appears. Follow the instructions on
the screen.
Color curve setting is completed.
To save change and close the menu, press
MENU key.
To cancel change and close the menu, press
END key.
5-8
Page 49

uneMmetInoitpircseD
,
,
,
,
ROLOCEGNAHC1ranoS
smetiesehtforolocehtezimotsucnacuoY
2ranoS
rednuoSohcE
skraM
uneM
.yekROLOCybnoitceles
ranoStahtetoN.cte,tseuqerresuotgnidrocca
noegnahcrolocyalpsidroF.desutonsi2
otgnidroccarolocegnahcnacuoy1ranoS
EGNAHCnoegnahcotmetitcelestsriF.1
ehtsserpnehtdna,unembusROLOC
.yekUNEM
Before
(R) (G) (B) (R) (G) (G)
15
14
13
12
11
10
9
8
7
6
5
4
3
2
1
0
Display
Color
,,
,,
,,
,,
Before
(Continued on next page)
norosrucehtecalp,yekworraehtgnisU.2
fI.rolocegnahcottnawuoytnemgesroloc
ehtroskramforolocehtgnignahcerauoy
yalpsidotyekPLEHehtsserp,unem
.srolocriehtgnignahcrofsenilediug
otsyekworranwodropuehtsserP.3
nacuoY.001dna0neewteb,eulavegnahc
retsaftegotsyekehtnwoddlohdnasserp
.egnahc
rehtoegnahcot3dna2spetstaepeR.4
.sroloc
.gnittesrolocetanimretotyekDNEsserP.5
.sraeppawolebnwohsyalpsideht,nehT
.neercsehtnosnoitcurtsniehtwolloF
.detelpmocsignittesevrucroloC
sserp,unemehtesolcdnaegnahcevasoT
.yekUNEM
sserp,unemehtesolcdnaegnahclecnacoT
.yekDNE
5-9
Page 50

uneMmetInoitpircseD
TOOHSTEN
NALP
EDNOSTENRTMXednoSteNdnasrettimsnartednostenforebmunsteS
retemaiDteNyrassecenretemaidnruts'pihsdetamitsesteS
fonoitcipedetaruccategot,tengnitoohsrof
ybyalpsidnacuoyhcihw,kramnoitacolten
gnittesehT.yekESRUOCTENehtgnisserp
.spetsretem01nisretem0001ot002siegnar
kcolretnItliTtenforetemaidkcolretniotNOesoohC
rewoluoynehW.elgnatlithtiwkramnoitacol
kramnoitacoltenneercs-noehtelgnatliteht
tessiretemaidteneht,elpmaxeroF(.segralne
54sielgnatlitehtnehW.sretemRrof ° eht
).sretemR2sitenneercs-noehtforetemaid
.rehtohcaeneewtebsecnatsidrieht
htgneLteNot005siegnargnittesehT.htgneltensteS
.spetsretem001nisretem0003
htgneLeriW.tendnapihsnwoneewtebhtgneleriwsteS
001nisretem0001ot001siegnargnittesehT
.spetsretem
htdiWteN001ot0siegnargnittesehT.htdiwtensteS
.sretem
RROCTOLPTEN1reyaL
gnitoohstengnirudtenehtfotnemevomehT
2reyaL
3reyaL
.deepstnerrucretawfo%05
dnadeepstnerrucretawgnisuybdettolpsi
ehT.rosneslanretxemorfdefnoitcerid
shtpedeerhtrofatadtahtsdeefrosneslanretxe
tnereffideblliwtnemevomtensuht,)sreyal(
ecnereffidfoeergedenimreteD.reyalhcaeta
,snoitidnocaes,tengniredisnocsreyalgnoma
rof,tessi%05fI.cte,noitcurtsnoclessev
fodeepstasevomtenneercs-no,elpmaxe
5-10
Page 51

INIT SET/TEST Menu Description
The INIT SET/TEST menu can be display by pressing MENU
and ON together.
uneMmetInoitpircseD
JDAGNIDAEHtsujdAgnidaeHlluhnokramDAEHfoelgnanoitaivedsteS
51sinoitaivedfI.wobs'pihsmorftinu ° ot
51;)seerged("51"retne,trop ° ,draobratsot
".543"retne
ETARDUABA021-SCF/I
1troPxuA
2troPxuA
3troPxuA
AEMN
PKTXEytiraloPPKtxE
/TINU
EGAUGNAL
TSETFLESelgniS.ecnotsetflestinuyalpsidsmrofreP
htpeD.tuodaerhtpedfotinusesoohC
toohSroftsiDroftuodaernurecnatsidfotinusesoohC
erutarepmeT;tuodaererutarepmetretawfotinusesoohC
egaugnaL,hsilgnE;unemnidesuegaugnalsesoohC
suounitnoC.ylsuounitnoctsetflestinuyalpsidsmrofreP
lenaPdnatinuyalpsidehtfosyekehtskcehC
.stropfo)duab(deepsnoissimsnartatadteS
.A021-SCF/Irofspb0042otteS
gniyekrofcigolevitagenroevitisopesoohC
ytiraloPtuOPK
.noissimsnartezinorhcnysot
.tiehnerhafroedargitnec
.naeroKro,esenapaJ
,rednuosohceroranoslanretxemorfdefeslup
.issapro,smohtaf,teef,sretem;tengnitoohs
.noitareporeporprofxoblortnocetomer
(Continued on next page)
roloC.srolocfoyalpsidreporprofskcehC
yarG.tsetyarghtiwnoitrotsidneercsrofskcehC
OISehtneewtebtsetnoitacinummocstcudnoC
aseriuqeR.tinureviecsnartdnatinuyalpsid
.gulptset
5-11
Page 52

uneMmetInoitpircseD
TSETOHCEtseTyalpsiDsinrettaptsetA.tinuyalpsidehtskcehC
.deyalpsid
noitartsnomeD.esuerutufrofdevreseR
CERTENS/EelacSoiduAS/EfoedistfelrothgirnoelacshtpedsyalpsiD
tsujdAtfarDSEohcenohtpedeurtdaerottfards'pihssteS
tceleS2SE;trop2SEotdetcennoctnempiuqestceleS
egnaRceRteNrettimsnartredrocertenfoegnargnidnuossteS
.tinu
STLUAFEDstluafeD.sgnittestluafedserotseR
sllaceRmargorP.esuerutufrofdevreseR
SREHTOYEKTNEVEotsnoitcnufyekTNEVEehT:TNEVE
.yalpsidrednuosohce
.yalpsidrednuos
.redrocertenrorednuosohce
.kramtneveebircsni
ehtsasnoitcnufyekTNEVEehT:TOOHS
lortnocetomerehtnoyekTOOHS
.kramgnitoohstenyalpsidotxob
tamroFataD,FICgnomadetcelesebnactamrofatadtupnI
tliTotuA.worranroediw,detcelesebnactlitotuA
* : Under development
*.0.2.reVAEMNdna*5.1.reV3810AEMN
5-12
Page 53

FUNCTION KEYS
Similar to the quick dialing function on a telephone, the five
function keys (F1–F3) on the main panel record control and menu
settings and replay them back exactly as programmed. The items
you can program are gain, display mode, TX ON/OFF, USER
menu, SYSTEM menu, DAT A SET menus and data setting window. The function keys are useful for quickly setting up the sonar for a specific purpose such as seabed detection.
Programming the Function Keys
1. Tune the sonar as desired.
2. Press the MENU key.
3. Select the FUNCTION KEY menu and press the MENU key .
USER MENU
Figure 6-1 FUNCTION KEY menu
4. Press the MENU key again.
FUNCTION KEY
ExecuteRegister
6-1
Page 54

USER MENU
Customized settings are registered to FUNCTION keys.
Select key number with↑ ↓ key and press MENU key.
Press END key to return to sub menu.
Figure 6-2 REGISTER menu
5. Press the up or down arrow key in the sub panel 1 to select
the function key to program, then press the MENU key.
6. Press the END key several times to close the menu.
Replaying a Function Key
Press function key (F1–F3) desired.
FUNCTION KEY
1
REGISTER
Function Key Fine Tuning
The function key fine tuning keys ([+], [-]) let you fine tune the
items shown in the table on the next page when a function key is
active.
Note: Register function keys beforehand to use this function.
1. Press desired function key. The lamp above the function key
pressed lights.
2. Press the [-] or [+] key as appropriate; the [-] key to lower
the setting to de-emphasize echoes, and the [+] key to raise
the setting to emphasize echoes.
The lamp above the [-] key lights when the setting is -1 to -4,
and the lamp above the [+] key lights when the setting is 1-5.
6-2
Page 55

Fine
Adjustment
Item
TVG Near -3 -2 -1 0 0 1 1 2 3 4
TVG Mid -3 -2 -1 0 0 0 1 1 2 3
TVG Far -3 -2 -1 0 0 0 0 1 1 2
Tx Cycle 0 0 0 0 0 0 0 0 0 0
Tx Beamwidth -3 -2 -1 0 0 0 0 0 0 0
Tx Power -2 -1 0 0 0 0 0 0 0 0
-4 -3 -2 -1 0 1 2 3 4 5
Function Key Fine Tuning
Saving Function Key Settings to a Memory Card
1. Press the MENU key.
2. Select the CARD UTILITY menu.
CARD UTILITY Press END key to return to main menu.
List Execute
Save Execute
Delete Execute
Initialize Execute
Figure 6-2 CARD UTILITY menu
3. Select Save and press the MENU key.
Note: If the card has not been initialized, initialize the card by
selecting Initialize and then save.
Replaying Function Key Settings from a Memory Card
Press the CARD REPLAY key on sub panel 1.
Note: When function key settings are replayed from a memory
card, current settings on all function keys are erased. Therefore,
if necessary , save current function key settings to another memory
card before replaying.
6-3
Page 56

This page is intentionally left blank .
Page 57

ADVANCED LEVEL OPERATION
Finding Fish School Center
When you want to find the center depth of a fish school, use the
auto tilt function, which automatically scans the tilt angle within
the selected width. You can choose angle width from Narrow or
Wide on the INIT/SET TEST menu. (Narrow is available on the
81 kHz, 94 kHz and 107 kHz models.)
Wide width settings
)m(egnaR)1(htdiW)2(htdiW)3(htdiWdoireP
snoissimsnart6yreve
snoissimsnart4yreve
snoissimsnart2yreve
6± °
02± °
"
"
"
61± °
21± °
"
"
"
"
001,57
002,051
004,003
006,005
008
0001
0021nahterom
01± °
"
"
8± °
6± °
4± °
2± °
61± °
"
"
"
21± °
8± °
4± °
For example, when the RANGE control, TIL T lever and WIDTH
key are set to 800 m, 8° and width (1), respectively , the tilt angle
varies at every transmission as follows:
8°→8°→10°→10°→12°→12°→14°→14°→12°→12°→10°→10°→
8° →8°→ 6°→6°→4°→4°→2°→2°→4°→4°→6°→6°→8°→
8°
Tilt Angle
Figure 7-1 Tilt angle setting
How to find fish school center
1. On sub panel 1 or the remote control box, turn on the AUT O
TILT key. The lamp above the key lights on sub panel 1.
2. With the WIDTH key, select scanning width. Auto tilting
begins, with tilt angle set with TILT lever as a center tilt
angle. Successively changing tilt angle is displayed in parentheses at the upper right of the screen.
3. To change center tilt angle, operate the TILT lever.
7-1
Page 58

Tracking a Fish School (target lock)
T arget lock, which requires speed and heading inputs, automatically tracks an important fish school so that you wonít lose sight
of it on the display screen. Two types of target lock are available: Target Mark or Fish. One may be selected on the SYSTEM menu.
Tracking a fish school
1. Operate the trackball to place the trackball mark on fish school
you want to track.
2. Press the [TARGET LOCK] key to light the lamp above it.
The target lock mark (
tracking begins.
ABCD
Depth
.
) appears on the fish school and
60° 60°
Figure 7-2 Target lock mark and target lock data
Note 1: Range offset is applied to both shipís movement and
fish school movement on the screen. Tilt angle is not offset.
Note 2: When the target goes out of the tilt angle range the
lamp above the [T ARGET LOCK] key blinks, and then target
lock is cancelled.
3. T o cancel tar get lock, press the [T ARGET LOCK] key again.
7-2
Page 59

Target lock mark appearance
The size and thickness of the target lock mark indicates fish speed
and tracking status, as shown below.
Target lock
mark appearance
Fast
Medium
Slow
(More than 5
Tx cycles)
(Up to 3 Tx
cycles)
Mark size indicates
relative speed.
Mark thickness shows
tracking status.
Meaning
Figure 7-3 Target lock mark appearance
Erasing target lock mark
Target lock marks may be erased as follows:
1. Open the sub panel 2.
2. Select DELETE MK.
3. Press the [+] key for DELETE MARK FISH.
Choosing target lock mode
Two types of target lock are available: target mark and fish.
Target mark: Tracks the target lock mark, changing range and
tilt angle according to ship’ s movement. The fish school itself is
not tracked.
Fish tracking: Tracks fish schoolís horizontal movement, changing range and tilt to track movement.
Do the following to select target lock type:
1. Open the sub panel 1.
2. Press the [MENU] key while pressing the up arrow key in
sub panel 1 to display the SYSTEM menu.
3. Select TARGET LOCK, and then press the [MENU] key.
7-3
Page 60

4. Select Tracking Method, and then press the [MENU] key.
5. Select method desired.
6. Press the [END] key several times to close the menu.
Tracking target lock mark
1. Operate the trackball to place the trackball mark on the fish
school you want to track.
2. Press the [TARGET LOCK] key to light the lamp above it.
The target lock mark (
) appears on the fish school and
tracking begins.
Tilt angle is automatically changed to keep the target lock
mark location within the sonar beam.
3. To stop tracking, press the [TARGET LOCK] key again.
Note 1: If the target goes out of the picture or the tilt angle is
greater than 60 degrees the lamp above the [TARGET LOCK]
key flashes to call your attention.
Note 2: Target lock position and data are calculated according
to tilt angle.
Note 3: The bearing mark moves to the target lock mark location when target lock becomes active. Bearing to the target lock
mark is shown.
Note 4: T ar get lock is temporarily disabled when the distance to
the tracked fish school is less then 40 m. It is resumed once the
distance becomes more than 40 m.
Note 5: The target lock works up to a tilt angle of 60 degrees. In
the drawing below, the tilt angle is fixed at 60 degrees between
B and C. During this period, however, calculation is continuously being performed. When own ship comes to point C, target
lock is resumed.
ABCD
60° 60°
Depth
7-4
Figure 7-4 Target lock and tilt angle
Page 61

Setting target lock conditions
1. Open the sub panel 1.
2. Press the [MENU] key while pressing and holding down the
down arrow key in sub panel 1.
3. Select TARGET LOCK with the arrow keys.
4. Press the [MENU] key.
SYSTEM MENU
TARGET LOCK
Select item with ↑ ↓ ← → keys and press MENU key.
Press END key to close menu.
Tracking Method TGT Mark Fish
Track Echo Color
Fish Speed Limit 5kt
Fish Track Window
Fish Spd Update
Target LK Window
8
Setting range: 1 to 10
Setting range: 1 to 15
Setting range: 2 to 20
10m
15 sec 30 sec 45 sec 60 sec
Normal Large Largest
Auto
Figure 7-5 Target lock menu
5. Press the up or down arrow key to choose item; right or left
arrow key to set option.
Setting
Choose weakest echo to
track.
Set fish speed which
cancels target lock.
Set distance at which to
trace fish school track.
Choose update interval for
fish speed readout.
Choose size of target track
window (not shown).
6. Press the [END] key several times to close the menu.
7-5
Page 62

Description of target lock items
TrackingMethod
Sets target lock function: target lock mark, fish or automatic.
Track Echo Color
Sets minimum echo signal level to track. A fish school whose
signal level is above the level set here is tracked.
Fish Speed Limit
Sets fish speed at which target lock is cancelled.
Fish Track Window
Set distance at which to track fish schoolís track when it exits
the tracking window.
Fish Speed Update
Selects update interval of fish speed readout; 5,10, 20 or 30 sec-
onds.
Target Lock Window
Sets size of target lock window. The window itself is not show
on the display.
NORMAL: 32 x 32
LARGE: 64 x 64
LARGEST: 128 x 128
7-6
Page 63

Detecting Fish Schools Aurally
Sometimes you may be preoccupied with other tasks and unable
to concentrate on watching the sonar picture. In such cases it
would be a good choice to use the audio function. This function
enables you to monitor echoes from fish schools and seabed
through the built-in speaker.
After you’ve become accustomed to monitoring fish aurally , you
should be able to detect a fish school from a range longer than
you can detect it on the screen. In addition you may judge whether
the fish school is approaching or going away; the tone becomes
higher when the school is approaching and lowers when the
school is going away.
1. Operate the trackball to place the trackball mark to the direction you want to monitor through the speaker.
2. Press the R/B key. The bearing mark appears on the display .
Echoes in a 30°, 60°, 90°, 180° or 330° sector centering the
bearing mark are monitored through the speaker. You can
adjust speaker volume with the AUDIO control.
3. To change coverage area, open the data setting window (sub
panel 2) and change width of AUDIO SECTOR.
4. To scan the coverage area, open the data setting window,
turn on AUTO SCAN and set scanning WIDTH.
Note: You can display the signal monitored through the loudspeaker on the history display combination window by pressing
the HIST key, if AUDIO is selected on the HIST Window DSP
menu in the USER menu.
7-7
Page 64

The Fish Alarm
The fish alarm sounds an audible alarm when a fish echo above
a preset strength enters an alarm zone. You set parameters for
the fish alarm at ALM on the data setting window.
ON/OFF: Turn alarm on or off.
Level: Set echo strength level which will activate the alarm.
Zone: Set alarm zone.
1. Open the data setting window and select ALM•AUDIO.
2. Press the + key of the ZONE item.
3. Operate the trackball to place the trackball mark on the starting point of the alarm zone.
4. Press the + key.
5. Rotate trackball clockwise to select the end point. The display paints a fan-shaped alarm zone.
6. Press the + key.
Starting
point
End
point
Alarm
zone
Figure 7-6 How to set the fish alarm zone
Note: There must be at least three degrees difference between
the starting and end points to get a fan-shaped alarm zone as
shown in (a) and (b). Otherwise, the unit paints a 360 degree
alarm zone as in (c) and (d).
More than 3°
Within 3°
7-8
(a) (b) (c) (d)
Page 65

Relocating Fish School for Easy Observation
Own ship
mark
Place trackball
mark here,
for example.
Press the
OFF-CENT key.
Fish
school
Own ship mark
moves to trackball
mark position.
1. Operate the trackball to place the trackball mark on the position where you want to relocate the own ship mark.
2. Press the OFF-CENT key.
3. To move the own ship mark back to the screen center, press
the OFF-CENT key again.
Figure 7-7 How to relocate fish schools
7-9
Page 66

Comparing of Fish School Concentration
You can get an estimate of the volume of two fish schools by
using the two ESTIMATE keys.
1. Operate the trackball to place the trackball mark on a fish
school, and then press the ESTIMATE 1 key.
The estimate mark appears on the fish school. Relative volume is shown by a figure between 0 and 100, below the estimate mark. When inside the mark is filled with reddish
brown, volume figure is “100”.
2. Operate the trackball to place the trackball mark on another
fish school and press the ESTIMATE 2 key .
3. Compare estimate figures for each fish school.
4. To turn off the estimate marks press their respective keys.
Estimate
mark 2
Estimate
mark 2
data
Estimate
mark 1
Estimate
mark 1
data
Figure 7-8 Estimate marks and their data
7-10
Page 67

Measuring Fish School Speed
To ensure a good haul, it is important to estimate the direction
and speed of the fish school before shooting the net. You can do
this with the FISH key. If the tidal current data is used together
with fish speed data, you can determine the timing of the net
shooting more efficiently . This function requires speed and heading inputs.
1. Place the trackball mark on the center of a fish school, and
then press the FISH key . The latest fish mark (
the fish school.
2. Wait 1 to 2 minutes.
3. Place the trackball mark on the same fish school selected in
step 1 and press the FISH key. The latest fish mark (
pears on the target and the 2nd latest fish mark (
on the location selected at step 1. At the bottom left corner of
the screen, the distance between the two fish marks, and fish
school course and speed appear .
) appears on
) ap-
) appears
Latest fish
mark
4. If you want to delete fish marks and fish speed marks, open
data setting window , select DELETE MK and then press the
FISH key.
Latest
fish mark
Fish
movement
Figure 7-9 How to measure fish speed
Note 1: Movement is calculated using ship’ s speed and bearing
inputs. Accordingly , pitching and rolling may affect the calculation. For better results, try the procedure two or three times to
verify reliability.
Note 2: The time and distance between pressings of the FISH
key should be as long as possible to increase accuracy of measurement. For more accurate measurement repeat the procedure
two or three times.
7-11
Page 68

Note 3: Each time the FISH key is pressed the latest fish mark
and ship’s speed mark change in the sequence shown below:
Fish key pressed once:
↓
Fish key pressed twice:
→
The Event Mark
Fish key pressed three times:
Fish key pressed four times:
↓
X
↓
X
↓
→
↓
X
↓
→
The event mark is useful for finding the horizontal range, depth
and bearing to a location some distance from current position.
This function requires speed and heading inputs.
There are two types of event marks: event mark 1 and event
mark 2. 10 of each type of mark can be displayed. The unit marks
the latest one by (
) for event mark 1 and by ( ) for event mark
2. Older event marks are displayed by a cross plus event number
(event mark 1) or an inverted Y with event number (event mark
2). When you enter more than ten event marks, the unit erases
the oldest mark, one by one.
1 2
1
Latest
Figure 7-10 Event marks
3
2 3
7-12
Page 69

Entering an event mark
1. Set the trackball mark where you want to place an event mark
(latest event mark).
2. Press an EVENT key. The horizontal range, depth and bearing to the event mark appear at the bottom left corner of the
screen.
→234: Horizontal range (m) from own ship mark
↓19: Present depth (m) to mark
(35): Depth (m) of mark at moment EVENT key is pressed.
B265: Present bearing (degree)
Bottom left-hand corner of screen
(35)
Stored when
EVENT key is
pressed.
You observe picture from
direction of mark.
B
A
Figure 7-11 Event mark description
Plotting an event mark on the display is equivalent to dropping a
buoy with an anchoring chain that extends from surface to bottom. The buoy is fixed at its present geographical location, but
the marker on the display moves to a point where present beam
plane intersects the anchor chain of the buoy as the ship moves
or the tilt angle is changed. This can be said of other marks as
well such as fish mark and trackball mark.
Erasing an event mark
Open the data setting window (sub panel 2) and select DELETE
MK. Press appropriate EVENT key to erase mark.
7-13
Page 70

True Motion Display
The relative motion display places the own ship mark at the screen
center, and echoes from fish and the seabed move on the screen
relative to own ship’s movement. This means that even when
the ship is dead in water, fish echoes move on the display.
In the true motion display , however , stationary objects are fixed
and own ship and fish echoes move on the display in accordance
with their true courses and speeds. Thus you can observe own
ship and fish echo movement with respect to the seabed.
Open the data setting window and select SONR•BEAM. Set UP/
TM in the SONAR menu to TM. This function requires speed
and heading inputs.
Although the true motion mode is available for use in all modes,
use in the combination mode is not recommended since the own
ship mark may move into the combination picture area.
7-14
Figure 7-12 True motion display
Page 71

Plotting Net Location Mark
Before shooting net, you will decide the shoot timing considering the water current direction, distance to fish school and moving direction of the fish school. Use the net location mark as a
guide to decide the timing.
This function requires speed and heading inputs.
1. Place the trackball mark on fish school to be caught.
2. Press the NET COURSE key. The net location mark is depicted by dotted ring with a diameter equivalent to that of
your purse seine net, being centered on the trackball mark.
Trackball
mark
Net location
mark
Figure 7-13 Net location mark
3. T o adjust the location of net location mark, move the trackball
mark.
4. When the location is finalized, press the NET COURSE key
again. The dotted ring is replaced by solid ring and the lamp
above the NET COURSE key lights.
5. To erase the mark, press the NET COURSE key again.
You can adjust the diameter of the net location mark on NET
SHOOT PLAN in the DATA SET menu.
7-15
Page 72

Observing Net Behavior
With net sonde connection you can observe net behavior after
the throwing of the net, on the echo sounder combination mode.
Accurate depiction of net sonde position depends on proper setting of the distances between net sonde transmitters. You can set
those distances on NET SONDE XMTR in the DAT A SET menu.
This function requires speed and heading inputs.
1. Press the SHOOT key just upon throwing the net into the
water.
Then, the net shooting mark (
mark and also at the right edge of the echo sounder picture.
Afterwards, whenever a net sonde transmitter on the net is
thrown into water, a net sonde mark appears on own ship
mark and moves with ship movement. The depths of net
sonde transmitter units are digitally displayed at the lower
left of the screen after the receiving transducer is placed into
water. The net sonde marks appear also on the echo sounder
picture as below , where the length of vertical line shows the
depth of the net sonde transmitter unit.
2. To erase net sonde mark and associated data, press the
SHOOT key again.
) appears at the own ship
7-16
Figure 7-14 Net behavior
Page 73

Target Slice Display
Using automatic tilting, the target slice mode displays the echo
inside the estimate mark at several different tilt angles (depth).
To access the target slice display, press the TARGET SLICE
key. The table and illustration below describe the target slice
mode.
ni.oN
gniwarD
)1(
)2(
)3(
noitamrofnIyalpsiDsnoitacilppA
.krametamitseedisniseohcE.seohcehsiffoweivdednapxewohS
ohcefoyalpsidhpargraB
rofnoitubirtsidlevellangis
.krametamitseedisniseohce
takrametamitseedisniseohcE
.)htped(selgnatlittnereffid
hsifgnitamitseroflufesuebotdetcepxE
yamscitsiretcarahchpargrabecnisseiceps
.seicepshsifhtiwtnereffideb
lanoisnemid-eerhtasevignoitatneserpsihT
lacitrevegdujplehotloohcshsifafoweiv
.loohcshsifehtfonoitubirtsid
Figure 7-15 Target slice display
7-17
Page 74

This page is intentionally left blank .
Page 75

PORT/STARBOARD, HORIZONTAL SLICE
DISPLAYS
The port/starboard display or horizontal slice display may be
displayed by pressing the [HIST] key. The display shown depends on the setting of “HIST DSP/GRPH” in the USER menu.
Port/Starboard display
The port/starboard display takes echoes along the bearing (port,
starboard) selected on the SYSTEM menu and displays them on
the lower 1/3 of the screen. If the bearing width is set to 90
degrees, for example, the CSH-83/84 displays echoes in both
port and starboard directions. The picture is scrolled vertically
to downward.
↓
- - -
↓
Port/Starboard
Sampling Angle
↓
B
- - -
- - -
- - -
Display
Sector
Picture Advance
Direction
Port Direction
Port/starboard sampling angle can be set between 0 and
A
180 degrees. Setting sequence: SYSTEM menu, HIST
DISPLAY, PRT/STBD Sample.
B
Fixed at 6 degrees.
Figure 8-1 Port/starboard display
Starboard
Direction
8-1
Page 76

Horizontal slice display
120 degrees of the picture in the horizontal direction is shown
for a given depth (D) in the horizontal slice window at the bottom of the display . The area to display may be selected with the
[R/B] key.
↓
Range Mark
→
↓
Bearing Mark
Echo inside
this area is
shown in
window
Horizontal Slice Width
Cross Cursor
D
Own Ship Mark
Figure 8-2 Horizontal slice display
1. In the normal display, place the trackball mark on the echo
you want to see displayed in the horizontal display , then press
the [R/B] key.
The horizontal slice marker, 120° in width and centered on
the bearing mark, appears on the display . Echoes within the
marker appear in the window at the bottom of the display,
scrolling leftward.
Picture
Advance
Direction
→
120 30 123 D22
→
↓
↓
D
↓
: Range from own ship to cross cursor in stern
direction.
: Range from own ship to cross cursor in port-
starboard direction.
: Slant range from own ship to cross cursor.
: Depth to cross cursor.
↓
120˚ (Fixed)
Range Mark
Color Bar
Latest Picture
Own Ship
Stern Mark
8-2
2. Place the trackball mark in the horizontal slice window to
find data. The trackball mark changes to the cross cursor.
Range and depth to the cross cursor are shown.
Note 1: Picture advancement is synchronized with ship’ s speed.
The picture does not advance when the ship is dead in water or
there is no speed input.
Note 2: The width of the horizontal slice marker may be changed
on the SYSTEM menu with H-Slice Width.
Page 77

MEMORY CARD OPERATIONS
Initializing Memory Cards
Before you save information to a memory card it must be initialized (formatted).
1. Press the MENU key to display the USER menu.
2. Select the CARD UTILITY menu.
3. Select Initialize. It takes more than two minutes to initialize
a memory card.
4. Press the END key a few times to display the user menu.
The memory card stores 256k bytes of data. This is equivalent
to about two picture screens or about 20 pictures of echoes inside the estimate mark. The following data are automatically
saved as system data when the memory card is initialized: panel
setting, function key settings, and menu settings.
9-1
Page 78

Saving the Picture
You can save either the whole screen or the echo inside the estimate mark to the internal memory or a memory card.
evaSotataDdohteMgnivaSotgnivaS
,skram,erutcipelohW
atadciremunahpla
etamitseedisniohcE
kram
atadgnitoohsteNyekTOOHSyromemlanretnI
1. Press the MENU key to display the USER menu.
2. Select SAVE PICTURE.
3. Select item to save:
Whole: Saves whole picture to memory card.
Est MK: Saves echo inside the estimate mark to internal
memory . (About 20 pictures can be saved.)
QK Save: Saves whole screen to the internal memory. (One
picture can be saved.)
4. Press the END key to close the USER menu.
5. Press the MEMO key on the main panel.
dnayekOMEM
gnittesunem
dnayekOMEM
gnittesunem
dracyromeM
yromemlanretnI
It takes about two minutes to save a whole screen to a memory
card. During this time the normal picture is displayed but the
unit accepts no key input.
Transferring Echo Data from Internal Memory to Memory Card
1. Press the MENU key to display the USER menu.
2. Press arrow keys to select CARD ECHO DAT.
3. The display shows all inside-estimate mark pictures stored
in the internal memory. Using the arrow keys select picture
to save to memory card.
4. Press the MENU key. The lamp to the right of the memory
card drive lights while picture data is being saved.
5. Press the END key several times to return to the USER menu.
9-2
Page 79

Saving Net Shooting Data
How net shooting data is saved
The unit starts accumulating net shooting data when the SHOOT
key is pressed. When net shooting is concluded by pressing the
SHOOT key again, the echo inside the estimate mark and other
net shooting data are saved to the internal memory. Note however that if ship’s movement between pressings of the SHOOT
key is less than 1/3 of the net length the unit judges that net
shooting is suspended and does not save net shooting data.
Transferring net shooting data to memory card
1. Press the MENU key.
2. Press arrow keys to select CARD NET DATA and press the
MENU key.
3. If desired, according to on-screen instructions, select fish
species to be added to net shooting data as a comment, and
then press the MENU key.
4. If desired, enter fish quantity estimate by:
a) selecting number with up or down arrow key
b) selecting place with right or left arrow key
c) registering value by pressing the MENU key.
Net shooting data contents
Net shooting data is comprised of the following:
• Echoes inside estimate mark (the ones which are displayed
the first time the SHOOT key is pressed)
• Ship’s position, date, time
• Ship’s track, net movement, current direction, water depth
and/or water temperature
• Net sonde mark
9-3
Page 80

Replaying Saved Data
Whole picture or echo inside estimate mark
1. Press the RECALL key (on the main panel).
2. Press the right or left arrow key in sub panel 1 to select item
to replay . The left arrow key selects older data (for example,
data in memory card); the right arrow key newer (for example, data in internal memory).
3. After viewing picture, press the RECALL key to escape.
Note that the priority order for replay of echo inside estimate
mark is internal memory-saved picture followed by memory card
contents.
Net shooting data
1. Press the NET REPLAY key (on sub panel 1).
2. At the screen bottom, comments are listed. Select the item to
replay .
3. After viewing the data, press the NET REPLA Y key again to
escape.
Deleting Memory Card Contents
You can delete unnecessary data from a memory card.
1. Press the MENU key to display the USER menu.
2. Select the CARD UTILITY menu and press the MENU key .
3. Select the DELETE and press the MENU key . The card contents are listed at the screen bottom.
4. Select data to delete.
5. Press the MENU key.
6. Press the END key a few times to close the menu.
9-4
Page 81

TURNING MARKS, DATA ON/OFF
You can turn marks and data on or off through the data setting
window or the USER menu.
Turning marks on/off through the data setting
window
Select DELETE MK to delete the following marks:
Event Mark 1
Event Mark 2
Fish Mark
Each press of + or – deletes
mark selected, one by one.
Own Ship Mark
Ship's Track
Each press of + or – deletes
1/5 of overall length of track.
Turning marks on/off through the user menu
The following marks can be turned on/off through the USER
menu:
User Menu
DATA DISPLAY
MARK DSP1
Display Item
Event Mark 1
Event Mark 2
Fish Mark
On Track Data
Text Window
ES Window
Range/Bearing
MARK DSP 2
CURRENT VEC
Heading Mark
Range Rings
Bearing Scale
Auto Scan Width
Ship's Track
Net Movement Plot
Fish MK Connect
Fish Tracking MK
Fish Track Plot
w/Current Vec
w/Current Vec
w/Current Vec
Current Flow Dir
10-1
Page 82

10-2
Page 83

INTERPRETING THE DISPLAY
Seabed Echoes
When the tilt angle is widened, the seabed echo illustrated below will appear on the display. When the tilt is narrowed, the
seabed trace becomes wider and weaker. By observing the seabed condition on the display, the skipper can prevent net damage.
(A) Flat seabed
Tilt angle: 10° to 15°
Narrow tilt angle
Only half of
vertical beam width
captures the seabed.
(B) Flat seabed
Tilt angle: 20° or more
(C) Sloping seabed
Tilt angle: 20° or more
Seabed is displayed
narrower and in
stronger colors when
compared to (A).
Shallow bottom
is displayed in
a strong color
and with a
short tail.
Figure 11-1 Seabed echoes
Seabed
The deeper seabed
echo is displayed in
a weak color and
with a long tail.
11-1
Page 84

Fish Schools
(A) Sea surface fish
Tilt angle: -5° to 10°
A fish school appears as a mass of echoes on the screen. The
color of the mass shows the density of fish schools on the sonar
beam. To find distribution and center point of a fish school, try
several different tilt angles.
Seabed echo not
Fish
school
Sea surface
reflections
displayed because
of narrow tilt angle.
Sea surface
reflections are
present.
(B) Midwater, bottom fish
Fish echo which appears before seabed can be detected.
Tilt angle: -0° to 20°
Fish echo which appears together with
or after seabed can be detected.
Tilt angle: 30° or more
school
Seabed
Fish
school
Large midwater
fish school is
present.
Fish
Seabed
11-2
When the tilt angle is shallow,
the reflection echo from seabed
is weak and the fish echo
which appears from bottom
is easy to find.
Figure 11-2 Fish schools
Page 85

Sea Surface Reflections
T o reduce sea surface reflections, set the tilt angle to 5° or higher,
so the upper edge of the sonar beam does not hit the sea surface,
or adjust TVG. When a narrow tilt angle is used, sea surface
reflections cover a large area as illustrated below.
W ake
Sea surface
15°
Sea surface
15°
Tilt angle
indication
Sea surface
reflections
Figure 11-3 Sea surface reflections
A wake produced by own ship or another ship can be a strong
reflecting object when a narrow tilt angle is used. As the wake
appears as a thick continuous line, it can be easily distinguished
from a fish school. A wake contains many air bubbles which
attenuate ultrasonic energy, making it difficult to sound beyond
the wake.
Own
ship
Other
ship
Own ship's
screw noise
Wake produced
by other ship
Own ship's
screw noise
Figure 11-4 Wake appearance on the display
Own ship's wake
(produced when
own ship turned)
11-3
Page 86

False Echo by Sidelobe
An ultrasonic wave is emitted only in the direction set by the
TILT lever, however there are some emissions outside the main
beam. These are called sidelobes. The energy of the sidelobe is
fairly weak but when the water is comparatively shallow and the
bottom is rocky and hard, strong signals are detected by the
sidelobe. These are represented on the display as a false echo as
shown below.
Mainlobe
Sidelobe
Mainlobe
echo
Sidelobe
echo
The seabed echo
detected by sidelobe
appears at a certain
tilt angle when the
sidelobe points
vertically.
Figure 11-5 Sidelobe echoes
Noise and Interference
Interference from a sonar on another ship appears on the screen
as shown in (A) below. This interference can be suppressed by
changing the CYCLE setting in TVG•TX on the data setting
window. Interference from electrical equipment on board own
ship appears as shown in (B) below. Noise from marine life appears on the display as shown in (C). Electrical interference and
marine life noise can be suppressed with IR on the SIGNAL
menu in the data setting window.
11-4
(A) Interference from
other sonar
(B) Electrical
interference
Figure 11-6 Noise and interference
(C) Marine life noise
Page 87

WARNINGS
Overvoltage W arning
If the input voltage to this unit rises above 125 VAC, the overvoltage detection circuit activates, an alarm sounds and the message OVERVOLTAGE appears at the screen center.
If this occurs, retract the transducer , turn the power off and check
the ship’s mains voltage. It should be about 100 VAC.
Unretracted Transducer Warning
If the transducer is not completely retracted within 30 seconds
after pressing c, an alarm sounds and the message XDCR NOT
RETRACTED! appears at the screen center.
If this occurs, do the following:
1. The power cannot be turned off because the transducer cannot be retracted. Turn off the main breaker for the display
and power supply units to stop operation.
2. Confirm that the net is not tangled in the transducer.
3. Confirm that the breaker inside the raise/lower control box
(mounted on the hull unit) is on.
4. Remove the cover of the raise/lower control box. Push the
(Red) reset button to reset the raise/lower control box.
5. T urn on the power and press c to retract the transducer into
the tank. If it does not retract, the main shaft of the hull unit
may be bent. Turn off the power and manually raise the transducer up to the highest position by using the hand crank.
(See the illustration on the next page.)
12-1
Page 88

TEST/NORMAL
switch
Breaker
Reset Switch
h
h
12-2
Photo No. 1479
RAISE/LOWER CONTROL BOX
Figure 12-1 How to manually raise the transducer
Photo No. 1744
HULL UNIT
Page 89

SELF TESTS
The CSH-83/84 has various self tests to check it for proper operation. If a test reveals equipment malfunction do not attempt
to check inside the equipment. There are no user serviceable
parts inside the equipment.
WARNING
Do not open the cover.
There are no user-serviceable
parts inside. Refer any repair
work to a qualified technician.
Opening the Self Test Menu
1. Turn on the power while pressing and holding down the
MENU key.
2. Press arrow keys to select SELF TEST.
INIT/SET MENU SELF TEST
Select item with dc keys and press MENU key.
Single
Continuous
Panel
Color
Gray
SIO
Execute
Execute
Execute
Execute
Execute
Execute
Figure 13-1 SELF test menu
3. Press up or down arrow key to select test desired.
4. Press the MENU key to start test.
13-1
Page 90

Self Test Description
Single test
The ROM, RAM and other devices of the display
unit are checked once. Control is returned to the
SELF TEST menu when the test is completed.
START UP TEST
DCON
105-0574-1xx
ROM = OK
RAM = OK
DPRAM = OK
P.W = OK
DRAW
105-0575-2xx
ROM = OK
RAM = OK
DUAL
105-0381-2xx
ROM = OK
RAM = OK
ES
105-0382-1xx
ROM = OK
RAM = OK
SLICE
105-0353-1xx
ROM = OK
RAM = OK
PSIO
105-0352-1xx
ROM = OK
RAM = OK
PIF
105-0415-1xx
ROM = OK
RAM = OK
RX1
105-0226-001 ROM = OK RAM = OK
1X1
RX2
1X2
105-0351-1xx
105-0576-1xx
105-0381-1xx
ROM = OK RAM = OK
ROM = OK RAM = OK
ROM = OK RAM = OK
Note: Above program numbers are for
CSH-83.
Figure 13-2 Single test
Continuous test
The devices of the display unit are checked continuously.
CONTI TEST
DCON
DRAW
DUAL
ES
SLICE
PSIO
PIF
ROM
RAM
DROM
DPRAM
P.W
EEPROM
REACT
ROM
RAM
VRAM
DPRAM
CLT
ROM
RAM
DPRAM
ROM
RAM
DPRAM
ROM
RAM
DPRAM
ROM
RAM
ROM
RAM
MEMCARD
= OK
= OK
= OK
= OK
= OK
= OK
= OK
= OK
= OK
= OK
= OK
= OK
= OK
= OK
= OK
= OK
= OK
= OK
= OK
= OK
= OK
= OK
= OK
= OK
= OK
= OK
Figure 13-3 Continuous test
13-2
Page 91

Panel test
This test checks the keys of the main and sub panels and the remote control box. Press and release
each key . Its on-screen location should display “1”
when the key is pressed and “0” when released. To
escape from the test reset the power.
Color test
PANEL TEST
=
X
=
Y
Figure 13-4 Panel test
This test checks for proper display color . T o escape
from the test reset the power.
COLOR TEST
Figure 13-5 Color test
13-3
Page 92

Gray test
GRAY TEST
This test checks for screen distortion. T o escape from
the test reset the power.
Figure 13-6 Gray test
SIO test
This test checks for proper communication between
the display unit and transmitter unit, and requires a
jumper plug. T o escape from the test reset the power .
SIO TEST
DRAW
SIO
= OK
IF
SIO
= OK
PISO
SIO1
= OK
SIO2
= OK
PIF
SIO1
= OK
Figure 13-7 SIO test
13-4
Page 93

Interface Unit CS-120A Self Test
1. Open the cover of the interface unit.
2. Find DIP switch DP-1 on the lone circuit board. T urn switch
#6 on to start the self test. The results of the check appear on
the digital display beside the DIP switch.
3. Turn the DIP switch off after completion of the test.
Turn #6 on.
678
If the readout shows "0" the unit
is functioning properly. If it is
not working properly any of the
following nine numerals or six
alphabets appear.
, , , , , , , , , ,
, , , , ,
.
678
Digital
display
Figure 13-8 Interface unit CS-120A, cover opened
13-5
Page 94

13-6
Page 95

INPUT DATA SELECTION
Selection of Data at Interface Unit CS-120A
Nav data and fish data input from external equipment can be
turned on or off at DIP switch DP-1 in the Interface Unit CS120A.
Ship's speed and bearing (for track plotting, true motion, target lock, etc.)
ON
Standard
setting
ON
12345678
1234
S1
S2
S3
S4
S5
Input Device S1 S2
Gyrocompass, Speed log OFF OFF
GPS or DR (Note 1) ON OFF
Current Indicator OFF ON
DR or Current Indicator (Note 2) ON ON
Select navigation which feeds
nav data for drawing ship's track
by switch S1 and S2.
Note 1: GPS has priority. Switched automatically from GPS to DR when
GPS data is absent for more than 61 seconds or ship's speed measured with
GPS is 0.2 kts or less. If DR is not available when switched from GPS to
DR, heading readout is fixed at 0 degrees and ship's track is plotted by using
the last GPS data obtained before switching to DR. If you still require speed,
heading data from GPS even though ship's speed is less than 0.2 kts, set the
GPS format to DR. Note however that the heading direction becomes erratic
if the ship's speed is less than 0.2 kts.
Note 2: Use this setting when both DR and current indicator are available.
Normally DR data has highest priority, and is switched to current indicator
data if the DR data is absent for more than 61 seconds. The heading data for
the bearing scale is always provided from the current indicator. When DR
data is taken from GPS be sure to set GPS output format to "DR." GPS with
no "DR" output format cannot be used.
Ship's Position
Input Device S3 S4
Loran C OFF OFF
GPS or DR (See Note.) ON OFF
Depth (echo sounder, color video sounder, etc.)
Input Device S5
Echo Sounder (Note 1) OFF
GPS or DR (Note 2) ON
Note 1: For white line pulse when the
depth data is taken from an echo
sounder which does not have digital
depth output.
Note 2: When the depth data is taken
from an echo sounder which has digital
echo output (FE-822, FCV, ED-202,
IF-3000, or IF-5000).
Figure 14-1 DIP switch settings in the interface unit
Use this position for GPS or DR.
GPS data has priority.
14-1
Page 96

Setting Distances Between Net Sonde Transmitters
T o accurately display the net shooting mark and net sonde mark
position, the distance between transmitters must be correctly set.
This is done on the DATA SET menu.
R0: Length of net from
its end to transmitter1
in meters.
R1: Length of net between
transmitters 1 and 2
R1
R2
R0
in meters.
R2: Length of net between
transmitters 2 and 3
in meters.
Figure 14-2 How to measure distances between transmitters
How to set net sonde transmitter distances
1. Press the MENU key while pressing and holding down
The DATA SET menu appears.
DATA SET MENU NET SONDE NET SONDE XMTR
Select item with dc[ \ keys and press MENU key.
Press END key to close menu.
Qty
Distance 0
:
3
:
0m
1
:
0m
2
:
0m
9
:
0m
t Setting range: 0 to 10 s
t Setting range: 0m to 9990m s
d
.
14-2
10
:
0m
Figure 14-3 DATA SET menu
2. Select NET SONDE and then “Net Sonde XMTR”.
3. Enter number of net sonde transmitters and distances between
them.
Page 97

MAINTENANCE
Display Unit Maintenance
WARNING
Do not open the cover.
There are no user-serviceable
parts inside. Refer any repair
work to a qualified technician.
Handle the equipment with care.
Clean the screen and filter
regularly. Cover the equipment
when it is not in use.
An anti-static spray may be used
to clean the screen. Do not use
chemical-based cleaners; they can
remove paint and markings.
Keep magnets and cassette tapes
away from the display unit.
Damage can cause corrosion.
Keep heater away from the
equipment.
Heat can damage the
DISPLAY UNIT
equipment. Allow sufficient
ventilation.
Figure 15-1 Display unit maintenance
Magnets or magnetic material can
can distort the picture.
15-1
Page 98

Hull Unit Maintenance
CAUTION
The zinc block near the transducer
must be replaced yearly.
The junction between the transducer
and main shaft may corrode, which
can result in loss of the transducer or
water leakage inside the ship.
HULL UNIT
Apply MOLYTONE grease
#2 every six months.
Raise transducer and coat main
shaft with DAPHAECOROAEX #2
every six months.
Dry dock ship and clean
transducer face yearly.
Apply single coat of
"MARINE STAR 20 Mod
(Red-N)" anti-foulant to
transducer face to keep
marine life off the transducer.
Figure 15-2 Hull unit maintenance
15-2
Page 99

MENU TREE
USER Menu
USER MENU
CARD UTILITY
CARD ECHO DAT
CARD NET DATA
FUNCTION KEY
DATA DISPLAY
MARK DSP 1
List
Save
Delete
Initialize
Save
Save
Register
Event Mark 1
Event Mark 2
Fish Mark
On Track Data
Text Window
ES Window
Range/Bearing
Heading Mark
Execute
Execute
Execute
Execute
Execute
Execute
Execute
ON OFF
ON OFF
ON OFF
Depth Temp OFF
ON OFF
Current Sonde
ON OFF
ON OFF
MARK DSP 2
HIST DSP/GRPH
CURRENT VEC
Range Rings
Bearing Scale
Auto Scan Width
Ship's Track
Net Movement Plot
Fish MK Connect
Fish Tracking MK
Fish Track Plot
Hist Window Dsp
Fish Histogram
w/Current Vec
w/Current Vec
w/Current Vec
Current Flow Dir
ON OFF
ON OFF
ON OFF
ON OFF
ON OFF
ON OFF
ON OFF
ON OFF
Audio PRT/STBD H-Slice
ON OFF
ON OFF
ON OFF
ON OFF
From To
SAVE PICTURE
Save Method
Whole Est MK QK Save
A-1
Page 100

DATA SET Menu
Setting range: 200-1000 m
ON OFF
Setting range: 0-3000 m
Setting range: 0-1000 m
Execute
Execute
Execute
Execute
Execute
Execute
Execute
CHANGE COLOR
DATA SET MENU
Sonar 1
Sonar 2
Echo Sounder
Marks
Menu
Execute
Execute
NET SHOOT PLAN
Net Diameter
Tilt Interlock
COLOR CURVE
Sonar 1
Sonar 2
Echo Sounder 1
Echo Sounder 2
Net Width
Execute (Qty plus distances)
Setting range: 0-200 m
NET SONDE
Net Sonde XMTR
Net Length
Wire Length
NET PLOT CORR
Layer 1
Layer 2
Layer 3
Setting range: 0%-100%
A-2
 Loading...