

Page 1

MARINE RADAR
MODEL1722/1732/1742/1752/1762
MODEL1722C/1732C/1742C/1752C/1762C
Page 2

C
All rights reserved.
PUB. No. OME- 34940
( HIMAD
FIRST EDITION : APR. 2001
9-52, Ashihara- cho,
Nishinomiya, Japan
Telephone: 0798-65-2111
Telefax: 0798-65-4200
Printed in Japan
Your Local Agent/Dealer
E1 : MAY 17, 2002
MODEL 1722/C SERIES
Page 3
SAFETY INSTRUCTIONS
WARNING
ELECTRICAL SHOCK HAZARD
Do not open the equipment.
Only qualified personnel
should work inside the
equipment.
Do not disassemble or modify the
equipment.
Fire, electrical shock or serious injury can
result.
Immediately turn off the power at the
switchboard if the equipment is emitting
smoke or fire.
Continued use of the equipment can cause
fire or electrical shock. Contact a FURUNO
agent for service.
Keep heater away from equipment.
WARNING
Radio Frequency
Radiation Hazard
The radar antenna emits electromagnetic
radio frequency (RF) energy which can be
harmful, particularly to your eyes. Never
look directly into the antenna aperture from
a close distance while the radar is in
operation or expose yourself to the transmitting antenna at a close distance.
Distances at which RF radiation levels of
100 and 10 W/m
table below.
Note: If the antenna unit is installed at a
close distance in front of the wheel house,
your administration may require halt of
transmission within a certain sector of
antenna revolution. This is possible - Ask
your FURUNO representative or dealer to
provide this feature.
2
exist are given in the
A heater can melt the equipment's power
cord, which can cause fire or electrical
shock.
Use the proper fuse.
Fuse rating is shown on the equipment.
Use of a wrong fuse can result in damage
to the equipment.
CAUTION
A warning label is attached to the equipment. Do not remove the label. If the
label is missing or damaged, contact
a FURUNO agent or dealer about
replacement.
WARNING
To avoid electrical shock, do not
remove cover. No user-serviceable
parts inside.
Name: Warning Label (1)
Type: 86-003-1011-0
Code No.: 100-236-230
MODEL
1722
1732
1742
1752
1762
Distance to
100 W/m
point
Nil
Nil
Nil
0.15 m
0.20 m
Distance to
2
Worst case
0.50 m
Worst case
0.50 m
Worst case
1.00 m
Worst case
3.00 m
10 W/m
Worst case
2.00 m
2
point
CAUTION
No one navigation device should ever be
solely replied upon for the navigation of
a vessel.
Always confirm position against all available
aids to navigation, for safety of vessel and
crew.
i
Page 4

TABLE OF CONTENTS
FOREWORD ...................................................................................................... viii
SYSTEM CONFIGURATIONS .............................................................................. x
1. OPERATIONAL OVERVIEW .........................................................................1-1
1.1 Operating Controls ...................................................................................................... 1-2
1.1.1 Display unit controls ......................................................................................... 1-2
1.1.2 Remote controller............................................................................................. 1-5
1.2 Inserting a Chart Card ................................................................................................. 1-6
1.3 Turn ing the Unit On/ Off................................................................................................ 1-7
1.4 Cursor Pad, Cursor...................................................................................................... 1-8
1.5 Display Brilliance, Panel Brilliance, Contrast, Hue....................................................... 1-9
1.5.1 Display brilliance, panel brilliance..................................................................... 1-9
1.5.2 Contrast...........................................................................................................1-10
1.5.3 Hue (MODEL1722C series).............................................................................1-10
1.6 Selecting a Display.....................................................................................................1-11
1.6.1 Display modes.................................................................................................1-11
1.6.2 Selecting a display ..........................................................................................1-12
1.6.3 Switching control in combination and overlay screens.....................................1-13
1.6.4 Selecting radar source.....................................................................................1-14
1.7 Data Boxes.................................................................................................................1-15
1.7.1 Showing, hiding data boxes with soft key........................................................1-15
1.7.2 Rearranging data boxes..................................................................................1-15
1.7.3 Temporarily erasing a data box........................................................................1-15
1.8 Function Keys.............................................................................................................1-16
1.8.1 Executing a function........................................................................................1-16
1.9 Simulation Display......................................................................................................1-17
2. RADAR OPERATION.....................................................................................2-1
2.1 Radar Display.............................................................................................................. 2-1
2.2 Transmi tti ng, Stand-by................................................................................................. 2-2
2.3 Tun ing ......................................................................................................................... 2-2
2.4 Adjusting the Gain....................................................................................................... 2-2
2.5 Reducing Sea Clutter .................................................................................................. 2-4
2.5.1 How the A/C SEA works................................................................................... 2-4
2.5.2 Adjusting A/C SEA ........................................................................................... 2-4
2.6 Reducing Precipitation Clutter..................................................................................... 2-5
2.6.1 Adjusting the A/C RAIN.................................................................................... 2-5
2.6.2 Adjusting the FTC............................................................................................. 2-6
2.7 Range Scale................................................................................................................ 2-7
2.8 Pulselength.................................................................................................................. 2-8
ii
Page 5

2.9 Presentation Mode.......................................................................................................2-9
2.9.1 Selecting a presentation mode..........................................................................2-9
2.9.2 Description of presentation modes..................................................................2-10
2.10 Measuring the Range...............................................................................................2-12
2.10.1 Measuring range by range rings....................................................................2-12
2.10.2 Meas u ring range by cursor...........................................................................2-13
2.10.3 Mea su ring range by VRM.............................................................................2-14
2.10.4 Erasing a VRM, VRM indication....................................................................2-15
2.10.5 Erasing EBL/VRM data boxes.......................................................................2-15
2.10.6 Hiding EBL/VRM data boxes.........................................................................2-15
2.10.7 Moving EBL/VRM data boxes.......................................................................2-15
2.11 Measuring the Bearing.............................................................................................2-15
2.11.1 Measuring bearing by cursor ......................................................................... 2-15
2.11.2 Measuring bearing by EBL............................................................................2-15
2.11.3 Erasing an EBL, EBL indication.....................................................................2-16
2.11.4 Erasing EBL/VRM data boxes.......................................................................2-16
2.11.5 Hiding EBL/VRM data boxes......................................................................... 2-16
2.11.6 Moving EBL/VRM data boxes........................................................................2-16
2.12 Erasing the Heading Line, North Marker ..................................................................2-17
2.13 Reducing Noise........................................................................................................2-17
2.14 Reducing Radar Interference...................................................................................2-18
2.15 Zoom.......................................................................................................................2-19
2.15.1 Zooming in on radar targets..........................................................................2-19
2.15.2 Zooming ARP, TTM targets...........................................................................2-19
2.16 Shifting the Picture...................................................................................................2-20
2.16.1 Manual shift..................................................................................................2-20
2.16.2 Automatic shift..............................................................................................2-21
2.17 Using the O ffset EBL................................................................................................2-22
2.17.1 Predicting a collision course..........................................................................2-22
2.17.2 Measuring range & bearing between two targets..........................................2-23
2.18 Echo Trails...............................................................................................................2-24
2.18.1 Trail time.......................................................................................................2-24
2.18.2 Starting echo trails........................................................................................2-25
2.18.3 Trail brilliance (MODEL1722 series)..............................................................2-25
2.18.4 Trail gradation (MODEL1722C series)..........................................................2-25
2.18.5 Trai l color (MODEL1722C series).................................................................2-26
2.19 Echo Stretch............................................................................................................2-27
2.20 Echo Averaging........................................................................................................2-28
2.21 Outputting TLL Data.................................................................................................2-29
2.22 Guard Ala rm.............................................................................................................2-30
2.22.1 Setting a guard alarm zone...........................................................................2-30
2.22.2 When the alarm is violated…........................................................................2-31
2.22.3 Canceling the guard alarm............................................................................2-31
2.23 Watchma n................................................................................................................2-32
2.23.1 How watchman works...................................................................................2-32
2.23.2 Turning on/off watchman............................................................................... 2-32
2.23.3 Setting watchman stand-by interval ..............................................................2-32
2.24 Waypoi nt Marker......................................................................................................2-33
iii
Page 6

2.25 ARP (optio n ), TTM operation....................................................................................2-34
2.25.1 Activating/deactivating ARP, TTM..................................................................2-35
2.25.2 Acquiring and tracking targets (ARP only).....................................................2-36
2.25.3 Displaying target number (internal, external ARP).........................................2-37
2.25.4 Terminating tracking of ARP targets..............................................................2-38
2.25.5 Setting vector attributes (ARP) ......................................................................2-39
2.25.6 Displaying past position display (ARP)..........................................................2-40
2.25.7 ARP, TTM target data....................................................................................2-41
2.25.8 CPA/TCPA alarm (ARP) ................................................................................2-42
2.25.9 Lost target alarm (ARP).................................................................................2-43
2.26 Interpreting the Radar Display..................................................................................2-44
2.26.1 General .........................................................................................................2-44
2.26.2 False echoes.................................................................................................2-46
2.26.3 SART (Search and Rescue Transponder) .....................................................2-48
2.26.4 Racon (Radar Beacon)..................................................................................2-50
3. PLOTTER OPERATION.................................................................................3-1
3.1 Plotter Displays............................................................................................................3-1
3.1.1 Full-screen plotter display................................................................................. 3-1
3.1.2 Compass display.............................................................................................. 3-3
3.1.3 Highway display............................................................................................... 3-5
3.1.4 Nav data display............................................................................................... 3-6
3.2 Presentation Mode...................................................................................................... 3-7
3.2.1 North-up........................................................................................................... 3-7
3.2.2 Course-up ........................................................................................................ 3-8
3.2.3 Auto course-up................................................................................................. 3-8
3.3 Shifting the Display...................................................................................................... 3-9
3.4 Chart Scale.................................................................................................................. 3-9
3.5 Chart Cards................................................................................................................3-10
3.5.1 Chart card overview.........................................................................................3-10
3.5.2 Indices and chart enlargement ........................................................................3-11
3.5.3 FURUNO and NavCharts™.............................................................................3-12
3.5.4 C-MAP cards...................................................................................................3-14
3.6 Workin g with T ra c k.....................................................................................................3-18
3.6.1 Displaying track...............................................................................................3-18
3.6.2 Stopping, restating plotting of own ship track...................................................3-19
3.6.3 Changing track color (MODEL1722C series)...................................................3-20
3.6.4 Track plotting method and interval for own ship track......................................3-21
3.6.5 Changing own ship track/mark distribution setting...........................................3-22
3.6.6 Erasing track...................................................................................................3-23
3.7 Marks, Lines...............................................................................................................3-25
3.7.1 Entering a mark...............................................................................................3-25
3.7.2 Changing mark attributes ................................................................................3-25
3.7.3 Selecting line type ...........................................................................................3-26
3.7.4 Erasing marks, lines........................................................................................3-27
3.8 Waypoin ts...................................................................................................................3-29
3.8.1 Entering waypoints..........................................................................................3-29
3.8.2 Editing waypoint data ......................................................................................3-32
iv
Page 7

3.8.3 Erasing waypoints........................................................................................... 3-34
3.8.4 Changing waypoint mark size (FURUNO, NavCharts™).................................3-35
3.8.5 Searching waypoints.......................................................................................3-36
3.9 Routes.......................................................................................................................3-37
3.9.1 Creating routes...............................................................................................3-37
3.9.2 Connecting routes...........................................................................................3-41
3.9.3 Inserting waypoints.........................................................................................3-42
3.9.4 Removing waypoints from a route...................................................................3-44
3.9.5 Erasing routes.................................................................................................3-44
3.10 Navigation ................................................................................................................ 3-45
3.10.1 Navigating to a "quick point" .........................................................................3-45
3.10.2 Navigating to waypoints................................................................................3-46
3.10.3 Navigating to ports, port services (NavCharts™ only)...................................3-47
3.10.4 Following a route...........................................................................................3-49
3.11 Alarms ....................................................................................................................3-53
3.11.1 Audio alarm on/off.........................................................................................3-53
3.11.2 Arrival alarm..................................................................................................3-54
3.11.3 Anchor watch alarm ......................................................................................3-55
3.11.4 XTE (Cross Track Error) alarm......................................................................3-56
3.11.5 Speed alarm..................................................................................................3-56
3.11.6 Proximity alarm.............................................................................................3-57
3.11.7 Trip alarm...................................................................................................... 3-58
3.11.8 Alarm information.......................................................................................... 3-59
3.12 Resetting Trip Distance............................................................................................3-60
3.13 Entering the MOB Mark, Setting MOB as Destination ..............................................3-61
4. VIDEO SOUNDER OPERATION...................................................................4-1
4.1 Principle of Operation...................................................................................................4-1
4.2 Sounder Displays.........................................................................................................4-2
4.2.1 Selecting a sounder display..............................................................................4-2
4.2.2 Description of sounder displays........................................................................4-3
4.2.3 Selecting screen split method in combination displays......................................4-7
4.3 Automatic Sounder Operation......................................................................................4-8
4.3.1 How the automatic sounder works....................................................................4-8
4.3.2 Types of automatic sounder modes..................................................................4-8
4.3.3 How to enable automatic sounder operation.....................................................4-8
4.4 Manual Sounder Operation..........................................................................................4-9
4.4.1 Selecting the manual mode...............................................................................4-9
4.4.2 Selecting display range.....................................................................................4-9
4.4.3 Adjusting the gain.............................................................................................4-9
4.4.4 Range shifting.................................................................................................4-10
4.5 Measuring Depth, Time.............................................................................................. 4-11
4.6 Reducing Interference................................................................................................ 4-12
4.7 Reducing Low Level Noise.........................................................................................4-13
4.8 Erasing Weak Echoes ..............................................................................................4-14
4.9 White Marker (MODEL1722C series).........................................................................4-15
v
Page 8

4.10 Picture Advance Speed............................................................................................4-16
4.10.1 Advancement independent of ship’s speed....................................................4-16
4.10.2 Advancement synchronized with ship’s speed...............................................4-17
4.11 Display Colors (MODEL1722C series)......................................................................4-18
4.12 Alarms......................................................................................................................4-19
4.12.1 Audio alarm on/off .........................................................................................4-19
4.12.2 Bottom alarm.................................................................................................4-20
4.12.3 Fish alarm .....................................................................................................4-20
4.12.4 Fish alarm (B/L).............................................................................................4-21
4.12.5 Wate r temperatu re alarm...............................................................................4-22
4.12.6 When an alarm setting is violated..................................................................4-23
4.13 Water Temperature Graph........................................................................................4-24
4.14 Interpreting the Sounder Display...............................................................................4-25
4.14.1 Zero line........................................................................................................4-25
4.14.2 Bottom echo..................................................................................................4-25
4.14.3 Fish school echoes........................................................................................4-26
4.14.4 Surface noise/Aeration..................................................................................4-26
5. CUSTOMIZING YOUR UNIT..........................................................................5-1
5.1 Generic Setup ............................................................................................................. 5-1
5.2 Radar Setup................................................................................................................ 5-3
5.2.1 Radar display setup.......................................................................................... 5-3
5.2.2 Radar range setup............................................................................................ 5-6
5.2.3 Function key setup........................................................................................... 5-7
5.3 Plotter Setup................................................................................................................ 5-9
5.3.1 Navigation options............................................................................................ 5-9
5.3.2 Function key setup..........................................................................................5-10
5.4 Chart Setup................................................................................................................5-12
5.4.1 Chart offset......................................................................................................5-12
5.4.2 FURUNO, Nav-Charts™ chart attributes.........................................................5-13
5.4.3 C-MAP chart attributes....................................................................................5-16
5.5 Data Boxes Setup.......................................................................................................5-20
5.6 Hot Page Setup..........................................................................................................5-21
5.7 Navigator Setup..........................................................................................................5-23
5.7.1 Navigation data source....................................................................................5-23
5.7.2 GPS receiver setup (Set equipped with GP-310B/320B).................................5-24
5.7.3 TD display setup..............................................................................................5-27
5.8 Nav Data Display Setup..............................................................................................5-29
5.9 Sounder Setup............................................................................................................5-30
5.9.1 System setup...................................................................................................5-30
5.9.2 Sensor setup...................................................................................................5-32
5.9.3 Sounding range, zoom range, bottom lock range ............................................5-33
5.9.4 Function key setup..........................................................................................5-34
vi
Page 9

6. DATA TRANSFER..........................................................................................6-1
6.1 Memory Card Operations.............................................................................................6-1
6.1.1 Formatting memory cards.................................................................................6-1
6.1.2 Saving data to a memory card..........................................................................6-2
6.1.3 Playing back data from a memory card.............................................................6-4
6.2 Uploading, Downloading Data......................................................................................6-5
6.2.1 Setting communication software on the PC.......................................................6-5
6.2.2 Uploading or downloading data.........................................................................6-5
6.3 Loading Waypoint Data from Yeoman..........................................................................6-8
6.4 Receiving Data Via Network Equipment.......................................................................6-9
6.5 Outputting Data Through the Network........................................................................6-10
7. MAINTENANCE, TROUBLESHOOTING ......................................................7-1
7.1 Preventive Maintenance...............................................................................................7-1
7.2 Replacement of Fuse...................................................................................................7-2
7.3 Replacement of Battery................................................................................................7-2
7.4 Simple Troubleshooting................................................................................................7-3
7.4.1 General.............................................................................................................7-3
7.4.2 Radar................................................................................................................7-4
7.4.3 Plotter...............................................................................................................7-5
7.4.4 Sounder............................................................................................................7-6
7.5 Diagnostics..................................................................................................................7-7
7.5.1 Memory I/O test................................................................................................7-7
7.5.2 Test pattern..................................................................................................... 7-10
7.5.3 Keyboard, remote controller test..................................................................... 7-11
7.6 GPS Status Display...................................................................................................7-12
7.7 Clearing Memories.....................................................................................................7-13
7.8 Error Messages..........................................................................................................7-14
APPENDIX ........................................................................................................ A-1
Menu Overview..................................................................................................................A-1
Geodetic Chart List..........................................................................................................A-12
World Time Chart.............................................................................................................A-13
Icons................................................................................................................................A-14
SPECIFICATION .............................................................................................SP-1
INDEX..........................................................................................................Index-1
Declaration of Comformity
vii
Page 10

FOREWORD
A Word to the Owner of the MODEL1722/1722C Series
Marine Radar
FURUNO Electric Company thanks you for purchasing t he MODEL1722/1722C
Series Marine Radar. We are confident you will discover why the FURUNO
name has become synonym ous with quality and reliability.
For over 50 years FURUNO Electric Company has enjoyed an enviable
reputation for quality and reliability throughout the world. This dedication to
excellence is furthered by our extensive global network of agents and dealers.
Your radar is designed and constructed t o meet the rigorous demands of the
marine environment. However, no machine can perform its intended function
unless properly installed and maintained. Please carefully read and f ollow the
operation and maintenance procedures set f orth in this manual.
We would appreciate feedback from you, the end-user, about whether we are
achieving our purposes.
Thank you for considering and purchasing FURUNO.
viii
Page 11

Features
The MODEL1722/1722C series work within our new product-network system
called the “NavNet.” Each product has an IP address to communicate with
NavNet compatible products within the network, using TCP/IP protocol through
an Ethernet 10 Base-T network.
The main features are
! Bright 7” screen visible even under direct sunlight.
! User friendly operation with combination of discrete keys, soft keys and
! Accepts FURUNO and Nav-charts™ (NAVIONICS) or C-MAP charts.
! Fast chart redraw.
! Built-in NavNet interface circuit board.
! 12-channel GPS Receiver GP-310B with highly accurate position fixing
! User programmable function keys.
! Video sounder picture available with connection to optional network
! ARP function (when connecting with MODEL1833/1833C series)
Note: WAAS, available in North America, is a system of satellites and ground
stations that provide GPS signal corrections, giving you better position accuracy,
typically within three meters. Other systems are currently under developm ent :
Multi-Functional Satellite Augmentation System (MSAS) in Japan, and Euro
Geostationary Navigation Overlay Service (EGNOS) for Europe.
The systems will be compatible with each other, so that by selecting WAAS
below will enable reception of the signal from any system. Unless ot herwise
specified this manual uses "WAAS" when referring to these position-fixing
systems.
FOREWORD
cursor pad.
optionally available or GP-320B with WAAS (see the note in below.)
sounder.
ix
Page 12
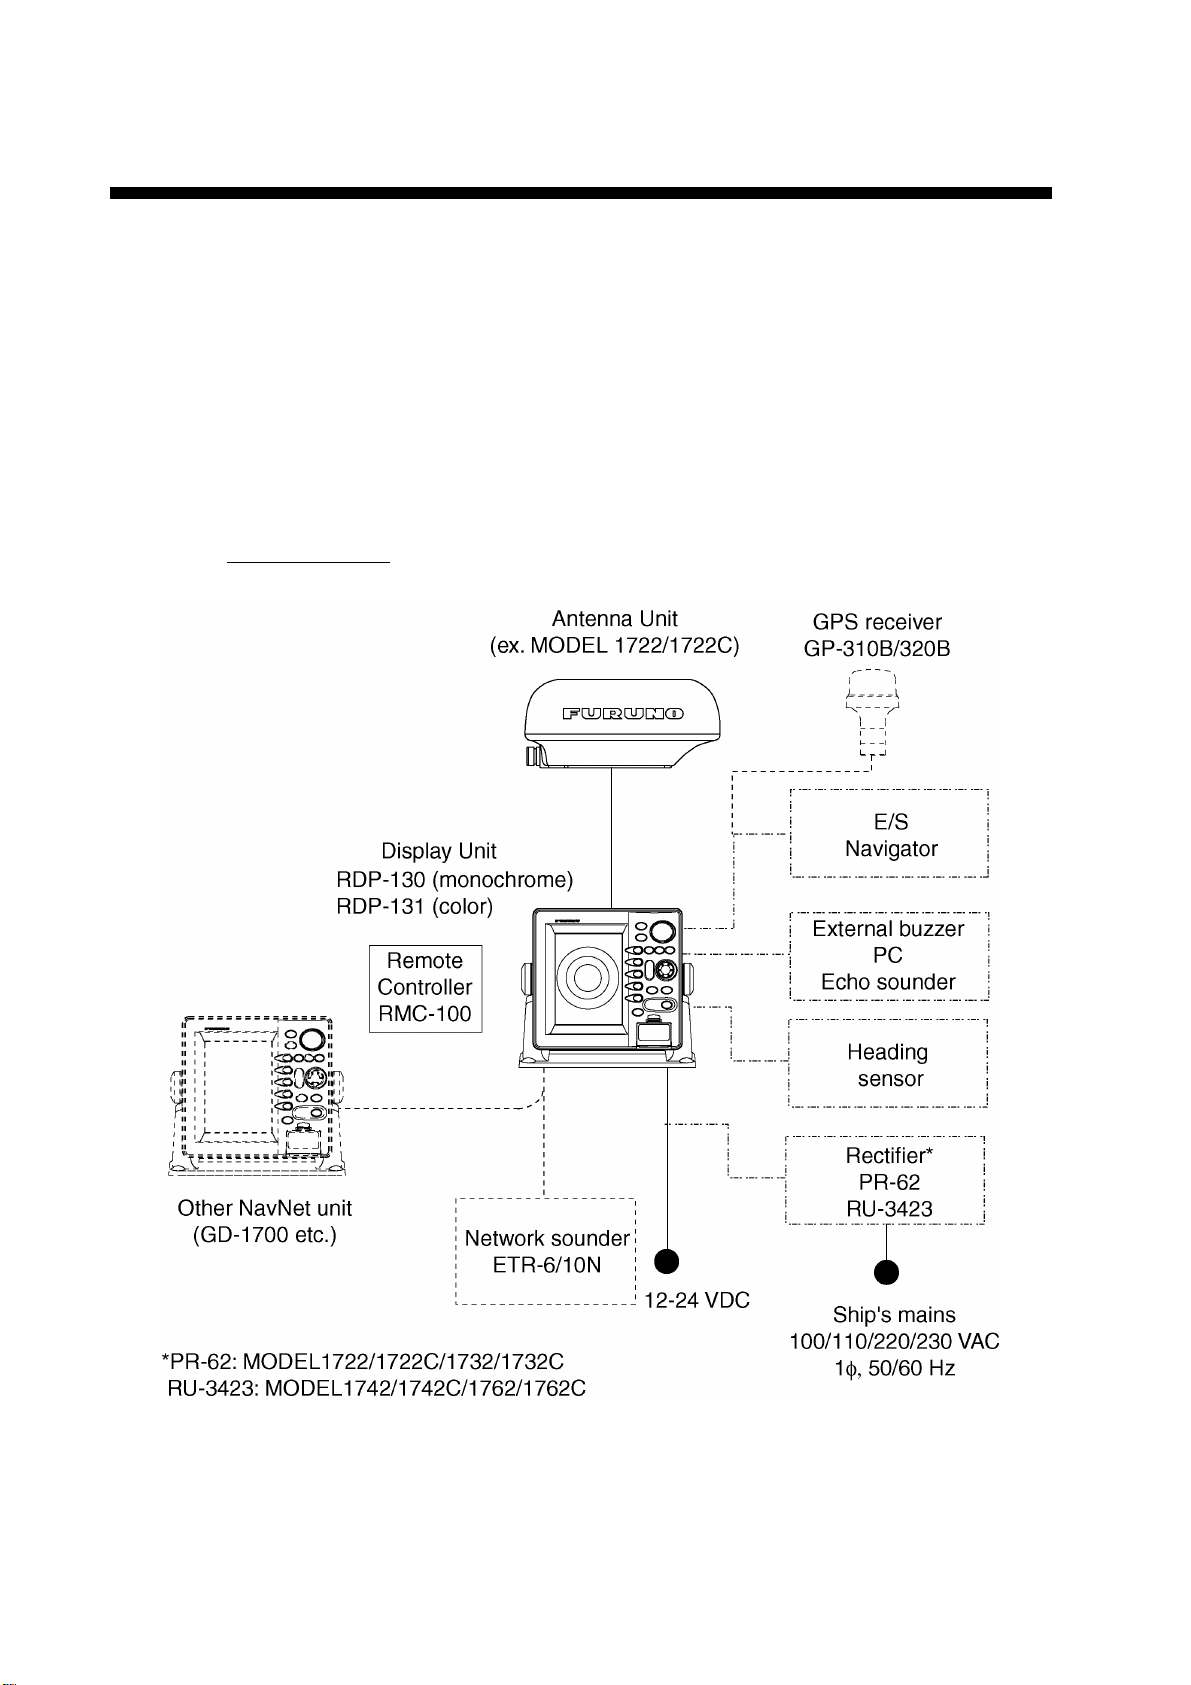
SYSTEM CONFIGURATIONS
All NavNet products incorporate a “network circuit board” to integrate each
NavNet product on board through an optional LAN cable (Ethernet 10BASE-T).
Each NavNet product is assigned an IP address to enable transfer of images
between other NavNet products. For example, video plotter pictures can be
transferred to a radar and vice versa. Pictures received via the NavNet may be
adjusted at the receiving end.
A NavNet system may consist of up to four display units and one ETR. For a
system incorporating three or more product s , a “hub” is required to process data.
NavNet system
NavNet system
x
Page 13
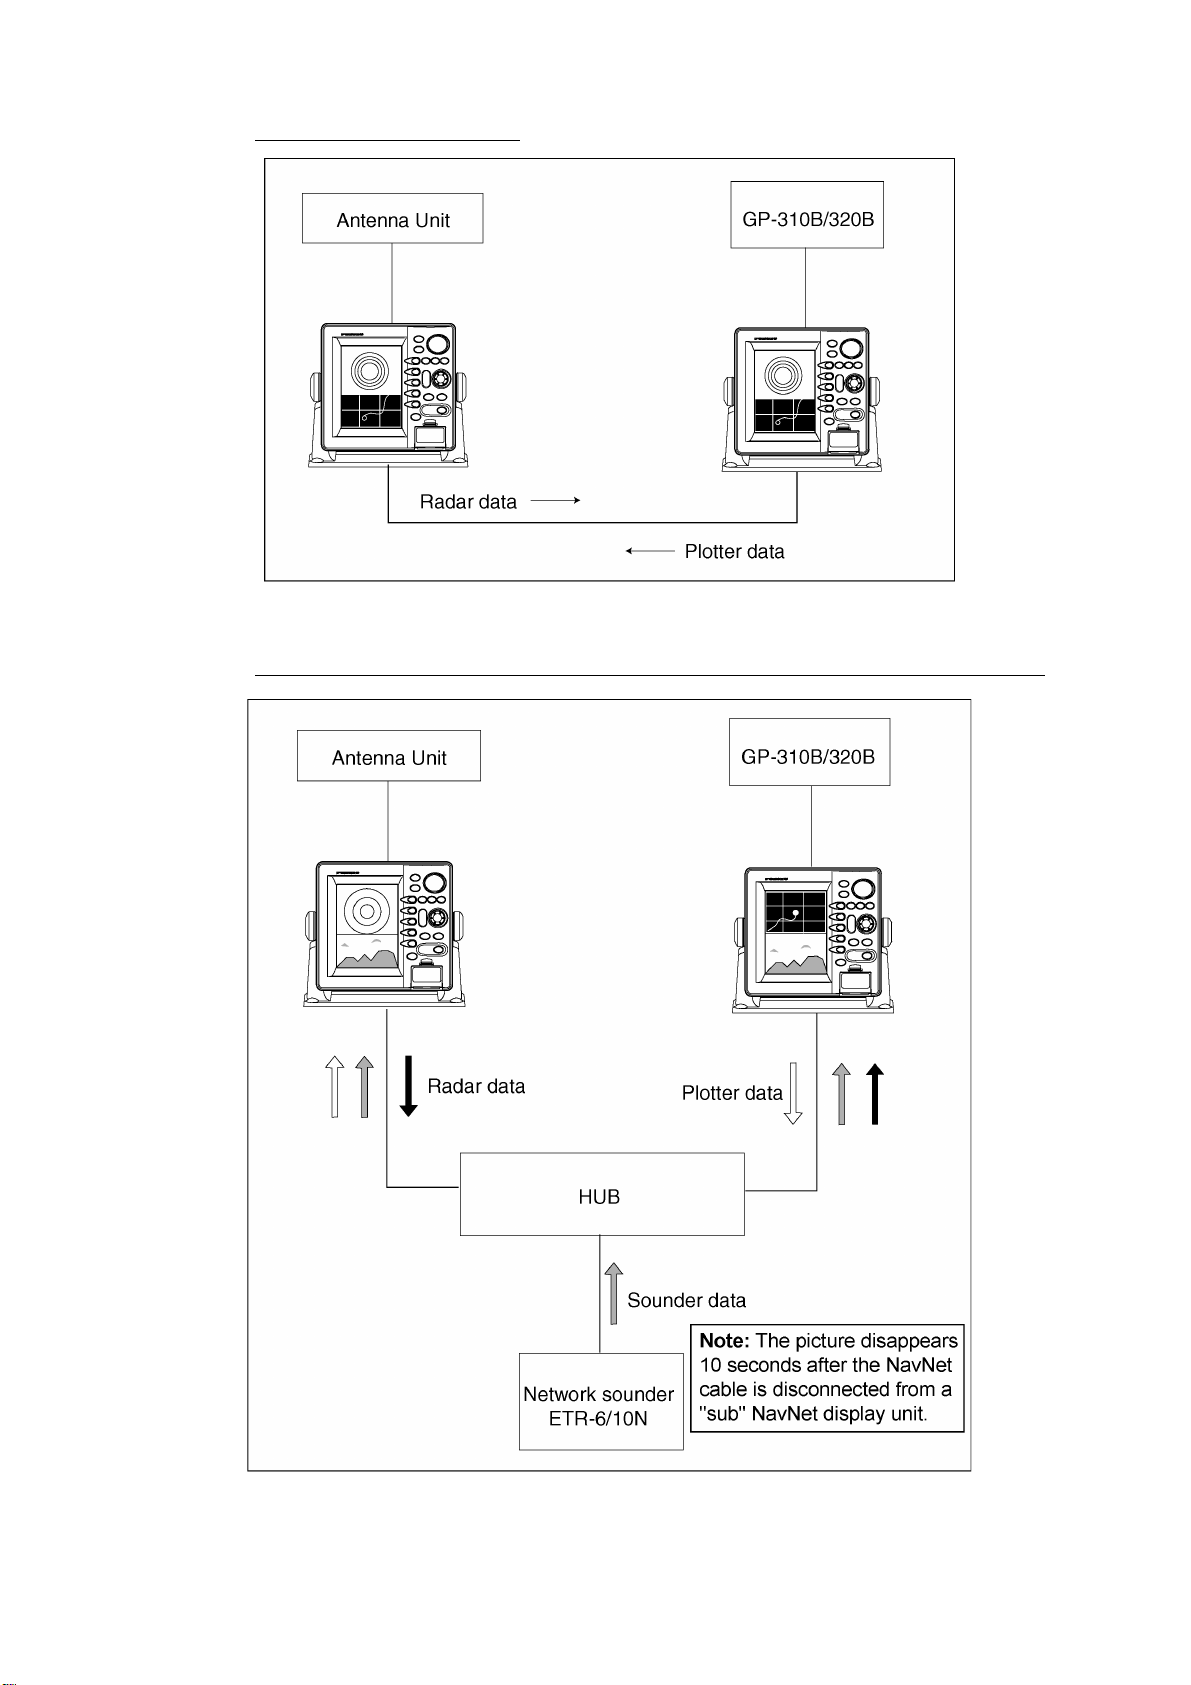
Two-unit NavNet system
Two-unit NavNet system
SYSTEM CONFIGURATIONS
Three-or more unit NavNet system (Max. 4 NavNet capable display units)
Three-or more unit NavNet system
xi
Page 14

This page is intentionally left blank .
Page 15

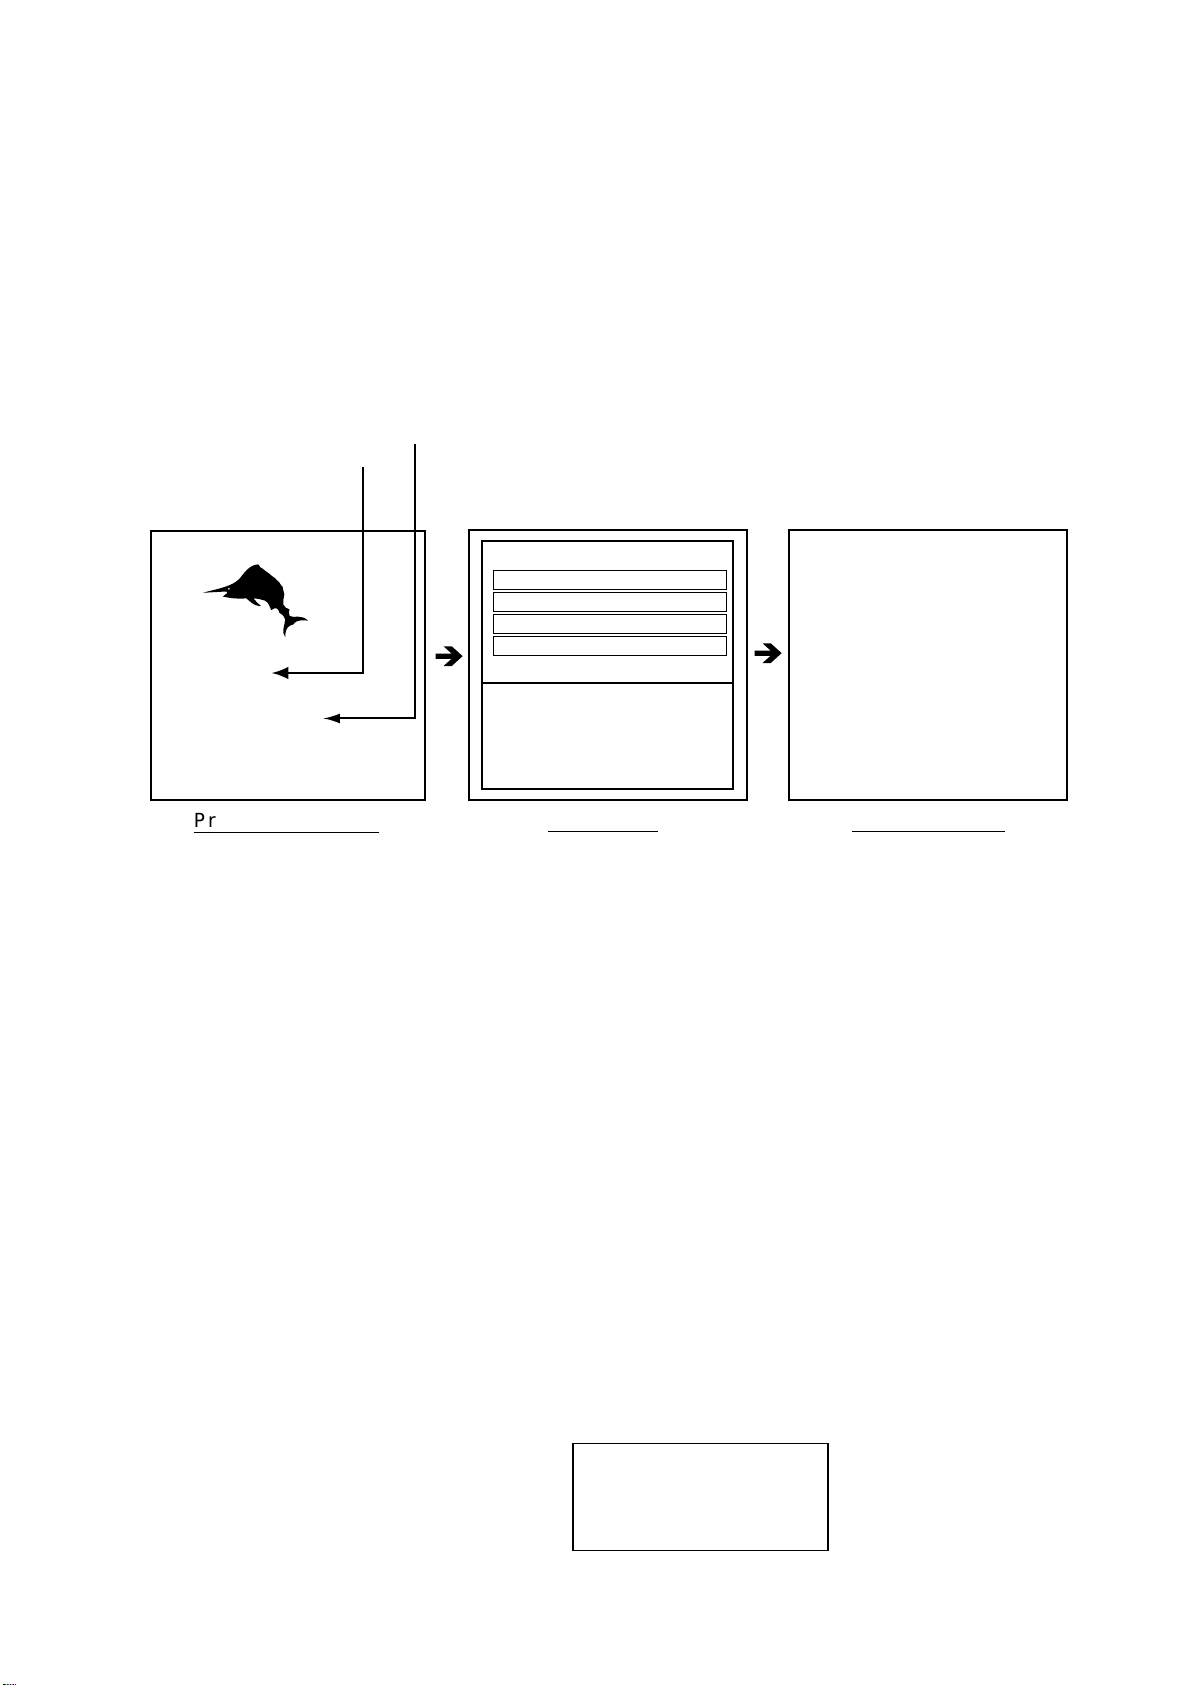
1. OPERATIONAL OVERVIEW
This chapter provides basic information needed to get you started using your
radar. The follow topics are presented:
• Control overview
• Chart card insertion
• Power on/off
• Contrast, brilliance and hue (Color series only) adjustment s
• Display selection
• Data boxes
• Function keys
• Simulation display
NOTICE
The brilliance of the LCD is adjustable
to match a wide variety of lighting
conditions. However, its maximum
setting may not be sufficiently bright
to permit viewing of the display with
polarized sunglasses.
Note: The example screens shown in this manual may not match the screens
you see on your display. The screen you see depends on your system
configuration and equipment set tings.
1-1
Page 16
1. OPERATIONAL OVERVIEW
1.1 Operating Controls
1.1.1 Display unit controls
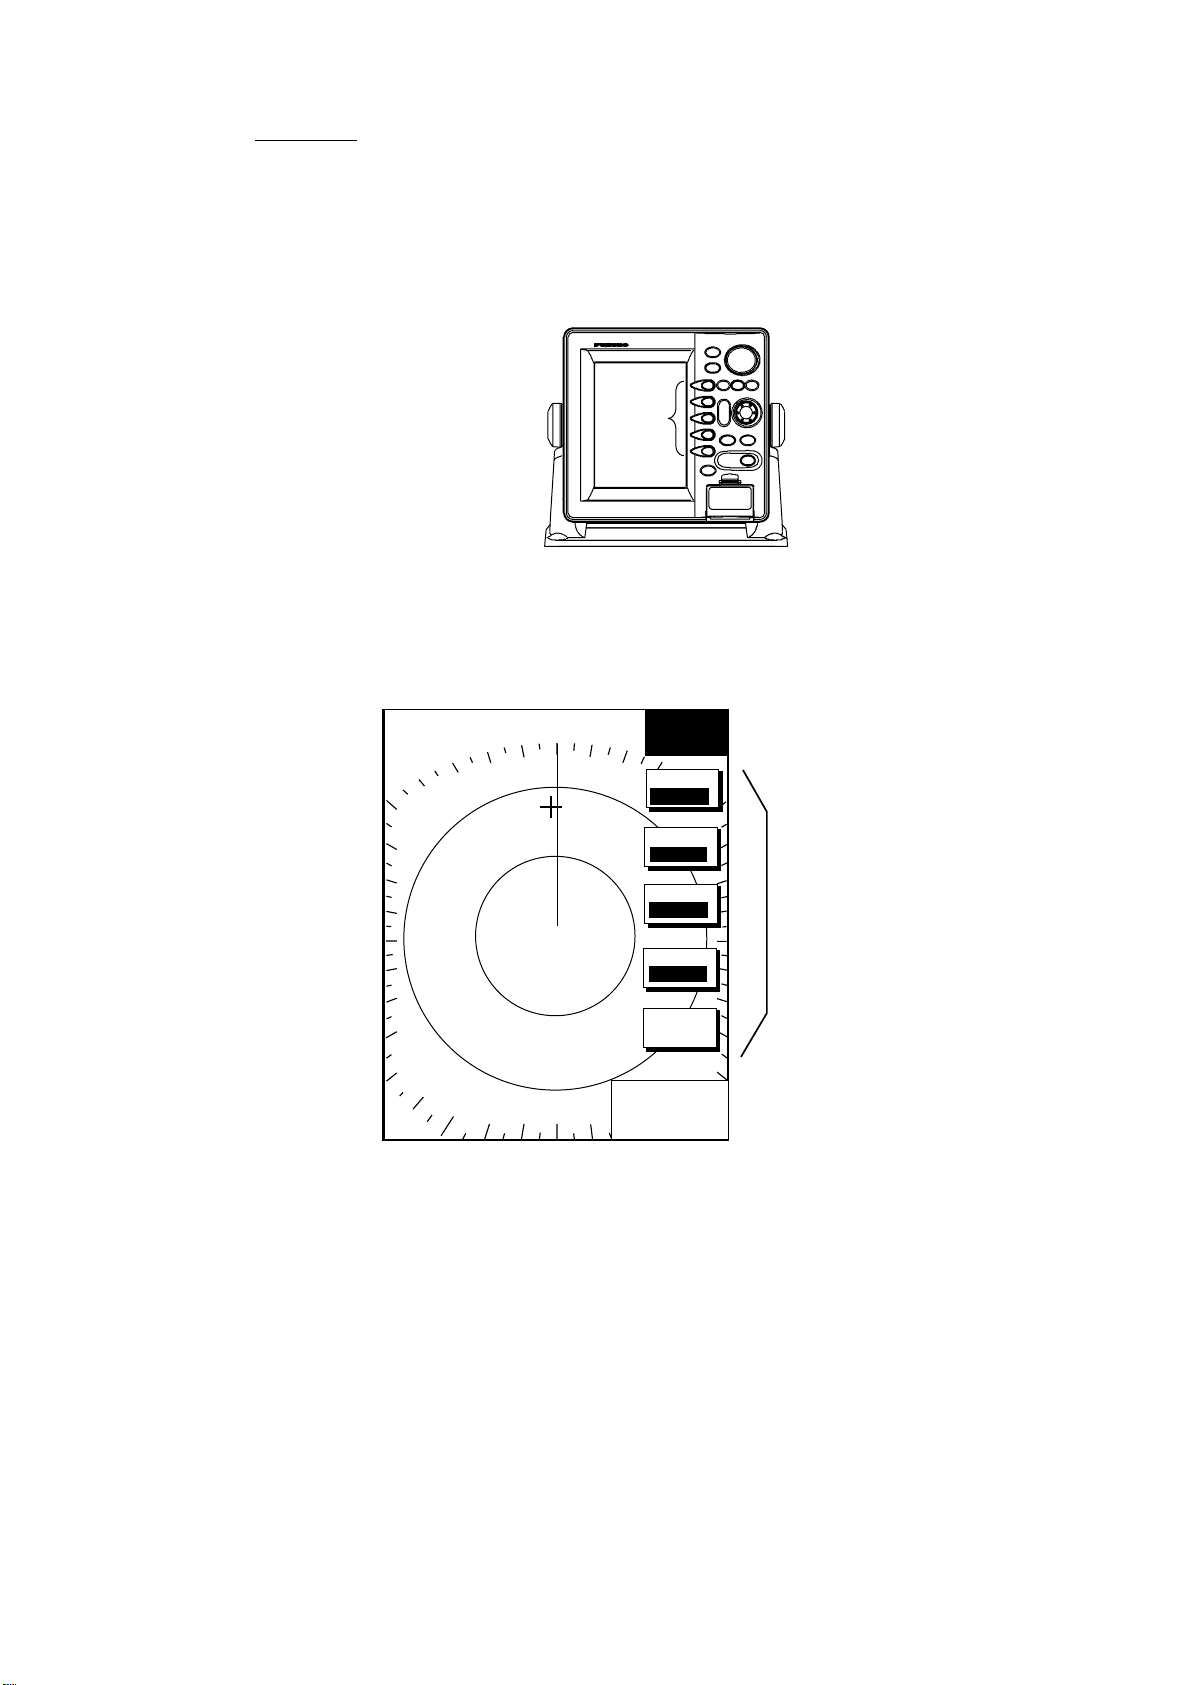
Overview of display unit cont rols
The radar systems are mainly operated with controls of the display unit (and
remote controller). Ten keys are labeled and they provide the function shown on
their labels. The five soft keys provide various functions according to current
operating mode. The [ENT ER] knob mainly functions to register selections on
the menu and enter alphanumeric data. The cursor pad’s main function is to
move the cursor across the screen. Whenever you operate a key, a single beep
confirms operation. Invalid operation causes the unit to emit three beeps.
Selects display mode.
Momentary press:
Registers own ship’s
position as a waypoint.
Press three seconds:
Marks man overboard
position.
Soft keys
Shows or hides the soft
keys, function keys,
nav data alternately.
Cursor pad
Selects menu items and options;
shifts cursor. Press, release and
press again to change setting
consecutively.
Opens/closes the alarm menu.
Clears data; erases selected mark.
Opens/closes the main menu.
Selects a range.
ENTER knob
Push: Registers options on menus.
Rotate: Selects character; adjusts sensitivity
(sounder, radar); chooses menu items and options.
Displays the soft keys for EBL/VRM.
Radar: Displays the soft keys for adjustment of
gain, A/C SEA, A/C RAIN and FTC.
Sounder: Adjusts gain.
Long press: Turns power on/off.
Momentary press: Opens the
display for adjustment of brilliance,
etc. For radar, switches STBY and TX.
Chart slot
Control panel
1-2
Page 17
1. OPERATIONAL OVERVIEW
Soft keys
The five soft keys’ functions change according t o the operation. Their labels for
their current functions are shown on the screen to the left of the keys. To hide or
show the soft keys, press the [HIDE/SHOW] key. Each press of the key shows
preset soft keys, user function keys or turns off navigation information (at the top
of the screen).
SOFT
KEYS
Display unit
Some soft keys show the current state of the soft key function in reverse video
as shown below.
.125nm
SP
.250/ 319.9
°
H-UP
*: Only when MODEL 1833/C series are
used as radar source.
M
359.9°R
+
0.24nm
SIGNAL
PROCESS
I. REJ
LOW
E. AVG*
OFF
PULSE
SHORT
E. STR
LOW
RETURN
Plotter display
Current option
shown in reverse
video
1-3
Page 18
1. OPERATIONAL OVERVIEW
[ENTER] knob
The [ENTER] knob functions to
• Register data
• Enter alphanumeric data such as waypoint name
• Select menu item s and options
• Adjust setting
Clockwise rotation of the knob selects an alphabet, symbol or numeric, in one of
the sequences shown below. After you have selected desired alphanumeric
character push the [ENTER] knob to register your selection.
[ENTER] knob
ENTER knob
Alphabet, symbol, numeric
A ! B ! C ! D ! E ! F ! G ! H ! I ! J ! K ! L ! M ! N ! O ! P ! Q !
R ! S ! T ! U ! V ! W ! X ! Y ! Z ! & ! _ ! ’ ! # ! 0 ! 1 ! 2 ! 3 !
4 ! 5 ! 6 ! 7 ! 8 ! 9
Numerics
0 ! 1 ! 2 ! 3 ! 4 ! 5 ! 6 ! 7 ! 8 ! 9
1-4
Page 19
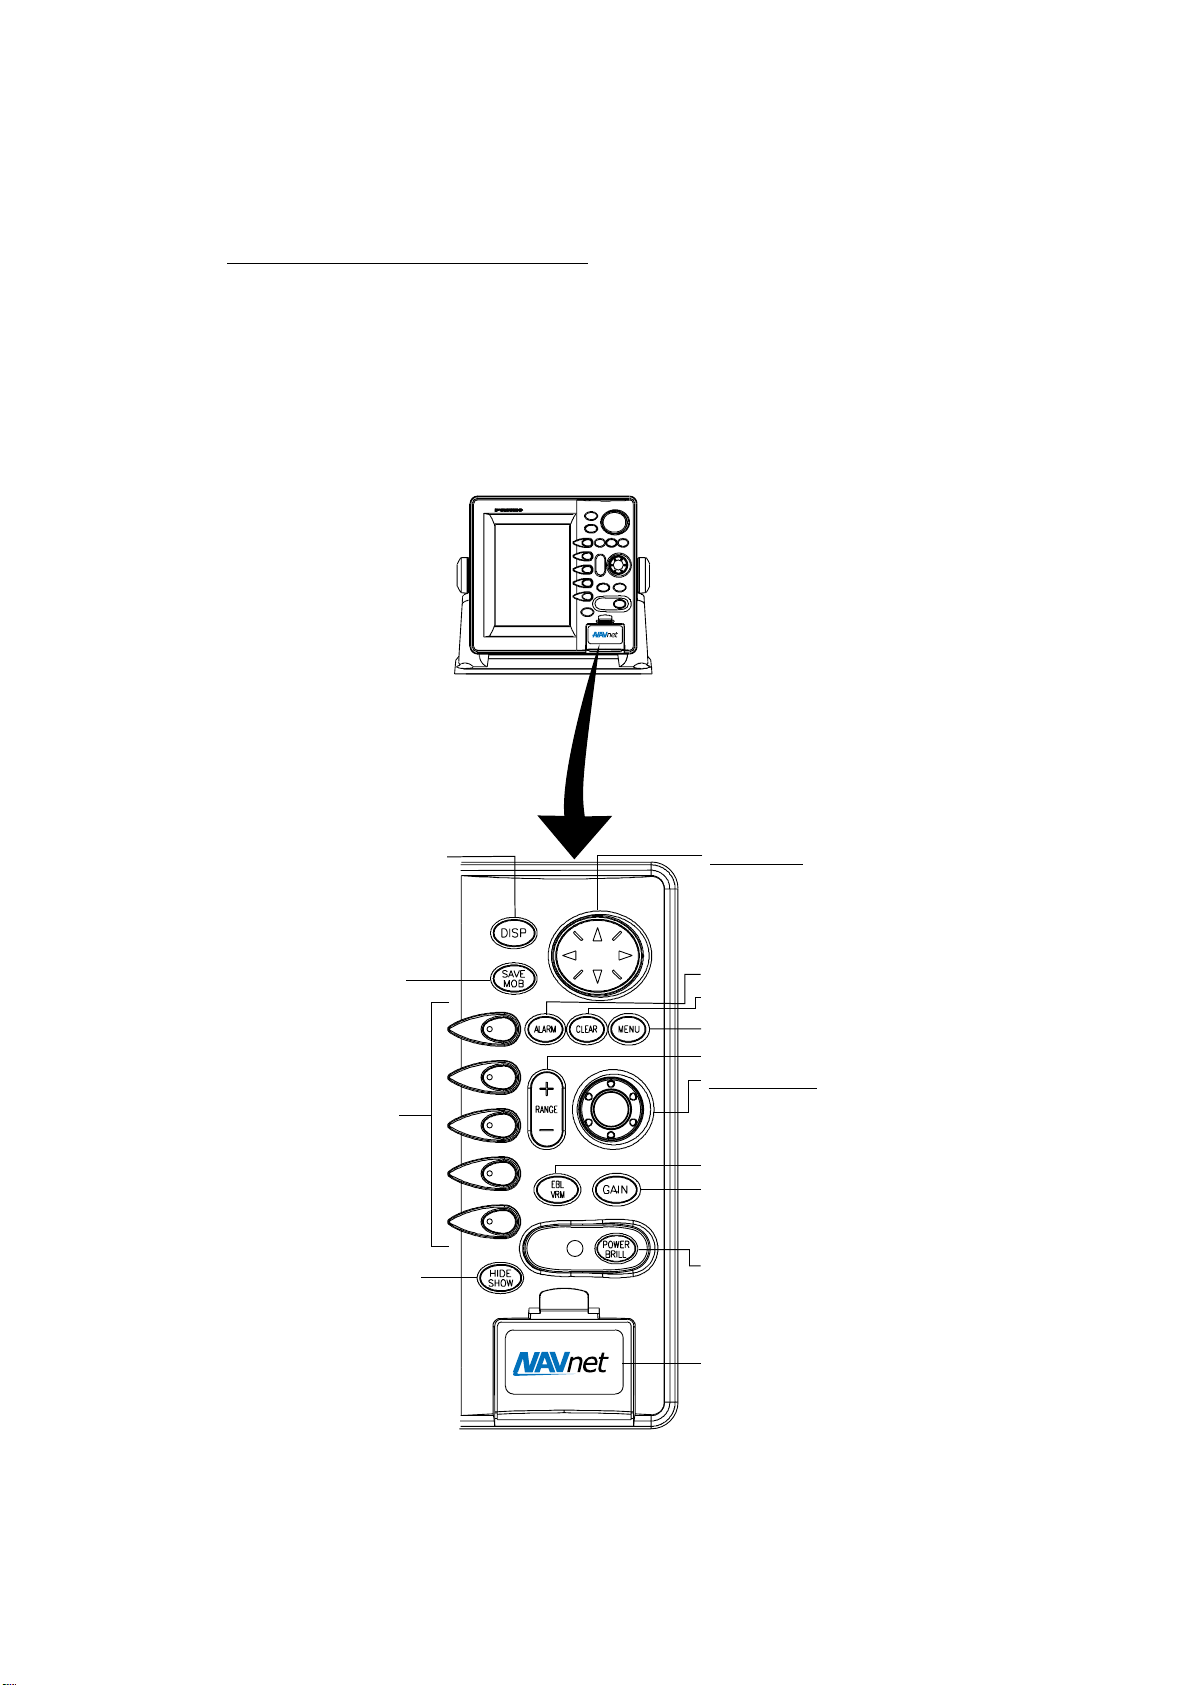
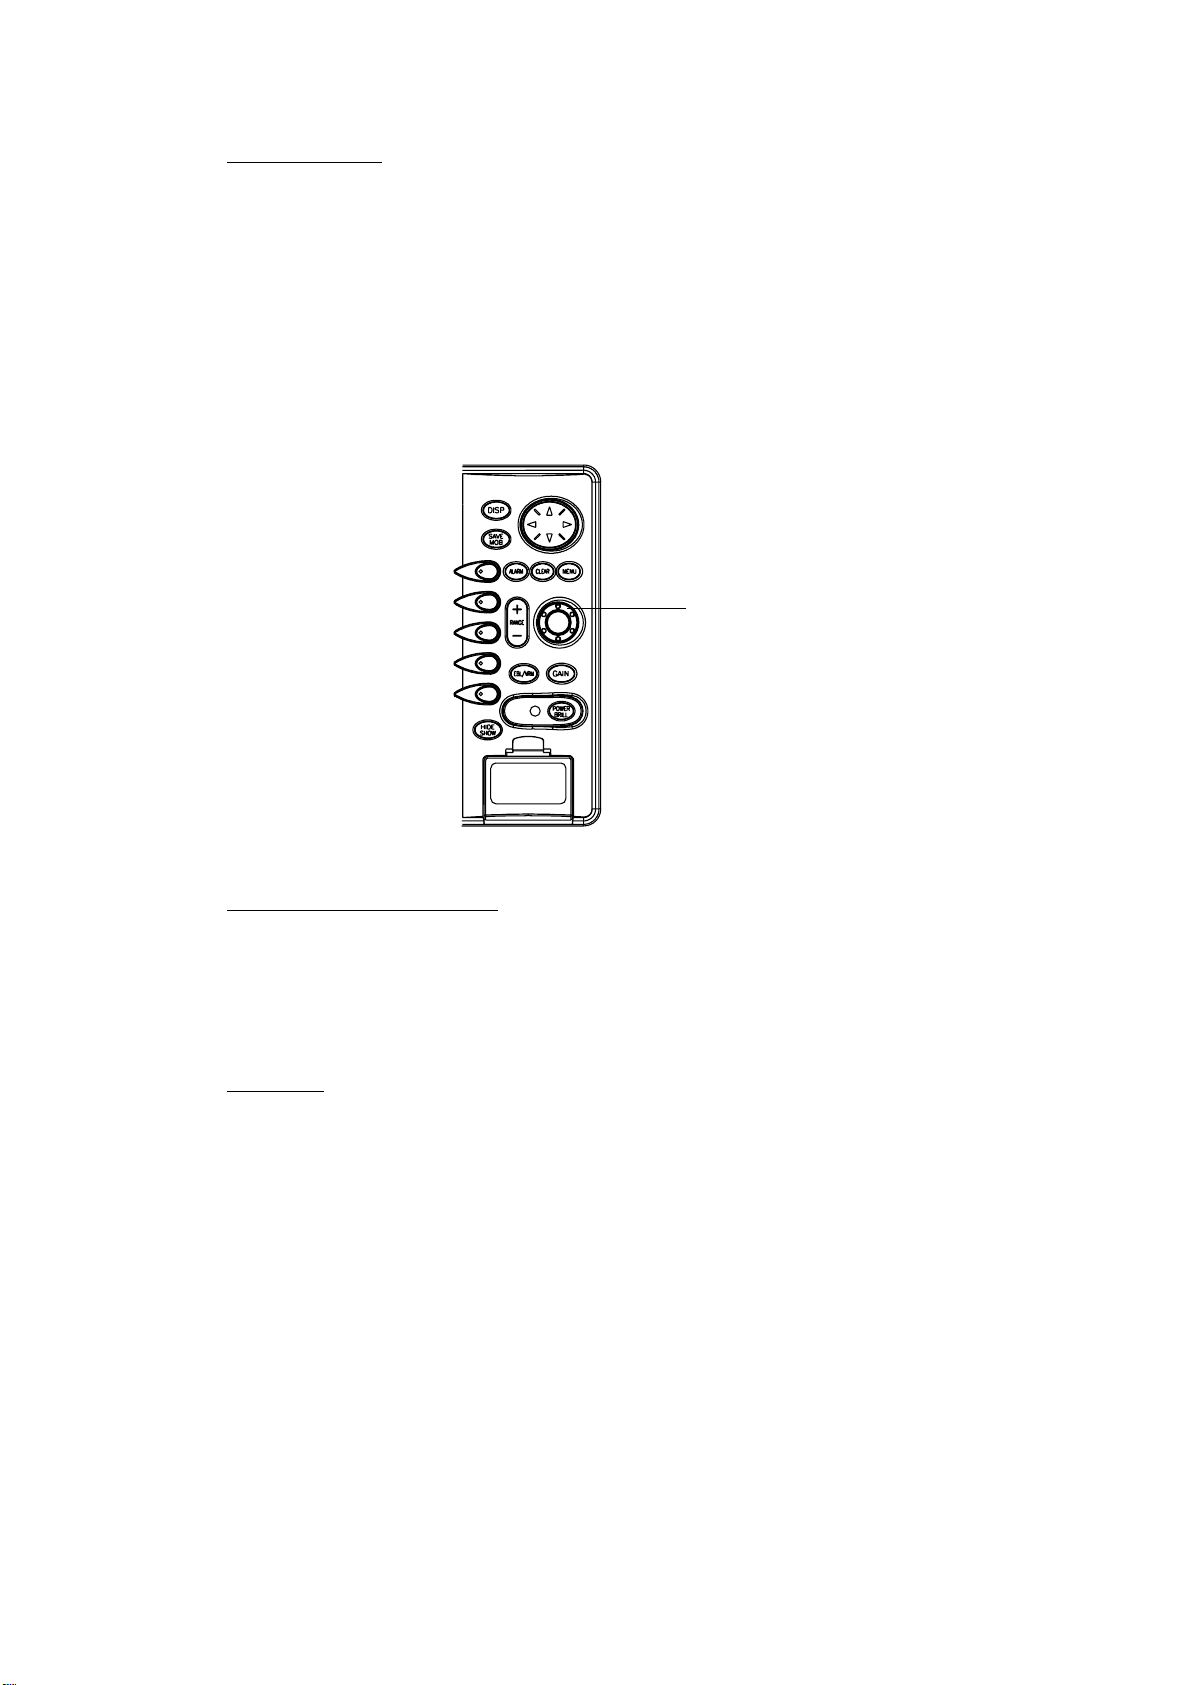
1.1.2 Remote controller
RANGE
ABC1DEF2GHI
4
JKL
STU
EBL / VRM
WPT
MNO
7
VWX
’#
DISP
0
Operating distance
90°: Up to 5 m
±45°: Up to 3 m
SAVE
Replace the batteries (AA) when the
MOB
distance from which the display
unit can be operated shortens.
3
Note: The remote controller may
65
PQR
become damaged if dropped.
Mishandling of the remote
98
YZ&
controller is not covered by
the warranty.
GAIN
CENTER
1. OPERATIONAL OVERVIEW
MARK
ENT
BRILL
ENT
CLEAR
TONE
SK3SK1 SK2
MENU
TX /STBY
ALARM
SK4 SK5
CNTL
ACQ
HIDE /SHOW
Remote controller
Key Function Key Function
RANGE Same as RANGE key on
display unit.
DISP Same as DISP key on
display unit.
SAVE MOB Same as SAVE MOB key on
CLEAR Same as CLEAR key on
display unit.
MENU Same as MENU key on
display unit.
BRILL Adjusts display brilliance.
display unit.
Ten keys Enter alphanumerics. TONE Adjusts display contrast.
EBL/VRM Same as EBL/VRM key on
display unit.
TX/STBY Toggles radar between
standby and transmit.
GAIN Same as GAIN key on
display unit.
ACQ Acquires radar target.
(Requires radar source
equipped with ARP.)
WPT Displays “alphabet” WPT list
on plotter display.
MARK ENT Same as MARK ENTRY soft
key.
CENTER Ret ur ns own ship to screen
center on plotter display.
CNTL Switches control between
displays on combination
ALARM Same as ALARM key on the
display unit.
HIDE/SHOW Same as HIDE/SHOW key
on display unit.
SK1 – SK5
(soft keys)
ENT
Same as soft keys on
display unit.
Same as ENTER knob on
display unit.
displays.
1-5
Page 20
1. OPERATIONAL OVERVIEW
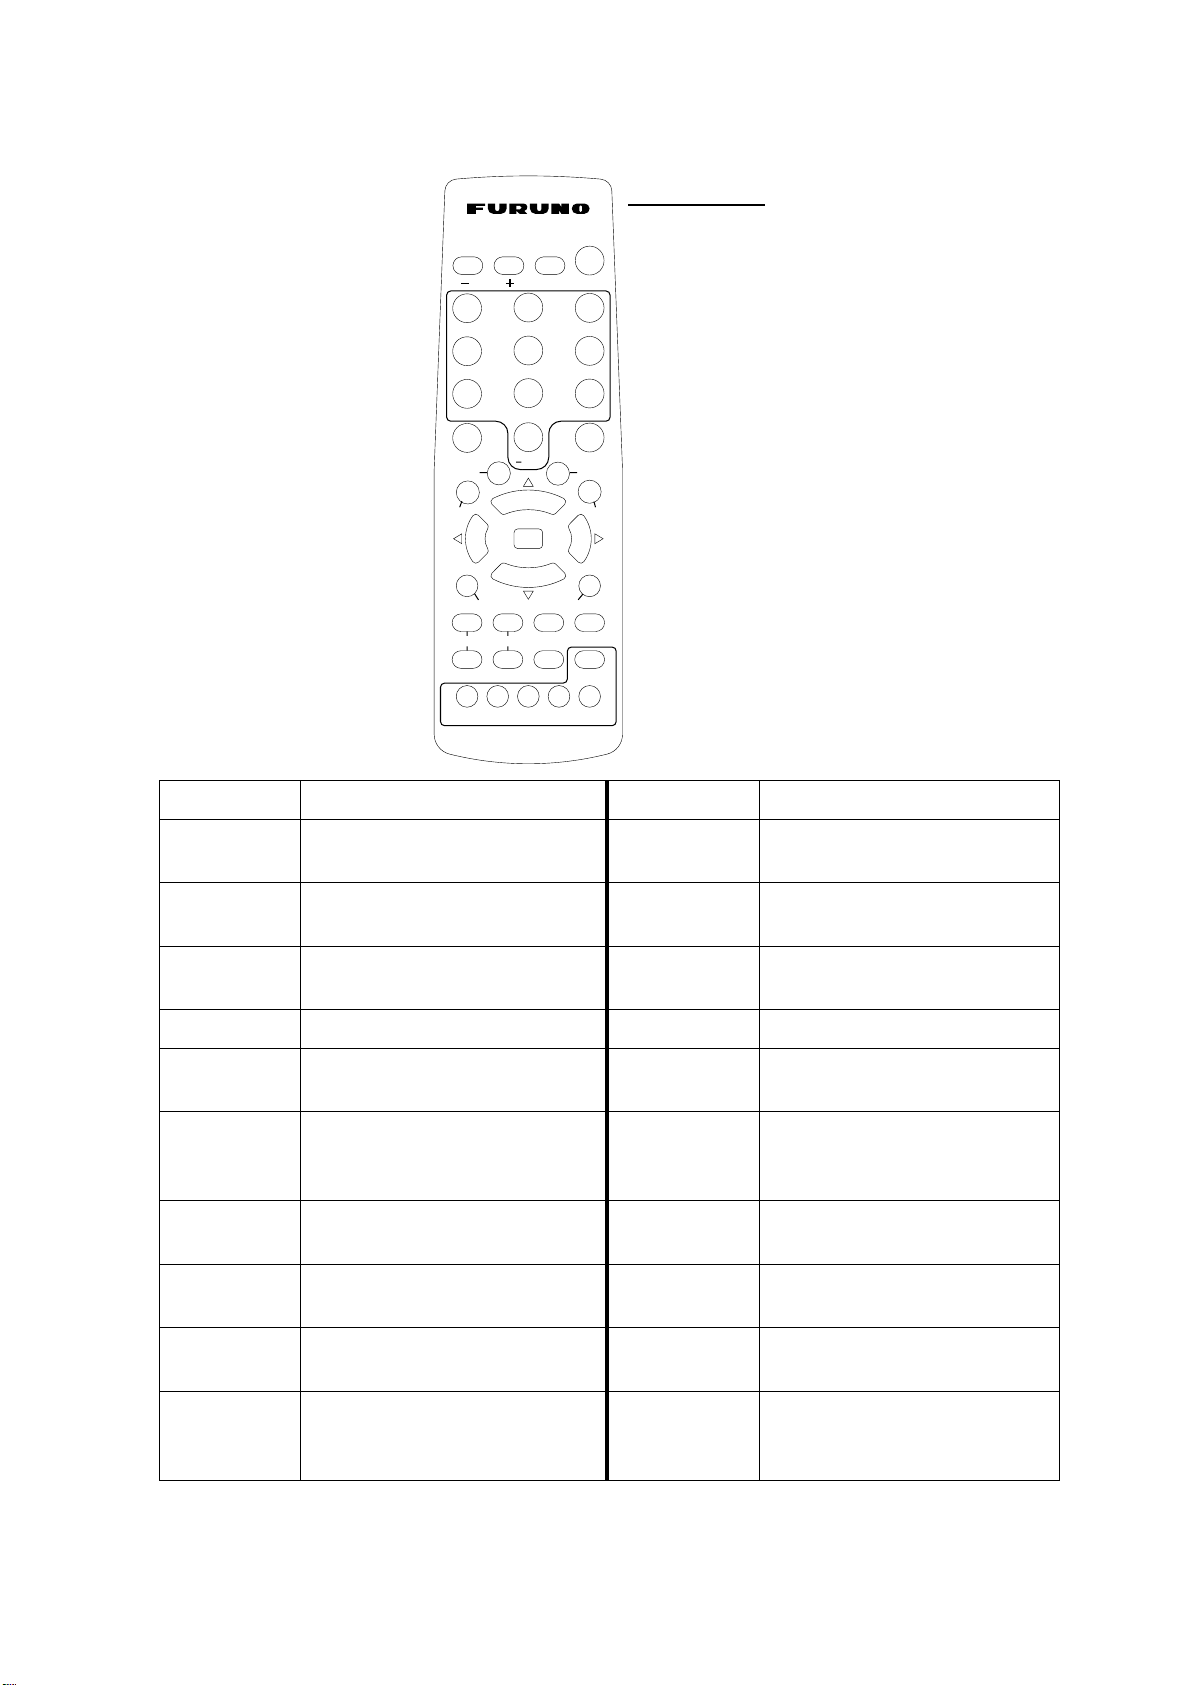
1.2 Inserting a Chart Card
Your unit reads FURUNO and Nav-Chart s™ (NAVIONICS), or C-MAP chart
cards, depending on its specifications. Insert the appropriat e chart card for your
area as follows:
1. Open the chart card slot lid.
Chart slot
Display unit
2. Insert desired chart card groove side up.
3. Close the lid to protect the chart drive.
Note 1: Do not insert or remove the chart card while turning power on. This may
cause the equipment to freeze.
Note 2: Do not remove a card while the chart is being drawn. This may cause
the equipment to freeze.
Note 3: A card remover is supplied to ease removal of chart cards. Attach the
card remover to the right-hand side hole on the card and pull to remove
card. You can leave the card remover attached to the card while the
card is in the card slot - push the card remover leftward until it contacts
the recessed area in the card.
Note 4: For multiple display units, do not use the same chart card type in more
than one display unit.
1-6
Chart card and card remover
Page 21
1.3 Turning the Unit On/Off
Press the [POWER/BRILL] key to turn the unit on. A beep sounds and the
equipment proceeds in the sequence shown below, displaying the product
information screen, startup test results and the chart usage disclaimer, in that
order. The startup test checks the ROM, RAM, internal battery and backup data
for proper operation, displaying the results for each as OK or NG (No Good). If
NG appears, an appropriate message appears on the screen. F or any NG, try to
press any key to go to the chart disclaimer screen, then perform the diagnostic
test referring to the paragraph “7.6 Diagnostics.”
Chart List
Host Name
RADAR PLOTTER
STATION NAME:
RADAR
FURUNO ELECTRIC CO., LTD.
CHARTS AVAILABLE
FLYBRDG = ANB01004
RADAR = ANB01003
è
STARTUP TEST
ROM OK
RAM OK
BACKUP DATA OK
INTERNAL BATTERY OK
1. OPERATIONAL OVERVIEW
** = Program version no.
(Two program version numbers.
One for NAVIO and one for C-MAP.)
NO NATIONAL HYDROGRAPHIC
OFFICE HAS VERIFIED THE
INFORMATION IN THIS
COASTLINE DATA CARD AND NONE
ACCEPT LIABILITY FOR THE
ACCURACY OF REPRODUCTION OR
ANY MODIFICATIONS MADE
THEREAFTER. THIS PRODUCT WITH
è
THIS COASTLINE DATA CARD
DOES NOT REPLACE THE
REQUIREMENT TO USE THE
APPROPRIATE PRODUCTS FOR
NAVIGATION ACCORDING TO
NATIONAL AND INTERNATIONAL
REGULATIONS.
PROGRAM No. 03591730**
Product information Startup test Chart disclaimer
The magnetron in the antenna unit takes about one minutes and thirty seconds
to warm up before the radar can be operated. The time remaining for warm up of
the magnetron appears at the center of the display, counting down from 1:30 to
0:01.
You m ay press any key at the chart disclaimer screen to show the last-used
display, or wait several seconds to let the equipment do it for you.
To turn the unit off, press and hold down the [POWER/BRILL] key until the
screen goes dark (approx. 3 sec.). To protect the LCD attach the hard cover.
Note that the network sounder will be turned off approx. three minutes after
turning off the power.
Note: You are asked if you want to start the simulation mode, which provides
simulated operation of the equipment, the f irst time you turn on the power
(or any time power is applied after a memory reset) the message shown
below is displayed. Push the [ENTER] knob to start the simulat ion mode,
or press the [CLEAR] key to start normal operation. For further details
about the simulation mode, see the paragraph “1.9 Simulation Display.”
START
SIMULATION MODE?
YES ... PUSH ENTER KNOB
NO ... PUSH CLEAR KEY
TO SKIP.
1-7
Page 22
1. OPERATIONAL OVERVIEW
1.4 Cursor Pad, Cursor
The cursor pad mainly functions to shift the cursor, for measurement of range
and bearing to a location (radar) and latitude and longitude position (plotter).
Operate the cursor pad to shift the cursor. The cursor moves in the direction of
the arrow or diagonal pressed, on the cursor pad.
For the plotter display, the cursor can be turned off with the CENTER sof t key.
This also returns own ship marker to the screen center.
Cursor
.125nm
SP
.250/ 319.9
M
°
H-UP
SIGNAL
PROC
RADAR
DISPLY
NAV
FUNC
TARGET
ZOOM &
D. BOX
359.9°R
+
0.24nm
Radar display
Cursor, cursor data
Cursor data
L/L position,
Range and
bearing from
own ship to
cursor
Cursor
34° 22. 3456'N 272.4°M TRIP NU
+
080° 22. 3456'E
15.9 nm 99.9 nm
16.0nm
Plotter display
MARK
ENTRY
MODE
NTH UP
CENTER
GOTO
CURSOR
D. BOX
ON/ OFF
1-8
Page 23
1. OPERATIONAL OVERVIEW
1.5 Display Brilliance, Panel Brilliance, Contrast, Hue
You can adjust display brilliance, panel brilliance, contrast and hue
(MODEL1722C series only) as shown below.
1.5.1 Display brilliance, panel brilliance
1. Press the [POWER/BRILL] key mom entarily. A set of soft keys for
adjustment of brilliance, contrast and hue (MODEL172 2C series only) appear.
The last-used adjustment window appears. In the example below the display
brilliance adjustment window is shown.
Current selection is higtlighted.
.125nm
SP
.250/ 319.9
M
°
H-UP
DISPLAY BRILLIANCE
MODEL1722C series MODEL1722 series
8
2. Press the DI SPLY BRILL or PANEL BRI LL soft key as appropriate. An
adjustment window appears at the bottom of the screen. This window shows
the name of the it em selected for adjustment plus current brilliance level, by
bar graph.
BRILL
CONTST
DISPLY
BRILL
PANEL
BRILL
CONTST
/HUE
RADAR
STBY
RETURN
.125nm
SP
.250/ 319.9
H-UP
DISPLAY BRILLIANCE
Brilliance adjustment soft keys
°
8
CONTST
DISPLY
BRILL
PANEL
BRILL
CONTST
RADAR
STBY
RETURN
BRILL
M
DISPLAY BRILLIANCE
8
Display brilliance Panel brilliance
PANEL BRILLIANCE
8
Display brilliance and panel brilliance windows
3. Adj ust the [ENTER] knob, clockwise to raise the setting or counterclockwise
to decrease it. You may also use the soft key pressed at st ep 2, in which
case the item selected is adjust ed cyclically, from low to high. Eight levels of
display brilliance and panel brilliance are available.
4. Hit the RETURN soft key to finish.
The display brilliance can be adjusted by pressing the [POWER/BRILL] key.
If the unit is turned on with minimum display brilliance, press the
[POWER/BRILL] key consecutively to adjust the brilliance.
1-9
Page 24
1. OPERATIONAL OVERVIEW
1.5.2 Contrast
1. Press the [ P OWER/BRILL] key momentarily.
2. Press the CO NTST (monochrome) or CONT ST/HUE (color) soft key.
3. For MODEL1722C series, two soft keys appear at the pressing of the
CONTST/HUE soft key: CONTST and HUE. Press the CONTST soft key to
adjust the contrast.
Contrast window
4. Adj ust the [ENTER] knob, clockwise to raise the setting or counterclockwise
to decrease it. You may also use the CONTST soft key, in which case the
item selected is adjusted cyclically, f r om low to high. 16 levels (monochrome)
and 10 levels (color) of contrast are available.
5. Press the RET URN soft key to finish.
1.5.3 Hue (MODEL1722C series)
CONTRAST
8
1. Press the [ P OWER/BRILL] key momentary.
2. Press the CONTST/HUE soft key.
3. Press the HUE soft key to show the hue setting window.
HUE
▲
¡
DAY
¡
NIGHT
¡
TWILIGHT
¤
MANUAL SET
▼
Hue window
4. Operat e the cursor pad or [ENTER] knob to select hue desired, referring t o
the table below. MANUAL SET follows the color settings on the RADAR
DISPLAY SETUP for the radar, CHART DETAILS menu for the plotter and
SOUNDER MENU for the sounder.
Day Night Twilight Applicable mode
Characters Black Red Green Plotter, radar, sounder
Radar ring Green* Red Green* Radar
Radar echo Orange Red Yellow Radar
Background White Black Blue Plotter, radar
Landmass Yellow Light Yellow Dim Yellow Radar
*: Red on C-map
5. Hit the RETURN soft key to finish.
Note: When using the overlay screen, the own ship track will be hidden if the
radar background and own ship track are blue and the “MANUAL” hue
setting is used. In this case, set HUE to other posit ion and then return to
“MANUAL” to show the own ship track in black.
1-10
Page 25
1.6 Selecting a Display
1.6.1 Display modes
If you have a navigator and network sounder connected, four full-screen displays
are available: radar, plotter, and video sounder and navigation data.
(MODEL1722C series have five screens, those mentioned above plus the
overlay screen.) In addition to the full-screen display, you can divide the screen
into half-screen combination displays to show two sets of images (data).
1. OPERATIONAL OVERVIEW
Full screen
(Ex. radar)
Combination screen
(Ex. radar + sounder)
Overlay screen
(Radar and plotter,
color model only.
Requires L/L data)
Display screens
The table below shows the displays available with each screen type.
Screen type and available display screen
Full screen Combination screen
options
Radar, plotter, sounder,
nav data
Radar, plotter, echo
sounder, compass,
highway,
compass/highway, nav
data, overlay
Overlay screen options
(Color series only)
Radar + plotter
1-11
Page 26
1. OPERATIONAL OVERVIEW
1.6.2 Selecting a display
1. Press the [ DISP] key to show the full-screen selection window. The icons of
modes not available are marked with “X” m ark. PAGE1-PAGE5 are
user-arrangeable displays called “hot pages,” which you can configure as you
like. For further details, see “5.5 Hot Page Set up.”
RADAR PLOT SNDR NAV OVRLY
PAGE1 PAGE2 PAGE3 PAGE4 PAGE5
Basic display
screens
Hot pages
· TURN KNOB TO SELECT MODE
AND PUSH KNOB TO ENTER.
· PUSH ANY SOFT KEY TO
SELECT IMAGE SOURCE.
Full-screen selection window (“overlay” for color model)
2. Rotat e the [ENTER] knob to select a basic display screen or a hot page
screen.
3. Push the [ENTER] knob. If you selected a basic display screen, a set of
combination display screens corresponding to the basic display screen that
was selected appear. In the example below, radar combination displays are
shown.
1-12
PUSH ENTER KNOB.
Radar combination screen selection window
4. Operate the [ENTER] knob to select the combination screen display desired
and push it to set.
Page 27
1. OPERATIONAL OVERVIEW
1.6.3 Switching control in combination and overlay screens
A soft key is provided in relevant combination and overlay screens (color series
only) to switch control between displays. In the example below, the RADAR
CNTRL and PLOTTR CNTRL soft keys enable switching control between the
radar and plotter screens in the plotter/radar combination display.
3nm
12
LP
H-UP
ST-BY
34° 22. 3456'N 359.9°M TRIP NU
080° 22. 3456'E
16.0nm
19.9 kt 99.9 nm
SIGNAL
PROC.
RADAR
DISPL Y
NAV
359.9
+
FUNC
11.7nm
T ARGET
RADAR
CNTRL
CNTL
RADAR
RADAR
CNTRL
To adjust
plotter
°
R
PLOTTR
CNTRL
To adjust
3nm
12
LP
H-UP
ST-BY
34° 22. 3456'N 359.9°M TRIP NU
080° 22. 3456'E
16.0nm
19.9 kt 99.9 nm
359.9
+
11.7nm
radar
WP-002
FISH
WP-002
FISH
Radar display selected Plotter display selected
How to switch control between modes in the plotter/radar combination display
MARK
ENTRY
MODE
NTH UP
NAV
°
R
POS
PLOTTR
CCNTRL
1-13
Page 28
1. OPERATIONAL OVERVIEW
1.6.4 Selecting radar source
When other network radar is connected to the equipment, you may select an
image source as shown below. This is not necessary when no other network
radar is connected. Select one host name for the source though there are two or
three radar units on the net.
Note: Turn the power off whenever changing the source.
1. Press the [ DI SP] key.
2. Press any sof t key to show the following display.
▲
RADAR SOURCE
RADAR
SOUNDER SOURCE*
SOUNDER
IP ADDRESS
HOST NAME
IF THERE IS MORE THAN
ONE NETWORK RADAR OR
ECHO SOUNDER, YOU MAY
SELECT THE IMAGE
SOURCES FOR DISPLAY.
- - -
-
172.031.003.001
RADAR
- - -
*: Do not change this setting.
SELECT
SOURCE
EDIT
RETURN
Select source menu
3. Use the cursor pad t o select RADAR SOURCE and press the EDIT key.
RADAR SOURCE
1-14
RADAR
- - -
Radar source
Radar source and sounder source windows
4. Use the cursor pad and [ENTER] knob to enter source host name: ◄ or ► to
select position and rotate the [ENTER] knob to select character.
5. Press the [ E NTER] soft key or [ENTER] knob.
6. Confirm that t he correct host name is entered.
7. Press the [DISP] key to finish.
8. Turn the power off and on again.
Note: Sources names are determined at installation. For example, the source
names for radars in a two radar system might be “RADAR” and
“RADAR1”.
Page 29
1.7 Data Boxes
Data boxes, providing navigation data, may be shown on any full-screen display.
Up to six data boxes (two in case of large characters) may be shown, and the
default data boxes are position (in latitude and longitude), course over ground,
speed over ground, trip log and cursor position. The user may choose which
data to display, where to locate it, and show or hide it as desired. In addition,
data boxes may be set independently for each display mode (radar, plotter,
sounder). For how to select data for the data boxes, see paragraph “5.5 Data
Boxes Setup”.
1. OPERATIONAL OVERVIEW
.125nm
SP
.250/ 319.9
M
°
H-UP
MARK
ENTRY
MODE
NTH UP
NAV
POS
TRIP LOG
177
POSITION
°
47
58.535'N
°
122
36.496'W
nm
COG
323.6
°
M
SOG
D.BOX
ON /OFF
20.0
350.4
0.000 nm
kt
°
Data boxes
Plotter display, showing data boxes
1.7.1 Showing, hiding data boxes with soft key
D. BOX ON/OFF (EBL/VRM data box, cursor data
Radar: ZOOM & D. BOX
→
box also shown/hidden)
Plotter: D. BOX ON/OFF
D. BOX ON/OFF
Sounder: AUTO/D. BOX
→
1.7.2 Rearranging data boxes
M
You may select the location for data boxes as follows:
1. Using the cursor pad, move the cursor to the data box you wish to move. As
the cursor enters the box it changes to a hand. Push the [ENTER] knob, and
the hand changes to a fist, meaning the box is correctly selected.
2. Use the cursor pad to drag the data box to the location desired and push the
[ENTER] knob.
1.7.3 Temporarily erasing a data box
You may temporarily erase a data box. Use the cursor pad to place the cursor
inside the data box you wish to erase and press the [CLEAR] key. To redisplay
the box, press the ZOOM & D.BOX soft key D.BOX soft key to display it.
1-15
Page 30
1. OPERATIONAL OVERVIEW
1.8 Function Keys
The function keys provide for one-touch call up of a desired function. The default
function key settings are as shown in the table below.
Default Setting, Key Label Function
Key
Radar Plotter Echosounder
#1 Heading line on/off,
HL
#2 Rings on/off, RNG Edit mar k/line, EML Clutter, CLT
#3 Echo trail, TRL Ruler, RUL Signal level, SLV
#4 Offcenter, SFT Add new waypoint,
#5 Radar source, RSR Waypoint
1.8.1 Executing a function
1. Press the [ HIDE/SHOW] key to replace the preset soft key labels with the
function key labels.
.125nm
SP
.250/ 319.9
H-UP
°M
TARGET
H
L
R
N
G
T
R
L
S
F
T
R
S
R
Function
keys
Track on/off, TRK TLL output, TLL
Noise limiter, NL
ADD
Picture advance, PA
alphanumeric list,
ALP
34° 22. 3456'N 359.9°M
080° 22. 3456'E
19.9 kt 99.9 nm
TRIP
NU
16.0nm
T
R
K
E
M
L
002WP
FISH
BRIDGE
R
U
A
L
p
L
A
D
D
Function
keys
1-16
359.9°R
+
0.24nm
Radar
Plotter
Function keys
2. Press function key desired.
Note: Function keys can be individually programmed f or the radar, plotter and
sounder displays. For further details see the following:
Radar: paragraph 5.2.3
Plotter: paragraph 5.3.2
Sounder: paragraph 5.9.4
Page 31

1.9 Simulation Display
The simulation display, for use by service technicians for demonstration
purposes, provides simulated operation to help acquaint you with the many
features your unit has to offer. It allows you to view and control a simulated
plotter, radar and sounder picture, without position-fixing equipment, network
radar or a network sounder. Most controls are operative, thus you may practice
setting destination, enter waypoints, measure range and bearing to a target, etc.
The simulation icon (
To start the simulation display;
1. Press the [MENU] key.
2. Press the SYSTEM CONFIGURATION, SYSTEM SETUP and SIMULATION
SETUP soft keys in that order.
S
I
M
) appears when any simulation mode is active.
RADAR
LIVE
PLOTTER
LIVE
SOUNDER
LIVE
SPEED
00.0kt
COURSE
000.0°
LATITUDE
45°35.000’N
LONGITUDE
123°00.000’W
START DATE & TIME
00:00 01.APR.01
RADAR SIMULATION DATA
NO
1. OPERATIONAL OVERVIEW
SIM
SETUP
EDIT
RETURN
Simulation setup menu
2. Follow appropriate procedure shown below.
Radar
Internally generated echoes
1. Select RADAR, then press the EDIT soft key.
RADAR
▲
¡
SIMULATION 1
¡
SIMULATION 2
¤
LIVE
▼
2. Select SI MULATION 1 and press the [ENTER] knob.
3. Press the [MENU] key to close the menu.
1-17
Page 32

1. OPERATIONAL OVERVIEW
Antenna unit-generated echoes
1. Select RADAR SIMULATION DATA, then press the EDIT soft key.
2. Select YES and push the [ENTER] knob to erase simulation data and get
new data. The message “Now getting demo data. Do not turn off display
unit.” appears while the unit is receiving radar data.
Note: If the network radar could not be found “Radar source is not found.
Cannot get demo data.” appears. Wait one minute aft er the message
disappears. Actual time may be longer depending on the system
configuration. And if the radar is not active, the message “Radar is not
active. Cannot get demo data.” is displayed. Check that the radar is
plugged in and its signal cable is firmly fast ened.
3. Select RADAR, then press the EDIT soft key.
4. Select SIMULATION 2, then press the [ENTER] knob.
5. Press the [MENU] key to close the menu.
Plotter
1. Select PLOTTER, then press the EDIT soft key.
PLOTTER
▲
¡
¡
SIMULATION
¤
LIVE
▼
2. Select SI MULATION, then press the [ENTER] knob.
3. Select SPEED and press t he EDIT soft key.
4. Enter speed (set ting range, 0-99 kt, default speed, 0 kt) with the
alphanumeric keys and push the [ENTER] knob.
5. Select CO URSE and press the EDIT key.
6. Select “8 FIGURE” to trace the simulated ship’s track in a figure-eight course,
or enter your own course at DIRECTION. Use the trackball to select digit and
enter value with the alphanumeric keys.
7. Press the ENTER soft key.
8. Select LATITUDE and press the EDIT soft key.
N-85°S, default setting, 45°35.000’N) and
9. Enter lat itude (setting range, 85
°
push the [ENTER] knob.
10. Select LONGITUDE and press the EDIT soft key.
E-180°W, default setting, 125°00.000’W)
11. Enter longitude (setting range, 180
°
and push the [ENTER] knob.
12. Select START DATE & TIME and push the EDIT soft key.
13. Enter start date and time and push the [ E NTER] knob.
14. Press the [MENU] key to close the menu.
1-18
Page 33

1. OPERATIONAL OVERVIEW
Sounder
1. Select SOUNDER, then press the EDIT soft key.
SOUNDER
▲
¡
SIMULATION 1
¡
SIMULATION 2
¤
LIVE
▼
2. Select SIMULATION 1 (internally generated echoes) or SIMULATION 2
(network sounder-generated echoes), then press the [ENTER] knob.
Note: The depth, shift, bottom-zoom, bottom-lock and bottom discrimination
displays cannot be shown at SIMULATION 1 mode.
3. Press the [MENU] key to close the menu.
1-19
Page 34

1. OPERATIONAL OVERVIEW
This page is intentionally left blank.
1-20
Page 35

2. RADAR OPERATION
This chapter covers radar operation, including the ARP (Automatic Plot ter)
function. ARP requires connection of MODEL1833/1833C series net work radar
equipped with the ARP circuit board.
2.1 Radar Display
Range/
range ring
interval
Presentation
mode
Alarm icon
Battery icon
Zoom area
Guard zone 1
Cursor
Pulselength
.125nm
.250
. / 319.9
SP
Heading
M: Magnetic
T: True
°M
H-UP
Heading line
North marker
TRAIL 30m
02m30s
G1 IN
G2 OUT
ES L
EAV L
IR L
Trail time
Trail elapsed time
Guard zone 1
Guard zone 2
Echo stretch
Echo averaging*
Interference rejector
Guard zone 2
VRM2
EBL1
VRM1
EBL2
Range ring
Own ship vector*
(ARP-equipped model,
true vector mode)
Zoom
window
EBL1 range
VRM1 range
EBL1
27.0°R
VRM1
0 .158nm
EBL2
327.1°R
VRM2
0 .225nm
EBL2 bearing, VRM2 range
359.9°R
0.18nm
Radar display
* = Radar source
Model 1833/1833C
series radar
Cursor range
and bearing
(Cursor position may
also be shown, in
L/L or Loran C TD.)
2-1
Page 36

2. RADAR OPERATION
2.2 Transmitting, Stand-by
1. Turn the power on. The products information appears and is then followed by
the radar screen. You can display the radar screen at once by pressing the
any key.
2. Press the [POWER/BRILL] key momentarily.
3. Press the RADAR STBY soft key to highlight TX on its label.
4. When the radar picture is not required, but you want to keep it in a state of
readiness, press the [POWER/BRILL] key momentarily followed by RADAR
TX soft key.
5. Press the RETURN soft key to finish.
2.3 Tuning
The radar receiver can be tuned automatically or manually, and the default
tuning method is automatic. To adj ust manually or switch to automatic tuning, do
the following:
1. Press the [MENU] key to display the main m enu.
2. Press the RADAR DISPLAY SETUP soft key.
3. Select TUNING and press the EDIT soft key.
TUNING
¤
AUTO
¡
MAN
4. Choose MAN or AUTO as appropriate.
5. For manual tuning, adjust the [ENTER] knob until the tuning bar is at its
longest position.
6. Press the RETURN soft key.
7. Press the [MENU] key to close the menu.
Note: If the auto setting does not provide satisfactory tuning, see the installation
manual for how to adjust tuning.
2.4 Adjusting the Gain
The [GAIN] key adjusts the sensitivity of the radar receiver. It works in a manner
similar to the volume control of a broadcast receiver, which amplifies received
signals.
The proper setting is such that the background noise is just visible on the screen.
If your gain setting is too low, weak echoes may be missed. On the other hand
excessive gain yields too much background noise; strong targets may be missed
because of the poor contrast between desired echoes and the background noise
on the display.
Tuning bar
Tuning window
2-2
Page 37

2. RADAR OPERATION
To adjust the receiver gain, transmit on long range, and then do the following:
1. Press the [ GAIN] key. The last-used “adjustment window” is displayed. In the
example below, the gain sensitivity adjustment is shown.
Item selected for adjustment is highlighted.
.125nm
.250/ 319.9
SP
H-UP
GAIN SENSITIVITY
AUTO ROUGH
¤
¡
AUTO MODERATE
¡
AUTO CALM
¡
MAN
0
M
°
GAIN
ADJUST
GAIN
A/C
SEA
A/C
RAIN
FTC
RETURN
359.9°R
+
0.24nm
.125nm
.250/ 319.9
SP
H-UP
GAIN SENSITIVITY
AUTO ROUGH
¤
¡
AUTO MODERATE
¡
AUTO CALM
¡
MAN
0
M
°
GAIN
ADJUST
GAIN
A/C
SEA
A/C
RAIN
A/C AT
ON/OFF
RETURN
359.9°R
+
0.24nm
MODEL 1722 series MODEL 1833/C series
Gain adjustment soft keys
2. If the gain sensitivity window is not displayed, press the GAIN soft key to
show it.
GAIN SENSITIVITY
¤
AUTO ROUGH
¡
AUTO MODERATE
¡
AUTO CALM
¡
MAN
0
Gain sensitivity window
3. Press ▲ or ▼ to select AUTO ROUGH, AUTO MODERATE, AUTO CALM,
or MAN (manual) as appropriate. Select an AUTO option according to the
sea state.
4. For manual adjustment, rotate the [ENTER] knob to adjust. The range of
adjustment is 0-100.
5. Press the [GAIN] key on the front panel or the RETURN soft key to finish.
2-3
Page 38

2. RADAR OPERATION
2.5 Reducing Sea Clutter
2.5.1 How the A/C SEA works
Echoes from waves can be troublesome, covering the cent ral part of the display
with random signals known as “sea clutter”. The higher the waves and the higher
the antenna is above the water, the further the clutter will extend. Sea clutter
may affect radar performance because real targets are sometimes hidden by the
echoes of small waves. (See the left-hand figure in the figure below.) When sea
clutter masks the picture, adjust the A/C SEA to reduce the clutter.
The A/C SEA reduces the amplif icat ion of echoes at short ranges (where clutter
is the greatest) and progressively increases am plification as the rang e increases,
so amplification will be normal at those ranges where there is no sea clutter.
Sea clutter at
screen center
2.5.2 Adjusting A/C SEA
A/C SEA should be adjusted so that the clutter is broken up into small dots, and
small targets becom e distinguishable.
1. Press the [ GAIN] key.
2. Press the A/ C SEA soft key to show the A/C SEA setting window.
A/C SEA
¡
AUTO ROUGH
¡
AUTO MODERATE
¡
AUTO CALM
¤
MAN
Model 1722/C series radar
3. When the radar source is the Model 1722/C series radar, press ▲ or ▼ to
select AUTO ROUGH, AUTO MODERATE, AUTO CALM, or MAN (manual)
as appropriate. Select an AUTO option according to sea state.
4. For manual adjustment, rotate the [ENTER] knob to adj ust while observing
radar echoes. The range of adjustment is 0-100. Do not overadjust the A/C
SEA – weak target echoes may be missed.
A/C SEA adjusted;
sea clutter suppressed
Effect of A/C SEA
0
Model 1833/C series radar
A/C SEA setting window
A/C SEA
0
2-4
Page 39

5. When the radar source is the Model 1833/C series radar, A/C SEA and
A/C RAIN can be automatically adjusted. Press the A/C AT soft key to select
ON or OFF as appropriate. When turned on, it overrides A/C SEA and A/C
RAIN settings.
6. Press the [GAIN] key on the front panel or RETURN soft key to finish.
2.6 Reducing Precipitation Clutter
The vertical beamwidth of the antenna is designed to see surface targets even
when the ship is rolling. However, by this design the unit will also detect rain
clutter (rain, snow, hail, etc.) in the same manner as normal target s. Precipitation
clutter shows as random dots on the screen.
2.6.1 Adjusting the A/C RAIN
When echoes from precipitation mask solid targets, adjust the A/C RAIN. This
split up these unwanted echoes into a speckled pattern, making recognition of
solid targets easier.
1. Press the [GAIN] key.
2. Press the A/ C RAIN soft key to show the A/C RAIN window.
2. RADAR OPERATION
A/C RAIN
0
A/C RAIN setting window
3. Rotat e the [ENTER] knob to adjust the A/C RAIN affect. The current level is
shown on the A/C RAIN level bar in the A/C RAIN window, and the range of
adjustment is 0 to 100. Do not overadjust the A/C RAIN – weak target echoes
may be missed.
4. Press the [GAIN] key on the front panel or RETURN soft key to finish.
2-5
Page 40

2. RADAR OPERATION
2.6.2 Adjusting the FTC
To suppress rain clutter from heavy storms or scattered rain clutter, adjust the
FTC. The FTC splits up these unwanted echoes into a speckled patt ern, making
recognition of solid targets easier.
Note: In addition to reducing clutter, the FTC can be used in fine weather to
clarify the picture when navigating in confined waters. However, with the
circuit active the receiver is less sensitive. Therefore, turn off t he FTC, by
setting it for “0”, when its function is not required.
FTC is available when the radar source is the MODEL1722 series radar.
1. Press the [ GAIN] key.
2. Press the FTC soft key to show the FTC window.
FTC
0
FTC setting window
3. Rotate the [ENTER] knob to adjust. The range of adjustm ent is 0-100. Do not
overadjust the FTC – weak target echoes may be m issed.
4. Press the [GAIN] key on the front panel or RETURN soft key to finish.
2-6
Page 41
2.7 Range Scale
The range setting determines the size of the area (in nautical miles) that will
appear on your display. in addition, the range setting will also automatically
adjust the range ring interval so that accurate range measurements may be
made while operating on any range setting.
The range, range ring interval and pulselength appear at the top left-hand corner
of the display.
Press the [RANGE (+ or -)] key to change the range scale.
2. RADAR OPERATION
Range scales (nm, sm)
Range 0.125 0.25 0.5 0.75 1 1.5 2 3 4 6 8 12 16 24 36 48 64 72
Ring
Interval
No. of
Rings
0.0625 0.125 0.125 0.25 0.25 0.5 0.5 1 1 2 2 3 4 6 12 12 16 18
2 2 4 3 4 3 4 3 4 3 4 4 4 4 3 4 4 4
Range scales (km)
Range 0.25 0.5 0.75 1 1.5 2 3 4 6 8 12 16 24 36 48 64 72
Ring
Interval
No. of
Rings
0.125 0.25 0.25 0.25 0.5 0.5 1 1 2 2 3 4 6 12 12 16 18
2 2 3 4 3 4 3 4 3 4 4 4 4 3 4 4 4
Note 1: Maximum range depends on the network radar as shown below.
Model 1722, 1722C: 24 nm
Model 1732, 1732C, 1742, 1742C, 1752, 1752C, 1833, 1833C: 36 nm
Model 1762, 1762C, 1933, 1933C: 48 nm
Model 1943, 1943C: 64 nm
Model 1953C: 72 nm
Note 2: You may choose which ranges to use from the RADAR RANGE SETUP
menu. For details see paragraph 5.2.2.
2-7
Page 42

2. RADAR OPERATION
2.8 Pulselength
The pulselength in use is displayed at the upper left corner of the display.
Appropriate pulselengths are preset to individual range scales. Therefore, you
are not usually required to select them. If you are not satisfied with the current
pulselength setting, however, it is possible to change it for the 1.5 and 3 nm (sm)
ranges (3 and 6 kilometer ranges) as below. Generally, select a longer pulse for
longer detection range and shorter pulse for better range discrimination.
1.5 nm, 1.5 sm, 3 km: Short pulse, medium pulse
3 nm, 3 sm, 6 km: Middle pulse, long pulse
1. Press HIDE/SHOW to show soft the radar soft keys.
2. Set the range to 1.5 or 3 nm , whichever you want to set.
3. Press the SIGNAL PROC. soft key.
.500nm
SP
1.5/ 319.9
M
°
H-UP
SIGNAL
PROCESS
I. REJ
LOW
E. AVG
OFF
PULSE
SHORT
E. STR
LOW
RETURN
359.9°R
+
1.40nm
Shown when radar
source is the Model
1833/C series
network radar. Not
shown otherwise.
Signal process soft keys
3. Press the PULSE soft key to select the pulselength setting. SHORT or
MEDIUM for 1.5 nm, 1.5 sm, 3 km and MEDIUM or LONG for 3 nm, 3 sm, 6
km.
4. Press the RET URN soft key to finish.
2-8
Page 43
2.9 Presentation Mode
This unit provides four radar presentation modes: head-up, course-up, north-up
and true motion.
Heading data is required for modes other t han head-up. (When you use the
network radar, input the radar source.)
2.9.1 Selecting a presentation mode
1. Press HIDE/SHOW to show soft the radar soft keys.
2. Press the RADAR DISPLY soft key to show the RADAR DISPLAY soft keys.
2. RADAR OPERATION
Current
mode
setting
.125nm
SP
.250/ 319.9
H-UP
MODEL1722C series MODEL1722 series
M
°
RADAR
DISPLAY
MODE
HD UP
SHIFT
RINGS
MED
HL
OFF
RETURN
359.9°R
+
0.24nm
.125nm
.250/ 319.9
SP
H-UP
M
°
359.9°R
+
0.24nm
RADAR
DISPLAY
MODE
HD UP
SHIFT
RINGS
ON /OFF
HL
OFF
RETURN
Radar display soft keys
3. Press the MODE soft key. Each pressing of the key changes the presentation
mode and the presentation mode indication in the sequence of North-up,
True Motion, Head-up, and Course-up.
Mode name Indicator on display Soft key label
North up N-UP NTH UP
True motion TR-M TRUE M
Head up H-UP HD UP
Course up CSE UP CSE UP
4. Press the RET URN soft key to finish.
Note: When heading data is lost, the presentation mode automatically goes to
head-up, the heading indication at the screen top shows “- - -.-°” and the
audio alarm sounds. Press the [ALARM] key to acknowledge the alarm.
The message “HEADING DATA MISSING” appears. Rest ore compass
signal to show heading indication. Use the MODE soft key to select
presentation mode if necessary. The audio alarm may be silenced with the
[CLEAR] key.
2-9
Page 44

2. RADAR OPERATION
2.9.2 Description of presentation modes
Head-up
A display without azimuth stabilization in which the line connecting the center
with the top of the display indicates own ship’s heading. The targets are painted
at their measured distances and in their directions relat ive to own ship’s heading.
The short line on the bearing scale is the north marker.
North Marker
Heading Line
Head-up presentation mode
Course-up
The radar picture is stabilized and displayed with the currently selected course at
the top of the screen. As you change heading, the ship’s heading marker moves.
If you select a new course, the picture resets to display the new course at the
top of the display.
North Marker
Heading Line
2-10
Course-up presentation mode
Page 45

2. RADAR OPERATION
North-up
In the north-up mode, target s are painted at their measured distances and in
their true (compass) directions from own ship. North is maintained at the top of
the screen. The heading line changes its direction according to the ship’s
heading.
North
Heading Line
North-up presentation mode
True motion
Fixed radar targets maintain a constant posit ion on the screen, while your own
ship moves across the radar image at the correct speed and heading. A map-like
image is displayed, with all moving vessels traveling in true perspective to each
other and to fixed landmasses. As your ship’s position approaches the edge of
the screen, the radar display is automatically reset to reveal the area ahead of
your ship. You can m anually reset your ship’s position at any time by pressing
the RADAR DISPLAY soft key followed by the SHIFT soft key.
North
Heading Line
True motion presentation mode
2-11
Page 46

2. RADAR OPERATION
2.10 Measuring the Range
You can measure the range to a radar target three ways: by the range rings, by
the cursor, and by the VRM (Variable Range Marker).
2.10.1 Measuring range by range rings
Count the number of rings between the center of the display and the target.
Check the range ring interval and judge the distance of the echo from the inner
edge of the nearest ring.
To turn the range rings on, do the following:
1. If not displayed, press the [HIDE/SHOW] key to show the radar soft keys.
2. Press the RADAR DISPLY soft key.
.125nm
SP
.250/ 319.9
H-UP
MODEL1722C series MODEL1722 series
M
°
RADAR
DISPLAY
MODE
HD UP
SHIFT
RINGS
MED
HL
OFF
RETURN
359.9°R
+
0.24nm
.125nm
.250/ 319.9
SP
H-UP
M
°
359.9°R
+
0.24nm
RADAR
DISPLAY
MODE
HD UP
SHIFT
RINGS
ON /OFF
HL
OFF
RETURN
Radar display soft keys
4. Press the RINGS soft key to select ON (MODEL1722 series) or desired
brilliance (MODEL1722C series) among LOW, MED and HIGH.
To disappear rings, select OFF.
4. Press the RET URN soft key to finish.
2-12
Page 47

2.10.2 Measuring range by cursor
Operate the cursor pad to place the cursor intersection on the inside edge of the
radar target. The range to the target, as well as the bearing, appears to the right
of “+” at the bottom of the display.
.125nm
SP
.250/ 319.9
H-UP
Cursor
Target
M
°
2. RADAR OPERATION
SIGNAL
PROC.
RADAR
DISPLY
NAV
FUNC
TARGET
ZOOM &
D. BOX
4.3°R
+
0.240nm
Bearing and range from own
ship to cursor position
How to measure range and bearing to a target with the cursor
2-13
Page 48
2. RADAR OPERATION
2.10.3 Measuring range by VRM
1. Press the [EBL/VRM] key to display the EBL/VRM soft keys.
.125nm
SP
.250/ 319.9
H-UP
M
°
EBL
VRM
EBL1
ON
VRM1
ON
OFFSET
EBL2
ON
VRM2
ON
359.9°R
+
0.240nm
EBL/VRM soft keys
2. Press the VRM1 ON (dotted ring VRM) or VRM2 ON (dashed ring VRM) soft
key to select the desired VRM. The selected VRM’s indication, at the bottom
of the screen, is highlighted.
3. Rotate the [ENTER] knob the place the VRM on the inside edge of a radar
target. Read the VRM indication to find range to t he target.
4. You may hide the EBL/VRM soft keys by pressing the [EBL/VRM] key.
VRM1
(Dotted line)
VRM2
(Dashed line)
VRM1 range
.125nm
SP
.250/ 319.9
H-UP
EBL1
---.-°R
VRM1
0.119nm
EBL2
---.-°R
VRM2
0.242nm
M
°
EBL
VRM
EBL1
ON
VRM1
ON
OFFSET
EBL2
ON
VRM2
ON
359.9°R
+
0.240nm
Active marker is highlighted.
VRM2 range
How to measure range with the VRM
2-14
Page 49

2.10.4 Erasing a VRM, VRM indication
Press appropriate VRM soft key and press the [CLEAR] key. The VRM is erased,
and its indication becomes blank.
2.10.5 Erasing EBL/VRM data boxes
Press the EBL or VRM soft key associated with the EBL/VRM data box you wish
to erase. Press the [CLEAR] key once or twice to erase the data box.
2.10.6 Hidi ng EBL/VRM data boxes
Press the ZOOM & D. BOX and D. BOX ON/OFF soft keys to show or hide the
EBL/VRM data boxes.
2.10.7 Moving EBL/VRM data boxes
When an EBL/V RM data box is obscuring a target that you need to see, you can
move it to another location as shown below. This cannot be done when the
EBL/VRM soft keys are shown.
1. Press the [EBL/VRM] key to erase the EBL/VRM soft keys if shown.
2. Using the cursor pad, place the cursor inside the data box you wish to move.
As the cursor enters the box it changes to a “hand.” Push the [ENTER] knob,
and the hand changes to a fist, meaning the data box is correctly selected.
3. Use the cursor pad to drag the data box to the location desired and push the
[ENTER] knob.
2. RADAR OPERATION
2.11 Measuring the Bearing
There are two ways to measure the bearing to a target: by the cursor, and by the
EBL (Electronic bearing Line).
2.11.1 Measuring bearing by cursor
Use the cursor pad to locate the cursor to the center of the target The bearing to
the target appears in the range and bearing box at the bottom right-hand corner
on the screen, next to the “+” mark.
2.11.2 Measuring bearing by EBL
1. Press the [ EBL/VRM] key.
2. Press the EBL1 O N (dotted line EBL) or EBL2 ON (dashed line EBL) soft key
to select the desired EBL. The selected EBL’s indication, at the bottom of the
screen, is highlighted.
3. Rotat e the [ENTER] knob to bisect the radar target with the EBL. Read the
EBL indication to find the bearing to the target
4. You may hide the EBL/VRM soft keys by pressing the [EBL/VRM] key.
2-15
Page 50
2. RADAR OPERATION
.125nm
SP
.250/ 319.9
H-UP
M
°
EBL
VRM
EBL1
(Dotted line)
EBL2
(Dashed line)
EBL2 bearing
EBL1 bearing
R: Relative
T: True
EBL1
330.1°R
VRM1
-.---nm
EBL2
234.1°R
VRM2
-.---nm
How to measure bearing with the EBL
Note: Bearing can be shown Relative to ship’s heading (relative) or in reference
to North (True). This setting may be changed by changing the EBL
REFERENCE setting, which is in the RADAR DISPLAY SETUP menu.
See the paragraph “5.2.1 Radar display setup.”
2.11.3 Erasing an EBL, EBL indication
EBL1
ON
VRM1
ON
OFFSET
EBL2
ON
VRM2
ON
359.9°R
+
0.24nm
Active marker is highlighted.
Press appropriate EBL soft key and press the [CLEAR] key. The EBL is erased
and its indication becomes blank.
2.11.4 Erasing EBL/VRM data boxes
Press the EBL or VRM soft key associated with the EBL/VRM data box you wish
to erase. Press the [CLEAR] key once or twice to erase the data box.
2.11.5 Hidi ng EBL/VRM data boxes
Press the ZOOM & D. BOX and D. BOX ON/OFF soft keys to show or hide the
EBL/VRM data boxes.
2.11.6 Moving EBL/VRM data boxes
When an EBL/V RM data box is obscuring a target that you need to see, you can
move it to another location as shown below. This cannot be done when the
EBL/VRM soft keys are shown.
1. Press the [EBL/VRM] key to erase the EBL/VRM soft keys if appears.
2. Using the cursor pad, place the cursor inside the data box you wish to move.
As the cursor enters the box it changes to a “hand.” Push the [ENTER] knob,
and the hand changes to a fist, meaning the data box is correctly selected.
3. Use the cursor pad to drag the data box to the location desired and push the
[ENTER] knob.
2-16
Page 51

2. RADAR OPERATION
2.12 Erasing the Heading Line, North Marker
The heading line indicates the ship's heading in all presentation modes. The
heading line is a line from the own ship position to the outer edge of the radar
display area and appears at zero degrees on the bearing scale in head-up
mode; it changes its orientation depending on the ship orientation in north-up,
course-up and true motion modes.
The north marker appears as a short dashed line. In t he head-up and course-up
modes the north m arker moves around the bearing scale as the ship’s heading
moves.
To tem porarily erase the heading line and north marker, press the RADAR
DISPLY soft key followed by the HL OFF soft key. Release the key to redisplay
the markers.
2.13 Reducing Noise
Noise, appearing on the displays as random “speckles,” can be reduced as
follows:
1. Press the [MENU] key to open the menu.
2. Press the RADAR DISPLAY SETUP soft key.
3. Select NOISE REJECTION and press the EDIT soft key.
4. Select OFF, HIGH or LOW as appropriate.
5. Press the ENTER soft key or the [ENTER] knob.
6. Press the [MENU] key to close the menu.
2-17
Page 52
2. RADAR OPERATION
2.14 Reducing Radar Interference
Radar interference may occur when near another shipborne radar that is
operating in the same frequency band as your radar. Its on-screen appearance
looks like many bright dots either scattered at random or in the form of dotted
lines extending from the center to the edge of the display. Interference effects
are distinguishable from normal echoes because they do not appear in the same
place on successive rotations of the scanner.
Be sure to turn off the interference rejection circuit when no interference exists –
weak targets may be missed.
Radar interference
1. If not displayed, press the [HIDE/SHOW] key to show the radar soft keys.
2. Press the SIGNAL PROC. soft key.
.500nm
SP
1.5/ 319.9
M
°
H-UP
SIGNAL
PROCESS
I. REJ
LOW
E. AVG
OFF
PULSE
SHORT
E. STR
LOW
RETURN
359.9°R
+
0.240nm
Shown when radar
source is the Model
1833/C series
network radar. Not
shown otherwise.
2-18
Signal process soft keys
3. Press the I . REJ soft key to choose the interference rejection level desired;
LOW, MED, HIGH or OFF.
4. Press the RET URN soft key to finish.
The display shows IR L (Low), IR M (Medium) or IR H (High) when the
interference rejecter is on.
Page 53

2.15 Zoom
The zoom feature allows you to double the size of the area select ed with the
zoom circle, which appears at the bott om right - or left -hand corner on t he disp lay.
The zoom feature is available on any range but is inoperative in true motion and
when the display is shifted.
2.15.1 Zooming i n on r adar targets
1. If not displayed, press the [HIDE/SHOW] key to show the radar soft keys.
2. Press the ZOOM & D. BOX soft key to show ZOOM & D. BOX soft keys.
3. Press the ZOOM ON/OFF soft key to select ON. A solid circle, called the
“zoom circle,” appears on the display.
4. Use the cursor pad to set the cursor where you want to zoom.
5. Press the CURSO R FLOAT soft key to fix the zoom cursor position. (The
solid circle changes to a dashed one.)
6. To release the cursor, press the CURSOR FLOAT soft key. (The dashed
circle changes to a solid one.) Relocate the zoom cursor, then press the
CURSOR LOCK key.
7. To quit the zoom function, press the ZOOM ON/OFF soft key to select OFF.
2. RADAR OPERATION
.125nm
SP
.250/ 319.9
H-UP
Zoom circle
Zoom window
2.15.2 Zooming ARP, TTM targets
You may zoom in on TTM targets coming into t he display. TTM targets can come
from a NAVNET connected RADAR, or from other ARP RADAR that is
outputting the TTM message. Not e: TTM stands for Tracked Target Message. It
is a NMEA 0183 data sentence that is an available output from some ARP
capable RADAR. TTM target numbers must be displayed to zoom in on tracked
targets. This can be done by enabling the target ID number option in the ARP
setup menu.
M
°
001.0°R
+
0.160nm
Zoom
ZOOM &
D. BOX
ZOOM
ON /OFF
CURSOR
FLOAT
ARPA
TGT ZM
D. BOX
ON/OFF
RETURN
Requires optional
ARP Board in
1833/1833C series
network radar.
Not shown when
radar source is
otherwise.
2-19
Page 54

2. RADAR OPERATION
1. If not displayed, press the [HIDE/SHOW] key to show the radar soft keys.
2. Press the ZOOM/D.BOX soft key to show ZOOM & D.BOX soft keys.
3. Press the ZOOM soft key to select ZOOM ON.
4. Press the ARP TGT ZM soft key.
5. Use the [ENTER] knob to select number (1-10) and then push the [ENTER]
knob. If the target does not exist several beep sounds and the zoom function
is cancelled.
To cancel, press the CURSOR LOCK soft key.
Note: The zoom window blends in with the background when the background
color for the radar picture is white. If the window is difficult to see change the
background color.
SELECT TARGET NO.
▲
1
▼
Target no. selection window
2.16 Shifting the Picture
Own ship position, or sweep origin, can be displaced manually or automatically
to expand the view field without switching to a larger scale.
2.16.1 Manual shift
The sweep origin can be shifted in any presentation mode to a point specified by
the cursor by up to 60% of the range in use in any direction.
1. Locate the cursor anywhere within the effective radius of the display.
2. If not displayed, press the [HIDE/SHOW] key to show the radar soft keys.
3. Press the RADAR DISPLY soft key.
4. Press the SHIFT soft key.
5. Press the MANUAL soft key to shift. The heading line shifts to the cursor
location. SHIFT appears at right-hand corner of the display.
6. Press the RETURN soft key to finish.
7. To cancel shift , press the RADAR DISPLY, SHIFT and OFF soft keys in that
order.
2-20
Page 55
2. RADAR OPERATION
SHIFT
Cursor
Place cursor
where desired.
2.16.2 Automatic shift
In the head-up mode, the amount of shift is automatically calculated with speed.
The maximum shift amount is limited to 60% of t he range in use. For example, if
you set the shift speed setting for 15 knots and the ship is running at 10 knots,
the amount of shift will be 40%. The formula for determining shift amount is as
shown below.
Ship's speed
Shift speed setting
Setting automatic shift maximum speed
1. If not displayed, press the [HIDE/SHOW] key to show the radar soft keys.
2. Press the RADAR DI SPLY soft key.
3. Press the SHIFT soft key to show the shift soft keys.
4. Press the AUTO S.SPD soft key to display the auto ship speed setting
window.
X 0.6 = Amount of shift(%)
Press the MANUAL soft key.
Shifting the picture manually
AUTO SHIP SPEED
15
Auto ship speed setting window
5. Adj ust the cursor pad or [ENTER] knob to set the m aximum speed of your
vessel and then push the [ENTER] knob or the ENTER sof t key to set. The
setting range is 1-999 kt and the default setting is 15 kt.
Automatic shift
Press the AUTO key to automatically shift the sweep origin. To cancel shift,
press the RADAR DISPLAY, SHIFT and OFF soft keys.
2-21
Page 56

2. RADAR OPERATION
2.17 Using the Offset EBL
The offset EBL can be used to predict a potential collision course, and can also
be used to measure the range and bearing between two targets.
2.17.1 Predicting a collision course
The procedure below may be used to check if a radar target is on a collision
course with your vessel.
1. Press the [EBL/VRM] key to show the EBL/VRM soft keys.
2. Press the EBL1 ON soft key to turn on the EBL1.
3. Press the OFFSET soft key. The origin of EBL1 moves to the cursor position
and an “X” appears at the cursor position.
4. Use the cursor pad to place the cursor on the radar target which looks like it
might be on a collision course with own ship.
5. Push the [ENTER] knob to fix the origin position.
6. After waiting for a few minutes (at least three minutes), rotate the [ENTER]
knob so the EBL bisects the target at the new position. If t he target tracks
along the EBL towards the center of the display (your ship’s position), the
target may be on a collision course.
7. To cancel the offset EBL, press the O FFSET soft key.
Target tracked
here
Initial target
position
.125nm
SP
.250/ 319.9
H-UP
EBL1
45.0°R
VRM1
-.---nm
M
°
EBL
VRM
EBL1
ON
VRM1
ON
OFFSET
EBL2
ON
VRM2
ON
359.9°R
+
.0.240nm
Predicting collision course with the offset EBL
2-22
Page 57

2. RADAR OPERATION
2.17.2 Measuring range & bearing between two targets
The procedure which follows shows how to measure the range and bearing
between two targets, using the targets “A” and “B” in the figure below as an
example.
1. Operat e the cursor pad to place the cursor on the target “A”.
2. Press the [EBL/VRM] key to show the EBL/VRM soft keys.
3. Press the EBL1 O N soft key to turn on the EBL1.
4. Press the O FFSET soft key. The origin of EBL1 and VRM1 moves to the
cursor position, which is marked with an “X.”
5. Rotate the [ENTER] knob so the EBL bisects the target “B”.
6. Press the [ENTER] knob.
7. Press the VRM1 ON soft key and then rotate the [ENTER] knob to place t he
VRM1 on the inner edge of the target “B”.
8. Look at the indications for VRM1 and EBL1 to find the range and bearing
between the two targets.
9. To cancel the offset EBL, press the O FFSET key.
Target B
Target A
Bearing and range
between target A
and target B
.125nm
SP
.250/ 319.9
H-UP
EBL1
45.0°R
VRM1
0.125nm
M
°
EBL
VRM
EBL1
ON
VRM1
ON
OFFSET
EBL2
ON
VRM2
ON
359.9°R
+
0.24nm
Measuring range and bearing between two targets
2-23
Page 58

2. RADAR OPERATION
2.18 Echo Trails
Echo trails are simulated aft erglow of target echoes that represent their past
movements relative to own ship. This funct ion is useful for alerting you past
possible collision situations.
2.18.1 Trail time
1. If not displayed, press the [HIDE/SHOW] key to show the radar soft keys.
2. Press the TARGET soft key.
3. Press the T RAI L soft key.
Echo trail
Sample echo trails
.125nm
SP
.250/ 319.9
M
°
TRAIL
H-UP
TRAIL
ON /OFF
TRAIL
TIME
GRAD
SINGLE
HIGH
TRAIL
COLOR
RETURN
359.9°R
+
0.24nm
.125nm
SP
.250/ 319.9
M
°
H-UP
MODEL1722C series MODEL1722 series
Trail soft keys
4. Press the TRAIL TIME soft key to show the trail time window.
TRAIL
TRAIL
ON /OFF
TRAIL
TIME
BRILL
HIGH
RETURN
359.9°R
+
0.24nm
2-24
TRAIL TIME
▲
¤
15 seconds
¡
30 seconds
¡
1 minute
¡
3 minutes
¡
6 minutes
¡
15 minutes
¡
30 minutes
¡
CONTINUOUS
▼
Trail time window
Page 59

5. Use the cursor pad t o select time desired.
6. Press the ENTER soft key to finish.
2.18.2 Starting echo trails
1. If not displayed, press the [HIDE/SHOW] key to display the radar soft keys.
2. Press the TARGET and TRAIL soft keys.
3. Press the TRAIL ON/OFF to select ON.
4. Press the RET URN soft key twice to finish.
“TRAIL,” the echo trail time selected and elapsed time appear at the top
right-hand corner of the display. Then, afterglow starts extending from all targets.
Trails are restarted when the range or mode is changed, and zoom or shift is
turned on.
For continuous trails the maximum continuous trail time is 99 minutes and 59
seconds. When t he elapsed time clock counts up to that time, the elapsed time
display resets to zero and trail begins again.
To turn off echo tr ail, press the TRAIL ON/OFF soft key to select OFF at step 3 n
the above procedure.
Note: No echo trails are shown where a tx sector blanking area is set.
2.18.3 Trail brilliance (MODEL1722 series)
2. RADAR OPERATION
Trail brilliance can be selected to high or low as below.
1. If not displayed, press the [HIDE/SHOW] key to display the radar soft keys.
2. Press the TARGET and TRAIL soft keys.
3. Press the BRILL soft key to select HIGH or LO W.
4. Press the RETURN soft key twice to finish.
2.18.4 Trail gradation (MODEL1722C series)
The echo trails can be shown in single or multiple gradations. Multiple gradation
paints the trails thinner with time, like the afterglow on an analog PPI radar.
1. If not displayed, press the [HIDE/SHOW] key to display the radar soft keys.
2. Press the TARGET and TRAIL soft keys.
3. Press the G RAD soft key to select SINGLE or MULTI as appropriate.
Multitone Monotone
Multitone and monotone trails
4. Press the RET URN soft key twice to finish.
2-25
Page 60

2. RADAR OPERATION
2.18.5 Trail color (MODEL1722C series)
The MODEL1722C series may be shown echo trails in blue, yellow, green or
white.
1. If not displayed, press the [HIDE/SHOW] key to display the radar soft keys.
2. Press the TARGET, TRAIL and TRAIL CO LOR soft keys.
TRAIL COLOR
▲
¤
BLUE
¡
YELLOW
¡
GREEN
¡
WHITE
▼
Trail color window
3. Use the cursor pad t o select the color desired.
4. Press the ENTER soft key.
5. Press the RET URN soft key twice to finish.
2-26
Page 61

2.19 Echo Stretch
Normally, the reflected echoes from long range targets appear on the display as
weaker and smaller blips even though they are compensated by the radar’s
internal circuitry. The echo stretch function magnifies these small blips in all
ranges. Two types of echo stretch are available: ES LOW which stretches
echoes in bearing direction and ES HIGH which stretches them in both range
and bearing directions.
Target
Bearing
direction
2. RADAR OPERATION
Range
direction
Bearing
direction
Echo Stretch OFF
This function magnifies not only targets but also sea clutter and radar
interference. For this reason, be sure sea clutter and radar interference are
properly suppressed before activating the echo stretch.
1. If not displayed, press the [HIDE/SHOW] key to display the radar soft keys.
2. Press the SIGNAL PROC. soft key.
3. Press the E. STR soft key to select HIGH, LOW or OFF as appropriate.
4. Press the RETURN soft key to finish.
The display shows ES H (High) or ES L (Low) when the echo stretch is on.
"LOW" Echo stretch "HIGH" Echo stretch
Types of echo stretch
2-27
Page 62

2. RADAR OPERATION
2.20 Echo Averaging
The echo average feature, available with selection of a Model 1833/C series
network radar as radar source, effectively suppresses sea clutter. Echoes
received from stable targets such as ships appear on t he screen at almost the
same position during every rotation of the ant enna. On the other hand, unstable
echoes such as sea clutter appear at random positions.
To distinguish real target echoes from sea clutter, echo average performs
scan-to-scan correlation. Correlation is made by storing and averaging echo
signals over successive picture frames. If an echo is solid and stable, it is
presented in its normal intensity. Sea clutter is averaged over successive scans
resulting in the reduced brilliance, making it easier to discriminate real targets
from sea clutter.
To properly use the echo average function, it is recommended to first suppress
sea clutter with the A/C SEA control and then do the following:
1. If not displayed, press the [HIDE/SHOW] key to display the radar soft keys.
2. Press the SIGNAL PROC. soft key.
3. Press the E. AVG soft key to select desired echo averaging.
OFF: No averaging
LOW: Helps distinguish target s from sea clutter and suppresses brilliance
of unstable echoes.
MED: Distinguishes small stationary targets such as navigation buoys.
HIGH: Stably displays distant targets.
The display shows EAV L, EAV M or EAV H when echo averaging is on.
(a) Echo average OFF (b) Echo average ON
Effect of echo averaging
4. Press the RET URN soft key to finish.
2-28
Page 63

2.21 Outputting TLL Data
Target position data can be output to units of the network and shown on their
plotter screen, with the waypoint mark. This function requires position and
heading data.
1. If not displayed, press the [HIDE/SHOW] key to display the radar soft keys.
2. Operate the cursor pad to place the cursor on the target whose position you
wish to output.
3. Press the TARGET soft key.
2. RADAR OPERATION
.125nm
SP
.250/ 319.9
M
°
TARGET
H-UP
TRAIL
TLL
OUTPUT
ACQ
TARGET
INFO
RETURN
359.9°R
+
0.240nm
Shown with selection of
1833/C series network
radar equipped with ARP
function as source.
Not shown otherwise.
TARGET soft keys
4. Press the TLL OUTPUT soft key to output t arget position data.
5. Press the RET URN soft key to finish.
Note: The screen of the TLL recipient may be temporarily interrupted when
receiving TLL from another NavNet display unit. Press any key to restore
normal operation.
2-29
Page 64
2. RADAR OPERATION
2.22 Guard Alarm
The guard alarm allows the operator to set the desired range and bearing f or a
guard zone. When ships, islands, landmasses, etc. violate the guard zone, an
audio alarm sounds and the offending target blinks to call the operator’s
attention.
• The alarm should not be relied upon as
the sole means for detecting possible
collision situations.
• A/C SEA, A/C RAIN and GAIN controls
should be properly adjusted to be sure
the alarm system does not overlook
target echoes.
CAUTION
2.22.1 Setting a guard alarm zone
To set a guard alarm zone, set the radar to transmit and do the following:
1. Press the [ALARM] key.
2. Use the cursor pad to set the cursor on the top left corner (or top right corner)
of the guard zone you want to set, then press the SET GUARD1 or SET
GUARD2 soft key, depending on which guard zone you want to set.
3. Use the cursor pad to set the cursor on the bottom right corner (or top left
corner) of the guard zone area and push the [ENTER] knob.
4. Press RETURN soft key to finish.
.125nm
SP
.250/ 319.9
H-UP
1
M
°
ALARM
SET
GUARD1
SET
GUARD2
.125nm
SP
.250/ 319.9
H-UP
M
2
ALARM
GUARD 1
SET
GUARD1
ERASE
GUARD1
SET
GUARD2
°
2-30
RETURN
MOVE +CURSOR TO
ANOTHER CORNER OF
GUARD1 AND PUSH KNOB
TO SET.
317.2°R
+
0.230nm
(1) Drag cursor to top (or bottom) corner
for guard zone and press the SET
GUARD1 or SET GUARD2 soft key.
How to set a guard alarm zone
RETURN
E
NO ALARM
19.9
B
T
L
V
.125n
R
.032nm
m
M
39.9°R
+
.0.230nm
(2) Drag cursor diagonally to bottom (or top)
corner for guard zone and press the [ENTER]
knob.
Page 65

The equipment then searches f or targets inside the guard zone to determine the
guard alarm type. If a target is found inside the guard zone the guard zone type
becomes an “Outward guard alarm”, and any target exiting, the guard zone will
trigger an alarm. If no target is found the guard zone type becomes an “Inward
guard alarm”, and any targets entering the guard zone will trigger the alarm. The
guard alarm type is shown as G1(G2) IN or G1(G2) OUT.
Note 1: When the radar range is less than the guard zone range, the audio
alarm sounds and the alarm icon is displayed (red on the color model).
Press the [CLEAR] key to silence the alarm. Press the [ ALARM] key and
the message “GUARD1(2) IS OUTSI DE RADAR RANG E” appears.
Reselect appropriate range.
Note 2: If the network radar is set to standby while the guard alarm is active, the
guard alarm is cancelled. The guard alarm is redisplayed when the
radar is set to transmit again.
Note 3: If the network radar is set to standby while the radar picture is not
displayed, the alarm icon appears (red on the color m odel) and the
alarm sounds. Press the [ALARM] key and the message “STBY MODE
HAS BEEN SELECTED. GUARD/WTCHMN CANCELED.” or
“GUARD/WATCHMAN CANCELED. STBY/TX SELECTED.” appears.
2.22.2 When the alarm is violated…
2. RADAR OPERATION
Any radar target violating the guard zone will flash, the audio alarm sounds, and
the alarm icon appears (red on the color m odel). Additionally the message
“TARGET ENTERED INTO GUARD1(GUARD2)” or “TARGET LEFT FROM
GUARD1(GUARD2)” is displayed at the bottom of the screen, depending on the
guard zone type. Press the [CLEAR] key to silence the alarm.
2.22.3 Canceling the guard alarm
1. Press the [ A LARM] key to show the ALARM menu.
2. Press the ERASE GUARD1 or ERASE GUARD2 soft key as appropriate.
3. Press the RETURN soft key to finish.
2-31
Page 66
2. RADAR OPERATION
2.23 Watchman
2.23.1 How watchman works
The watchman function periodically transmits radar pulses for one minut e to
check for targets in a guard zone. If a target is found in the zone, watchman is
cancelled, the audio alarm sounds and the radar continues tr ansmitting. If no
target is found the radar goes into standby, for the number of minutes selected
on the RADAR DISPLAY SETUP menu. This feature is useful when you do not
need the radar’s function cont inuously but want to be alerted to radar targets in a
specific area. “WTCH” appears at the top left corner when Watchman is active.
Tx
ST-BY
*
Tx
ST-BY
*
1 min
Watchman
starts
5,10
or
20 min
* Beeps emitted just before radar transmits.
1 min
How watchman works
2.23.2 Turning on/ off watchman
1. If not displayed, press the [HIDE/SHOW] key to display the radar soft keys.
2. Press the NAV FUNC soft key.
3. Press the W. MAN ON/OFF soft key to select ON or OF F as appropriate.
4. Press RETURN soft key to finish.
Note: When the watchman is activated and no guard zone is active, the
message “PLEASE SET GUARD ZONE. PUSH ANY KEY TO
CONTINUE.” appears. Press any key and then set a guard zone.
2.23.3 Setting watchman stand-by interval
The watchman standby period interval, that is, the number of minutes the radar
is in standby, can be set to 5, 10 or 20 minutes as follows:
1. Press the [MENU] key.
2. Press the RADAR DISPLAY SETUP soft key.
3. Select WATCHMAN TIME and press the EDIT soft key.
WATCHMAN TIME
5,10
or
20 min
2-32
¤
5 minutes
¡
10 minutes
¡
20 minutes
Watchman window
4. Select time desired and press the ENTER soft key.
5. Press the [MENU] key to close the menu.
Page 67
2.24 Waypoint Marker
A waypoint marker, showing waypoint position output from a navigation device,
may be inscribed on the radar display. You may show or hide this marker as
desired.
2. RADAR OPERATION
.125nm
SP
.250/ 319.9
H-UP
Waypoint
marker
+
M
°
NAV
FUNC
W. MAN
ON/OFF
WPT MK
ON /OFF
RETURN
359.9°R
+
0.24nm
Waypoint marker
1. If not displayed, press the [HIDE/SHOW] key to display the radar soft keys.
2. Press the NAV FUNC soft key.
3. Press the W P T MK ON/OFF soft key to select ON or OFF as appropriate.
4. Press the RETURN soft key to finish.
2-33
Page 68

2. RADAR OPERATION
2.25 ARP (option), TTM operation
When the radar source is ARP-equipped Model 1833/C series net work radar,
you can manually and automatically acquire and track 10 targets. Once a target
is acquired automatically or manually it is aut omatically tracked within 0.1 to 32
nm. When the FURUNO heading sensor PG-1000 is connected, RMC sentence
(NMEA) is required for true heading data.
Alternatively, you can display the tracks of other ships by receiving the data
sentence “TTM” through the NETWORK or NMEA port. However, targets cannot
be acquired.
Usage precautions for ARP
WARNING
No one navigational aid should be relied
upon for the safety of vessel and crew.
The navigator has the responsibility to
check all aids available to confirm
position. Electronic aids are not
a substitute for basic navigational
principles and common sense.
• This auto plotter automatically tracks an
automatically or manually acquired radar
target and calculates its course and
speed, indicating them by a vector. Since
the data generated by the auto plotter
are based on what radar targets are
selected, the radar must always be
optimally tuned for use with the auto
plotter, to ensure required targets will not
be lost or unwanted targets such as sea
returns and noise will not be acquired
and tracked.
• A target does not always mean a land mass, reef, ships or other surface vessels
but can imply returns from sea surface
and clutter. As the level of clutter changes
with environment, the operator should
properly adjust the A/C SEA, A/C RAIN
and GAIN controls to be sure target
echoes are not eliminated from the
radar screen.
CAUTION
The plotting accuracy and response of
this auto plotter meets IMO standards.
Tracking accuracy is affected by the
following:
• Tracking accuracy is affected by course
change. One to two minutes is required to
restore vectors to full accuracy after an
abrupt course change. (The actual
amount depends on gyrocompass
specifications.)
• The amount of tracking delay is inversely
proportional to the relative speed of the
target. Delay is on the order of 15-30
seconds for high relative speed; 30-60
seconds for low relative speed.
Display accuracy is affected by the
following:
• Echo intensity
• Radar transmission pulsewidth
• Radar bearing error
• Gyrocompass error
• Course change (own ship or target)
2-34
Page 69

2.25.1 Activating/deactivating ARP, TTM
1. Press the [ MENU] key followed by the ARP SETUP soft key to show the ARP
SETUP menu.
ARP TARGET INFO
INTERNAL ARP
CANCEL ALL TARGETS
NO
ARP VECTOR MODE
TRUE
ARP VECTOR TIME
30 minutes
HISTORY INTERVAL
OFF
CPA
OFF
TCPA
30 seconds
AUTO ACQUISITION AREA
OFF
TARGET ID NUMBER
OFF
2. RADAR OPERATION
ARP
SETUP
EDIT
RETURN
ARP setup menu
2. Select ARP TARGET INFO, and then press the EDIT soft key to show the
ARP target info window.
ARP TARGET INFO
▲
¤
INTERNAL ARP
¡
EXTERNAL ARP
¡
OFF
▼
ARP target info window
3. Select I NT E RNAL ARP, EXTERNAL ARP or OFF as appropriate.
INTERNAL ARP: The radar source must be the MODEL1833/C series radar.
Select this item also for a NavNet unit being fed ARP targets.
EXTERNAL ARP: Receive TTM data sentence via NETW O RK or NMEA port.
Target tracks are shown but targets cannot be acquired.
OFF: Turns off the ARP or TTM display.
4. Press the ENTER soft key.
5. Press the [ MENU] key to close t he menu.
2-35
Page 70
2. RADAR OPERATION
2.25.2 Acquiring and tracking targets (ARP only)
Ten targets may be acquired and tracked manually and automatically. When you
attempt to acquire an eleventh target, the message “ARP FULL – ALREADY
TRACKING 10 TARGETS!” appears for five seconds. To acquire another target,
terminate tracking of an unnecessary target as shown in the paragraph 2.25.4.
Manual acquisition
1. If not displayed, press the [HIDE/SHOW] key to display the radar soft keys.
2. Press the TARGET soft key.
3. Place the cursor on the target to acquire and press the ACQ soft key.
4. Press the RET URN soft key.
The plot symbol changes its shape according to its status as below. A vector
appears about one minute aft er acquisition, indicating the target’s motion trend.
Vector
01*
At acquisition 1 min. after
acquisition
* = Target number shown when TARGET ID NUMBER is
turned on in the ARP SETUP menu.
01*
3 min. after
acquisition
01*
Target Number
ARP plot symbols
Automatic acquisition
The ARP can acquire up to ten targets automatically by setting an automatic
acquisition area. W hen automatic acquisition is selected af t er acquiring targets
manually, only the remaining capacity for targets may be automatically acquired.
For example, if seven targets have been manually acquired, three targets may
be automatically acquired.
1. Press the [MENU] key to show the main menu.
2. Press the ARP SET UP soft key to show the ARP SETUP menu.
3. Operat e the cursor pad to select AUTO ACQUISITION AREA.
4. Press the EDIT soft key to show the automatic acquisition area window.
AUTO ACQ. AREA
▲
¤
OFF
¡
ON
▼
2-36
Automatic acquisition area window
5. Select ON.
6. Press the ENTER soft key.
Page 71

2. RADAR OPERATION
7. Press the [MENU] key to close the menu. An acquisition area of 2.0 to 2.5
miles in range and ±45º on either side of the heading line in bearing appears.
Note: Targets being tracked in automatic acquisition are continuously
tracked when switching to manual acquisition.
Automatic acquisition area
45° port
2.0 - 2.5 nm
45° starboard
Automatic acquisition area
2.25.3 Displaying target number (internal, external ARP)
Target num ber can be shown for ARP and TTM targets as below.
ARP
Target
Number
.125nm
SP
.250/ 319.9
H-UP
01
T
°
TARGET
TRAIL
TLL
OUTPUT
ACQ
TARGET
INFO
RETURN
359.9°R
+
0.240nm
ARP target number
1. Press the [ MENU] key.
2. Press the ARP SETUP soft key.
3. Select TARGET ID NUMBER.
4. Press the EDIT soft key.
5. Select O N or OFF (default setting) as appropriate.
6. Press the ENTER soft key.
7. Press the [ MENU] key to close t he menu.
2-37
Page 72
2. RADAR OPERATION
2.25.4 Terminating tracking of ARP targets
When 10 target s have been acquired, no more targets may be acquired unless
targets are cancelled. If you need to acquire additional targets, you must first
cancel one or more individual targets, or all of the targets, using one of the
procedures below.
Terminating tracking of selected targets
1. Place the cursor on the target to terminate tr acking.
2. Press the [ CLEAR] key to erase to terminate tracking and erase the target .
Terminating tracking of all targets
1. Press the [MENU] key followed by the ARP SETUP soft key.
2. Select CANCEL ALL TARGETS.
3. Press the EDIT soft key.
CANCEL ALL TARGETS
▲
¡
¤
▼
YES
NO
Cancel all targets window
4. Select YES.
5. Press the ENTER soft key.
6. Press the [MENU] key to close the menu.
2-38
Page 73

2.25.5 Setting vector attributes (ARP)
What is a vector?
A vector is a line extending from a tracked target which shows speed and course
of the target. The vector tip shows an estim ated position of the target after the
selected vector time elapses. It can be useful to extend the vector length in order
to evaluate the risk of collision with any target.
Vector
Vector reference, vector time
You m ay reference the vectors to North (True) or ship’s heading (relative) as
desired. Vector time can be set to 30 seconds, 1, 3, 6, 15 or 30 minutes.
1. Press the [ MENU] key followed by the ARP SETUP soft key to show the ARP
SETUP menu.
2. Operat e the cursor pad to select ARP VECTOR MODE.
3. Press the EDI T soft key to show the vector mode window.
2. RADAR OPERATION
Vector
ARP VECTOR MODE
¤
RELATIVE
TRUE
¡
Vector mode window
4. Select T RUE or RELATIVE as appropriate.
5. Press the ENTER soft key.
6. Select ARP VECTOR TIME, and t hen press the EDIT soft key to show the
ARP vector time window.
ARP VECTOR TIME
▲
¤
30 seconds
¡
1 minute
¡
3 minutes
¡
6 minutes
¡
15 minutes
¡
30 minutes
▼
ARP vector time window
7. Operate the cursor pad to select vector time among 30 sec, 1 min, 3 min, 6
min, 15 m in and 30 min.
8. Press the ENTER soft key.
9. Press the [ MENU] key to close t he menu.
2-39
Page 74

2. RADAR OPERATION
2.25.6 Displaying past position display (ARP)
This ARP can display time-spaced dots (maximum 10 dots) m arking the past
positions of any targets being tracked. You can evaluate a target’s actions by the
spacing between dots. Below are examples of dot spacing and target movement.
(a) Ship turning
(b) Ship running
straight
(c) Ship reduced
speed
(d) Ship increased
speed
Past position displays
To turn the past position display on or off:
1. Press the [ MENU] key followed by the ARP SETUP soft key.
2. Operat e the cursor pad to select HISTORY INTERVAL.
3. Press the EDI T soft key to show the plot interval window.
HISTORY INTERVAL
▲
¤
OFF
¡
30 seconds
¡
1 minute
¡
3 minutes
¡
6 minutes
▼
History interval window
4. Operate the cursor pad to select plotting interval among 30 sec, 1 min, 3 min
and 6 min, or select OFF to turn off the past position display.
5. Press the ENTER soft key.
6. Press the [MENU] key to close the menu.
2-40
Page 75

2.25.7 ARP, TTM target data
This ARP calculates motion trends (range, bearing, course, speed, CPA and
TCPA) of all target been tracked. You can show this data for a tracked target as
below. TARGET ID NUMBER, in the ARP SETUP menu, must be turned on to
show ARP target data.
1. Place the cursor on the target whose data you want to see.
2. If not displayed, press the [HIDE/SHOW] key to display the radar soft keys.
3. Press the TARGET and TARGET INFO soft keys. The data of the selected
target appears at the bottom left-hand corner of the display. (If an EBL/VRM
data box is displayed the ARP data box will be under it.)
4. Press the RET URN soft key to finish.
5. To erase the ARP target data box, select the corresponding target with the
cursor and press the [CLEAR] key.
2. RADAR OPERATION
Cursor
ARP
Target
.125nm
SP
.250/ 319.9
T
°
TARGET
H-UP
+
TRAIL
TLL
OUTPUT
ACQ
01
TARGET
INFO
RETURN
No.01 VECTOR TRUE 15min
CSE 359.9°T SPD 12.5kt
CPA 2nm TCPA 12.35
CPA and TCPA
Course and Speed
Target No., Vector Reference (True), Vector Time
ARP target data
359.9°R
+
0.240nm
2-41
Page 76

2. RADAR OPERATION
2.25.8 CPA/TCPA alarm (ARP)
When the predict ed CPA of any target becomes smaller t han a preset CPA
alarm range or its predicted TCPA less than a preset TCPA alarm limit, an audio
alarm sounds, which you may silence with the [CLEAR] key. In addition, the
target plot symbol of t he offending target changes to a triangle and flashes
together with its vector. Press the [ALARM] key and the message COLLISION
ALARM appears. Press the CLEAR ALARM soft key to acknowledge the alarm.
The flashing of the tr iangle plot symbol continues until you intentionally term inate
tracking of the target. The ARP continuously monitors the predicted range at the
Closest Point of Approach (CPA) and predicted time to CPA (TCPA) of each
target to own ship.
Provided that this feature is used correctly, it will help prevent the risk of collision
by alerting you to threatening targets. It is important that gain, A/C SEA, A/C
RAIN and other radar controls are properly adjusted and the ARP is set up so
that it can track targets effectively.
CPA/TCPA alarm ranges must be set up properly taking into consideration the
size, tonnage, speed, turning perform ance and other characteristics of own ship.
CAUTION
The CPA/TCPA alarm should never be
relied upon as the sole means for detecting the risk of collision. The navigator is
not relieved of the responsibility to keep
visual lookout for avoiding collisions,
whether or not the radar or other plotting
aid is in use.
Follow the steps shown below to set the CPA/TCPA alarm range:
1. Press the [ MENU] key followed by the ARP SETUP soft key.
2. Operat e the cursor pad to select CPA.
3. Press the EDI T soft key to show the CPA window.
CPA
▲
¤
OFF
¡
0.5nm
¡
1nm
¡
2nm
¡
3nm
¡
5nm
¡
6nm
▼
CPA window
2-42
4. Select a CPA limit desired by the cursor pad.
5. Press the ENT E R soft key. The ARP SETUP menu reappears.
6. Press the cursor pad t o select TCPA.
7. Press the EDI T soft key to show the TCPA window.
Page 77

8. Select a TCPA limit.
9. Press the ENTER soft key.
10. Press the [MENU] key to close the menu.
2.25.9 Lost target alarm (ARP)
When the system detects a lost target, t he target symbol becomes a diamond
and tracking is discontinued after one minute.
TCPA
▲
¤
30 seconds
¡
1 minute
¡
2 minutes
¡
3 minutes
¡
4 minutes
¡
5 minutes
¡
6 minutes
¡
12 minutes
▼
TCPA window
2. RADAR OPERATION
Lost target mark
Canceling a lost target
1. Place the cursor on the target.
2. Press the [ CLEAR] key.
1
2-43
Page 78

2. RADAR OPERATION
)
2.26 Interpreting the Radar Display
2.26.1 General
Minimum and maximum ranges
Minimum range
The minimum range is defined by the shortest distance at which, using a scale of
2
1.5 or 0.75 nm, a target having an echoing area of 10 m
is still shown separate
from the point representing the antenna position. It is mainly dependent on the
pulselength, antenna height, and signal processing such as main bang
suppression and digital quantization.
Maximum range
The maximum detecting range of the radar, Rmax, varies considerably
depending on several factors such as the height of the antenna above the
waterline, the height of the target above the sea, the size, shape and material of
the target, and atmospheric condit ions.
Under normal atmospheric condit ions, the maximum range is equal to the radar
horizon or a little shorter. The radar horizon is longer than the optical one by
about 6% because of the diffraction propert y of the radar signal. Rmax is given
in the following equation.
R
= 2.2 x ( h1 + h2
max
where Rmax: radar horizon (nautical miles)
h1: antenna height (m)
h2: target height (m)
Radar horizon
Optical horizon
Radar horizon
For example, if the height of the antenna above the waterline is 9 meters and the
height of the target is 16 meters, the maxim um radar range is;
R
= 2.2 x ( 9 + 16 ) = 2.2 x (3 + 4) = 15.4 nm
max
It should be noted that the detection range is reduced by precipitation (which
absorbs the radar signal).
2-44
Page 79

2. RADAR OPERATION
Radar resolution
There are two important factors in radar resolution (discrimination): bearing
resolution and range resolution.
Bearing resolution
Bearing resolution is the ability of the radar to display the
echoes received from two targets, which are at the same range and close
together, as separate targets. Bearing resolution is directly proportional to the
antenna length, and inversely proportional to the radar's wavelength.
Range resolution
Range resolution is the ability to display the echoes received
from two targets, which are on the same bearing and close to each other, as
separate targets.
Bearing accuracy
One of the most important features of the radar is how accurately the bearing of
a target can be measured. The accuracy of bearing measurement basically
depends on the narrowness of the radar beam. However, the bearing is usually
taken relative to the ship’s heading, and thus, proper adjustment of the heading
marker at installation is an important factor in ensuring bearing accuracy. To
minimize error when measuring the bearing of a target, select a range which will
put the target as far out to t he edge of the radar screen as possible.
Range measurement
Measurement of the range to a t arget is also a very important function of the
radar. Generally, there are two means of measuring range: the fixed range rings
and the variable range marker (VRM). The fixed range rings appear on the
screen with a predetermined interval and provide a rough estimate of the range
to a target. The variable range marker’s diameter is increased or decreased so
that the marker touches the inner edge of the target, allowing the operator to
obtain more accurate range m easurements.
2-45
Page 80
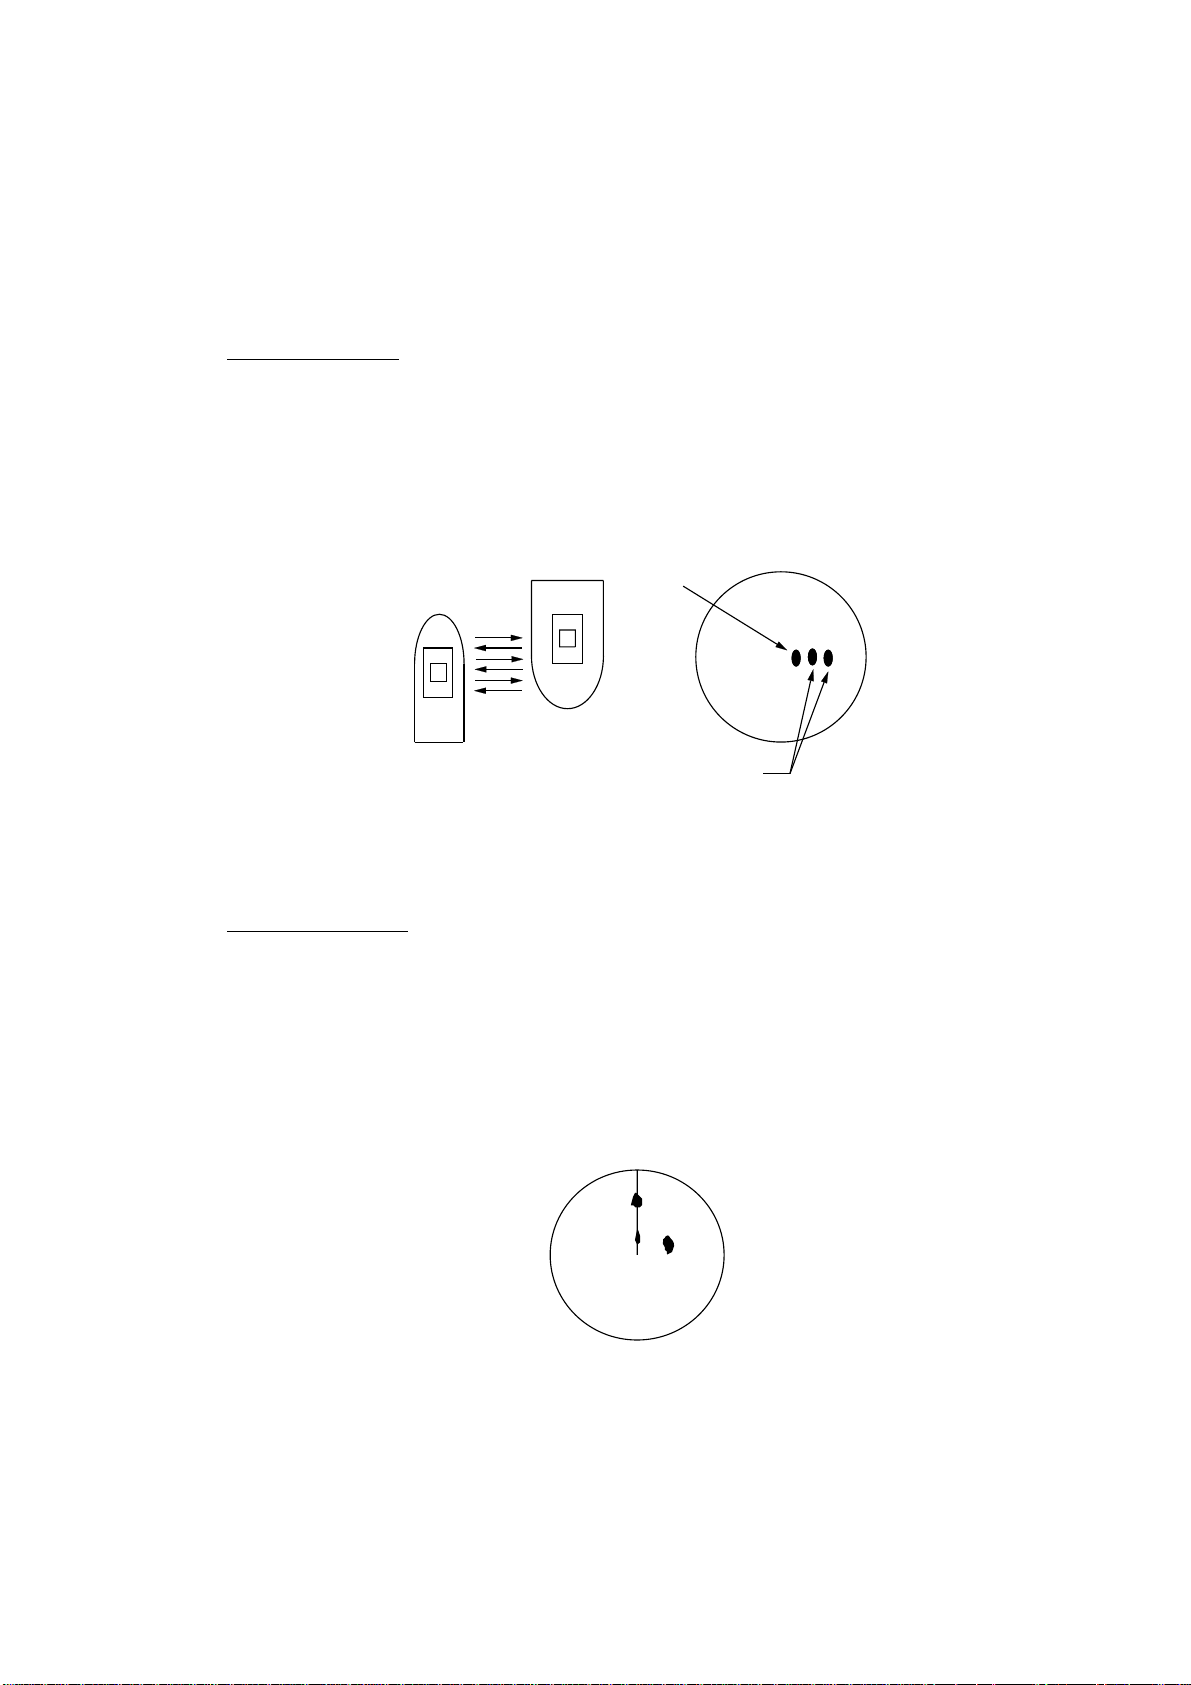
2. RADAR OPERATION
2.26.2 False echoes
Occasionally echo signals appear on the screen at positions where there is no
target, or disappear even if there are targets. False target situations may be
recognized, however, if you understand why they are displayed. Typical false
echoes are shown below.
Multiple echoes
Multiple echoes occur when a transmitted pulse returns from a solid object like a
large ship, bridge, or breakwater. A second, a third or more echoes may be
observed on the display at double, triple or other multiples of the actual range of
the target as shown below. Multiple reflection echoes can be reduced and often
removed by decreasing the gain (sensitivity) or properly adjusting the [A/C SEA]
control.
True
echo
Target
Own ship
Multiple
echo
Multiple echoes
Sidelobe echoes
Every time the radar pulse is transmit t ed, some radiation escapes on each side
of the beam. T his stray RF is called sidelobe. If a target exists where it can be
detected by the side lobes as well as the main lobe, the side echoes m ay be
represented on both sides of the true echo at t he same range. Sidelobes appear
usually only on short ranges and from strong targets. They can be reduced
through careful reduction of the gain or proper adj ustment of the A/ C SEA
control.
Target A
Target B
(Spurious)
Target B
(True)
2-46
Sidelobe echoes
Page 81
2. RADAR OPERATION
;
Virtual image
A relatively large target close to your ship may be shown at two positions on the
screen. One of them is the true echo directly reflected by the target and the
other is a false echo which is caused by the mirror effect of a large object on or
close to your ship as shown in the figure below. If your ship comes close to a
large metal bridge, for example, such a false echo may temporarily be seen on
the screen.
Target ship
Own
ship
True
echo
Mirror image
of target ship
False
echo
Virtual image
Shadow sectors
Funnels, stacks, masts, or derricks in the path of the antenna block the radar
beam. If the angle subtended at the antenna is more than a few degrees, a
non-detecting sector or blind spot may be produced. Within this sector, targets
can not be detected.
Radar
antenna
Radar
mast
Shadow sector
Shadow sectors
2-47
Page 82

2. RADAR OPERATION
2.26.3 SART (Search and Rescue Transponder)
A Search and Rescue Transponder (SART) may be triggered by any X-Band (3
cm) radar within a range of approximately 8 nm. Each radar pulse received
causes it to transmit a response which is swept repetitively across the complete
radar frequency band. When interrogated, it first sweeps rapidly (0.4 µs) through
the band before beginning a relatively slow sweep (7.5 µs) through the band
back to the starting frequency. This process is repeated for a total of twelve
complete cycles. At some point in each sweep, the SART frequency will match
that of the interrogating radar and be within the pass band of the radar receiver.
If the SART is within range, the frequency matc h during each of the 12 slow
sweeps will produce a response on the radar display, thus a line of 12 dot s
equally spaced by about 0.64 nautical miles will be shown.
When the range to the SART is reduced to about 1 nm, the radar display may
show also the 12 responses generated during the fast sweeps. These additional
dot responses, which also are equally spaced by 0.64 nm, will be interspersed
with the original line of 12 dots. They will appear slightly weaker and smaller
than the original dots.
Echo of SART
Position of
SART
Screen A: When SART
is distant
Radar antenna
beamwidth
24 NM
Own ship's
position
9500 MHz
9200 MHz
7.5 µs
Sweep start
Low speed sweep signal
Screen B: When SART
is close
1.5 NM
Own ship's
SART mark
length
Sweep time
95 µs
High speed sweep signal
position
Radar receiver
bandwidth
Lines of 12 dots
are displayed in
concentric arcs.
Echo of
SART
Position of
SART
2-48
Appearance of SART signal on the radar display
Page 83

2. RADAR OPERATION
General procedure for detecting SART response
1. Use the range scale of 6 or 12 nm as the spacing between the SART
responses is about 0.6 nm (1125 m) to distinguish the SART.
2. Turn off the automatic clutter suppression (if applicable).
3. Turn off the Interference Rejector.
General remarks on receiving SART
SART range errors
When responses from only the 12 low frequency sweeps are visible (when the
SART is at a range greater than about 1 nm), the position at which the first dot is
displayed may be as much as 0.64 nm beyond the true position of the SART.
When the range closes so t hat the fast sweep responses are seen also, the first
of these will be no more than 150 m eters beyond the true position.
Radar bandwidth
This is normally matched t o the radar pulselength and is usually switched with
the range scale and the associated pulselength. Narrow bandwidths of 3-5 MHz
are used with long pulses on long range and wide bandwidths of 10-25 MHz with
short pulses on short ranges.
Any radar bandwidth of less than 5 MHz will attenuate the SART signal slightly,
so it is preferable to use a medium bandwidth to ensure optimum detection of
the SART.
Radar side lobes
As the SART is approached, sidelobes from the radar antenna may show the
SART responses as a series of arcs or concentric rings. These can be removed
by the use of the [A/C SEA] control although it may be operationally useful to
observe the sidelobes as they may be easier to detect in clutter conditions and
also they will confirm that the SART is near to the ship.
Gain
For maximum range SART detection the normal gain setting f or long range
detection should be used, that is, with background noise speckle visible.
2-49
Page 84

2. RADAR OPERATION
A/C SEA control
For optimum range SART detection, this control should be set to the minimum.
Care should be exercised as wanted target in sea clutter may be obscured. Note
also that in clutter conditions the first few dots of the SART response may not be
detectable, irrespective of the setting of the anti-clutter sea control. In this case,
the position of the SART may be estimated by measuring 9.5 nm from the
furthest dot back towards own ship.
Some sets have automat ic/manual anti-clutter sea control facilities in which case
the operator should switch to manual.
A/C RAIN control
This should be used normally (to break up areas of rain) when trying to detect a
SART response which, being a series of dots, is not affected by the action of the
anti-clutter rain circuitry. Note that racon responses, which are often in the form
of a long flash, will be affected by the use of this control.
Some sets have automat ic/manual anti-clutter rain control facilities in which case
the operator should switch to manual.
Note: This SART information is excerpted from IMO SN/Circ 197 Operation of
Marine Radar for SART Detection.
2.26.4 Racon (Radar Beacon)
A racon is a radar transponder which emits a characteristic signal when
triggered by a ship’s radar (usually only the 3 centimeter band). The signal may
be emitted on the same frequency as that of the triggering radar, in which case it
is superimposed on the ship's radar display automat ically.
The racon signal appears on the PPI as a radial line originating at a point just
beyond the position of the radar beacon or as a Morse code signal (see figure
below) displayed radially from just beyond the beacon.
Racon
Appearance of racon signal on the radar display
2-50
Page 85

3. PLOTTER OPERATION
3.1 Plotter Displays
You may show the plotter display over the entire screen, in the overlay screen
(MODEL1722C series), or in a combination screen. Press the [DISP] key to
show the screen selection window, and then rotat e the [ENTER] knob to select
PLOT, NAV or OVRLY (overlay) as appropriate.
3.1.1 Full-screen plotter display
Scale
Icon (from left)
North Marker
Chart
Alarm
Track Hold
Chart Offset
Save
L/L Offset
Battery
Simulation
(See icon
table on
page A-14
for details.)
Nav data window
Presentation mode
(Data changes with NAV soft
key setting and cursor
status. For details see next page.)
34° 22. 3456'N 359.9° M
080° 22. 3456'E
16.0nm
002WP
Waypoint name
S
I
M
FISH
19.9 kt 99.9 nm
BRIDGE
Own ship
marker
Course bar
Waypoint marker
(North-up)
Trip distance
TRIP
NU
MARK
ENTRY
MODE
NTH UP
NAV
POS
D. BOX
ON/OFF
Own ship
track
Functions for
soft keys
Full-screen plotter display
Note: The own ship marker blinks when the unit loses the GPS signal. The
message “No GPS fix!” appears approx. 90 seconds after the positioning
error and is accompanied by the audio alarm. When the message “NO
POSITION DATA” appears, a cable may be loosened.
3-1
Page 86

3. PLOTTER OPERATION
Nav data window
The data shown in the nav data window depends on the status of the NAV soft
key and the cursor.
Latitude and longitude
of cursor intersection
Waypoint data
(waypoint selected
with cursor)
Latitude, Longitude
34°24. 3456'N 359. 9°M
+
124°24. 3456'W 59.9nm 99. 9nm
Cursor Mark
001WPT
Bearing to Cursor
TRIP
Range to
Cursor
Trip Distance
CourseBearing to WaypointWaypoint Name
359. 9°M359. 9°M
19. 9nm 19. 9kt 99. 9nm
SpeedRange to WaypointWaypoint Mark Trip Distance
NU
TRIP
Presentation
Mode
Presentation
Mode
NU
Own ship
position
Destination
waypoint
data
Own ship
speed and
course
NAV
POS
soft key
NAV
WPT
soft key
NAV
S/C
soft key
CourseLatitude, Longitude
34°24. 3456'N 359. 9°M
TRIP
NU
124°24. 3456'W 19. 9kt 99. 9nm
Own Ship Mark Speed Trip Distance
Bearing to WaypointWaypoint Name
001WPT
Waypoint Mark
Course, Speed
CSE
359. 9° 359. 9 °M 79. 9°F NU
SOG
19. 9kt 99. 9nm 345 ft
Range to Waypoint
Bearing to Waypoint
BRG
RNG
359. 9°M
19. 9nm
TTG
4D02H23M NU
ETA
1st 13:45
Estimated Time of
Arrival
TMP
DPT
Presentation
Mode
Time-to-Go
to Destination
Presentation
Mode
Presentation
Mode
* Requires appropriate
sensor.
Turns off
nav data
window
NAV
OFF
soft key
Range
to
Waypoint
Water Temp.,
Depth*
Contents of nav data window
3-2
Page 87

3.1.2 Compass display
The compass display, displayed at the bottom half of the screen in the
combination display, provides steering information. The compass rose shows
two triangles: the black triangle (hollow on monochrome model) shows the
bearing to destination waypoint and the red (solid on monochrome) t r iangle,
which moves with ship’s course, shows own ship’s course.
The water temperature and depth graphs, which require appropriate sensors,
show the latest 10 minutes of temperature and depth data. The range of the
depth graph is 50 feet and it is automatically adjusted with depth.
3. PLOTTER OPERATION
Time-to-go
to destination
Destination
waypoint bearing
(black and filled
on color model,
hollow on monochrome model)
Depth
graph*
* = Requires appropriate
sensor.
Destination
waypoint
003WPT
0D 9H 59MTTG 23th23:59
DPT
45.2ft
Shown (in red on
color model) when
direction to steer
is "left."
Bearing scale
Speed over ground
Range to destination waypoint
RNG
10.0
SOG
BRG
359.9°M
0
50
w
359.9°M
N
CSE
Own ship marker
(For color model, black when within XTE range,
yellow when over; flashes when over XTE range
on monochrome model)
Speed through water
99.9nm
kt
ETA
20
E
10
STW
TMP
16.2°F
10.0
kt
Direction to steer
(green on color model)
Estimated time of
arrival at destination
Ship's course
(red and filled
on
color model, filled
on monochrome model
Water
temperature
graph*
)
XTE monitor (See next page for description.)
Compass display
3-3
Page 88

3. PLOTTER OPERATION
Reading the XTE (cross-track error) monitor
The XTE monitor, located below the compass rose, shows the amount you are
off course and the direction to steer to return to course. The own ship marker
shows the direction and amount your ship is off course. It is shown in black when
the amount of cross-tr ack error is within the XTE monitor range and yellow when
it is over. An arrow appears at the right or left side of the XTE monitor and it
shows the direction to steer to return to intended course. (For the color m odel
the arrow is shown in red when you should steer left, and green when you
should steer right.) In the example on t he previous page you would steer right to
return to course. To maintain course, steer the vessel so the own ship marker
stays at the center of the XTE monitor.
Soft keys
EDIT XT-LMT: Sets the range for XTE monitor scale. See the procedure below
for how to set.
Setting the range for the XTE monitor
1. With the compass (or highway) display shown, press the EDIT XT-LMT soft
key to display the following window.
XTE LIMIT
0 .1nm
XTE range setting window
2. Use the cursor pad to select digit to change. Note that all digits may be
cleared by pressing the [CLEAR] key.
3. Use the [ENTER] knob to set value, or press the CANCEL soft key to cancel.
RESET XTE: Displayed when destination is set, and enables you to restart
navigation. When this soft key is pressed, the following window is displayed.
RESTART NAVGATION TO
CURRENT WPT.
ARE YOU SURE?
YES ... PUSH ENTER KNOB
NO ... PUSH CLEAR KEY
3-4
Page 89
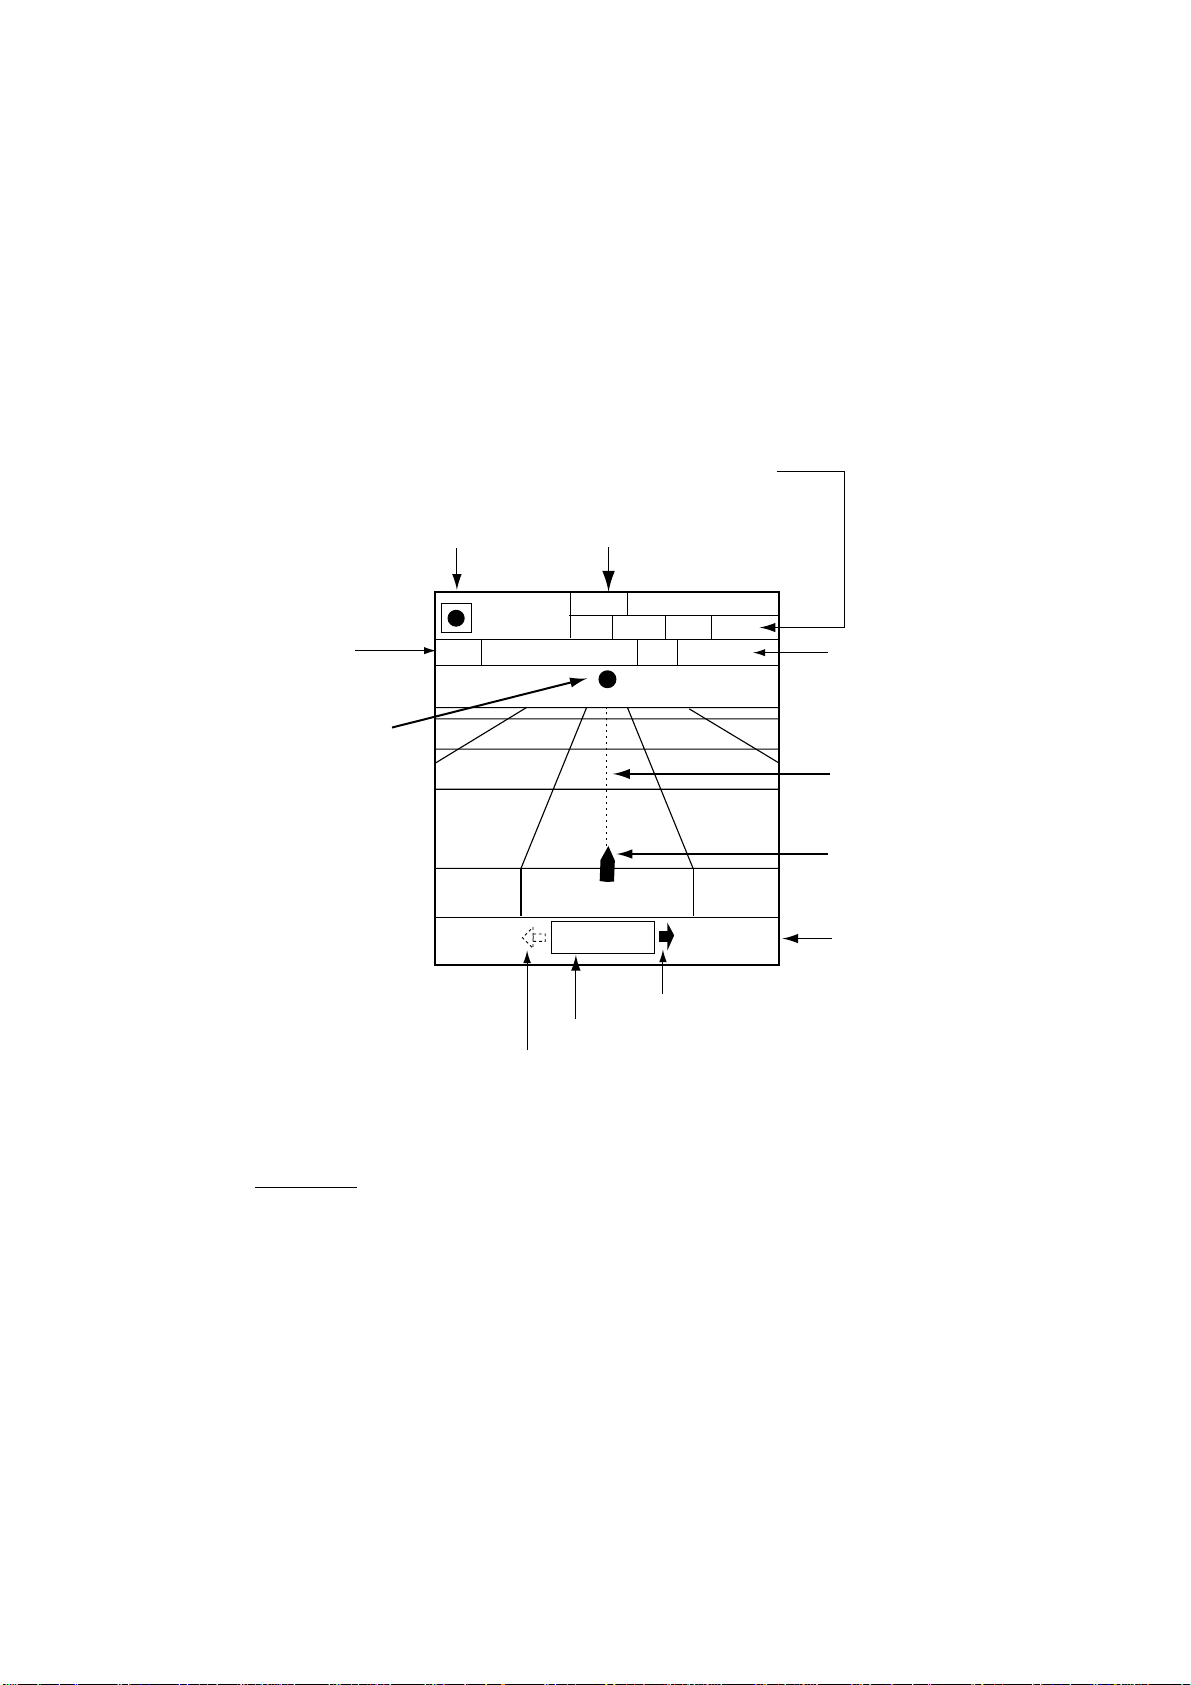
3.1.3 Highway display
The highway display, displayed at the lower half of the screen in the combination
display, provides a graphic presentation of ship’s track along intended course. It
is useful for monit oring ship’s progress toward a waypoint. The own ship marker
shows relation between ship and intended course. The XTE monitor shows the
direction and amount your vessel is off course – the arrow shows the direction to
steer to return to your course and the numeric the distance you are off course.
Using the figure below as an example, you would steer right 0.009 nm to return
to course. To maintain course, steer the vessel so the own ship marker stays
aligned with the intended course line.
Speed over ground, speed through water
3. PLOTTER OPERATION
Time-to-go
to destination
Destination waypoint
Destination
waypoint
003WPT
0D 9H 59M
TTG 23th23:59
0.9 nm
Shown (in red on color model) when
direction to steer is "left."
Range to
destination waypoint
RNG
99.9 nm
10.0
kt
SOG
WPT001
0.009nm
XTE monitor
STW
ETA
Direction to steer (green on color model)
10.0
0.9 nm
kt
Estimated time of
arrival at destination
Intended
course
Own ship marker
XTE range
Highway display
Soft keys
EDIT XT-LMT: Sets the range for the XTE monitor scale. See the procedure on
the previous page for how to set.
RESET XTE: Displayed when destination is set, and enables you to restart
navigation. See the description on the previous page.
3-5
Page 90

3. PLOTTER OPERATION
3.1.4 Nav data display
The nav data display provides comprehensive navigation data. The user may
select what data to display and where to display it, on the NAV DATA DISPLAY
SETUP menu. For details see paragraph “5.8 Nav Data Display Setup.”
Appropriate sensors are required. Bars ( - -) appear when corresponding sensor
is not connected.
Position
POSITION
34° 34. 5678' N
120° 34. 5678'
34° 14. 5678' N
120° 14. 5678'
10.0
9.2°
1324.1
Depth
Bearing to
waypoint
Speed through
water
Waypoint
Position
Full-screen display
W
kt
M
ft
Water temperature
W
SOGWPT POSITION
10.0
kt
COURSESTW
101.6°
RANGEBEARING
0.18
TEMPDEPTH
18.2 °
Range to
waypoint
Course
Speed over ground
M
nm
C
103
ET A
nm
1st 1:25
2001
FEB 1
Half-screen display
TTGTRIP LOG
0D 2H 30
TIMEDATE
01:27:05
M
Nav data displays
3-6
Page 91
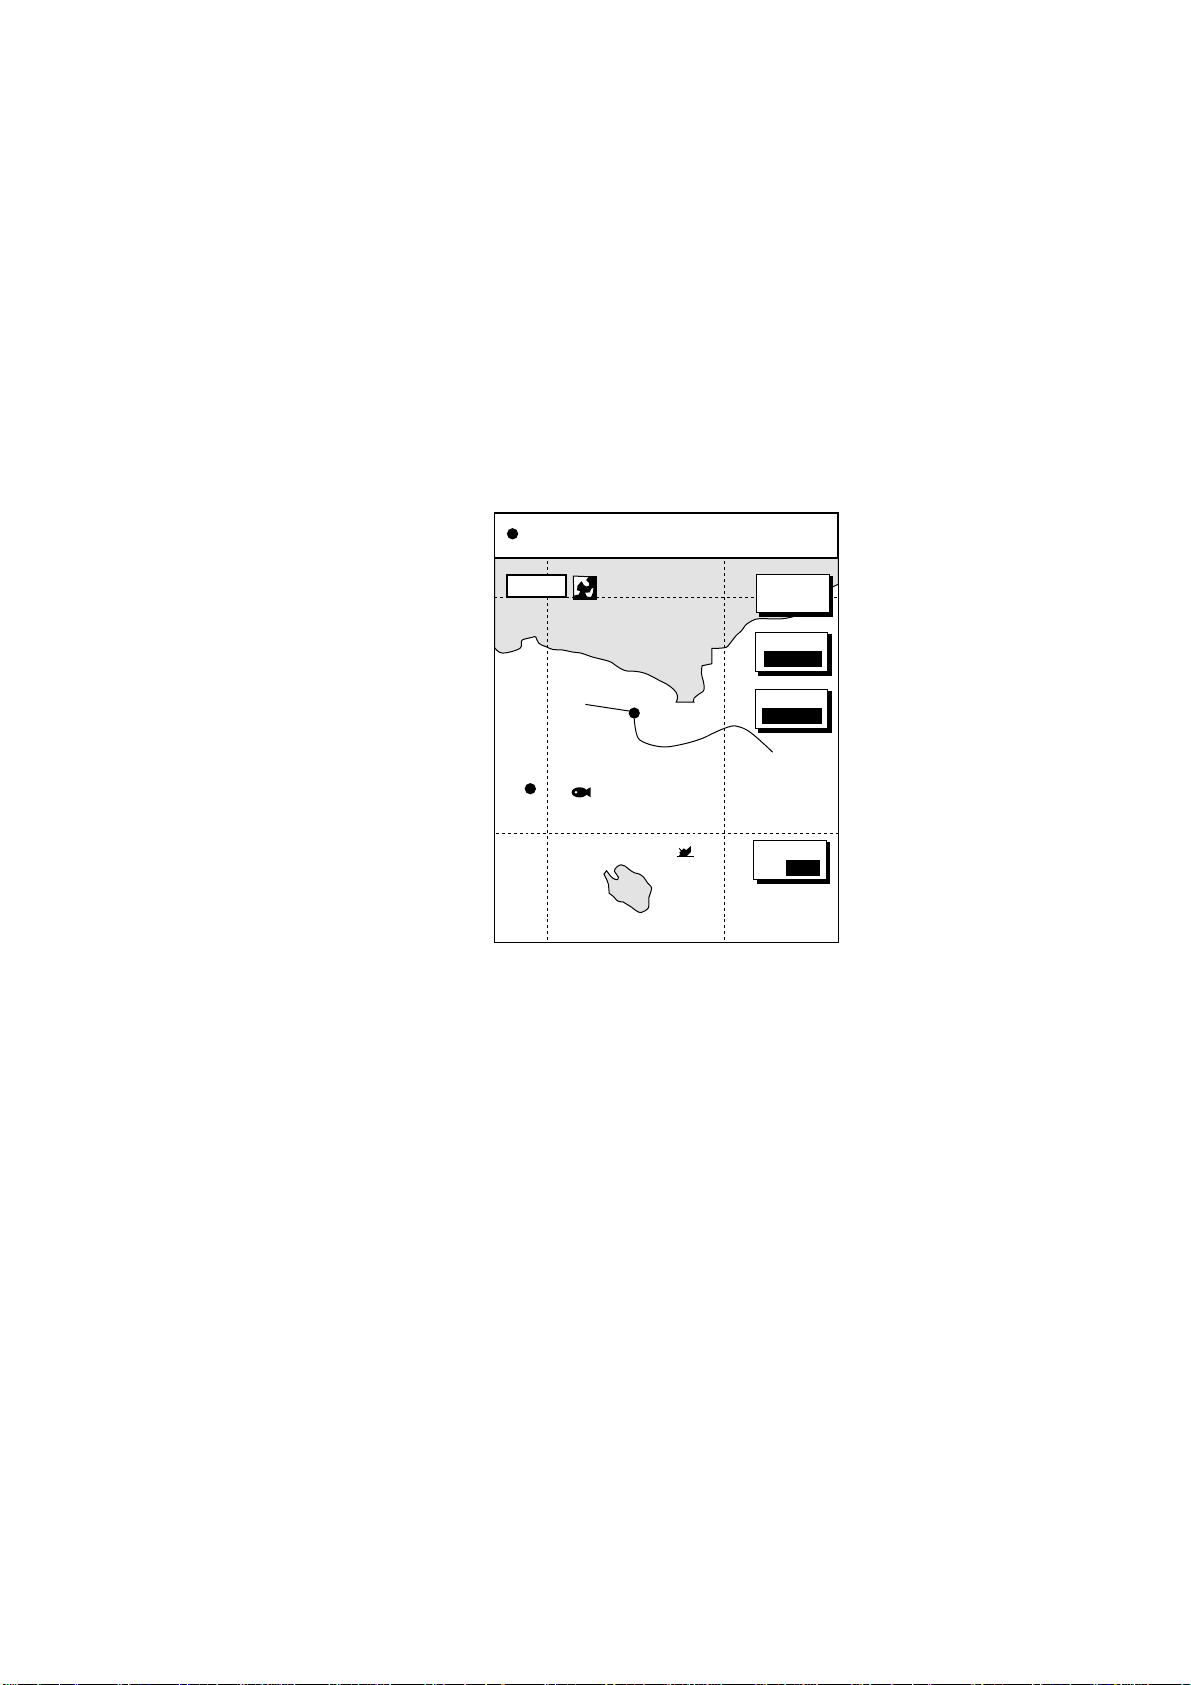
3.2 Presentation Mode
Three types of presentation modes are provided for the plotter display: north-up,
course-up and auto course-up. To change the presentat ion mode, first press the
[HIDE/SHOW] key if the plotter soft keys are not displayed. Press the MODE soft
key to select desired mode. Each press of the key changes the present ation
mode and presentation m ode indication (top right-hand corner of the screen)
cyclically in the sequence of North-up, Course-up and Auto course-up.
3.2.1 North-up
North is at the top of the display and own ship, shown by a filled circle. This
mode is useful f or long-range navigation.
34° 22. 3456'N 359.9°
080° 22. 3456'E
TRIP
19.9 kt 99.9 nm
NU
3. PLOTTER OPERATION
16.0nm
WP-002
FISH
BRIDGE
MARK
ENTRY
MODE
NTH UP
NAV
POS
D.BOX
ON/ OFF
Plotter display, north-up mode
3-7
Page 92

3. PLOTTER OPERATION
3.2.2 Course-up
The destination is at the top of the screen when a destination is set. When no
destination is set, the course or heading is at the top of the screen at the
moment t he course-up mode is selected. A filled triangle marks own ship’s
position.
Note: The data sentences GGA and VTG must be output from the NavNet
display unit connected to the GPS navigator in order to correctly orient the own
ship marker in the course-up mode on ot her NavNet display units.
34° 22. 3456'N 359.9° M
+
080° 22. 3456'E
16.0nm
WPT 001
19.9 kt 99.9 nm
TRIP
MARK
ENTRY
MODE
CSE UP
CENTER
GO TO
CURSOR
CU
Plotter display, course-up mode, destination set
3.2.3 Auto course-up
The course is at the top of screen at the moment the aut o course-up mode is
selected. In this mode, t he current course is kept at the top of the screen when
the change is within 22.5 degrees. For example, if your vessel turns larger than
22.5 degrees to port or starboard, the chart display will rotate so that your course
is pointing towards the top of the screen again. A filled triangle marks own ship’s
position.
34° 22. 3456'N 359.9° M
+
080° 22. 3456'E
16.0 nm
D. BOX
ON/ OFF
19.9 kt 99.9 nm
TRIP
MARK
ENTRY
MODE
AT CU
CU
CENTER
GOTO
CURSOR
D. BOX
ON/OFF
Plotter display, auto course-up mode
3-8
Page 93

3.3 Shifting the Display
The plotter display can be shifted on the plotter display as below.
1. Press the cursor pad t o display the cursor.
2. Locate the cursor at a screen edge and press and hold down the cursor pad.
The screen shifts in the direction opposite of cursor location.
3. To return the cursor to the screen center, press the CENTER soft key. T his
also returns own ship marker to the screen center.
3.4 Chart Scale
Chart scale (range) may be selected with the [RANGE -] or [RANGE +] key. The
[-] key expands the chart range; the [+] key shrinks it.
3. PLOTTER OPERATION
Charts scales
0.125 0.25 0.5 1 2 4 8 16 32 64 128 256 512 1024
nm
0.23 0.46 0.93 1.85 3.70 7.41 14.8 29.6 59.3 119 237 474 948 1896
km
0.144 0.29 0.58 1.15 2.30 4.60 9.21 18.4 36.8 73.7 147 295 589 1178
sm
Note: When the display is expanded or shrunk beyond the range of the chart
card in use the message “NO CHART” appears, along with the appropriate
chart icon. See the illustration on the next page for det ails.
3-9
Page 94

3. PLOTTER OPERATION
3.5 Chart Cards
3.5.1 Chart card overview
Your system reads FURUNO and NavCharts™ (NAVIONICS) charts, or C-MAP
charts, depending on its specification.
When you insert a suitable chart card in the slot and your boat is near any chart
graphic data, a chart appears. If a wrong card is inserted or a wrong chart scale
is selected, land masses will appear hollow. Insert the proper card and select a
suitable chart scale. Chart icons appear at the top of the display to help you
select a suitable chart scale. The table below shows the chart icons and their
meanings.
Chart icons and their meanings
Icon Meaning
Proper card is not inserted or
chart scale is too small.
Operate the RANGE key to
adjust chart scale.
Chart scale is too large.
Operate the RANGE key to
adjust chart scale.
Suitable chart scale is
selected.
3-10
Page 95

3.5.2 Indices and chart enlargement
When the [RANGE] key is operated, you will see several frames appear on the
chart. These frames are called indices and they show you what parts of the chart
can be zoomed in on.
Sample chart (Japan) showing indices
3. PLOTTER OPERATION
When a chart cannot be displayed
A chart will not be displayed in the following conditions:
When the chart scale is too large or too small.
•
When scrolling the chart outside the indices.
•
When this happens, select proper chart scale.
Note: Indices can be turned on or off with “Chart border line.” See page 5-13 for
FURUNO and NAVIONICS charts and 5-16 for C-MAP charts.
3-11
Page 96

3. PLOTTER OPERATION
3.5.3 FURUNO and NavCharts
Chart symbols
The table below shows FURUNO and NavCharts
meanings.
™
mini chart symbols and their
™
Chart symbols
Symbol Description
Summit
Wreck
Lighthouse
Lighted Buoy
Buoy
Radio Station
Data for aids to navigation
Selected FURUNO and NavCharts
charts can show buoy and lighthouse data.
™
Symbol Description
Position of Sounding
Obstruction
Fishing Reef
Platform
Anchorage
Simply place the cursor on the lighthouse or buoy mark.
Place the cursor on
a lighthouse or buoy mark.
Lighthouse mark
Example of data displayed
Range and bearing
from own ship
Period (ex.: 6 seconds)
Visibility in nautical
mile (ex.: 12 miles)
NAVAID: /FL 6S 12M
FROM OS 52.38nm 48.0°
FL : Flashing
F : Fixed light
F FL : Fixed and Flashing light
MO : Morse code light
Oc : Occulting light
Example of buoy, lighthouse data
3-12
Page 97

3. PLOTTER OPERATION
Port service icons (NavCharts™ only)
show services available at ports, with icons. Use the cursor pad to
NavCharts
™
place the cursor on the sailboat icon (denotes a port or harbor), and then push
the [ENTER] knob. The services available appear at the top of the display.
Detailed information of service
selected
List of services
at the port selected
34° 22. 3456'N 359.9°M
+
080° 22. 3456'E
FIRST AID
16.0nm
19.9 kt 99.9 nm
TRIP
NU
Emergency
medical service
Fueling station
CANCEL
Sailboat icon (Port)
Water
supply station
Customer
service station
Port
Traveler's
service station
Marine
equipment service
Information center
Plotter display, showing port service display
3-13
Page 98

3. PLOTTER OPERATION
3.5.4 C-MAP cards
Cursor and data display
Besides its fundamental functions of providing position data, the cursor can also
show caution area, depth area, source of data, etc. on C-map charts. In addition,
you can display information about an icon by placing the cursor on it.
1. Press the cursor pad t o t urn the cursor on.
2. Use the cursor pad to place the cursor on the position desired.
3. Push the [ENTER] knob to open the Objects window.
Objects
Navigation mark, fixed
Beacon, generic
Light
Light
Depth area
Source of data
Objects window
4. Use the cursor pad to select the item desired.
5. Push the [ENTER] knob to display details for object selected.
Navigation Mark, fixed
Light
Color
White
Height
12.0 Meters
Light characteristic
flashing
Sectorlimit one
64.0 Degrees
Sectorlimit two
138.0 Degrees
Signal group
(3)
Signal period
10.0 Seconds
Example of caution area window
6. Press the RETURN soft key to close the window.
7. Repeat step 4 to 6 to select other item.
8. Press the [ MENU] key to close t he menu.
3-14
Page 99

3. PLOTTER OPERATION
Icon data
You may place the cursor on any icon to find informat ion about the selected icon.
1. For example, place the cursor on a lighthouse icon.
Place the cursor on a lighthouse icon.
34° 22. 3456'N 359.9°M
+
080° 22. 3456'E
16.0nm
19.9 kt 99.9 nm
TRIP
NU
MARK
ENTRY
MODE
NTH UP
CENTER
GO TO
CURSOR
D. BOX
ON /OFF
Lighthouse icon
2. Push the [ENTER] knob to show data. For example, the following window
appears for a lighthouse.
Objects
Lighthouse
Tower
Light
Underwater Lock
Depth contour
Depth contour
Depth area
Source of data
Object windows
3. Use the cursor pad to select the item desired.
4. Push the [ENTER] knob to display detailed inform ation.
3-15
Page 100

3. PLOTTER OPERATION
5. Press the RET URN soft key to close the Objects window.
Tide information
The C-MAP chart card provides for calculation of the tide heights for any date.
Additionally it displays the times of sunrise and sunset.
1. Press the cursor pad to place the cursor on a Tide icon (
2. Push the [ENTER] knob to open the Objects window.
Navigation mark, fixed
Light.
Color
white
Height
7. 00 Meters
Light characteristic
occulting
XXXXXXXX
XXXXXXXX
Sample lighthouse data
T
).
34 24. 3456 N 359.9 NU
+
OBJECTS
124 24. 3456 W 59.9kt 024nm
Tide height
Cartographic area
Source of data
T
RETURN
Objects window
3. Use the cursor pad t o select “Tide height.”
4. Push the [ENTER] knob to open the TIDE window.
3-16
 Loading...