

Fujitsu siemens PRIMERGY RX300 S6 E-StarFam1 (2x Quad-Core CPUs), PRIMERGY RX300 S6 E-STARFAM1 Power and Performance Data Sheet
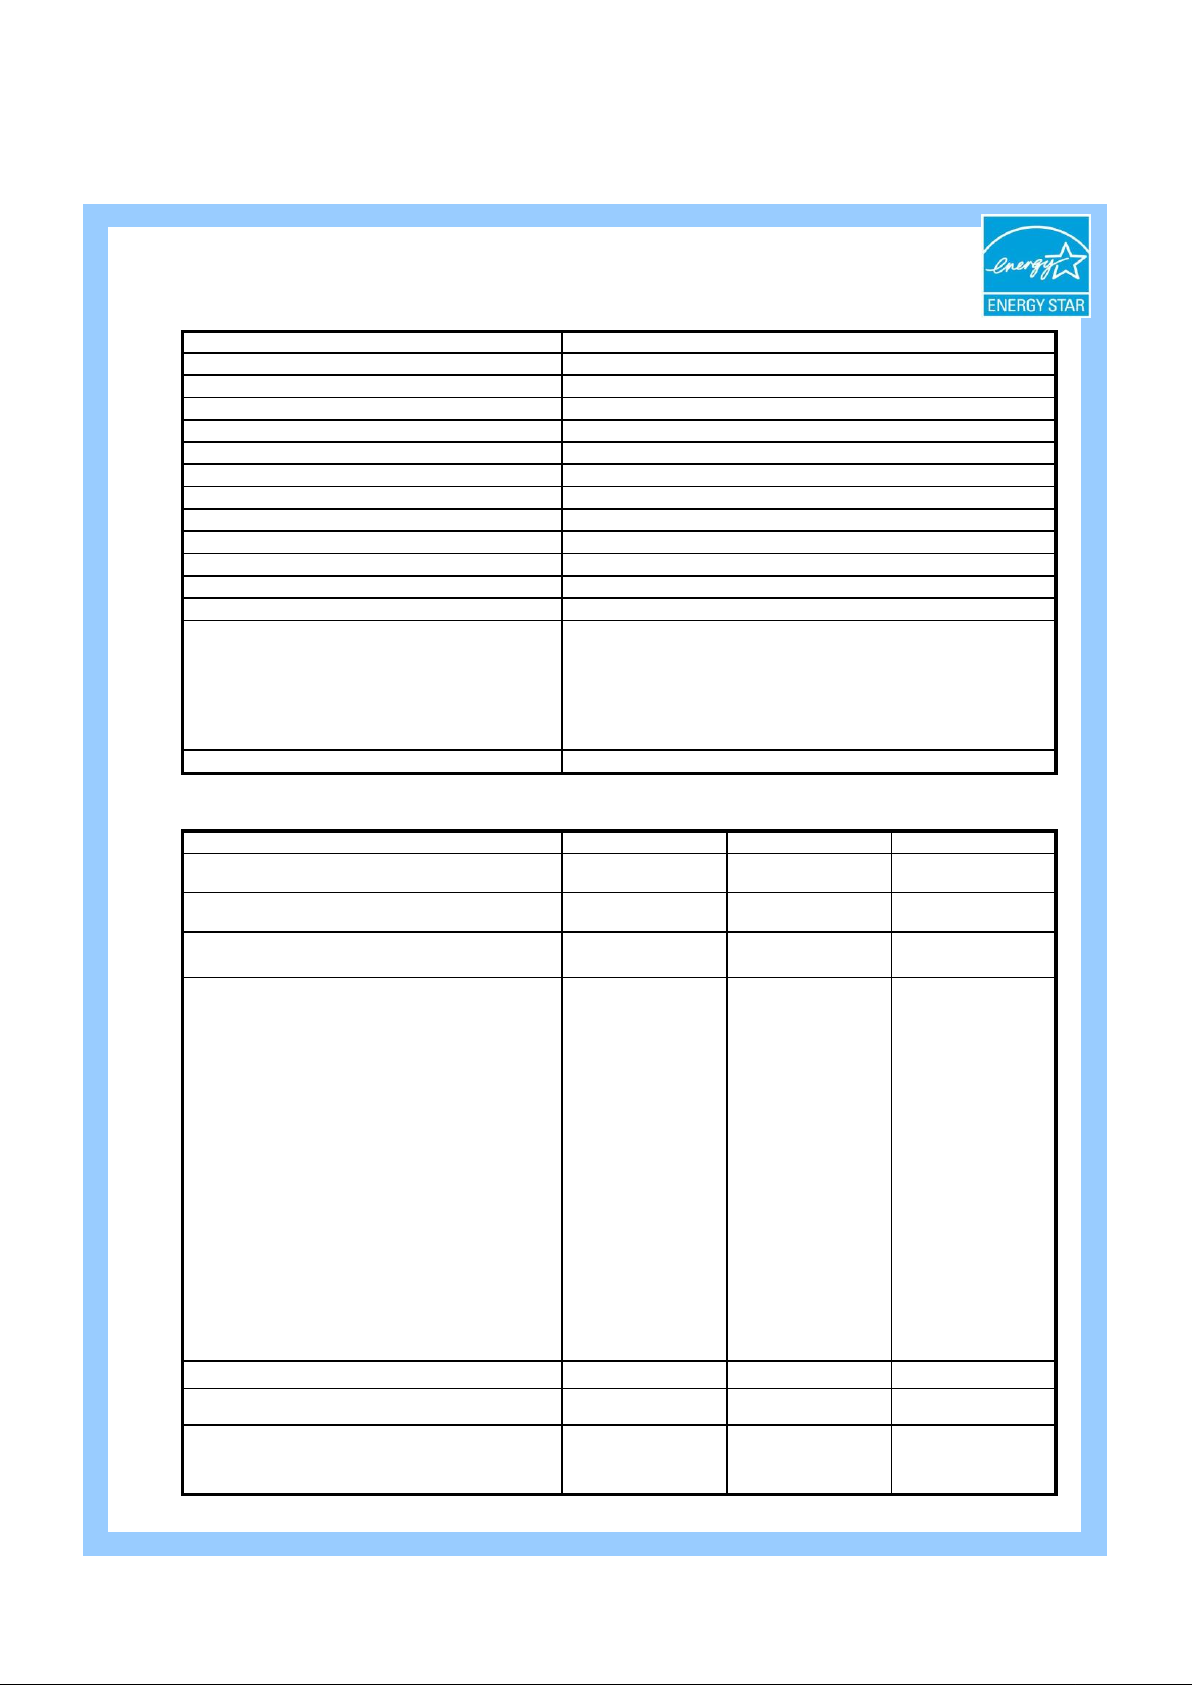
Form Factor
Available Processor Sockets
Available DIMM Slots / Max Memory Capacity
ECC and/or Fully Buffered DIMMs
Available Expansion Slots
Minimum and Maximum # of Hard Drives
Redundant Power Supply Capable?
Power Supply Make and Model Delta, DPS-800GB-3 A
Power Supply Output Rating* (watts)
Minimum and Maximum # of Power Supplies
Input Power Range (AC or DC)
Power Supply Efficiency at Specified Loadings*
Power Supply Power Factor at Specified Loadings*
Operating Systems Supported
Installed Operating System for Testing
Minimum Typical Maximum
Configuration ID
Processor Information
2x Intel® Xeon® E5620
4 cores, 2.40GHz
2x Intel® Xeon® E5620
4 cores, 2.40GHz
2x Intel® Xeon® E5620
4 cores, 2.40GHz
Memory Information
8GB (2x 4GB)
DDR3
24GB (6x 4GB)
DDR3
72GB (18x 4GB)
DDR3
Internal Storage
1x 3.5" SAS HDD
300GB
2x 3.5" SAS HDD
300GB
2x 3.5" SAS HDD
300GB
I/O Devices
1x 1Gbit Dual Port
Ethernet LAN
Intel® 82575EB
2 active ports
1x 1Gbit Dual Port
Ethernet LAN
Intel® 82575EB
2 active ports
1x 1Gbit Dual Port
Ethernet LAN
Intel® 82575EB
2 active ports
3x 1Gbit Quad Port
Ethernet LAN
Intel® Pro/1000PT
12 active ports
2x 4Gbit Dual Port
Fibre Channel
Emulex Lpe 11002
4 active ports
1x 10Gbit Dual Port
Ethernet LAN
Intel XF SR
2 active ports
Power Supply Number and Redundancy Configuration 1 2 (1 redundancy) 2 (1 redundancy)
Management Controller or Service Processor Installed? Yes Yes Yes
Other Hardware Features / Accessories
8 port SAS Raid
Controller
DVD RW
8 port SAS Raid
Controller
DVD RW
8 port SAS Raid
Controller
DVD RW
PRIMERGY RX300 S6 E-StarFam1 (2x Quad-Core CPUs)
ENERGY STAR® Power and Performance Data Sheet
84.4@10%, 89.6@20%, 92.2@50%, 90.9@100%
0.819@10%, 0.921@20%, 0.974@50%, 0.989@100%
System Characteristics
1 or 2
100 - 240V AC
Microsoft® Windows Server® 2008
Microsoft® Windows Server® 2008 R2
Microsoft® Windows Server® 2003
Novell SUSE Linux Enterprise Server 10 and 11 (incl. XEN)
Red Hat Enterprise Linux 5 (incl. XEN)
Microsoft Hyper-V Server 2008
0 to 2
Yes
800W
ECC / no fully buffered DIMMs
2U Rackmount
2
18 / 72GB
7 PCIe
System Configurations
MS Windows Server 2008 R2 Enterprise Edition, Vers. 6.1 (Build 7600)
* Note: Power supply information is for a single power supply only
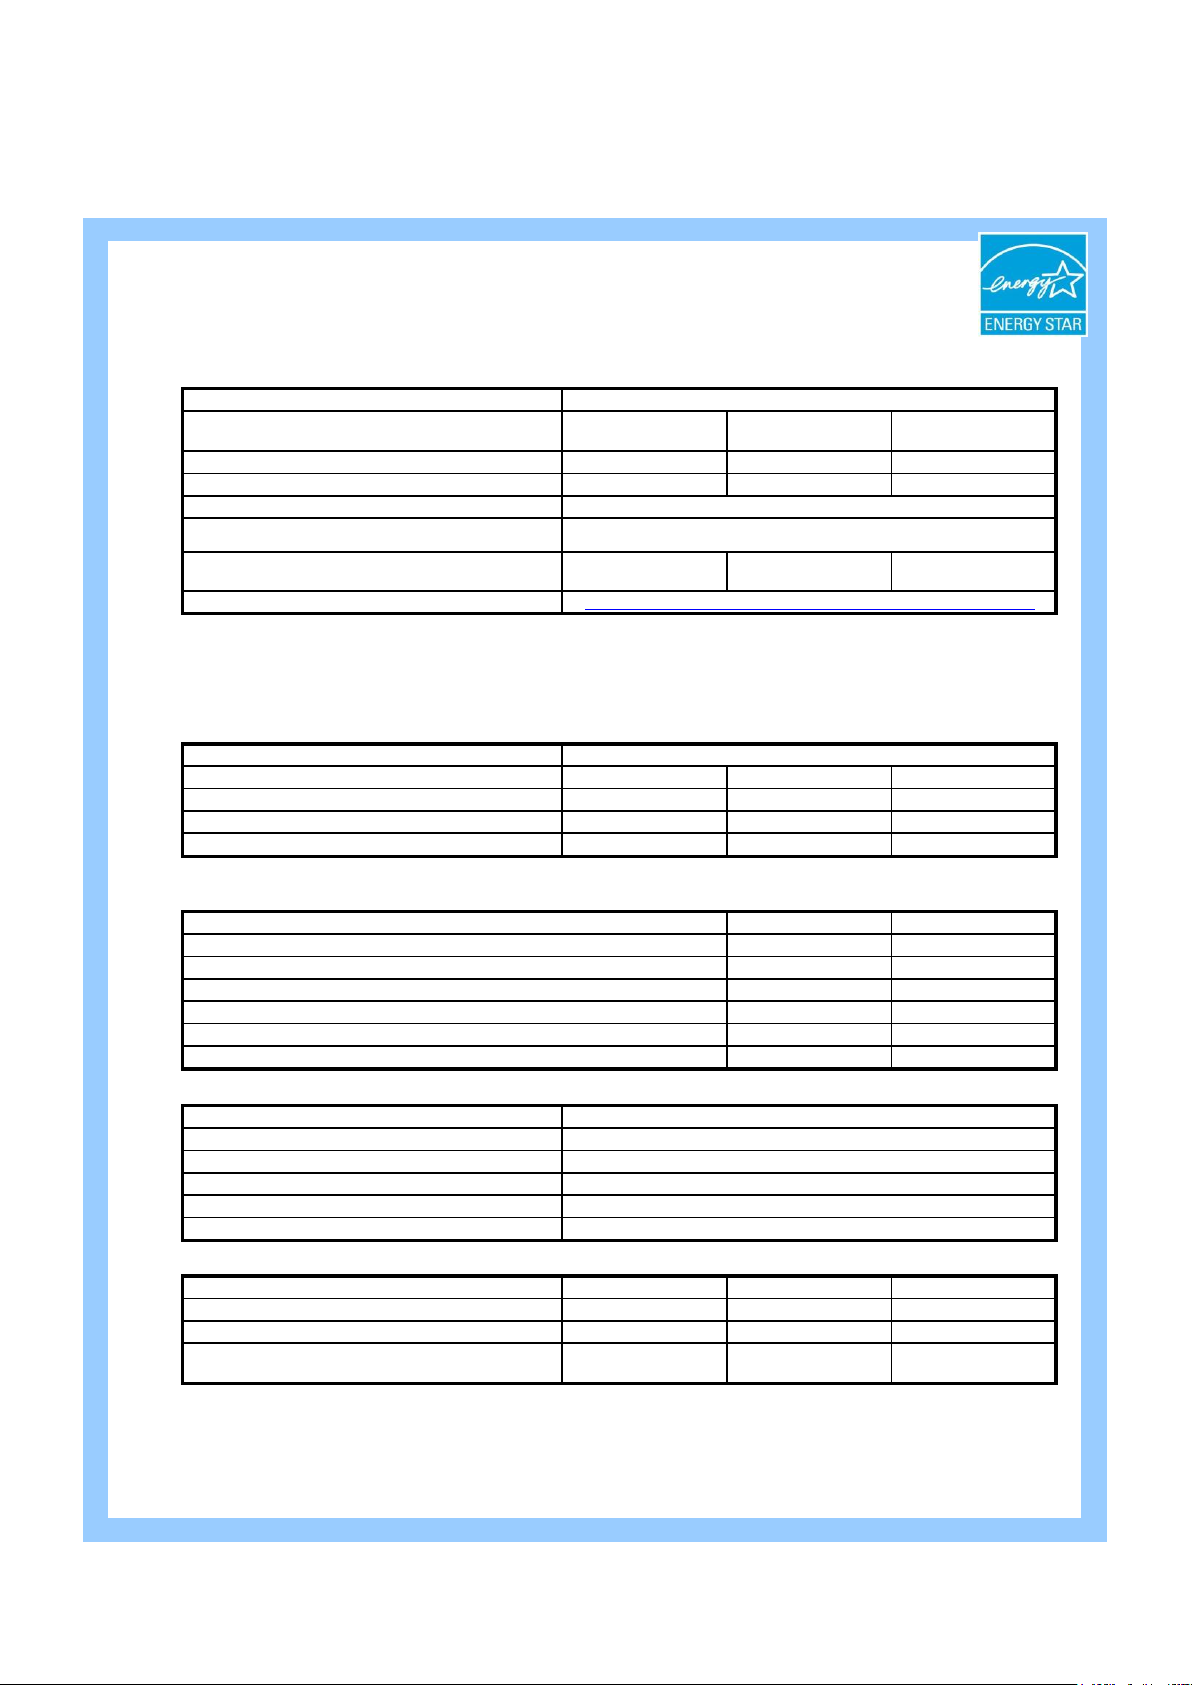
Minimum Typical Maximum
Idle Category (1S and 2S only)
ENERGY STAR Idle Power Allowance (1S and 2S only) 158W 218W 370W
Measured Idle Power (watts) 104,8 137,4 199,0
Power at Full Load* (watts) 184,1 247,4 310,3
Benchmark / Method Used for Full Load Test
Test Voltage and Frequency for Idle and Full Load Test
Range of Total Estimated Energy Usage ** (kWh/year) 1836 to 3225 2407 to 4334 3486 to 5436
Link to Detailed Power Calculator (if available)
Minimum Typical Maximum
Benchmark Used and Type of Workload
Avg. Power Measured During Benchmark Run 184,1W 247,4W 310,3W
Benchmark Performance Score 35.72MPixel/s 37.57MPixel/s 37.54MPixel/s
Power Performance Ratio (perf score/avg. power) 0,19MPixels/s/W 0,15MPixels/s/W 0,12MPixels/s/W
Link to Full Benchmark Report (Where Available) N/A N/A N/A
Enabled on
Shipment
End-User Enabling
Required
x
xxx
Input Power Available & Accuracy?
Input Air Temp Available & Accuracy?
Processor Utilization Available?
Other Data Measurements Available & Accuracy?
Compatible Protocols for Data Collection
Averaging method and time period
Minimum Typical Maximum
Total Power Dissipation (watts) 203 240 310
Delta Temperature at Exhaust at Peak Temp. (˚C) 9 10 12
Airflow at Maximum Fan Speed (CFM) at Peak Temp.
125m3/h 130m3/h 126m3/h
Airflow at Nominal Fan Speed (CFM) at Nominal Temp.
62m3/h 68m3/h 63m3/h
Benchmark #1
* Note: Full load power represents the sustained, average power at 100% load of the given workload, and does not necessarily represent the absolute peak power or the
highest average, sustained power possible for other workloads.
Processor or Core Reduced Power States
Power Saving Features
Power and Performance for Benchmark #1
SiSoftware Sandra Engineer 2009.SP4, .Net Multimedia, Double x1
ENERGY STAR® Power and Performance Data Sheet
* References: ASHRAE Extended Environmental Envelope Final August 1, 2008
Thermal Guidelines for Data Processing Environments, ASHRAE, 2004, ISBN 1-931862-43-5
Peak temperature is defined as 35 ˚C, Nominal Temperature is defined as 18 - 27 ˚C
Page 2 of 2
IPMI
Yes, +/- 15% above 160W and +/- 10% above 400W
Low Power Memory States
Low Power I/O States
Thermal Information *
Linear Average calculation / 5 sec.
Processor Dynamic Voltage and Frequency Scaling
Power Capping
Variable Speed Fan Control Based on Power or Thermal Readings
Yes
Liquid Cooling Capability
Yes, +/- 3°C
Power and Temperature Measurement and Reporting
** Note: Estimated kWh/year gives the absolute range of energy use a user could expect from continuous operation (24x365) and ranges from 100% Idle usage to 100%
full load operation. The calculation also includes typical data center overhead at a ratio of 1 watt of overhead to every 1 watt of IT load (corresponding to a PUE of 2.0).
Closer approximations may be found by using established power calculators and specific information about the intended operating environment (e.g., average time at
Category D: Managed Dual Installed Processor (2P) Servers
230V / 50Hz
SiSoftware Sandra Engineer 2009.SP4, .Net Multimedia, Double x1
PRIMERGY RX300 S6 E-StarFam1 (2x Quad-Core CPUs)
http://ts.fujitsu.com/products/standard_servers/e_efficient.html
Power Data
 Loading...