

Page 1

Fujitsu Microelectronics Europe
User Guide
FMEGDC-xxxx-xxxx
EVALUATION BOARD
CREMSON MODULAR STARTERKIT
USER
GUIDE
Page 2

Cremson Starterkit User Manual
Revision History
Revision History
Date Issue
March 2001 1.0 MM first version based on MB91F361 CPU module
Seperated used manuals for Cremson and Lavender Family
Sep 2003 2.0 MM
New combined user manual including F369 CPU board for all configurtaions
- 2 - © Fujitsu Microelectronics Europe GmbH
Page 3

Cremson Modular Starterkit
Warranty and Disclaimer
Warranty and Disclaimer
To the maximum extent permitted by applicable law, Fujitsu Microelectronics Europe GmbH restricts
its warranties and its liability for CREMSON MODULAR STARTERKIT and all its deliverables (eg.
software include or header files, application examples, target boards, evaluation boards, engineering
samples of IC’s etc.), its performance and any consequential damages, on the use of the Product in
accordance with (i) the terms of the License Agreement and the Sale and Purchase Agreement under
which agreements the Product has been delivered, (ii) the technical descriptions and (iii) all
accompanying written materials. In addition, to the maximum extent permitted by applicable law,
Fujitsu Microelectronics Europe GmbH disclaims all warranties and liabilities for the performance of
the Product and any consequential damages in cases of unauthorised decompiling and/or reverse
engineering and/or disassembling. Note, the CREMSON MODULAR STARTERKIT and all its
deliverables are intended and must only be used in an evaluation laboratory environment.
1. Fujitsu Microelectronics Europe GmbH warrants that the Product will perform substantially in
accordance with the accompanying written materials for a period of 90 days form the date of
receipt by the customer. Concerning the hardware components of the Product, Fujitsu
Microelectronics Europe GmbH warrants that the Product will be free from defects in material
and workmanship under use and service as specified in the accompanying written materials
for a duration of 1 year from the date of receipt by the customer.
2. Should a Product turn out to be defect, Fujitsu Microelectronics Europe GmbH´s entire liability
and the customer´s exclusive remedy shall be, at Fujitsu Microelectronics Europe GmbH´s
sole discretion, either return of the purchase price and the license fee, or replacement of the
Product or parts thereof, if the Product is returned to Fujitsu Microelectronics Europe GmbH in
original packing and without further defects resulting from the customer´s use or the transport.
However, this warranty is excluded if the defect has resulted from an accident not attributable
to Fujitsu Microelectronics Europe GmbH, or abuse or misapplication attributable to the
customer or any other third party not relating to Fujitsu Microelectronics Europe GmbH.
3. To the maximum extent permitted by applicable law Fujitsu Microelectronics Europe GmbH
disclaims all other warranties, whether expressed or implied, in particular, but not limited to,
warranties of merchantability and fitness for a particular purpose for which the Product is not
designated.
4. To the maximum extent permitted by applicable law, Fujitsu Microelectronics Europe GmbH´s
and its suppliers´ liability is restricted to intention and gross negligence.
NO LIABILITY FOR CONSEQUENTIAL DAMAGES
To the maximum extent permitted by applicable law, in no event shall Fujitsu
Microelectronics Europe GmbH and its suppliers be liable for any damages whatsoever
(including but without limitation, consequential and/or indirect damages for personal
injury, assets of substantial value, loss of profits, interruption of business operation,
loss of information, or any other monetary or pecuniary loss) arising from the use of
the Product.
Should one of the above stipulations be or become invalid and/or unenforceable, the remaining
stipulations shall stay in full effect
© Fujitsu Microelectronics Europe GmbH - 3 -
Page 4

Cremson Starterkit User Manual
Contents
Contents
REVISION HISTORY.............................................................................................................. 2
WARRANTY AND DISCLAIMER........................................................................................... 3
CONTENTS ............................................................................................................................ 4
1 INTRODUCTION................................................................................................................ 6
1.1 Abstract..................................................................................................................... 6
1.2 Key Features CPU-Board ......................................................................................... 7
1.3 Key Features Graphic Subboard............................................................................... 7
1.4 Board Configuration .................................................................................................. 8
2 INSTALLATION ................................................................................................................. 9
2.1 Hardware Installation ................................................................................................ 9
2.2 Software Installation................................................................................................ 10
2.3 Download the debugging kernel (CPU-board F369 only) ....................................... 10
3 GETTING STARTED ....................................................................................................... 11
3.1 Using the MB91F362 CPU-module......................................................................... 11
3.2 Using the MB91F369 CPU-module......................................................................... 11
3.3 An Introduction to Softune Workbench – Creating projects .................................... 12
3.4 Debugging with Softune Workbench....................................................................... 14
4 DETAILS OF THE INCLUDED MONITOR-DEBUGGER ................................................ 16
4.1 Basic debugger features ......................................................................................... 16
4.2 Advanced debugger features.................................................................................. 18
5 FLASH PROGRAMMING ................................................................................................ 21
5.1 MB91360 Flash Programmer .................................................................................. 21
6 CPU BOARD HARDWARE ............................................................................................. 23
6.1 Overview of Jumpers .............................................................................................. 24
7 . APPENDIX ..................................................................................................................... 26
7.1 Memory Mappings................................................................................................... 26
7.2 Tool options for own projects .................................................................................. 28
7.3 Starterkit limitations................................................................................................. 29
7.4 Provided Examples ................................................................................................. 30
7.4.1 Examples for using the CPU-Board MB91F362 :...................................... 30
7.4.2 Examples for using the CPU-Board MB91F369 :...................................... 31
7.4.3 Examples for the CPU-Board MB91F369 without any graphic subboard : 32
- 4 - © Fujitsu Microelectronics Europe GmbH
Page 5

Cremson Modular Starterkit
Contents
7.4.4 Segger “emWin” example for Jasmine...................................................... 32
7.5 Related Documents................................................................................................. 33
7.6 Related Partnumbers .............................................................................................. 34
7.7 Trouble Shooting..................................................................................................... 35
© Fujitsu Microelectronics Europe GmbH - 5 -
Page 6

Cremson Starterkit User Manual
Chapter 1 Introduction
1 Introduction
1.1 Abstract
The Fujitsu Cremson Modular Starterkit is a stand-alone application board that makes it easy
to evaluate and demonstrate almost all features of a particular graphic system (MCU +
Graphic Controller). The board is a combination of a CPU-main board and a graphic
subboard.
Fujitsu has a number of graphic controllers for embedded systems organized in different
device families. All graphic controllers from one particular family are software-compatible.
Therefore, this evaluation system has different software packages, manuals etc. depending
on the device family. To control the graphic device, Fujitsu offers 2 CPU modules with 32-bit
MCUs MB91F362 and MB91F369. The MB91F369 CPU board has a debugging option to
allow high-level source code debugging.
The board can be programmed and used as a stand-alone evaluation unit. When using the
system with the MB91F369 CPU-board, a full-features monitor debugger is available in
addition to allow high-level debugging using Softune Workbench.
All peripheral functions are available on external pin-headers in order to design and test user
applications cost- and time-effectively. For some resource functions, additional hardware is
already present on the board (e.g. CAN- and UART-transceivers, LEDs, Buttons, etc).
The included Windows-based Software “Softune Workbench” is an integrated front-end for
development and debugging. It allows fast development of “ANSI C”-based applications for
the evaluationboard. To get started quickly, a number of example projects and templates are
available.
Related documents such as hardware manuals, software API descriptions etc. are available
and should always be used in addition to this manual (see appendix).
Be sure to have the latest information available – check our websites for updates and last
minute informations :
Fujitsu Microelectronics Europe website :
Technical website : http://www.fme.gsdc.de/gsdc.htm
http://www.fme.fujitsu.com
- 6 - © Fujitsu Microelectronics Europe GmbH
Page 7

Cremson Modular Starterkit
Chapter 1 Introduction
1.2 Key Features CPU-Board
< Available CPU-boards : MB91F362 or MB91F369 MCU
< DC Power-supply circuit (incl. testpins for Vcc, GND, LED and switch) for the entire
system
< 1MB external flash ROM
< 2MB external debugging RAM (MB91F369 CPU-board only)
< MAX232 + DB9 (female) connectors for monitor and internal UART
< CAN tranceiver and DB9 (male) for internal CAN0
< External Interrupt 0 and 1 connected to buttons for user interaction
< Various jumpers for individual configuration
< 8 LEDs
< External bus connector for attaching graphic subboards
< Resources logically grouped on pin-headers
< Software includes Softune Workbench, a set of tools (e.g. flashloader) and example
projects.
1.3 Key Features Graphic Subboard
< Available Subboards: MB87J2120 “Lavender”, MB87P2020A “Jasmine”, MB86290A
“Cremson” or MB86291A “Scarlet” GDC
< PALs for user connections to other CPUs
< External bus connector for attaching CPU boards
< VGA connector for monitor
< External SDRAM for MB87J2120 and MB86290A
< External Video processor for MB87P2020A,MB87J2120 and MB86291A
< Composite + S-Video Input connector for MB87P2020A, MB87J2120 and MB86291A
< Pin-headers for digital displays, sync-signals and other graphic signals
< Seperated Reset circuit for Graphic subsystem
© Fujitsu Microelectronics Europe GmbH - 7 -
Page 8

Cremson Starterkit User Manual
Chapter 1 Introduction
1.4 Board Configuration
This page shows the available CPU-boards and graphic subboards for this system :
Available CPU modules : MB91F362 or MB91F369 MCU
Available Graphic Subboards : Cremson, Lavender, Scarlet and Jasmine.
Make sure you have both, the CPU-module and the Graphic subboard available for
your system. The boards can be purchased individually.
- 8 - © Fujitsu Microelectronics Europe GmbH
Page 9

Cremson Modular Starterkit
Chapter 2 Installation
2 Installation
2.1 Hardware Installation
What you’ll need :
< Host : IBM(-comp) PC with Windows 9x, 2k, XP or NT ; 1 COM-port
< Power Requirements: A power supply, capable of supporting 9-12V DC at about 1200
mA. Note that the power connector must be + at the shield and - in the centre.
< RS232 : An ‘extension’ (1:1) RS232 cable with DB9 m+f connectors
< A second VGA monitor (or any suitable display) for the graphic output
1. Combine the CPU-board and the graphic subboard
2. Connect the power supply
3. Switch on the board
the power-LEDs should light up
4. Connect the RS232 cable
from your PC to UART0
Connect the VGA cable to the VGA monitor
or use the pin-headers for other displays
The board is now ready to use.
© Fujitsu Microelectronics Europe GmbH - 9 -
Page 10

Cremson Starterkit User Manual
Chapter 2 Installation
2.2 Software Installation
Insert the provided CD-ROM, browse to the installation page for the “Modular Starterkit” and
select the Installation option for Softune Workbench. Follow the instructions in the
“Installation Guide” to unpack and install Softune Workbench for FR, as well as some
example projects and additional tools. It is recommended to use the default installation path
C:\Softune. Please use the available registration form to receive the installation password.
After the installation, you will find all language tools, the IDE and other system files within the
directory Softune\Bin. Samples for the Starterkit can be found in the Softune\sample
directory. The tools directory contains additional software tools (flashloader etc.).
Execute “FR Family Softune Workbench” from your Start-Menu.
If any errors occur during installation, remove any previous versions of Softune Workbench
from your PC and retry. Make sure you have enough disk space available and you have a
supported Windows OS installed. For more information see the provided installation
information and last-minute information.
Refer to the getting started session (next chapter) for more details on how to use Softune
Workbench for developing and debugging.
2.3 Download the debugging kernel (CPU-board F369 only)
You have to make sure that the debugging kernel is loaded to the internal flash ROM of the
MB91F369 MCU before you can use the monitor debugging features of the MB91F369 CPU
module. To do so, please follow these steps :
1. Locate the monitor debugger project in your sample-directory “MonDebADA91369”. In this
project you will find the load module “mondeb\Debug\ABS\MonDeb-ADA-91369.mhx” which
you have to program to the embedded flash. If this load module should not be present, you
have to open this workspace in Softune Workbench and re-build the project to have the mhxfile available for download.
2. To download the debugger kernel, open the provided MB91360 flash programmer
(contained in your tools-directory).
3. Select device type “MB91F365,6,7,8,9Gx”
4. Use browse to specify the above mhx file in the “file to program” field.
5. Select your COM-port (default is COM1) and any desired baudrate (default is 38400).
6. Make sure the CPU-module is switched off or in permanent reset. Now click on Automatic
Mode and immediately switch on the starterkit (or release the reset) to start the flash
programming. The flash programming sequence will be executed automatically.
CAUTION : DO NOT INTERRUPT THE FLASH PROGRAMMING OR CUT OFF THE
POWER DURING PROGRAMMING !
7. Wait until the programming sequence is finished. Reset the CPU-module after having
programmed the kernel successfully. Now your board is ready to be used with the Softune
workbench monitor debugger.
See the flashprogramming chapter for more details on how to program the embedded flash
of the MB91F369 MCU.
- 10 - © Fujitsu Microelectronics Europe GmbH
Page 11

Cremson Modular Starterkit
Chapter 3 Getting Started
3 Getting Started
Make sure you have Softune Workbench for FR and the additional tools (e.g. the
flashprogrammer) installed on your PC and the evaluation board is ready to use. Refer to
Chapter 2 for details on the hardware and software installation.
3.1 Using the MB91F362 CPU-module
If you have a system with the MB91F362 CPU module, you can not use the monitor
debugger. Instead, you have to program the application to the embedded flash. Therefore,
the provided examples are already linked for the embedded flash area of the MB91F362
(08:0000…0F:FFFF).
Creating applications for this board configuration could look like this :
1. Modify an existing project for the F362 CPU board and the GDC subboard
2. Compile&Link (Build) the project to create a valid loadmodule for the embedded flash
3. Use the MB91360 flash programmer tool to program the embedded flash
4. Test the application in stand-alone mode and continue at step 1.
3.2 Using the MB91F369 CPU-module
If you have a system with the MB91F369 CPU module, you are able to use the monitor
debugger of Softune workbench. Hence, the examples are linked for the additional
debugging RAM of the F369 CPU-module (80:0000…8F:FFFF). Your application will be
downloaded to the debugging RAM automatically by starting the debugger.
Alternatively, you can also program the application to the embedded flash of the MB91F369
to create a stand-alone application which starts immediately after a reset. To do so, you
have to re-link the application to the internal flash area (08:0000..0F:FFFF).
Creating applications for this board configuration could look like this :
1. Modify an existing project for the F369 CPU board and the GDC subboard
2. Compile&Link (Build) the project to create a valid loadmodule for the ext. RAM
3. Start the debugger to download the application to the ext RAM
4. Test and debug the application in the debugger
5. Return to the development area of Softune Workbench to make changes
6. Continue at step 2 until your project has reached a stable stage
7. Change the linker settings for internal flash (see Appendix)
5. Use the MB91360 flash programmer tool to program the embedded flash
6. Test the application stand-alone
7. Change the linker-settings and continue at step 1. if necessary
L Make sure to not overwrite the “security vector” (0x0FFEF4) – see hardware manual
L Use the provided templates to make sure the sections are located correctly
© Fujitsu Microelectronics Europe GmbH - 11 -
Page 12

Cremson Starterkit User Manual
Chapter 3 Getting Started
3.3 An Introduction to Softune Workbench – Creating projects
Start Softune Workbench. Select “File – Open Workspace” to load the first example
“VGATemplate_ xxx”. In the project tree on the left side, you can open the “source”-folder
which contains the source-files registered to this project. A double-click on one of the files
will invoke the built-in editor, which supports syntax-highlighting, tags and various other
functions.
Figure 1: Softune Workbench Editor
L You may customize the editor by a right-click on the editor window.
Whenever you make changes to your source-files, you have to re-compile and link the
related files to produce a valid loadmodule (ABS-file). This is done using the MAKE-function.
MAKE invokes the assembler, C-compiler and linker for FR whenever necessary (only the
changed files will be re-compiled).
- 12 - © Fujitsu Microelectronics Europe GmbH
Page 13

Cremson Modular Starterkit
Chapter 3 Getting Started
If you wish to re-compile the entire project regardless of any changes, you can use the
BUILD-function. To check for syntax-errors on a specific source-file, use the
COMPILE/ASSEMBLE function.
These three functions are available on the button-bar or from the main menu (Project –
Compile / Make / Build / Abort).
Click on MAKE or BUILD. Messages from the individual language tools will be fed into the
output window at the bottom of the main screen. If the tool chain (C-compiler → Assembler
→ Linker) was completed successfully, the message “No Error” will appear.
If you get any errors during compilation, an appropriate message will be generated. Try this
with a simple syntax-error (e.g. delete a semicolon “;” from the end of a C-line) and click on
MAKE again. You will now see a message like this:
Now Making...
main.c
*** c:\softune\sample\template_cpu369\src\main.c(42) E4062C: syntax error near `for'
------------------------------
Error detected.
------------------------------
To locate the position in the source-file, where the error has occurred, double-click on the
message. The editor will open the appropriate source-file, indicating the error highlighted in
red, depending on the customise settings of the editor. Correct the error and re-compile the
project as explained above.
If more errors occurred, you can go through the error list step by step using the menu “Edit –
Top/Previous/Next/Bottom Error” or using the appropriate buttons which have the same
functions:
L To get on-line help about a specific error, select the error message and press F1. In many
cases, you can get some useful hints how to solve the problem. Of cource, you can also
use the HELP-menu anytime during development or debugging.
© Fujitsu Microelectronics Europe GmbH - 13 -
Page 14

Cremson Starterkit User Manual
Chapter 3 Getting Started
3.4 Debugging with Softune Workbench
Note : You can use the Softune Workbench Monitor Debugger only with the F369 CPUboard ! However, the Simulator Debugger is always available (does not require any
hardware units).
Whenever you have successfully created a valid load module, you may switch from the
development mode to the debugging mode of Softune Workbench.
Basically, there are 3 types of debugging systems supported :
1. The software simulator: This type of debugger is always present and does not
require any special hardware extensions. The simulator will cover the FR-core
features, but no peripheral functions. Therefore, you can use the simulator to
verify program flow, check for dynamic errors, look at the generated assembler
code and so on.
2. The monitor debugger: This debugger type requires an evaluation board like the
modular Starterkit (MB91F369 module) connected to one of the COM-ports of
your PC. Therefore, make sure you have the evaluation board connected and
powered-up as described before. Explanations in this manual refer to the monitor
debugger only.
3. The emulator debugger: The in-circuit-emulator (ICE) is a system, which allows a
connection to any target system using a probe-cable. The appropriate system for
the MB91360 series is the MB2197-01 system. More information about this
system can be found on the Fujitsu website.
Which debugger is used for the actual project can be configured in the Project tree as shown
below or in the “Project – Setup Project – Debug” menu. By default, the monitor debugger is
selected for MB91F369 project examples :
The default settings for the monitor debugger are : COM-Port 1 at 57600Baud. If you wish
to change the COM-port, please right-click on the “MonDeb 57k6 COM1” entry and select
change.
Note : If you wish to change the Baudrate, you have to change the UART-settings in the
debugging kernel source project, re-compile and flash the new kernel to your MB91F369 first
before you can use another baudrate.
- 14 - © Fujitsu Microelectronics Europe GmbH
Page 15

Cremson Modular Starterkit
Chapter 3 Getting Started
If these settings are correct, start your debugging session :
First please make sure you are using the F369 CPU-board and your monitor-kernel is stored
in the flash memory of the MB91F369. Then please power up and reset the starterkit.
Start the debugger by double clicking the “MonDeb 57k6 COM1” entry in the project/debug
tree - or by using “Debug – Start Debug” from the menu. You should see a progress bar
indicating the download process.
If nothing happens, there will be an error message after some time (“Invalid communication
status”). Double-check the settings again as explained above. Also make sure the
evaluation-board is powered on, ready to use and the RS232-cable is connected properly.
Also see the trouble-shooting section in the appendix.
After starting the debugger, additional windows will appear which contain
locate-arrows for each (possible) source-line, the original source-code,
Figure 2: SWB Debugging window
breakpoint-indicators and the assembler code (in “mixed view”). The actual program position
will be indicated by a yellow line.
L You can choose “mixed view” from the context menu (right-click) to display source
and assembly code at the same time. To easily locate the actual line, use “go to current” !
© Fujitsu Microelectronics Europe GmbH - 15 -
Page 16

Cremson Starterkit User Manual
Chapter 4 Details of the included Monitor-Debugger
4 Details of the included Monitor-Debugger
4.1 Basic debugger features
GO: Executes the program continuously from the memory location pointed to by the
current program counter (PC) until a termination factor occurs.
STEP IN: Executes the program stepwise according to the listing in the source
window (steps in C- or ASM). Note that Interrupts are disabled during step execution !
STEP OVER: Executes the program stepwise except call-instructions (which will be
executed until return). Interrupts are not disabled during a continuous CALL...RETURN
execution.
STEP OUT: Executes the program continuously to the parent function (until
RETURN). Interrupts are enabled. Note, that debug information is required for this function.
EXECUTE UNTIL CURSOR: Automatically sets a breakpoint at the actual cursor
position and executes continuously until this breakpoint, which will be deleted
afterwards.
Each valid code line in a debugger window automatically has a locator (blue arrow) and a
breakpoint-option (circle). Note that some C-lines may not be displayed with locators and
breakpoints, because the compiler has created “optimized” assembler-code. Select “mixed
view” in order to check the compiler output.
Instead of single-steps, you may also use the arrows to directly execute your program until a
certain line of your source-code :
- 16 - © Fujitsu Microelectronics Europe GmbH
Page 17

Cremson Modular Starterkit
Chapter 4 Details of the included Monitor-Debugger
ABORT: Forcibly terminates execution.
CAUTION: This function can be used in single code line operations only
(example: for(k=DELAY_CONSTANT; k>0; k--); ) !!
To abort continous execution on the Starterkit, you have to use an external
interrupt. All examples provided use the „USER0“-button for this purpose.
L The USER0-button is an external interrupt source which will be initialized at the highest
priority. In the interrupt service routine you will find a software trap (INTE), which will
force the debugger to stop at this specific point. You may use traps also to intentionally
stop in your code for debugging purposes.
© Fujitsu Microelectronics Europe GmbH - 17 -
Page 18

Cremson Starterkit User Manual
Chapter 4 Details of the included Monitor-Debugger
4.2 Advanced debugger features
TOGGLE BREAKPOINT: Sets or deletes breakpoint at the current source line or :
To set or delete a breakpoint, click the circles at the beginning of a source-line.
A indicates an active breakpoint. Hit “go” to execute until this line. A list of all
breakpoints can be found under the “Debug – Breakpoint” menu. 255 Software-Breakpoints
(using TRAP replacement) are possible.
L To set breakpoints at positions which are currently not visible (e.g. because the source-
window of that module is not open), you can also enter a symbolic label directly in the
“Breakpoint” menu. Example: Enter “main” in the address-field and confirm. The new
breakpoint will automatically be assigned to the address of the “main()”-function.
REGISTER WINDOW: Displays the CPU-register window. Updated registers appear
in red. Setup in context menu defines which Registers should be displayed.
WATCH WINDOW: Displays the current variables to „watch“. Double-click on any
variable in your code then specify watch in context menu to add to watch window. All listed
variables in a watch window can be displayed in any number format. Use Edit to directly
change the contents.
MEMORY WINDOW: Displays memory areas in various formats defined by Setup
(context menu). Changing of address/data is possible when debugger is not executing.
Note : If you make changes to the ROM-area (800000..8FFFFF) it can affect the currently
loaded program !
The memory window can be very helpful to check the registers or the frame memory of the
connected graphic controller !
DISASSEMBLER: Disassembles the contents of the code memory beginning from
actual PC position and displays the result in a separate window. Individual
assembler-lines can be changed using the „inline assemble“-function.
- 18 - © Fujitsu Microelectronics Europe GmbH
Page 19

Cremson Modular Starterkit
Chapter 4 Details of the included Monitor-Debugger
DEBUG - STACK: Displays the current stack contents in terms of function calls.
Parameters, if any, are given in brackets.
DEBUG - VECTOR: Reads out and displays the actual interrupt-vector table. Use the „jump“
function to display any code areas pointed to by an interrupt vector (e.g. interrupt service
routines used in your program).
DEBUG - CALL: This function can be used to „call“ any routine defined in your code when
the debugger is halted.
Example: Enter „LCDprinthex(0x1234,4)“ from any example project. The number 1234 will
appear on the LCD. The function-call will be terminated by showing the result (here : none).
You may restore the debugging context by „Clear call“ if execution was stopped during the
function-call. Note that this example assumes that „LCDinitdisp“ was executed before.
DEBUG – LOAD TARGET FILE: Starts a new download of the current load module (ABS
file). Usually this function will be executed automatically after starting the debugger (defined
in debug settings ; see „Project-Setup-Debug“). However, this function can be useful to reinitialize the debugger for the current debug session.
VIEW - SYMBOL: This function displays all (global) symbols of the current project.
Information about the type (char, integer etc.) and the location (address in RAM or register)
can be shown using „detail“.
VIEW - LOCAL: Similar to View-Symbol, but only local variables of the current function are
shown.
VIEW - COMMAND: From this window, the debugger can be controlled using a command
line input. All GUI functions are available as individual commands.
Examples :
go
step
examine PDRN
set break main
Dump/Halfword 100000..1000ff
Shortcuts to complex commands can be defined (“alias”) and parameter strings can be
substituted by variables.
Example: candump = Dump/Halfword 100000..1000ff
A set of commands can be combined to a “macro”. Aliases and macros can be defined
using the command window context menu.
© Fujitsu Microelectronics Europe GmbH - 19 -
Page 20

Cremson Starterkit User Manual
Chapter 4 Details of the included Monitor-Debugger
Example: restart: set register PC=8f4000
set break main
go
In order to document or save debugging details such as memory contents, all outputs fed to
the command console can be written to a file (“logging”).
A whole “program” of commands (incl. flow control) can be written to a PRC-file and
executed. Procedure-files are simple text-files with the extension “.PRC” and can be created
by the Softune Workbench editor or any other text editor. To execute a procedure-file, use
the command window menu or the “file-open” menu during debugging.
L Procedure-files can be very helpful to automatically configure the debug-environment,
perform automated tests (e.g. when a new C-module has to be tested) or to enhance
basic emulator functions such as breakpoints. Using a procedure file, breakpoints can be
dynamically defined depending on program conditions. See the “Command Reference
Manual” (on-line help) for detailed information about the available command and
parameter syntax.
Some procedure file are already contained in your project directory as examples.
- 20 - © Fujitsu Microelectronics Europe GmbH
Page 21
Cremson Modular Starterkit
Chapter 5 Flash Programming
5 Flash Programming
Whenever your application has been developed, debugged and tested as explained in the
last chapter, it can be programmed to the internal flash ROM using the „MB91360 Flash
Programmer“. This tool is a general flash programming utility, which allows programming the
internal flash ROM without any restrictions given by the starterkit.
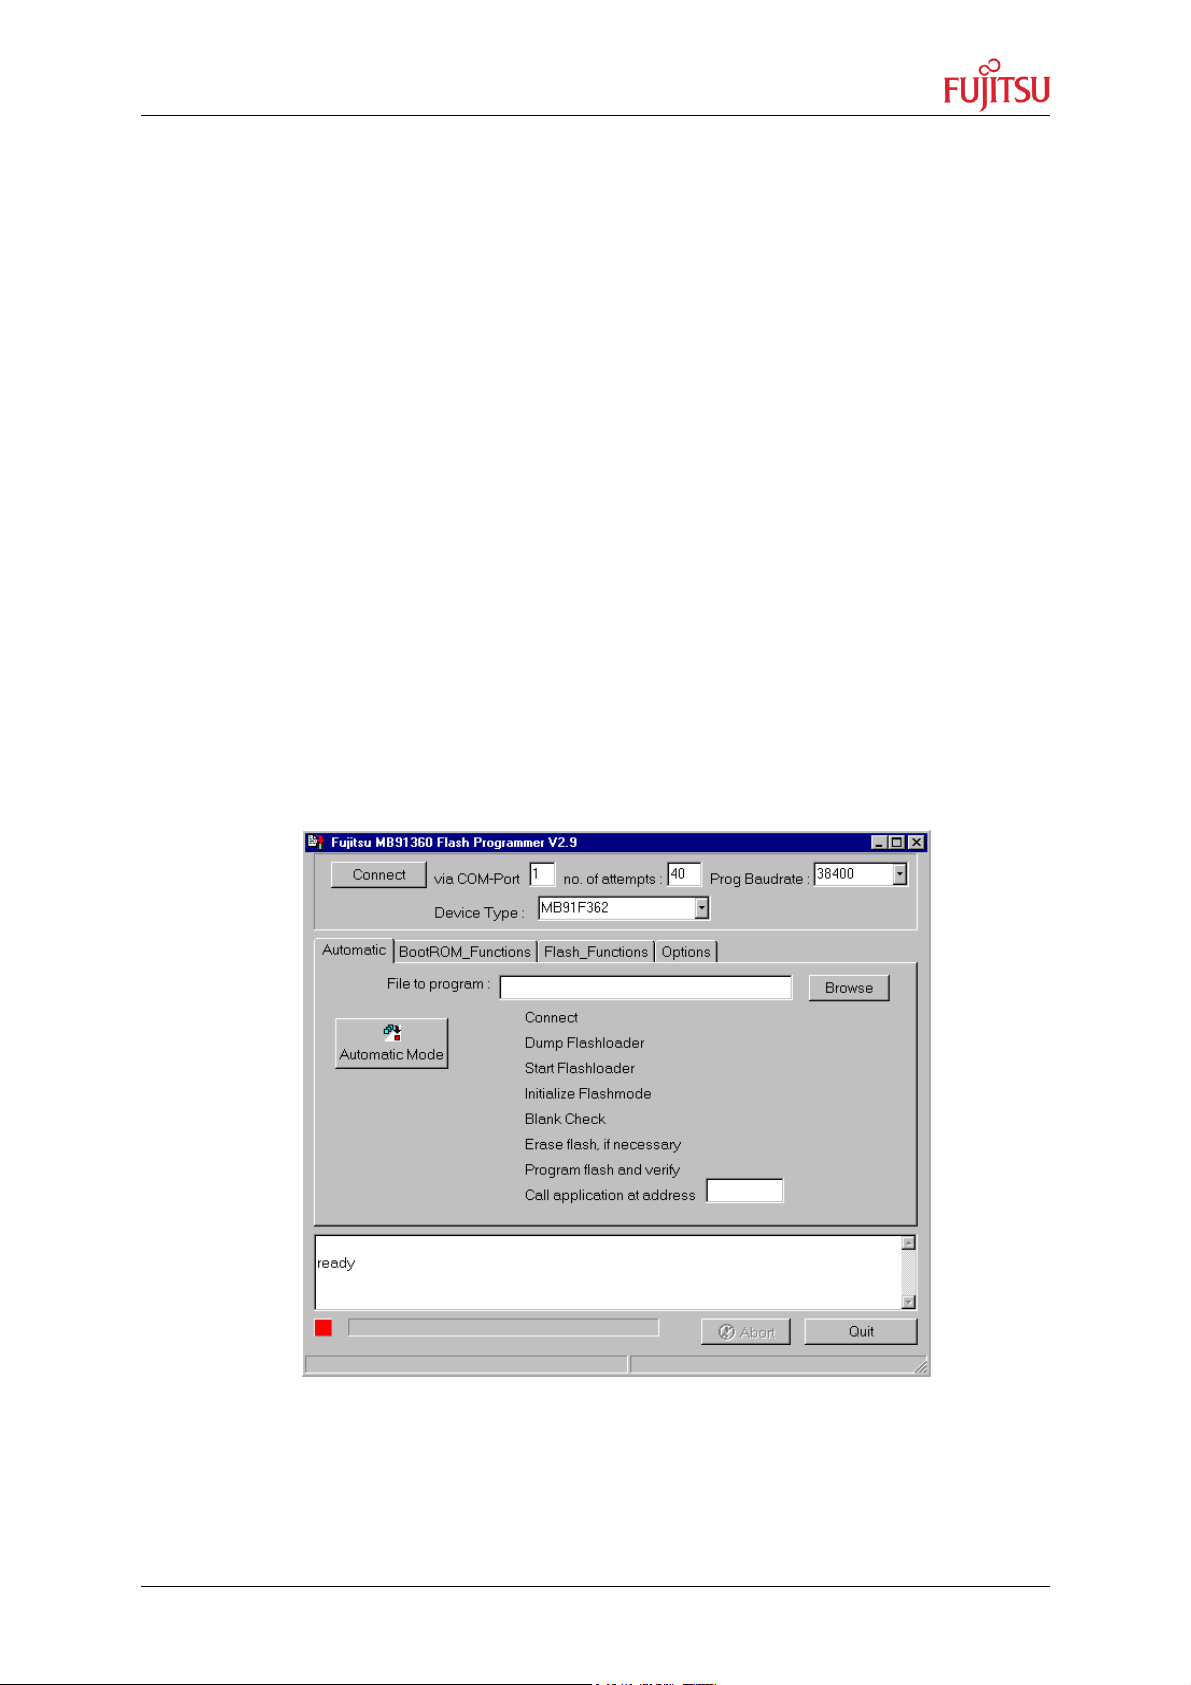
5.1 MB91360 Flash Programmer
The tool „MB91360 Flash Programmer“ is a general flash programming tool which does not
take care of the special features of this Starterkit. The tool can be used to program the
debugging kernel (MB91F369 board) or any applications linked for the embedded flash area
directly (without the possibility to have any debugging functions later on). In this case, the
evaluation board will act as a target system only.
CAUTION: Take special care not to write anything to location 0FFEF4, the „security vector“.
If you do, you will not be able to re-program the device ever again! See the hardware manual
for details!
Make sure you have installed the Flash Programmer from your CD-ROM. The package
includes the executable (Flashprg.exe) as well as some binary files (Brloadxx.bin) and a
user’s guide (Flashprg.pdf).
Figure 3: MB91360 Flash Programmer
© Fujitsu Microelectronics Europe GmbH - 21 -
Page 22

Cremson Starterkit User Manual
Chapter 5 Flash Programming
Follow these steps to use the MB91360 Flash Programmer :
1. Be sure to have the starterkit in single-chip mode. Check the position of the Mode
DIP-switches onboard according to table1.
2. Connect the RS232-cable from your PC-COM-port to “UART0” (female UART
connector on the left side of the board).
3. Specify a (hex-)file in the “file to program”-field (use the browse-button to select).
This file must be a converted linker output file from Softune in the Motorola HexFormat “*.MHX” (for programming your own applications, be sure to have the load
module converter started in Softune Workbench to generate MHX-files !).
4. Select the appropriate device type “MB91F365,6,7,8,9Gx” for the F369-board or
“MB91F362” for the F362-board
5. Select your COM-port (default is COM1) and any desired baudrate (default is 38400).
6. Make sure the CPU-module is switched off or in permanent reset. Now click on
Automatic Mode button and immediately switch on the starterkit (or release the reset)
to start the flash programming. The flash programming sequence will be executed
automatically.
7. CAUTION : DO NOT INTERRUPT THE FLASH PROGRAMMING OR CUT OFF THE
POWER DURING PROGRAMMING !
8. Wait until the programming sequence is finished.
9. After a successful programming procedure, press reset on the Starterkit and close
the program on the PC.
L The Flash Programmer uses the internal Boot-ROM functions instead of the monitor
kernel for flash programming. See the MB91360 hardware manuals for details.
For more information and trouble shooting, see the „MB91360 Serial flash programmer
user’s guide“ (Flashprg.pdf) which is included in the installation.
- 22 - © Fujitsu Microelectronics Europe GmbH
Page 23

Cremson Modular Starterkit
r
Chapter 6 CPU Board Hardware
6 CPU Board Hardware
Power
Switch
MCU
Peripherals1
8 LEDs
MCU
Peripherals2
UART0
connector
9-12V
DC Input
1MB
flash ROM
MCU
MB91F362
or
MB91F369
(+RAM)
Bus
connector
CAN0
connector
MCU Mode
DIP-Switch
Powe
Regulators
Reset and
User buttons
© Fujitsu Microelectronics Europe GmbH - 23 -
Page 24

Cremson Starterkit User Manual
Chapter 6 CPU Board Hardware
The evaluation board provides various IO-signals, which can be connected to external
devices. The controller resource functions are available on the connectors JH1
(Peripheral_1) and JH2 (Peripheral_2).
The graphic subboards can be connected via the address/data bus connectors on the richt
side JDH1 and JDH2. For more information please refer to the following pin assignments
and the schematics in the appendix.
6.1 Overview of Jumpers
Jumper Description Standard Setting Æ Jumper Position
JP7 UART1_RxD Choose RxD of synchron
or asynchron UART1
JP8 UART1_TxD Choose TxD of synchron
or asynchron UART1
JP9 UART1_Clock Clock-Select for UART1 in
syncronous mode
JP10 Flash_enable Enable Flash on CS2 or
CS3
JP11 FR_3V3 3,3 Volts CPU-net Closed
JP12 FR_5V0 5,0 Volts CPU-net Closed
JP13 Vcc3/C Bypass-Condensator
on/off
JP14 HVdd 5,0 Volts of high current
outputs
JP15 Avcc 5,0 Volts of analog net
(ADC and DAC)
JP16 HSTX Hardware-Standby 1-2
JP17 SELCLK Clock-Source (4Mhz /
32kHz)
JP18 4MHz 4MHz-Oszillator 1-2
JP19 32kHz 32kHz-Oszillator 2-3
JP20 VCI Filter for 32kHz-Oscillator 2-3
2-3
2-3
2-3
1-2
Closed
Closed
Closed
2-3
JP21 UART0_TxD MAX232 TxD to UART0 Closed
JP22 UART0_RxD MAX232 RxD to UART0 Closed
JP23 CAN0_TX PCA82C250 TxD to CAN0 Open
JP24 CAN0_RX PCA82C250 RxD to CAN0 Open
JP25 LEDs Enable LEDs Closed
Table 1: Configuration jumpers on CPU-board
- 24 - © Fujitsu Microelectronics Europe GmbH
Page 25

Cremson Modular Starterkit
Chapter 6 CPU Board Hardware
Jumper Description
JP1 Direct DC-Input (9-12V) Vcc/Gnd array for testpurposes
JP2 5V Vcc/Gnd array for testpurposes
JP3 3.3V Vcc/Gnd array for testpurposes
JP4 2.5V Vcc/Gnd array for testpurposes
JP5 2.5V Vcc/Gnd array for testpurposes
JP6 2.5V Vcc/Gnd array for testpurposes
JH1 MCU Peripherals 1
JH2 MCU Peripherals 2
TP1 GND Testpin
TP2 Monitor Clock output of MCU Testpin
JDH1
Bus connector for graphic subboards
JDH2
Table 2: Grouped jumpers on CPU Starterkit (see schematics for pin assignment!)
L Refer to the schematics of the CPU-board for details on the pin-assignment of the
grouped jumpers !
© Fujitsu Microelectronics Europe GmbH - 25 -
Page 26

7 . Appendix
7.1 Memory Mappings
Cremson Starterkit User Manual
Chapter 7 . Appendix
Figure 4: Memory Mapping MB91F369 CPU-board
- 26 - © Fujitsu Microelectronics Europe GmbH
Page 27

Cremson Modular Starterkit
Chapter 7 . Appendix
Figure 5: Memory Mapping MB91F362 CPU-board
© Fujitsu Microelectronics Europe GmbH - 27 -
Page 28

Cremson Starterkit User Manual
Chapter 7 . Appendix
7.2 Tool options for own projects
Valid load module files for different CPU boards can only be achieved if the language tool
configuration is appropriate. The most convenient way to create own projects is to copy the
provided Template-Projects from the sample-directory and use it as “blank sheet”.
Always check the Linker Settings (“Project – Setup Project – Linker – Disposition”) to make
sure the following memory map is applied according to your project configuration :
Recommended linker settings for MB91F369 CPU-Board for debugging
Memory Type Used for Area(s) Sections
Data RAM,
F-Bus RAM
Variables,Stack,
Displaylist
3D000..3FFFF
40000..43FFF
DATA, INIT, STACK,
(DISPLIST) = RAM_AREA
External Debug RAM Code 88:0000.. 8F:3FFF CODE = CODE_AREA
External Debug RAM Boot-Code 8F:4000..8F:FFFF START,INIT,CONST
=ROM_AREA
Note : Startup code must be located at 0x8F:4000 !
Table 3: Linker Settings for MB91F369 Debug-Configuration
Recommended linker settings for MB91F369 CPU-Board for embedded flash execution
Memory Type Used for Area(s) Sections
Data RAM,
F-Bus RAM
Variables,Stack,
Displaylist
3D000..3FFFF
40000..43FFF
DATA, INIT, STACK,
(DISPLIST) = RAM_AREA
Internal flash ROM Code 08:0000.. 0F:3FFF CODE = CODE_AREA
Internal flash ROM Boot-Code 0F:4000..0F:FFFF START,INIT,CONST
=ROM_AREA
Note : Startup code must be located at 0x0F:4000 !
Table 4: Linker Settings for MB91F369 Flash-Configuration
Recommended linker settings for MB91F362 CPU-Board (embedded flash only)
Memory Type Used for Area(s) Sections
Data RAM,
F-Bus RAM
Variables,Stack,
Displaylist
3D000..3FFFF
40000..40FFF
DATA, INIT, STACK,
(DISPLIST) = RAM_AREA
Internal flash ROM Code 08:0000.. 0F:3FFF CODE = CODE_AREA
Internal flash ROM Boot-Code 0F:4000..0F:FFFF START,INIT,CONST
=ROM_AREA
Note : Startup code must be located at 0x0F:4000 !
Table 5: Linker Settings for MB91F369 Debug-Configuration
- 28 - © Fujitsu Microelectronics Europe GmbH
Page 29

Cremson Modular Starterkit
Chapter 7 . Appendix
Checklist for project configuration :
• Make sure, the corect Target MCU (“Project – Setup Project - MCU” menu)
MB91F369 or MB91F362 is selected as the target MCU device.
• Use the correct linker settings as outlined above depending on your target MCU and
the target area (embedded flash or external debugging RAM).
• Make sure to not overwrite the “security vector” (0x0FFEF4) – see hardware manual.
• Use the provided templates to make sure the sections are located correctly.
• Always check the “map file” (use the context menu in the project-view and select
“open list file”) to see the used sections and addresses !
7.3 Starterkit limitations
If creating new projects, be sure not to use the following functions, which are reserved for
the Starterkit:
MB91F369 CPU-Board :
< Chip Selects :
CS0 is used for the external debugging RAM
CS2 is used for the external flash
CS3, CS4, CS5 are used for the graphic controller
< Memory area 0x0F:4000…0xF7:FFFF (embedded flash) is used by debugging kernel
< Memory area 0x9F:E000…0x9F:FFFF (external RAM) is used by debugging kernel
< Port N used for LEDs
< UART0 used for monitor debugger and flash programming
< External Interrupt 0 (used for Abort function)
MB91F362 CPU-Board :
< Chip Selects :
CS2 is used for the external flash
CS3, CS4, CS5 are used for the graphic controller
< Port J used for LEDs
< UART0 used for flash programming only
© Fujitsu Microelectronics Europe GmbH - 29 -
Page 30

Cremson Starterkit User Manual
Chapter 7 . Appendix
7.4 Provided Examples
After the installation you will find the follwing example sub-directories in your Softune/sample
directory. For each CPU-module and graphic subboard combinations you will find a number
of samples showing almost all features of the graphic controllers. The basis of most of the
examples is VGA resolution (640x480@60Hz). This allows to easily connect any standard
VGA-computer monitor and check the provided examples and features.
7.4.1 Examples for using the CPU-Board MB91F362 :
Examples_CPU362_Jasmine
SGA_Metrics_CPU362Jasmine
VGA_Bmp_CPU362Jasmine
VGA_CLUT_CPU362Jasmine
VGA_Layer_CPU362Jasmine
VGA_Metrics_CPU362Jasmine
VGA_Ortho_CPU362Jasmine
VGA_Temp_CPU362Jasmine
VGA_Text_CPU362Jasmine
VGA_VIC_CPU362Jasmine
XGA_Metrics_CPU362Jasmine
Examples_CPU362_Cremson
PrimDemo_CPU362Cremson
SVGATemplate_CPU362Cremson
VGATemplate_CPU362Cremson
XGATemplate_CPU362Cremson
Examples_CPU362_Scarlet
BMPinextflash_CPU362
GeoDemo_CPU362Scarlet
PrimDemo_CPU362Scarlet
QVGATemplate_CPU362Scarlet
ShowExtBMP_CPU362Scarlet
SVGATemplate_CPU362Scarlet
VGATemplate_CPU362Scarlet
VideoDemo_CPU362Scarlet
XGATemplate_CPU362Scarlet
- 30 - © Fujitsu Microelectronics Europe GmbH
Page 31

Cremson Modular Starterkit
Chapter 7 . Appendix
7.4.2 Examples for using the CPU-Board MB91F369 :
Examples_CPU369_Jasmine
SGA_Metrics_CPU369Jasmine
VGA_Bmp_CPU369Jasmine
VGA_CLUT_CPU369Jasmine
VGA_Layer_CPU369Jasmine
VGA_Metrics_CPU369Jasmine
VGA_Ortho_CPU369Jasmine
VGA_Temp_CPU369Jasmine
VGA_Text_CPU369Jasmine
VGA_VIC_CPU369Jasmine
XGA_Metrics_CPU369Jasmine
Examples_CPU369_Cremson
PrimDemo_CPU369Cremson
SVGATemplate_CPU369Cremson
VGATemplate_CPU369Cremson
XGATemplate_CPU369Cremson
Examples_CPU369_Scarlet
BMPinextflash_CPU369
GeoDemo_CPU369Scarlet
PrimDemo_CPU369Scarlet
QVGATemplate_CPU369Scarlet
ShowExtBMP_CPU369Scarlet
SVGATemplate_CPU369Scarlet
VGATemplate_CPU369Scarlet
VideoDemo_CPU369Scarlet
XGATemplate_CPU369Scarlet
© Fujitsu Microelectronics Europe GmbH - 31 -
Page 32

Cremson Starterkit User Manual
Chapter 7 . Appendix
7.4.3 Examples for the CPU-Board MB91F369 without any graphic subboard :
Examples_CPU369only
MonDeb-ADA-91369 Monitor Debugger kernel
MonDeb-ADA-91369-RLTimer Example using a Timer
MonDeb-ADA-91369-Template Example for projects with debugger
Template_CPU369 Example for projects without debugger
NOTE : The project MonDeb-ADA-91369 is the debugger kernel itself. This project needs to
be programmed to the embedded flash of the MB91369 before you can use the debugging
features of Softune Workbench. If you want to change UART, Abort-Button or other settings
you need to modify this project. We recommend that you save a copy of the original monitor
debugger on your local hard disk anyway.
The project Template_CPU369 is a project for using the CPU-board with F369 without
debugger (linked for the embedded flash).
7.4.4 Segger “emWin” example for Jasmine
The provided example project for Jasmine demonstrates how to use the “emWin” graphic
library from Segger. emWin is designed to provide an efficient, processor- and LCD
controller-independent graphical user interface (GUI) for any application that operates with a
graphical LCD. It is compatible with single-task and multitask environments, with a
proprietary operating system or with any commercial RTOS. emWin is shipped as "C" source
code. For more information please refer to the readme-information in the project directory or
read about emWin here : http://www.segger.de
- 32 - © Fujitsu Microelectronics Europe GmbH
Page 33

Cremson Modular Starterkit
Chapter 7 . Appendix
7.5 Related Documents
Other available manuals for the starterkit :
< Board Manual and schematics for F362 CPU Module
< Board Manual and schematics for F369 CPU Module
< Board Manual and schematics for Jasmine Graphic Subboard
< Board Manual and schematics for Lavender Graphic Subboard
< Board Manual and schematics for Cremson Graphic Subboard
< Board Manual and schematics for Scarlet Graphic Subboard
< MB87J2120 and MB87P2020A Hardware Manual
< MB86290A Hardware Manual
< MB86291A Hardware Manual
< API Manual for MB8629x Series
< API Manual for Lavender/Jasmine Series
< MB91360 Hardware Manual
< FR Family C-Compiler Manual
< FR Family Instruction Manual
< FR Family Assembler Manual
< FR Family Simulator Manual
< FR Family Linkage Kit Manual
< FR Family Softune Workbench Manual
Note : More updated documents are available from the provided CD-ROM, Fujitsu’s
Microcontroller CD-ROMs or from our technical web-site : http://www.fme.gsdc.de/gsdc.htm
© Fujitsu Microelectronics Europe GmbH - 33 -
Page 34

Cremson Starterkit User Manual
Chapter 7 . Appendix
7.6 Related Partnumbers
Graphic Controller related Partnumbers Description
CPU Module using MB91F362 for the Cremson Modular
CREMSON-STARTERKIT-CPU
CREMSON-STARTERKITCPU369
CREMSON-STARTERKIT-CRM Cremson (MB86290) sub-board for the Starterkit
CREMSON-STARTERKIT-ROSE Scarlet (MB86291) sub-board for the Starterkit
CREMSON-STARTERKIT-JAS Jasmine (MB87P2020) sub-board for the Starterkit
CREMSON-STARTERKIT-LAV Lavender (MB87J2120) sub-board for the Starterkit
MB86290EB01 Cremson PCI board for standard PC's
MB86291EB01 Scarlet PCI board for standard PC's
MB86292EB01 Orchid PCI board for standard PC's
Starterkit
CPU Module using MB91F369 + Debugging RAM for the
Cremson Modular Starterkit
MB8629XEB01 Coral Family - PCI Motherboard (Coral Q & B)
MB86293EB01 Coral Q Daughterboard
MB86294EB01 Coral B Daughterboard
MB86295EB01 Coral P PCI Evaluationboard
Table 6: Related Graphic Controller Partnumbers
Microcontroller related Partnumbers Description
ADA-91362-91369-RAM CPU Adapter for MB91F369 + RAM
MB2197-01 FR Emulator Main Unit
MB2197-10 DSU cable
MB2197-120 Emulation Adapter Board
MB21197-127-3V3 Probe-Cable for MB91F362
FR360-PROBE-160 Probe-Cable for MB91F369
MB91FV360GA-CR Evaluation Chip
Table 7: Related Microcontroller Partnumbers
- 34 - © Fujitsu Microelectronics Europe GmbH
Page 35

Cremson Modular Starterkit
Chapter 7 . Appendix
7.7 Trouble Shooting
Problem Solution
Evaluationboard does not power-on
correctly. Some or all of the power
LEDs (D4,D7,D10,D13, D16) on the
CPU module do not light up.
Check voltage supply and jumpers :
∗ The voltage on DC-Power plug should be in
the range of 9-12V. The plug should have + on
shield and – on the center. The power supply
should be able to supply 1200mA to support
both, the CPU-module and the graphic
subboard.
* The LEDs should light up after switching on
the board. Use a multimeter to see whether
5V,3.3V and 2.5V are present on the Vcc/Gnd
terminals (JP2,3,4,5,6).
∗ Check jumper positions according to table 1
(Esp. : JP11 – JP15) !
∗ Remove all user extensions on the CPU
module and on the subboard
Evaluationboard stays in reset.
LED D25 (Reset indicator) ligths up
permanently.
∗ LED D25 (Reset) should flash. If D25 lights
up permantantly, the voltage is too low (below
4.25V) - Increase the voltage to solve the
problem.
∗ Remove all user extensions on the board to
avoid shorts or leakage currents !
The communication from Softune
Workbench to the evaluation board
fails (Communication errors)
∗ Make sure your COM-port number and the
baudrate settings are correct (see debugger
introduction). The default COM-port is 1 and
the default baudrate is 57600Baud.
∗ Make sure no other programs are using the
same COM-port on your PC. Close all other
applications (e.g. Flash programmer utilities,
terminals etc.)
* Check if RTS/CTS is closed on the CPU
module (check if pin 7-8 are connected).
* Use only an RS232 extension 1:1 cable
The program stops at the label
„uninitialized interrupt !“
∗ Before downloading a new project to the
evaluation board, re-initialize your CPU-board
using the reset button. This will erase all valid
interrupt definitions from previous programs
executed on the starterkit.
The abort switch (USER0) does not
work correctly.
* make sure you are using a debugging kernel
which is configured for using the USER0-
button as abort switch. See the description of
the monitor debugger project for more details
how to configure the kernel software.
* make sure not to mask the interrupts
© Fujitsu Microelectronics Europe GmbH - 35 -
Page 36

Cremson Starterkit User Manual
Chapter 7 . Appendix
Problem Solution
The windows of the debugger are
empty.
* This is due to a wrong (maybe old) path
information. Closing all windows in the
debugger should fix the problem.
When trying to program the
application to the embedded flash, the
programmer stops at first address with
“loading error” !
Hardware units such as LEDs, user
buttons, UART0 or CAN are not
working.
* You are probably trying to program a
program to the flash which is linked for the
external RAM area. See Appendix for details
on the linker settings.
∗ Make sure you have enabled these units on
the evaluation board using the appropriate
jumpers (e.g. JP25 for LEDs). See the
provided examples and the hardware manual
for information on how to control the
peripherals.
CAN devices do not respond
∗ Adjust the potentiometer RV2 (slew rate)
according to the line.
Table 8: Trouble Shooting
For more information see the Softune Workbench on-line help, the provided manuals, last
minute information and additional or updated documentation on our web-site.
- 36 - © Fujitsu Microelectronics Europe GmbH
 Loading...