

Page 1

FUJITSU SEMICONDUCTOR
CONTROLLER MANUAL
SOFTUNE
CM71-00329-7E
FR FAMILY
TM
WORKBENCH
USER’S MANUAL
for V6
Page 2

Page 3

SOFTUNE
USER’S MANUAL
FR FAMILY
TM
WORKBENCH
for V6
FUJITSU SEMICONDUCTOR LIMITED
Page 4

Page 5

Preface
■ What is the SOFTUNE Workbench?
SOFTUNE Workbench is support software for developing programs for the FR families of
microprocessors / microcontrollers.
It is a combination of a development manager, simulator debugger, emulator debugger, monitor debugger,
and an integrated development environment for efficient development.
■ Purpose of this manual and target readers
This manual explains the functions of SOFTUNE Workbench. This manual is intended for engineers
developing various types of products using SOFTUNE Workbench. Be sure to read this manual
completely.
■ Trademarks
REALOS, SOFTUNE are trademark of Fujitsu Semiconductor Limited, Japan.
The company names and brand names herein are the trademarks or registered trademarks of their respective
owners.
■ Organization of Manual
This manual consists of two chapters.
CHAPTER1 Basic Functions
This chapter describes the basic functions on the SOFTUNE Workbench.
CHAPTER2 Dependence Functions
This chapter describes the functions dependent on each Debugger.
i
Page 6

• The contents of this document are subject to change without notice.
Customers are advised to consult with sales representatives before ordering.
• The information, such as descriptions of function and application circuit examples, in this document are presented solely for the
purpose of reference to show examples of operations and uses of FUJITSU SEMICONDUCTOR device; FUJITSU
SEMICONDUCTOR does not warrant proper operation of the device with respect to use based on such information. When you
develop equipment incorporating the device based on such information, you must assume any responsibility arising out of such
use of the information. FUJITSU SEMICONDUCTOR assumes no liability for any damages whatsoever arising out of the use
of the information.
• Any information in this document, including descriptions of function and schematic diagrams, shall not be construed as license
of the use or exercise of any intellectual property right, such as patent right or copyright, or any other right of FUJITSU
SEMICONDUCTOR or any third party or does FUJITSU SEMICONDUCTOR warrant non-infringement of any third-party's
intellectual property right or other right by using such information. FUJITSU SEMICONDUCTOR assumes no liability for any
infringement of the intellectual property rights or other rights of third parties which would result from the use of information
contained herein.
• The products described in this document are designed, developed and manufactured as contemplated for general use, including
without limitation, ordinary industrial use, general office use, personal use, and household use, but are not designed, developed
and manufactured as contemplated (1) for use accompanying fatal risks or dangers that, unless extremely high safety is secured,
could have a serious effect to the public, and could lead directly to death, personal injury, severe physical damage or other loss
(i.e., nuclear reaction control in nuclear facility, aircraft flight control, air traffic control, mass transport control, medical life
support system, missile launch control in weapon system), or (2) for use requiring extremely high reliability (i.e., submersible
repeater and artificial satellite).
Please note that FUJITSU SEMICONDUCTOR will not be liable against you and/or any third party for any claims or damages
arising in connection with above-mentioned uses of the products.
• Any semiconductor devices have an inherent chance of failure. You must protect against injury, damage or loss from such
failures by incorporating safety design measures into your facility and equipment such as redundancy, fire protection, and
prevention of over-current levels and other abnormal operating conditions.
• Exportation/release of any products described in this document may require necessary procedures in accordance with the
regulations of the Foreign Exchange and Foreign Trade Control Law of Japan and/or US export control laws.
• The company names and brand names herein are the trademarks or registered trademarks of their respective owners.
Copyright ©2002-2011 FUJITSU SEMICONDUCTOR LIMITED All rights reserved.
ii
Page 7

CONTENTS
CHAPTER1 Basic Functions .......................................................................................... 1
1.1 Workspace Management Function ..................................................................................................... 2
1.2 Project Management Function ............................................................................................................ 3
1.3 Project Dependence ........................................................................................................................... 5
1.4 Make/Build Function ........................................................................................................................... 6
1.4.1 Customize Build Function .............................................................................................................. 7
1.5 Include Dependencies Analysis Function ........................................................................................... 9
1.6 Functions of Setting Tool Options ..................................................................................................... 10
1.7 Error Jump Function ......................................................................................................................... 11
1.8 Editor Functions ................................................................................................................................ 13
1.9 Storing External Editors .................................................................................................................... 15
1.10 Storing External Tools ...................................................................................................................... 17
1.11 Macro Descriptions Usable in Manager ............................................................................................ 18
1.12 Setting Operating Environment ......................................................................................................... 22
1.13 Debugger Types ............................................................................................................................... 23
1.14 Memory Operation Functions ........................................................................................................... 24
1.15 Register Operations .......................................................................................................................... 25
1.16 Line Assembly and Disassembly ...................................................................................................... 26
1.17 Symbolic Debugging ......................................................................................................................... 27
1.17.1 Referring to Local Symbols ......................................................................................................... 29
1.17.2 Referring to C/C++ Variables ...................................................................................................... 30
CHAPTER2 Dependence Functions ............................................................................ 33
2.1 Simulator Debugger .......................................................................................................................... 34
2.1.1 Instruction Simulation .................................................................................................................. 36
2.1.2 Memory Simulation ...................................................................................................................... 37
2.1.3 I/O Port Simulation ...................................................................................................................... 38
2.1.4 Interrupt Simulation ..................................................................................................................... 39
2.1.5 Reset Simulation ......................................................................................................................... 40
2.1.6 Low Power Consumption Mode Simulation ................................................................................. 41
2.1.7 STUB Function ............................................................................................................................ 42
2.1.8 Break ........................................................................................................................................... 43
2.1.8.1 Code Break ............................................................................................................................... 44
2.1.8.2 Data Break ................................................................................................................................ 45
2.1.8.3 Trace Buffer-full Break .............................................................................................................. 46
2.1.8.4 Guarded Access Break ............................................................................................................. 47
2.1.8.5 Forced Break ............................................................................................................................ 48
2.1.9 Measuring Execution Cycle Count .............................................................................................. 49
2.1.10 Trace ........................................................................................................................................... 50
2.1.10.1 Trace Sampling ........................................................................................................................ 51
2.1.10.2 Setting Trace ............................................................................................................................ 52
2.1.10.3 Displaying Trace Data .............................................................................................................. 53
2.1.10.4 Display Format of Trace Data ................................................................................................... 54
iii
Page 8

2.1.10.5 Searching Trace Data ............................................................................................................... 55
2.1.10.6 Saving Trace Data .................................................................................................................... 56
2.1.10.7 Clearing Trace Data ................................................................................................................. 57
2.1.11 Measuring Coverage ................................................................................................................... 58
2.1.11.1 Coverage Measurement Procedures ........................................................................................ 59
2.1.12 Checking Debugger Status .......................................................................................................... 62
2.2 Emulator Debugger (MB2197) .......................................................................................................... 65
2.2.1 Setting Operating Environment ................................................................................................... 66
2.2.1.1 MCU Operation Mode ............................................................................................................... 67
2.2.1.2 DRAM Refresh Control ............................................................................................................. 68
2.2.1.3 Cache Flush Control ................................................................................................................. 69
2.2.1.4 Operating Frequency ................................................................................................................ 70
2.2.2 Notes on Executing Program ....................................................................................................... 71
2.2.3 Commands Available during Execution of User Program ........................................................... 72
2.2.4 Break ........................................................................................................................................... 73
2.2.4.1 Code Break ............................................................................................................................... 74
2.2.4.2 Code Event Break .................................................................................................................... 76
2.2.4.3 Data Event Break ..................................................................................................................... 77
2.2.4.4 Trace Buffer-full Break .............................................................................................................. 78
2.2.4.5 Alignment Error Break .............................................................................................................. 79
2.2.4.6 External Trigger Break .............................................................................................................. 80
2.2.4.7 Forced Break ............................................................................................................................ 81
2.2.5 Measuring Execution Cycle Count .............................................................................................. 82
2.2.6 Trace ........................................................................................................................................... 83
2.2.6.1 Trace Data ................................................................................................................................ 84
2.2.6.2 Trace Sampling ........................................................................................................................ 85
2.2.6.3 Setting Trace ............................................................................................................................ 86
2.2.6.4 Displaying Trace Data .............................................................................................................. 87
2.2.6.5 Display Format of Trace Data ................................................................................................... 88
2.2.6.6 Searching Trace Data ............................................................................................................... 89
2.2.6.7 Saving Trace Data .................................................................................................................... 90
2.2.6.8 Clearing Trace Data ................................................................................................................. 91
2.2.6.9 Notes on Use of Tracing Function ............................................................................................ 92
2.2.7 Inaccessible Area ........................................................................................................................ 94
2.2.8 Checking Debugger Status .......................................................................................................... 95
2.3 Emulator Debugger (MB2198) .......................................................................................................... 98
2.3.1 Setting Operating Environment ................................................................................................. 100
2.3.1.1 Monitoring Program Automatic Loading ................................................................................. 101
2.3.1.2 MCU Operation Mode ............................................................................................................. 102
2.3.1.3 Cache Flush Control ............................................................................................................... 103
2.3.1.4 Operating Frequency .............................................................................................................. 104
2.3.1.5 External Memory Emulation ................................................................................................... 105
2.3.1.6 Debug mode ........................................................................................................................... 106
2.3.2 Notes on Executing Program ..................................................................................................... 107
2.3.3 Commands Available during Execution of User Program ......................................................... 108
2.3.4 Break ......................................................................................................................................... 110
2.3.4.1 Code Break ............................................................................................................................. 111
iv
Page 9

2.3.4.2 Data Break .............................................................................................................................. 113
2.3.4.3 Code Event Break .................................................................................................................. 114
2.3.4.4 Data Event Break ................................................................................................................... 116
2.3.4.5 Trace Buffer-full Break ............................................................................................................ 118
2.3.4.6 Alignment Error Break ............................................................................................................ 119
2.3.4.7 External Trigger Break ............................................................................................................ 120
2.3.4.8 Forced Break .......................................................................................................................... 121
2.3.4.9 Data Watch Break .................................................................................................................. 122
2.3.5 Control by Sequencer ................................................................................................................ 124
2.3.6 Measuring Execution Cycle Count ............................................................................................ 127
2.3.7 Trace ......................................................................................................................................... 128
2.3.7.1 Display Format of Trace Data ................................................................................................. 132
2.3.7.2 Saving Trace Data .................................................................................................................. 133
2.3.7.3 Notes on Use of Tracing Function .......................................................................................... 134
2.3.8 Measuring Performance ............................................................................................................ 136
2.3.8.1 Performance Measurement Procedures ................................................................................. 137
2.3.8.2 Displaying Performance Measurement Data .......................................................................... 139
2.3.9 Real-time Monitoring ................................................................................................................. 140
2.3.10 Power-on Debugging ................................................................................................................. 141
2.3.11 Inaccessible Area ...................................................................................................................... 142
2.3.12 RAM Checker ............................................................................................................................ 143
2.3.13 Checking Debugger Status ........................................................................................................ 147
2.4 Emulator Debugger (MB2100-01) ................................................................................................... 150
2.4.1 Starting debugging .................................................................................................................... 151
2.4.1.1 Power-on Reset ...................................................................................................................... 152
2.4.1.2 Operating Environments of the Target ................................................................................... 153
2.4.1.3 Security ................................................................................................................................... 155
2.4.2 Ending debugging ...................................................................................................................... 156
2.4.3 Efficiently Executing Debugging ................................................................................................ 157
2.4.3.1 Increasing Communication Speed during Debugging ............................................................ 158
2.4.3.2 Switching Debug Function ...................................................................................................... 159
2.4.4 Executing Program .................................................................................................................... 160
2.4.4.1 Setting/Release of Debug Functions ...................................................................................... 161
2.4.4.2 Monitoring ............................................................................................................................... 163
2.4.4.3 Power-on Debug ..................................................................................................................... 164
2.4.5 To Access the Flash Memory .................................................................................................... 166
2.4.6 To Interrupt the Program Execution [Break] .............................................................................. 170
2.4.6.1 Code Break (Hardware) .......................................................................................................... 171
2.4.6.2 Code Break (Software) ........................................................................................................... 173
2.4.6.3 Data Break .............................................................................................................................. 175
2.4.6.4 Trace Trigger Break ................................................................................................................ 176
2.4.6.5 Forced Break .......................................................................................................................... 177
2.4.6.6 Data Watch Break .................................................................................................................. 178
2.4.6.7 Sequencer .............................................................................................................................. 180
2.4.6.8 Guarded Access Break ........................................................................................................... 182
2.4.7 Measuring the Program Execution Time ................................................................................... 183
2.4.7.1 Measuring the Program Execution Cycle Count ..................................................................... 184
v
Page 10

2.4.7.2 Measuring Event-to-Event Execution Cycle Count [Performance Measurement] .................. 186
2.4.8 Viewing Program Execution History [Trace] .............................................................................. 189
2.4.8.1 Displaying Trace Data ............................................................................................................ 191
2.4.8.2 Saving Trace Data .................................................................................................................. 198
2.4.8.3 Searching for Trace Data ....................................................................................................... 199
2.4.8.4 Obtaining Only Trace Data with Specified Attributes .............................................................. 200
2.4.8.5 Ending Trace Acquisition in Specified Conditions .................................................................. 201
2.4.9 Disabling Memory Access to Specified Area ............................................................................. 202
2.4.10 Displaying Messages Output from the User Program on Debugger ......................................... 203
2.4.11 Checking Debugger Status ........................................................................................................ 205
2.5 Monitor Debugger ........................................................................................................................... 208
2.5.1 Resources Used by Monitor Program ....................................................................................... 209
2.5.2 Break ......................................................................................................................................... 210
2.5.2.1 Software Break ....................................................................................................................... 211
2.5.2.2 Forced Break .......................................................................................................................... 212
2.5.3 Measuring Execution Time ........................................................................................................ 213
2.5.4 Inaccessible Area ...................................................................................................................... 214
INDEX................................................................................................................................... 215
vi
Page 11

CHAPTER1
Basic Functions
This chapter describes the basic functions on the
SOFTUNE Workbench.
1.1 Workspace Management Function
1.2 Project Management Function
1.3 Project Dependence
1.4 Make/Build Function
1.5 Include Dependencies Analysis Function
1.6 Functions of Setting Tool Options
1.7 Error Jump Function
1.8 Editor Functions
1.9 Storing External Editors
1.10 Storing External Tools
1.11 Macro Descriptions Usable in Manager
1.12 Setting Operating Environment
1.13 Debugger Types
1.14 Memory Operation Functions
1.15 Register Operations
1.16 Line Assembly and Disassembly
1.17 Symbolic Debugging
1
Page 12

CHAPTER1 Basic Functions
1.1 Workspace Management Function
This section explains the workspace management function of SOFTUNE Workbench.
■ Workspace
SOFTUNE Workbench uses workspace as a container to manage two or more projects including
subprojects.
For example, a project that creates a library and a project that creates a target file using the project can be
stored in one workspace.
■ Workspace Management Function
To manage two or more projects, workspace manages the following information:
• Project
• Active project
• Subproject
■ Project
The operation performed in SOFTUNE Workbench is based on the project. The project is a set of files and
procedures necessary for creation of a target file. The project file contains all data managed by the project.
■ Active Project
The active project is basic to workspace and undergoes [Make], [Build], [Compile/Assemble], [Start Debug],
and [Include Dependencies] in the menu. [Make], [Build], [Compile/Assemble], and [Include Dependencies]
affect the subprojects within the active project.
If workspace contains some project, it always has one active project.
■ Subproject
The subproject is a project on which other projects depend. The subproject target files are linked together
when creating parent project target files that have dependent relationships. When making/building a parent
project, the subproject which has a dependent relationships is make/build first before executing the make/
build for the parent project. If making and building of the subproject is unsuccessful, the parent project of
the subproject will not be made and built.
The target file in the subproject is however not linked with the parent project when:
• An absolute (ABS)-type project is specified as a subproject.
• A library (LIB)-type project is specified as a subproject.
■ Restrictions on Storage of Two or More Projects
Only one REALOS-type project can be stored in one workspace.
2
Page 13

CHAPTER1 Basic Functions
1.2 Project Management Function
This section explains the project management function of SOFTUNE Workbench.
■ Project Management Function
The project manages all information necessary for development of a microcontroller system.
- Project configuration
- Active project configuration
- Information on source files, include files, other object files, library files
- Information on tools executed before and after executing language tools (customize build function)
■ Project format
The project file supports two formats: a 'workspace project format,' and an 'old project format.'
The differences between the two formats are as follows:
● Workspace project format
- Supports management of two or more project configurations
- Supports use of all macros usable in manager
- Does not support early Workbench versions *
● Old project format
- Supports management of just one project configuration
- Limited number of macros usable in manager
For details, refer to Section "1.11 Macro Descriptions Usable in Manager".
- Supports early Workbench versions *
When a new project is made, the workspace project format is used.
When using an existing project, the corresponding project format is used.
If a project made by an early Workbench version* is used, dialog asking whether to convert the file to the
workspace project format is opened. For details, refer to Section "2.13 Reading SOFTUNE Project Files of
Old Versions" in "SOFTUNE Workbench Operation Manual".
To open a project file in the workspace project format with an early Workbench version*, it is necessary to
convert the file to the old project format. For saving the file in other project formats, refer to Section "4.2.7
Save As" in "SOFTUNE Workbench Operation Manual".
*: FR V5: V50L03 or earlier
FR V3: V30L26 or earlier.
3
Page 14

CHAPTER1 Basic Functions
■ Project Configuration
The project configuration is a series of settings for specifying the characteristics of a target file, and
making, building, compiling and assembling is performed in project configurations.
Two or more project configurations can be created in a project. The default project configuration name is
Debug. A new project configuration is created on the setting of the selected existing project configuration.
In the new project configuration, the same files as those in the original project configuration are always
used.
By using the project configuration, the settings of programs of different versions, such as the optimization
level of a compiler and MCU setting, can be created within one project.
In the project configuration, the following information is managed:
• Name and directory of target file
• Information on options of language tools to create target file by compiling, assembling and linking
source files
• Information on whether to build file or not
• Information on setting of debugger to debug target file
■ Active Project Configuration
The active project configuration at default undergoes [Make], [Build], [Compile/Assemble], [Start Debug],
and [Include Dependencies].
Note:
The setting of the active project configuration is used for the file state displayed in the SRC tab of project
window and includes files detected in the [Dependencies] folder.
If a macro function newly added is used in old project format, the macro description is expanded at
the time of saving in old project format. For the macro description newly added, refer to Section
"1.11 Macro Descriptions Usable in Manager".
4
Page 15

CHAPTER1 Basic Functions
1.3 Project Dependence
This section explains the project dependence of SOFTUNE Workbench.
■ Project Dependence
If target files output by other projects must be linked, a subproject is defined in the project required in the
[Project] - [Project Dependence] command. The subproject is a project on which other projects depend.
By defining project dependence, a subproject can be made and built to link its target file before making and
building the parent project.
The use of project dependence enables simultaneous making and building of two or more projects
developed in one workspace.
A project configuration in making and building a subproject in the [Project] - [Configuration] - [Set Build
Configuration] command can be specified.
5
Page 16

CHAPTER1 Basic Functions
1.4 Make/Build Function
This section explains the make/build function of SOFTUNE Workbench.
■ Make Function
Make function generates a target file by compiling/assembling only updated source files from all source
files registered in a project, and then joining all required object files.
This function allows compiling/assembling only the minimum of required files. The time required for
generating a target file can be sharply reduced, especially, when debugging.
For this function to work fully, the dependence between source files and include files should be accurately
grasped. To do this, SOFTUNE Workbench has a function for analyzing include dependence. To perform
this function, it is necessary to understand the dependence of a source file and include file. SOFTUNE
Workbench has the function of analyzing include dependence. For details, refer to Section "1.5 Include
Dependencies Analysis Function".
■ Build Function
Build function generates a target file by compiling/assembling all source files registered with a project,
regardless of whether they have been updated or not, and then by joining all required object files. Using
this function causes all files to be compiled/assembled, resulting in the time required for generating the
target file longer. Although the correct target file can be generated from the current source files.
The execution of Build function is recommended after completing debugging at the final stage of program
development.
Note:
When executing the Make function using a source file restored from backup, the integrity between an
object file and a source file may be lost. If this happens, executing the Build function again.
6
Page 17

CHAPTER1 Basic Functions
1.4.1 Customize Build Function
This section describes the SOFTUNE Workbench function to set the Customize Build
function.
■ Customize Build Function
In SOFTUNE Workbench, different tools can be operated automatically before and after executing the
Assembler, Compiler, Linker, Librarian, Converter, or Configurator started at Compile, Assemble, Make,
or Build.
The following operations can be performed automatically during Make or Build using this function:
• Starting the syntax check before executing the Compiler.
• After executing the Converter, starting the S-format binary Converter (m2bs.exe) and converting
Motorola S-format files to binary format files.
■ Setting Options
An option follows the tool name to start a tool from SOFTUNE Workbench. The options include any file
name and tool-specific options. SOFTUNE Workbench has the macros indicating that any file name and
tool-specific options are specified as options.
■ Macro List
If any character string other than parameters is specified, it is passed directly to the tool. For details about
the parameters, refer to Section "1.11 Macro Descriptions Usable in Manager".
The Setup Customize Build dialog provides a macro list for macro input. The build file, load module file,
project file submenus indicate their sub-parameters specified.
The environment variable brackets must have any item; otherwise, resulting in an error.
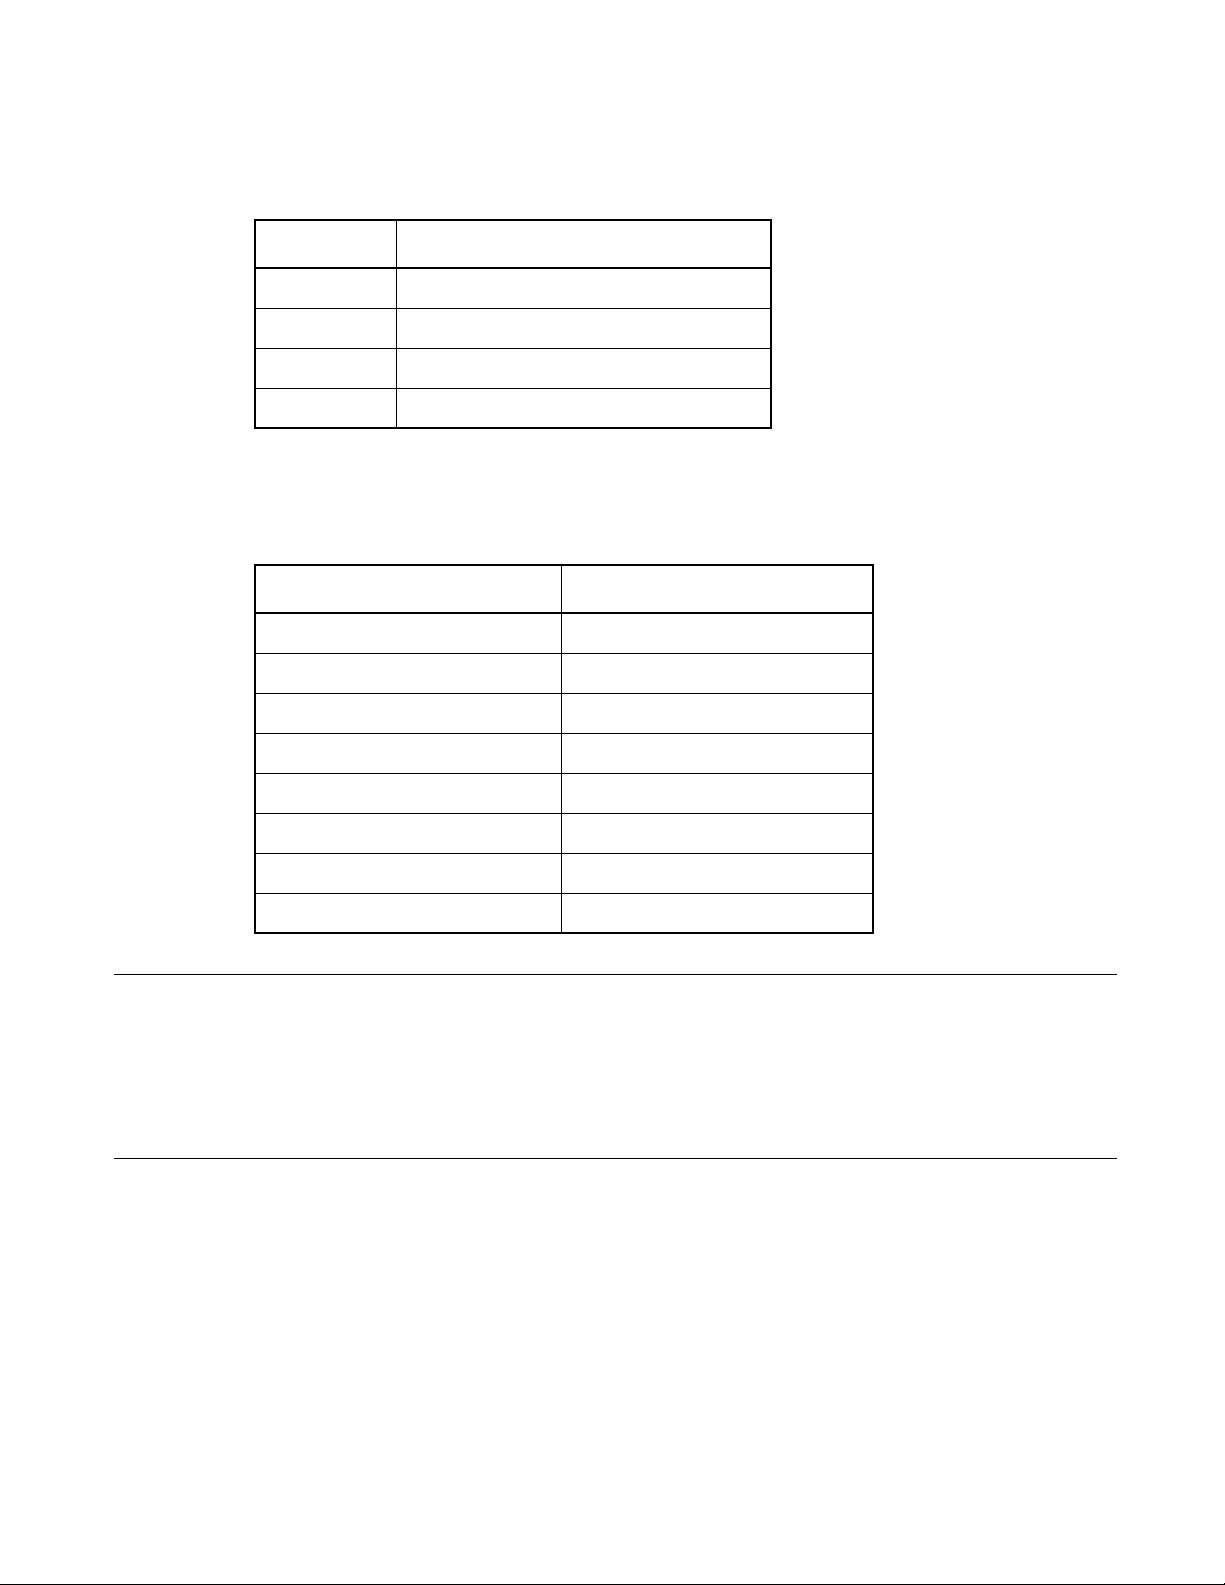
Table 1.4-1 Macro List
Macro List Macro Name
Build file %(FILE)
Load module file %(LOADMODULEFILE)
Project file %(PRJFILE)
Workspace file %(WSPFILE)
Project directory %(PRJPATH)
Target file directory %(ABSPATH)
Object file directory %(OBJPATH)
List file directory %(LSTPATH)
Project construction name %(PRJCONFIG)
Environment variable %(ENV[])
Temporary file %(TEMPFILE)
7
Page 18

CHAPTER1 Basic Functions
Note:
When checking [Use the Output window], note the following:
• Once a tool is activated, Make/Build activated until the tool is terminated.
• The Output window must not be used with a tool using a wait state for user input while the tool is
executing. The user can not perform input while the Output window is in use, so the tool cannot
be terminated. To forcibly terminate the tool, select the tool on the Task bar and input Control - C,
or Control - Z.
8
Page 19

CHAPTER1 Basic Functions
1.5 Include Dependencies Analysis Function
This section describes the function of the Include Dependencies Analysis of SOFTUNE
Workbench.
■ Analyzing Include Dependencies
A source file usually includes some include files. When only an include file has been modified leaving a
source file unchanged, SOFTUNE Workbench cannot execute the Make function unless it has accurate and
updated information about which source file includes which include files.
For this reason, SOFTUNE Workbench has a built-in Include Dependencies Analysis function. This
function can be activated by selecting the [Project] -[Include Dependencies] command. By using this
function, uses can know the exact dependencies, even if an include file includes another include file.
SOFTUNE Workbench automatically updates the dependencies of the compiled/assembled files.
Note:
When executing the [Project] - [Include Dependencies] command, the Output window is redrawn and
replaced by the dependencies analysis result.
If the contents of the current screen are important (error message, etc.), save the contents to a file
and then execute the Include Dependencies command.
9
Page 20

CHAPTER1 Basic Functions
1.6 Functions of Setting Tool Options
This section describes the functions to set options for the language tools activated
from SOFTUNE Workbench.
■ Function of Setting Tool Options
To create a desired target file, it is necessary to specify options for the language tools such as a compiler,
assembler, and linker. SOFTUNE Workbench stores and manages the options specified for each tool in
project configurations.
Tool options include the options effective for all source files (common options) and the options effective
for specific source files (individual options). For details about the option setting, refer to Section "4.5.5
Setup Project" in "SOFTUNE Workbench Operation Manual".
● Common options
These options are effective for all source files (excluding those for which individual options are specified)
stored in the project.
● Individual options
These options are compile/assemble options effective for specific source files. The common options
specified for source files for which individual options are specified become invalid.
■ Tool Options
In SOFTUNE Workbench, the macros indicating that any file name and directory name are specified as
options.
If any character string other than parameters is specified, it is passed directly to the tool. For details about
the parameters, refer to Section "1.11 Macro Descriptions Usable in Manager". For details about the tool
options for each tool, refer to the manual of each tool.
10
Page 21

CHAPTER1 Basic Functions
1.7 Error Jump Function
This section describes the error jump function in SOFTUNE Workbench.
■ Error Jump Function
When an error, such as a compile error occurs, double-clicking the error message displayed in the Output
window, opens the source file where the error occurred, and automatically moves the cursor to the error
line. This function permits efficient removal of compile errors, etc.
The SOFTUNE Workbench Error Jump function analyzes the source file names and line number
information embedded in the error message displayed in the Output window, opens the matching file, and
jumps automatically to the line.
The location where a source file name and line number information are embedded in an error message,
varies with the tool outputting the error.
An error message format can be added to an existing one or modified into a new one. However, the modify
error message formats for pre-installed Fujitsu language tools are defined as part of the system, these can
not be modified.
■ Syntax
A new error message format should be added when working the Error Jump function with user registered
tool. To set Error Jump, execute the [Setup] - [Error] command.
An error message format can be described in Syntax. SOFTUNE Workbench uses macro descriptions as
shown in the Table 1.7-1 to define such formats.
To analyze up to where %f, %h, and %* continue, SOFTUNE Workbench uses the character immediately
after the above characters as a delimiter. Therefore, in Syntax, the description until a character that is used
as a delimiter re-appears, is interpreted as a file name or a keyword for help, or is skipped over. To use %
as a delimiter, describe as %%. The %[char] macro skips over as long as the specified character continues
in parentheses. To specify "]" as a skipped character describes it as "\]". Blank characters in succession can
be specified with a single blank character.
Table 1.7-1 Special Characters for Analyzing Error Messages
Characters Semantics
%f Interpret as source file name and inform editor.
%1 Interpret as line number and inform editor.
%h Become keyword when searching help file.
%* Skip any desired character.
%[char] Skip as long as characters in [ ] continues.
11
Page 22

CHAPTER1 Basic Functions
[Example]
*** %f(%l) %h: or, %[*] %f(%l) %h:
The first four characters are "*** ", followed by the file name and parenthesized line number, and then the
keyword for help continues after one blank character.
This represents the following message:
*** C:\Sample\sample.c(100) E4062C: Syntax Error: near /int.
12
Page 23

CHAPTER1 Basic Functions
1.8 Editor Functions
This section describes the functions of the SOFTUNE Workbench built-in standard
editor.
■ Standard Editor
SOFTUNE Workbench has a built-in editor called the standard editor. The standard editor is activated as
the Edit window in SOFTUNE Workbench. As many Edit windows as are required can be opened at one
time.
The standard editor has the following functions in addition to regular editing functions.
● Keyword marking function in C/C++/assembler source file
Displays reserved words, such as if and for, in different color.
● Error line marking function
The error line can be viewed in a different color, when executing Error Jump.
● Bookmark setup function
A bookmark can be set on any line, and instantaneously jumps to the line. Once a bookmark is set, the line
is displayed in a different color.
● Ruler, line number display function
The Ruler is a measure to find the position on a line; it is displayed at the top of the Edit window. A line
number is displayed at the left side of the Edit window.
● Automatic indent function
When a line is inserted using the Enter key, the same indent (indentation) as the preceding line is set
automatically at the inserted line. If the space or tab key is used on the preceding line, the same use is set at
the inserted line as well.
● Function to display Blank, Line Feed code, and Tab code
When a file includes a Blank, a Line Feed code, and Tab code, these codes are displayed with special
symbols.
● Undo function
This function cancels the preceding editing action to restore the previous state. When more than one
character or line is edited, the whole portion is restored.
● Tab size setup function
Tab stops can be specified by defining how many digits to skip when Tab codes are inserted. The default is
8.
13
Page 24

CHAPTER1 Basic Functions
● Font changing function
The font size for character string displayed in the Edit window can be selected.
14
Page 25

CHAPTER1 Basic Functions
1.9 Storing External Editors
This section describes the function to set an external editor to SOFTUNE Workbench.
■ External Editor
SOFTUNE Workbench has a built-in standard editor, and use of this standard editor is recommended.
However, another accustomed editor can be used, with setting it, instead of an edit window. There is no
particular limit on which editor can be set, but some precautions (below) may be necessary. Use the
[Setup] - [Editor] command to set an external editor.
■ Precautions
● Error jump function
The Error Jump cannot move the cursor to an error line if the external editor does not have a function to
specify the cursor location when activated.
● File save at compiling/assembling
SOFTUNE Workbench cannot control an external editor. Always save the file you are editing before
compiling/assembling.
■ Setting Options
When activating an external editor from SOFTUNE Workbench, options must be added immediately after
the editor name. The names of file to be opened by the editor and the initial location of the cursor (the line
number) can be specified. SOFTUNE Workbench has a set of special parameters for specifying any file
name and line number, as shown in the Table 1.9-1 . If any other character string are described by these
parameters, such character string are passed as is to the editor.
%f (File name) is determined as follows:
1.If the focus is on the SRC tab of Project window, and if a valid file name is selected, the selected file
name becomes the file name.
2.When a valid file name cannot be acquired by the above procedure, the file name with a focus in the
built-in editor becomes the file name.
%x (project path) is determined as follows:
1.If a focus is on the SRC tab of project window and a valid file name is selected, the project path is a
path to the project in which the file is stored.
2.If no path is obtained, the project path is a path to the active project.
The specification method of the file name containing a space is different by editors. For details, refer to the
Editor Manual.
Ex.)
MIFES "%f + %l"
WZ Editor "%f" /j%l
15
Page 26
CHAPTER1 Basic Functions
Table 1.9-1 List of Special Characters for Analyzing Error Message
Parameter Semantics
%% Means specifying % itself
%f Means specifying file name
%l Means specifying line number
%x Means specifying project path
■ Example of Optional Settings
Table 1.9-2 Example of Optional Settings (For External Editors)
Editor name Argument
WZ Editor V4.0 %f /j%l
Note:
MIFES V1.0 %f + %l
UltraEdit32 %f/%l/1
TextPad32 %f(%l)
PowerEDITOR %f -g%l
Codewright32 %f -g%l
Hidemaru for Win3.1/95 /j%l:1 %f
ViVi /line=%l %f
• Regarding execution of error jump in Hidemaru:
To execute error jump in Hidemaru used as an external editor, use the [Others] - [Operating
Environment] - [Exclusive Control] menu, and then set "When opening the same file in Hidemaru"
and "Opening two identical files is inhibited".
16
Page 27

CHAPTER1 Basic Functions
1.10 Storing External Tools
This section describes the SOFTUNE Workbench function to set an external tool.
■ External Tools
A non-standard tool not attached to SOFTUNE Workbench can be used by setting it as an external tool and
by calling it from SOFTUNE Workbench. Use this function to coordinate with a source file version
management tool.
If a tool set as an external tool is designed to output the execution result to the standard output and the
standard error output through the console application, the result can be specified to the SOFTUNE
Workbench Output window. In addition, the allow description of additional parameters each time the tool
is activated.
To set an external tool, use the [Setup] - [Tool] command.
To select the title of a set tool, use the [Setup] - [Tool execution] command.
■ Setting Options
When activating an external tool from SOFTUNE Workbench, options must be added immediately after the
tool name. Specify the file names, and unique options, etc.
SOFTUNE Workbench has a set of special parameters for specifying any file name and unique tool
options.
If any characters described other than these parameters, such characters are passed as it is to the external
tool.
Note:
For details about the parameters, refer to Section "1.11 Macro Descriptions Usable in Manager".
When checking [Use the Output window], note the following:
1. Once a tool is activated, neither other tools nor the compiler/assembler can be activated until the
tool is terminated.
2. The Output window must not be used with a tool using a wait state for user input while the tool is
executing. The user can not perform input while the Output window is in use, so the tool cannot
be terminated. To forcibly terminate the tool, select the tool on the Task bar and input Control - C,
or Control - Z.
17
Page 28

CHAPTER1 Basic Functions
1.11 Macro Descriptions Usable in Manager
This section explains the macro descriptions that can be used in the manager of
SOFTUNE Workbench.
■ Macros
SOFTUNE Workbench has special parameters indicating that any file name and tool-specific options are
specified as options.
The use of these parameters as tool options eliminates the need for options specified each time each tool is
started.
The type of macro that can be specified and macro expansion slightly vary depending on where to describe
macros. The macros usable for each function are detailed below. For the macros that can be specified for
"Error Jump" and "External Editors", refer to Sections "1.7 Error Jump Function" and "1.9 Storing
External Editors".
■ Macro List
The following is a list of macros that can be specified in SOFTUNE Workbench.
The macros usable for each function are listed below.
• External tools : Table 1.11-1 and Table 1.11-2
• Customize build : Table 1.11-1 and Table 1.11-2
• Tool options : Table 1.11-2
The directory symbol \ is added to the option directories in Table 1.11-1 but not to the macro directories in
Table 1.11-2 .
The sub-parameters in Table 1.11-3 can be specified in %(FILE), %(LOADMODULEFILE), %(PRJFILE)
and %(WSPFILE).
The sub-parameter is specified in the form of %(PRJFILE[PATH]).
If the current directory is on the same drive, the relative path is used. The current directory is the
workspace directory for %(PRJFILE), and %(WSPFILE), and the project directory for other than them.
18
Page 29

Table 1.11-1 List of macros that can be specified 1
Parameter Meaning
%f Passed as full-path name of file. (*1)
%F Passed as main file name of file. (*1)
%d Passed as directory of file. (*1)
%e Passed as extension of file. (*1)
%a Passed as full-path name of load module file.
%A Passed as main file name of load module file. (*2)
%D Passed as directory of load module file. (*2)
%E Passed as extension of load module file. (*2)
%x Passed as directory of project file. (*2)
%X Passed as main file name of project file. (*2)
CHAPTER1 Basic Functions
%% Passed as %.
Table 1.11-2 List of macros that can be specified 2
Parameter Meaning
%(FILE) Passed as full-path name of file. (*1)
%(LOADMODULEFILE) Passed as full-path name of load module file. (*2)
%(PRJFILE) Passed as full-path name of project file. (*2)
%(WSPFILE) Passed as full-path name of workspace file.(*3)
%(PRJPATH) Passed as directory of project file. (*2)
%(ABSPATH) Passed as directory of target file. (*2)
%(OBJPATH) Passed as directory of object file. (*2)
%(LSTPATH) Passed as directory of list file. (*2)
%(PRJCONFIG) Passed as project configuration name. (*2)(*3)
%(ENV[Environment variable]) Environment variable specified in environment variable
brackets is passed.
%(TEMPFILE) Temporary file is created and its full-path name is
passed. (*4)
*1: The macros are determined as follows:
• Customize build
1. Source file before and after executing compiler and assembler
2. Target file before and after executing linker, librarian and converter
3. Configuration file before and after executing configuration
19
Page 30

CHAPTER1 Basic Functions
• Tool options
1. Null character
•Others
1. File as focus is on the SRC tab of project window and valid file name is selected
2. File on which focus is in internal editor as no valid file name can be obtained in 1
3. Null character if no valid file name can be obtained
*2: The macros are determined as follows:
• Customize build and tool options
1. Information on configuration of project under building, making, compiling and assembling
•Others
1. Information on configuration of active project in which file is stored as focus is on the SRC tab of
project window and valid file name is selected
2. Information on configuration of active project if no valid file name can be obtained in 1
*3: Only project files in the workspace project format can be used for macros indicated.
*4: Data in the temporary file can be specified only for customize build.
Table 1.11-3 Lists of Sub parameters 1
Sub parameter Meaning
[PATH] Directory of file
[RELPATH] Directory of file
[NAME] Main file name of file
[EXT] Extension of file
[SHORTFULLNAME] Full path name of short file
[SHORTPATH] Directory of short file
[SHORTNAME] Main file name of short file
[FOLDER] Name of folder in which files are stored in the SRC tab of project
window (Can be specified only in %(FILE).) (*)
*: The macro can be used only in workspace-compatible Workbench. It is not expanded in workspace-
incompatible Workbench.
20
Page 31

■ Examples of Macro Expansion
If the following workspace is opened, macro expansion is performed as follows:
Workspace : C:\Wsp\Wsp.wsp
Active project : C:\Wsp\Sample\Sample.prj
Active project configuration - Debug
Object directory : C:\Wsp\Sample\Debug\Obj\
Subproject : C:\Subprj\Subprj.prj
Active project configuration - Release
Object directory : C:\Subprj\Release\Obj\
Target file : C:\Subprj\Release\Abs\Subprj.abs
[Example] Macro expansion in external tools
Focus is on Subprj project in the SRC tab of project window.
%a : C:\Subprj\Release\Abs\Subprj.abs
%A : SUBPRJ.abs
%D : C:\Subprj\Release\Abs\
%E : .abs
%(FILE[FOLDER]) : Source Files\Common
%(PRJFILE) : C:Subprj\Subprj.prj
Focus is not in the SRC tab of project window.
%a : C:\Wsp\Sample\Debug\Abs\Sample.abs
%A : Sample.abs
%D : C:\Wsp\Sample\Debug\Abs\
%(PRJFILE) : C:\Wsp\Sample\Sample.prj
CHAPTER1 Basic Functions
[Example] Macro expansion in customize build
Release configuration of Subprj project is built.
%(FILE) : C:\Subprj\LongNameFile.c
%(FILE[PATH]) : C:\Subprj
%(FILE[RELPATH]) : .
%(FILE[NAME]) : LongNameFile
%(FILE[EXT]) : .c
%(FILE[SHORTFULLNAME]) : C:\Subprj\LongFi~1.
%(FILE[SHORTPATH]) : C:\Subprj
%(FILE[SHORTNAME]) : LongFi~1
%(PRJFILE[RELPATH]) : ..\Subprj
%(PRJPATH) : C:\Subprj
%(OBJPATH) : C:\Subprj\Release\Obj
%(PRJCONFIG) : Relase
%(ENV[FETOOL]) : C:\Softune
%(TEMPFILE) : C:\Subprj\Relase\Opt\_fs1056.TMP
[Example] Macro expansion in tool options
Release configuration of Subprj project is build.
%(FILE) :
%(PRJFILE[RELPATH]) : ..\Subprj
%(PRJPATH) : C:\Subprj
%(OBJPATH) : C:\Subprj\Release\Obj
%(PRJCONFIG) : Relase
%(ENV[FETOOL]) : C:\Softune
21
Page 32

CHAPTER1 Basic Functions
1.12 Setting Operating Environment
This section describes the functions for setting the SOFTUNE Workbench operating
environment.
■ Operating Environment
Set the environment variables for SOFTUNE Workbench and some basic items for the workspace.
To set the operating environment, use the [Setup]-[Development] command.
● Environment Variables
Environment variables are variables that are referred to mainly using the language tools activated from
SOFTUNE Workbench. The semantics of an environment variable are displayed in the lower part of the
Setup dialog. However, the semantics are not displayed for environment variables used by tools added
later to SOFTUNE Workbench.
When SOFTUNE Workbench and the language tools are installed in a same directory, it is not especially
necessary to change the environment variable setups.
● Basic setups for workspace
The following setups are possible.
• Open the previous workspace at start up
- When starting SOFTUNE Workbench, it automatically opens the last opened workspace.
• Display options while compiling/assembling
- Compile options or assemble options can be viewed in the Output window.
• Save dialog before closing workspace
- Before closing the workspace, a dialog asking for confirmation of whether or not to save the
workspace to the file is displayed. If this setting is not made, SOFTUNE Workbench automatically
saves the Project without any confirmation message.
• Save dialog before compiling/assembling
- Before compiling/assembling, a dialog asking for confirmation of whether or not to save a source file
that has not been saved is displayed. If this setting is not made, the file is saved automatically before
compile/assemble/make/build.
• Termination message is highlighted at Make/Build
- At Compile, Assemble, Make, or Build, the display color of termination messages (Abort, No Error,
Warning, Error, Fatal error, or Failing During start) can be changed freely by the user.
Note:
22
Because the environment variables set here are language tools for the SOFTUNE Workbench, the
environment variables set on previous versions of SOFTUNE cannot be used. In particular, add the
set values of [User Include Directory] and [Library Search Directory] to [Tool Options Settings].
Page 33

CHAPTER1 Basic Functions
1.13 Debugger Types
This section describes the types of SOFTUNE Workbench debuggers.
■ Type of debugger
SOFTUNE Workbench integrates three types of debugger: a simulator debugger, emulator debugger, and
monitor debugger. Any one can be selected depending on the requirement.
■ Simulator Debugger
The simulator debugger simulates the MCU operations (executing instructions, memory space, I/O ports,
interrupts, reset, etc.) with software to evaluate a program.
It is used for evaluating an uncompleted system and operation of individual units, etc.
■ Emulator Debugger
The emulator debugger is software to evaluate a program by controlling an Emulator from a host through a
communications line (RS-232C, LAN, USB).
Before using this debugger, the emulator must be initialized.
■ Monitor Debugger
The monitor debugger evaluates a program by putting it into an evaluation system and by communicating
with a host. An RS-232C interface and an area for the debug program are required within the evaluation
system.
23
Page 34

CHAPTER1 Basic Functions
1.14 Memory Operation Functions
This section describes the memory operation functions.
■ Functions for Memory Operations
• Display/Modify memory data
Memory data can be display in the Memory window and modified.
•Fill
The specified memory area can be filled with the specified data.
• Copy
The data in the specified memory area can be copied to another area.
•Compare
The data in the specified source area can be compared with data in the destination area.
• Search
Data in the specified memory area can be searched.
For details, refer to "3.11 Memory Window" in "SOFTUNE Workbench Operation Manual".
• Display/Modify C/C++ variables
The names of variables in a C/C++ source file can be displayed in the Watch window and modified.
• Setting Watch point
By setting a watch point at a specific address, its data can be displayed in the Watch window.
For details, refer to "3.13 Watch Window" in "SOFTUNE Workbench Operation Manual".
24
Page 35

1.15 Register Operations
This section describes the register operations.
■ Register Operations
The Register window is opened when the [View] - [Register] menu is selected. The register and flag values
can be displayed in the Register window.
For further details about modifying the register value and the flag value, refer to "4.4.4 Register" in
"SOFTUNE Workbench Operation Manual".
The name of the register and flag displayed in the register window varies depending on each MCU in use.
For the list of register names and flag names for the MCU in use, refer to "Appendix A Register Names" in
"SOFTUNE Workbench Operation Manual".
CHAPTER1 Basic Functions
25
Page 36

CHAPTER1 Basic Functions
1.16 Line Assembly and Disassembly
This section describes line assembly and disassembly.
■ Line Assembly
To perform line-by-line assembly (line assembly), right-click anywhere in the Disassembly window to
display the short-cut menu, and select [Inline Assembly]. For further details about assembly operation,
refer to "4.4.3
■ Disassembly
To display disassembly, use the [View] - [Assembly] command. By default, disassembly can be viewed
starting from the address pointed by the current program counter (PC). However, the address can be
changed to any desired address at start-up.
Disassembly for an address outside the memory map range cannot be displayed. If this is attempted, "???"
is displayed as the mnemonic.
Assembly" in "SOFTUNE Workbench Operation Manual".
26
Page 37

CHAPTER1 Basic Functions
1.17 Symbolic Debugging
The symbols defined in a source program can be used for command parameters
(address). There are three types of symbols as follows:
• Global Symbol
• Static Symbol within Module (Local Symbol within Module)
• Local Symbol within Function
■ Types of Symbols
A symbol means the symbol defined while a program is created, and it usually has a type. Symbols
become usable by loading the debug information file.
There are three types of symbols as follows:
● Global symbol
A global symbol can be referred to from anywhere within a program. In C/C++, variables and functions
defined outside a function without a static declaration are in this category. In assembler, symbols with a
PUBLIC declaration are in this category.
● Static symbol within module (Local symbol within module)
A static symbol can be referred to only within the module where the symbol is defined.
In C/C++, variables and functions defined outside a function with a static declaration are in this category.
In assembler, symbols without a PUBLIC declaration are in this category.
● Local symbol within function
A local symbol within a function exists only in C/C++. A static symbol within a function and an automatic
variable are in this category.
• Static symbol within function
- Out of the variables defined in function, those with static declaration.
• Automatic variable
- Out of the variables defined in function, those without static declaration and parameters for the
function.
■ Setting Symbol Information
Symbol information in the file is set with the symbol information table by loading a debug information file.
This symbol information is created for each module.
The module is constructed for each source file to be compiled in C/C++, in assembler for each source file
to be assembled.
The debugger automatically selects the symbol information for the module to which the PC belongs to at
abortion of execution (Called "the current module"). A program in C/C++ also has information about
which function the PC belongs to.
27
Page 38

CHAPTER1 Basic Functions
■ Line Number Information
Line number information is set with the line number information table in SOFTUNE Workbench when a
debug information file is loaded. Once registered, such information can be used at anytime thereafter.
Line number is defined as follows:
[Source File Name] $Line Number
28
Page 39

1.17.1 Referring to Local Symbols
This section describes referring to local symbols and Scope.
■ Scope
When a local symbol is referred to, Scope is used to indicate the module and function to which the local
symbol to be referred belongs.
SOFTUNE Workbench automatically scopes the current module and function to refer to local symbols in
the current module with preference. This is called the Auto-scope function, and the module and function
currently being scoped are called the Current Scope.
When specifying a local variable outside the Current Scope, the variable name should be preceded by the
module and function to which the variable belongs. This method of specifying a variable is called a symbol
path name or a Search Scope.
■ Moving Scope
As explained earlier, there are two ways to specify the reference to a variable: by adding a Search Scope
when specifying the variable name, and by moving the Current Scope to the function with the symbol to be
referred to. The Current Scope can be changed by displaying the Call Stack dialog and selecting the parent
function. For further details of this operation, refer to "4.6.7 Stack" in "SOFTUNE Workbench Operation
Manual". Changing the Current Scope as described above does not affect the value of the PC.
By moving the current scope in this way, you can search a local symbol in parent function with precedence.
CHAPTER1 Basic Functions
■ Specifying Symbol and Search Procedure
A symbol is specified as follows:
[ [Module Name] [\Function Name] \] Symbol Name
C++ symbol can be specified as follows with the scope operator:
[ [Class Name::] [ [\] Function Name] \] Symbol Name
When a symbol is specified using the module and function names, the symbol is searched. However, when
only the symbol name is specified, the search is made as follows:
1.Local symbols in function in Current Scope
2.The class member which can access with the this pointer (when C++)
3.Static symbols within module in Current Scope
4.Global symbols
If a global symbol has the same name as a local symbol in the Current Scope, specify "\" or "::" at the start
of global symbol. By doing so, you can explicitly show that is a global symbol.
An automatic variable can be referred to only when the variable is in memory. Otherwise, specifying an
automatic variable causes an error.
29
Page 40

CHAPTER1 Basic Functions
1.17.2 Referring to C/C++ Variables
C/C++ variables can be specified using the same descriptions as in the source program
written in C/C++.
■ Specifying C/C++ Variables
C/C++ variables can be specified using the same descriptions as in the source program. The address of C/
C++ variables should be preceded by the ampersand symbol "&". Some examples are shown in the Table
1.17-1 .
Table 1.17-1 Examples of Specifying Variables
Example of
Example of Variables
Specifying
Variables
Semantics
Regular
Variable
Pointer
Array
Structure
Union
Address of
variable
Reference
type
Class
int data;
char *p;
char a[5];
struct stag{
char c;
int ;
struct stag st;
struct stag *stp;
union utag{
char c;
int i;
}uni;
int data;
inti i;
int &ri = i;
class X{
static int i;
}cls;
int X::i;
data Value of data
*p Value pointed to by p
a[1] Value of second element of a
st, c
stp->c
uni.i Value of member i of uni
&data Address of data
ri Same as i
cls.i
X::i
Value of member c of st
Value of member c of the
structure to which stp points
Value of member i of class X
Same as cls.i
30
Member
pointer
class
class X{
short cs;
}clo;
short X::* ps=&X::cs;
X*clp=&clo;
clo.*ps
clp->*ps
Same as clo.cs
Same as clp->cs
Page 41

■ Notes on C/C++ Symbols
The C/C++ compiler outputs symbol information with "_" prefixed to global symbols. For example, the
symbol main outputs symbol information _main. However, SOFTUNE Workbench permits access using
the symbol name described in the source to make program debugging described in C/C++ easier.
Consequently, a symbol name described in C/C++ and a symbol name described in assembler, which
should both be unique, may be identical.
In such a case, the symbol name in the Current Scope normally is preferred. To refer to a symbol name
outside the Current Scope, specify the symbol with the module name.
If there are duplicated symbols outside the Current Scope, the symbol name searched first becomes valid.
To refer to another one, specify the symbol with the module name.
CHAPTER1 Basic Functions
31
Page 42

CHAPTER1 Basic Functions
32
Page 43

CHAPTER2
Dependence Functions
This chapter describes the functions dependent on each
Debugger.
2.1 Simulator Debugger
2.2 Emulator Debugger (MB2197)
2.3 Emulator Debugger (MB2198)
2.4 Emulator Debugger (MB2100-01)
2.5 Monitor Debugger
33
Page 44

CHAPTER2 Dependence Functions
2.1 Simulator Debugger
This section describes the functions of the simulator debugger.
■ Simulator Debugger
The simulator debugger simulates the MCU operations (executing instructions, memory space, I/O ports,
interrupts, reset, etc.) with software to evaluate a program.
It is used to evaluate an uncompleted system, the operation of single units, etc.
There are 2 types of simulator debuggers.
• Normal simulator debugger (normal)
• High-speed simulator debugger (fast)
This high-speed simulator provides substantial reductions in simulation time due to a dramatic review of
normal simulator’s processing methods.
This can be instruction processing performance for 10MIPS when it is operated by PC equipped with
Pentium4 2.0GHz.
External I/F for simulator are equipped to high-speed simulator debugger to create peripheral simulation
modules.
Please refer to an "Appendix G External I/F for Simulator" in "SOFTUNE Workbench Operation Manual".
■ Operating Conditions
The high-speed simulator debugger requires much more RAM space on the host PC than that of normal
simulator debugger.
The required RAM size depends largely on your program size.
For the required available RAM space, refer to the table below:
Basic use Fs911s.exe (FR Family) 20MB
CODE size of target program per 64 KB 6MB
DATA size of target program per 64 KB 1.5MB
Insufficient RAM space will lead to an extreme decrease in simulation speed.
34
Page 45

Target program size
CODE XX(KB)
DATA YY(KB)
Required RAM space (MB) = 20 + (XX / 64) 6 + (YY / 64) 1.5
However, RAM space larger than the above may be needed depending on program allocation. Allocate
memory space consecutive areas should be reserved as much as possible.
Example: Program with 1 MB of CODE and DATA sizes
Required RAM space (MB) = 20 + (1024 / 64) 6 + (1024 / 64) 1 / 5 = 140MB
■ Simulation Range
The simulator debugger simulates the MCU operations (instruction operations, memory space, interrupts,
reset, low power consumption mode, etc.) Peripheral I/Os, such as a timer, DMAC and serial I/O, other
than the CPU core of the actual chip are not supported as peripheral resources. I/O space to which
peripheral I/Os are connected is treated as memory space. There is a method for simulating interrupts like
timer interrupts, and data input to memory like I/O ports. For details, refer to the sections concerning I/O
port simulation and interrupt simulation.
CHAPTER2 Dependence Functions
• Instruction simulation
• Memory simulation
• I/O port simulation (Input port)
• I/O port simulation (Output port)
• Interrupt simulation
• Reset simulation
• Low power consumption mode simulation
35
Page 46

CHAPTER2 Dependence Functions
2.1.1 Instruction Simulation
This section describes the instruction simulation executed.
■ Instruction Simulation
This simulates the operations of all instructions supported by the FR Family. It also simulates the changes
in memory and register values due to such instructions.
36
Page 47

2.1.2 Memory Simulation
This section describes the memory simulation executed.
■ Memory Simulation
The simulator debugger must first secure memory space to simulate instructions because it simulates the
memory space secured in the host PC memory.
• To secure the memory area, either use the [Setup] - [Memory Map] menu, or the SET MAP command in
the Command window.
• Load the file output by the Linkage Editor (Load Module File) using either the [Debug] - [Load target
file] menu, or the LOAD/OBJECT command in the Command window.
■ Simulation Memory Space
Memory space access attributes can be specified byte-by-byte using the [Setup] - [Memory Map] menu.
The access attribute of unspecified memory space is Undefined.
■ Memory Area Access Attributes
Access attributes for memory area can be specified as shown in Table 2.1-1 . A guarded access break
occurs if access is attempted against such access attribute while executing a program. When access is
made by a program command, such access is allowed regardless of the attribute, CODE, READ or WRITE.
However, access to memory in an undefined area causes an error.
CHAPTER2 Dependence Functions
Table 2.1-1 Types of Access Attributes
Attribute Semantics
CODE Instruction operation enabled
READ Data read enabled
WRITE Data write enabled
undefined Attribute undefined (access prohibited)
37
Page 48

CHAPTER2 Dependence Functions
2.1.3 I/O Port Simulation
This section describes I/O port simulation executed.
■ I/O Port Simulation (Input Port)
There are two types of simulations in I/O port simulation: input port simulation, and output port
simulation. Input port simulation has the following types:
• Whenever a program reads the specified port, data is input from the pre-defined data input source.
• Whenever the instruction execution cycle count exceeds the specified cycle count, data is input to the
port.
To set an input port, use the [Setup] - [Debug Environment] - [I/O Port] menu, or the SET INPORT
command in the Command window.
Up to 4096 port addresses can be specified for the input port. The data input source can be a file or a
terminal. After reading the last data from the file, the data is read again from the beginning of the file. If a
terminal is specified, the input terminal is displayed at read access to the set port.
A text file created by an ordinary text editor, or a binary file containing direct code can be used as the data
input file. When using a text file, input the input data inside commas (,). When using a binary file, select
the binary button in the input port dialog.
■ I/O Port Simulation (Output Port)
At output port simulation, whenever a program writes data to the specified port, writing is executed to the
data output destination.
To set an output port, either use the [Setup] - [Debug Environment] - [I/O Port] menu, or the SET
OUTPORT command in the Command window.
Up to 4096 port addresses can be set as output ports. Select either a file or terminal (Output Terminal
window) as the data output destination.
A destination file must be either a text file that can be referred to by regular editors, or a binary file. To
output a binary file, select the Binary radio button in the Output Port dialog.
Note:
The following method is not supported by high-speed simulator debugger.
• Whenever the instruction execution cycle count exceeds the specified cycle count, data is input to
the port.
Furthermore the setting of memory map is necessary to set I/O port. When deleting memory map,
I/O port is also deleted.
38
Page 49

2.1.4 Interrupt Simulation
This section describes interrupt simulation executed.
■ Interrupt Simulation
This simulates the MCU operation for an interrupt request. The following types can be used to allow an
interrupt to occur.
• When the instruction is executed as many cycles as the specified cycle count while executing a program
(executing execution commands), generate an interrupt corresponding to the specified interrupt number
to reset the interrupt generating condition.
• Whenever the instruction executing cycle count exceeds the specified cycle, an interrupt continues to be
generated.
The type of interrupt can be set using either the [Setup] - [Debug Environment] - [Interrupt] menu, or the
SET INTERRUPT command in the Command window. If an interrupt is masked by an interrupt-enabled
flag when the interrupt generating condition is met, the interrupt is generated after resetting the mask.
When an interrupt is generated while executing a program, an interrupt cause number is displayed on the
Status Bar.
CHAPTER2 Dependence Functions
Furthermore, the simulator supports the MCU operation for interrupt requests for the following exception
processing.
• Executing undefined instruction
39
Page 50

CHAPTER2 Dependence Functions
2.1.5 Reset Simulation
This section describes the reset simulation executed.
■ Reset Simulation
The simulator simulates the operation when a reset signal is input to the MCU using the [Debug]-[Reset
MCU] menu or RESET command, and initializes the registers.
The function for performing reset processing by operation of MCU instructions (writing to RST bit in
standby control register) is also supported.
The register with the RST bit is different according to the FR/FR80 as follows.
FR :Standby mode Control Register
FR80 :Reset Control Register
40
Page 51

CHAPTER2 Dependence Functions
2.1.6 Low Power Consumption Mode Simulation
This section describes the low power consumption mode simulation executed.
■ Low Power Consumption Mode Simulation
The MCU enters the low power consumption mode in accordance with the MCU instruction operation
(Write to SLEEP bit or STOP bit of standby control register). Once in the sleep mode or stop mode, a
message ("sleep" for sleep mode, "stop" for stop mode) is displayed on the Status Bar. The loop keeps
running until either an interrupt request is generated, or the [Debug] - [Abort] menu is executed. Each
cycle of the loop increments the count by 1. During this period, I/O port processing can be operated.
Writing to the standby control register using a command is not prohibited.
41
Page 52

CHAPTER2 Dependence Functions
execution s tarts
Breakpoint is hit
Break (STUB) process ing
execution ends
Program execution
Is there a breakpoint
command list?
Re-execute (is no-break
specified)?
Execution
restarts
YES
YES
NO
NO
Process a breakpoint command lit
(execute commands).
Execution stops
2.1.7 STUB Function
This section describes the STUB function which executes commands automatically
when the breakpoint hit occurs.
■ Outline of STUB Function
The STUB function is supported so that a series of commands in the command list can automatically be
executed when a specified breakpoint is hit. The use of this function enables spot processing, such as
simple I/O simulation, external interrupt generation, and memory reprogramming, without changing the
main program. This function is effective only when the simulator debugger is used.
■ How to set
42
The STUB function can be set by the following commands.
- Dialog
1. Breakpoint Set Dialog - [Code] tab
2. Breakpoint Set Dialog - [Data] tab
- Command
1.SET BREAK
2.SET DATABREAK
Page 53

CHAPTER2 Dependence Functions
2.1.8 Break
This Simulator Debugger provides five types of break functions. When by each break
function aborts program execution, the address where a break occurred and the break
factor are displayed.
■ Break Functions
This Simulator Debugger provided the following five types of break functions;
- Code break
- Data break
- Trace buffer-full break
- Guarded access break
- Forced break
43
Page 54

CHAPTER2 Dependence Functions
2.1.8.1 Code Break
This function causes a break by monitoring a specified address by software.
A break occurs before executing an instruction at the specified address.
■ Code Break
When the program reaches a break point (immediately before executing the instruction at the memory
location), the simulator debugger executes the following processes:
1. Suspend program execution (before executing instruction).
2. Checks count of arrival time. If the count of arrival time at the specified break point has not yet been
reached, the simulator resumes the program execution. If the count of arrival time has been reached, the
simulator proceeds to step 3.
3. Displays memory location where execution suspended on Status Bar.
Break points can be set as follows.
• For simulator debugger of normal speed: 65535 points
• For simulator debugger of high speed: 67 points
When the code break occurs, the following message appears at the status bar.
Break at address by breakpoint
■ How to set
Set code break as follows.
• Dialog
- "Code" tab in breakpoint setting dialog
For details, refer to "4.6.4 Breakpoint" in "SOFTUNE Workbench Operation Manual".
Note:
•Window
- Source window/disassemble window
For details, refer to "3.7 Source Window" or "3.9 Disassemble Window" in "SOFTUNE Workbench
Operation Manual".
• Command
- SET BREAK
For details, refer to "3.1 SET BREAK (type 1)" in "SOFTUNE Workbench Command Reference
Manual".
In order to set breakpoints, it is required to set memory map to high-speed simulator debugger.
When the memory map defined area is changed to an undefined attribute, the breakpoints are
cancelled.
44
Page 55

CHAPTER2 Dependence Functions
2.1.8.2 Data Break
This function aborts the program execution when a data access (read/write) is made to
a specified address.
■ Data Break
When data is written or read to a data break point, the simulator debugger executes the following processes:
1. Suspend program execution after completing instruction execution
2. Checks access count. If the access count has not yet been reached the count for the specified data break
point, the simulator resumes the program execution. If the count has been reached, the simulator
proceeds to step 3.
3. If program execution is suspended by reaching access count, on Status Bar, displays memory location of
data break point and of instruction writing to it.
4. Displays memory location executed next.
Up to 65535 data break points can be set.
When the data break occurs, the following message appears at the status bar.
■ How to set
Notes:
• If an automatic variable within a C/C++ function is specified, a data break is set at the address
where the automatic variable is held. Therefore, the data break remains valid even after the
specified automatic variable becomes invalid (after exiting function), causing a break due to
unexpected access.
• To allow access to a variable in C/C++ to cause a break, specify the variable address by putting
an ampersand symbol "&" immediately before the variable symbol.
• It is required to set memory map in order to set breakpoint for high-speed simulator debugger.
Once memory map is deleted, setup of breakpoint will also be deleted.
Break at address by databreak at access address
Set the data break as follows.
• Command
- SET DATABREAK
For details, refer to "3.8 SET DATABREAK (type 1)" in "SOFTUNE Workbench Command Reference
Manual".
• Dialog
- Data tab in breakpoint setting dialog
For details, refer to "4.6.4 Breakpoint" in "SOFTUNE Workbench Operation Manual".
45
Page 56

CHAPTER2 Dependence Functions
2.1.8.3 Trace Buffer-full Break
This function aborts the program execution when the trace buffer becomes full.
■ Trace Buffer-full Break
This function aborts the program execution when the trace buffer becomes full.
When the trace buffer-full break occurs, the following message appears at the status bar.
Break at address by trace buffer full
■ How to set
Set the trace buffer-full break as follows.
• Command
- SET TRACE/BREAK
For details, refer to "4.12 SET TRACE(type 2)" in "SOFTUNE Workbench Command Reference
Manual".
• Dialog
- Trace setting dialog
For details, refer to "4.4.8 Trace" in "SOFTUNE Workbench Operation Manual".
46
Page 57

CHAPTER2 Dependence Functions
2.1.8.4 Guarded Access Break
A guarded access break suspends a executing program when accessing in violation of
the access attribute set by using the [Setup]-[Memory Map] command, and accessing a
guarded area (access-disabled area in undefined area).
■ Guarded Access Breaks
A guarded access break suspends a executing program when accessing in violation of the access attribute
set by using the [Setup]-[Memory Map] command, and accessing a guarded area (access-disabled area in
undefined area).
Guarded access breaks are as follows:
• Code Guarded
An instruction has been executed for an area having no code attribute.
• Read Guarded
A read has been attempted from the area having no read attribute.
•Write Guarded
A write has been attempted to an area having no write attribute.
If a guarded access occurs while executing a program, the following message is displayed on the Status Bar
and the program execution suspended.
Break at Address by guarded access {code/read/write} at Access Address
47
Page 58

CHAPTER2 Dependence Functions
2.1.8.5 Forced Break
This function forcibly aborts the program execution to generate a break.
■ Forced Break
This function forcibly aborts the program execution to generate a break.
When the forced break occurred, the following message appears at the status bar.
Break at address by command abort request
■ How to Generate
A forced break is generated in the following methods:
•Menu
[Debug] - [Abort] menu
For details, refer to "4.6.2 Abort" in "SOFTUNE Workbench Operation Manual".
• Command
- ABORT
For details, refer to "2.2 ABORT" in "SOFTUNE Workbench Command Reference Manual".
Note:
The forced break cannot be generated when the MCU in the low power consumption mode or in the
hold state. If the MCU is in the low power consumption mode or in the hold state when the strong
break is requested by the [Debug]-[Abort] menu during the program execution, the [Debug] - [Abort]
menu is ignored. To generate a break forcibly, use the [Debug] - [Abort] menu to remove a factor by
the user system or use the [Debug]-[Reset of MCU] menu to remove it. If the MCU enters the low
power consumption mode or the hold state during the program execution, the condition is displayed
at the status bar.
48
Page 59

CHAPTER2 Dependence Functions
2.1.9 Measuring Execution Cycle Count
This function measures the program execution cycle count and step count.
■ The measuring item
Measures program execution cycle count and step counts.
● Execution Cycle Count
This is calculated based on the basic cycle count of each instruction described in the Programming Manual.
Because no simulation was done on pipeline process or cache operation inside the chip, it may differ from
an actual chip for normal simulator debugger and/or high-speed simulator debugger. A compensation value
(a, b, c, d), which is described in the list of an instruction in Programming Manual, is calculated as 1.
The maximum measurable value varies, as shown below, whether the normal or the high-speed simulator
debugger is used.
Normal debugger: Max. (2 to the power of 32 - 1) = 4,294,967,295 cycles
High-speed debugger: Max. (2 to the power of 64 - 1) = 18,446,744,073,709,551,615 cycles
● Execution Step Count
Measures program execution step counts.
For both the normal simulator debugger and the high-speed simulator debugger, the maximum measurable
count is "2 to the power of 32 - 1", in other words, up to 4,294,967,295 steps.
The measurement is performed whenever a program is executed, and the measurement result displays the
following two values:
• Number of cycles spent on the previous program execution
• Total number of cycles executed since the previous clearing
■ Displaying Measurement Results
Either of the following methods can be used to display the measurement results.
1. Display by dialog
The results appear in the time measurement dialog, which can be displayed by selecting [Debug] –
[Time Measurement] menu.
2. Display by command
Enter the SHOW TIMER command in the command window.
■ Clearing Measurement Results
Either of the following methods can be used to clear the measurement results.
1. Operation by dialog
Click the [Clear] button in the time measurement dialog, which can be displayed by selecting [Debug] –
[Time Measurement] menu.
2. Clearing by command
Enter the CLEAR TIMER command in the command window.
49
Page 60

CHAPTER2 Dependence Functions
2.1.10 Trace
The address and status information can be sampled during program execution to record
it in a trace buffer. This function is called a trace.
■ Trace
Data recorded with the trace function can be used to make a detailed analysis of a program execution
history.
The trace buffer is in the form of a ring. When it becomes full, it records the next data by automatically
overwriting the buffered data at the beginning.
• Trace Sampling
• Setting trace
• Displaying trace data
• Display format of trace data
• Searching trace data
• Saving trace data
• Clearing trace data
■ Trace Data
The simulator debugger can sample 1000 frames of trace data. Trace data sampling occurs at the address of
the executed instruction.
50
Page 61

CHAPTER2 Dependence Functions
2.1.10.1 Trace Sampling
Trace measurements are made of a program execution status during the interval
between the start and stop of program execution.
■ Trace Sampling
While the trace function is enabled, data is always sampled and recorded in the trace buffer during
execution of an execution command.
The program execution aborts due to a break factor such as a breakpoint, terminating the trace.
Furthermore, when the trace buffer becomes full, a program break can be invoked. This break is called a
trace buffer full break.
■ Frame Number
A number is assigned to each frame of sampled trace data. This number is called a frame number.
The frame number is used to specify the display start position of the trace buffer.
The number 0 is assigned to the last-sampled trace data. Negative values are assigned to trace data that
have been sampled before the arrival at the triggering position.
51
Page 62

CHAPTER2 Dependence Functions
2.1.10.2 Setting Trace
You must set the following two items to perform a trace. After that, trace data will be
sampled with the execution of the program. You can set this from the command
window.
■ Setting Trace
1. Enable the trace function
- This is done by [Setup] - [Trace] in the trace window shortcut menu. This program will startup and
will be enabled.
2. Set the trace buffer full break
- When the trace buffer is full, you can make a break. This is done using the setting dialogs of the
trace window shortcut menu [Setup] - [Trace].
- When starting up this program, it is setup for no breaks.
52
Page 63

2.1.10.3 Displaying Trace Data
Data recorded in the trace buffer can be displayed.
■ Displaying Trace Data
The trace window displays how much trace data is stored in the trace buffer. Also, you can use the SHOW
TRACE command from the command window.
CHAPTER2 Dependence Functions
53
Page 64

CHAPTER2 Dependence Functions
2.1.10.4 Display Format of Trace Data
There are two display formats for displaying the data stored in the trace buffer.
■ Display Format of Trace Data
• Display Only Instruction Operation: Specify Instruction
• Display by Unit of Source Lines: Specify Source
■ Display Only Instruction Operation
In this mode, the instruction operation is displayed in disassembly units.
■ Display by Unit of Source Lines
This mode only displays source lines.
54
Page 65

2.1.10.5 Searching Trace Data
The trace buffer can be searched to locate target data.
■ Searching Trace Data
Specify the address information for the search purpose. This search function can be run by clicking the
Search button in the trace window.
CHAPTER2 Dependence Functions
55
Page 66

CHAPTER2 Dependence Functions
2.1.10.6 Saving Trace Data
The debugger has function of saving trace data.
■ Saving Trace Data
Save the trace data to the specified file.
For details on operations, refer to Sections "3.14 Trace Window", and "4.4.8 Trace" in "SOFTUNE
Workbench Operation Manual"; and Section "4.9 Show Trace" in "SOFTUNE Workbench Command
Reference Manual".
56
Page 67

2.1.10.7 Clearing Trace Data
To clear trace data, use the following command.
■ Clearing Trace Data
When clearing trace data, the [Clear] command is executed from the short-cut menu in the trace window.
CHAPTER2 Dependence Functions
57
Page 68

CHAPTER2 Dependence Functions
2.1.11 Measuring Coverage
In the high-speed version simulator debugger, the C0 coverage measurement function
is provided. Use this function to find what percentage of an entire program has been
executed.
■ Coverage Measurement Function
When testing a program, the program is executed with various test data input and the results are checked
for correctness. When the test is finished, every part of the entire program should have been executed. If
any part has not been executed, there is a possibility that the test is insufficient.
It can know what percentage of the entire program executed when the coverage function for the high-speed
version simulator debugger to have is used.
In addition, details such as which addresses were not accessed can be checked.
In this debugger, the range to measure coverage can be set.
Please set the time base range only to the code area when you do the C0 coverage.
Moreover, the access of the variable can be examined as the variable not used is searched out by setting the
time base range to the data area.
■ Coverage Measurement Procedures
The procedure for coverage measurement is as follows:
- Set range for coverage measurement: SET COVERAGE
- Measuring coverage: GO, STEP, CALL
- Displaying measurement result: SHOW COVERAGE
■ Coverage Measurement Operation
The following operation can be made in coverage measurement:
- Load/Save of coverage data: LOAD/COVERAGE. SAVE/COVERAGE
- Clearing coverage data: CLEAR COVERAGE
- Canceling coverage measurement range: CANCEL COVERAGE
58
Page 69

CHAPTER2 Dependence Functions
2.1.11.1 Coverage Measurement Procedures
The procedure for coverage measurement is as follows:
- Set range for coverage measurement : SET COVERAGE
- Measure coverage : GO, STEP, CALL
- Display measurement result : SHOW COVERAGE
■ Setting Range for Coverage Measurement
Use the SET COVERAGE command to set the measurement range. The measurement range can be set
only within the area defined as the debug area. Up to 32 ranges can be specified.
By specifying /AUTOMATIC for the command qualifier, the code area for the loaded module is set
automatically. However, the library code area is not set when the C/C++ compiler library is linked.
[Example]
>SET COVERAGE FF000000 .. FFFFFFFF
■ Measuring Coverage
When preparing for coverage measurement, execute the program.
Measurement starts when the program is executed by using the GO, STEP, or CALL command.
■ Displaying Coverage Measurement Result
To display the measurement result, use the SHOW COVERAGE command. The following can be
displayed:
• Coverage rate of total measurement area
• Displaying coverage rate of load module
• Summary of 16 addresses as one block
• Details indicating access status of each address
• Displaying coverage measurement result per source line
• Displaying coverage measurement result per machine instruction
- Display Coverage Rate of Total Measurement Area (Specify /TOTAL for command qualifier.)
>SHOW COVERAGE/TOTAL
total coverage : 82.3%
59
Page 70

CHAPTER2 Dependence Functions
Display the access status of every 16 addresses
. : No access
1 to F : Display the number accessed in 16 addresses by the hexadecimal number.
* : Access all of the 16 addresses.
>SHOW COVERAGE/GENERAL
(HEX)0X0 +1X0 +2X0
+---------------+---------------+------ ----- address 0123456789ABCDEF0123456789ABCDEF0123456 ... ABCDEF C0(%)
FF000000 **3*E*....... 32.0
- Displaying coverage rate of load module (Specify /MODULE for the command qualifier)
>SHOW COVERAGE/MODULE
sample.abs ........................ (84.03%)
+- startup.asm .................... (90.43%)
+- sample.c ...................... (95.17%)
+- samp.c ....................... (100.00%)
Displays the load modules and the coverage rate of each module.
- Summary (Specify /GENERAL for command qualifier.)
- Details (Specify /DETAIL for command qualifier.)
>SHOW COVERAGE/DETAIL FF000000
address +0 +1 +2 +3 +4 +5 +6 +7 +8 +9 +A +B +C +D +E +F C0(%)
FF000000 - - - - - - - - - - - - - - - - 100.0
FF000010 - - - - - - - - - - - - - - - - 100.0
FF000020 . . . . - - - . . . . . . . . . 18.6
FF000030 - - - - - - - - - - - - - - - - 100.0
FF000040 - . - - - - - - - - - - - - - - 93.7
FF000050 - - - - - - - - - - - - - - - - 100.0
FF000060 . . . . . . . . . . . . . . . . 0.0
FF000070 . . . . . . . . . . . . . . . . 0.0
FF000080 . . . . . . . . . . . . . . . . 0.0
Display the access status of every 1 address
. : No access
- : Access
Display one line of a
coverage rate
60
Page 71

CHAPTER2 Dependence Functions
- Displays per source line (Specify /SOURCE for the command qualifier)
>SHOW COVERAGE/SOURCE main
sample.c
* 66: void main()
* 67: {
68: int i;
69: struct table *value[16];
70:
* 71: for (i=0; i<16; i++)
. 72: value[i] = &target[i];
73:
. 74: sort_val(value, 16L);
. 75: }
The execution situation of each source line is displayed.
. : No execution
* : Execution
Blank : Line which the code had not been generated or
is outside the scope of the coverage measurement
- Displays per machine instruction (Specify /INSTRUCTION for the command qualifier)
>SHOW COVERAGE/INSTRUCTION 000803EE
sample.c$66 void main()
* 000803EE \main:
* 000803EE 1781 ST RP,@-R15
* 000803F0 0F12 ENTER #048
sample.c$71 for (i=0; i<16; i++)
. 000803F2 C00C LDI:8 #00,R12
. 000803F4 3FFC ST R12,@(R14,-4)
. 000803F6 2FF0 LD @(R14,-4),R0
. 000803F8 C10C LDI:8 #10,R12
. 000803FA AAC0 CMP R12,R0
. 000803FC EB15 BGE 00080428
. 000803FE 9F820003C1E8 LDI:32 #0003C1E8,R2
sample.c$72 value[i] = &target[i];
. 00080404 2FF0 LD @(R14,-4),R0
. 00080406 B420 LSL #2,R0
. 00080408 2FF1 LD @(R14,-4),R1
. 0008040A C14C LDI:8 #14,R12
. 0008040C AFC1 MUL R12,R1
. 0008040E B75C MOV MDL,R12
The execution situation at each chance instruction is displayed.
. : No execution
* : Execution
Blank : Instruction outside the scope of the coverage measurement
61
Page 72

CHAPTER2 Dependence Functions
2.1.12 Checking Debugger Status
This section explains how to check information about the simulator debugger.
■ Debugger Information
This simulator debugger enables you to check the following information at startup.
• SOFTUNE Workbench file information
• Hardware information
If any errors have been discovered during SOFTUNE Workbench operations, check this information and
contact our sales department or support department.
■ How to Check
Use one of the following methods to check debugger information.
• Command
- SHOW SYSTEM
For details, refer to Section "1.12 SHOW SYSTEM" in "SOFTUNE Workbench Command
Reference Manual".
• Dialog
- Version information dialog
Select [Help] - [Version Information] menu.
For details, refer to Section "4.9.3 Version Information" in "SOFTUNE Workbench Operation
Manual".
■ Displayed Contents
FR Family SOFTUNE Workbench VxxLxx
ALL RIGHTS RESERVED,
COPYRIGHT(C) FUJITSU SEMICONDUCTOR LIMITED 1997
LICENCED MATERIAL -
PROGRAM PROPERTY OF FUJITSU SEMICONDUCTOR LIMITED
=======================================================
Cpu information file path: CPU information file path
Cpu information file version: CPU information file version
=======================================================
Add in DLLs
-------------------------------------------------------
SiCmn
62
Product name: SOFTUNE Workbench
File Path: SiC911.dll path
Version: SiC911.dll version
- - - - - - - - - - - - - - - - - - - - - - - - - - - -
SiiEd
File Path: SiiEd3.ocx path
Page 73

Version: SiiEd3.ocx version
-------------------------------------------------------
SiM911
Product name: SOFTUNE Workbench
File Path: SiM911.dll path
Version: SiM911.dll version
- - - - - - - - - - - - - - - - - - - - - - - - - - - -
Language Tools
- FR Family SOFTUNE C/C++ Compiler version
File Path: fcc911s.exe path
- FR Family SOFTUNE Assembler version
File Path: fasm911s.exe path
- FR Family SOFTUNE Linker version
File Path: flnk911s.exe path
- FR Family SOFTUNE Librarian version
File Path: flib911s.exe path
CHAPTER2 Dependence Functions
- SOFTUNE FJ-OMF to S-FORMAT Converter version
File Path: f2ms.exe path
- SOFTUNE FJ-OMF to INTEL-HEX Converter version
File Path: f2is.exe path
- SOFTUNE FJ-OMF to INTEL-EXT-HEX Converter version
File Path: f2es.exe path
- SOFTUNE FJ-OMF to HEX Converter version
File Path: f2hs.exe path
-------------------------------------------------------
SiOsM
Product name: Softune Workbench
File Path: SiOsM911.dll path
Version: SiOsM911.dll version
-------------------------------------------------------
FR Series Debugger DLL
Product name: SOFTUNE Workbench
File Path: SiD911.dll path
Version: SiD911.dll version
- - - - - - - - - - - - - - - - - - - - - - - - - - - -
Debugger type: Current debbuger type
MCU type: Currently selected target MCU
VCpu dll name: Path and name of the currently used VCpu dll
VCpu dll version: Version of the currently used virtual debugger DLL
63
Page 74

CHAPTER2 Dependence Functions
REALOS version: REALOS version
-------------------------------------------------------
SiIODef
Product name: Softune Workbench
File Path: SiIODef.dll path
Version: SiIODef.dll version
=======================================================
Current path: Path of the currently used project
Language: Currently used language
Help file path: Help file path
64
Page 75

CHAPTER2 Dependence Functions
2.2 Emulator Debugger (MB2197)
This section describes the emulator debugger functions that are available when the
emulator debugger (MB2197) is specified.
■ Emulator Debugger
When choosing the emulator debugger from the setup wizard, select one of the following emulators.
• MB2197
• MB2198
The following description explains the case when MB2197 has been selected. The emulator debugger
(MB2197) is software that controls an emulator from a host computer via a communications line (RS-232C
or LAN) to evaluate programs.
Products targeted for debugging must have the following DSUs (debug support units):
•DSU1
•DSU2
•DSU3
Before using the emulator debugger, it is necessary to initialize the emulator. For details, refer to
"Appendix B Monitoring Program Download", and "Appendix C LAN Interface Setup", in "SOFTUNE
Workbench Operation Manual".
65
Page 76

CHAPTER2 Dependence Functions
2.2.1 Setting Operating Environment
This section explains the operating environment setup.
■ Setting Operating Environment
For emulator debugger (MB2197), the following items must be set according to the operating environment.
Each setting item has a default value at startup. Therefore, if the default value is used as it is, there is no
need to change this setting. Adjusted settings can be used as new default settings from the next time.
• MCU operation mode
• DRAM refresh control
• Cache flush control
• Operating Frequency
66
Page 77

CHAPTER2 Dependence Functions
2.2.1.1 MCU Operation Mode
The following four modes are in the MCU Operation Mode. The Internal Trace Mode and
External Trace Mode are enabled only with products using the DSU3 chips. The Full
Trace Mode and Real-time Mode are not enabled with products using the DSU3 chips.
• Full Trace Mode
• Real Time Mode
• Internal Trace Mode
• External Trace Mode
■ Setting MCU Operation Mode
Set the MCU operation mode. There are two modes: full trace, and real-time. To set the operation mode,
use either the [Setup] - [Debug Environment] - [Debug Environment] menu, or the SET RUNMODE
command in the Command window.
● Full Trace Mode
In the full trace mode, all instruction executions can be traced without omission. However, if branching
occurs more than three times within 11 cycles, operations may not be real-time due to the wait entered to
MCU as acquiring the trace data is preceded. This mode cannot be specified with DSU3 chips.
● Real-time Mode
In the real-time mode, a program runs in real-time. However, if branching occurs more than three times
within 11 cycles, some trace data may be omitted.
This mode cannot be specified with DSU3 chips.
● Internal Trace Mode
Trace data is stored in the specialized trace memory built-in to the chip. The program is executed at real
time, but this is possible only with DSU3 chips which include that function.
● External Trace Mode
Trace data is stored in the specialized trace memory mounted on the adapter board. The program is
executed at real time.
This mode may not be specified depending on the specification of the adapter board. Check your adapter
board specification.
67
Page 78

CHAPTER2 Dependence Functions
2.2.1.2 DRAM Refresh Control
This section explains DRAM refresh setup.
■ DRAM Refresh Control
The operating frequency of some DSU chips is automatically divided at a break (in emulation mode).
When this happens, the register (RFCR) must be reset if the built-in DRAM refresh function is used on the
user target.
The RFCR register values for On Execution (in user mode) and On Break (in emulation mode) can be set
by [RFCR] tab in debug environment setting dialog. When the mode is switched, the values set here are
used to set to the RFCR register.
Note:
When using chips with an operating frequency that is not divided automatically at a break (in
emulation mode), or when the built-in DRAM refresh function at the user target is not in use, this
function causes a slowdown in debugger operation due to writing to the RFCR register.
68
Page 79

2.2.1.3 Cache Flush Control
This section explains cache flush setup.
■ Cache Flush Control
When using a chip with cache memory, rewriting the memory and software break point setup using
commands is not reflected in the cache. Therefore, cache flushing must be performed when such
commands are executed. The emulator debugger (MB2197) has a function to flush the cache
automatically, monitor memory rewriting, and set software break points, etc.
This function is controlled using the [Emulation] tab in debug environment setting dialog.
Note:
When the automatic cache flushing option is enabled, it may negatively affect the program speed.
CHAPTER2 Dependence Functions
69
Page 80

CHAPTER2 Dependence Functions
2.2.1.4 Operating Frequency
This section explains the setting of operating frequencies.
■ Operating frequencies
Set the operating frequencies of the MCU. Enable only DSU3. DSU3 ranges from 1 to 200 MHz. This
setting provides the optimum communication speed between the MCU and emulator.
This function can be controlled by the [Frequency] tab in debug environment setting dialog.
Notes:
• This setting is used to set maximum operating frequencies. Actual operating frequencies will not
be changed.
• Actual operating frequencies exceeding these settings will cause improper communication with
the emulator.
70
Page 81

CHAPTER2 Dependence Functions
2.2.2 Notes on Executing Program
There are some precautions to observe when using program execution commands.
■ Real-time Functionality in Running Program
When the MCU is in the full trace mode, there are some cases when a program cannot execute in real-time.
The MCU operation mode can be set up by using either the [Emulation] tab in debug environment setting
dialog, or the SET RUNMODE command in the Command window.
■ Precaution on executing the delay branch instruction
If the delay branch instruction is executed in one of the following procedures, the instruction (just after the
delay branch instruction) placed in the delay slot is executed, and a break is set just after the delay branch
instruction was executed.
• [Debug] - [Run] - [Step In] menu
• [Debug] - [Run] - [Step Over] menu
■ Restrictions when Suspended by Software Break
When there is a software break at the current PC location, if either the [Debug] - [Run] - [Go] menu or the
Go command is executed, the emulator debugger (MB2197) performs one execution step internally, and
then executes the program in batch processing. In addition, when a software break is set for the instruction
to clear the T-flag, and when either the [Debug] - [Run] - [Go] menu or the Go command is executed from
that address, all software breaks are disregarded. When this happens, any interrupt is masked too.
■ Value of TBR Register
Note a program null-function may occur if you specify such value for the TBR register as the vector table
overlaps to the I/O area.
■ Precautions on executing the instruction for clearing flag T
If one of the following procedures is executed, the instruction for clearing flag T is executed continuously.
All software breaks are then ignored.
• [Debug] - [Run] - [Step In] menu
• [Debug] - [Run] - [Step Over] menu
71
Page 82

CHAPTER2 Dependence Functions
2.2.3 Commands Available during Execution of User Program
This section explains the commands available during the execution of a user program.
■ Commands Available during Execution of User Program
The emulator debugger (MB2197) allows you to use certain commands during the execution of a user
program.
For more details, refer to "■ Supported Debuggers" in "SOFTUNE Workbench Command Reference
Manual".
The double circle indicates that it is available during the execution of a user program.
Table 2.2-1 shows the commands available during the execution of a user program.
Table 2.2-1 Commands Available during Execution of User Program
Notes:
Function Limitations and
Restrictions
MCU reset - 1.3 RESET
Memory operation (Read/Write)
-
Line assembly, Disassembly
• The conditions which allow you to use the commands in Table 2.2-1 are limited to the following
cases when a user program is executed.
- [Debug] - [Run] - [Go] menu
- [Go] button on the debug toolbar
The commands in Table 2.2-1 cannot be used when the GO command is entered in the command
window.
• An error message appears if you enter a command that cannot be used during the execution of a
user program.
"E4404S Command error (MCU is busy)."
-
Major Commands
5.1 EXAMINE
5.2 ENTER
5.3 SET MEMORY
5.4 SHOW MEMORY
5.5 SEARCH MEMORY
5.8 COMPARE
5.9 FILL
5.10 MOVE
5.11 DUMP
6.1 ASSEMBLE
6.2 DISASSEMBLE
72
Page 83

CHAPTER2 Dependence Functions
2.2.4 Break
The emulator debugger (MB2197) provides seven types of break functions. When by
each break function aborts program execution, the address where a break occurred and
the break factor are displayed.
■ Break Functions
The emulator debugger (MB2197) provides the following seven types of break functions;
• Code break
• Code event break
• Date event break
• Trace buffer-full break
• Alignment error break
• External trigger break
• Forced break
73
Page 84

CHAPTER2 Dependence Functions
2.2.4.1 Code Break
This function aborts the program execution by monitoring a specified address by
hardware or software.
A break occurs before executing an instruction at the specified address.
■ Code Break
This function aborts the program execution by monitoring a specified address by hardware or software.
A break occurs before executing an instruction at the specified address.
The maximum number of points that can be set is as follow:
Hardware: 5 points
Software: 4096 points
When the code break occurs, the following message appears at the status bar.
- Hardware
Break at address by hardware breakpoint
- Software
Break at address by breakpoint
■ How to set
Set the break as follows.
• Command
- SET BREAK/HARD (hardware)
- SET BREAK/SOFT (software)
For details, refer to "3.1 SET BREAK (type 1)" in "SOFTUNE Workbench Command Reference
Manual".
• Dialog
- "Code" tab in breakpoint setting dialog
For details, refer to "4.6.4 Breakpoint" in "SOFTUNE Workbench Operation Manual".
•Window
- Source window/disassemble window
For details, refer to "3.7 Source Window" or "3.9 Disassemble Window" in "SOFTUNE Workbench
Operation Manual".
74
Page 85

Notes:
CHAPTER2 Dependence Functions
Hardware
The hardware break requires the following cautions:
- Do not set any hardware break in instruction placed in a delay slot. When the hardware break
is set in the instruction, a branch does not occur even if the program is reexecuted after break.
- Be sure to set a breakpoint at the starting address of the instruction. A break may not occur if
an address other than the starting address is specified.
- When the program is executed from the address at which a hardware break is set, a break
occurs without executing the instruction if the immediately preceding program execution is
stopped by a factor other than the instruction break. To execute the instruction, reexecute the
program.
Software
The software break requires the following cautions:
- A breakpoint cannot be set in any area, such as ROM, where data cannot be written properly.
In this case, a verify error occurs when program execution is started (continuous execution or
stepwise execution is started).
- Be sure to set a breakpoint at the starting address of the instruction. If breakpoint is set during
instruction execution, the program may malfunction.
75
Page 86

CHAPTER2 Dependence Functions
2.2.4.2 Code Event Break
This function used breakpoints contained in the evaluation chip. The address mask,
pass count, and sequential mode can be set.
■ Code Event Break
This function uses breakpoints contained in an evaluation chip. The address mask and pass count can be
set. Up to two breakpoints can be set and used in two modes.
1. OR mode (if a hit is found in either code event 1 or 2, a break occurs)
2. Sequential mode (if a hit is found in code events 1 and 2 in the order, a break occurs)
When the code event break occurs, the following message appears at the status bar.
1. OR mode
Break at address by code event break (No.: Code event number)
2. Sequential mode
Break at address by code event break (sequential)
■ How to set
Set the code event break as follows.
Note:
• Command
- SET CODEEVENT
- SET SEQUENCE/ON (only in sequential mode)
For details, refer to "3.19 SET CODEEVENT" in "SOFTUNE Workbench Command Reference
Manual".
• Dialog
- "Code" tab in event setting dialog
For details, refer to "4.6.5 Event" in "SOFTUNE Workbench Operation Manual".
In the DSU3 chip, the code event can be used as a break factor and a trace measurement start
factor. This mode is called a trace sampling mode. There are two trace sampling modes.
a. Full mode: The code event is used as a break factor.
b. Trigger mode: The code event is used as a trace measurement start factor.
To use the code event as a break factor, set the full mode.
Set as follows:
Command
- SET TRACE/FULL
For details, refer to "4.12 SET TRACE (type 2)" in "SOFTUNE Workbench Command
Reference Manual".
Dialog
- Trace setting dialog
For details, refer to "4.4.8 Trace" in "SOFTUNE Workbench Operation Manual".
76
Page 87

CHAPTER2 Dependence Functions
2.2.4.3 Data Event Break
This function uses breakpoints contained in the evaluation chip. The address mask,
data size, access type, and sequential mode can be set.
■ Data Event Break
This function uses breakpoints contained in the evaluation chip. The address mask, data size (byte/half
word/word), and access attributes (read/write) can be set.
Up to two breakpoints can be set and used in two modes.
1. OR mode (if a hit is found in either data event 1 or 2, break occurs)
2. Sequential mode (if a hit is found in data events 1 and 2 in this order, a break occurs)
When the data event break occurs, the following message appears at the status bar.
1. OR mode
Break at address by data event break (No: Data event number)
2. Sequential mode
Break a address by data event break (sequential)
■ How to set
Set the data event break as follows.
• Command
- SET DATAEVENT
- SET SEQUENCE/ON (only in sequential mode)
For details, refer to "3.24 SET DATAEVENT" in "SOFTUNE Workbench Command Reference
Manual".
• Dialog
- "Data" tab in event setting dialog
For details, refer to "4.6.5 Event" in "SOFTUNE Workbench Operation Manual".
Note:
In the DSU3 chip, the data event can be used as a break factor and a trace measurement start
factor. This mode is called a trace sampling mode. There are two trace sampling modes.
a. Full mode: The data event is used as a break factor.
b. Trigger mode: The data event is used as a trace measurement start factor.
To use the data event as a break factor, set the full mode.
Set as follows:
Command
- SET TRACE/FULL
For details, refer to "4.12 SET TRACE (type 2)" in "SOFTUNE Workbench Command
Reference Manual".
Dialog
- Trace setting dialog
For details, refer to "4.4.8 Trace" in "SOFTUNE Workbench Operation Manual".
77
Page 88

CHAPTER2 Dependence Functions
2.2.4.4 Trace Buffer-full Break
This function aborts the program execution when the trace buffer becomes full.
■ Trace Buffer-full Break
This function aborts the program execution when the trace buffer becomes full.
When the trace buffer-full break occurs, the following message appears at the status bar.
Break at address by trace buffer full
■ How to set
Set the trace buffer-full break as follows.
• Command
- SET TRACE/BREAK
For details, refer to "4.12 SET TRACE (type 2)" in "SOFTUNE Workbench Command Reference
Manual".
• Dialog
- Trace setting dialog
For details, refer to "4.4.8 Trace" in "SOFTUNE Workbench Operation Manual".
78
Page 89

CHAPTER2 Dependence Functions
2.2.4.5 Alignment Error Break
This function aborts the program execution when an instruction access or a word/half
word access beyond the boundary is made to the odd address.
■ Alignment Error Break
This function aborts the program execution when an instruction access or a word/half word access beyond
the boundary is made to the odd address. Whether to enable or disable the alignment error break can be set
for both instruction access and data access.
When the alignment error break occurs, the following message appears at the status bar.
• Instruction access
Break at address by alignment error break (code)
• Data access
Break at address by alignment error break (data)
■ How to set
Set the alignment error break as follows.
• Command
- ENABLE ALIGNMENTBREAK
- DISABLE ALIGNMENTBREAK
For details, refer to "3.37 ENABLE ALIGNMENTBREAK" in "SOFTUNE Workbench Command
Reference Manual".
• Dialog
- "Emulation" tab in debug environment setting dialog
For details, refer to "4.7.2.3 Debug Environment" in "SOFTUNE Workbench Operation Manual".
79
Page 90

CHAPTER2 Dependence Functions
2.2.4.6 External Trigger Break
This function aborts the program execution when an external signal is input from the
TRIG of the Emulator.
■ External Trigger Break
This function aborts the program execution when an external signal is input from the TRIG of the
Emulator.
When the external trigger break occurs, the following message appears at the status bar.
Break at address by external trigger break
■ How to set
Set the external trigger break as follows.
• Command
- SET TRIGGER
For details, refer to "3.35 SET TRIGGER" in "SOFTUNE Workbench Command Reference
Manual".
• Dialog
- "Emulation" tab in debug environment setting dialog
For details, refer to "4.7.2.3 Debug Environment" in "SOFTUNE Workbench Operation Manual".
80
Page 91

CHAPTER2 Dependence Functions
2.2.4.7 Forced Break
This function forcibly aborts the program execution to generate a break.
■ Forced Break
This function forcibly aborts the program execution to generate a break.
When the forced break occurred, the following message appears at the status bar.
Break at address by command abort request
■ How to Generate
A forced break is generated in the following methods:
•Menu
[Debug] - [Abort] menu
For details, refer to "4.6.2 Abort" in "SOFTUNE Workbench Operation Manual".
• Command
- ABORT
For details, refer to "2.2 ABORT" in "SOFTUNE Workbench Command Reference Manual".
Note:
The forced break cannot be generated when the MCU is in the low power consumption mode or in
the hold state. If the MCU is in the low power consumption mode or in the hold state when the forced
break is requested by the [Debug]-[Abort] menu during the program execution, the [Debug]-[Abort]
menu is ignored. To generate a break forcibly, use the [Debug]-[Abort] menu to remove a factor by
the user system or use the [Debug]-[Reset of MCU] menu to remove it. If the MCU enters the low
power consumption mode or the hold state during the program execution, the condition is displayed
at the status bar.
81
Page 92

CHAPTER2 Dependence Functions
2.2.5 Measuring Execution Cycle Count
This function measures the program execution cycle count.
■ The measuring item
Measures program execution cycle counts.
The maximum measurable count is "2 to the power of 48 - 1", in other words, up to 281,474,976,710,655
cycles.
The measurement is performed whenever a program is executed, and the measurement result displays the
following two values:
• Number of cycles spent on the previous program execution
• Total number of cycles executed since the previous clearing
■ Displaying Measurement Results
Either of the following methods can be used to display the measurement results.
1. Display by dialog
The results appear in the time measurement dialog, which can be displayed by selecting [Debug] –
[Time Measurement] menu.
2. Display by command
Enter the SHOW TIMER command in the command window.
■ Clearing Measurement Results
Either of the following methods can be used to clear the measurement results.
1. Operation by dialog
Click the [Clear] button in the time measurement dialog, which can be displayed by selecting [Debug] –
[Time Measurement] menu.
2. Clearing by command
Enter the CLEAR TIMER command in the command window.
■ error
The number of measurement cycles includes an error of about 20 cycles. In the Real-time mode or Full
Trace mode, it has additionally an error of about at most (*1) cycles. For time measurement, use the
Internal Trace mode or External Trace mode, which has less error.
*1: Autowait 1 : +1250
Autowait 3 : +2500
Autowait 7 : +5000
Autowait 15 : +10000
Note:
82
Execution cycle counts are measured in several tens of cycles at one execution. When measuring
execution cycles, set for consecutive executions of many instructions to decrease the efficacy of
errors.
Page 93

CHAPTER2 Dependence Functions
2.2.6 Trace
The address and status information can be sampled during program execution to record
it in a trace buffer. This function is called a trace.
■ Trace
Data recorded with the trace function can be used to make a detailed analysis of a program execution
history.
The trace buffer is in the form of a ring. When it becomes full, it records the next data by automatically
overwriting the buffered data at the beginning.
• Trace data
• Trace sampling
• Setting trace
• Displaying trace data
• Display format of trace data
• Searching trace data
• Saving Trace dada
• Clearing trace data
• Notes on Use of Tracing Function
83
Page 94

CHAPTER2 Dependence Functions
2.2.6.1 Trace Data
Data sampled and recorded by tracing is called trace data.
■ Trace Data
You can sample the following sizes using the emulation debugger.
• Full Trace Mode: 65536 bytes
• Real Time Trace Mode: 65536 bytes
• Internal Trace Mode: 128 frames or 64 frames
(The number of frame is different by an evaluation chip.)
• External Trace Mode: 65536 frames
The following data is sampled.
• Address (32 bits)
• Data (32 bits)
• Status Information
- Access Data Size: Word/Halfword/Byte
- Data Types: Data Access/Instruction Execution
Note:
Trace data requires a few bytes for each frame.
84
Page 95

CHAPTER2 Dependence Functions
2.2.6.2 Trace Sampling
Trace measurements of the program execution status are made during the interval
between the program start and stop. The DSU3 chip emulator debugger (MB2197)
performs trace measurements until the program execution stops, using the first or
second code event or first data event as a trigger for starting trace measurement.
■ Trace Sampling
When the trace function is enabled, data is always sampled and recorded in the trace buffer during the
execution of an execution command.
In addition to the above function, the DSU3 chip emulator debugger (MB2197) has functions for starting
trace measurement during the next program execution and making trace measurements of data access with
a specified region.
• When mode switching is effected from the trace sampling mode to the trigger mode, trace
measurements start at the first or second code event hit or the first data event hit.
• When the internal trace mode or external trace mode is selected as the MCU operation mode, data
sampling is conducted only for data accesses to a specified data trace measurement region.
The program execution aborts due to a break factor such as a breakpoint, terminating the trace.
Furthermore, when the trace buffer becomes full, a program break can be invoked. This break is called a
trace buffer full break.
■ Frame Number
A number is assigned to each frame of sampled trace data. This number is called a frame number.
The frame number is used to specify the display start position of the trace buffer.
The value 0 is assigned to the last-sampled trace data. Negative values are assigned to trace data sampled
before the arrival at the triggering position.
85
Page 96

CHAPTER2 Dependence Functions
2.2.6.3 Setting Trace
To perform a trace, complete steps 1 through 3 below. When a program is executed
after completion of the following steps, trace data is sampled. Trace setup can also be
performed from the command window. The DSU3 chip allows the trace measurement
region for data access to be specified.
■ Setting Trace
1. Enable the trace function
- This is done by [Setup] - [Trace] in the trace window shortcut menu. This program will startup and
will be enabled.
2. Set the MCU operation mode
- This is done by the debug environment setting dialog.
- Real time mode operates while executing, but there is a great possibility of losing trace data. Full
trace mode does not operate while executing, but there is a very low possibility of losing trace data.
If there are many divisional instructions, we recommend that you use the full trace mode.
- With the DSU3 chip, you can specify internal trace mode or external trace mode. Using these two
modes, you can measure while operating during execution without losing trace data.
3. Set the trace buffer full break
- When the trace buffer is full, you can make a break. This is done using the setting dialogs of the
trace window shortcut menu [Setup] - [Trace].
- When starting up this program, it is setup for no breaks.
- Also, on emulator debuggers using DSU3 chips, you can specify the data access area for performing
the trace measurements.
86
Page 97

2.2.6.4 Displaying Trace Data
Data recorded in the trace buffer can be Displayed.
■ Displaying Trace Data
The trace window displays how much trace data is stored in the trace buffer. Also, you can use the SHOW
TRACE command from the command window.
When the emulator debugger uses the DSU3 chip, it displays branch information and data access
information as trace data. To display instructions executed between branch instructions, it is necessary to
open the trace details dialog. The same purpose can also be achieved by executing the SHOW
DETAILTRACE command from the command window.
CHAPTER2 Dependence Functions
87
Page 98

CHAPTER2 Dependence Functions
2.2.6.5 Display Format of Trace Data
There is a format for displaying trace buffer data.
■ Display Format of Trace Data
• Display Only Instruction Operation: (Specify Instruction)
■ Display Only Instruction Operation
In this mode, the instruction operation is displayed in disassembly units.
88
Page 99

2.2.6.6 Searching Trace Data
The trace buffer can be searched to locate target data.
■ Searching Trace Data
Specify the address, data, and access information for searching. The address and data can be masked. This
search function can be run by clicking the Search button in the trace window.
CHAPTER2 Dependence Functions
89
Page 100

CHAPTER2 Dependence Functions
2.2.6.7 Saving Trace Data
The debugger has function of saving trace data.
■ Saving Trace Data
Save the trace data to the specified file.
For details on operations, refer to Sections "3.14 Trace Window", and "4.4.8 Trace" in "SOFTUNE
Workbench Operation Manual" and Section "4.9 Show Trace" in "SOFTUNE Workbench Command
Reference Manual".
90
 Loading...