

Fracture Technology
Associates
Non-Linear Fracture Toughness Testing and Analysis
Version 3+.16.01
Users’ Reference Manual
January 2016
Keith Donald
Amy Blair
Fracture Technology Associates
2412 Emrick Boulevard
Bethlehem, PA 18020
610-868-3054
www.FractureTech.com

Page 2 of 148
NLFT Testing - Series 2015 - V3+.16.01

Table of Contents
1.0 The FTA NLFT Testing and Analysis System .............................................7
1.1 Introduction .................................................................................7
1.2 Software .....................................................................................7
1.2 The ADwin Gold .........................................................................7
1.4 Other Hardware Requirements ...................................................9
1.5 License Agreement.....................................................................9
1.6 Manual Layout ............................................................................9
2.0 Installation Guide ...................................................................................... 11
2.1 Hardware and Drivers ............................................................... 11
2.1.1 Analog input and output connections ............................. 11
2.1.2 Digital input and output connections .............................. 12
2.2 Connecting the FTA-DCPD Current Supply and Amplifier ........ 13
2.3 PC Setup and Installation of the FTA Software ........................ 15
2.4 Installing the ADWin Drivers on the PC .................................... 16
2.5 Testing in Simulation ................................................................ 18
2.5 Tuning ...................................................................................... 18
3.0 Using the NLFT Testing Software ............................................................. 19
3.1 Understanding Testing Files ..................................................... 19
3.2 Running a Test Using the FTA NLFT Software ........................ 20
3.2.1 Setup ............................................................................. 20
3.2.2 Running The Test .......................................................... 25
4.0 NLFT Testing Software: Description of Menus and Tabs ......................... 29
4.1 Splash Screen .......................................................................... 29
4.2 Main Menu ................................................................................ 30
4.3 File ............................................................................................ 30
4.3.1 Save Analysis File ......................................................... 30
4.3.2 Exit ................................................................................. 31
4.4 Config ....................................................................................... 31
4.4.1 Hardware Configuration ................................................. 32
4.4.1.1 Calibration (compliance) .................................. 32
4.4.1.2 Calibration (DCPD).......................................... 33
4.4.1.3 Configuration (Compliance and DCPD) ........... 34
4.4.2 Test Set-up .................................................................... 36
4.4.2.1 Initialize ........................................................... 37
4.4.2.2 Calibration ....................................................... 40
4.4.2.3 Coefficients ..................................................... 44
4.4.2.4 Dimensions ..................................................... 46
4.4.2.5 Compliance ..................................................... 48
4.4.2.6 DCPD .............................................................. 50
4.4.2.7 Storage ............................................................ 52
4.4.2.8 Limits ............................................................... 54
4.4.3 General information ....................................................... 55
4.4.3.1 General ........................................................... 56
4.4.3.2 Precrack .......................................................... 57
Page 3 of 148
NLFT Testing - Series 2015 - V3+.16.01

4.5 Control ...................................................................................... 58
4.5.1 Ramp Generator: Compliance and DCPD ..................... 58
4.6 Display ...................................................................................... 63
4.6.1 Status ............................................................................ 63
4.6.2 Load-Displacement ........................................................ 64
4.6.3 J – Delta a...................................................................... 66
4.7 Comments ................................................................................ 67
4.8 Help .......................................................................................... 67
5.0 Using the FTA Analysis Software ............................................................. 69
5.1 How the NLFT Analysis Program Works ................................ .. 69
5.2 Understanding the Files Used by the Analysis Program ........... 70
5.3 E1820 Analysis Procedure ....................................................... 71
5.4 E399 Analysis Procedure ......................................................... 74
6.0 NLFT Analysis Software: Description of Menus and Tabs ........................ 79
6.1 Splash Screen .......................................................................... 79
6.2 Main Form: Menu Items ............................................................ 79
6.2.1 File ................................................................................. 80
6.2.1.1 Open ............................................................... 81
6.2.1.2 Save ................................................................ 81
6.2.2 Display ........................................................................... 81
6.2.3 Help ............................................................................... 81
6.2.4 Quit ................................................................................ 81
6.3 Main Form: Tabs ...................................................................... 82
6.3.1 Control ........................................................................... 82
6.3.2 Coeff[icient]s .................................................................. 85
6.3.3 General .......................................................................... 86
6.3.4 Dimensions .................................................................... 88
6.3.5 Visuals, Etc. ..................................................................... 89
6.3.6 Comments ..................................................................... 91
6.3.7 Data ............................................................................... 92
6.3.8 Load-Disp Data .............................................................. 94
6.4 Processing The Data ................................................................ 96
6.4.1 Run Non-Linear Analysis ............................................... 96
6.4.2 Process Load-Disp Data ................................................ 96
6.5 Display ...................................................................................... 96
6.5.1 J – delta a Display ......................................................... 97
6.5.2 Output Display ............................................................... 98
6.5.3 Load-displacement Display ............................................ 99
6.6 Post Processing ..................................................................... 101
7.0 Analysis Utility ........................................................................................ 103
7.1. Non-Linear Report .................................................................. 103
7.1.1 User Input .................................................................... 105
7.1.2 Reduced Data .............................................................. 106
7.1.3 J-plot ............................................................................ 107
7.1.4 Cover page .................................................................. 108
7.1.5 Raw Data ..................................................................... 110
Page 4 of 148
NLFT Testing - Series 2015 - V3+.16.01

7.1.6 Additional Data ............................................................ 111
7.1.7 Variables ...................................................................... 112
7.2. Load-Disp and Linear Report ................................................. 113
7.2.1 Load Disp..................................................................... 114
7.2.2 Load Time .................................................................... 115
7.2.3 User Input .................................................................... 116
7.2.4 Cover Page .................................................................. 117
7.2.5 K-Plot ........................................................................... 118
7.2.6 K-Plot ........................................................................... 119
7.2.7 Reg Data...................................................................... 120
7.2.8 Variables ...................................................................... 121
8.0 The NLFT Testing PLAYBACK software ................................................ 123
8.1 Using the Testing Playback Software ..................................... 123
8.2 Description of Menus and Tabs .............................................. 124
8.2.1 Splash Screen ............................................................. 124
8.2.2 Main Menu ................................................................... 125
8.2.2.1 File ................................................................ 125
8.2.2.2 Open ............................................................. 126
8.2.2.3 Save Analysis File As .................................... 126
8.2.2.4 Save Metric Load-Displacement ................... 126
8.2.3 Input ............................................................................. 126
8.2.3.1 Data ............................................................... 127
8.2.3.1.1 Initialize ........................................ 127
8.2.3.1.2 Coefficients .................................. 128
8.2.3.1.3 Dimensions .................................. 129
8.2.3.1.4 Calibration ................................... 130
8.2.3.2 Options .......................................................... 131
8.2.4 Display ......................................................................... 132
8.2.4.1 Load-Displacement ....................................... 132
8.2.4.2 J – Delta a ..................................................... 133
8.2.5 Help ............................................................................. 133
Appendix A: Recovery from System Crash ................................................. 135
Appendix B: Descriptions of Analysis Files ................................................. 137
B1: Log file .................................................................................... 137
B1a: Compliance .................................................................. 137
B1b: Potential Drop .............................................................. 139
B2: Compliance .in5 file ................................................................ 141
B2a: Field Descriptors .......................................................... 142
B2b: Glossary of Variables ................................................... 142
B3: RAW file ................................................................................. 146
B4: UNL file ................................................................................... 147
Page 5 of 148
NLFT Testing - Series 2015 - V3+.16.01

Page 6 of 148
NLFT Testing - Series 2015 - V3+.16.01

1.0 The FTA NLFT Testing and Analysis System
1.1 Introduction
Fracture Technology Associates’ fourth-generation Non-Linear Fracture Toughness
(NLFT) system is an updated hardware and software package designed primarily for
non-linear fracture toughness testing and analysis (ASTM E1820, E1921), ), although
linear elastic testing and analysis is supported (ASTM E399). Each system consists of
an ADwin Gold signal processor and a computer running the FTA NLFT software.
Enhancements to the software include the ability to perform cyclic J and da/dt with a K
profile, desirable for accelerated environmentally assisted cracking tests (K
Two analysis packages are included with each system: 1) standard analysis and 2)
testing playback software, which allows the user to reprocess unloading slopes that may
have captured non-linear crack measurement data during testing.
FTA’s basic NLFT (ASTM E1820, E1921) testing application is designed to run with the
ADwin Gold and any closed loop servo-hydraulic mechanical test machine and
controller, suitably configured for non-linear fracture toughness testing. It is important to
note that the fourth-generation software requires an ADwin with an integrated USB port:
older Adwins are not supported.
Ieac
).
1.2 Software
The basic software application uses either compliance (NLFT-C) or DC potential drop
(NLFT-D) for non-linear fracture toughness testing with a single crack monitor. The
combined application (NLFT-C/D) includes either, independent or simultaneous
compliance unloading and DC potential drop monitor of crack size.
The FTA NLFT analysis program runs independently of the Adwin Gold and has been
upgraded as well. The analysis program can run analysis files created by the new
testing software as well as previous versions.
1.3 The ADwin Gold
The hardware component of FTA’s testing system is the ADwin-Gold signal processor,
manufactured by the German company Jäger. The ADwin takes over from the test
machine controller and performs all function generation, data acquisition, and real-time
data processing, using the ADbasic programming language. ADbasic controls both high
(such as command control and data acquisition) and low priority processes (such as
determination of crack length). The ADwin performs all tasks on a priority basis
regardless of the computer’s workload and time-critical processes run independently of
Page 7 of 148
NLFT Testing - Series 2015 - V3+.16.01

the PC operating system. Thus, if the computer running the FTA software crashes, the
ADwin continues to maintain control and collect data. When the computer is rebooted, it
can access the ADwin process and tests continue uninterrupted.
The ADwin has a dedicated Analog Devices SHARC DSP processor; local memory; and
high-speed 16-bit resolution analog input and output. It provides real-time response
within one microsecond. Further documentation can be found in the ADwin manuals
provided with FTA systems.
Page 8 of 148
NLFT Testing - Series 2015 - V3+.16.01

1.4 Other Hardware Requirements
Required hardware for the FTA testing package includes the ADwin Gold and a
computer running the FTA software. A computer (either 32-bit or 64-bit) with a Pentium
3 processor and 256M memory (or better) and a CD/DVD drive is recommended.
Windows versions 98 thru 7 are supported, although ADwin drivers will differ according
to the OS used (see section 2.4 of this manual for further details).
For potential drop methods of crack measurement, FTA supplies its own high-quality,
DC potential drop instrumentation (FTA-DCPD). The FTA-DCPD was specifically
designed for the precise current and amplifier stability necessary for the reversing DC
potential drop method of monitoring crack length and consists of two units: a
programmable linear DC power supply with built-in solid-state polarity-reversing relays
and a two channel precision differential DC amplifier
Please consult FTA for additional details regarding system requirements.
1.5 License Agreement
Familiarization with the background and theory of fracture toughness testing as well as
the American Society for Testing and Materials (ASTM) standards for fracture
toughness testing (E1820, E1921, E399) is strongly recommended. Fracture
Technology Associates (FTA) assumes no liability for inappropriate use of this software
and hardware system. It is the user’s responsibility to provide back-up verification of the
performance and accuracy of this software package (i.e., visual checking of crack
length, independent monitoring of the applied loads, and redundant checking of the
analysis).
Each test system requires a software license for each of the two required testing
applications. Permission is granted to make copies of the software for back-up
purposes. The analysis software does not require a license for multiple copies and may
be loaded on additional computers for convenience of use. All rights and title to the
application software shall remain the sole and exclusive property of FTA. Distribution of
this software to another party is prohibited.
1.6 Manual Layout
This manual is intended as a beginning reference for new users of the FTA testing and
analysis software. The following section describes setup and installation of the ADwin
Gold; FTA-DCPD current supply and amplifier; and FTA software. Section 3.2 provides
step-by-step instructions to guide new users through the running of a room temperature
E1820 test, including the option of DCPD crack measurement. Section 4 provides
detailed descriptions of each of the testing software menus and displays in the order in
Page 9 of 148
NLFT Testing - Series 2015 - V3+.16.01

which they are typically opened by the user. Sections 5 through 8 detail use of the
analysis software, including testing playback.
This manual includes discussion of the E399 and E1820 standards only. Please contact
FTA for more details on using the NLFT software for E1921 testing and analysis.
Operation and troubleshooting of laboratory controllers and test frames are outside the
scope of this document: for guidance, users are encouraged to contact their equipment
manufacturers.
Page 10 of 148
NLFT Testing - Series 2015 - V3+.16.01

2.0 Installation Guide
2.1 Connecting the ADwin to the Controller and FTA-DCPD
The ADwin-Gold is factory-calibrated and configured for differential inputs, although
FTA can provide a calibration procedure upon request. The ADwin must be grounded
for use in conjunction with a test machine: it should be grounded to the system console
or the common ground of the controller (refer to the ADwin hardware manual Start Up
section for details).
2.1.1 ANALOG INPUT AND OUTPUT CONNECTIONS
For fracture toughness applications, the following analog BNC connections are required
(refer to ADwin hardware manual Connector section for details). Note that these
connections are different than those required by FTA’s previous testing applications.
load cell signal from the test controller: connects to the IN 1 connector on the
ADwin
external function generator input on the test machine controller: connects to the
OUT 1 connector on the ADwin
[for compliance] the displacement signal from the test controller or auxiliary
instrumentation: connects to the IN 2 connector on the ADwin.
[for DC potential drop] active probe amplifier output: connects to the IN 5
connector on the ADwin.
[for DC potential drop] reference probe amplifier output (if required): connects to
the IN 6 connector on the ADwin.
in addition, the ADwin’s IN3 and IN4 connectors may be used as auxiliary
channels for display and/or data logging
The software is configured for a 10 volt range. It is therefore recommended that only
active inputs be connected to the ADwin, since an unused displacement or DC potential
drop signal may have an off-scale output (greater than 10 volts). This condition
influences the analog input multiplexer settling time and may affect the readings of the
other channels.
Page 11 of 148
NLFT Testing - Series 2015 - V3+.16.01
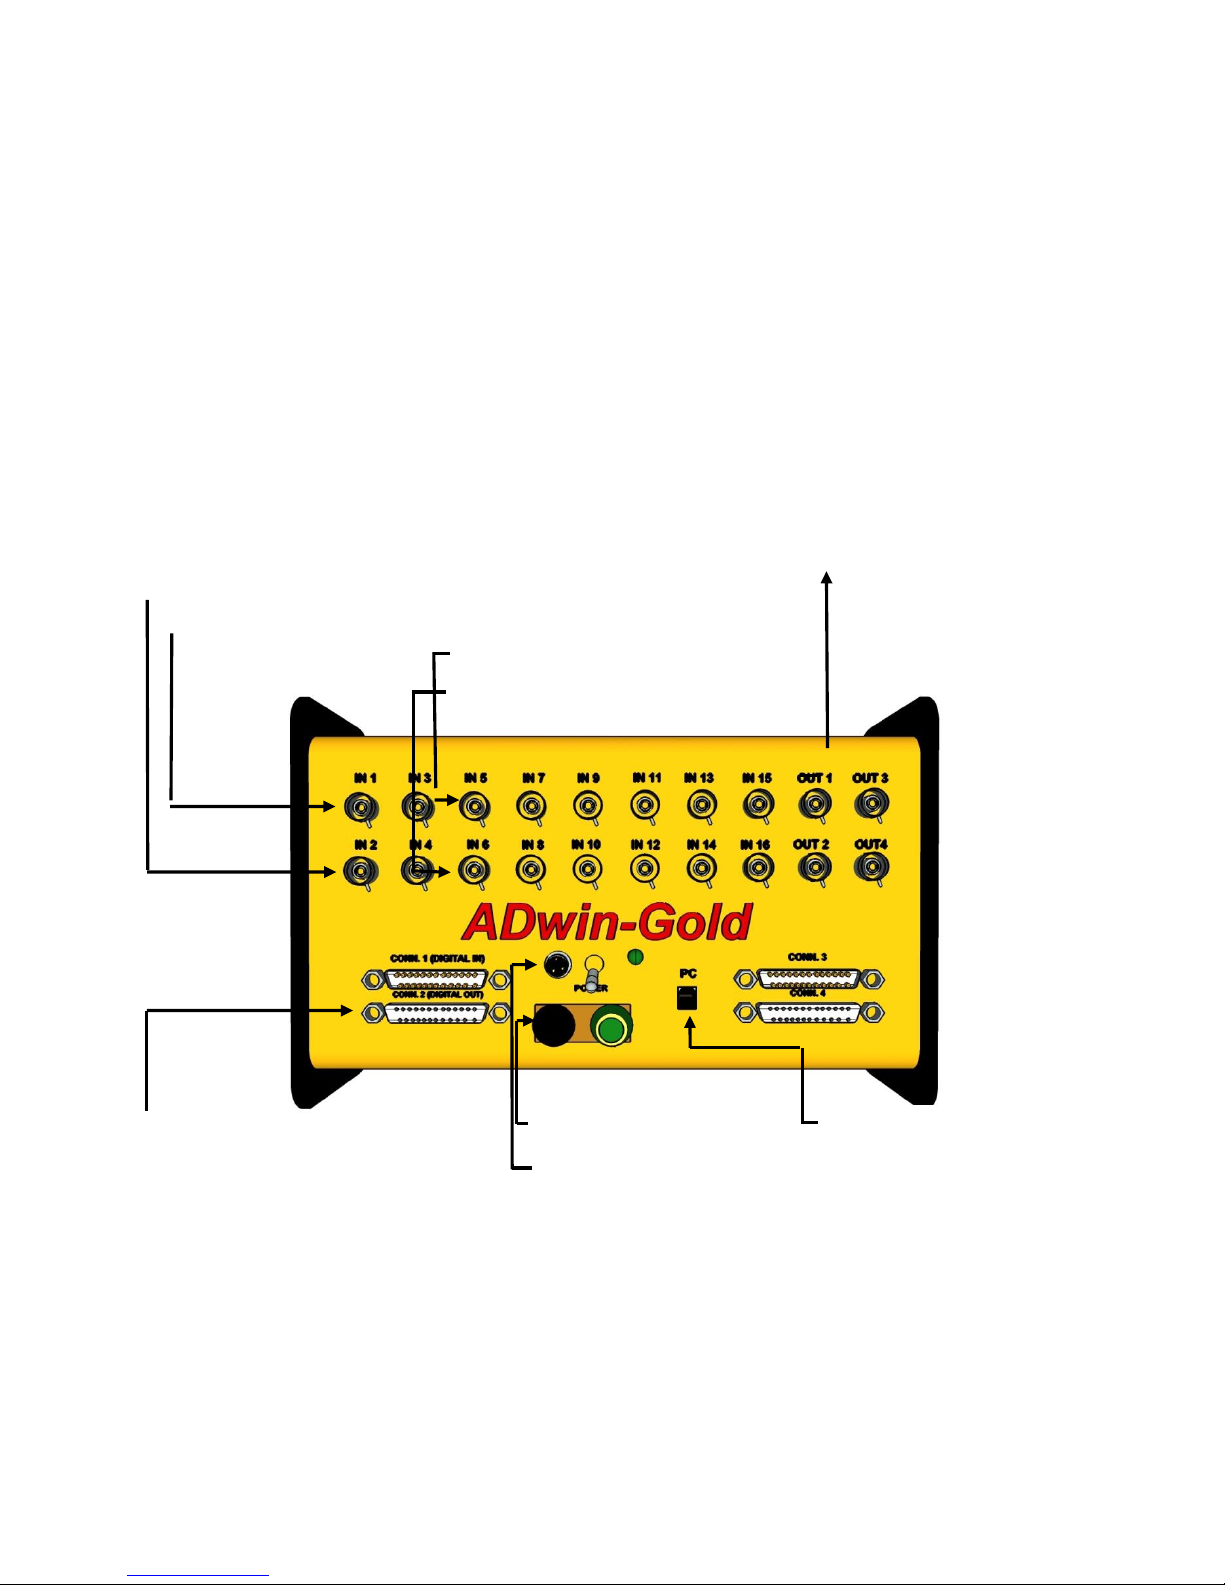
2.1.2 DIGITAL INPUT AND OUTPUT CONNECTIONS
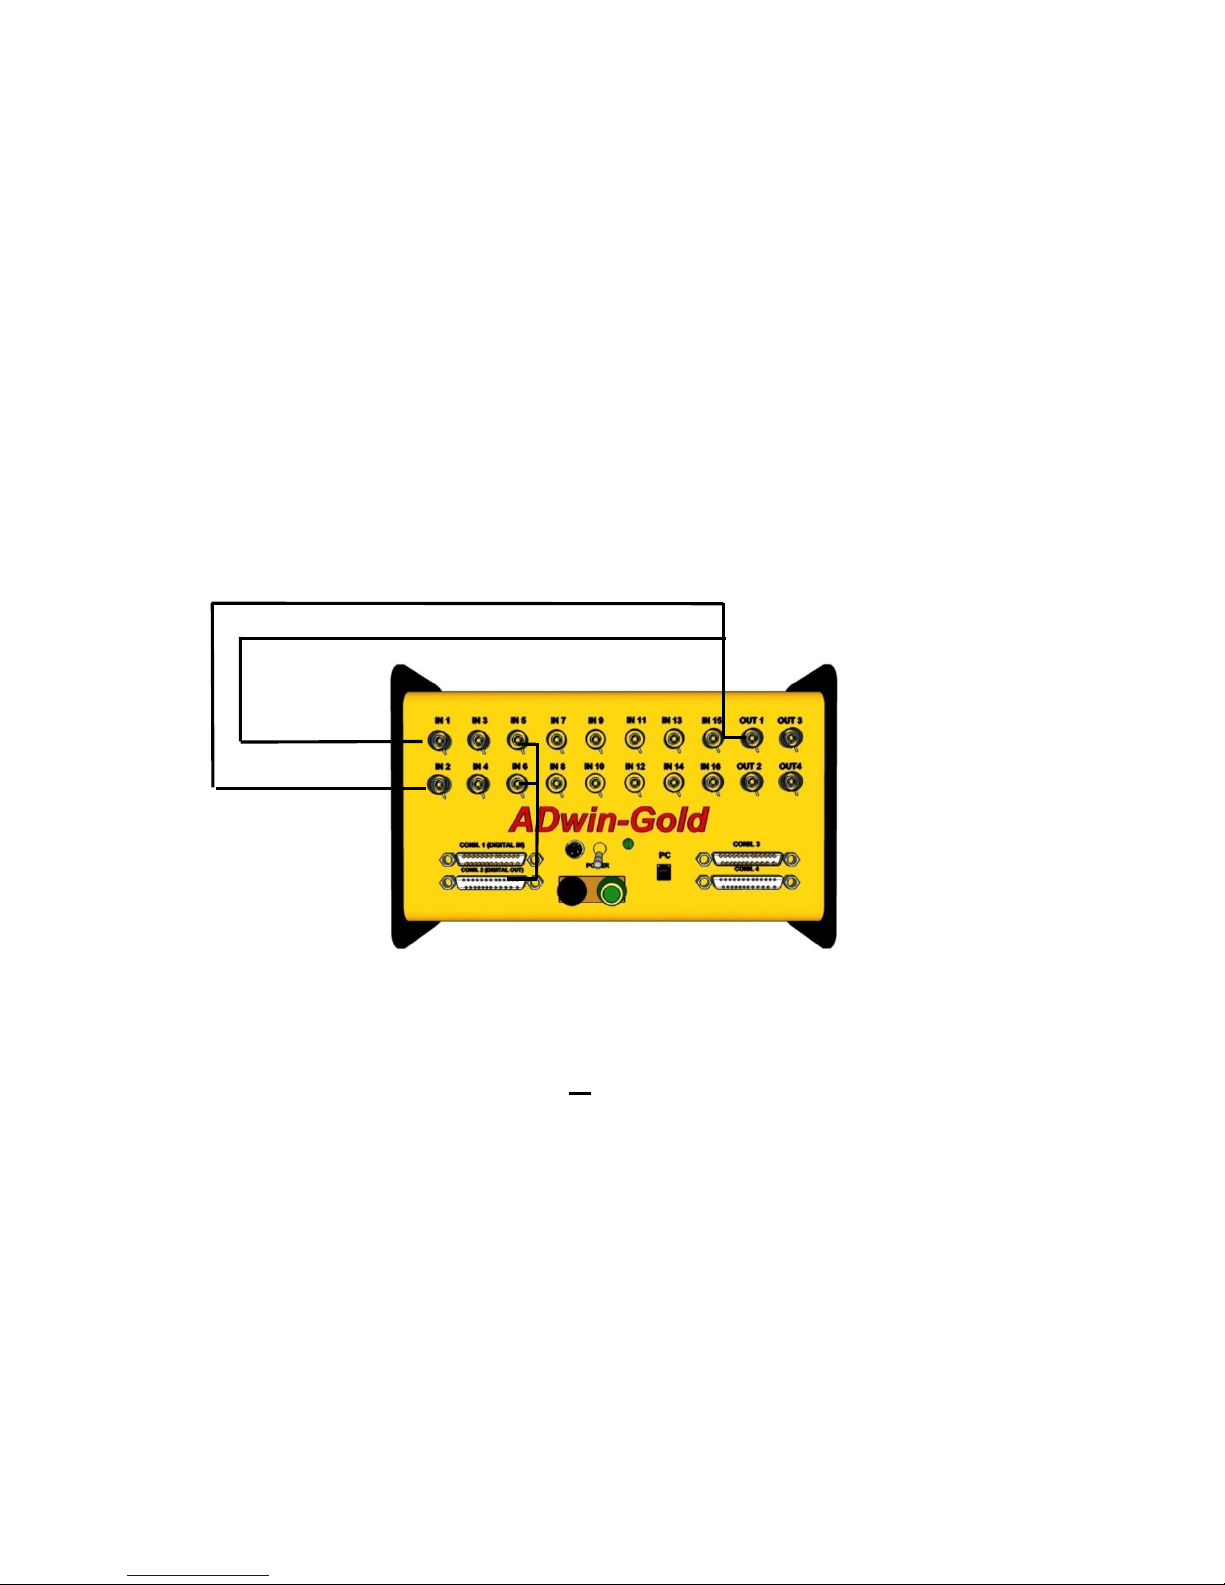
EXTERNAL FUNCTION GENERATION INPUT (OUT 1)
DISPLACEMENT SIGNAL (IN2)
LOAD CELL SIGNAL FROM TEST CONTROLLER (IN1)
ACTIVE DCPD (IN5)
REFERENCE DCPD (IN6)
CONTROLLER RUN STOP,
FTA-DCPD
POWER SUPPLY
CONTROLLER GROUND
PC USB
With each system, FTA supplies a 25-pin run-stop cable, which connects to CONN 2
(digital out) of the ADwin. Pins 5 and 13 of this connector (short red and black wires)
monitor the run state of the controller (pin 5 connects to ‘high’ and pin 13 to ‘low/ground’
of a digital-in logic signal – else, the wires are interchangeable). The nine-pin connector
goes to the back of the FTA-DCPD power supply if required. See Section 2.2 for FTADCPD hook-up.
An ADwin connection diagram appears below:
Page 12 of 148
NLFT Testing - Series 2015 - V3+.16.01
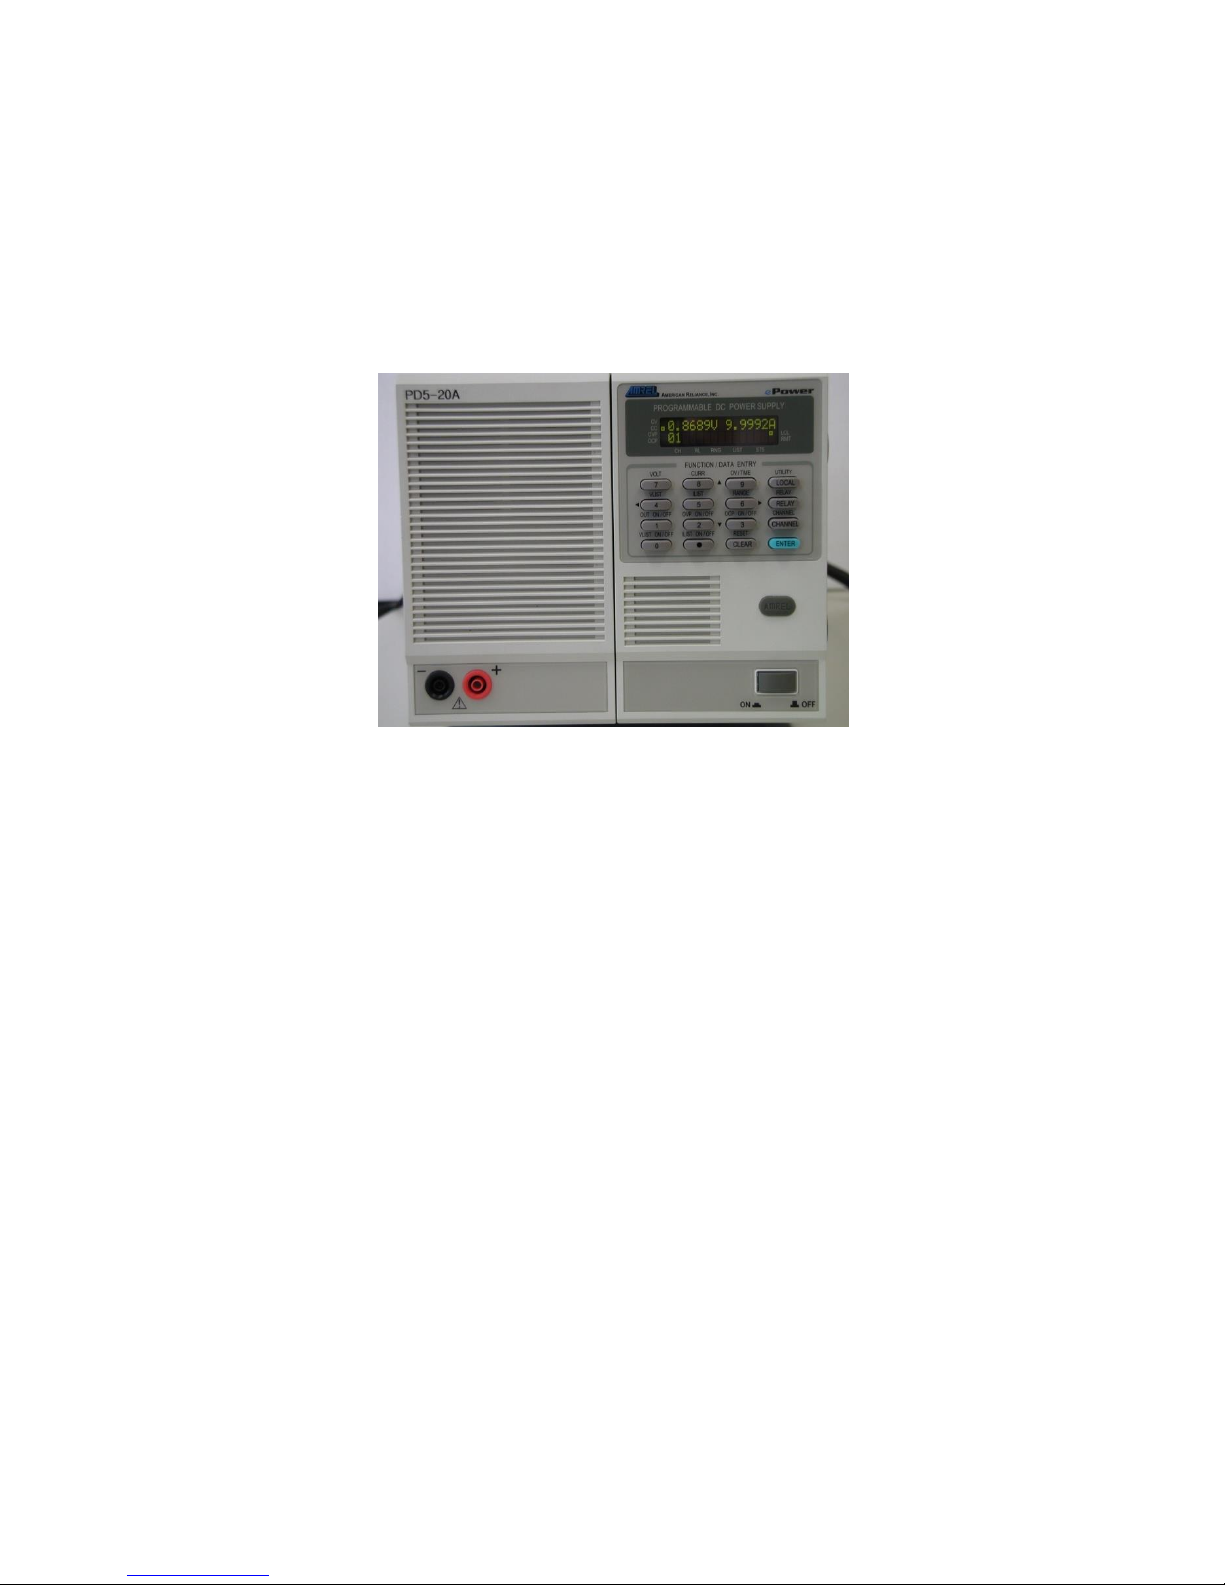
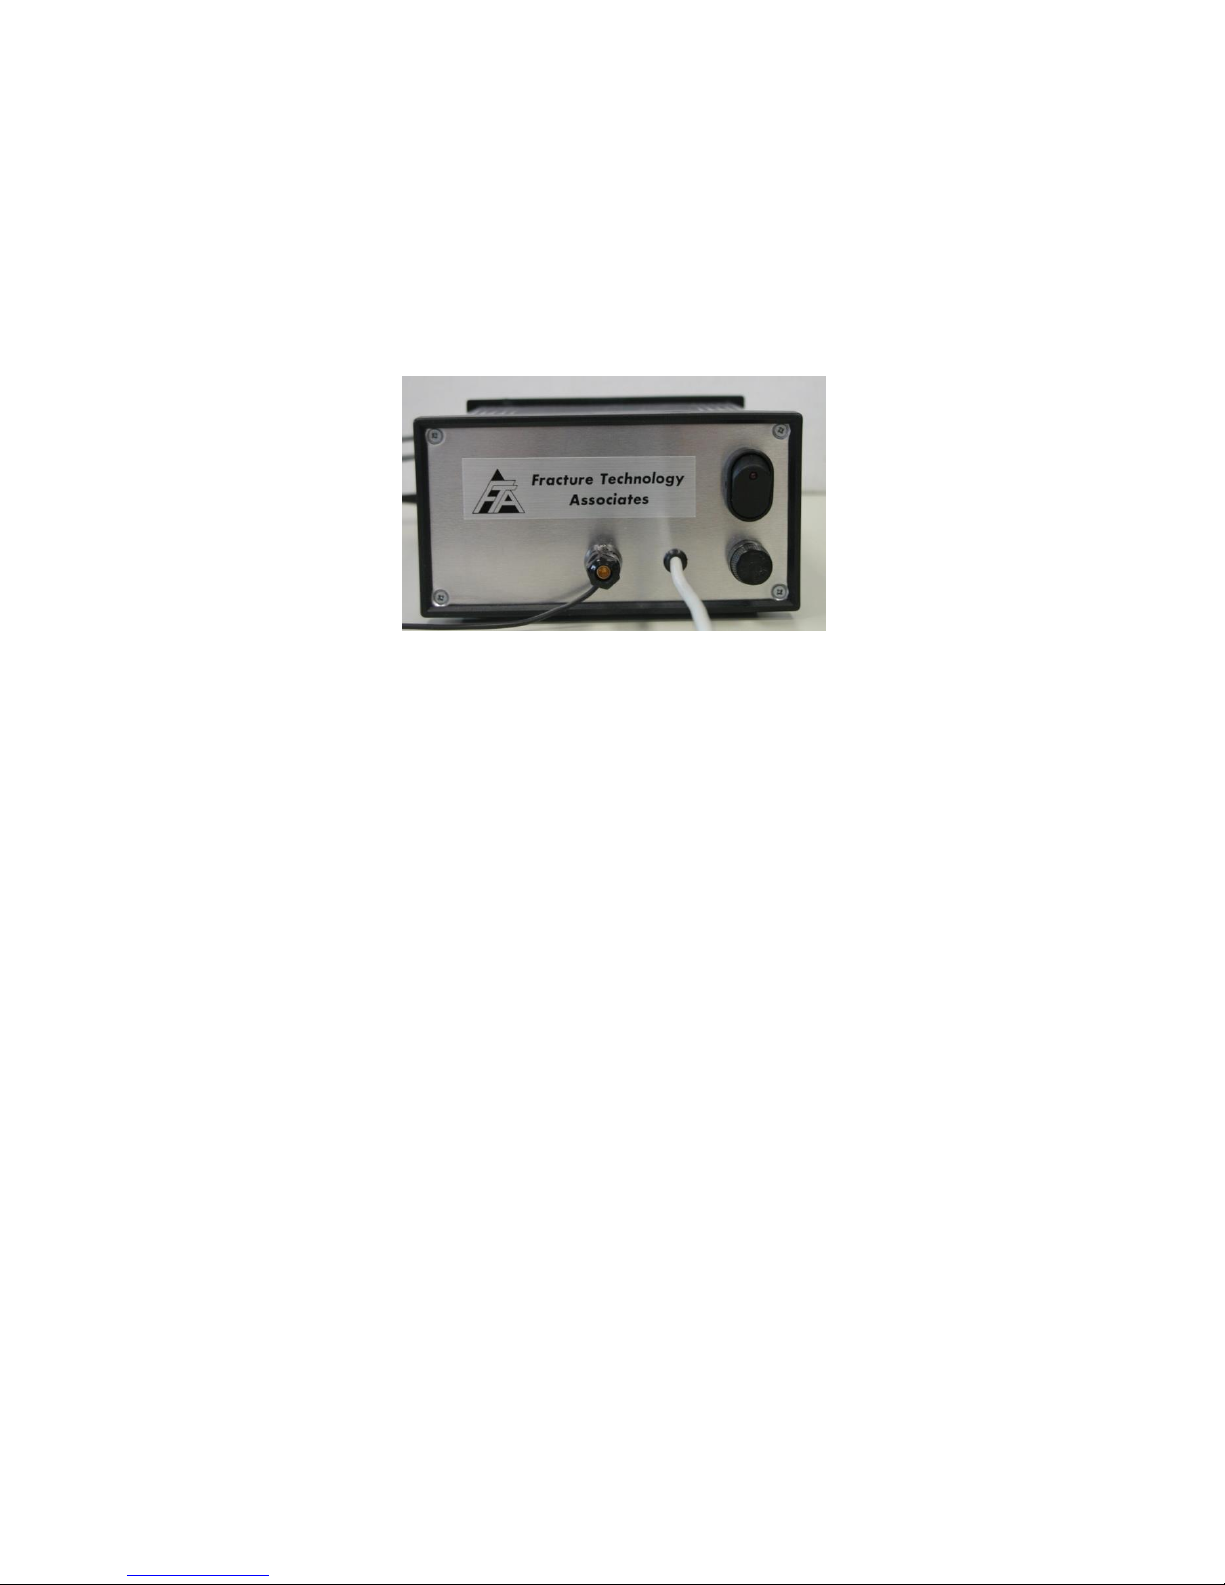
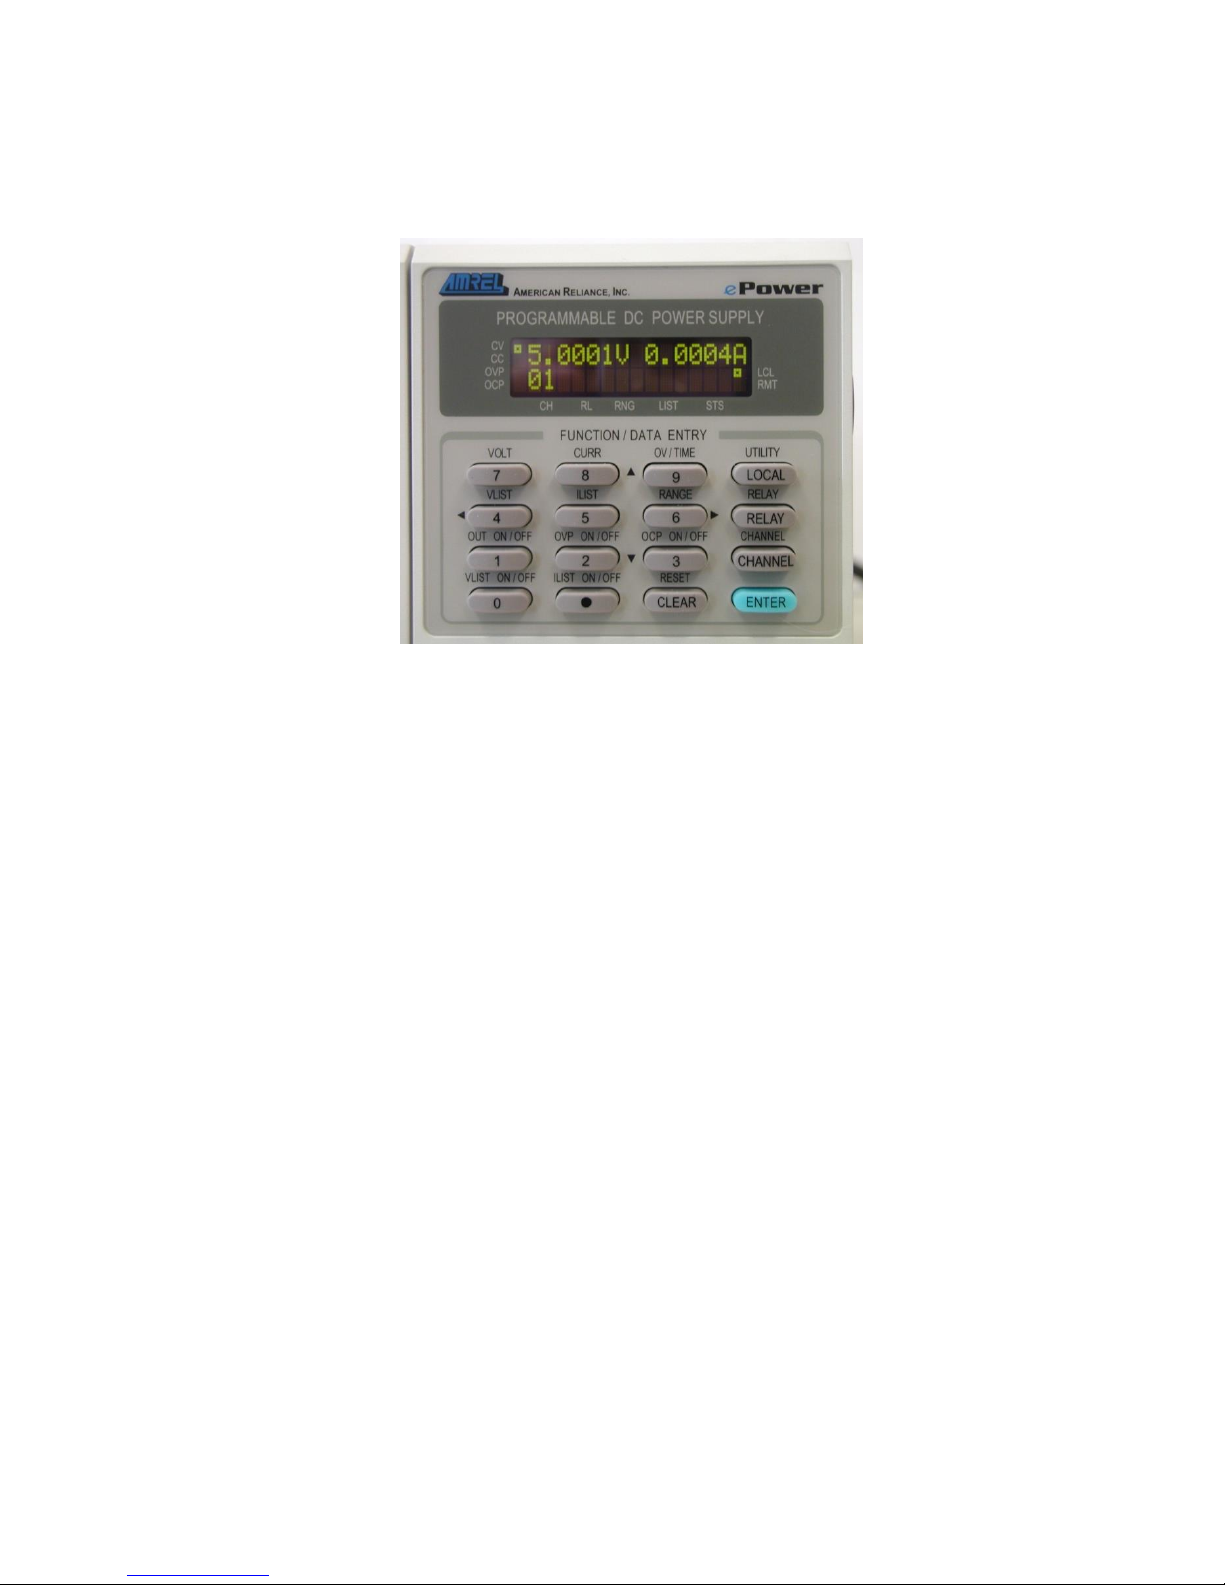
2.2 Connecting the FTA-DCPD Current Supply and Amplifier
The figure below shows the front panel of the power supply. Programming functions are
activated by the keypad (see the DCPD options described in the test procedure in
Section 3.2 of this manual for details). The voltage/current output on the lower left side
has been disabled.
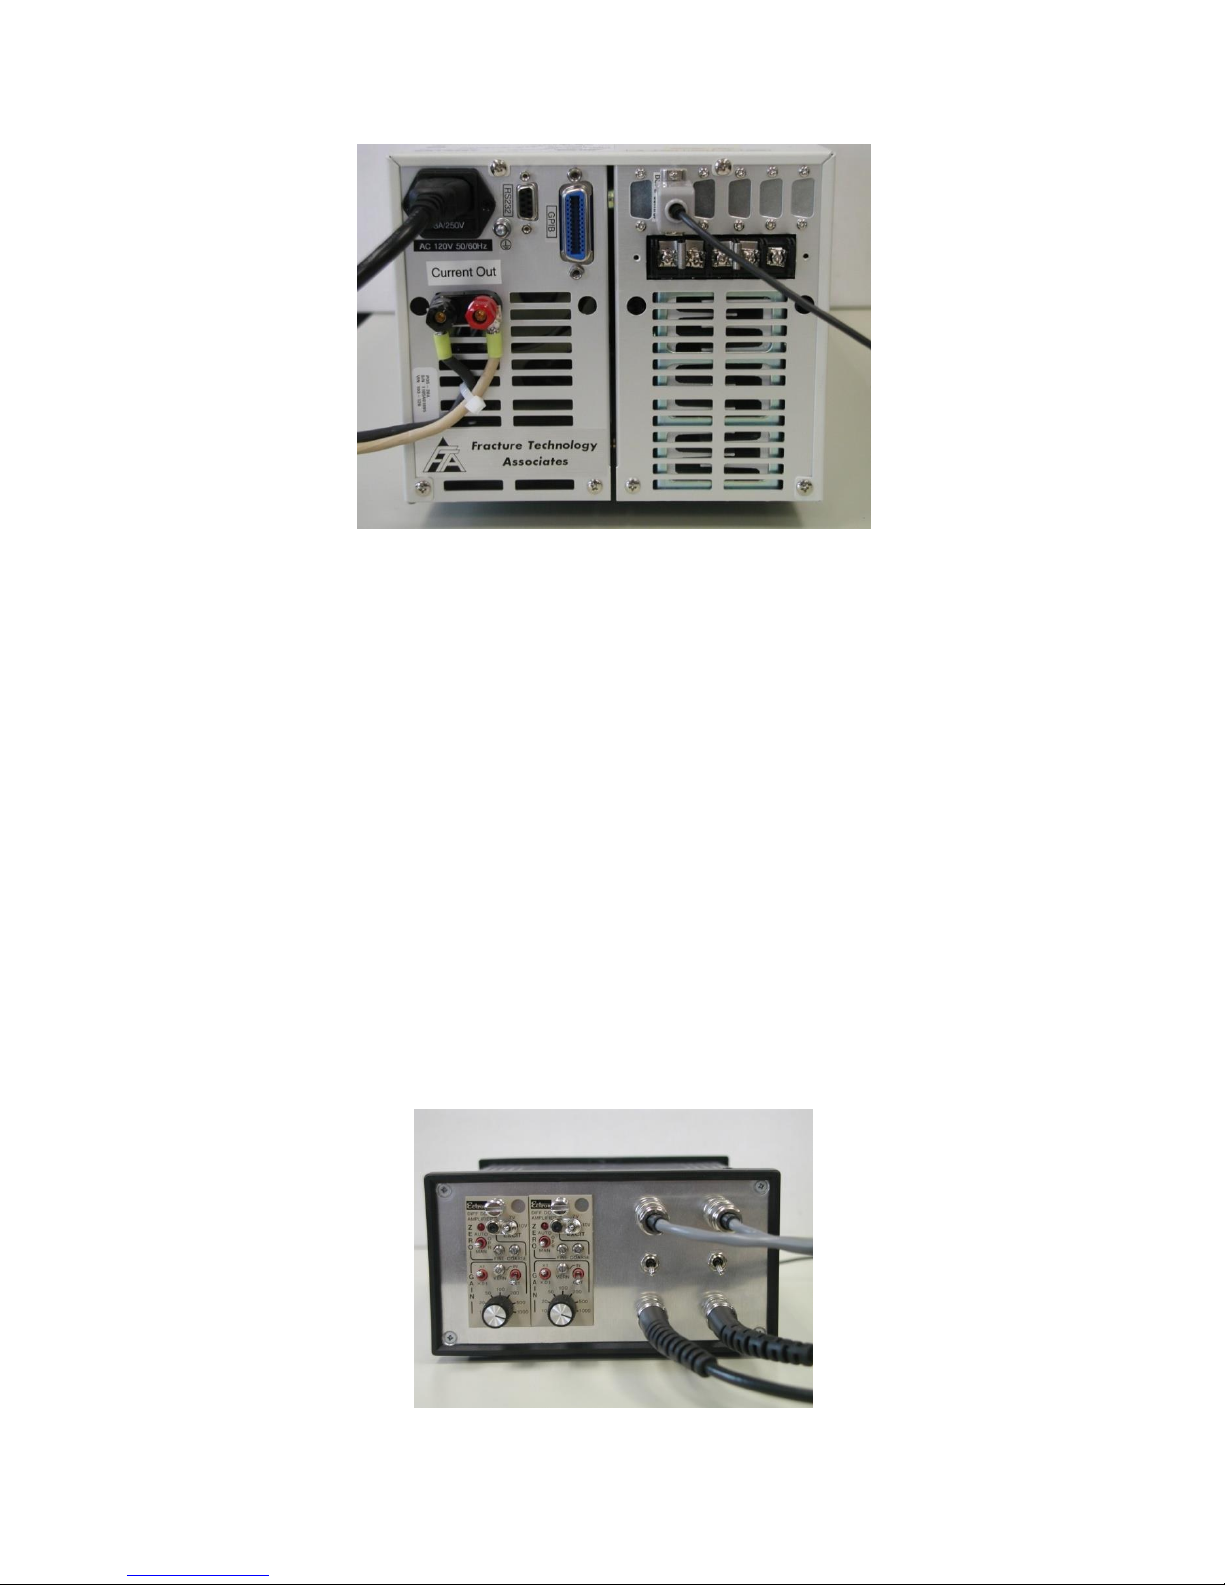
On the back of the unit, the current output is located on the left side beneath the 120
volt AC power cord. Use the FTA-provided current wire from the Current Out connector
to the test specimen or terminal strip. A cable-tie strain relief is recommended. On the
upper right side of the unit is a 9-pin connector labeled DCPD control, which is
connected to the nine-pin connector from the 25-pin CONN 2 connector on the cabling
to the ADwin-Gold. Note that pin 25 of CONN 2 goes to pin 1 of DCPD control; pin 1 of
CONN 2 goes to pin 3 of DCPD control, and pin 14 of CONN 2 goes to pin 2 of DCPD
control. Do not use the voltage/current outputs on the right side below the DCPD
control connector. Grounding of the unit is provided through the AC power cord.
However, an additional chassis ground terminal is provided next to the power cord and
use of that additional ground is recommended. FTA provides ground cabling in all
shipments.
Page 13 of 148
NLFT Testing - Series 2015 - V3+.16.01
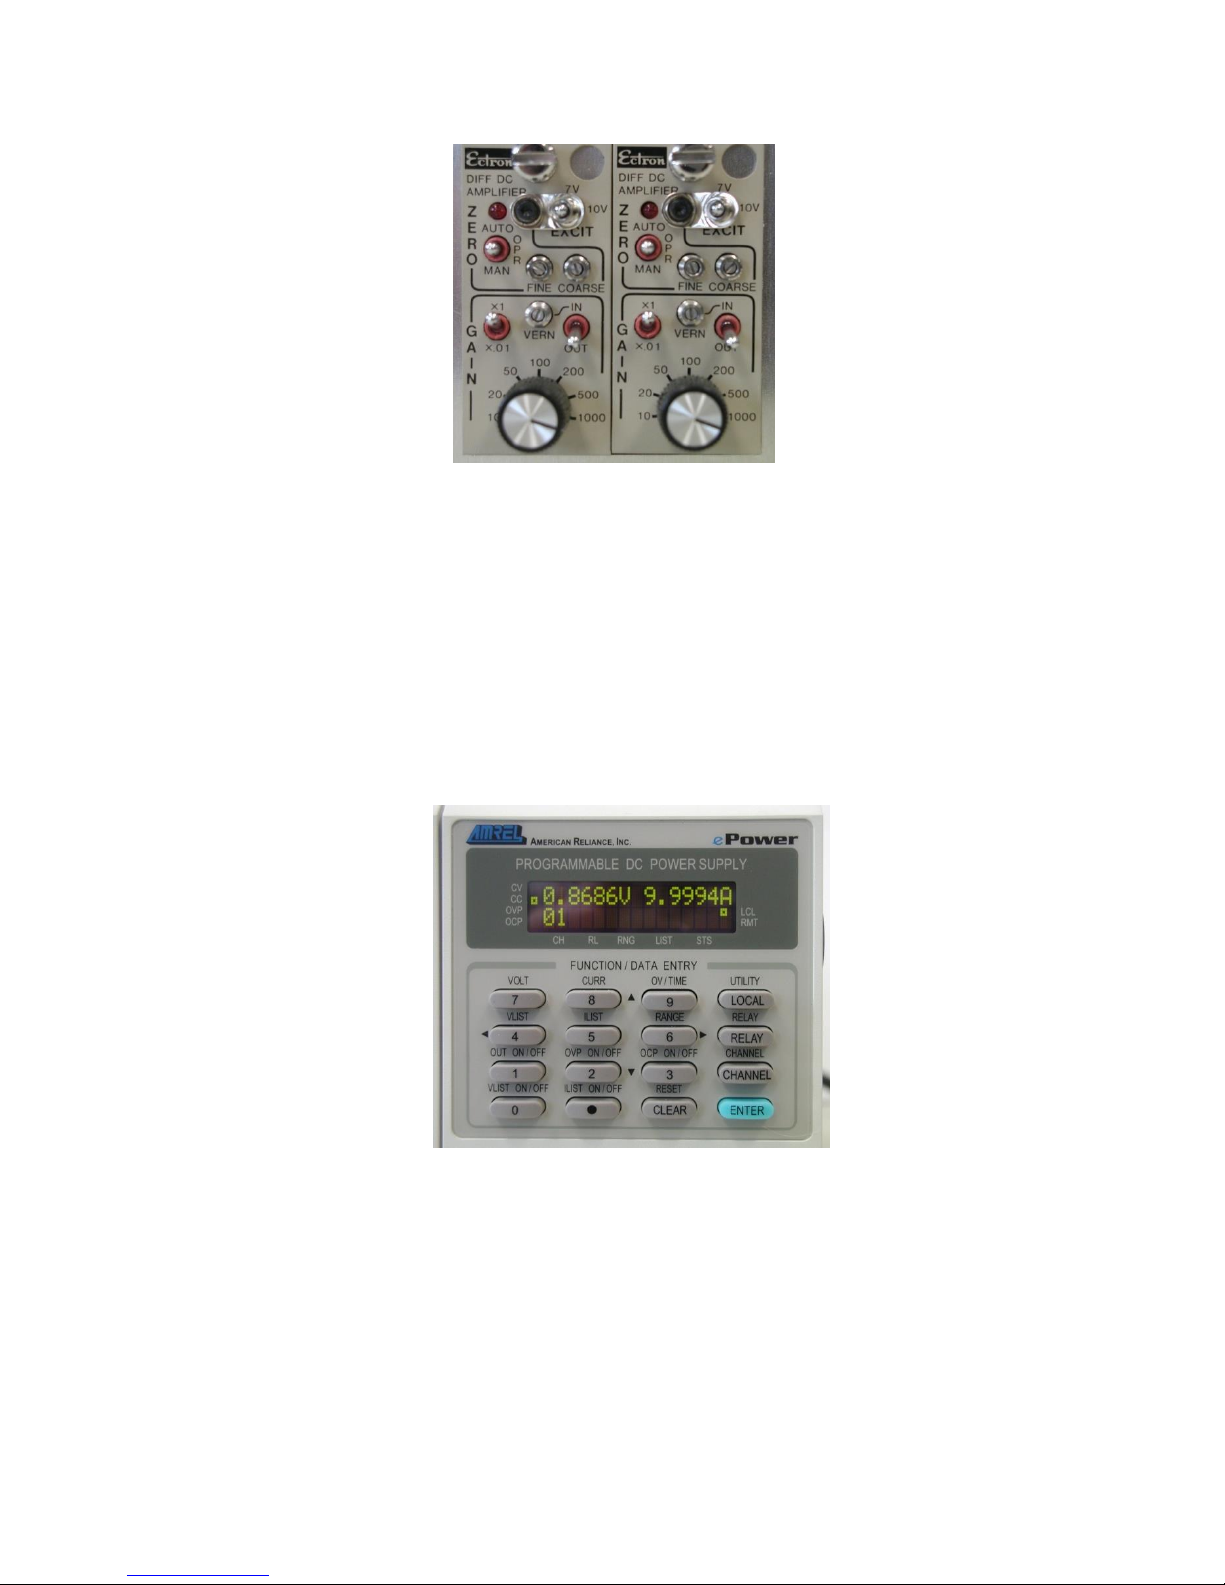
On the FTA DCPD amplifier, gain selection and auto zero are provided using the panel
controls on the Ectron modules. The two shielded Input connectors above the toggle
switches (left and right) connect to the active and reference probes. The active probe
senses the voltage drop across the crack while the reference probe senses the voltage
drop at a location not significantly affected by crack growth. The left-side Ectron module
is linked to the left-side connector and the right-hand module is linked to the right-side
connector. Active/reference assignment is at the discretion of the user.
The two BNC Output connectors below the toggle switches are the amplified and
conditioned voltage outputs for the active and reference probes respectively. They are
each paired with the shielded connector above. The channel designated ‘active’ by the
user connects with IN5 on the ADwin-Gold. The channel designated ‘reference’ by the
user connects with IN6 on the ADwin-Gold.
The toggle switch between the Input and BNC Output connectors is the Filter Switch
for each channel. Filter ‘out’ is the down position, filter ‘in’ is the up position.
Page 14 of 148
NLFT Testing - Series 2015 - V3+.16.01
On the back panel of the amplifer may be found the illuminated power switch; a fuse
holder with a 2-amp fuse; and a 12-volt DC power cord. A 120-volt AC to 12-volt DC
power supply is provided with the system.
To the left of the DC power cord is a ground terminal. The unit must be connected to
ground to function properly: FTA provides ground cabling in all shipments.
Note that the unit is ready for operation only after all the cables have been installed.
This includes attaching the potential drop and current wires to the specimen. In addition,
the FTA DCPD testing software must be open and all test parameters entered before
the system’s power is turned on. Activation of the FTA software sends a logic signal to
the DC power supply enabling the polarity switching relays to start in the forward
position. Detailed instructions for use of the FTA-DCPD system are included in the test
procedure provided in Section 3.2 of this manual.
2.3 PC Setup and Installation of the FTA Software
1. Deactivate the computer’s power saving modes, including standby and
hibernation. The settings of the Windows display should be high color, 800 by
600 pixels (small fonts) or 1024 by 768 (large fonts). The Theme/Appearance
should be set to Windows Classic, regardless of the computer’s OS.
2. From the FTA CD, execute the three setup files for Testing, Analysis, and
Testing Playback from their respective folders. It is recommended the software
be permitted to create the default directories of c:\Program Files\NLFT Testing
and c:\Program Files\NLFT Analysis.
3. Each program can now be launched from the Start Programs menu. To launch
the applications from the desktop, right click on their filename in the Start
Programs menu and Send them to the desktop (create shortcut). Icon files
FTAlogo3.bmp or FTAlogo4.bmp may be used for customization. These icons
can be found in the NLFT Testing folder in the Programs directory.
Page 15 of 148
NLFT Testing - Series 2015 - V3+.16.01
2.4 Installing the ADWin Drivers on the PC
Use the ADwin drivers contained on the FTA-provided CD rather than the gold-colored
CD provided with the ADwin. Version 3.20.1200 should be used for 32-bit systems with
Windows 98 through Windows XP; for Windows 7 use version 5.00.10.00. Users of
older Adwins with ISA-link-to-USB adaptors must use the ADwin driver version
3.00.2332. Adwin drivers for 64-bit systems can be provided by FTA or found on the
web at www.adwin-downloads.de.
Copy the entire ADwin folder onto the PC desktop and carry out installation from there.
Before installing the drivers, connect the ADwin (powered off) to the computer.
1. Run the installation program in the ADWin folder. From the ADWin splash
screen, execute the complete Driver and ADbasic setup.
2. V. 3.20.1200 users will be prompted to restart the computer at this point. Do not
do so. Return to the splash screen, choose Developer-Software setup, and
repeat installation. Exit the installation program.
3. Restart the computer with the ADwin powered off.
4. Power up the ADwin. When prompted by the ‘new hardware wizard’, choose to
find the drivers from a specific location. Go the ADwin folder on the desktop and
choose to search. Ignore warnings about Windows logo testing and finish the
installation.
5. The installation window will reappear when this first stage of installation is
complete. Click ‘next’, choose not to search the internet, and continue with all
defaults.
6. Next, go to Start\Programs\ADwin\ADconfig. For v. 3.20.1200, remove the two
default ‘Link’ type connections. Add USB from the drop-down menu and click OK
to exit the form.
Page 16 of 148
NLFT Testing - Series 2015 - V3+.16.01
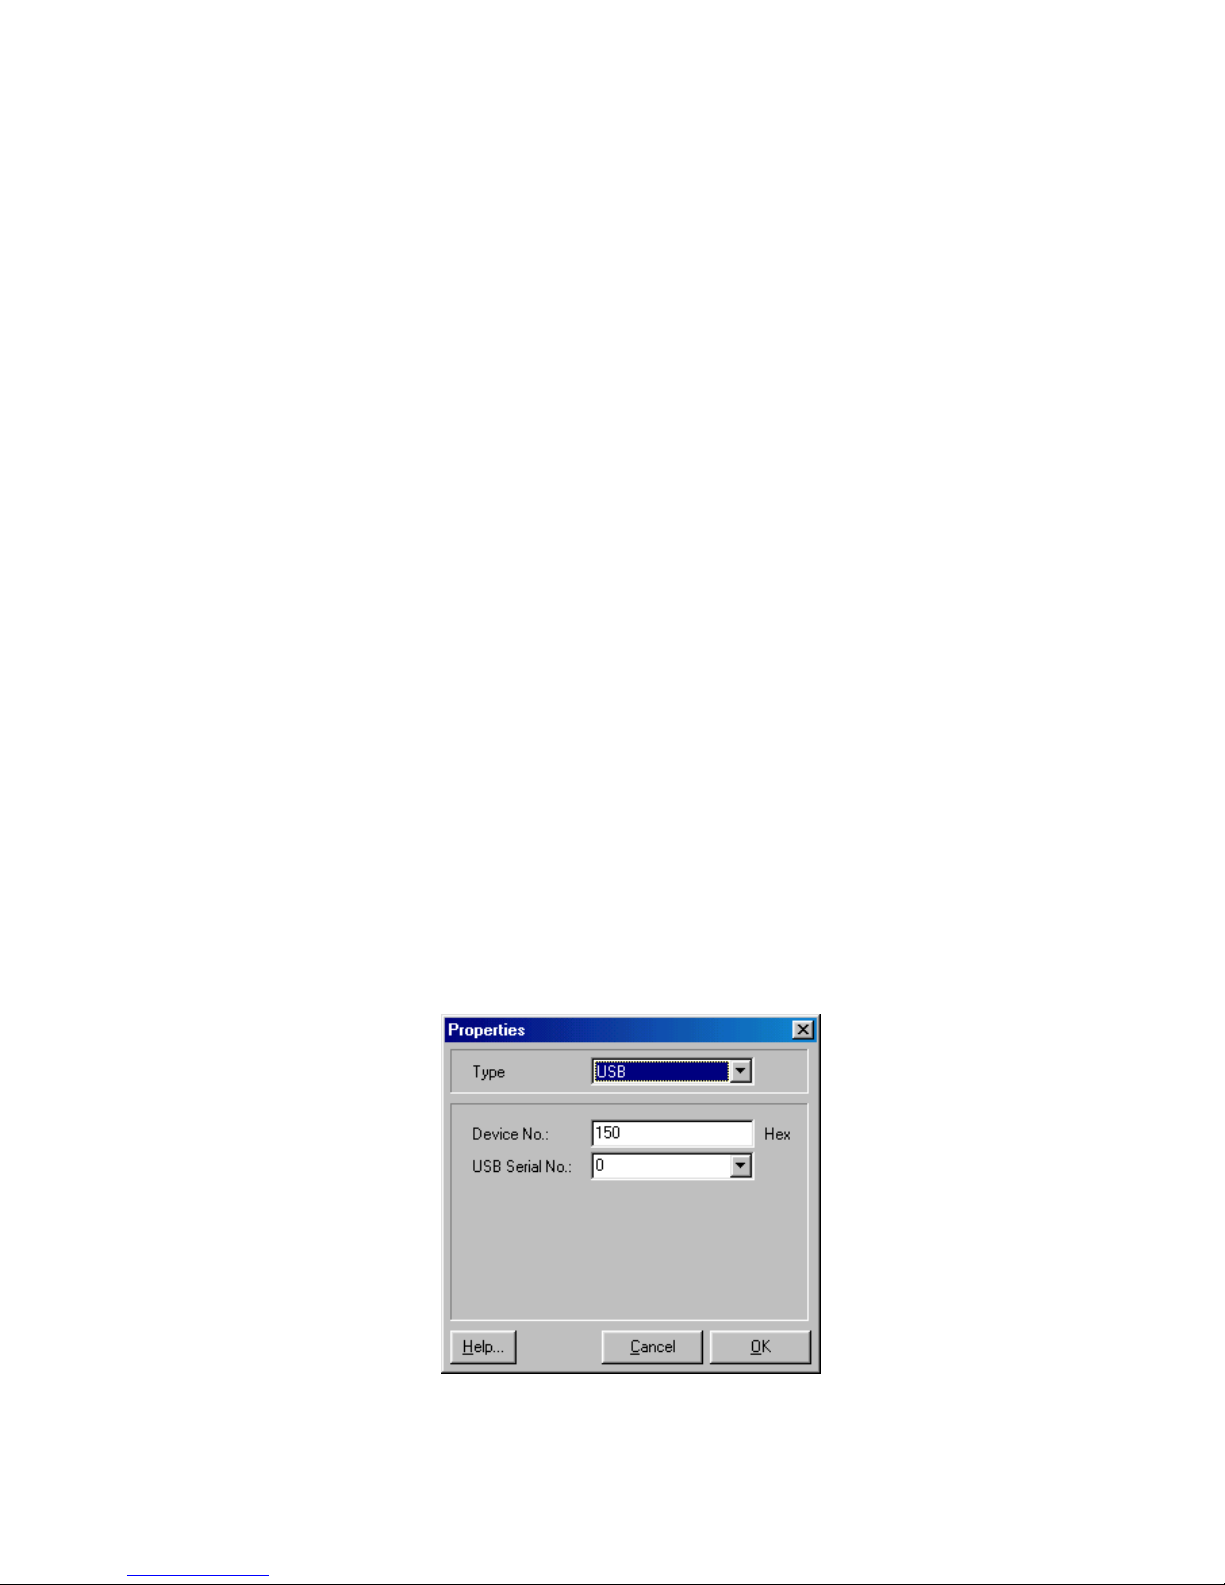
For v. 5.00.10.00, on the ADconfig screen choose ‘Add USB’ from the menu
across the top. Choose Device #150 [hex] and USB Serial #0.
7. Double click on the Adbasic icon on the computer desktop. Leave the license key
blank and click ‘OK’ twice to open the ADbasic program. For v. 3.20.1200, go
straight to step 8. For v. 5.00.10.00, go to the ‘options’ tab at the top of the
window and choose ‘compiler’. Make sure ‘System’ = ADwin Gold; ‘Processor’ =
T9; and ‘Device No.’ = 150 Hex. Close the window.
8. Press the red ‘B’ button on the Adbasic screen to boot the ADWin.
9. A flashing green LED on the ADwin-Gold unit means a successful connection
has been established. Unless the hardware is changed, booting the system from
this point forward will be done automatically when the FTA testing software is
opened.
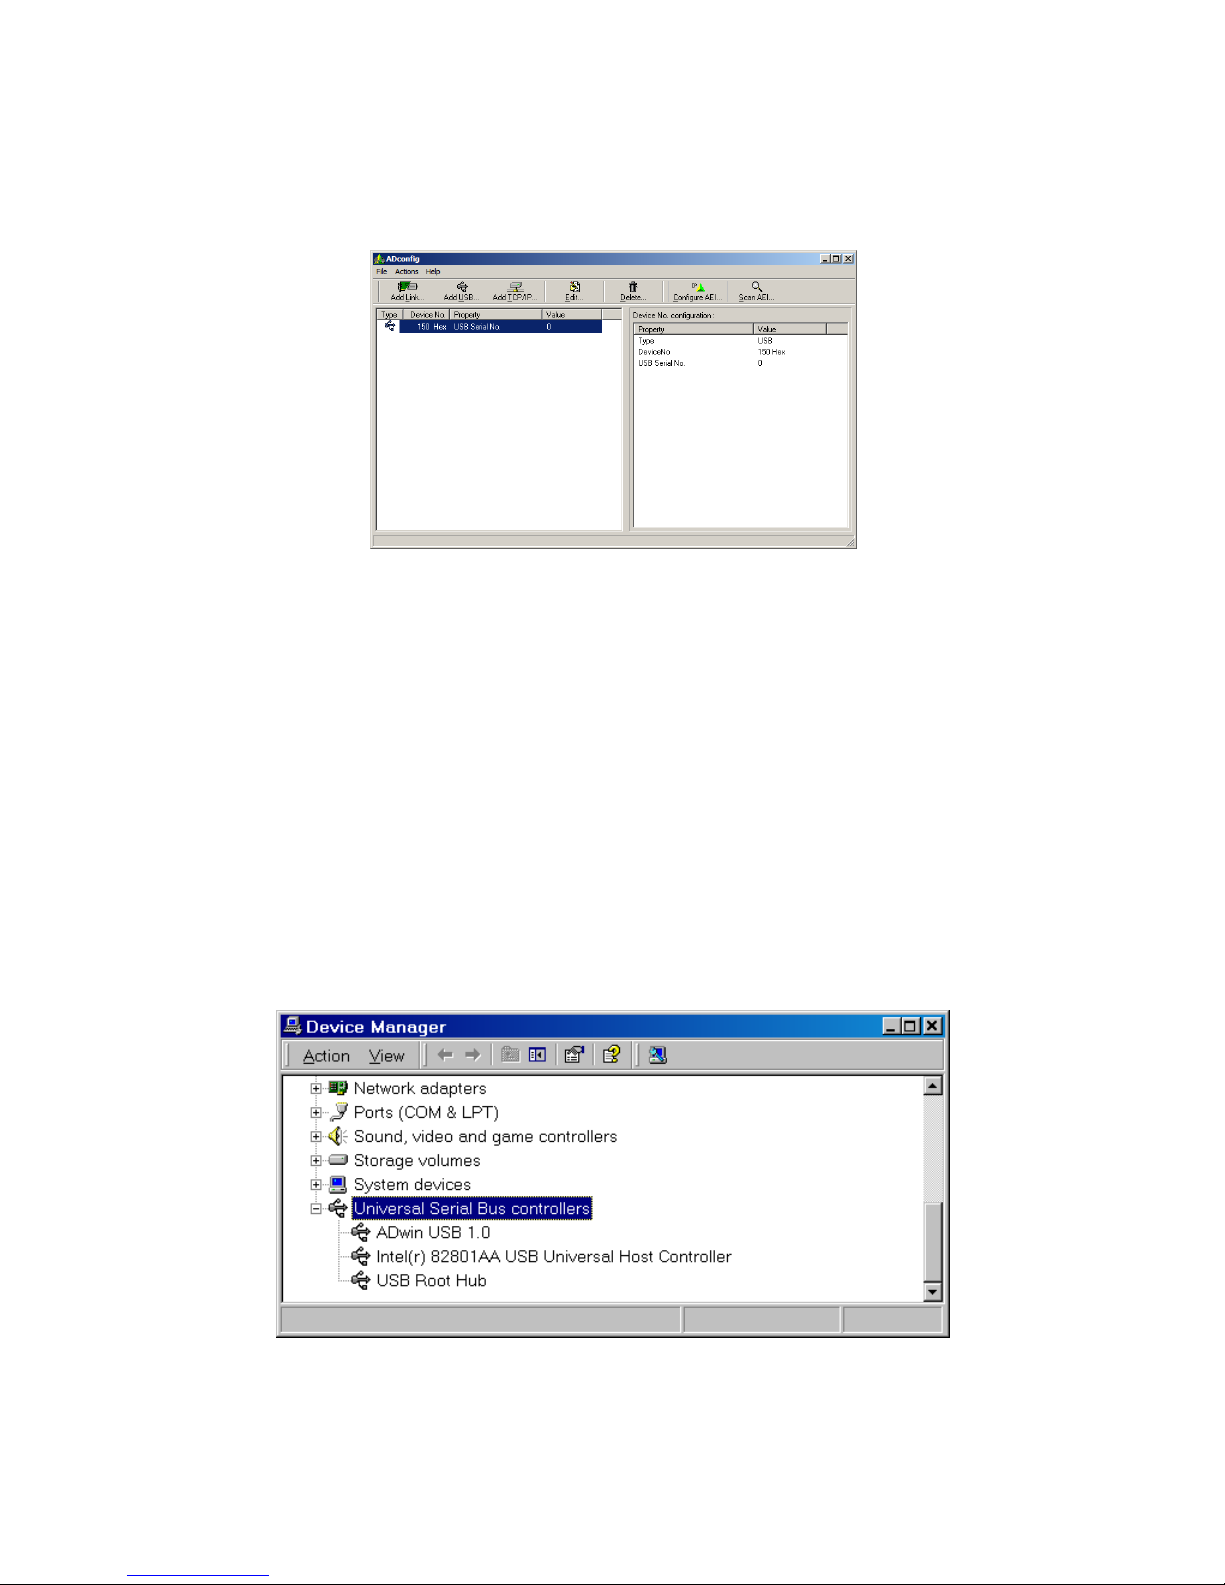
10. The final installation may be confirmed by viewing the following form in the
Windows’ Device Manager.
Page 17 of 148
NLFT Testing - Series 2015 - V3+.16.01
2.5 Testing in Simulation
Note that it is possible to disconnect the ADwin from the test machine and operate the
NLFT program in simulation mode. Thus, users may familiarize themselves with the
FTA software and evaluate operation of the system without endangering the test
machine or expensive specimens. See Section 3.2 of this manual for sample test
procedures.
To simulate a compliance test, use BNC cables to jumper the ADwin’s OUT 1 to IN 1
and IN 2. To simulate a DCPD test, jumper OUT 1 to IN 1 and connect PIN 1 of
connector 2 to both of the center posts only of [PD active] IN 5 and [PD reference] IN 6.
Run the program as normal: new users may benefit from experimenting with the sample
test procedures provided in Section 3.2 of this manual.
2.6 Tuning
Make sure the machine controller is in displacement (actuator) control. Tune the system
as you normally would for a displacement controlled test. Since loading is static, some
dither might be required.
Page 18 of 148
NLFT Testing - Series 2015 - V3+.16.01

3.0 Using the NLFT Testing Software
The following section of this manual opens with a discussion of the six file-types
associated with the testing program. Section 3.2 contains an illustrative test procedures,
which detail the use of both the compliance and DCPD testing software. Analysis of test
results is covered in sections 5 through 8.
3.1 Understanding Testing Files
It is important to note that six different types of file are associated with the testing
program, each with its own extension. Some of these files are created automatically
during testing, while others must be configured and saved by the user. Several are
required by the FTA analysis software. Procedures for using these files are detailed
throughout this manual, but a summary of the different files is given briefly, for
information, below.
Test Parameter file (.pr5 extension): key information unique and necessary to
the test, such as specimen dimensions and initial test conditions. Although the
information is required, the files themselves are optional, and may be loaded,
modified and saved by the user for ease of use.
General Information file (.gn2 extension): general information not required for
testing, but that may be common across tests (such as test temperature or
material description). These optional files may be loaded, modified and saved by
the user. General information may also be added at analysis time.
Log file (.log extension): details of the test including test parameters and data
that are part of the analysis file (.in5). A log file is appended, rather than
overwritten, every time it is saved. See Appendix B1 for a description of log files.
Analysis file (.in5 extension): data required for the Windows Visual BASIC
analysis software. See Appendix B2.
Unloading Data file (.unl extension): calibration factors and the voltages of the
load-displacement unloading slopes. See Appendix B3.
Raw Data file (.raw extension): load-displacement information including elapse
time; load; displacement; and auxiliary channel information recorded in
engineering units. See Appendix B4.
Page 19 of 148
NLFT Testing - Series 2015 - V3+.16.01

3.2 Running a Test Using the FTA NLFT Software
The following is a general outline illustrating use of the FTA software to conduct a nonlinear fracture toughness test (E1820) at room temperature, using both a clip gage and
DC potential drop. These steps are meant as guidelines only in order to demonstrate
use of the FTA testing software. For detailed descriptions of the menus and forms
referred to below, see Section 4 of this manual. For an analysis procedure, see Section
5.3.
Note that when data are entered in a text box on a program menu, the data are not
transferred to the corresponding variable until another text box or command button
(such as Send to DSP) is clicked. If data have been entered in a text box but Send to
DSP has not been clicked, a blinking red reminder message will appear.
The following step-by step guide to test execution applies both to compliance and
DCPD testing. Where the process differs, directions for compliance testing appear in
blue and directions for DCPD testing appear in red. These steps are a guideline only: a
thorough knowledge of governing ASTM standards is essential.
3.2.1 SETUP
1. Turn on power to the ADwin.
2. Power to the FTA-DCPD amplifer and power supplies should be on, but the
power supply’s Output (number 1 on keypad) should be toggled to Off (the
front LED panel on the power supply should display ‘Output Off’). The unit will
start with a default voltage of 5 volts, which is recommended for most
applications. The default current is 1 amp. With Output set to off, the current
may be changed using the keypad. To input a current of 10 amps, for example,
press CURR (number 8 on the keypad) to bring up a new menu. Press the
numbers 1 and 0. Press the blue ENTER key to confirm the new setting.
3. On the FTA-DCPD amplifer, set the desired gain with the black dial on the
appropriate Ectron module (left module for left channel, right module for right
channel). Remember that the actual gain is 10 times that displayed on the
module. Also ensure that the amplifier’s VERN toggle switch is in the OUT
position and the left-hand toggle switch is in the X1 position. Note that the
toggle switch for the excitation has been locked in the 5 volt position. Do not
tamper with this lockout.
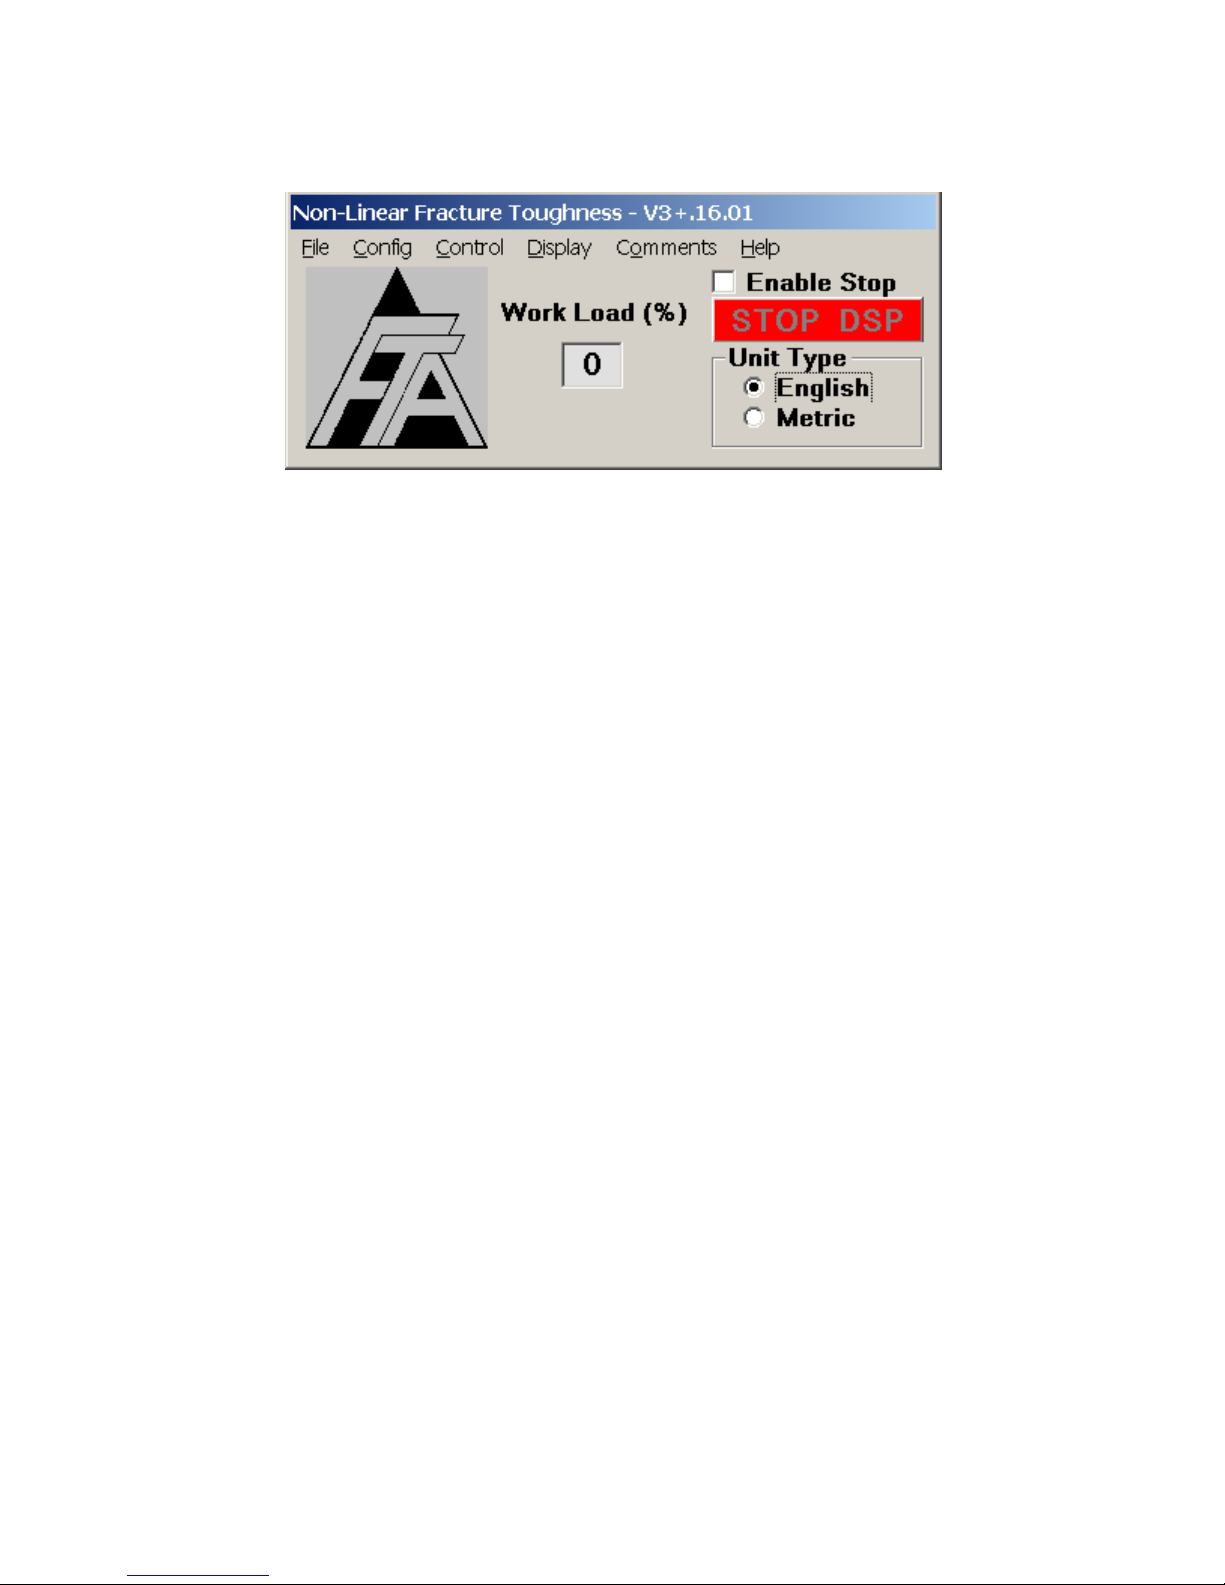
4. Open the NLFT testing program. If the program is already open from a previous
test, skip straight to step 7 of this procedure. Ensure the green light on the
Adwin is blinking, which indicates communication with the computer. Reboot
the Adwin to establish communication, if necessary. On the initial Splash
Screen, choose the crack monitor type: Compliance (for clip gage
Page 20 of 148
NLFT Testing - Series 2015 - V3+.16.01

measurement of crack length and J) or DC Potential Drop (for DCPD
measurement of crack length and clip gage measurement of J).
5. Select New Test (select Resume only if restarting a test, for example, after a
system crash).
6. The Main Menu appears: select Unit Type (English or Metric).
7. From the Input menu, select Data from the dropdown list. The Data Input form
appears, with the Initialize tab foremost. Note that the form has six tabs, which
are typically addressed from left to right.
If the program is already open from a previous test, ensure
FNG OUT on the Status screen reads zero. Ensure STOP
is active on the Ramp Generator and that the three boxes
under Data Acquisition Status are unticked. On the
Initialize tab of the Data Input form, Initialize the new test
by ticking Set Delta a to Zero and Clear Data Storage
Buffer. Press Send to DSP to clear the Adwin of data from
the previous test.
8. Select the Initialize tab of the Data Input form and enter the Test ID.
9. Press Start Data Files: this enables you to save .log files; .unl files (compliance
only); and .raw files as well as specify their data storage path.
10. Press Load Test Parameters (.pr2 files for common specimen geometries may
be found in the NLFT testing program directory).
11. Ensure the K-Calibration Type and PD Calibration Type are appropriate for
the application.
12. The Send to DSP button will blink when changes are made, reminding you to
send the changes to the ADwin by pressing Send to DSP. As an option, press
Print to Log to send data input to the .log file.
13. Address the remaining five tabs on the Data Input form (details may be found
in Section 4 of this manual). Go first to the Coefficients tab and confirm correct
values.
14. Go to the Dimensions tab. Ensure values are correct and change as
necessary. The program will automatically calculate limit load based upon the
values entered. The limit load is based on the plastic limit derived from the
specimen’s yield strength and geometry and is useful for determining the
maximum load range for the test.
15. Address the Calibration tab. Review and adjust values as required. It is
important to note that values in red must correspond to settings on the
controller and PD instrumentation. A full scale of 10 volts is assumed for all
controller settings and entry must be 10% of full-scale range. For a load range
Page 21 of 148
NLFT Testing - Series 2015 - V3+.16.01

of 25,000 lbs, for example, the entry in the Load Cell Calibration text box
should be 2500. PD gain (if running a DCPD test) should be the same as the
gain set on the FTA amplifier x10 (a gain of 500 on the amplifier should be
entered as 5000 on the Calibration tab). Initial PD should be set to zero.
16. Select the Data Acquisition tab, on which criteria for and characteristics of
automatic unloading slopes or DCPD crack length measurements are
determined. For example, if Load under Unloading Slope/DCPD Acquisition
Interval is set to 500 pounds, then that action will be taken every time the load
increases by 500 pounds. Please see Section 4.4.1.5 for more details on the
Data Acquisition tab.
17. Go to the Limits tab. The parameters on this tab specify the limits (Transducer
Limits, Load Drop Limit) at which the command signal will go to STOP or the
test will be terminated (Delta a Limit).
Load Limit Hold determines the initial ramp-up load level (which in most
cases should not exceed the Pmax of the precrack), at which point the
system can be tested for signal quality and correct crack-length reading
before the start of the test proper.
Ramp Down Amount specifies how much the load will ramp down upon
test termination (before going into Hold mode).
Automatic Preload is a useful alternative to the controller setpoint and
applies a [typically low] constant load to the specimen when, for
example, it is coming to test temperature or being held steady for other
purposes before testing commences.
18. Press Send to DSP to send all changes on the Data Input form to the ADwin.
Print to Log.
19. Return to the Initialize tab and press Save Test Parameters. This updates the
.pr2 file for future use.
20. Minimize the Data Input form, but do not close it.
21. Return to the Main Menu and select the Options form from the Input
dropdown list. The default settings are appropriate for most applications. Apply
Rotation Correction to Delta a should always be ticked when compliancetesting a C(T) specimen. For bend-bar testing, Normal Load Cell Polarity and
Normal Stroke Polarity should be unticked. See Section 4.4.2.2 for more
details on the Options menu.
22. Press Send to DSP regardless of whether any changes have been made.
Minimize but do not close the Options menu.
23. Return to the Main Menu and select General Information from the Input
dropdown list. Load a previously-saved .gn2 file or input new values and save
the file for future use. Information about both the test and precracking regime
Page 22 of 148
NLFT Testing - Series 2015 - V3+.16.01

can be recorded. Note that some precracking parameters are necessary for
fulfilling validity requirements during analysis. The General Information form
may be closed before proceeding.
24. Return to the Main Menu and open the Ramp Generator from the Control
drop-down list. The Ramp Generator is the form from which the test is
controlled and must not be closed while the test is running. Changes on this
form are sent immediately to the ADwin.
25. On the Ramp Generator, verify the Ramp and Data Acquisition Rates and
change as appropriate (see details in Section 4.5). These rates may also be
changed on-the-fly while the test is running, if necessary. Ensure once again
that none of the check-boxes is selected and that the program is in STOP
mode. Minimize but do not close the Ramp Generator.
26. Return to the Main Menu and open the Status; Load-displacement; and J-da
(J-delta a) forms from the Display drop-down list.
27. Observe the Status display. Verify that the load and displacement channels are
active and reading correctly. FNG Out should read zero. Load should also
indicate zero.
28a. COMPLIANCE ONLY. Set the test controller to stroke control. Turn on the test
machine hydraulics. Enable the external command for full-scale input. Mount
the specimen in the test machine. Attach the clip gage and use the controller to
adjust the signal to read zero (Disp 1 on the FTA testing software’s Status
display). If more than 10v will be required for the test, adjust the signal for a
negative voltage.
28b. DCPD ONLY. Set the test controller to stroke control. Turn on the test machine
hydraulics. Enable the external command for full-scale input. Mount the
specimen in the test machine. Attach the clip gage and use the controller to
adjust the signal to read zero (Disp 1 on the FTA testing software’s Status
display). If more than 10v will be required for the test, adjust the signal for a
negative voltage.
Attach current and potential drop leads to the specimen.
With the FTA-DCPD power supply Output still Off, zero the volts on the Status
screen by toggling up the ‘auto/man zero’ switch at the top left of the amplifier’s
Ectron module. When the red light has activated, return the switch to its central
position. Voltage should now read zero on the NLFT testing software’s Status
screen (DCPD volts).
Page 23 of 148
NLFT Testing - Series 2015 - V3+.16.01
Activate the current output, (OUT ON/OFF or keypad number 1 on the power
supply). If the FTA software is running and the sample installed correctly, the
LED display should appear similar to the figure below, in which a 10 amp
current has been selected. In this figure, the voltage of 0.8686 volts is due
almost entirely to the voltage drop through the 10-12 AWG wire from the DC
power supply to the test sample. Constant current is assured as long as the
display voltage is less than the default setting of 5 volts. Note that in addition to
displaying the designated current of ~10 amps, the left side of the display
shows a square symbol next to the letters ‘CC’, indicating the constant current
mode.
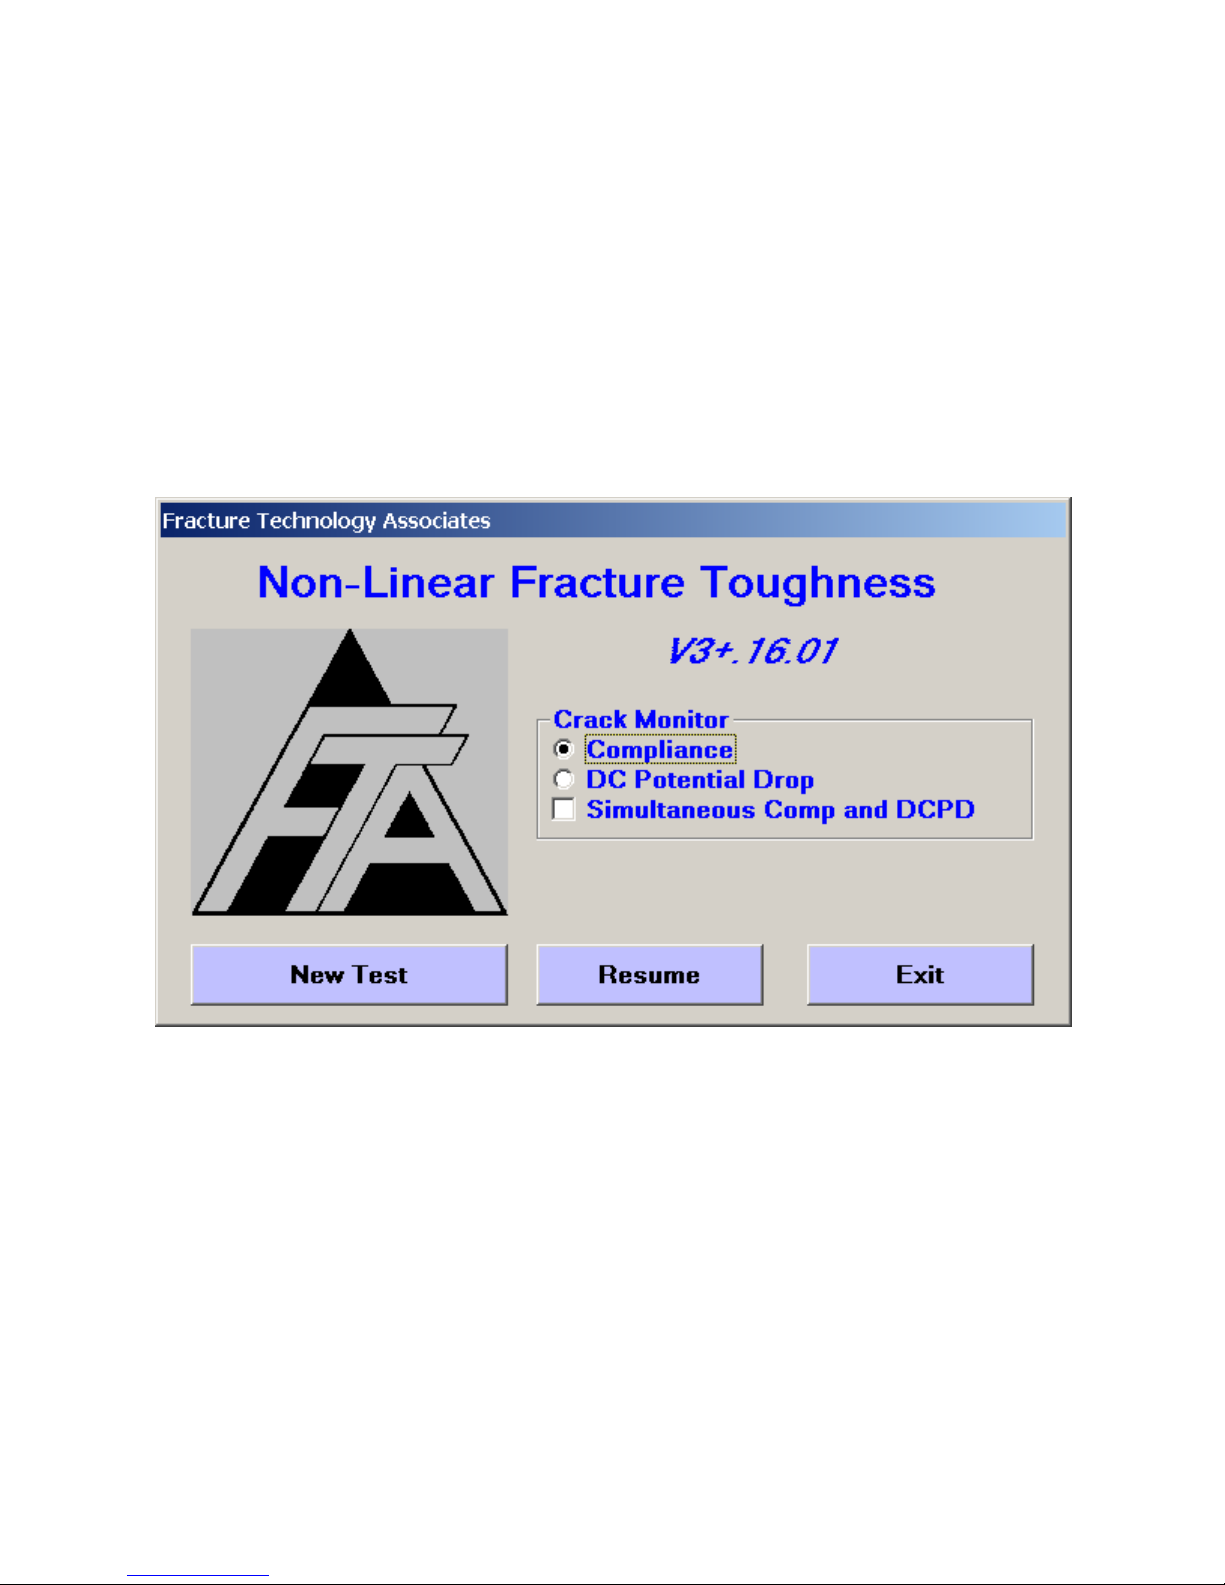
The figure below shows the power supply display if the current wires are not
hooked up to the specimen or the FTA software is not running. Note that the left
side of the display shows a square symbol next to the letters ‘CV’, indicating the
constant voltage mode. If the system cannot maintain constant current due to
the resistance of the current loop then it defaults to the constant voltage mode.
The constant voltage mode with a current value lower than desired is most
likely due to insufficient wire size in the current path. A current value near zero
Page 24 of 148
NLFT Testing - Series 2015 - V3+.16.01
indicates an open current path or a low logic signal state on pins 2 and 3 of the
DCPD control connector.
Using the black knob on the amplifier’s Ectron module(s), adjust the gain
setting such that the amplified signal displayed on the NLFT testing software’s
Status screen is between 0.5 and 1.0 volts. Be sure to enter the final gain
setting in the FTA software on the Calibration tab, remembering to multiply the
selected amplifier gain by 10. (Note that the proper gain setting is also a
function of the applied current and must take into account the actual PD
calibration and range of crack size. It is important not to reach the ±10 volt
amplifier output limit during a crack growth rate experiment). For gains above
10,000, select the VERN IN position of the toggle switch. The vernier
adjustment can be used to increase the gain to ~25,000.
3.2.2 RUNNING THE TEST
1. Press Reset MAX on the Status form to reset the FNG Out and Load on the
Status display.
2. Return to the Ramp Generator and Clear Message if necessary.
3. Press Run on the Ramp Generator to activate the command signal.
4. Press Load Limit Hold to ensure that loading will stop when the load limit (set
on the Limits tab of the Data Input form) is reached.
5. Press Load-Displacement to begin data acquisition and ensure real-time
plotting of load on the Load-Displacement Display.
6. Press Ramp Up to begin loading the specimen to the load limit hold level.
Page 25 of 148
NLFT Testing - Series 2015 - V3+.16.01

7. Observe the Load-displacement display and Status screen (Load) to ensure
loading stops at the load limit hold. The HOLD indicator on the Ramp
Generator will flash when the load limit has been reached. The Loaddisplacement display may be scaled using the blue buttons.
8a. COMPLIANCE ONLY. Return to the Ramp Generator. Press the blue Unload
Slope button once to apply an unload slope to the specimen (the
characteristics of the unload slope were determined on the Data Acquisition
tab of the Data Input menu). Observe the green trace on the Load-
displacement display to verify correct operation:
the correlation coefficient should 0.9999 or better
the crack length should be accurate
Repeat unloading slopes as necessary to ensure repeatability of crack length
and quality of signal. Scale the unloading slopes as necessary (using the pink
buttons). Press Refresh to bring up the full display. Delta a should be within ±
0.001 inches and there should be no change in Ci/Co greater than 0.003. When
the system is stable, tick Set Delta a to Zero on the Initialize tab of the Data
Input form. Send to DSP.
Activate Unloading Slope on the Ramp Generator (Data Acquisition Status)
and apply one more unload slope to the specimen. This will be the first active
data point in the .in5 file.
8b. DCPD ONLY. Return to the Ramp Generator. Press the blue DCPD Acqu.
button once to take a DCPD reading (the characteristics of the acquisition were
determined on the Data Acquisition tab of the Data Input menu). Observe the
green trace on the Load-displacement display to verify correct operation.
Press DCPD Acqu. several more times. Observe the DCPD Active Voltage on
the Load-Displacement Display form. Readings should be consistent within
0.1%. Compute the mean of the final three readings and enter the value as
Initial PD on the Calibration tab of the Data Input form. Send to DSP.
Activate another DCPD acquisition cycle. The Load-Displacement Display
should now indicate the correct crack length. Apply at least two more cycles
and observe changes in crack length. Verify that the variation in delta a is
consistently within ±0.001 inches.
Page 26 of 148
NLFT Testing - Series 2015 - V3+.16.01

Activate DCPD Data on the Ramp Generator (Data Acquisition Status) and
press DCPD Acqu. once more. This will be the first active data point in the .in5
file.
9. When the quality of the signal and repeatability of crack length readings is
satisfactory, it is time to start the test. On the Ramp Generator disable Load
Limit Hold. Enable Auto Unloading [compliance] [or] Enable Auto DCPD Acq.
[DCPD] and press Clear Message.
10. Press Ramp Up to start the test. Unload slopes/DCPD acquisition cycles will
occur at the intervals and durations set on the Data Acquisition tab of the
Data Input form. View the Load-Displacement trace to verify correct
operation.
11. Observe the J-da (J-delta) display from the Display and adjust the scale as
required.
12. When the final test limit has been achieved (typically the Delta a Limit
specified on the Limits tab of the Data Input form), the test is complete. The
machine will automatically ramp down to the load specified under Ramp Down
Amount on the Limits tab. When this load is reached, the test will HOLD.
13. On the Ramp Generator, disable Unloading Slope and Auto Unloading/DCPD
data and Auto DCPD Acqu. On the Limits tab of the Data Input form, disable
Displacement 1 Limit and Send to DSP.
14. Press Run and then Ramp Down to ramp the load to zero. When the load
reaches zero press Hold. Disable Load-Displacement and remove the
specimen from the test machine (if DCPD, turn off the current before removing
the specimen). If necessary, press Ramp Down again until FNG Out reads
zero on the Status display.
15. Press Stop.
16. Return to the Main Menu. Using the File drop-down list, save the analysis
(.in5) file in Version 3 Format. Also save the load-displacement (.raw) data file
and the unload (.unl) data file.
Page 27 of 148
NLFT Testing - Series 2015 - V3+.16.01

17. Choose Exit if you wish to quit the program. For a new test, return to the
Initialize tab on the Data Input form. Enter a new Test ID and go straight to
step 7 of the preceding section, Setup.
Page 28 of 148
NLFT Testing - Series 2015 - V3+.16.01
4.0 NLFT Testing Software: Description of Menus and Tabs
The following section of the manual offers a complete description of the menus and tabs
comprising both the compliance and potential drop NLFT testing applications. The
menus are presented in the order in which they would normally be opened during test
setup.
For a step-by-step procedure detailing how the software may be used for running an
E1820 test, see preceding Section 3.2.
4.1 Splash Screen
The splash screen is displayed upon start-up. The application title and version number
are identified at the top of this form. From this form the Crack Monitor type
(Compliance or DC Potential Drop) is selected. If a different crack monitor type is
required for subsequent tests, the program must be shut down completely and
restarted. Simultaneous Compliance and DC Potential Drop if desired.
Once the test selection has been made, select New Test to call up the Main Menu and
begin a test from scratch. The Resume options allows the operator to resume a test
that may already have been in progress (for example, after a system crash or power
outage). See Appendix A for details. The establishment of a successful link between the
PC and the ADwin is confirmed when the green LED on the Adwin begins to flash.
Page 29 of 148
NLFT Testing - Series 2015 - V3+.16.01
4.2 Main Menu
The Main Menu is always displayed while the program is running: its default position is
in the upper left-corner of the computer screen. The Unit Type (English or Metric)
must be selected before other forms may be opened. The Unit Type can be changed
while the test is in progress or the program is open, but such a change requires closing
and reopening all of the other forms. Note that all processing and data storage are done
in English units, even if the Metric option is chosen: the unit conversion takes place as
data are entered or displayed.
The Work Load displays the ADwin workload in % for both high and low priority
processes and is for reference only.
Pressing the red STOP DSP button terminates all DSP processes. This is not
recommended for normal operation and the button is disabled by default. To activate,
tick the Enable Stop box. Sometimes, if the ADwin does not appear to be responding,
enabling stop can reset the Adwin so normal functioning can resume. All DSP
processes are then restarted when the Run Button is pressed on the Main Function
Generator. Use with caution.
4.3 File
The first drop-down menu on the Main Menu is File. See Section 3.1 of this manual for
a full discussion of the files produced by the testing software.
4.3.1 SAVE ANALYSIS FILE
Analysis files with the .in5 extension must be saved manually, although they are held in
memory until the data buffer has been cleared. The user may save the analysis file at
any time during the test, noting that saving an analysis file overwrites any previous
versions.
Page 30 of 148
NLFT Testing - Series 2015 - V3+.16.01

Analysis files contain the header and raw test data that will be processed using the
analysis program. In addition to the analysis file (which is not saved automatically), the
program produces a .raw file containing load-displacement data and time data in
engineering units; a .unl file containing unloading slope data in volts; and a .log file that
automatically records all data taken during the test. It is nonetheless good practice to
save the .raw and .unl files at test completion using the Save As feature. Log files are
automatically produced and saved as long as this process is activated on the Options
form. It is also possible to save the analysis file in the FCGR format for da/dt analysis
using the FCGR analysis software.
Saving an analysis file overwrites the previous file. Analysis files are held in memory
until manually saved or the data buffer is cleared. Log files are saved automatically:
however, data dumps between automatic saving intervals (determined on the Options
form) must be done manually by pressing Print to Log on the Data Input form.
4.3.2 EXIT
When Exit is chosen, the user is prompted to save the analysis files even if they have
been previously saved. If Exit is selected inadvertently and the ADwin system power
remains on, the test can be continued without losing data by selecting Resume on the
splash screen.
4.4 Config
From the Main Menu, the Config dropdown menu accesses the Hardware
Configuration form; the Test Set-up form; and the General Information form. These
forms are addressed in sequence during test setup. All testing configuration (but not
function generation or control) is determined on the Config forms. Entries are
transferred between the PC and the ADwin when the Send to ADwin and Receive
from ADwin buttons are pressed. When a change is made to the input forms, the Send
to ADwin button will flash indicating that the change has not yet been sent to the
ADwin. When the Receive from ADwin button is pressed, the user will notice that all
fields in blue will be updated with the latest information from the ADwin. Pressing
Receive from ADwin does not alter test conditions and may be done at any time during
a test. All Config entries can be dumped to the .log file using the Print to Log button on
each of the three forms.
NB Text box entries are not transferred to the corresponding variable until you click on
another text box or command button such as Send to ADwin.
Page 31 of 148
NLFT Testing - Series 2015 - V3+.16.01

4.4.1 HARDWARE CONFIGURATION
The Hardware Configuration form is used to assign and configure the ADwin’s analog
input channels. All channels are pre-assigned and cannot be changed by the user.
Channels one through six are used, as detailed in the following sections.
The form consists of two tabs: Calibration and Configuration. These tabs are slightly
different depending on whether the compliance or DCPD application is in use, as
detailed below.
Hardware configuration entries are not transferred between the ADwin and computer
until the Send to ADwin or Receive from ADwin buttons are pressed. Hardware
configuration files (.pr8 extension) may be saved and loaded for subsequent tests using
the blue buttons at the bottom of the form.
4.4.1.1 Calibration (compliance)
Page 32 of 148
NLFT Testing - Series 2015 - V3+.16.01

The Calibration tab displays the active ADwin analog input compliance channels IN1
through IN4 and their function under the Channel Designation heading. These
assignments may not be changed by the user in the steady state single-monitor
application. The two auxiliary channels (IN3 and IN4) are optional and should be set to
zero when not in use (in this case, the BNC connectors on the ADwin should be empty).
IN5 and IN6 are used by the DCPD application only.
The channels are calibrated by the user using the text boxes under Calibration Factor,
using units/volt.
Enable Run-Stop Interlock is ticked by default and may not be changed.
4.4.1.2 Calibration (DCPD)
The Calibration tab displays the active ADwin analog input DCPD channels IN1
through IN6 and their function under the Channel Designation heading. Channel
assignments may not be changed by the user. The two auxiliary channels and DCPD
Page 33 of 148
NLFT Testing - Series 2015 - V3+.16.01

Ref[erence] (IN3, IN4, and IN6) are optional and should be set to zero when not in use
(in this case, the BNC connectors on the ADwin should be empty).
The channels are calibrated by the user using the text boxes under Calibration Factor.
All calibration factors are in units/volt except DCPD Active and DCPD Ref[erence],
which relate directly to the proportional gain selected on the amplifier. When using the
FTA DCPD system, the number entered for IN5 and IN6 must be 10X that selected on
the associated Ectron module: that is, if a gain of 500 is selected on the amplifier, then a
gain of 5000 should be entered on the Calibration tab).
Enable Run-Stop Interlock is ticked by default and may not be changed.
4.4.1.3 Configuration (Compliance and DCPD)
Page 34 of 148
NLFT Testing - Series 2015 - V3+.16.01

For each of the ADwin input channels, the Configuration tab allows designation of
Polarity and programmable Gain. Default selections are appropriate for most
applications with the following exceptions:
Polarity
IN1: increasing voltage with increasing load is the default setting for most
geometries with the exception of the compressive loading of bend bars, for
which polarity should be reversed. If the IN1 polarity is reversed, then the load
cell polarity must also be reversed by unticking the Normal Command
Polarity option below it. Use this option with caution. Do not change the
polarity while the ADwin is in control. The polarity cannot be changed while
the function generator is running.
IN2: increasing voltage with increasing displacement is the default setting and
appropriate for most applications.
IN3: normal polarity is chosen by default
IN4: normal polarity is chosen be default
IN5: specifies the polarity of the active DCPD signal. This option should be
Reversed if the potential signal is negative when the current is in the forward
direction (for example, if the hardware configuration has been accidentally
reversed)
IN6: specifies the polarity of the Reference DCPD signal. This option should
be Reversed if the potential signal is negative when the current is in the
forward direction (for example, if the hardware configuration has been
accidentally reversed)
Gain: the default gain of x1 provides + to -10 volt inputs, which is appropriate for
most steady-state testing. Higher gains allow for greater resolution but offer less
range: lower-level signals could benefit from gains of x2 (+ to -5 volts), x4 (+ to -
2.5 volts) or x8 (+ to -1.25 volts). Changes to the Gain on the Configuration tab
do not require any alterations on the Calibration tab.
Page 35 of 148
NLFT Testing - Series 2015 - V3+.16.01

4.4.2 TEST SET-UP
The Test Set-up form consists of eight tabs: Initialize; Calibration; Coefficients;
Dimensions; Compliance; DCPD; Storage; and Limits. When organized in a single
row, these tabs appear in the logical order in which parameters would be entered to
start a test. Inactive data fields are displayed in gray.
NB It is important to remember that entries are not automatically transferred between
the PC and the ADwin, but must be sent manually using the Send to ADwin and
Receive from ADwin buttons at the bottom of the form. Once a test has been started, it
is extremely important, before changing any test conditions, to Receive from ADwin in
order to ensure the PC and ADwin are in agreement.
Page 36 of 148
NLFT Testing - Series 2015 - V3+.16.01

4.4.2.1 Initialize
The tabs of the Test Set-up form are organized logically and, when displayed in a
single row, addressed from left to right by the user. Initial test setup is accomplished on
the Initialize tab. First, the Test ID must be entered, establishing the name of all the
test’s associated files (analysis files (.in5), log files (.log), load-displacement files (.raw)
and unloading slope files (.unl)). An extension is not entered in this field because it will
be automatically appended by the software. When changing the Test ID, the user will
be prompted to save the current analysis file. The Send to ADwin button must be
pressed a second time to confirm the name change.
Three blue buttons at the top of the tab establish the data storage path and allow
creation and saving of parameter files:
Page 37 of 148
NLFT Testing - Series 2015 - V3+.16.01

Start Log File: starting a log file also establishes the data storage path
(prompted by a pop-up window when the button is pressed) for all files created
by the testing program. It is recommended that users create discreet storage
folders out with the PC’s program directory, since some computers require
administrator privileges to access such files later on. Once initiated, log files are
saved and updated automatically by the program.
Load Test Parameters: loading a parameter (.pr5) file populates the Data Input
form with all the information necessary to start a test (except the Test ID), edited
as required. Parameter files contain geometry designations, specimen
dimensions, initial Pmax values, and other specific test information. Use of
parameter files can save time and reduce the risk of errors when entering
repetitive information. FTA supplied parameter files can be used for either
Compliance or DC Potential Drop. However, once these files are saved, they
become unique to the crack monitor type. Note that .par files from previous
versions of the software are not compatible with the current version 3+.16.
Several parameter files for commonly-used specimen geometries are supplied in
the program directory for the testing software. These files may be modified for
users’ particular needs. Refer to the latest ASTM E1820 and E647 test standards
for corresponding formulas and coefficients. Test parameter files supplied by
FTA include:
C(T) FF.pr5: compact tension with front face clip gage
C(T) LL.pr5: compact tension with load line clip gage
M(T) 4W.pr5: middle crack tension, 0.6” gage length, 4” panel width
SE(B).pr5: single edge 3-point bend
SE(T) PIN LOADED.pr5: single edge tension (pin loaded)
SE(T) RIGID.pr5: single edge tension (rigid grip)
ESE(T).pr5: eccentrically load single edge tension
SF.pr5: surface flaw tension
CC.pr5: corner crack tension
Save Test Parameters: pressing this button saves the current information with
the Test ID for future reference and/or loading. Parameter files may also be
saved from the Limits tab when all test setup fields are complete.
The Initialize tab also includes the following three check boxes at the upper right:
Initialize: sets to zero the values of crack length and current a/W (used only at
the start of a new test, after the previous test’s data have been saved).
Page 38 of 148
NLFT Testing - Series 2015 - V3+.16.01

Clear Data Buffer: clears all previously calculated data stored in memory. This is
typically used when starting a new test. Ticking Clear Data Buffer automatically
issues a prompt to store the data to an analysis file.
Clear Elapse Timer: resets the hour and day-elapse timer on the Status display.
After a box is ticked, the Send to ADwin button must be pressed to communicate the
change to the ADwin. The box is then cleared automatically so the action is not
repeated accidentally. All of these selections may be made without stopping a test and
may be carried out individually or in combination.
If the data buffer has been cleared unintentionally (or the operator has second
thoughts!) it may be restored using the Restore Data Buffer checkbox. This is
particularly useful if the analysis file was not manually saved before the buffer was
cleared.
The Data Buffer display shows the current status of the buffer, either as an absolute
value or % Used. Data stored include elapsed time; force; displacement; auxiliary1;
auxiliary2; crack size; unloading compliance; DCPD active; DCPD reference; and DCPD
normalized. The buffer allows for a maximum of 50,000 lines of data in the analysis
(.in5) file.
If the data buffer has been cleared accidentally (by activating the Clear Data Buffer box
in the Initialize frame), it may be restored by activating the Restore Data Buffer box
and sending to the ADwin. If too few data points reappear, more may restored by
entering the total desired number in the Specify Data Buffer Size field. Caution should
be exercised when using this capability, however, as it is possible to include data from
previous tests if too many points are specified.
Page 39 of 148
NLFT Testing - Series 2015 - V3+.16.01

4.4.2.2 Calibration
The K Calibration Type is selected automatically when the appropriate test parameter
file is loaded. It may be changed, however, when the user is testing a specimen
geometry for which a test parameter file does not exist or when creating a new test
parameter file from scratch. To change a K calibration, tick the Enable Cal Type box,
make the desired selection, then untick the Enable Cal Type box. Send to ADwin. Do
not forget to untick the Enable Cal Type box once all changes are made!
See Appendix G of the FCGR manual for the stress intensity solutions used by the FTA
software.
Page 40 of 148
NLFT Testing - Series 2015 - V3+.16.01

Polynomial (Type 1): allows the user to enter coefficients of a polynomial
expression up to the 5th order. The form of the expression is taken from the
ASTM E647 stress intensity (K) solution for the compact tension, C(T), geometry.
However, the user can apply other coefficients for different geometries such as
the disk-shaped compact tension, DC(T), as long as the K expression is of the
same form. Type 1 Type 1 is the form suitable for the compact tension sample as
follows:
K = (P /(BW)) ((2+a/W)/(1-a/W)^1.5) f(a/W)
Polynomial (Type 2): a more general form suitable for custom K calibrations:
K = a f(a/W) = (P/(BW)) a f(a/W)
Polynomial (Type 3): an alternative form suitable for custom K calibrations:
K = (P /(BW)) f(a/W)
Center Crack, M(T): the K solution is taken from ASTM E 647
Single Edge Crack, SE(T): assumes a pin-loaded specimen with the K solution
taken from: H. Tada, P. Paris, G. Irwin, Stress Analysis of Cracks Hankbook,
Second Edition, 1985.
SEN rigid for a rigidly gripped single edge notch
Bend, SE(B): K solution is taken from ASTM E399
Extended Compact, ESE(T): K solution is taken from ASTM E 647.
Surface Crack the solution assumes an aspect ratio of 1.
Corner Crack the solution assumes an aspect ratio of 1.
Look-up Table (see further details below)
The DCPD version of the Test Set-up form (shown at the beginning of this section)
includes PD Calibration Type options. When a standard test parameter file is loaded,
the selection of PD calibration type is automatic. However, when creating a unique
parameter file, the user may change the PD calibration. To change a PD calibration, tick
Enable Cal Type, make the desired selection, then untick the Enable Cal Type box.
Send to ADwin. Do not forget to untick the Enable Cal Type box once all changes are
made!
Polynomial: requires the input of user-supplied coefficients. The form of the
equation in terms of a/W is:
a/W = B0+B1(Va/V
B3(Va/V
0,a
V
V
0,a
)3 + B4(Va/V
0,r/Vr
) + B2(Va/V
0,r/Vr
0,a
0,a
V
V
0,r/Vr
0,r/Vr
4
)
)2 +
Page 41 of 148
NLFT Testing - Series 2015 - V3+.16.01

Where:
Va = instantaneous active voltage
V
= starting active voltage
0,a
Vr = instantaneous reference voltage (equal to 1 when reference
probe is not used)
V
= starting active voltage (equal to 1 when reference probe is
0,r
not used)
Johnson’s formula: may be selected for most specimen geometries. This is a
closed form solution for crack length and can be found in ASTM E647. It should
be noted that when applying Johnson’s formula to the C(T) geometry, a starting
a/W > 0.3 and a probe spacing to width ratio of 0.35 gives the most accurate
result.
Surface Crack: for a surface crack or corner crack. The solution assumes an
aspect ratio of 1.0.
Look-up Table: for situations where a polynomial expression or Johnson’s
formula are not sufficiently accurate. The data pairs are entered in a file with the
.dat extension in tabular form as shown in the example below:
Page 42 of 148
NLFT Testing - Series 2015 - V3+.16.01

The first column is the normalized DCPD reading and the second column is the
corresponding crack-length to width ratio (a/W).
The Geometry Type is selected automatically when the appropriate test parameter file
is loaded. It may be changed, however, when the user is testing a specimen geometry
for which a test parameter file does not exist or when creating a new test parameter file
from scratch. To change a Geometry calibration, tick the Enable Cal Type box, make
the desired selection, then untick the Enable Cal Type box. Send to ADwin. Do not
forget to untick the Enable Cal Type box once all changes are made!
The Geometry Type is necessary to assign eta and gamma functions for non-linear
fracture toughness. It is not necessary to assign a geometry for linear elastic fracture
toughness.
C(T): compact of similar type
M(T): center crack
SEN(B): single edge crack bend
SEN(pin): single edge crack tension (pin loaded)
SEN(rigid): single edge crack tension (clamped)
Neutral: no geometry adjustment
Page 43 of 148
NLFT Testing - Series 2015 - V3+.16.01

4.4.2.3 Coefficients
This tab displays the coefficients of fifth-order polynomial expressions used to calculate
stress intensity and crack length. When a selection other than Polynomial is made on
the Initialize tab, the coefficient fields on this tab are disabled and appear in gray.
Compliance coefficients are required in all cases for the compliance method of cracklength determination. DCPD applications using polynomial expressions for crack length
will require input of user-supplied coefficients.
The Coefficients tab shown displays the correct values for a C(T) specimen with a
front-face mounted clip gage (CT-comp-load line.pr5).
Page 44 of 148
NLFT Testing - Series 2015 - V3+.16.01

When using an FTA-provided parameter file, the Stress Intensity and Compliance
ranges displayed at the bottom of the tab are for information only. Consult FTA for more
information on user-generated look-up tables.
Page 45 of 148
NLFT Testing - Series 2015 - V3+.16.01

4.4.2.4 Dimensions
The following values must be entered by the user:
Specimen Thickness, B (NB When testing surface-crack or corner-crack
specimens, width and thickness dimensions are reversed)
Net Specimen Thickness, B
grooves, Net Specimen Thickness must equal Specimen Thickness, as in the
example above.
Specimen Width, W. For center-crack specimens enter half the full panel width.
(NB When testing surface-crack or corner-crack specimens, width and thickness
dimensions are reversed)
Span to Width Ratio(bend bars)
Page 46 of 148
NLFT Testing - Series 2015 - V3+.16.01
, for side-grooved samples. If there are no side-
net

Pin Spacing.
Modulus of Elasticity, E.
Yield Stress ys.
Tensile Stress
ult
.
Crack Length
Limit Load is automatically calculated by the program in reference to the other
dimensions entered by the user.
The ADC Data Burst Count parameter specifies the number of analog-to-digital
conversions that are averaged for each data point. A value of 83 is recommended since
this number cancels 60 Hz AC noise.
Page 47 of 148
NLFT Testing - Series 2015 - V3+.16.01
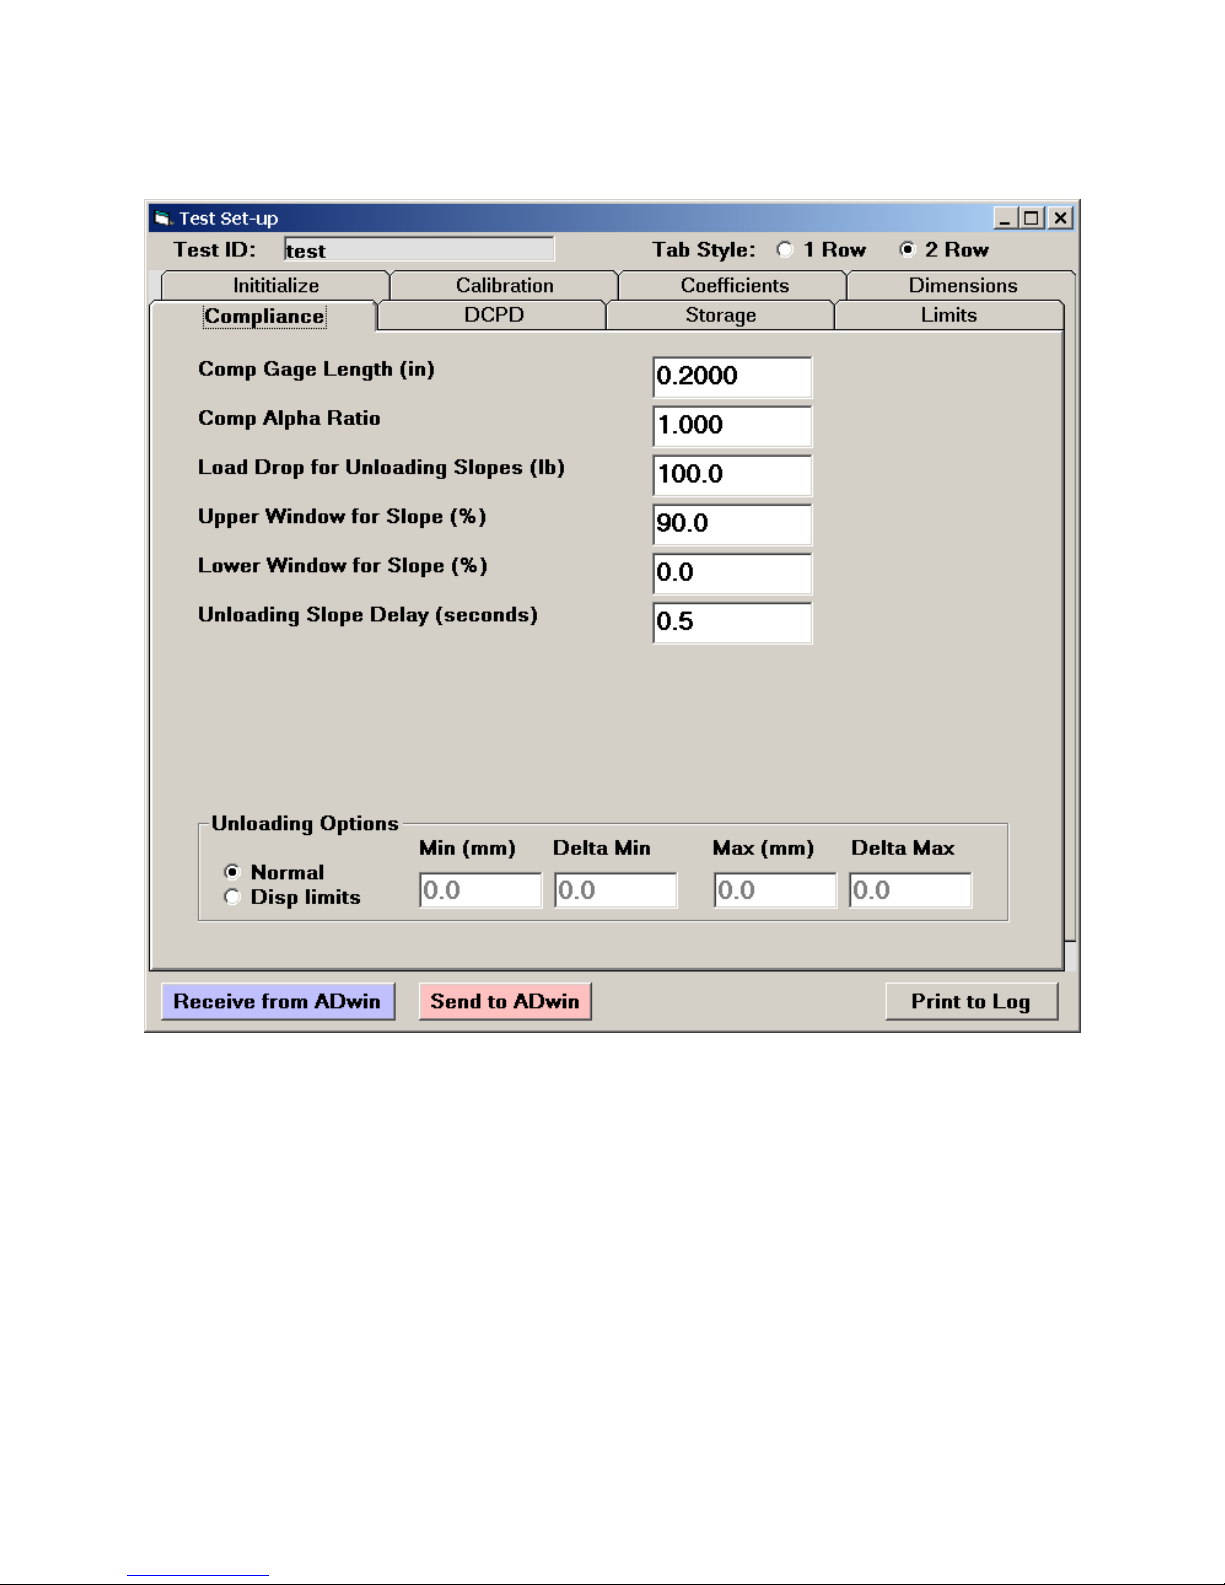
4.4.2.5 Compliance
The Compliance tab defines the parameters related to crack measurement using
unloading slopes.
The following values must be entered by the user:
Comp[liance] Gage Length.
Comp[liance] Alpha Ratio: the ratio between the gage location to back edge
distance divided by the specimen width. For example, when testing a C(T)
specimen with displacement measured on the load line, alpha = 1. If a front-face
displacement measurement is made, alpha = 1.25.
Page 48 of 148
NLFT Testing - Series 2015 - V3+.16.01

Load Drop for Unloading Slopes: the load drop value, expressed in pounds,
should not exceed 20% of the limit load. If no unloading slopes are required
during the test, enter zero.
Upper Window for Slope: specifies the upper cutoff for unloading compliance
slope measurement based upon percentage of load drop. The excluded portion
of the slope is displayed in red on the Load-displacement Display. During a
long test, it can be useful to decrease this window to capture the linear part of the
slope only. The default value of 90% (corresponding to the lower 90% of the
slope) is recommended at the start of tests, but this window can be decreased to
as much as 50% if the specimen undergoes severe deformation (it is good
practice to increase the Load Drop in this case). Slopes can also be
reprocessed during analysis using the Testing Playback software (discussed in
Section 8 of this manual).
Lower Window for Slope: specifies the lower cutoff for unloading compliance
slope measurement based upon percentage of load drop. The excluded portion
of the slope is displayed in red on the Load-displacement Display. Generally a
value of 0% is recommended.
Unloading Slope Delay: specifies the time interval between holding the
command signal at load and starting the unloading slope. The default value of 1
second is recommended for most applications where no creep effect is expected
Unloading Options: allows optional displacement limits for unloading slopes.
This is used for cyclic J and is beyond the scope of this manual.
Page 49 of 148
NLFT Testing - Series 2015 - V3+.16.01
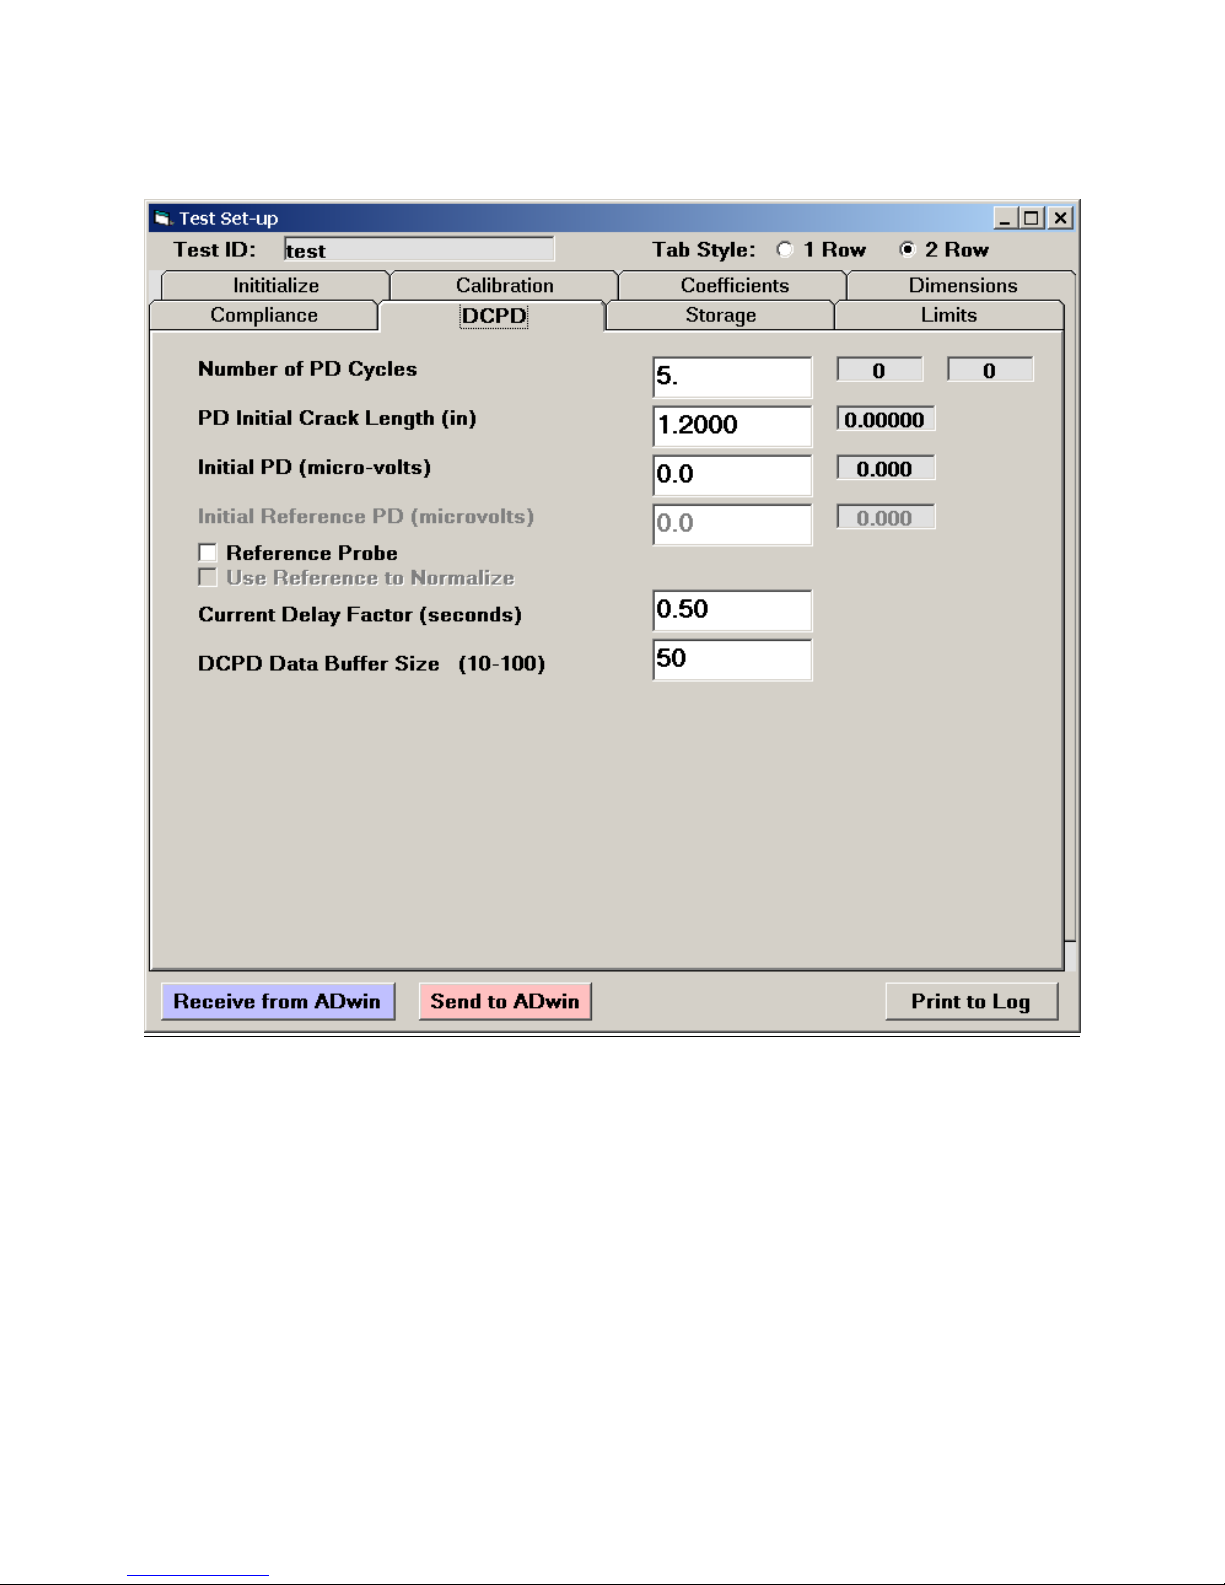
4.4.2.6 DCPD
The DCPD tab defines the parameters related to crack measurement using DC potential
drop.
The following values must be entered by the user:
PD Number of PD Cycles: … required to determine crack length. A large
number gives greater crack length precision but does not update the crack length
as often. A value of 2 to 5 is appropriate for most applications.
PD Initial Crack Length: the specimen’s starting crack length
Initial PD: this value is initially set to zero, then changed after DCPD data
acquisition to calculate crack length. See the test procedure in Section 3.2 of this
manual for the order of operations.
Page 50 of 148
NLFT Testing - Series 2015 - V3+.16.01

Initial Reference PD (if enabled): this value is initially set to zero, then changed
after DCPD data acquisition to calculate crack length.
Current Delay Factor: the delay in seconds that the program waits after the
current is reversed to allow the voltage to stabilize. A value of 0.5 seconds is
recommended for most applications when using a solid-state current source.
DCPD Data Buffer Size specifies the number of DCPD readings between each
current reversal. A data buffer size of 50 is recommended.
Page 51 of 148
NLFT Testing - Series 2015 - V3+.16.01

4.4.2.7 Storage
The Storage tab is used to determine the intervals at unloading slopes or DC potential
drop measurements are to be taken.
Three text boxes specify conditions at which unloading will occur. Unloading is triggered
by whichever condition is met first:
Load: in the example above, unloading slopes will occur every 1000-lb increase
in load
Displacement: in the example above, unloading slopes will occur every 0.0002”
increase in displacement.
Time: specifies the time interval between unloading slopes.
Page 52 of 148
NLFT Testing - Series 2015 - V3+.16.01

Four additional check boxes determine which channels, in addition to elapse time, are
saved in the .raw file. Only active channels should be selected.
Store Load: must always be selected!
Store Disp: select if a displacement signal is fed into BNC IN2 on the ADwin.
Store Aux 1: select if a signal is fed into BNC IN3 on the ADwin.
Store Aux 2: select if a signal is fed into BNC IN4 on the ADwin.
Automatic Zero of Displacement sets displacement to zero when data
acquisition is started. This allows the operator to begin a test with negative
voltage at zero displacement, ensuring that the full range is not exceeded during
the test.
Apply Rotation Correction to Delta a should always be ticked when
compliance-testing a compact tension C(T) specimen.
Enable Automatic Analysis File Storage allows a backup analysis file (no
extension) to be automatically saved to the test directory. These files are saved
every two hours by default, although this interval can be changed by the user.
Page 53 of 148
NLFT Testing - Series 2015 - V3+.16.01

4.4.2.8 Limits
The Limits tab allows the user to specify conditions outside which the program goes
into HOLD mode or ends the test. Additionally, the tab is used to automate certain
actions that occur at the beginning of a test or when the test is finished.
When Transducer Limits are exceeded, the program goes into HOLD mode:
Load Limit
Displacement Limit
DCPD Active
DCPD Reference
Other Limits and Actions include the following:
Page 54 of 148
NLFT Testing - Series 2015 - V3+.16.01

Load Limit Hold: the load at which the command goes to hold. A useful feature
at the beginning of tests for applying low loads and evaluating signal quality and
repeatability of crack length readings.
Load Drop Limit: the drop in load that triggers the HOLD mode.
Delta a Limit: the value of Delta a that, when achieved, will cause test
termination and a ramping down of load, as specified by the Ramp Down
Amount.
Ramp Down Amount: specifies the drop in load after which the command signal
goes to hold, typically at the end of a test (when the specified Delta a has been
reached).
Automatic PreLoad: typically a low load, applied while a specimen is coming to
test temperature. Enable Automatic PreLoad only when the three Data
Acquisition items on the Ramp Generator deselected! When Automatic
Preload and RUN on the Ramp Generator are pressed, the command signal will
change so the automatic preload is achieved. Pressing Ramp Up is not required.
The load level for the preload may be determined here or on-the-fly on the Ramp
Generator.
Since this is the final tab addressed by the user during test setup, test parameter files
may also be saved from here.
4.4.3 GENERAL INFORMATION
General information may be saved and loaded before or during testing, thus avoiding
the entering of repetitive data during analysis and the risk of mistakes. This information
is not required to run a test, but is necessary for the cover page of the analysis program
output and some validity checks (discussed more fully Section 7 of this manual).
Page 55 of 148
NLFT Testing - Series 2015 - V3+.16.01

4.4.3.1 General
Load General Info: this button calls up a dialogue box requesting selection of a .gn2.
Selecting the appropriate file populates the two tabs of the General Information
screen. This .gn2 file is created through the Save General Info button.
Save General Info: after the fields of the General Information tabs have been
populated, the input values may be saved as a .gn2 file and loaded during subsequent
tests. The user is prompted for an appropriate file name and file path.
Page 56 of 148
NLFT Testing - Series 2015 - V3+.16.01

4.4.3.2 Precrack
Precrack parameters may also be provided by the user:
Page 57 of 148
NLFT Testing - Series 2015 - V3+.16.01
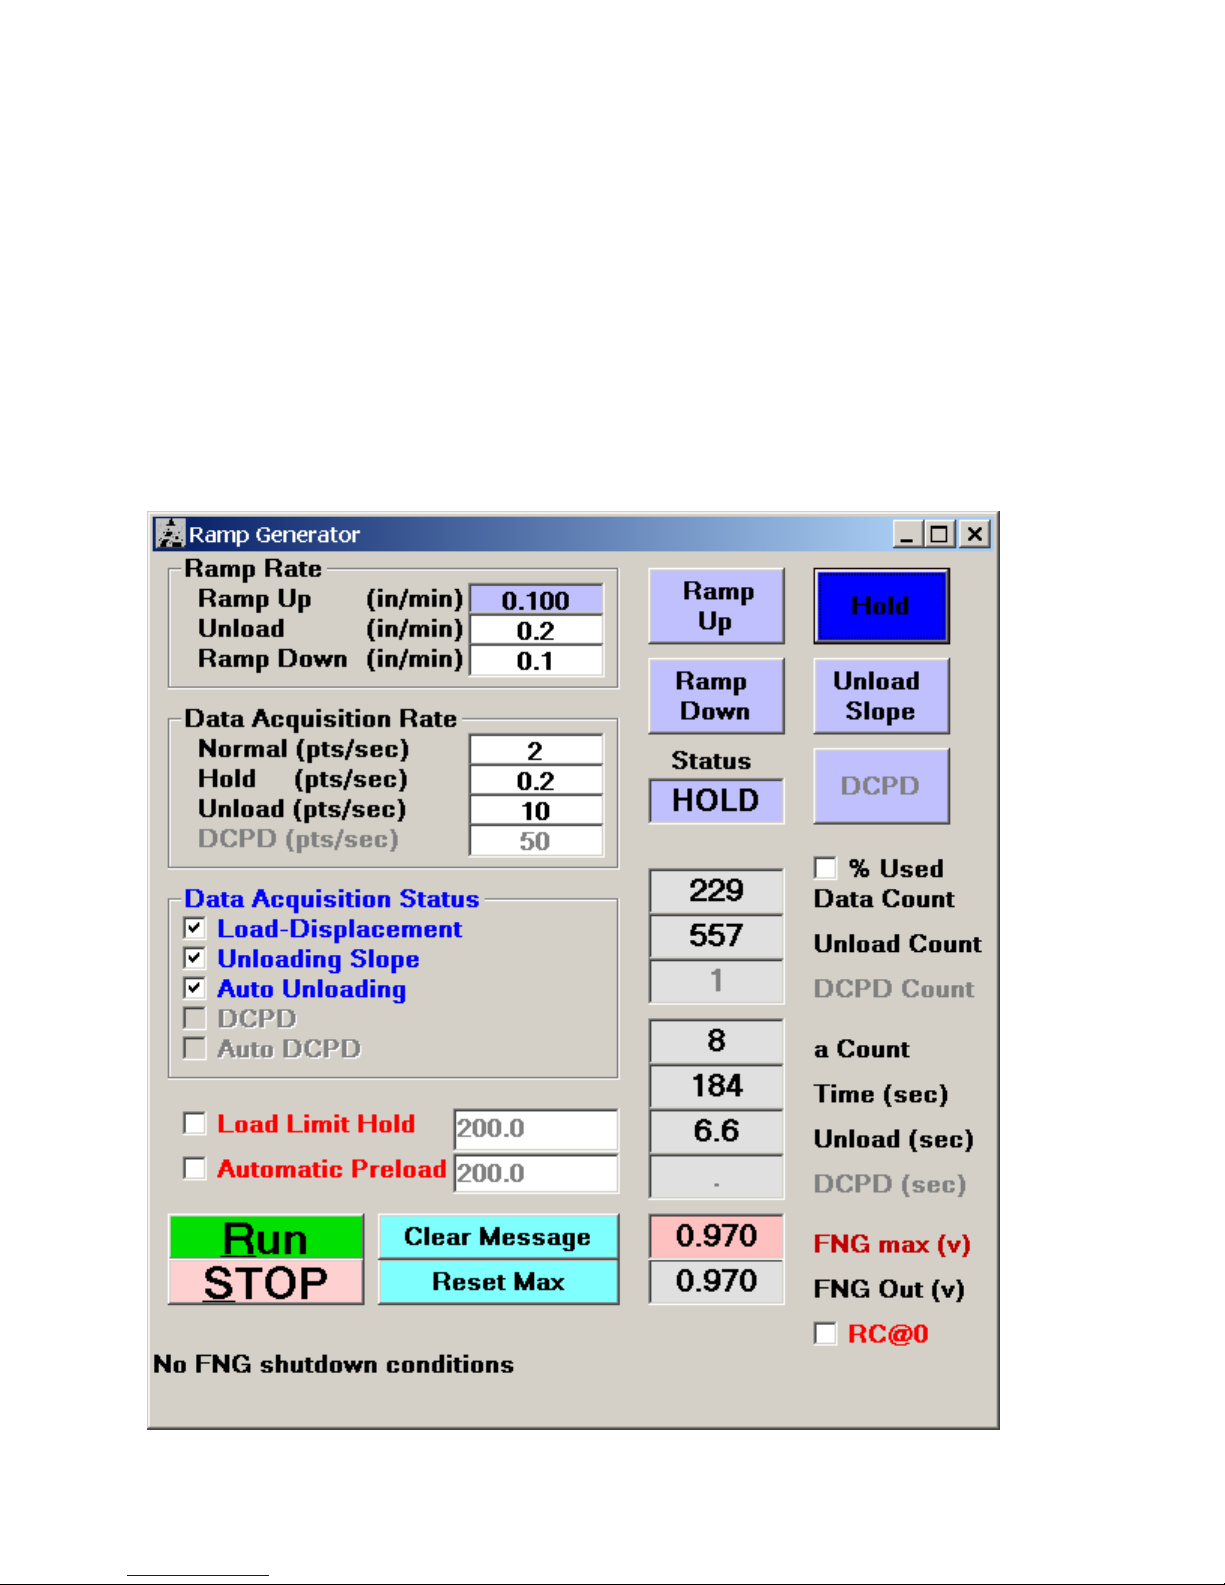
4.5 Control
4.5.1 RAMP GENERATOR: COMPLIANCE AND DCPD
The Ramp Generator is at the heart of a test’s control. The Ramp Generator must be
open to activate the Status and Load-Displacement display forms and must remain
open for the duration of the test. Ramp generation and feedback signals are updated
three times per second. Unlike the Data Input and Options forms, changes on this form
are sent immediately to the ADwin-Gold. Text boxes with white backgrounds are both
for display and entry purposes; text boxes with gray backgrounds are used for display
only.
Page 58 of 148
NLFT Testing - Series 2015 - V3+.16.01

Ramp and Data Acquisition rates are displayed in/determined by seven text boxes at
the top of the form. They may be changed on the fly as the test progresses. The values
shown in the example above are typical for a steel 1T C(T) specimen. Changes in
material or specimen geometry will require adjustments to these rates.
Ramp Rate (units are inches per minute):
Ramp Up controls the speed of the monotonic loading between unload slopes.
Unload controls the rate of the unload slopes. This is typically set faster than the
ramp rate to save time for unloading slopes
Ramp Down is the ramp rate when the ramp down button is pressed
Data Acquisition Rate (units are points per second):
Normal: the data acquisition rate when the program is not in HOLD.
Hold: the data acquisition rate during the HOLD mode.
Unloading slopes: the data acquisition rate during unloading slopes.
DCPD (if enabled): the DCPD data acquisition rate during crack length
determination (points per second).
Five boxes in the middle of the form determine the status of Data Acquisition.
Load-Displacement Storage: when selected, load-displacement data are stored
in the .raw data file and traced in real-time on the Load-Displacement Display.
Unloading Slope Storage: when selected, the unloading slope data that are
stored in the .in5 analysis file are included instead of excluded. Typically, this
option is not activated until signal quality and crack length repeatability have
been verified at a relatively low load (unloading slope data can also be included
or excluded at analysis time).
Enable Auto Unloading: when selected, then automatic unloading slopes are
enabled according to the specifications determined on the Data Acquisition tab
of the Data Input form. Auto-unloading should not be enabled until initial
unloading slopes have been applied to verify set up and crack length (see
above). Auto unloading will not occur if Load Limit Hold is activated. If no
unloading slopes are required, the value Load Drop for Slopes should be set to
zero on the Data Acquisition tab.
DCPD Data (if enabled): when selected, DCPD readings that are stored in the
.in5 analysis file are included instead of excluded. T. Typically, this option is not
activated until signal quality and crack length repeatability have been verified at a
Page 59 of 148
NLFT Testing - Series 2015 - V3+.16.01

relatively low load (DCPD data can also be included or excluded at analysis
time).
Enable Auto DPCD (if enabled): when selected, then automatic DCPD data
acquisition is enabled according to the specifications determined on the Data
Acquisition tab of the Data Input form. Auto-acquisition should not be enabled
until initial DCPD readings have been taken to verify set up and crack length (see
above). Auto acquisition will not occur if Load Limit Hold is activated.
Load Limit Hold specifies the level at which command signal will hold (specified on the
Limits tab of the Data Input form) during initial ramping-up. The load limit is usually set
to the precrack Pmax for the purpose of applying manual unloading slopes before the
test proper has begun.
Automatic Preload adjusts the command signal to ensure a stable preload according
to the value specified on the Limits tab of the Data Input form. This is typically used to
hold a specimen at a constant load while it is brought to test temperature. Selecting the
Automatic Preload box will cause the load to increase without pressing Ramp Up on
the Ramp Generator and should be used with some caution.
Run must be selected for the command signal to change and the test to begin.
Transducer limits and other limit conditions will set the button to STOP or HOLD.
Pressing Clear Message clears all displayed error or limit messages, provided the
cause of the error has been rectified.
Pressing Reset Max resets the display of FNG Out (max) and Load (max) on the
Status display.
Five blue buttons at the right top of the Ramp Generator allow for manual control of
certain aspects of the test and indicate the test’s status during auto unloading:
Ramp Up: pressing Ramp Up ramps the command signal in the positive
direction (dependent on the polarity setting on the Options screen). The button
turns dark blue when the machine is ramping up in auto-unloading mode.
Ramp Down: pressing Ramp Down ramps the command signal in the negative
direction (dependent on the polarity setting on the Options screen). The button
turns dark blue when the machine is ramping down in auto-unloading mode.
Hold: pressing Hold stops the command signal from ramping up or down and
holds the actuator at its current position. The button turns dark blue when the
Page 60 of 148
NLFT Testing - Series 2015 - V3+.16.01

machine goes into Hold mode - for example, after completion of a manuallyapplied unloading slope or when limits have been reached.
Unload Slope: pressing Unload Slope applies a manual unloading slope to the
specimen. Use this for initial unloading slopes, before enabling Auto-Unloading
and commencing the test proper. When Auto-Unloading is enabled, the Unload
Slope button turns dark blue during automatic unload slopes.
DCPD (if enabled): pressing this blue button at the top right of the form initiates
DCPD data acquisition for determining crack length, before enabling Auto DCPD
(above) and commencing the test proper. When Auto DCPD is enabled, the
DCPD button turns dark blue during automatic data acquisition.
Status displays whether the command signal is in the UP, HOLD, or DOWN mode.
Nine boxes on the right side of the Ramp Generator display the current status of the
test and command signal. These boxes are for information only and not available for
editing:
% Used: toggles between absolute and percent of memory used up in data
storage. The limit is 100%. If this value is exceeded, the test will stop. Therefore,
judgement must be exercised in selecting data acquisition rates. For normal
operation, only a few percent will be required. Note that at 20% of memory
usage, the program displays tend to become sluggish.
Data Count displays the number of load-displacement data pairs recorded up to
that point in the test
Unload Count displays the number of unloading load-displacement data pairs
recorded up to that point in the test
DCPD Count (if enabled) displays the number of DCPD measurements
recorded for each DCPD crack size determination
A Count displays the number of crack length determinations from both unloading
slopes and DC potential drop recorded up to that point in the test
Time (sec) displays the elapsed time of the test
Unload (sec) displays the elapse time of each unloading slope.
DCPD (if enabled) (sec) displays the elapse time of each DCPD measurement.
FNG max displays the maximum value of the command signal output.
FNG Out displays the current command signal output.
RC@0: (rate change at zero load) When doing cyclic J, it is useful to activate
this when going through zero load. This feature shifts the rate to the ramp down
rate when going through zero load.
Page 61 of 148
NLFT Testing - Series 2015 - V3+.16.01

When an error or limit condition occurs, the error is displayed in blinking red letters in
place of the No FNG shutdown conditions label shown. A list of possible selfexplanatory error messages follows:
‘Command output exceeded full scale’
‘Load reached full scale or limit setting’
‘Displacement reached full scale or limit setting’
‘Auxiliary channel reached full scale or limit setting’
‘Active PD signal reached full scale or limit setting’
‘Reference PD signal reached full scale or limit setting’
‘Load limit hold’
‘Load drop limit’
‘Delta a limit’
‘Data storage buffer overload’
Page 62 of 148
NLFT Testing - Series 2015 - V3+.16.01
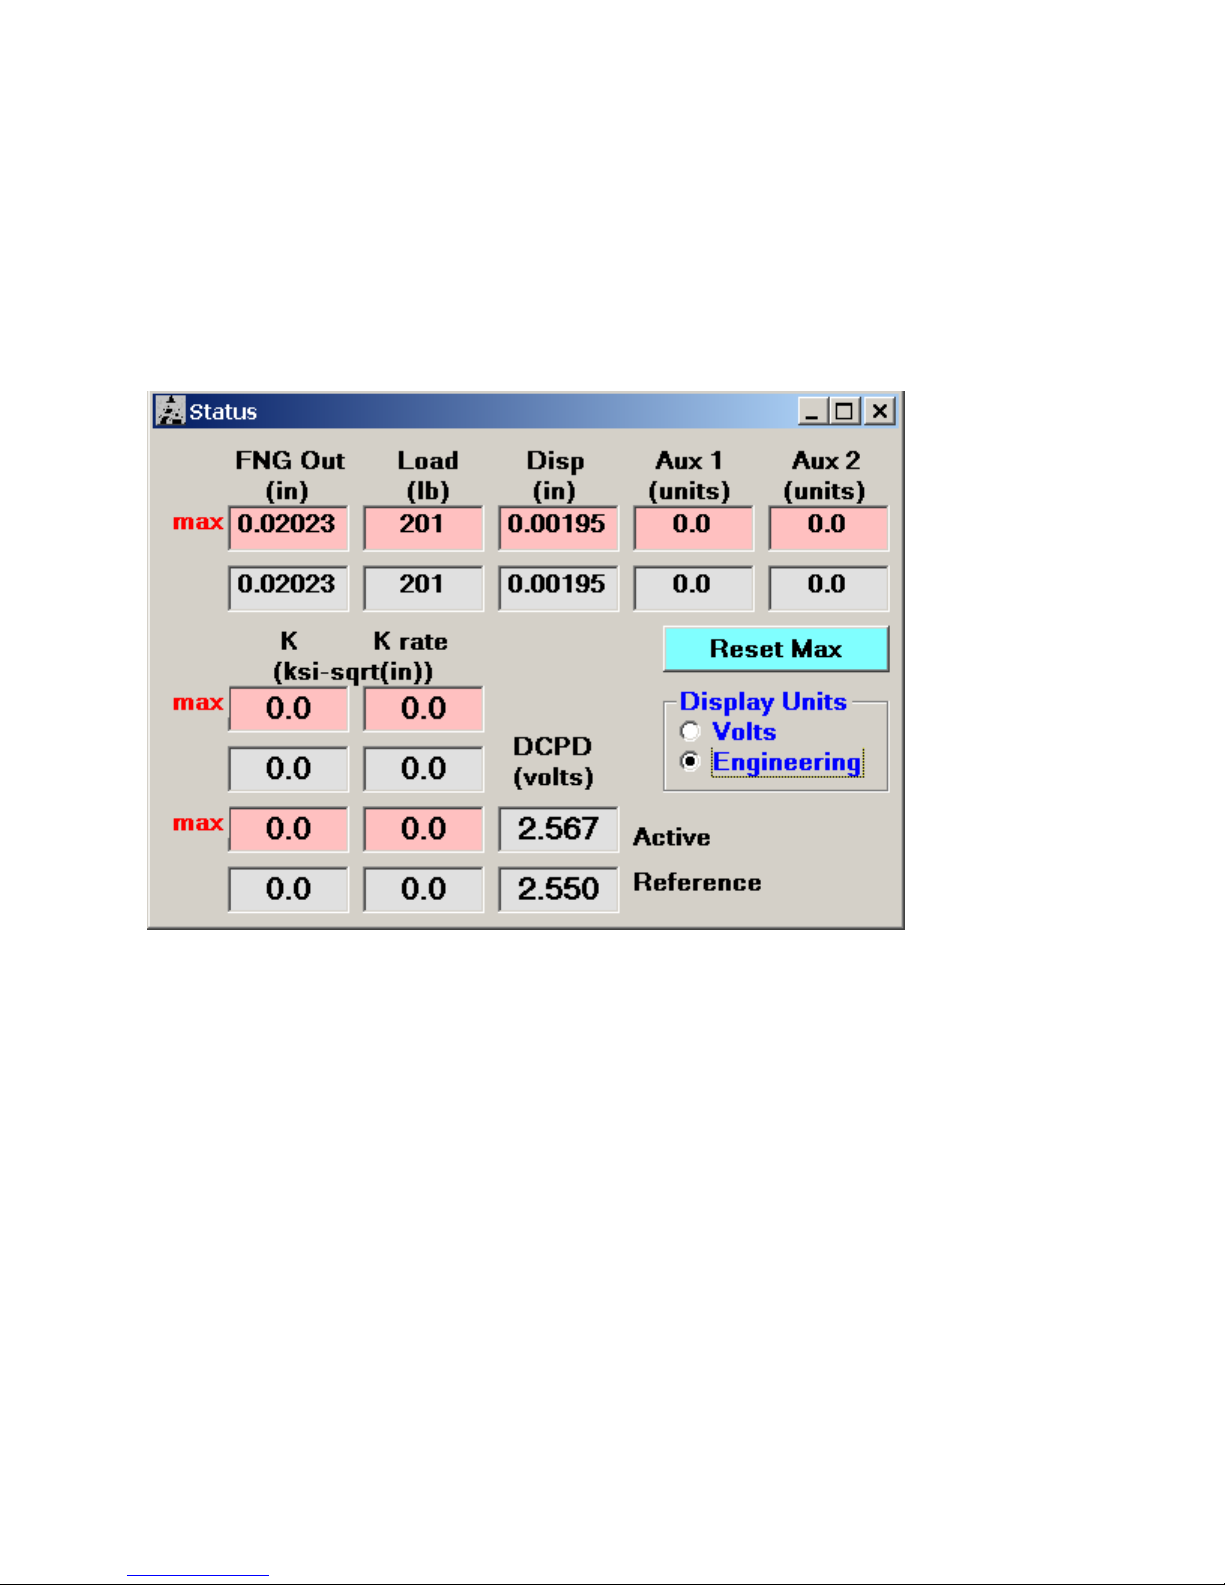
4.6 Display
The Display drop down list on the Main Menu allows the user to open the Status,
Load-Displacement, and J-a displays. These displays may not be accessed until a
test has been initialized and the Ramp Generator is open.
4.6.1 STATUS
The Status screen displays both the maximum and current signals for FNG Out, Load,
Displacement, Auxiliary and Potential Drop in either volts or engineering units.
The Stress Intensity and Stress Intensity Rate per minute are also displayed.
Page 63 of 148
NLFT Testing - Series 2015 - V3+.16.01
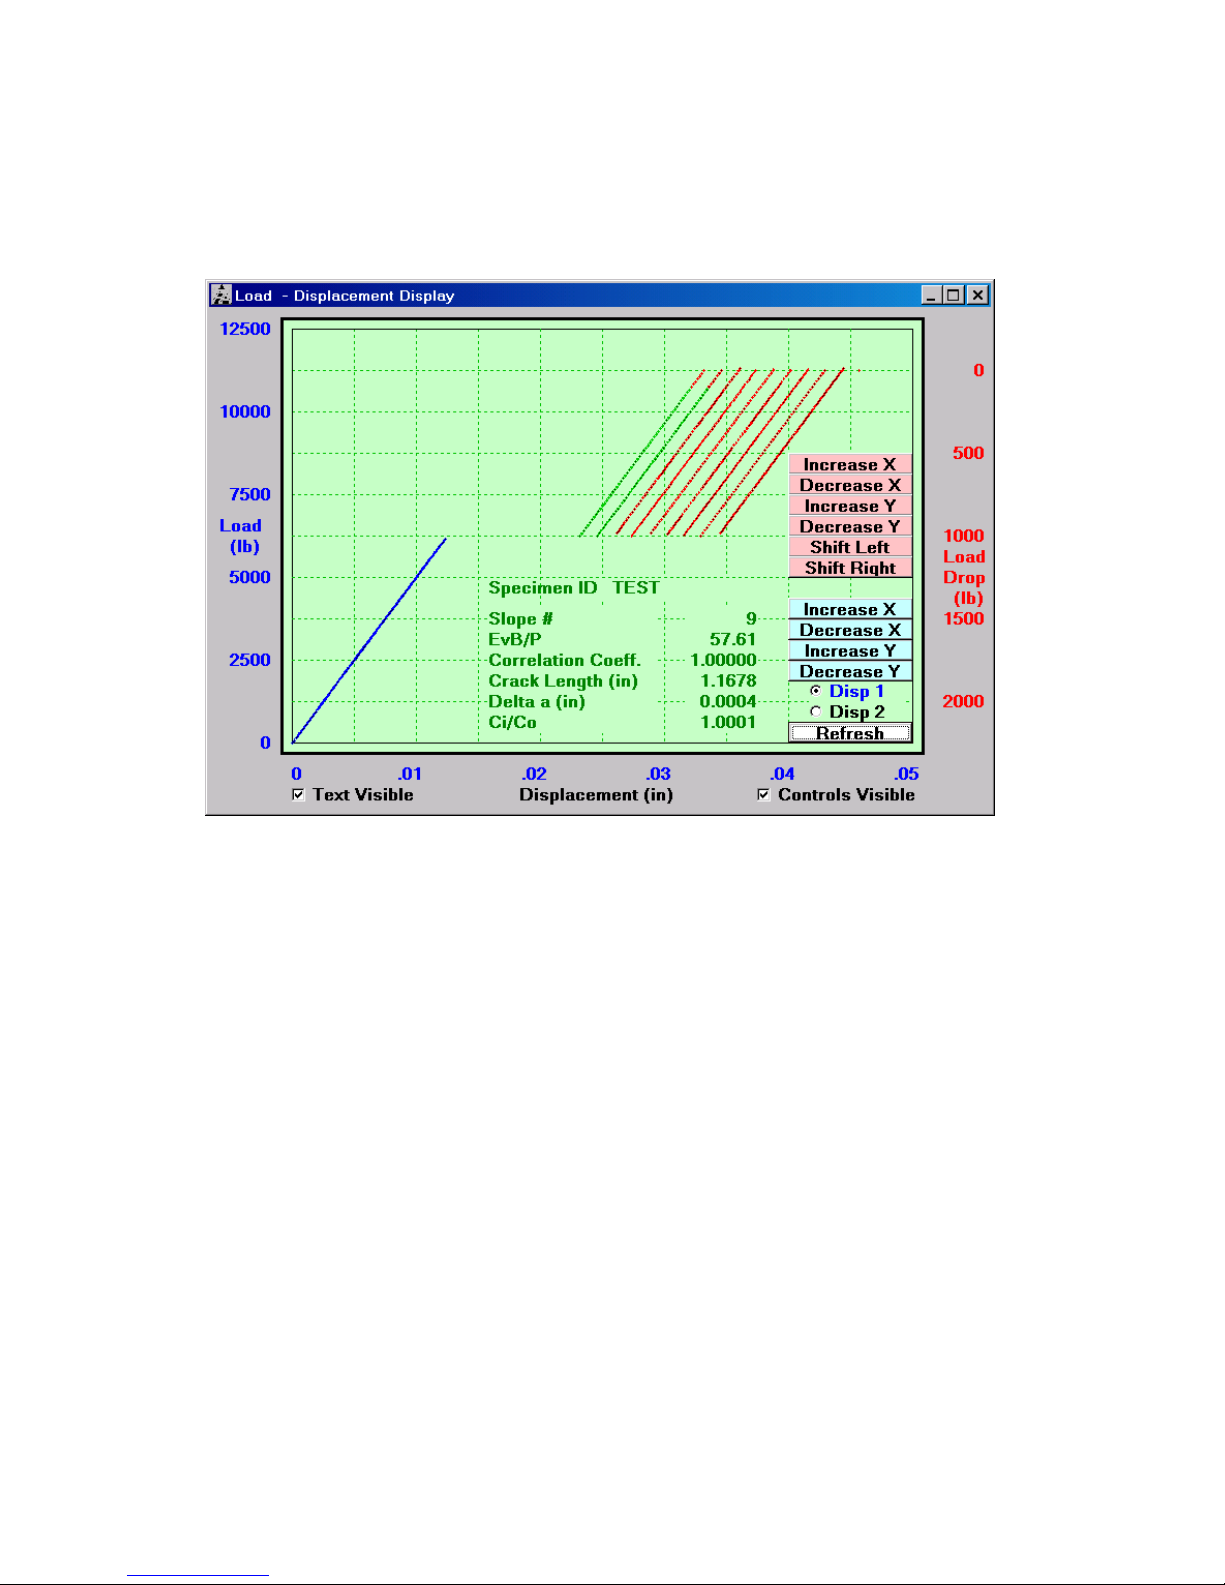
4.6.2 LOAD-DISPLACEMENT
When Load-displacement has been activated under Data Acquisition on the Ramp
Generator, real-time traces of load-displacement (blue) and unloading slopes (green
and red) are plotted on this display. The green portion of the active unloading slopes
indicates the data that are used for slope determination: this ‘window’ is determined on
the Data Acquisition tab of the Data Input form (these data may be edited during
analysis using the Testing Playback software). Note that the unloading slope traces turn
completely red when the pink scaling or Refresh buttons are deployed. This in no way
affects that data that are used in slope determination.
The Disp 1 and Disp2 (Aux 1) selectors allow the user to choose which displacement
channel is displayed.
A variety of scaling and display buttons are available for adjusting the plots in real time:
Increase X increases the full scale of the unloading slopes in the X direction.
Decrease X decreases the full scale of the unloading slopes in the X direction.
Increase Y increases the full scale of the unloading slopes in the Y direction.
Page 64 of 148
NLFT Testing - Series 2015 - V3+.16.01

Decrease Y – Decrease the full scale of the unloading slopes in the Y direction.
Shift Left shifts the unloading slopes to the left.
Shift Right shifts the unloading slopes to the right.
Increase X increases the full scale of the load-displacement trace in the X
direction.
Decrease X decreases the full scale of the load-displacement trace in the X
direction.
Increase Y increases the full scale of the load-displacement trace in the Y
direction.
Decrease Y decreases the full scale of the load-displacement trace in the Y
direction.
Page 65 of 148
NLFT Testing - Series 2015 - V3+.16.01
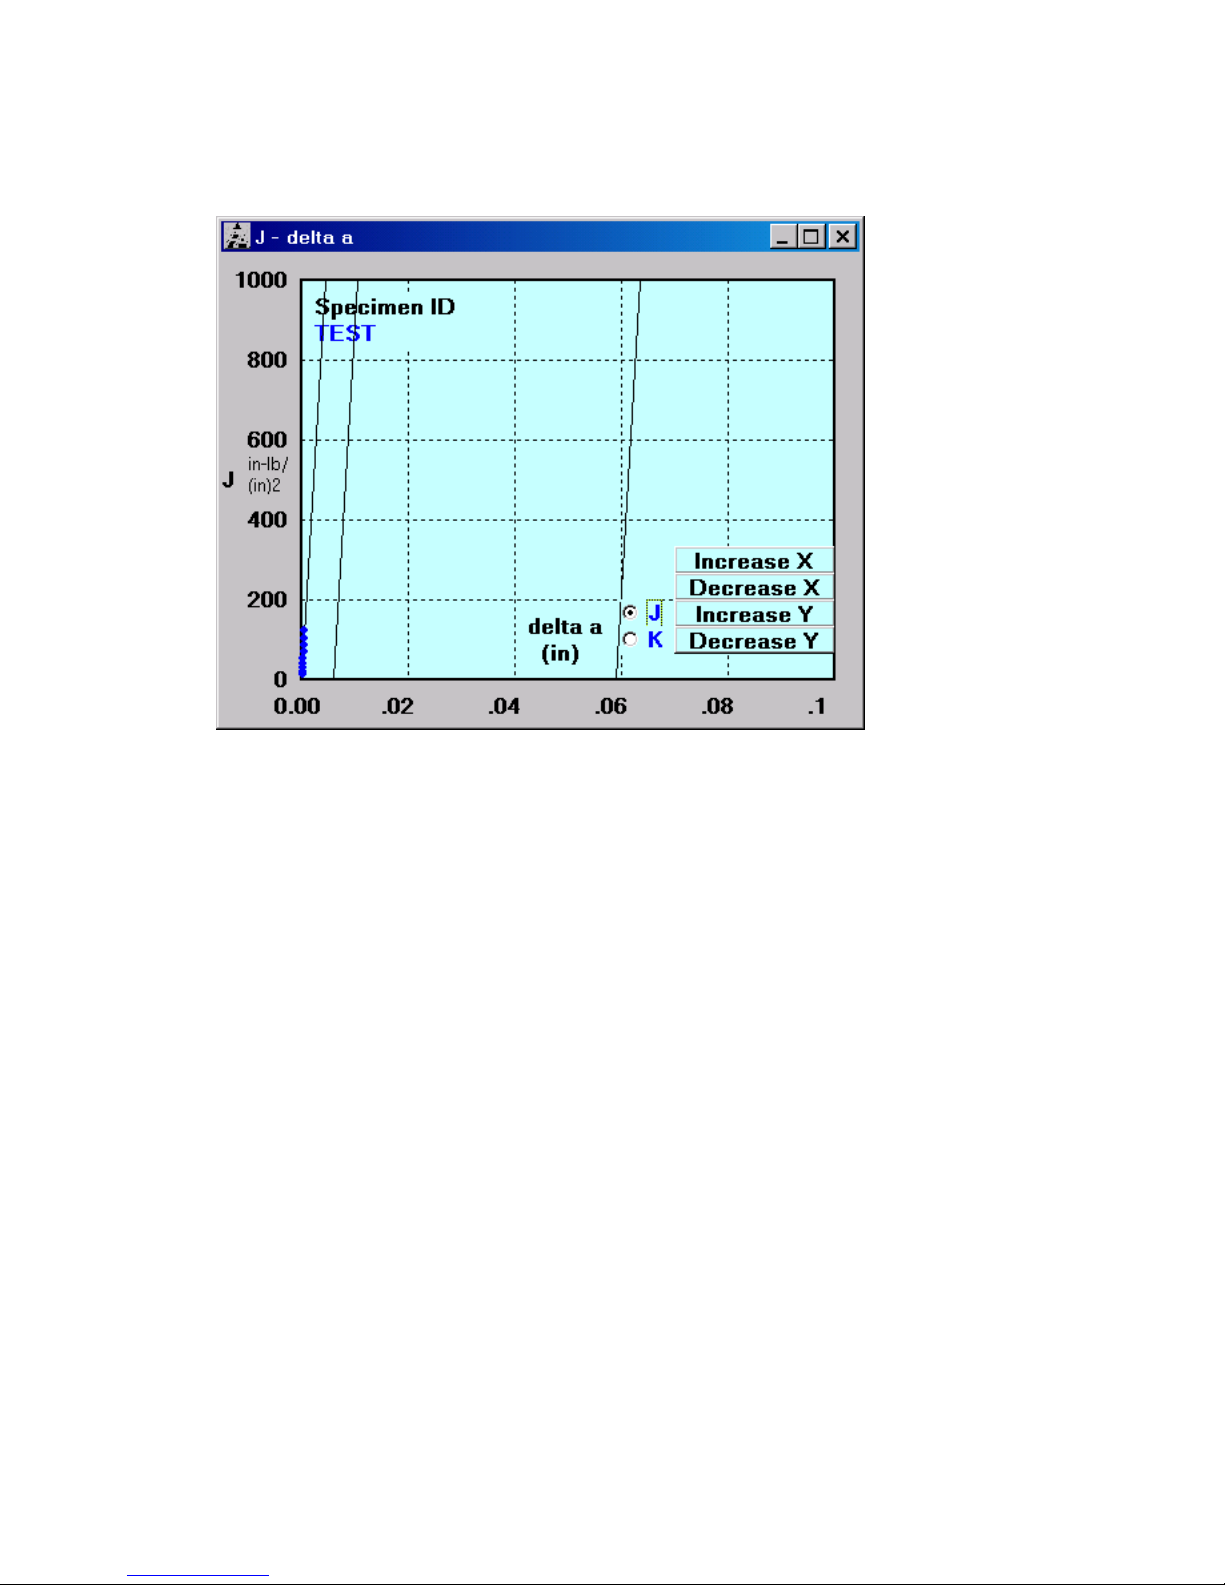
4.6.3 J – DELTA A
The J-delta a display plots a new point after every unload slope or DCPD data
acquisition cycle. Either J or K may be displayed
The three parallel and slanted vertical lines represent the crack tip blunting line and the
minimum and maximum data exclusion limits.
Four options for rescaling the plot are available:
Increase X increases the full scale of the J-a data in the X direction.
Decrease X decreases the full scale of the J-a data in the X direction.
Increase Y increases the full scale of the J-a data in the Y direction.
Decrease Y decreases the full scale of the J-a data in the Y direction.
Page 66 of 148
NLFT Testing - Series 2015 - V3+.16.01

4.7 Comments
This form allows comments to be entered during the test. These comments are stored in
the .in5 analysis file and can be changed during analysis, although they do not appear
in the final Excel workbook.
4.8 Help
A PDF file of this manual is available under the Help menu.
Page 67 of 148
NLFT Testing - Series 2015 - V3+.16.01

Page 68 of 148
NLFT Testing - Series 2015 - V3+.16.01

5.0 USING THE FTA ANALYSIS SOFTWARE
The analysis software is a Visual Basic/Excel editing and analysis package that uses
the raw data from testing and visual crack length observations to perform three fracture
toughness analyses with both tabular and graphical output:
ASTM E1820
E399
E1921 (with an Excel utility for master curve generation)
The following Sections 5.1 through 5.5 provide an explanation of the VB analysis
program’s structure; descriptions of the analysis files; and analysis procedures for each
of the three ASTM standards. Section 6 details the analysis program’s structure,
including a complete description of its menus and tabs. Section 7 describes the Excel
post-processing utility and Section 8 the Testing Playback program.
Only E1820 and E399 analyses are considered here. For details on E1921, please
contact FTA.
5.1 How the NLFT Analysis Program Works
The analysis program is constructed in two distinct parts. Raw data from the test are
first edited, pre-processed, and analyzed by the Visual Basic program. The user then
selects a post-processing option, which calls up a Microsoft Excel utility for data
reduction; calculation of JQ; validation; and plotting. Microsoft Excel v. 2007 or 2010
must have been previously loaded onto the PC for the program to function correctly.
The workbook templates necessary for the utility (nlft.xls and nlft_timed data.xls) are
included with the FTA software.
The Excel utility functions through a combination of four elements.
Visual Basic ActiveX Control is used by the VB program to start Excel and call
the file nlft.xls or nlft_timed data.xls. These files have been extensively
customized for the sole purpose of fracture toughness analysis post-processing.
The worksheets’ cells are populated with information and formatting statements
from the VB analysis program via a one-way communication link. The Excel utility
must be exited before a new file can be analyzed in the main VB program.
VBA (Visual Basic for Applications) enables the use of macros within Excel to
expand the capability of basic worksheet features and automate repetitive tasks.
The macros are invoked by pressing the analysis button on the Raw Data sheet
in the Excel file. The macros used for the various analysis types can be viewed
using the Tools menu in Excel.
Excel worksheets are used to display tabular data, hold variables, perform
calculations, and make logic decisions. The nlft.xls workbook contains from five
Page 69 of 148
NLFT Testing - Series 2015 - V3+.16.01

to seven worksheets, depending upon the analysis type (E1820 or E1921). The
user may view all the worksheets by opening the nlft.xls file. The nlft.xls file
should never be overwritten by the user but always saved under a new name
(usually the TEST ID).
Excel file: one standard Excel file is dedicated to each analysis option or test.
5.2 Understanding the Files Used by the Analysis Program
At the end of a test, analysis (.in5) files must be saved from within the testing program
using the Save Analysis File As Version 3 command. This .in5 file is loaded into the
analysis program for editing and processing. Once edited within the VB program, it is
saved as an .in6 file, thus preserving the unedited .in5 file. Initial processing produces a
.dat file, which is subsequently called (together with the .raw file) by the Excel utility for
final processing. The analysis program’s final output consists of an Excel workbook
including a cover page; tabular data, and plots.
A review of the files required and produced by the analysis program follows:
Analysis file (.in5 extension): data produced by the testing program and required
for the NLFT analysis program. This file remains unchanged by analysis, thus
preserving the unedited data.
Edited analysis file (.in6 extension): edited .in5 files are saved by the analysis
program with the new .in6 extension. These files will include visual crack length
measurements, edited data points, and initial choices for analysis and data
reduction.
General Information file (.gn2 extension): general information not required for
testing, but that may be common across tests (such as test temperature or
material description). These optional files may be loaded, modified and saved by
by the analysis program as well as the testing program.
Log file (.log extension): details of the test including test parameters and data
that are part of the analysis file (.in5).
Load-displacement Data file (.raw extension): elapse time; load; displacement;
and auxiliary channel information recorded engineering units.
Unloading Data file (.unl extension): calibration factors and the voltages of the
load-displacement unloading slopes. These files are typically only required when
using the Playback software.
Page 70 of 148
NLFT Testing - Series 2015 - V3+.16.01

In addition, two customized Excel templates are provided, which are called up by the
Post Processing option in the VB software. These files should never be altered but
always saved under a new name after data analysis (typically the Test ID):
Non-Linear Toughness Report Template (nlft.xls): used for non-linear J-R
analyses, production of test reports and graphs, and performance of validity
checks
Load Disp and Linear Toughness Report Template: (nlft_timed data.xls) used
for linear KIC analysis and the production of load-time and load-displacement
plots for E1820 and E1921 analyses.
The following sample analysis files are included with FTA’s analysis software so users
may practice when no actual test data are present:
TEST1.IN5: an unedited data file based on an E1820 compliance test
TEST1.IN6: the above data file edited to include visual measurements and edited
data points.
TEST1.DAT: the analysis program’s E1820 output from the above test
TEST1.RAW: the load-displacement data file associated with the above test
TEST1.UNL: the unloading data file associated with the above test
TEST1KIC.IN6: the TEST1.IN5 data file edited for E399 analysis.
TEST1KIC.DAT: the analysis program’s E399 output from the above test
Each of these files may be opened for editing/analysis and saved under a different
name.
5.3 E1820 Analysis Procedure
1. Start the program NLFT Analysis and press Continue on the Splash Screen.
Note the Main Form with its eight tabs of information (see Section 6 of this
manual for a full discussion of the menus and forms associated with the analysis
software). The Control tab is foremost.
2. On the Control tab, select the Unit Type.
3. From the File menu select Open → Analysis Input File.
4. Open the file Test1.in6, which may be found in the NLFT program directory.
5. Return to the File drop own list and Open the Load-displacement Data (.raw)
file Test1.raw, which also may be found in the NLFT program directory.
6. On the Control tab, select the Analysis Option (eg ASTM 1820) appropriate for
the test. If a general file already existed, that could also be loaded from the
Control tab.
7. Go to the Coefficients tab. Note that these values are part of the analysis file
and should not be changed.
Page 71 of 148
NLFT Testing - Series 2015 - V3+.16.01

8. Go to the General tab. Check general information (labeled in blue) and edit as
required. Note that values in red will affect the analysis results and should only
be changed with caution. Some general information (such as precrack load, for
example) is required for the Excel utility to generate validity statements.
9. Go to the Dimensions tab. The only dimension that may be changed is notch
length, which is part of the general file.
10. Address the Visuals tab. Here is where visually-measured crack lengths
(Precrack and Final crack) are entered. For E1820 and E1921 analyses, nine
measurements are required for each and the number nine must be entered in the
text box at the top of each column. If no crack extension is visible on the
specimen, the precrack measurements should be entered in the final visuals
fields. The Test1.in6 file already contains visual measurements.
Also on the Visuals tab, evaluate the two corrections options. Recall that for
E1820 the improved aoq correction is mandatory. For an E813 analysis, an
improved aoq is not used, however, the effective modulus is required. Be sure
to consult the correct standard before selecting options.
11. Additional notes may be entered on the Comments tab, although these will not
appear on the Excel output.
12. On the Data tab, note that the characteristics of each data point may be
examined by scrolling through the file using the Back and Forward buttons. This
tab has limited use before the data are pre-processed.
13. Finally, address the Load-Disp Data tab, where the .raw data may be filtered
and the pre-processing results displayed. This tab also has little meaning before
pre-processing.
14. Return to the File drop down list and Save the Edited Input Analysis File. This
gives the edited file a .in6 extension, thus preserving the original .in5 file. It is
wise to work subsequently with the .in6 file to save the time required by reediting.
15. The general (.gn2) file may be saved or updated at this point by pressing the blue
Save General Info button on the Control tab.
16. It is time for pre-processing the data. Press the Run Non-Linear Analysis button
at the bottom of the Main Form. A message will appear prompting the user to
save the resulting .dat file. The .dat file must be saved or the program will crash!
17. The J-delta a plot will appear in a new window. Note that each point on the plot
can be selected by scrolling through the indeces on the Data tab of the Main
Form. Selected points are shown in green on the J-delta a plot. Errant points
may be excluded from analysis by activating the Exclude Data box on the Data
tab. The point can be reintroduced into the analysis by deactiving the box. Use of
the Delete option is not recommended, as this deletes the point entirely from the
file.
18. Go to the Visuals tab and ensure the Actual delta a (which was calculated from
the manually-entered visuals) corresponds with the Predicted delta a
Page 72 of 148
NLFT Testing - Series 2015 - V3+.16.01

(determined from compliance or DCPD measurements during testing). This
check helps ensure no typos occurred during data entry.
19. The contents of the .dat file produced during pre-processing may be viewed in
the Output window.
20. Further editing may be required after the pre-processing results have been
inspected. This may be done as before, remembering that the updated file must
always be saved with its .in6 extension. The Run Non-Linear Analysis button
should be pressed after each iteration to ensure the most recent .dat file is sent
to the Excel utility.
21. To pre-process the load-displacement data (for the production of Load-
displacement or Load Time plots later on), press the blue Process Load-Disp
Data button at the bottom of the Main Form. The results will be shown on the
Load-Disp Data tab and the data filter accordingly. See Section 6.3.8 for a
discussion of the Load-Disp Data tab.
22. When the pre-processed results are satisfactory, call up the Excel utility to finish
the analysis. Go to the Post Processing drop down list at the top of the Main
Form and choose Non-Linear Report. This calls up the Excel workbook nlft.xls
and populates it with the .dat file.
23. After a few seconds, the Excel workbook will appear. Press the grey button
ASTM 1820 JIC to perform the regression analysis. A complete seven-worksheet
record of the test will appear.
24. This file must be saved with a new file name, typically the TEST ID. The original
template nlft.xls must be preserved. Resist all prompts to save the changes to
the original file!
25. After saving the new Excel file, examine the worksheets in turn to view their
contents, which include a cover page, program output, and a plot. These
worksheets are not usually edited, although plots may be scaled as required.
This file serves as the printable record of the test. See Section 7.1 of this manual
for a full discussion of the Excel workbooks’ worksheets.
26. If a Load-Displacement and/or Load Time plot is required, return to the main VB
program and the Post Processing drop down list. Choose Load-Disp and
Linear Report, which calls up the nlft-timed data.xls Excel workbook. The
required plots may be found among the worksheets of the resulting populated
workbook and saved under a new name as before (see Section 7.2 for full
details).
Page 73 of 148
NLFT Testing - Series 2015 - V3+.16.01

5.4 E399 Analysis Procedure
NB The sample data files included in the NLFT Analysis program directory (Test1.in6
and Test1.raw) are drawn from the same test provided for the E1820 sample analysis
session and will not produce a valid KIC result.
1. Start the program NLFT Analysis and press Continue on the Splash Screen.
Note the Main Form with its eight tabs of information (see Section 6 of this
manual for a full discussion of the menus and forms associated with the analysis
software). The Control tab is foremost.
2. On the Control tab, select the Unit Type.
3. From the File menu select Open → Analysis Input File.
4. Open the file Test1.in6 and select the ASTM E399 analysis option.
5. Treat the first seven tabs as in the E1820 sample analysis session described in
Section 5.3.
6. Go to the Load-Disp Dat tab and activate the 3 Column Raw Data File Format
at the lower right.
7. Return to the File drop own list and Open the Load-displacement Data (.raw)
file Test1.raw, which may be found in the NLFT program directory.
8. It is not necessary to press the Run Non-Linear Analysis button.
9. Press the Process Linear Data. The KIC Utility tab should look like the one
below.
Page 74 of 148
NLFT Testing - Series 2015 - V3+.16.01
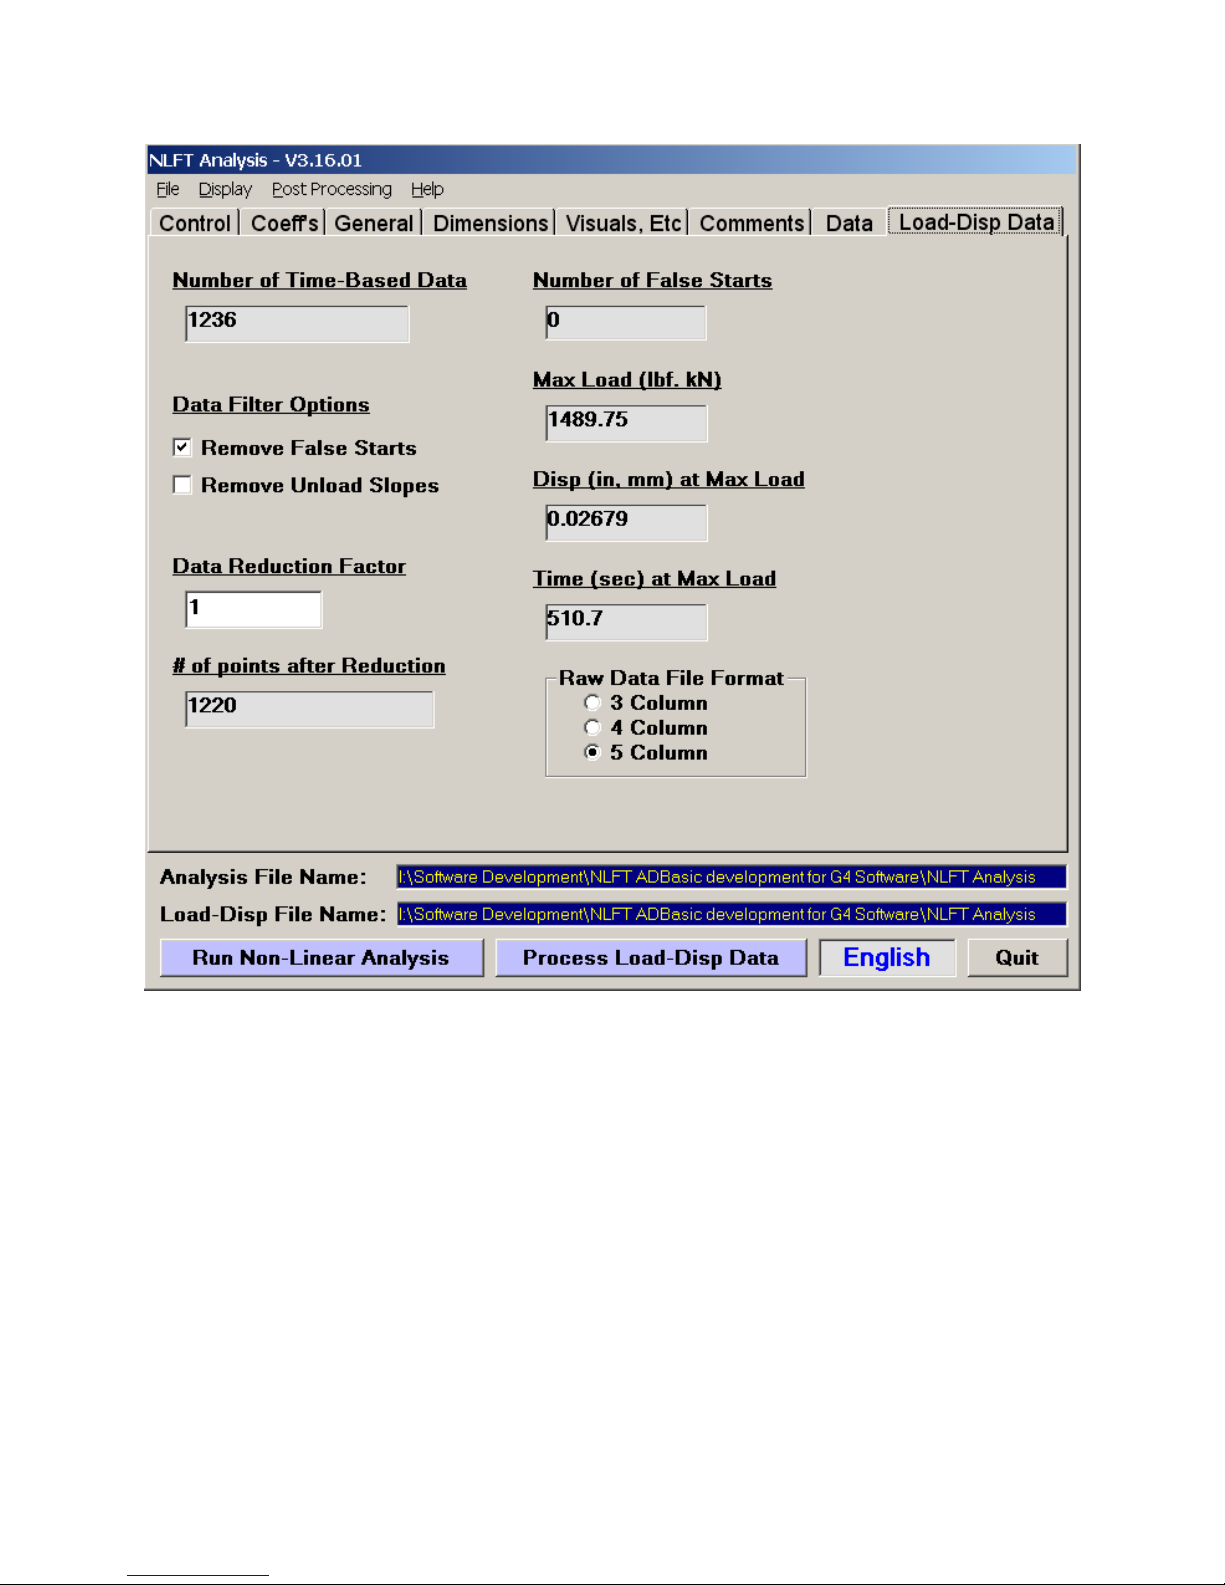
10. From the Display menu select Load-Displacement, where the pre-processing
result may be viewed. Select the Filter option on the plot to see what effect
changing the Data Filter Options or changing the Data Reduction Factor has
on the display, pressing the Process Load-Disp Data button after each change.
11. When satisfied, call up the Excel utility by going to the Post Processing drop
down list and selecting Load Disp and Linear Report. Wait a few seconds while
the workbook is populated with the pre-processed data.
12. On the User Input sheet select the Upper and Lower limits for the regression
and press Calculate KIC. At the completion of this step, return to the User Input
sheet. It should look like this:
Page 75 of 148
NLFT Testing - Series 2015 - V3+.16.01

13. Other worksheets such as the Cover Page appear much as the E1820
worksheets.
Page 76 of 148
NLFT Testing - Series 2015 - V3+.16.01
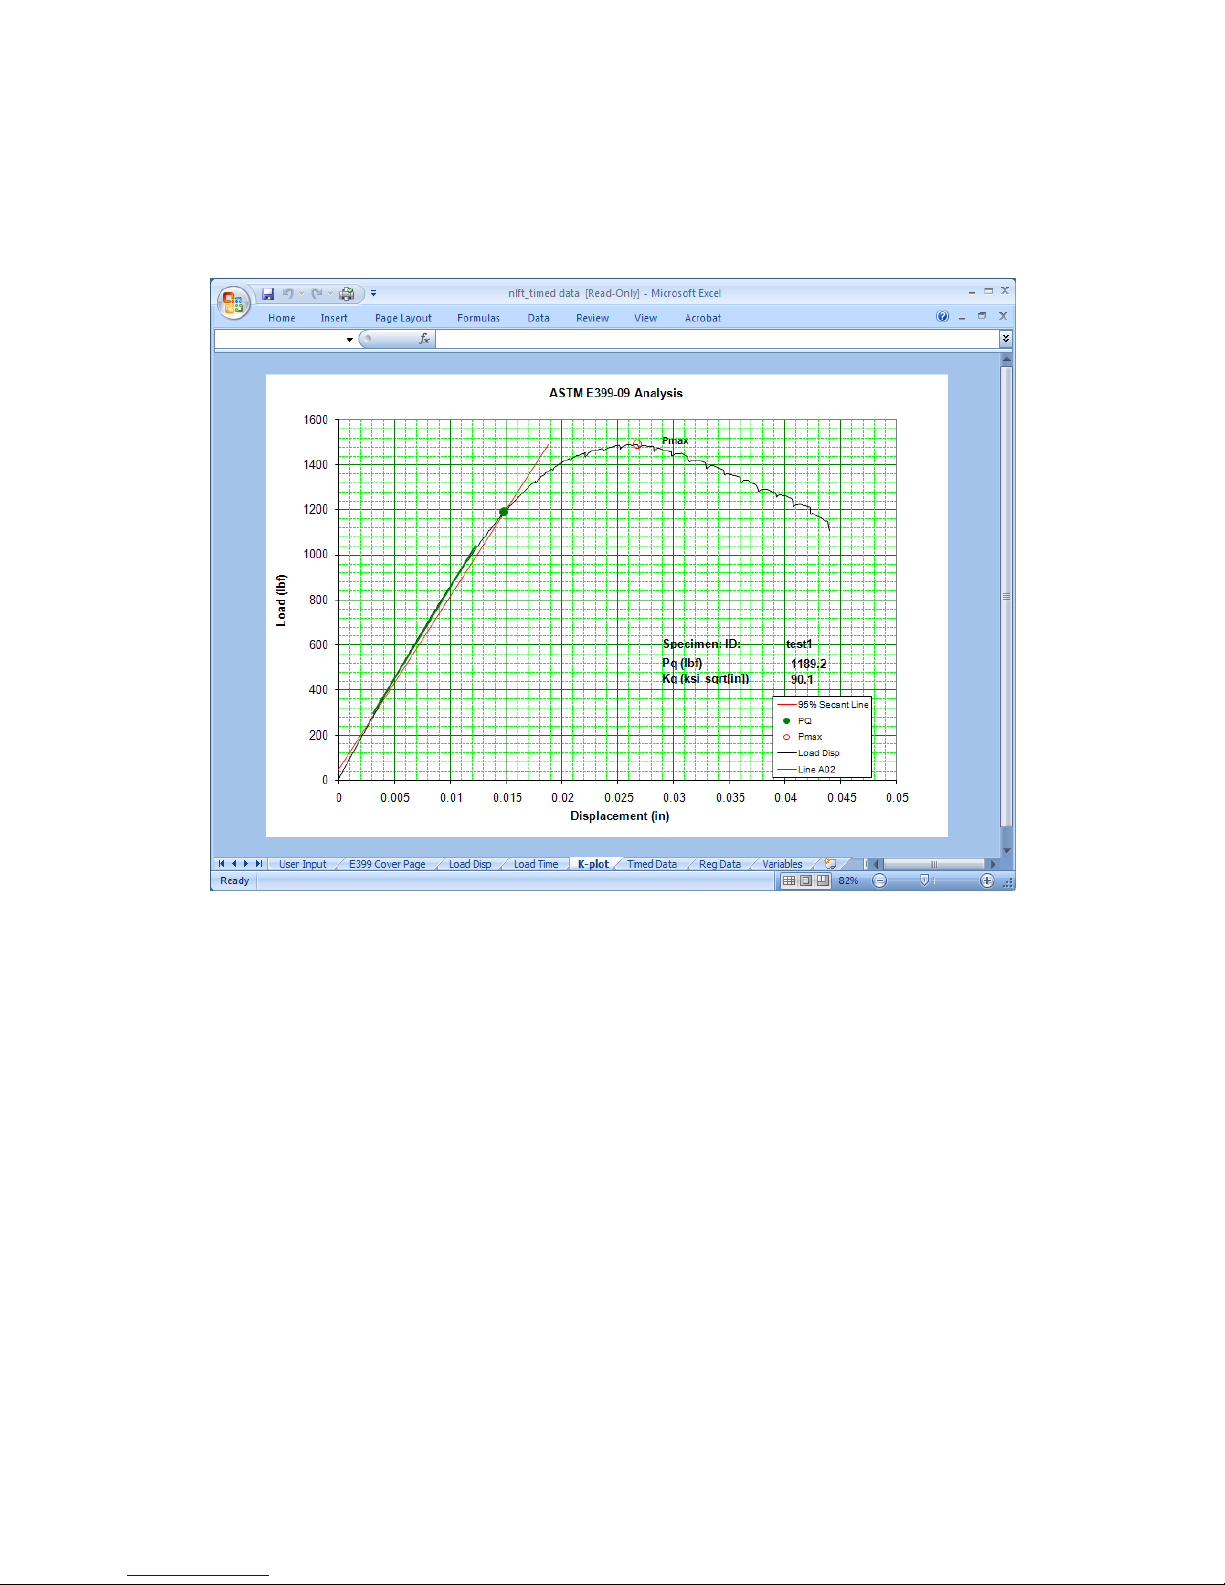
14. If the linear fit of the K-plot is improper, return to the User Input sheet and select
different regression limits. Press Calculate KIC again .
15. The finished file must be saved with a new file name, typically the TEST ID. The
original template nlft_timed data.xls must be preserved. Resist all prompts to
save the changes to the original file!
Page 77 of 148
NLFT Testing - Series 2015 - V3+.16.01

Page 78 of 148
NLFT Testing - Series 2015 - V3+.16.01
6.0 NLFT Analysis Software: Description of Menus and Tabs
6.1 Splash Screen
The Splash Screen is displayed upon start-up. The application and version number are
displayed on this screen. Click Continue to proceed to the Main Menu.
6.2 Main Form: Menu Items
Data are edited, preprocessed, and prepared for export into the Excel utility using the
File options and eight tabs of the Main Form. The Post Processing routine accessed
from the drop down list at the top of the form is not discussed until the end of this
section, since it is the last step before calling up the Excel utility.
Page 79 of 148
NLFT Testing - Series 2015 - V3+.16.01

6.2.1 FILE
The File drop down list allows the opening and saving of Input (.in5) files as well as the
saving of .dat files in English or metric units. One may also Exit the analysis program
from the File menu.
Both input and output files are standard ASCII files that may be examined and modified
with a Windows-based text editor such as NotePad. When editing files with an editor, be
sure to save the file with the correct extension (.in6 or .dat). Choosing the ‘All Files’ type
when saving preserves the current extension even if the name has been changed.
Otherwise, the modification may render the extension incompatible with the analysis
software.
Page 80 of 148
NLFT Testing - Series 2015 - V3+.16.01

6.2.1.1 Open
This menu option allows both opening of Analysis Input (.in5 or .in6) files and Load-
displacement Data (.raw files). Before opening a file, the user must select the Unit
Type. This selection is independent of how the test was run.
Open Analysis Input Files: only files with .in5 or .in6 extensions are recognized
by the analysis program. Analysis files with the .in5 extension are created by the
testing software. The .in6 extension is used for files that have already been
edited with the analysis software.
Open Load-displacement Data: load-displacement (.raw) files are only needed
for the creation of Load-Displacement or Load-Time plots and KIC analyses.
Only files with the .raw extension are recognized by the analysis software.
6.2.1.2 SAVE
Save Edited Input Analysis Files saves the edited analysis files with the .in6
extension. This distinguishes the new edited file from the original .in5 file
produced by the test software. Each time an input file is edited, the previous file
is overwritten unless the name is changed.
Save Output As: after pre-processing, output files are stored with the .dat
extension for use by the Excel utility. Used if default output (English or Metric) is
not desired. Output (.dat) files are also saved automatically when the user
presses the Run Non-Linear Analysis button at the bottom of the menu.
6.2.2 DISPLAY
This menu option selects the J vs. a; Output; and Load-displacement screens.
These screens appear after the data have been pre-processed, but if they are
accidentally closed by the user, they can be reopened using this menu.
6.2.3 HELP
A .pdf version of this manual appears under the Help menu.
6.2.4 QUIT
In addition, the user may exit the analysis program at any time, by pressing the Quit
button at the bottom of the Main Form. This button is visible from any of the Main Form
tabs. The user will be prompted to save input and output as appropriate.
Page 81 of 148
NLFT Testing - Series 2015 - V3+.16.01

6.3 Main Form: Tabs
Analysis (.in5 and .in6) files are examined and edited on the eight Main Form tabs. In
some cases, editing will be necessary after the first pre-processing routine and
examination of results. For example, if some early data pairs are shown not to be
appropriate, they may be excluded from subsequent analysis. Editing procedures are
explained in the following sections.
On the Main Form tabs, labels in blue indicate areas where user modification is
expected. Changes to text boxes labeled in red will affect the test results.
6.3.1 CONTROL
Page 82 of 148
NLFT Testing - Series 2015 - V3+.16.01

The Control tab is foremost on the Main Form and is the first to be addressed when
the form is opened.
The selection of Unit Type is mandatory before loading a file and is independent of the
units selected during the test.
An Analysis Option must be selected before running an analysis, as it determines the
equations that will be applied to the data set.
ASTM E1820 is based on the 2010 standard
ASTM E1921 is based on the 2009 standard. The user must specify whether or
not unload slopes were used during the particular E1921 test being analyzed.
ASTM E399 is based on the 2009 Standard.
Additional Options:
Override J Limit allows data that exceeds J
(E1820) to be used in the
limit
regression analysis of the J-R curve to determine a provisional J value.
However, data outside the exclusion lines are not used.
Calc[ulate] Tearing Modulus performs a tearing modulus calculation by
linearly fitting the data used for the J regression. This includes only the data
between the exclusion lines, but may include data that exceeds J
Limit
if
Override J Limit is activated.
The Input Filter allows the user to discriminate between .in5 and .in6 extensions when
searching for an analysis file. This is particularly useful when re-analyzing data, where
the user might accidentally load an .in5 file that doesn’t include visual measurements
and edited data pairs. If neither box is selected, both file types will be displayed.
The right-hand side of the form indicates the K-Calibration Type, PD calibration Type,
and Test Type. These characteristics were established during test time and are part of
the analysis file. These options cannot be changed.
The Load PD Look-up [table] option at the bottom of the form is used for non-standard
geometries. When pressed, the same user-defined DCPD – crack length calibration file
(.dat extension) that was used during testing may be loaded into the analysis program.
Page 83 of 148
NLFT Testing - Series 2015 - V3+.16.01

For DCPD tests that used a reference probe, the user may run the DCPD Analysis with
or without including the reference probe data.
The Disp[lacement] for J Analysis option allows the user to select data collected from
either displacement channel (IN2 or IN3 on the ADwin, identified as Disp 1 and Disp 2
in the testing software).
Disp 1, CMOD is the standard setting for testing C(T) specimens using
compliance as the crack monitor. Also, it can be used for the special case of
SEN(B) testing when the crack mouth opening displacement is measured with a
clip gage on the specimen and converted to a theoretical load line displacement.
Disp 2, Load line is the typical setting for a bend bar SEN(B) test. It should be
selected if the displacement from the LVDT is fed into Input 3 on the ADWIN
Gold and used as the primary displacement for J analysis.
Disp 1, Load Line is a special case for SEN(B) tests. This is used when the
crack monitor type is DCPD. Also the load line displacement signal is fed into
Input 2 on the ADWIN Gold and used as the primary displacement for J analysis.
The user can also make use of general information (.gn2) files at analysis time:
By pressing Read General Info. the user can load a general information (.gn2)
file , which populates the input fields with contract and test condition information
common to all specimens in a test group (the blue labels on the General tab).
Although this information is not critical to the analysis, time can be saved by
loading repetitive information in this way. The .gn2 file can be created during the
test or by completing the input fields in the analysis program.
By pressing Save General Info. after filling in the blue input fields, the user may
save or update the .gn2 file at analysis time. Subsequently, the information can
be read into further analyses in the same test group to streamline input (see
above).
Page 84 of 148
NLFT Testing - Series 2015 - V3+.16.01

6.3.2 COEFF[ICIENT]S
The Coefficients tab of the Main Form allows examination of K, Stress Intensity;
a/W, Compliance; and, if applicable, a/W, DCPD coefficients. None of these values
should be changed unless an incorrect coefficient is detected. Although errors may be
remedied here, the user should perform a cause-and-effect analysis of any such
alteration to the data.
When analyzing fracture-toughness test data collected using the potential drop
technique, compliance is back-calculated from known values of a/W. For ASTMrecommended geometries, the equations are embedded in the code. See ASTM E1820
for more detail.
Page 85 of 148
NLFT Testing - Series 2015 - V3+.16.01

6.3.3 GENERAL
The General tab contains information that will appear on the cover page of the Excel
analysis spreadsheet. Blue labels indicate information that may need to be entered by
the user if it was not entered at test time. These fields can be automatically populated
by reading in an existing .gn2 file.
Many of these data are for information purposes and do not affect the analysis. The
Test Modulus, however, does affect the analysis, and so is shown in red. Also, Tensile
Stress and Yield Stress are required to calculate flow stress and determine limit loads.
Although estimates may have been used during testing, these values may be changed
at analysis time.
Page 86 of 148
NLFT Testing - Series 2015 - V3+.16.01

Precrack Load, Precrack Stress Ratio, and Precrack Length are used to determine
the final K level attained during precracking. These are also used for validity checks. K
will be calculated based on B
eff
.
Page 87 of 148
NLFT Testing - Series 2015 - V3+.16.01

6.3.4 DIMENSIONS
Most of the information on the Dimensions tab was entered at test time and may not be
changed. An exception is specimen notch length, which is part of the .gn2 file.
Page 88 of 148
NLFT Testing - Series 2015 - V3+.16.01

6.3.5 VISUALS, ETC.
Visual measurements of precrack and final crack length (after heat tinting or specimen
failure) are added manually by the user on the Visuals tab. Up to eighteen
measurements for E 1820 and E1921 analysis may be entered (nine Precrack and nine
Final crack), but the user must be sure to enter the total Number of Measurements for
each column, as above. Five measurements only are required for E399 analysis so
most of the text boxes are inactive when this option is chosen on the Control tab. The
a1 and a9 values are weighted 50% compared to the others.
Two additional operations for data pre-processing are available:
Calculate improved aoq is required for E1820 analysis. When the box is
activated, J-da pairs from 0 to Pmax are shifted about the blunting line by
Page 89 of 148
NLFT Testing - Series 2015 - V3+.16.01

adjusting the starting crack length, aoq. The value of aoq is found by solving the
equation:
a = aoq + J/(2y) + BJ2 + CJ3
Calculate effective modulus calculates an effective modulus that corrects the
crack lengths measured at test time with the visually-measured post-test values.
This effective modulus is displayed in the Excel Report after post-processing.
Three Intermediate Results are displayed when the data have been pre-processed (by
pressing the Run Non-Linear Analysis button at the bottom of the form). These values
provide an initial indication of the validity of the test and help ensure all entered values
are correct.
Initial Crack Length Correction Factor: a multiplier used to adjust the effective
modulus so that compliance-measured crack length equal the visually-measured
values. Values are typically between 0.9 and 1.1.
Actual delta a: the difference between the initial and final crack length
measurements as visually-measured after the test.
Comp or DCPD predicted delta a: the difference between the initial and final
crack length measurements as determined during the test by compliance
unloading slopes or by DCPD data acquisition.
Page 90 of 148
NLFT Testing - Series 2015 - V3+.16.01
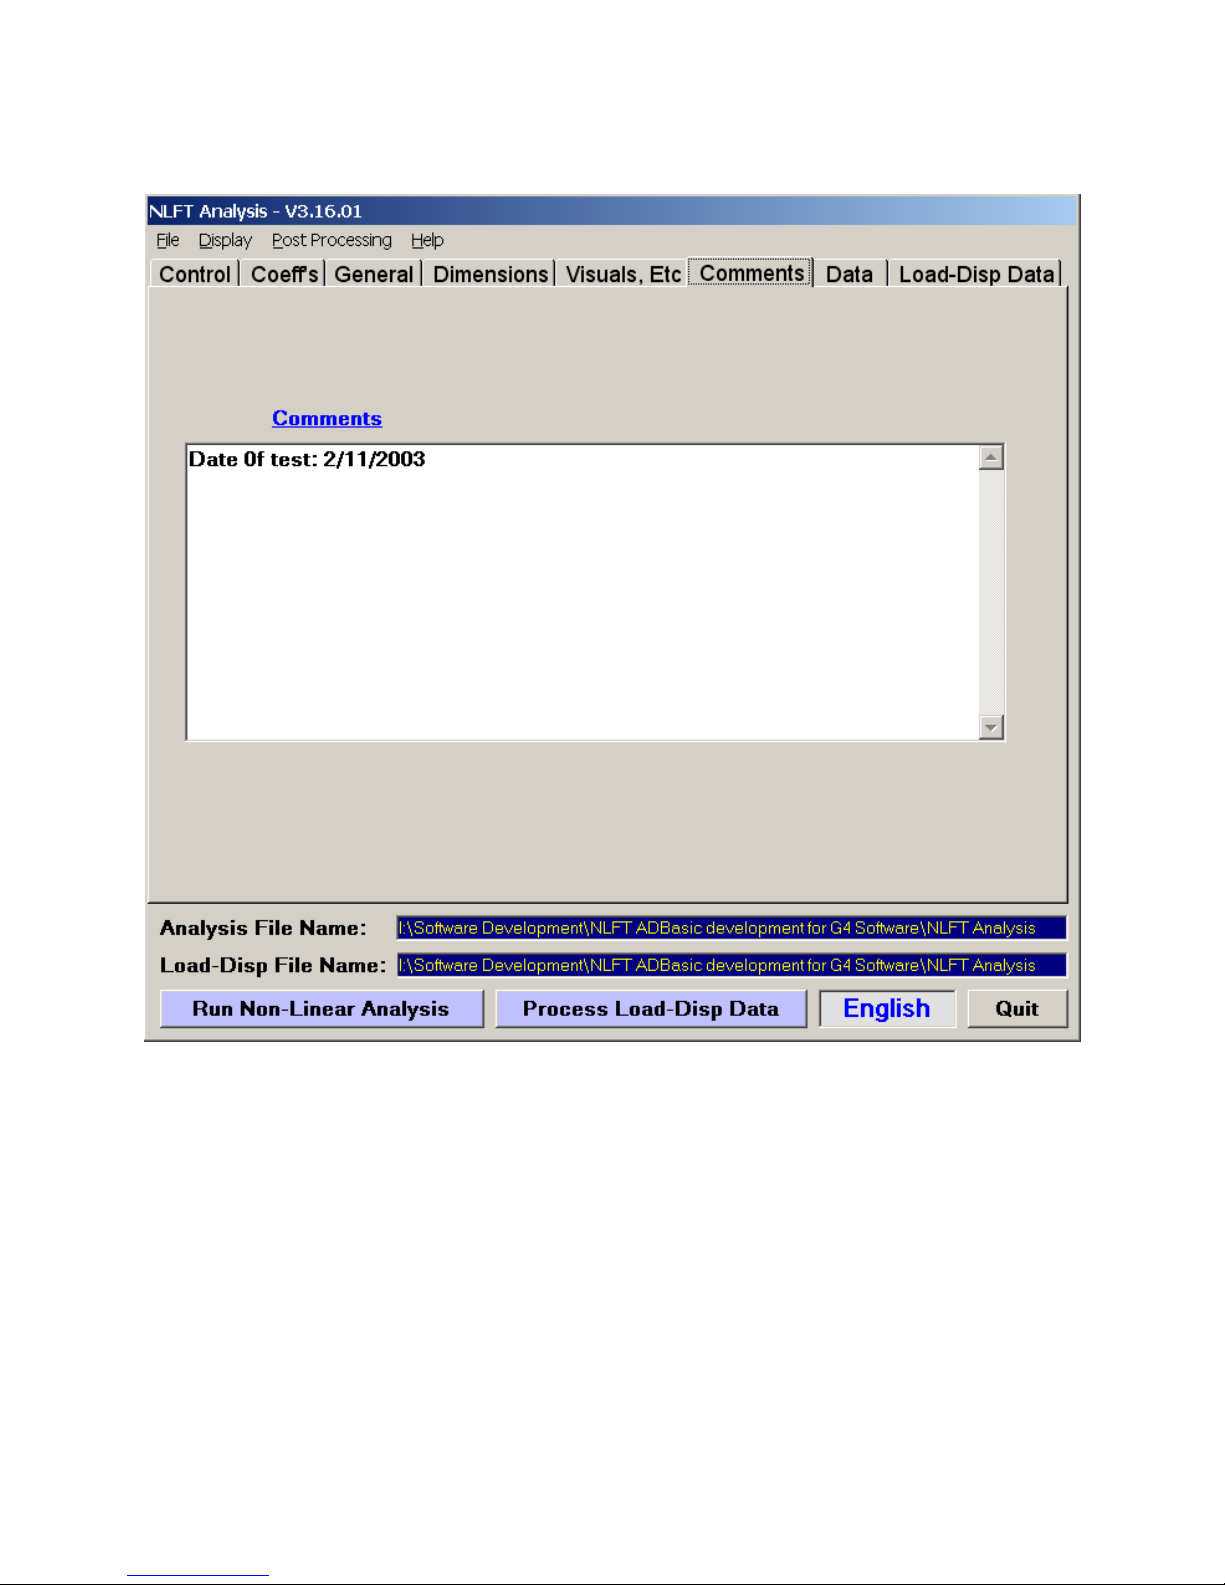
6.3.6 COMMENTS
Comments may be added to the analysis file on the Comments tab, although the
comments will not appear in the final Excel workbook or cover page of the test.
Page 91 of 148
NLFT Testing - Series 2015 - V3+.16.01

6.3.7 DATA
The Data tab is used for viewing and editing the data points in the analysis file.
Characteristics of each point are displayed in the white text boxes with its assigned
index at the top.
It is usually necessary to pre-process the data to determine whether editing is
appropriate: after pressing the Run Non-Linear Analysis button, the points may be
viewed on the J - Δa Display. The active point is shown in green on the display of blue
data points.
Use the command buttons Back One/Ten and Forward One/Ten to examine the
contents of each text box. The Insert/Delete check boxes, in combination with the
Activate Ins/Del command button, may be used to remove data points from the
analysis file. However, it is safer to merely exclude the points from the analysis (rather
Page 92 of 148
NLFT Testing - Series 2015 - V3+.16.01

than the file itself) by using the Exclude Data feature: this way, points are easily reintroduced into the analysis by deactivating the Exclude feature. Ticking the Carry
checkbox allows actions such as Delete or Exclude to be carried across data points by
pressing Back One/Ten or Forward One/Ten.
Page 93 of 148
NLFT Testing - Series 2015 - V3+.16.01
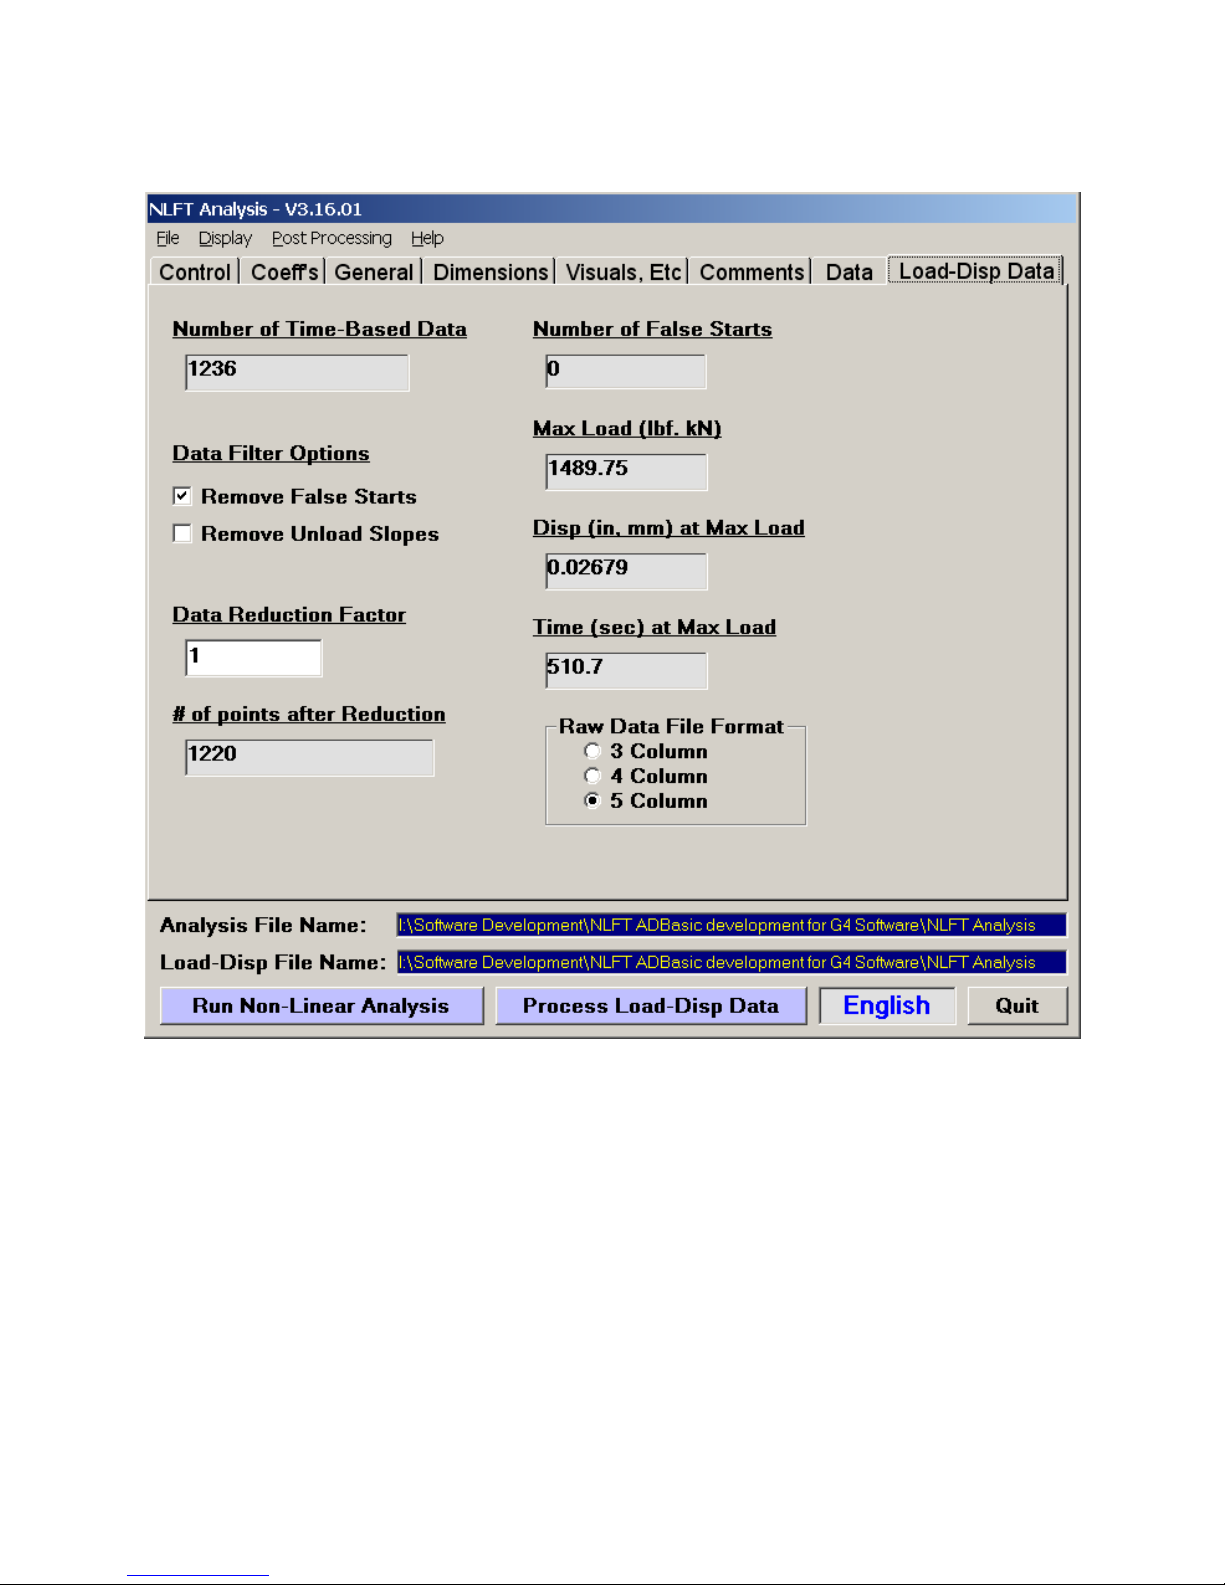
6.3.8 Load-Disp Data
The Load-Disp Data tab displays the pre-processing results of the load-displacement
analysis, achieved by pressing the Process Load-Disp Data button at the bottom of the
form. These results should be examined and filtered before post-processing the data
and producing the Excel Load-Disp Linear Toughness Report.
Pre-processing results can be viewed in the text boxes Number of Time-Based Data;
Number of False Starts; Max Load; Disp[lacement] at Max Load; and Time at Max
Load.
A number of Data Filter Options enable editing of the load-displacement data:
Page 94 of 148
NLFT Testing - Series 2015 - V3+.16.01

Remove False Starts: when activated, this option filters any restarts from the the loaddisplacement (.raw) file. For example, if the elapse time in the file shows a decrease,
this is an indication that the test was restarted and any previous data are ignored.
Remove Unload Slopes: when activated, only increases in displacement are
processed, thus removing unloading slopes from the load-displacement curve.
Data Reduction Factor: the total number of load-displacement pairs to be processed
can be reduced by the factor entered.
Recent releases of this software are formatted for five columns in the .raw file (elapsed
time, load, disp1, disp2, auxiliary) even if storage of less than five columns was
indicated when the test was run and the data collected. The unused columns are
separated by commas. However, earlier versions may only have three or four columns.
For this reason, the number of columns in the file can be selected under Raw Data File
Format. If the number is unknown, the file should be opened with a text editor or Excel
to determine the correct option. If the data do not process with the default setting of five
columns, running it with three or four columns may prove more successful.
Page 95 of 148
NLFT Testing - Series 2015 - V3+.16.01

6.4 Processing The Data
6.4.1 RUN NON-LINEAR ANALYSIS
The Run Non-Linear Analysis button is located at the bottom of the Main Menu and is
visible on all the tabs. When this button is pressed, the loaded .in5 or .in6 file is preprocessed and a non-linear fracture toughness analysis performed, producing a .dat file
and populating the J-a display. For a complete JIC analysis and associated printout,
the Post Processing option on the Main Form must be deployed, sending the .dat file
to the Excel utility.
After pre-processing (but before post-processing), it is useful to examine the J-a
display for any errant data points, which may be edited using the Exclude Data option
on the Data tab. It is also a good idea to review the predicted and actual a values on
the Visuals tab to ensure the manual entries in the Precrack and Final Visuals
columns make sense. If any changes are made, it is important to resave the file and run
the pre-processing routine again before calling up the Excel utility.
6.4.2 PROCESS LOAD-DISP DATA
The Process Load-Disp Data button is located at the bottom of the Main Menu and is
visible on all the tabs. When this button is pressed, the load-displacement (.raw) data
are filtered according to the options chosen on the Load-Disp Data tab. For a complete
analysis and associated printout, the Post Processing option on the Main Form must
subsequently be pressed, sending the .dat file to the Excel utility.
6.5 Display
Two displays appear when the Run Non-linear Analysis button is pushed: the J-delta
a display and the Output display. If either of these displays is closed after pre-
processing, they can be reopened using the drop-down list under Display on the Main
Form.
Page 96 of 148
NLFT Testing - Series 2015 - V3+.16.01

6.5.1 J – DELTA A DISPLAY
The results of the pre-processing analysis are based upon the test standard Analysis
Option selected on the Control tab of the Main Form.
The axes of the J-delta a plot are auto-scaled, but can be adjusted by using the
Increase/Decrease X/Y buttons.
The characteristics of each data point may be examined using the Forward/Back
buttons on the Data tab of the Main Form, with the active point appearing in green on
the J-delta a display.
The plot will be available for printing after post-processing in the Excel utility has taken
place.
Page 97 of 148
NLFT Testing - Series 2015 - V3+.16.01

6.5.2 OUTPUT DISPLAY
The .dat file produced by the pre-processing routine appear on the Output display. This
is for information only: the .dat file will be available for printing after post-processing has
occurred.
Page 98 of 148
NLFT Testing - Series 2015 - V3+.16.01

6.5.3 LOAD-DISPLACEMENT DISPLAY
After pre-processing a third display, Load-Displacement, may be viewed by selecting
Load-displacement from the Display drop down list on the Main Form. The
Increase/Decrease X/Y buttons may be used to change the scale.
Page 99 of 148
NLFT Testing - Series 2015 - V3+.16.01
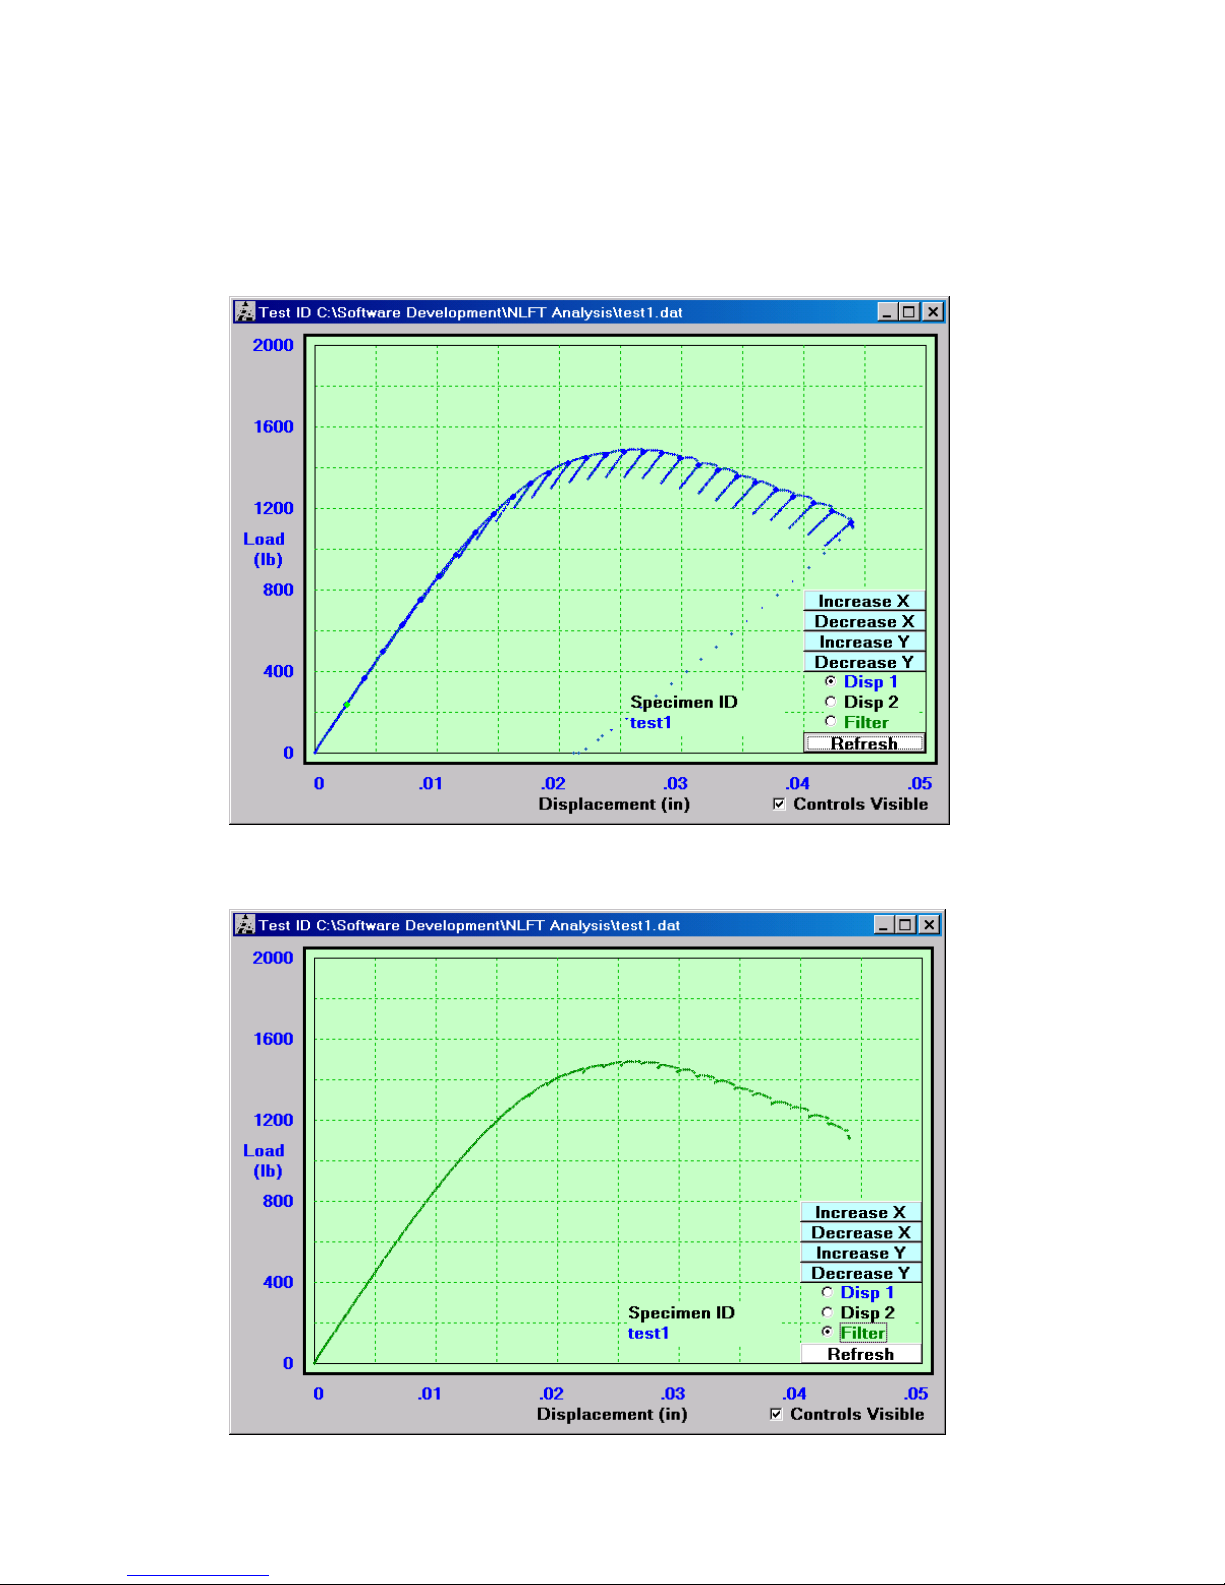
If the load-displacement data file (.raw extension) is loaded, this can also be displayed
as seen below. When the Filter option on the plot is selected, the Data Filter Options
from the KIC Utility tab are displayed.
Page 100 of 148
NLFT Testing - Series 2015 - V3+.16.01
 Loading...