

Page 1

FONIX® FP40/FP40D
PORTABLE HEARING AID ANALYZER
OPERATOR’S MANUAL
A Note on this Manual
The instructions in this manual are for software version
3.70 and above, with references to earlier software.
However, you may contact Frye Electronics for a more
appropriate manual if you have earlier software.
Software Version 3.70 © September 2005 Frye Electronics, Inc.
Rev. Jun. 04, 2007 All Rights Reserved.
Page 2

Page 3

Table of Contents
Chapter 1: Introduction
1.1 Description . . . . . . . . . . . . . . . . . . . . . . . . . . . . . . . . . . . . . . . . . . . . . . . . . . . . . . . . 1
1.2 Hardware History . . . . . . . . . . . . . . . . . . . . . . . . . . . . . . . . . . . . . . . . . . . . . . . . . . .
1.3 Features & Options . . . . . . . . . . . . . . . . . . . . . . . . . . . . . . . . . . . . . . . . . . . . . . . . . .
1.3.1
1.3.2 Probe Option
1.3.3 External Video Monitor
1.3.4 Battery Pack Option . . . . . . . . . . . . . . . . . . . . . . . . . . . . . . . . . . . . . . . . . . . .
1.3.5 ID Option . . . . . . . . . . . . . . . . . . . . . . . . . . . . . . . . . . . . . . . . . . . . . . . . . . . .
1.3.6
1.3.7 OES (Occluded Ear Simulator) Option
1.3.8 CIC (Completely In the Canal) Option. . . . . . . . . . . . . . . . . . . . . . . . . . . . . . . 4
1.4 Accessories
1.4.1 Standard Accessories . . . . . . . . . . . . . . . . . . . . . . . . . . . . . . . . . . . . . . . . . . .
1.4.2
1.4.3 Real-Ear Accessories
1.5 Layout & Controls . . . . . . . . . . . . . . . . . . . . . . . . . . . . . . . . . . . . . . . . . . . . . . . . . .
1.5.1 LCD (Liquid Crystal Display) . . . . . . . . . . . . . . . . . . . . . . . . . . . . . . . . . . . .
1.5.2 Front Panel
1.5.3 Front Panel
1.5.4 Front Panel
1.5.5 Rear Panel Controls . . . . . . . . . . . . . . . . . . . . . . . . . . . . . . . . . . . . . . . . . . .
1.5.6 Right Side Mounted Jack and Module . . . . . . . . . . . . . . . . . . . . . . . . . . . . .
1.5.7 Sound Chamber Mounted Jacks and Controls . . . . . . . . . . . . . . . . . . . . . . .
1.5.8 Top of Instrument, Printer . . . . . . . . . . . . . . . . . . . . . . . . . . . . . . . . . . . . . .
1.6 FP40
1.6.1 Setting up the instrument
1.6.2 Connecting equipment . . . . . . . . . . . . . . . . . . . . . . . . . . . . . . . . . . . . . . . . .
1.6.3 Connecting the line cord
1.7 Miscellaneous . . . . . . . . . . . . . . . . . . . . . . . . . . . . . . . . . . . . . . . . . . . . . . . . . . . . .
1.7.1 Servicing Your FP40
1.7.2 Cleaning the FP40 Display . . . . . . . . . . . . . . . . . . . . . . . . . . . . . . . . . . . . . .
1.7.3 Emergency
1.7.4 Warranty
Composite/Digital Speech Option . . . . . . . . . . . . . . . . . . . . . . . . . . . . . . . . . 2
. . . . . . . . . . . . . . . . . . . . . . . . . . . . . . . . . . . . . . . . . . . . . . . . . . 3
. . . . . . . . . . . . . . . . . . . . . . . . . . . . . . . . . . . . . . . . . . 3
RS232 Option . . . . . . . . . . . . . . . . . . . . . . . . . . . . . . . . . . . . . . . . . . . . . . . . . 4
. . . . . . . . . . . . . . . . . . . . . . . . . . . . . . 4
. . . . . . . . . . . . . . . . . . . . . . . . . . . . . . . . . . . . . . . . . . . . . . . . . . . . . . . . . 5
Optional Accessories . . . . . . . . . . . . . . . . . . . . . . . . . . . . . . . . . . . . . . . . . . . . 6
. . . . . . . . . . . . . . . . . . . . . . . . . . . . . . . . . . . . . . . . . . . . 8
10
10
Buttons . . . . . . . . . . . . . . . . . . . . . . . . . . . . . . . . . . . . . . . . . . . 11
Lamps . . . . . . . . . . . . . . . . . . . . . . . . . . . . . . . . . . . . . . . . . . . . 11
Knobs . . . . . . . . . . . . . . . . . . . . . . . . . . . . . . . . . . . . . . . . . . . . 12
12
13
13
13
Setup . . . . . . . . . . . . . . . . . . . . . . . . . . . . . . . . . . . . . . . . . . . . . . . . . . . . . . . 14
. . . . . . . . . . . . . . . . . . . . . . . . . . . . . . . . . . . . . . . 14
14
. . . . . . . . . . . . . . . . . . . . . . . . . . . . . . . . . . . . . . . . 15
15
. . . . . . . . . . . . . . . . . . . . . . . . . . . . . . . . . . . . . . . . . . . 15
15
Shutdown . . . . . . . . . . . . . . . . . . . . . . . . . . . . . . . . . . . . . . . . . . 16
. . . . . . . . . . . . . . . . . . . . . . . . . . . . . . . . . . . . . . . . . . . . . . . . . . . . 16
1
2
3
4
5
Chapter 2: General Operation
2.1 Screen Navigation . . . . . . . . . . . . . . . . . . . . . . . . . . . . . . . . . . . . . . . . . . . . . . . . . . 17
2.2 General Setup Menu . . . . . . . . . . . . . . . . . . . . . . . . . . . . . . . . . . . . . . . . . . . . . . . .
2.2.1 Making selections
2.2.2 Saving changes
2.2.3 Switching between partial and full menus
2.3 Using Function Keys . . . . . . . . . . . . . . . . . . . . . . . . . . . . . . . . . . . . . . . . . . . . . . . .
2.3.1 Hints
. . . . . . . . . . . . . . . . . . . . . . . . . . . . . . . . . . . . . . . . . . . . . . . . . . . . . . . 19
. . . . . . . . . . . . . . . . . . . . . . . . . . . . . . . . . . . . . . . . . . . . 18
. . . . . . . . . . . . . . . . . . . . . . . . . . . . . . . . . . . . . . . . . . . . . . . 18
. . . . . . . . . . . . . . . . . . . . . . . . . . 18
17
19
Page 4

2.3.2 Customizing the function keys . . . . . . . . . . . . . . . . . . . . . . . . . . . . . . . . . . . 20
2.4 Source Types . . . . . . . . . . . . . . . . . . . . . . . . . . . . . . . . . . . . . . . . . . . . . . . . . . . . . .
2.4.1 Understanding Pure-tone signals . . . . . . . . . . . . . . . . . . . . . . . . . . . . . . . . .
2.4.1.1
2.4.1.2 Noise Reduction
2.4.1.3 Settling Time . . . . . . . . . . . . . . . . . . . . . . . . . . . . . . . . . . . . . . . . .
2.4.1.4 Ha
2.4.2 Understanding Composite signals
2.4.2.1 ICRA vs. ANSI . . . . . . . . . . . . . . . . . . . . . . . . . . . . . . . . . . . . . . . . . . . . . .
2.4.2.2 Noise Reduction
2.4.2.3 Intermodulation Distortion . . . . . . . . . . . . . . . . . . . . . . . . . . . . . . . . . . . .
2.4.2.4 Composite source levels
2.5 Display Mode
2.6 Battery Current Drain . . . . . . . . . . . . . . . . . . . . . . . . . . . . . . . . . . . . . . . . . . . . . . .
2.7 Using the DATA button . . . . . . . . . . . . . . . . . . . . . . . . . . . . . . . . . . . . . . . . . . . . . .
2.8 External Sound
2.9 Printing . . . . . . . . . . . . . . . . . . . . . . . . . . . . . . . . . . . . . . . . . . . . . . . . . . . . . . . . . .
2.9.1 Selecting the printer
2.9.2 Using the thermal printer
2.9.3 Using an external printer . . . . . . . . . . . . . . . . . . . . . . . . . . . . . . . . . . . . . . .
2.9.4 Printing a
2.10 The Opening Screen . . . . . . . . . . . . . . . . . . . . . . . . . . . . . . . . . . . . . . . . . . . . . . .
2.11 The Battery Option (not available on FP40-D) . . . . . . . . . . . . . . . . . . . . . . .
Pure-tone settings . . . . . . . . . . . . . . . . . . . . . . . . . . . . . . . . . . . . . 22
. . . . . . . . . . . . . . . . . . . . . . . . . . . . . . . . . . . . . . . . . . . . . 22
rmonic Distortion . . . . . . . . . . . . . . . . . . . . . . . . . . . . . . . . . . . 23
. . . . . . . . . . . . . . . . . . . . . . . . . . . . . . . . . 23
. . . . . . . . . . . . . . . . . . . . . . . . . . . . . . . . . . . . . . . . . . . . . 24
. . . . . . . . . . . . . . . . . . . . . . . . . . . . . . . . . . . . . . . 25
. . . . . . . . . . . . . . . . . . . . . . . . . . . . . . . . . . . . . . . . . . . . . . . . . . . . . . 26
Chamber or Speaker. . . . . . . . . . . . . . . . . . . . . . . . . . . . . . . . . . . . 28
. . . . . . . . . . . . . . . . . . . . . . . . . . . . . . . . . . . . . . . . . . . 29
. . . . . . . . . . . . . . . . . . . . . . . . . . . . . . . . . . . . . . . 29
label . . . . . . . . . . . . . . . . . . . . . . . . . . . . . . . . . . . . . . . . . . . . . . . 31
21
21
22
23
24
26
28
29
30
32
32
Chapter 3: Coupler Measurements
3.1 The Main Coupler Screen . . . . . . . . . . . . . . . . . . . . . . . . . . . . . . . . . . . . . . . . . . . . 35
3.1.1 Viewing a
3.1.2 Viewing a Composite display . . . . . . . . . . . . . . . . . . . . . . . . . . . . . . . . . . . .
Leveling . . . . . . . . . . . . . . . . . . . . . . . . . . . . . . . . . . . . . . . . . . . . . . . . . . . . . . . . . 36
3.2
3.2.1 Leveling without the reference microphone (standard) . . . . . . . . . . . . . . . .
3.2.2 Leveling with the reference microphone
3.2.3 Saving the leveling information . . . . . . . . . . . . . . . . . . . . . . . . . . . . . . . . . .
3.3 Hearing Aid
3.3.1 Setting up a
3.3.2 Setting up an
3.3.3 Setting up a body aid . . . . . . . . . . . . . . . . . . . . . . . . . . . . . . . . . . . . . . . . . .
3.3.4 Setting up an eyeglass aid . . . . . . . . . . . . . . . . . . . . . . . . . . . . . . . . . . . . . .
3.4 Frequency responses . . . . . . . . . . . . . . . . . . . . . . . . . . . . . . . . . . . . . . . . . . . . . . . .
3.4.1 Choosing a source t
3.4.2 Taking the measurement
3.4.3 Viewing multiple measurements
3.4.4 Taking a single frequency response . . . . . . . . . . . . . . . . . . . . . . . . . . . . . . . .
3.4.5 Taking a three frequency
Pure-tone display . . . . . . . . . . . . . . . . . . . . . . . . . . . . . . . . . . . . . 35
36
37
. . . . . . . . . . . . . . . . . . . . . . . . . . . . 37
38
Setup . . . . . . . . . . . . . . . . . . . . . . . . . . . . . . . . . . . . . . . . . . . . . . . . . . 38
BTE. . . . . . . . . . . . . . . . . . . . . . . . . . . . . . . . . . . . . . . . . . . . . . 39
ITE/ITC/CIC . . . . . . . . . . . . . . . . . . . . . . . . . . . . . . . . . . . . . . 39
41
41
42
ype. . . . . . . . . . . . . . . . . . . . . . . . . . . . . . . . . . . . . . . . . 42
. . . . . . . . . . . . . . . . . . . . . . . . . . . . . . . . . . . . . . . . 43
. . . . . . . . . . . . . . . . . . . . . . . . . . . . . . . . . . 44
44
average . . . . . . . . . . . . . . . . . . . . . . . . . . . . . . . . . 45
Page 5

3.4.6 Viewing harmonic distortion. . . . . . . . . . . . . . . . . . . . . . . . . . . . . . . . . . . . . 45
3.4.7 Viewing battery current drain
3.4.8 Switching between gain and
3.4.9 Testing with the reference microphone
3.5 Digital Aids
3.5.1 Testing with Digital Speech . . . . . . . . . . . . . . . . . . . . . . . . . . . . . . . . . . . . .
3.5.2 Testing with the Composite Signal . . . . . . . . . . . . . . . . . . . . . . . . . . . . . . . .
3.5.3 Testing with pure-tone
3.6 Directional Hearing Aids
3.6.1 Preparing for the measurement . . . . . . . . . . . . . . . . . . . . . . . . . . . . . . . . . .
3.6.2 Taking the Forward Measurement
3.6.3. Taking the Reverse Measurement
3.7 The
3.8 The OES Option
CIC Option . . . . . . . . . . . . . . . . . . . . . . . . . . . . . . . . . . . . . . . . . . . . . . . . . . . . 52
. . . . . . . . . . . . . . . . . . . . . . . . . . . . . . . . . . . . . . . . . . . . . . . . . . . . . . . . 47
sweeps . . . . . . . . . . . . . . . . . . . . . . . . . . . . . . . . . . . 49
. . . . . . . . . . . . . . . . . . . . . . . . . . . . . . . . . . . . . . . . . . . . . 49
. . . . . . . . . . . . . . . . . . . . . . . . . . . . . . . . . . . . . . . . . . . . . . . . . . . . 53
. . . . . . . . . . . . . . . . . . . . . . . . . . . . . . . . . . . . 46
output . . . . . . . . . . . . . . . . . . . . . . . . . . . . . . . 46
. . . . . . . . . . . . . . . . . . . . . . . . . . . . . 46
48
48
50
. . . . . . . . . . . . . . . . . . . . . . . . . . . . . . . . . 50
. . . . . . . . . . . . . . . . . . . . . . . . . . . . . . . . . 51
Chapter 4: Automated Test Sequences
4.1 ANSI S3.22-2003 . . . . . . . . . . . . . . . . . . . . . . . . . . . . . . . . . . . . . . . . . . . . . . . . . . . 55
4.1.1 Setting up the aid for testing . . . . . . . . . . . . . . . . . . . . . . . . . . . . . . . . . . . .
4.1.2 Setting up the analyzer for testing . . . . . . . . . . . . . . . . . . . . . . . . . . . . . . . .
4.1.3 Running the test sequence . . . . . . . . . . . . . . . . . . . . . . . . . . . . . . . . . . . . . .
4.1.4 Viewing the
4.2 ANSI S3.22-1996
4.2.1 Setting up the aid for testing . . . . . . . . . . . . . . . . . . . . . . . . . . . . . . . . . . . .
4.2.2 Setting up the analyzer for testing . . . . . . . . . . . . . . . . . . . . . . . . . . . . . . . .
4.2.3 Running the test sequence . . . . . . . . . . . . . . . . . . . . . . . . . . . . . . . . . . . . . .
4.2.4 Viewing the
4.3 ANSI S3.22-1987
4.3.1 Setting up for the test
4.3.2 Running the test sequence . . . . . . . . . . . . . . . . . . . . . . . . . . . . . . . . . . . . . .
4.3.3 Viewing the
4.4 ANSI S3.42-1992
4.4.1 Setting up for the test
4.4.2 Running the test sequence . . . . . . . . . . . . . . . . . . . . . . . . . . . . . . . . . . . . . .
4.4.3 Viewing the
4.5 IEC . . . . . . . . . . . . . . . . . . . . . . . . . . . . . . . . . . . . . . . . . . . . . . . . . . . . . . . . . . . . . . 67
4.5.1 Setting up the aid for testing . . . . . . . . . . . . . . . . . . . . . . . . . . . . . . . . . . . .
4.5.2 Setting up the analyzer for testing. . . . . . . . . . . . . . . . . . . . . . . . . . . . . . . . . . . . . . . 68
4.5.3 Running the test sequence . . . . . . . . . . . . . . . . . . . . . . . . . . . . . . . . . . . . . . 69
4.5.4 Viewing the
Profiler. . . . . . . . . . . . . . . . . . . . . . . . . . . . . . . . . . . . . . . . . . . . . . . . . . . . . . . . . . . 70
4.6
4.6.1 Setting up for the test
4.6.2 Running the test sequence . . . . . . . . . . . . . . . . . . . . . . . . . . . . . . . . . . . . . .
4.6.3 Viewing the results
ACIC . . . . . . . . . . . . . . . . . . . . . . . . . . . . . . . . . . . . . . . . . . . . . . . . . . . . . . . . . . . . 72
4.7
results . . . . . . . . . . . . . . . . . . . . . . . . . . . . . . . . . . . . . . . . . . . . 58
. . . . . . . . . . . . . . . . . . . . . . . . . . . . . . . . . . . . . . . . . . . . . . . . . . . 59
results . . . . . . . . . . . . . . . . . . . . . . . . . . . . . . . . . . . . . . . . . . . . 62
. . . . . . . . . . . . . . . . . . . . . . . . . . . . . . . . . . . . . . . . . . . . . . . . . . . 63
. . . . . . . . . . . . . . . . . . . . . . . . . . . . . . . . . . . . . . . . . . 63
results . . . . . . . . . . . . . . . . . . . . . . . . . . . . . . . . . . . . . . . . . . . . 64
. . . . . . . . . . . . . . . . . . . . . . . . . . . . . . . . . . . . . . . . . . . . . . . . . . . 65
. . . . . . . . . . . . . . . . . . . . . . . . . . . . . . . . . . . . . . . . . . 66
results . . . . . . . . . . . . . . . . . . . . . . . . . . . . . . . . . . . . . . . . . . . . 67
results . . . . . . . . . . . . . . . . . . . . . . . . . . . . . . . . . . . . . . . . . . . . 69
. . . . . . . . . . . . . . . . . . . . . . . . . . . . . . . . . . . . . . . . . . 70
. . . . . . . . . . . . . . . . . . . . . . . . . . . . . . . . . . . . . . . . . . . . 71
56
56
58
59
60
61
64
66
67
71
Page 6

Chapter 5: Real-Ear Measurements
5.1 Preparation for Real-Ear Measurements . . . . . . . . . . . . . . . . . . . . . . . . . . . . . . . . . 73
5.1.1 Setting
5.1.1.1 To set up the microphones and monitor headset
5.1.1.2 To set up the internal sound field speaker
5.1.1.3 To set up an external sound field speaker
5.1.2 Setting up the client for testing . . . . . . . . . . . . . . . . . . . . . . . . . . . . . . . . . .
5.1.2.1 To position the sound field speaker
5.1.2.2 To place the
5.1.2.3 To insert the probe tube
5.1.2.4 To level the sound field . . . . . . . . . . . . . . . . . . . . . . . . . . . . . . . . . . . . . . .
5.2 The Target Screen . . . . . . . . . . . . . . . . . . . . . . . . . . . . . . . . . . . . . . . . . . . . . . . . . .
5.2.1 Viewing the target screen
5.2.2 Creating a target
5.2.3 Setting the default target . . . . . . . . . . . . . . . . . . . . . . . . . . . . . . . . . . . . . . .
5.2.4 Creating your own target . . . . . . . . . . . . . . . . . . . . . . . . . . . . . . . . . . . . . . .
5.2.5 Modifying an existing target
5.3 Insertion Gain Measurements . . . . . . . . . . . . . . . . . . . . . . . . . . . . . . . . . . . . . . . . .
5.3.1 Viewing the Insertion Gain screen . . . . . . . . . . . . . . . . . . . . . . . . . . . . . . . .
5.3.2 Taking an unaided response
5.3.3 Taking an aided response
5.3.4 Viewing insertion gain . . . . . . . . . . . . . . . . . . . . . . . . . . . . . . . . . . . . . . . . .
5.3.5 Testing Open Fit Hearing Aids
5.4 SPL Measurements (including real-ear DSL) . . . . . . . . . . . . . . . . . . . . . . . . . . . . . . 90
5.4.1 Understanding the SPL approach . . . . . . . . . . . . . . . . . . . . . . . . . . . . . . . . .
5.4.2 Understanding the specifics of
5.4.3 Viewing the SPL screen
5.4.4 Taking the SPL measurements . . . . . . . . . . . . . . . . . . . . . . . . . . . . . . . . . . .
5.5 Audibility Index (AI)
5.5.1 Viewing the AI display . . . . . . . . . . . . . . . . . . . . . . . . . . . . . . . . . . . . . . . . .
5.5.2 Performing AI measurements . . . . . . . . . . . . . . . . . . . . . . . . . . . . . . . . . . . .
5.6 DSL Coupler Measurements . . . . . . . . . . . . . . . . . . . . . . . . . . . . . . . . . . . . . . . . . . .
5.6.1 Performing the RECD measurement
5.6.1.1 To perform the coupler measurement . . . . . . . . . . . . . . . . . . . . . . . . . . . .
5.6.1.2 To perform the real-ear measurement
5.6.2 Performing coupler measurements to a DSL target . . . . . . . . . . . . . . . . . .
5.7 Coupler prescription (non DSL) . . . . . . . . . . . . . . . . . . . . . . . . . . . . . . . . . . . . . .
5.7.1 Viewing the Target 2-cc screen
5.7.2 Taking the FOG measurement . . . . . . . . . . . . . . . . . . . . . . . . . . . . . . . . . .
5.7.3 Viewing the SSPL 90 screen . . . . . . . . . . . . . . . . . . . . . . . . . . . . . . . . . . . .
5.7.4 Taking the SSPL 90 measurement . . . . . . . . . . . . . . . . . . . . . . . . . . . . . . .
5.7.5 Checking an aid against a
5.7.6 Accounting for venting effects . . . . . . . . . . . . . . . . . . . . . . . . . . . . . . . . . .
5.7.7 Understanding the technical details . . . . . . . . . . . . . . . . . . . . . . . . . . . . . .
up the analyzer for testing . . . . . . . . . . . . . . . . . . . . . . . . . . . . . . . . 73
. . . . . . . . . . . . . . . . . . . . 73
. . . . . . . . . . . . . . . . . . . . . . . . . 74
. . . . . . . . . . . . . . . . . . . . . . . . . 76
76
. . . . . . . . . . . . . . . . . . . . . . . . . . . . . . 76
earhook and reference microphone . . . . . . . . . . . . . . . . . . . . 77
. . . . . . . . . . . . . . . . . . . . . . . . . . . . . . . . . 78
79
80
. . . . . . . . . . . . . . . . . . . . . . . . . . . . . . . . . . . . . . . 80
. . . . . . . . . . . . . . . . . . . . . . . . . . . . . . . . . . . . . . . . . . . . . . 83
84
85
. . . . . . . . . . . . . . . . . . . . . . . . . . . . . . . . . . . . . 85
85
86
. . . . . . . . . . . . . . . . . . . . . . . . . . . . . . . . . . . . . 86
. . . . . . . . . . . . . . . . . . . . . . . . . . . . . . . . . . . . . . . 87
88
. . . . . . . . . . . . . . . . . . . . . . . . . . . . . . . . . . . 89
90
DSL . . . . . . . . . . . . . . . . . . . . . . . . . . . . . . . 91
. . . . . . . . . . . . . . . . . . . . . . . . . . . . . . . . . . . . . . . . . 92
92
. . . . . . . . . . . . . . . . . . . . . . . . . . . . . . . . . . . . . . . . . . . . . . . . 94
95
96
96
. . . . . . . . . . . . . . . . . . . . . . . . . . . . . . . 96
97
. . . . . . . . . . . . . . . . . . . . . . . . . . . . 98
100
101
. . . . . . . . . . . . . . . . . . . . . . . . . . . . . . . . . . 102
103
103
104
prescription . . . . . . . . . . . . . . . . . . . . . . . . . . . . 105
106
106
Page 7

5.8 Miscellaneous . . . . . . . . . . . . . . . . . . . . . . . . . . . . . . . . . . . . . . . . . . . . . . . . . . . . 107
5.8.1 Single frequency response . . . . . . . . . . . . . . . . . . . . . . . . . . . . . . . . . . . . .
5.8.2 S
5.8.3 Reset Level . . . . . . . . . . . . . . . . . . . . . . . . . . . . . . . . . . . . . . . . . . . . . . . . .
5.8.4 Data Display
5.9 Body, CROS, and BI-CROS aids
5.9.1 Testing body aids . . . . . . . . . . . . . . . . . . . . . . . . . . . . . . . . . . . . . . . . . . . .
5.9.2 Testing CROS and BICROS aids . . . . . . . . . . . . . . . . . . . . . . . . . . . . . . . . .
5.9.2.3 Overall Insertion Gain . . . . . . . . . . . . . . . . . . . . . . . . . . . . . . . . . . . . . .
5.9.2.4 Insertion Loss to the “Good” Ear (CROS) . . . . . . . . . . . . . . . . . . . . . . . .
5.10 FM Systems
5.11 Testing Directional Aids . . . . . . . . . . . . . . . . . . . . . . . . . . . . . . . . . . . . . . . . . . . . 114
5.11.1 Reverse Measurement
5.11.2 Forward Measurement . . . . . . . . . . . . . . . . . . . . . . . . . . . . . . . . . . . . . . .
moothing . . . . . . . . . . . . . . . . . . . . . . . . . . . . . . . . . . . . . . . . . . . . . . . . . 107
. . . . . . . . . . . . . . . . . . . . . . . . . . . . . . . . . . . . . . . . . . . . . . . . 108
. . . . . . . . . . . . . . . . . . . . . . . . . . . . . . . . . . . . . . . 109
5.9.2.1 Head-Baffle Effect . . . . . . . . . . . . . . . . . . . . . . . . . . . . . . . . . . . .
5.9.2.2 How Well the Aid Overcomes the Head-Baffle Effect
. . . . . . . . . . . . . . . . . . . . . . . . . . . . . . . . . . . . . . . . . . . . . . . . . . . . . 114
. . . . . . . . . . . . . . . . . . . . . . . . . . . . . . . . . . . . . . . . 114
. . . . . . . . . . 111
107
108
109
110
110
112
113
115
Chapter 6: Spectrum Analysis
6.1 Spectrum Mode . . . . . . . . . . . . . . . . . . . . . . . . . . . . . . . . . . . . . . . . . . . . . . . . . . . 117
6.2 Entering the Spectrum Mode
6.3 Using the Spectrum Mode
. . . . . . . . . . . . . . . . . . . . . . . . . . . . . . . . . . . . . . . . . 117
. . . . . . . . . . . . . . . . . . . . . . . . . . . . . . . . . . . . . . . . . . . 117
Chapter 7: Telecoil Testing
7.1 Setup with the Telecoil Board . . . . . . . . . . . . . . . . . . . . . . . . . . . . . . . . . . . . . . . . 121
7.2 Setup with the Telewand . . . . . . . . . . . . . . . . . . . . . . . . . . . . . . . . . . . . . . . . . . . .
7.3 Environmental Magnetic Fields
7.4 Testing
. . . . . . . . . . . . . . . . . . . . . . . . . . . . . . . . . . . . . . . . . . . . . . . . . . . . . . . . . . 124
. . . . . . . . . . . . . . . . . . . . . . . . . . . . . . . . . . . . . . . 123
122
Appendices
Appendix A: Specifications . . . . . . . . . . . . . . . . . . . . . . . . . . . . . . . . . . . . . . . . . . . . . . 125
Appendix B: Calibratio
Appendix C: History of Change
Appendix D: Custom RECD Tes
Appendix E: The FONIX CIC Option . . . . . . . . . . . . . . . . . . . . . . . . . . . . . . . . . . . . . .
Appendix F: Storage Compartments in the FP4
Appendix G: Troubleshooting Guide . . . . . . . . . . . . . . . . . . . . . . . . . . . . . . . . . . . . . . 143
Appendix H: Probe SPL Mode Descriptio
Appendix I: DSL Programming Note
Appendix J: Battery Simulator Impedance
n. . . . . . . . . . . . . . . . . . . . . . . . . . . . . . . . . . . . . . . . . . . . . . . . 129
s . . . . . . . . . . . . . . . . . . . . . . . . . . . . . . . . . . . . . . . . . 133
t . . . . . . . . . . . . . . . . . . . . . . . . . . . . . . . . . . . . . . . . . . 135
137
0 . . . . . . . . . . . . . . . . . . . . . . . . . . . . . . . . 141
n. . . . . . . . . . . . . . . . . . . . . . . . . . . . . . . . . . 145
s . . . . . . . . . . . . . . . . . . . . . . . . . . . . . . . . . . . . . 149
s . . . . . . . . . . . . . . . . . . . . . . . . . . . . . . . . 151
Index . . . . . . . . . . . . . . . . . . . . . . . . . . . . . . . . . . . . . . . . . . . . . . . . . . . . . . . . . . . . . 153
Page 8

If you are located in the European Union, please report all safety-related concerns to our autho
rized representative:
Siemens Hearing Instruments
Alexandra House
Newton Road
Manor Royal
Crawley
West Sussex RH109TT
England
Otherwise, please report all safety-related concerns to:
Frye electronics, Inc.
P.O. Box 23391
Tigard, OR 97281-3391
USA
Frye Electronics is a Registered Firm of British Standards Institution, and
we conform tothe ISO 13485 standard
-
viii
Page 9

Chapter 1: Introduction
1.1 Description
Hearing aid analyzers are designed to give the user accurate information on how much amplification the aid provides, which frequencies it amplifies, how loud it can get, and how much distortion
and noise are present. Information is displayed in both graphs and in number tables, and can be
printed as desired.
The FP40 Hearing Aid Analyzer is the third generation of portable analyzers manufactured by Frye
Electronics. It incorporates a tilt-up, wide-angle LCD (liquid crystal display), a quiet, fast thermal
printer, and a convenient, optional battery pack for testing in places where it is not convenient to
use electrical outlets. The lid holding accessories comes off so that the unit looks like a desk model
in your office.
The following test sequences are currently available on the FP40: ANSI (American National
Standards Institute); IEC (International Electrotechnical Commission); JIS (Japanese Industrial
Standard) and ISI (Indian Standards Institute). Your choice of one of these is included in the stan
dard price. Additional test sequences can be included at a modest cost. Instructions for the ANSI
and IEC test sequences are found in Chapter 5. Instructions for the JIS automated test sequence are
available upon request.
-
The FP40 comes standard with three types of pure-tone sweeps: normal, fast, and short. The
Composite Options adds three real-time signals: the Composite signal, Digital Speech ANSI, and
Digital Speech ICRA. These signals are described in more detail in Section 1.3.
Indications for use
The FONIX FP40 Hearing Aid Analyzer allows the user to test the characteristics of a hearing
aid using coupler and optional real-ear measurements. These characteristics include: Frequency
response, harmonic distortion, equivalent input noise, battery current drain, and compression.
Coupler measurements are performed inside a sound chamber. Real-ear measurements are per
formed with a small probe microphone inside the patient’s ear. This manual provides detailed
instructions on the measurement capabilities and user interface of the FONIX FP40.
-
1.2 Hardware History
Here’s some of the recent hardware changes to the FP40:
In 1994, we introduced the VG
video monitor for a large, colorful display. (In 1999, this VGA Option became a standard feature.)
At the same time, we introduced the Telecoil Option to allow telecoil testing. It requires separate
hardware such as the ANSI 87 telecoil board or the ANSI 96 telewand.
A Option that allowed the FP40 to be hooked up to an external color
Introduction 1
Page 10

Also in 1994, we introduced the FP40-D desk model analyzer. This unit is always equipped with the
real ear testing function. In order to minimize costs, the Battery Pack Option is not available on this
unit and some accessories (battery pills and monitor headset) that are standard on the FP40 are
optional with the FP40-D. Since this unit does not have a lid, a separate soft carrying case is avail
able for those who want to carry the unit from place to place.
In 1996, we improved the sound chamber significantly. The new sound box excludes much more
ambient noise than the previous model did. It was designed to be taken out of the module and
placed on a short pole for use as a speaker for real ear measurements. The speaker is then at a
higher elevation than in the previous design and can be swiveled, allowing easy positioning for real
ear measurements.
-
1.3 Features & Options
This section describes many of the different features and options available on the FP40 hearing aid
analyzer
1.3.1 Composite/Digital Speech Option
In addition to pure-tone tests, the FP40 can be purchased with the Composite Option, providing
real-time measurements of hearing aids. The Composite and Digital Speech signals are complex sig
nals made up on 79 different frequencies presented simultaneously, updating about once a second.
-
Besides giving instant results, these test signals often provide more realistic test results of hearing
aids than you can get using pure-tone sweeps. Aids with automatic gain control (AGC) technology
can respond unexpectedly to pure-tone sweeps, providing more amplification in the low frequen
cies than would occur in a real-life situation. This artifact of pure-tone testing, known as “artificial
blooming,” does not occur when a complex signal, such as the composite signal, is used.
Advanced digital hearing aids with “noise suppression” have different difficulties with testing. These
aids were designed to lower their gain when in the presence of a continuous sound. Unfortunately,
this generally includes conventional test signals such as pure-tone sweeps or the standard composite
signal. Digital Speech was developed as a way to test these advanced hearing aids. Digital Speech is
very similar to the composite signal except that instead of being a continuous signal, it is an inter
rupted signal that the aid responds to as it would respond to speech.
Digital Speech comes with two speech weightings: ANSI and ICRA. The ANSI speech weighting is
from the ANSI S3.22-1992 standard – it is the same weighting used by the standard Composite sig
nal. The ICRA speech weighing is from a CD of sounds from multiple languages developed by the
International Collegium of Rehabilitative Audiology. It rolls off the high frequencies more rapidly
than the ANSI weighting.
-
-
-
2 FONIX FP40 Portable Hearing Aid Analyzer
Page 11

The use of the Composite or Digital Speech signals can uncover the presence of intermodulation
distortion in a hearing aid. Intermodulation distortion is the distortion that results when two or
more frequencies are delivered to the hearing aid simultaneously, resulting in the addition of fre
quencies to the output that were not present in the input. In other words, when you deliver a com
plex signal to the hearing aid, such as speech, the aid provides unexpected amplification to some of
the frequencies, causing the entire signal to sound distorted.
-
-
Intermodulation distortion can be detected using the composite or digital speech signals and look
ing for jagged peaks and valleys in the response curve. The curve “breaks up” more and more as the
amount of intermodulation distortion increases.
-
1.3.2 Probe Option (standard on the FP40-D)
(See Chapter 5 for details.)
The FP40 Hearing Aid Analyzer can be ordered with the Probe Option so that tests can be done on
the hearing aid while it is in the client’s ear. Probe measurements are also known as “real-ear” mea
surements. It is then possible to individualize the fitting of a hearing aid since a coupler measure
ment can seldom tell the operator exactly what sound is received by the client. Many factors affect
the sound on its way to the ear drum. When measuring with a probe microphone, you will know
what is happening in the “real ear.”
The probe microphone can also be used as a reference microphone while making coupler measure
ments.
Target 2-cc
The Target 2-cc screen on the FP40 converts real-ear targets to coupler targets. It can be used for
ordering hearing aids from a manufacturer, and it can be used for adjusting the hearing aid to tar
get when a real-ear measurement isn’t possible. Further refinements of the coupler target are pos
sible using a measured real-ear to coupler difference (RECD) measurement. This is explained in
more detail in Chapter 5.
Prescription
-
-
-
-
-
1.3.3 External Video Monitor
In September 1994, the VGA Color Option was introduced on the FP40. This allowed the FP40 to
be hooked up to an external video monitor. In 1999, we made this a standard feature. When the
VGA display mode is chosen, the LCD is blanked.
When purchasing a VGA monitor for your FP40, it is recommended that you get one with a 0.31 or
0.28mm dot pitch so that you get the resolution needed to take full advantage of the FP40 video
resolution.
1.3.4 Battery Pack Option
Some users may find it convenient to operate their unit away from electrical outlets. These users
can order the Battery Pack Option which will operate on its rechargeable batteries for up to three
hours. (Not available on the FP40-D.)
Introduction 3
Page 12

1.3.5 ID Option
The ID Option personalizes the printout strips with the owner’s name and address or phone
number. Specify two lines of 27 characters each at time of purchase, and we will program them
into your instrument. The ID can be changed for a modest fee with an exchange of PROMs
(Programmable Read Only Memory).
1.3.6 RS232 Option
The RS232 Option allows you to hook your analyzer up to a computer so you can grab your analyzer data from your analyzer and save it on your computer. It includes internal FP40 software and
external RS232 cables and connectors. In order for you to communicate with your analyzer, you
will also need a corresponding program on your computer, such as WinCHAP. It is also possible to
create your own custom program for communicating with your FP40.
1.3.7 OES (Occluded Ear Simulator) Option
The OES Option provides special couplers, (the MZ series) and correction factors to produce the
same results as a real ear simulator (Zwislocki coupler) when simulating occluded ear measure
ments in the sound chamber. See Section 3.7 for more details.
-
1.3.8 CIC (Completely In the Canal) Option
The CIC Option was designed as a realistic coupler test for CIC hearing aids. It uses a 0.4 cc coupler combined with software correction factors in order to create a response curve that is more like
what you would expect to see in a person’s ear than the response curve you will get using a stan
dard HA-1 coupler. See Section 3.6 for more details.
4 FONIX FP40 Portable Hearing Aid Analyzer
Page 13
1.4 Accessories
The standard and optional accessories available for the FP40 analyzer are described in this
section.
1.4.1 Standard Accessories
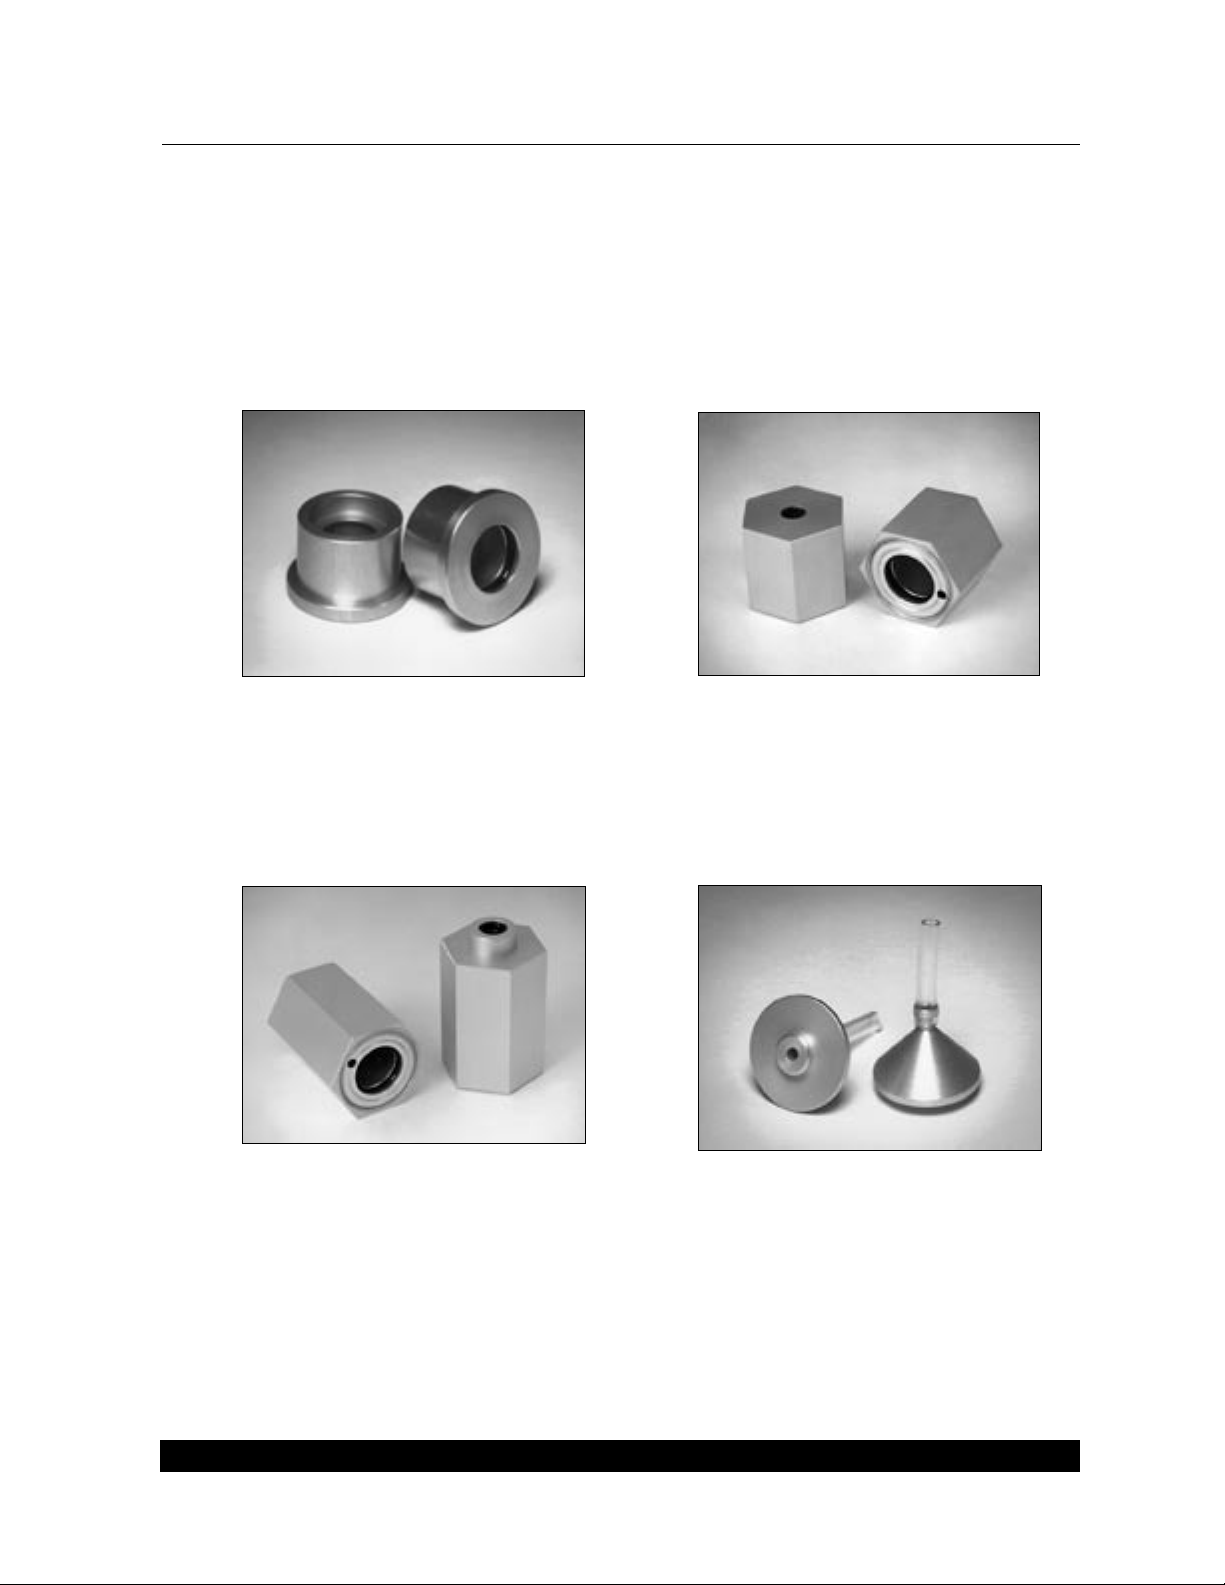
Microphone Adapter
14 mm to ANSI 1" diameter microphone
size. This is used for calibrating the FP40
microphones.
HA-2 2-cc Coupler
Dimensions per requirements of ANSI
S3.7 for testing ear level, eyeglass and
body aids.
HA-1 2-cc Coupler
Dimensions per requirements of ANSI
S3.7 for testing in-the-ear aids.
Ear-Level (BTE) Adapter
Snaps into the 1/4" (6.35 mm) diam
eter cavity in the HA-2 2-cc coupler or
the MZ-2 coupler. Equipped with a 0.6"
(15 mm) length of 0.076" (1.93 mm)
ID tubing, the adapter allows ANSI
S3.22 specified connection of an earlevel aid to the coupler.
-
Introduction 5
Page 14
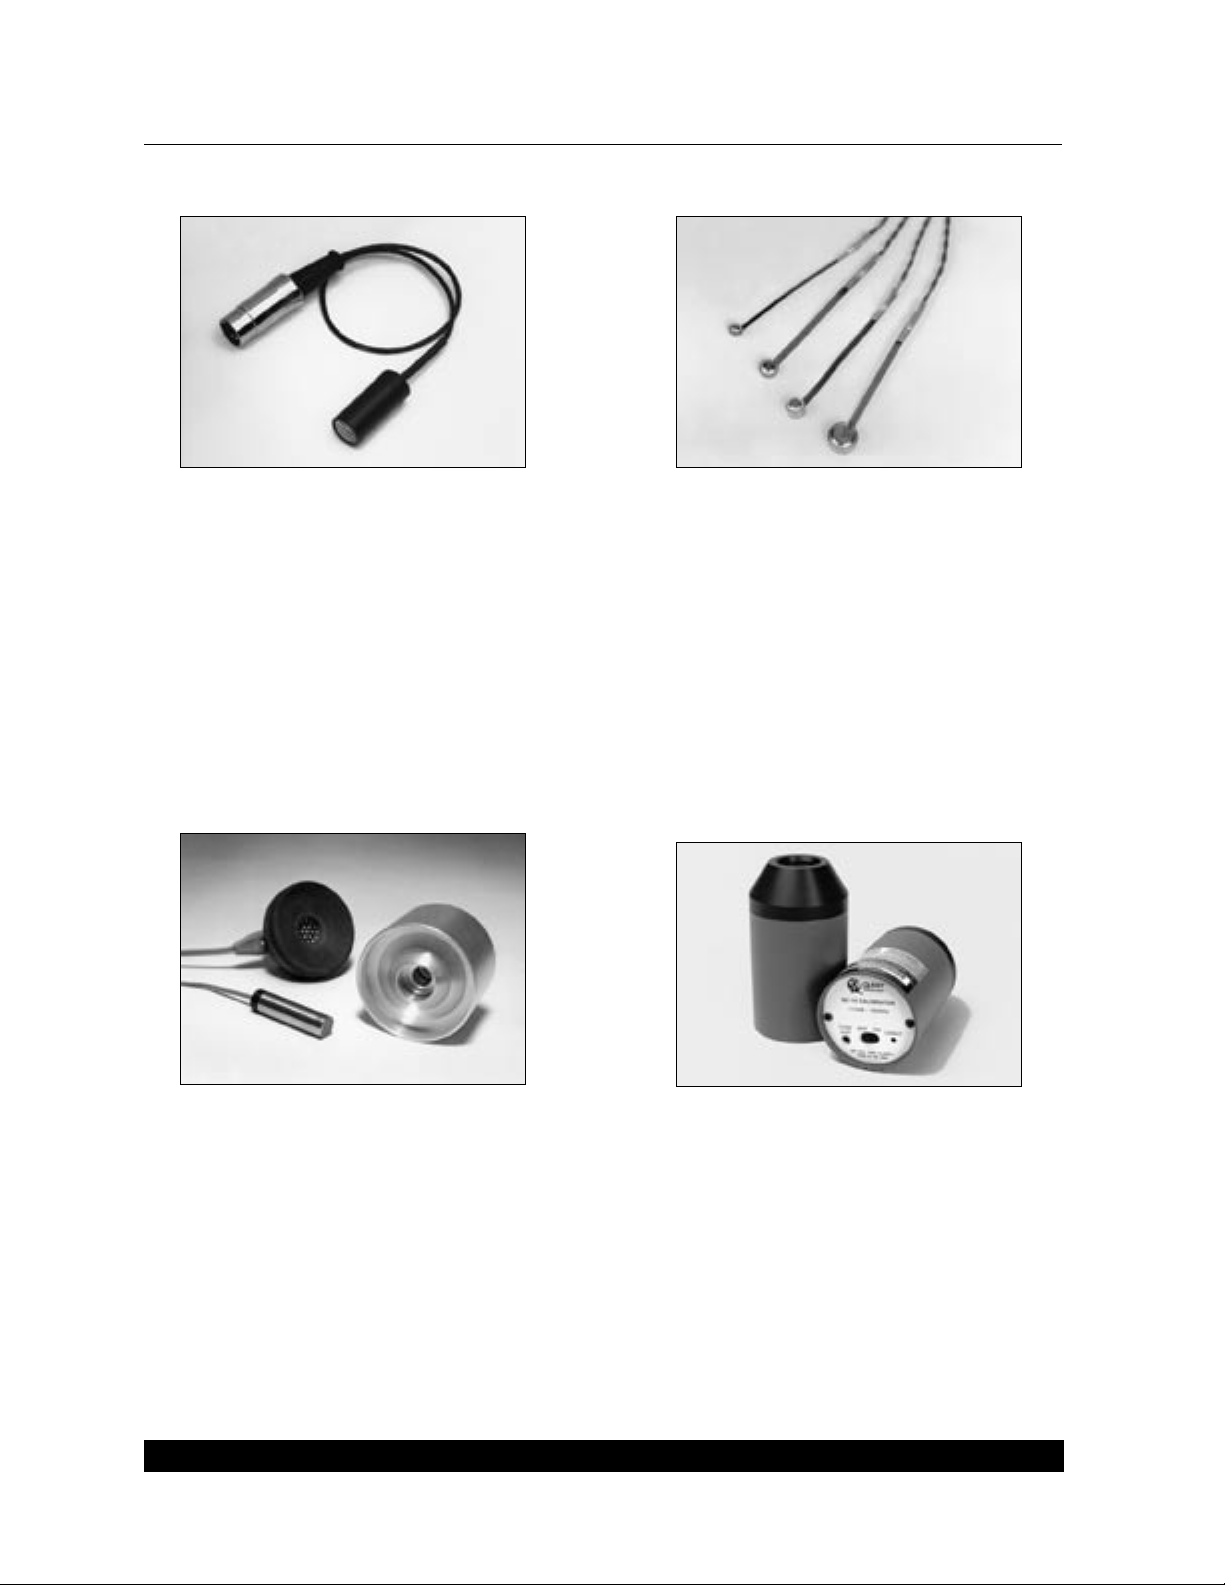
FM40 Microphone
Provided if the Real-Ear Option is not
ordered.
1.4.2 Optional Accessories
Battery Pills
(With 12" [30 cm] cables — 24" [60
cm]) cables available upon request)
#13, #675/65, #312, #10A/230. (All
pills optional with FP40-D).
Operator’s Manual
6-CC Coupler
Per ANSI S3.7 for NBS 9A—used to
check output of audiometers.
6 FONIX FP40 Portable Hearing Aid Analyzer
Sound Level
For microphone calibration
Calibrator
Page 15
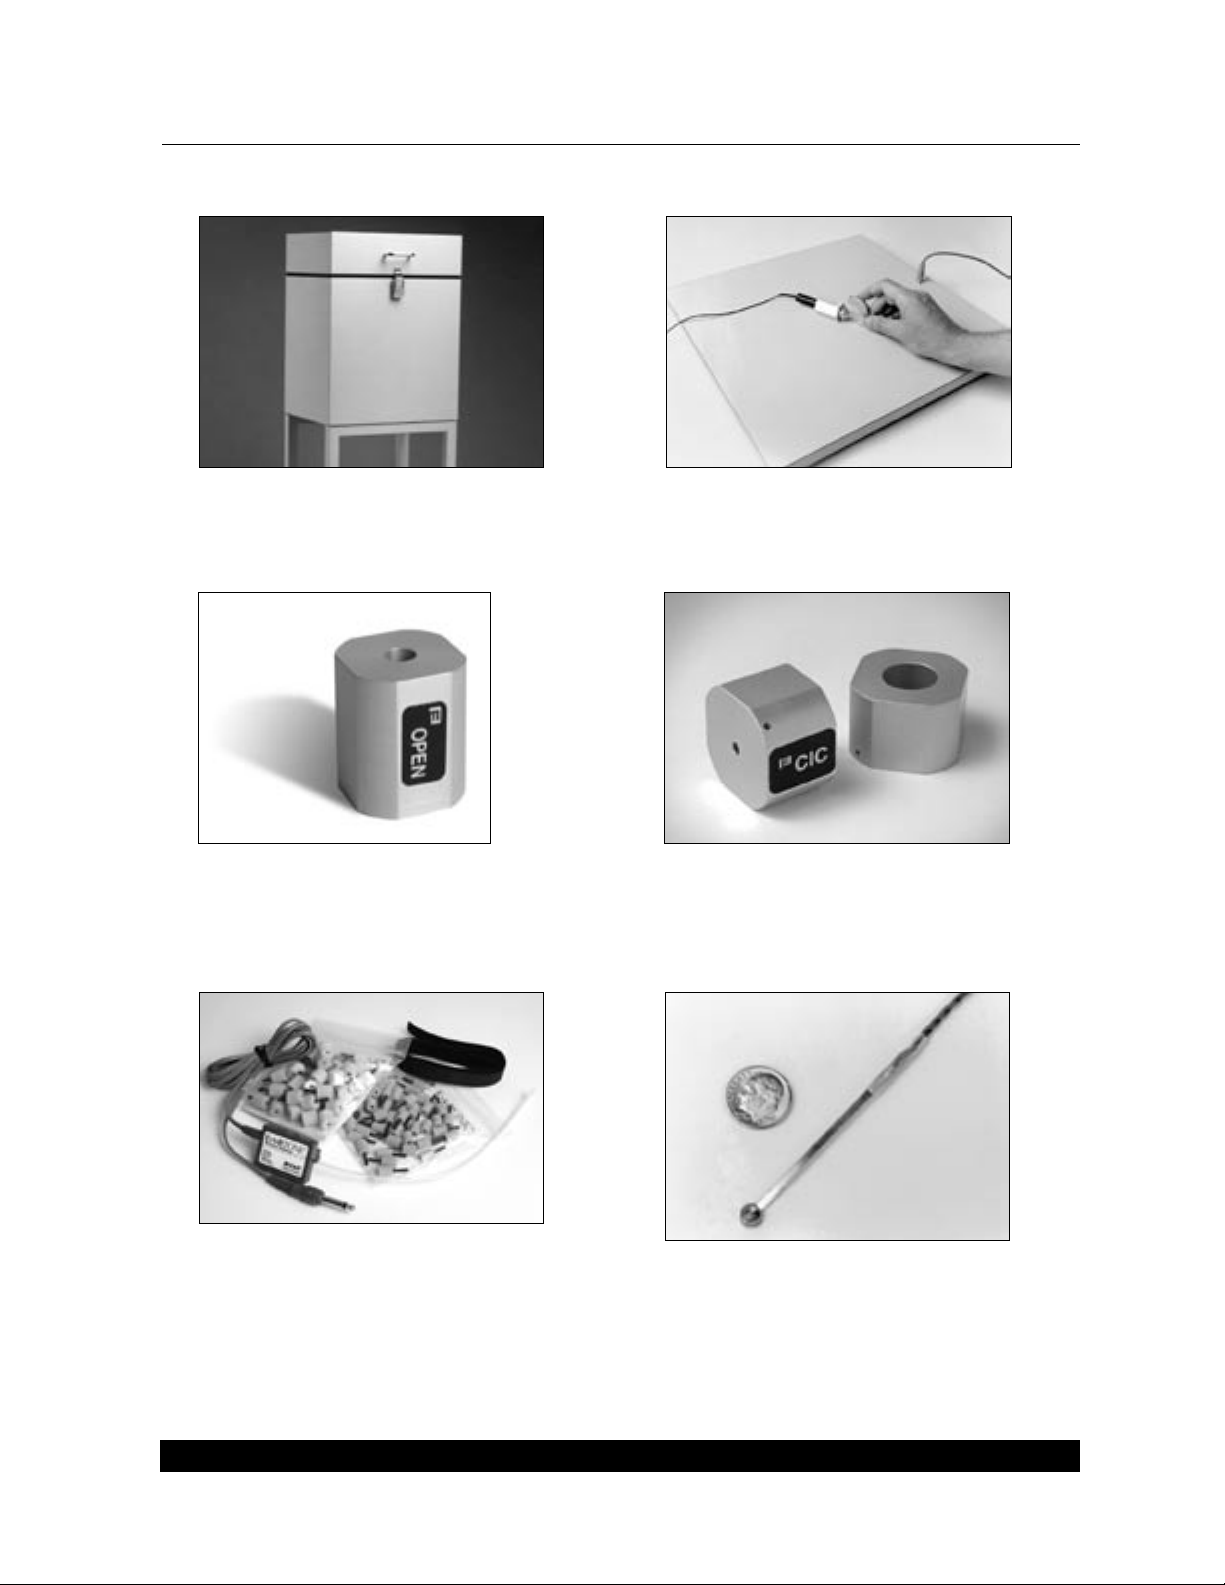
6040 Sound Chamber
For control of external noises.
External Telecoil
For checking the response of aids in
the “telephone” mode.
Open Ear Coupler
Non-standard coupler used for
realistic testing of open ear hear
-
ing aids.
RECD Earphone Package
Consists of one ER3A earphone with a
phono plug, a 72 inch cable, an assort
ment of ear tips, a calibration certifi
cate, and a lapel clip. This package is
suitable for performing an RECD mea
surement with the FP40 analyzer.
-
CIC Coupler
Required coupler for use with
Option.
#5 Battery Pill
-
-
12" or 24"
Needed for some CIC hearing aids.
CIC
Introduction 7
Page 16
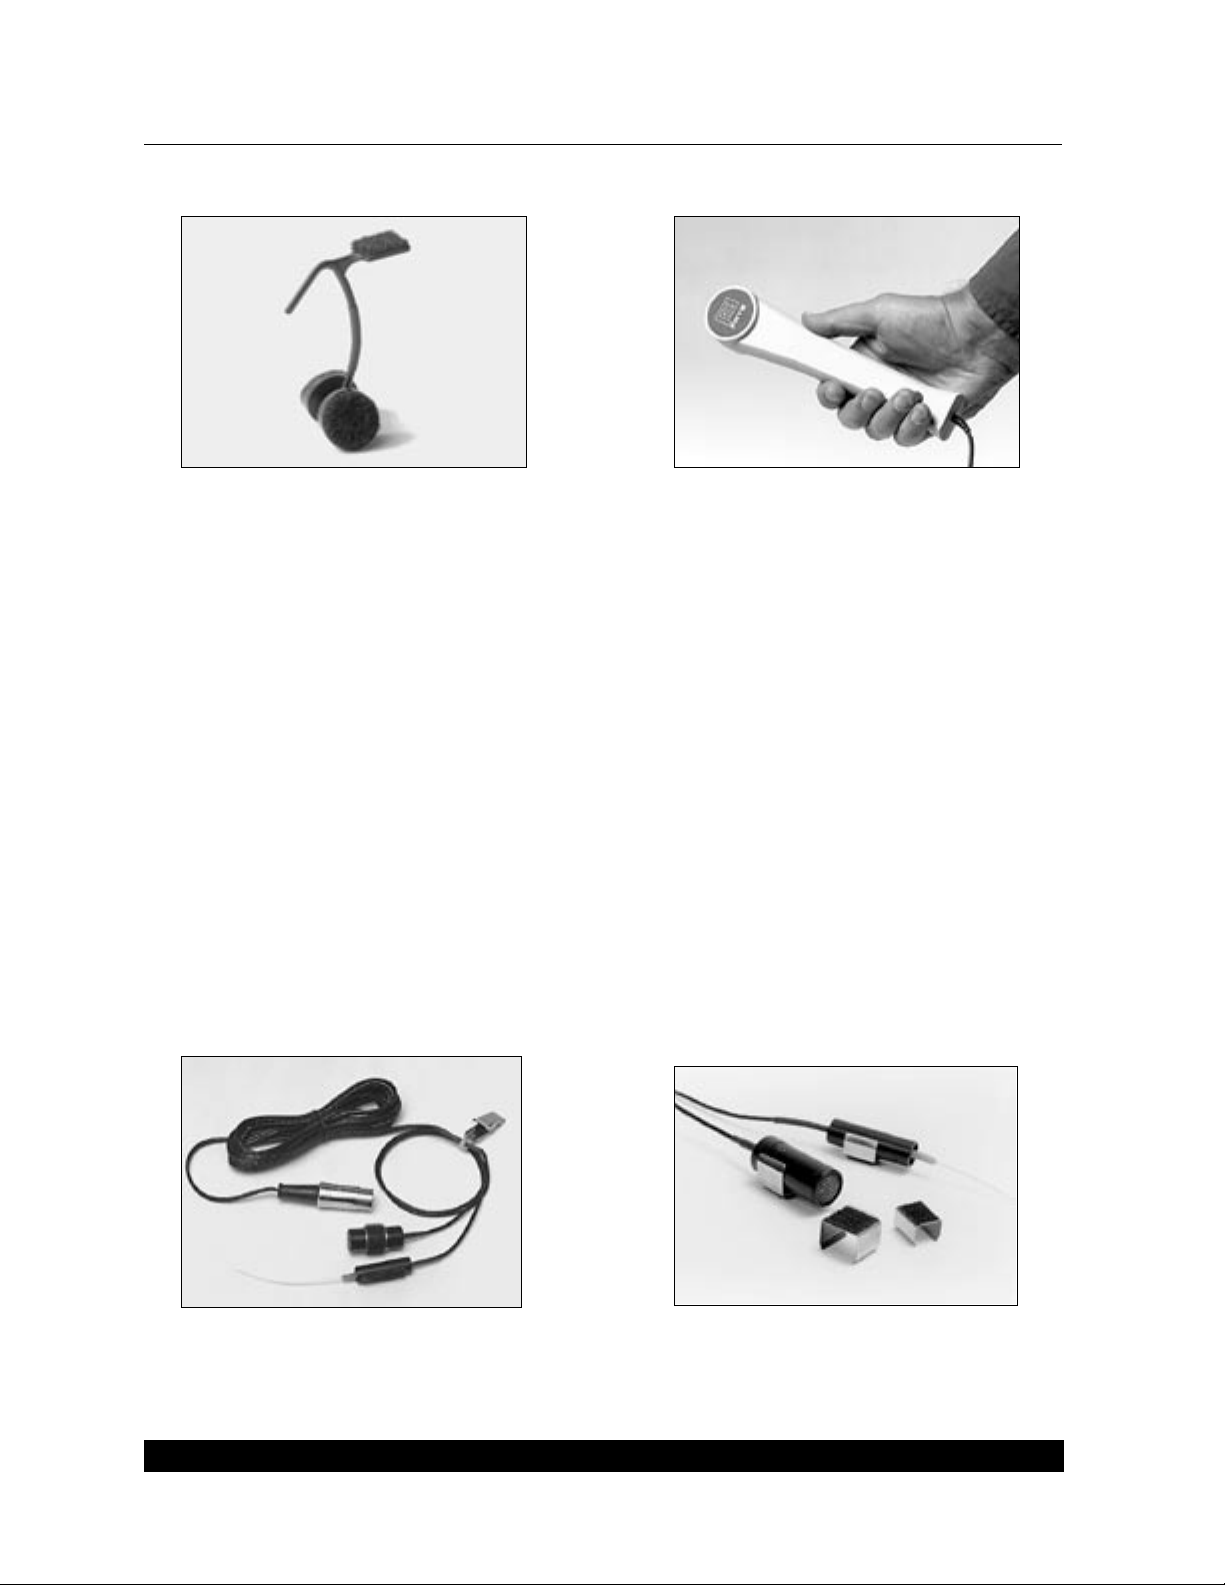
Child Size Wedge Style Earhook
Holds probe and reference microphones
during real ear testing.
Other Optional Accessories
• RS232 Option—RS232 cable
• Probe Extension Cable for 6040 & FP40 w/o Probe
• 6040 Sound Chamber Cable
• External Printer Package: serial-to-parallel converter, printer cable and custom cable
•Y adapter for using both external printer and RS232
• Eartips for insert earphones:
Eartips, 3A medium, 50/pk
Eartips, 3B small, 50/pk
Eartips, 3C large, 25/pk
• Battery Pills, #AA, #41 (with 12" cables. 24" cables available upon request)
•Maintenance Manual (on request at time of purchase
Telewand
For checking the telecoil response per
ANSI-S3.22-1996
1.4.3 Real-Ear Accessories
M200 Probe Microphone
8 FONIX FP40 Portable Hearing Aid Analyzer
Mounting Sleeves
(L) for reference mic
(R) for probe mic
Page 17

Wedge Style Ear Hook
Standard size
Holds probe and reference microphones
during real ear testing. Improved design
eliminates need for Velcro headband.
Optional Swing Arm, Speaker,
and Cable
Allows precise placement and aiming
of the loudspeaker.
Monitor Headset, folding
(Optional with FP40-D)
Other Real Ear Accessories
Set of 25 Probe Tubes
Ear hook, standard size
Ear Hook, children’s size
Velcro Headband
Calibration Clip
Felt Pen-dry erase
Probe Calibration Adapter
Introduction 9
Infant/Child Headband Package
Includes infant, child, and adult head
bands, six flexible earhooks, and two
sets of “animal ears.”
-
Page 18
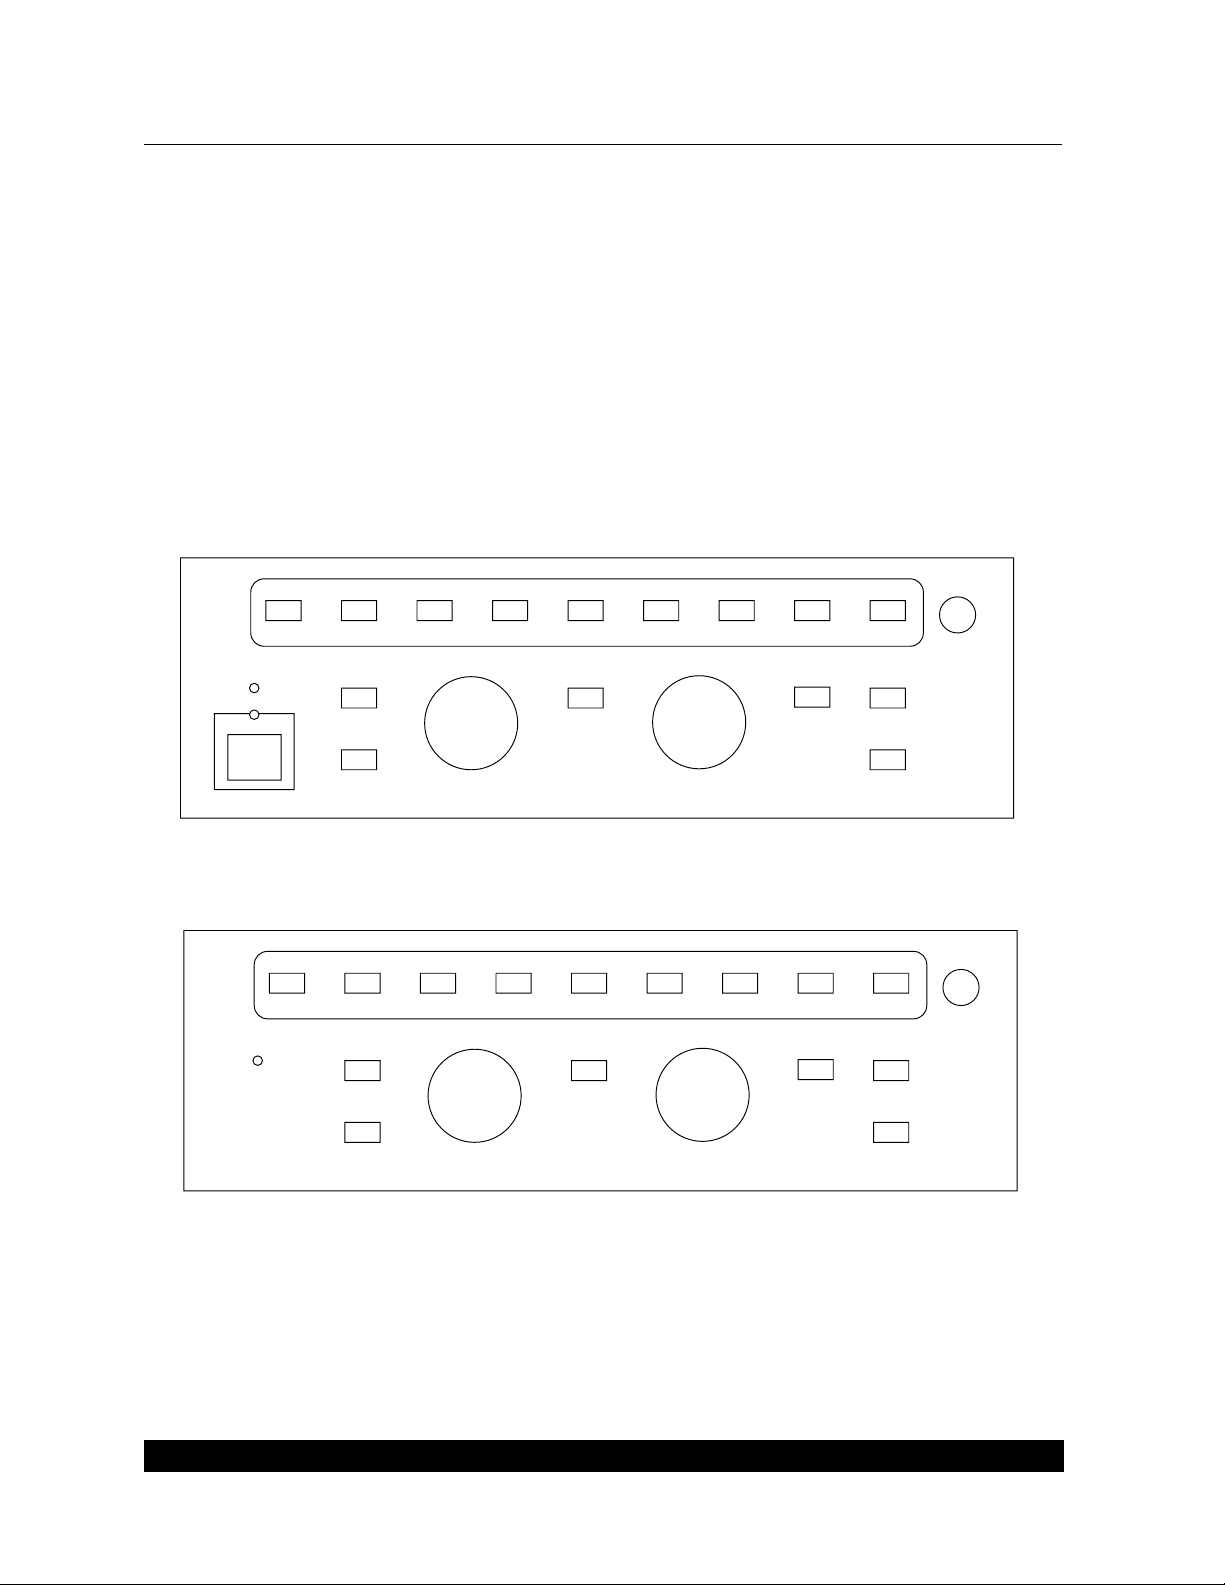
1.5 Layout & Controls
F1 F2 F3 F4 F5 F6 F7 F8 F9
LINE POWER
OPERATE
RESET
LEVEL
START/
STOP
DATA/
GRAPH
PRINT
FEED
FREQUENCY
AMPLITUDE
CONTRAST
F1 F2 F3 F4 F5 F6 F7 F8 F9
POWER
RESET
LEVEL
START/
STOP
DATA/
GRAPH
PRINT
FEED
FREQUENCY
AMPLITUDE
CONTRAST
This section gives a short explanation of the layout of the FP40 analyzer, its controls, and its functions
1.5.1 LCD (Liquid Crystal Display)
The FP40 is equipped with an LCD screen that displays test results and operational instructions in
both alphanumeric and graphical formats. This display is mounted on a swing-up door that can be
adjusted for optimum viewing by the operator.
Hint: If no display appears on the LCD screen, turn the contrast knob in the upper right corner, or
press any key.
Figure 1.5.1A—FP40 Front Panel Function Buttons
Figure 1.5.1B—FP40-D Front Panel Function Buttons
10 FONIX FP40 Portable Hearing Aid Analyzer
Page 19

1.5.2 Front Panel Buttons
There are nine function key buttons in the top row of the FP40 front panel. The function of each of
these keys changes as you move from screen to screen on the FP40.
The rest of the front panel buttons have specific functions that do not change with each new menu
selection.
Feed Feeds the paper through the printer.
Print Produces a hard copy of the data and graphs displayed on the LCD screen or
monitor screen.
Data/Graph Allows the screen presentation to be switched from graph to data table and
back again.
Start/Stop Starts or continues or stops a measurement action, depending on the particular
measurement task. When the instrument is running a continuous measure
ment, this button starts or freezes the measurement on the display. START/
STOP is also used to activate a menu selection.
FP40s manufactured prior to 8/22/90 are marked START/CONTINUE.
Level Along with START/STOP button, initiates a leveling action that takes a
response measurement and develops a set of frequency response corrections to
adjust the signal so that it is at the correct level for each test frequency.
-
Reset Resets the test signal to the amplitude and frequency you have chosen in the
SETUP MENU and interrupts current operation.
Operate Starts and terminates the measurement operation of the FP40. Use operate to
turn the instrument on and off. (There is no operate button on the FP40-D.)
1.5.3 Front Panel Lamps
Line Power Signals that the FP40 is connected to the power line, and that the main rear
panel-mounted power switch is switched “on.” If the Battery Option is installed,
this lamp may also indicate that the battery is being charged.
Operate When lighted, signals that the instrument is active. (Not on the FP40-D).
Introduction 11
Page 20

1.5.4 Front Panel Knobs
EXTERNAL
POWER
ON
OFF
HEADPHONES
EXTERNAL
SPEAKER
VIDEO MONIT
OR
SERIAL
INTERFACE
CAUTION
ELECTRICAL SHOCK HAZARD.
DO NOT REMOVE INSTRUMENT COVER.
REFER SERVICE TO QUALIFIED PERSONNEL.
0 08 6
Amplitude Controls the amplitude or loudness of the test signal. Is also used to move the
cursor up and down in making menu selections.
Frequency Controls the frequency of the test signal in pure-tone mode. Is also used to
move the cursor left and right when making menu selections. In the real-ear
target screen, it selects the amplitude in the audiogram tables.
Contrast Control Controls the contrast of LCD display. If no display appears, check this control
first.
Figure 1.5.5—Rear Panel
1.5.5 Rear Panel Controls
External Speaker A miniature phone jack that allows an external sound field speaker or sound
box (FONIX 6040) to be connected to the speaker drive from the FP40.
Headphones A standard 1/4 inch phone jack and volume control that allows the monitoring
of the sound reaching the probe microphone.
Serial Interface Nine pin D jack for RS232 connection and laser printer connection.
CE Mark This symbol indicates that Frye Eelctronics conforms to the Medical Device
Directive 93/42/EEC. If an external monitor or printer is used, it should also
have a CE mark in order for the FP40 to remain compliant.
Video Monitor Units with serial numbers 940000 and above have VGA connectors. Older units
have RCA jacks for composite
External Power Main power input switch. (On the portable version, operate button on front
panel must also be pushed to activate the instrument.)
12 FONIX FP40 Portable Hearing Aid Analyzer
monitors.
Page 21
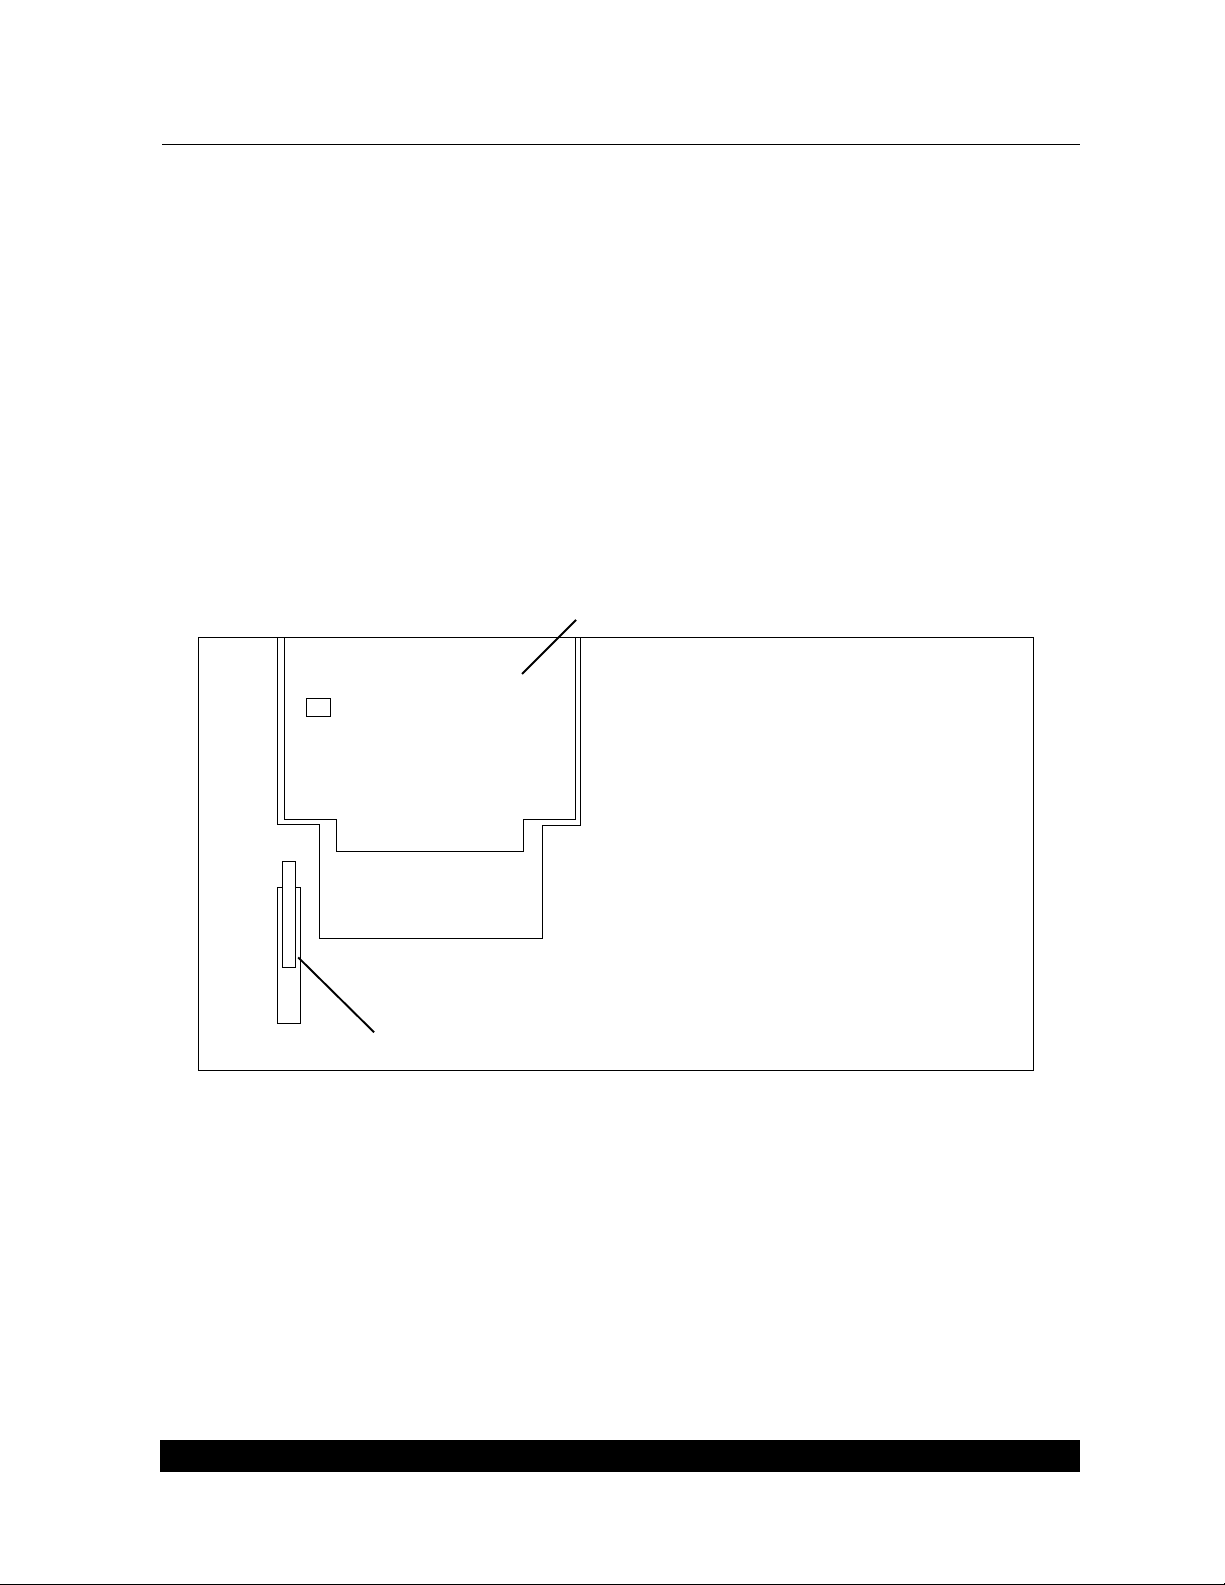
1.5.6 Right Side Mounted Jack and Module
Paper Release Lever
Printer Door
Line input connector, IEC computer variety.
Dual “snap in” fuse holder.
Instrument will automatically choose the proper voltage.
1.5.7 Sound Chamber Mounted Jacks and Controls
Jacks Battery replacement pill jack. Microphone jack.
Controls Gain controls for microphones.
Found on the left side of the sound chamber, near te speaker.
Marked: Probe Gain and Ref. Gain.
1.5.8 Top of Instrument, Printer
Figure 1.5.8—Electronics Module Top View
Introduction 13
Page 22
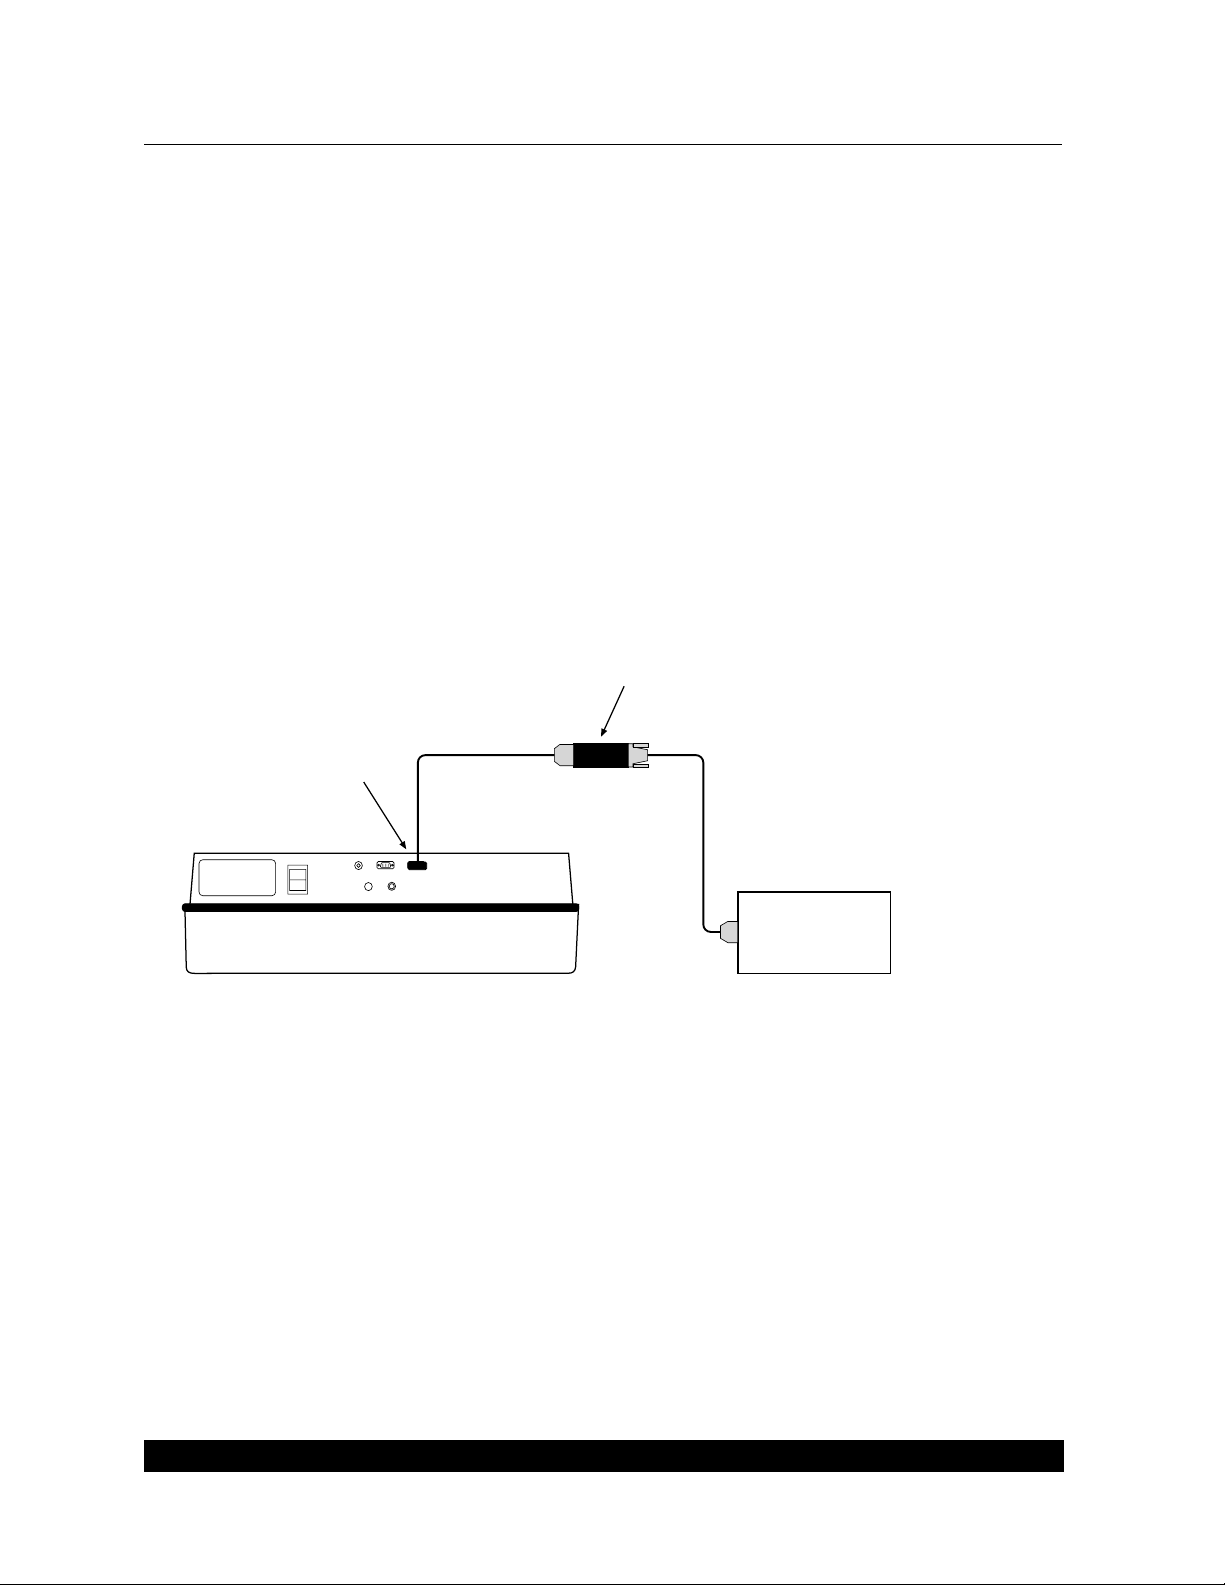
1.6 FP40 Setup
FONIX FP40
EXTERNAL
PRINTER
SERIAL-TO-PARALLEL
CONVERTER
SERIAL INTERFACE
This section describes how to set up the FP40 analyzer and prepare it for testing.
1.6.1 Setting up the instrument
Unpack and locate all accessories (in the lid/FP40; in the boxes/FP40-D). Save the shipping box in
case you need to send the unit in to us for repair or major upgrades. Choose a location for the FP40
which is relatively free of ambient sounds and vibrations. See Figure 1.5.5 for a drawing of the rear
panel
1.6.2 Connecting equipment
If you want to connect an external printer, you must have the External Printer Kit. This kit consists
of a special serial-to-parallel converter, a printer cable, a couple connectors, and an RJ11 cable. See
Figure 1.6.2.
14 FONIX FP40 Portable Hearing Aid Analyzer
Figure 1.6.2—External printer setup
1. Make sure the FP40 is turned off.
2. Attach the connector labeled “FP40 Printer” to the serial interface connector on the back of
the FP40.
3. Attach the RJ11 cable to the FP40 printer connector
4. Attach the connector labeled “Printer” to the other end of the RJ11 cable.
5. Attach the printer connector to the “RS232” side of the serial-to-parallel converter.
6. Attach the printer cable to the “Parallel” side of the serial-to-parallel converter.
7. Attach the other end of the printer cable to your external printer.
Page 23

If desired, plug in an external video monitor to the connector labeled “Video Monitor” on the back
of the FP40.
You can also plug in an external sound chamber or an external sound field speaker into the “exter
nal speaker” jack of the FP40.
Hint: When something is plugged into the external speaker jack, the sound source of the FP40 is
always delivered to that external source, regardless of whether you are performing a coupler test or
a real-ear test.
-
1.6.3 Connecting the line cord
Plug the line cord into the jack on the right side of the analyzer. Push the on-off rocker switch on
the back of the unit. The green LED labeled “line power” (FP40) or “power” (FP40-D) will light up.
This will turn on the analyzer if you have an FP40-D model. To fully turn on an FP40 model ana
lyzer, push the square gray button marked OPERATE on the front panel.
-
1.7 Miscellaneous
This section describes how to clean and service your FP40 analyzer. Warranty information is also
included.
1.7.1 Servicing Your FP40
Contact Frye Electronics, Inc., Box 23391, Tigard, Oregon 97281-3391 for service. Our toll-free
number is 1-800-547-8209. Our regular number is (503) 620-2722, or you may contact your local
Frye representative. We are also available on the internet. Our e-mail address is: service@frye.com,
and our web site is http://www.frye.com.
Units may be returned to Frye Electronics, Inc., 9826 S.W. Tigard St., Tigard, Oregon 97223. It is
advisable to contact the company or your local Frye representative first, since many problems can
be fixed without returning the whole unit. Printed circuit boards, for instance, may be exchanged. If
something must be returned, an RMA number will be issued.
When contacting the factory, please have the serial number of your instrument on hand. (Found on
the rear panel of the instrument.) It will also be helpful for you to be able to tell us the software
version installed on your machine. The software version and date of release are found on the LCD
when you turn the unit on (FP40-D) or press OPERATE (FP40).
1.7.2 Cleaning the FP40 Display
Cleaning of the FP40 LCD screen should be kept to a minimum to avoid scratching the surface. To
clean the LCD, first blow off any loose dust. Then wipe gently with a soft cloth moistened with glass
cleaner. The surface of the LCD is waxed to minimize scratching.
Introduction 15
Page 24

1.7.3 Emergency Shutdown
If you find it impossible to turn off the instrument using the OPERATE button in units with a
Battery Option, hold OPERATE down and then tap RESET twice. Or you can simply hold the
OPERATE button down for five seconds.
1.7.4 Warranty
The FONIX FP40/FP40-D and its accessories are guaranteed to be free from manufacturing defects
which would prevent the products from meeting these specifications for a period of one year from
date of purchase.
Battery pills are warranted for thirty days because they are necessarily fragile and can be damaged
by careless handling.
16 FONIX FP40 Portable Hearing Aid Analyzer
Page 25
Chapter 2: General Operation
This chapter discusses the general operation of the FP40 analyzer. You will learn how to navigate
through the different screens, use the General Setup Menu, and change the function keys to suit
your purposes. Other general operational topics will also be discussed such as source types, battery
pills, printers, and other topics.
2.1 Screen Navigation
You move through the different screens of the FP40 by using the function keys. The function keys
are the top row of buttons of the FP40 front panel labeled F1 through F9. Each button is labeled on
the display screen just above the function keys.
For example, in most screens, F1 is labeled “MENU.” This means that you get to the Menu by press
ing F1.
Hint: Whenever a function key is labeled with large letters, it is a navigational key. That is, pressing
it will take you to a different screen.
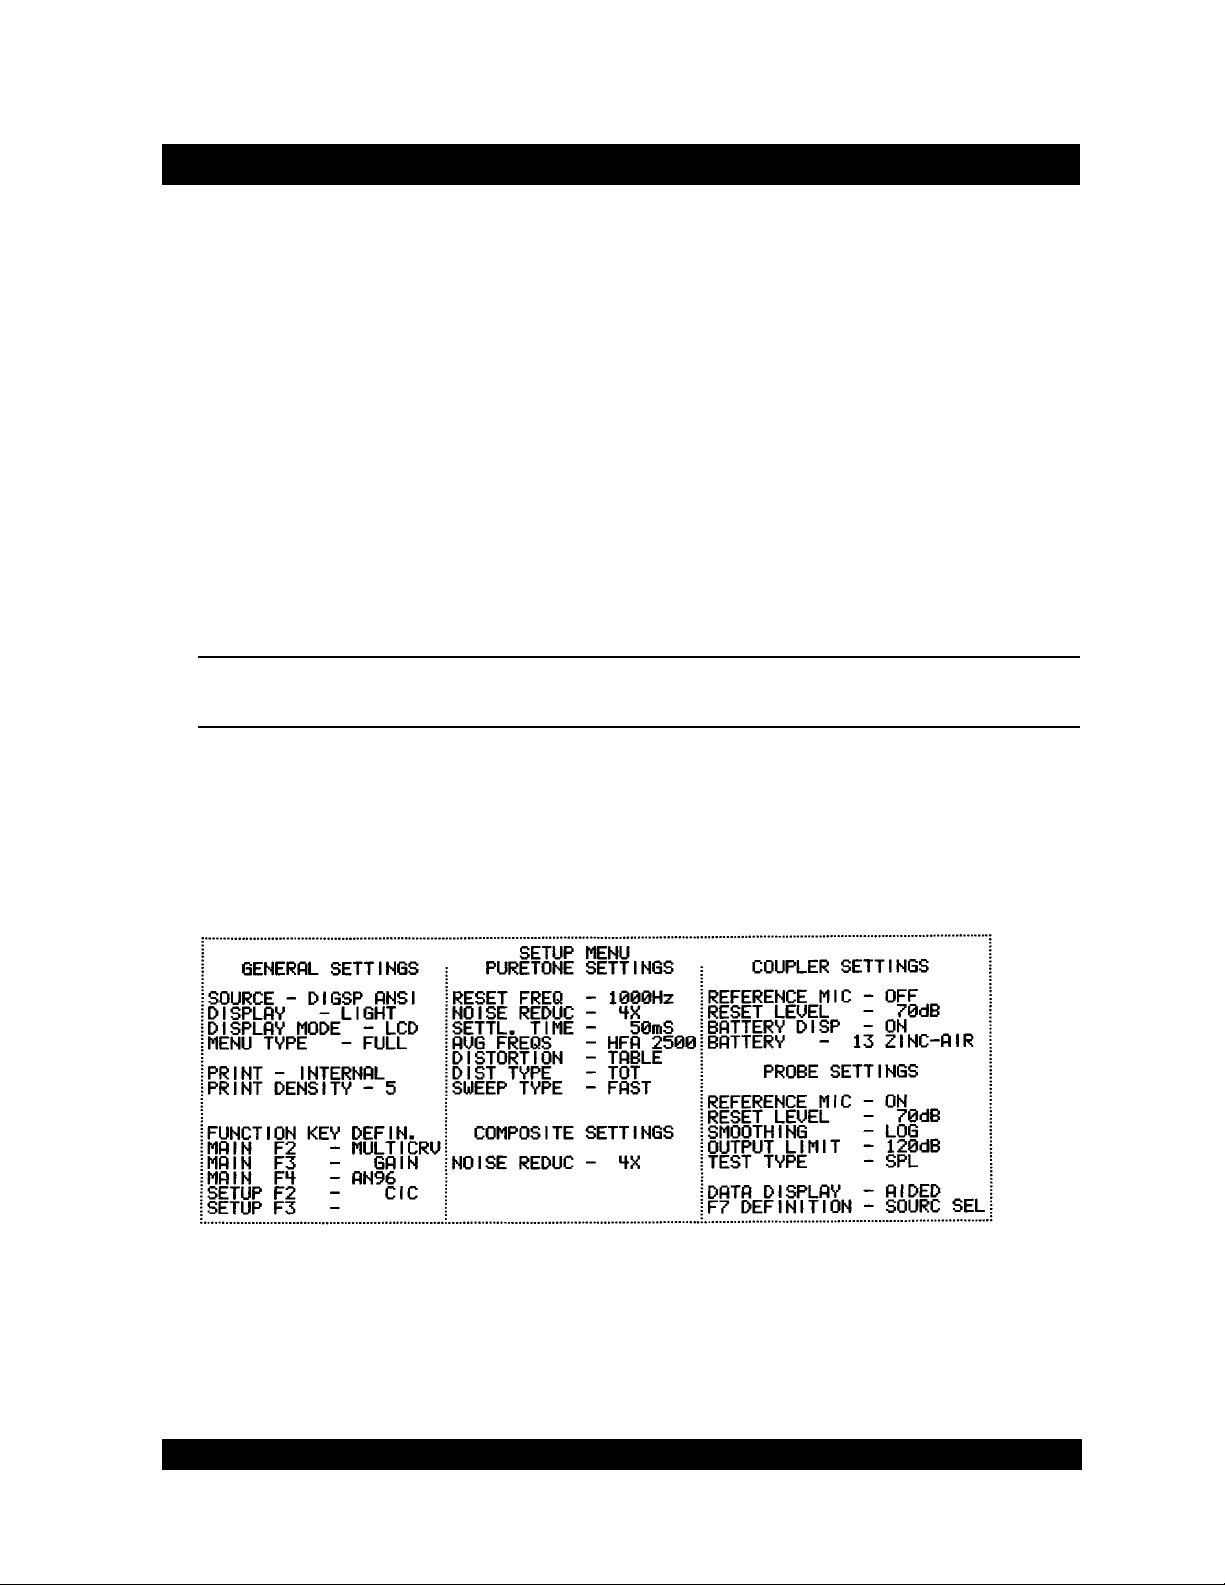
2.2 General Setup Menu
In the General Setup Menu, you can change most of the settings on the FP40. To enter the General
Setup Menu, press F1 from almost any screen.
-
Figure 2.2—General Setup Menu
General Operation 17
Page 26

2.2.1 Making selections
Notice the three columns in the General Setup Menu. Move the selection indicator (lines above
and below the selection) from one column to another using the FREQUENCY knob. Move the knob
slowly. You will feel each position change. Move the selection indicator up and down within the col
umns with the AMPLITUDE knob.
Push the START/STOP button, found in the very center of the front panel, to switch between the
available choices at the indicated position.
2.2.2 Saving changes
Unless you purposely make setup changes permanent, they will only be effective until you turn off
the analyzer. When the analyzer is turned on again, it will revert to default settings. However, you
can change the default settings to suit your own needs.
• To change the default setting of an individual item, highlight the item in the General Setup
Menu, change it to the desired setting, and press F8. This will store the individual item set
ting.
• To set the default settings of the entire menu at once, make any desired changes in the
General Setup Menu, and press F9. This will store the entire menu.
-
2.2.3 Switching between partial and full menus
-
Not all the items in the General Setup Menu will apply to every screen of the FP40. In order to
avoid information overload, the FP40 has a “Partial
If the FP40 is in PARTIAL Menu mode, it will only display the items of interest to the screen you
just left. For instance, if you enter the General Setup Menu from the Main Coupler Screen, the par
tial menu will not display Probe Settings. Also, if you have selected a composite signal source, it
will not display the pure-tone settings.
When the FP40 is in FULL Menu mode, it will display all available settings, regardless of the screen
that you just left or the signal source you have chosen.
To switch between Partial Menu mode and Full Menu mode, select MENU TYPE in the General
Setup Menu. Choose between FULL and PARTIAL.
Menu” mode.
-
18 FONIX FP40 Portable Hearing Aid Analyzer
Page 27

2.3 Using Function Keys
The front panel of the FP40 analyzer contains nine function keys, F1 through F9. These keys control
the navigation through the FP40 screens as well as some settings in each screen.
2.3.1 Hints
The first thing you need to understand when working with the FP40 is the concept of “function
keys.” In order to make it easier to add new functions and screens to the FP40, we made the func
tion of keys F1 through F9 vary, depending upon the current screen and your current settings. Here
are three simple things to remember about function keys:
• The function of the keys vary, depending upon the current screen
• The labels above the keys always indicate the function of that key. They are never labels for
the current screen.
• Small labels indicate the function key toggles a setting. Large labels indicate the function key
will take you to a different screen.
These three points are explained in more detail below.
Varying Function Keys
The function of the keys vary, depending upon the current screen. There are nine function keys
used on the FP40 to toggle common settings and switch between screens. We’ve tried to make the
function of each key be as consistent as possible when you switch from screen to screen.
-
For example,
• F1 is generally the “MENU” key. Pressing it will usually take you to the General Setup Menu.
• F4 in the Main Coupler Screen will take you to an automated test sequence such as ANSI. F4
in the ANSI Screen will exit you back to the Main Coupler Screen.
The function of each key for each screen is clearly labeled above the function key on the display.
Function Key Labels are NOT Screen Labels
As mentioned above, the function of each key is labeled on the display above the key. This label
always denotes the function of the key. Function key labels are never labels for the current screen.
Sometimes it’s easy to see “PROBE” above F5 and think that you are in the probe screen. Remember
that the label above F5 actually means that you need to press F5 in order to enter the Probe Screen.
The actual labels for the screens can usually be found in the top center of the screen.
Small Labels vs. Big Labels
There are two main types of function keys: setting keys that change a common setting in the
current screen, and directional keys that take you to a different screen. In order to easily
differentiate between the two types of keys, we generally use small letters to denote a set
ting key and large letters to denote a directional key. There are a couple of exceptions to
this rule, but not many. Here’s an example from the Main Coupler Screen:
-
General Operation 19
Page 28
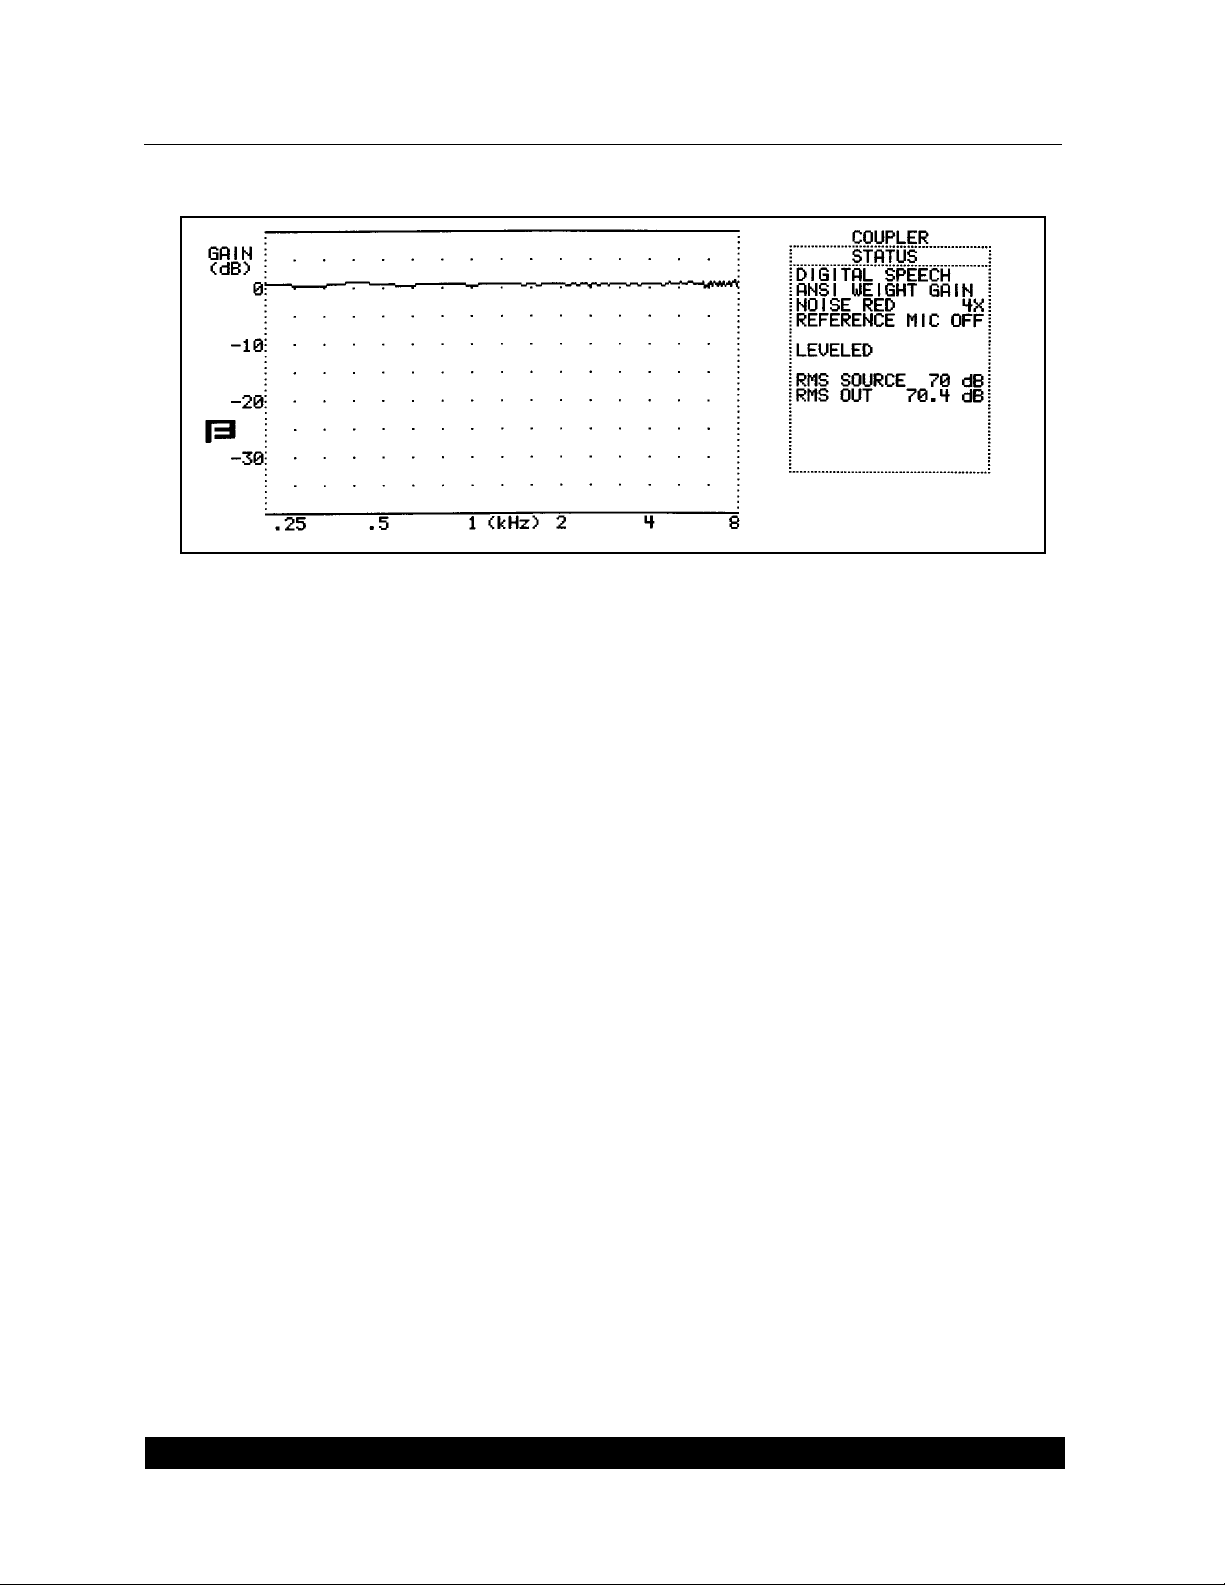
Figure 2.3.1—The Main Coupler Screen
Notice that F1, F4, and F5 are written in large letters. They take you to the Menu, ANSI 96, and
Probe Screens, respectively. F2, F3, F6, F7, and F9 are all settings that pertain to the current Main
Coupler Screen.
2.3.2 Customizing the function keys
As described in Section 2.3.1, the functions of F1 through F9 will vary, depending upon the current screen. Most of the time, the functions of these keys in each screen are set at the factory and
cannot be changed. However, the FP40 does allow you to customize the function of several keys.
This allows you to change the FP40 screen to fit your testing needs. Most of these are set in the
FUNCTION KEY DEFIN section of the General Setup Menu.
MAIN F2 & MAIN F3: These settings change the function of F2 and F3 in the Main Coupler
Screen. Usually, you can select from AVG, GAIN, MULTICURVE, and TELECOIL. (These options are
explained in Chapter 3.) The available settings are dependent upon the options on your FP40, so
you may have some additional functions available.
MAIN F4: This setting changes the automated coupler test sequence available from the Main
Coupler Screen. Depending upon the options you purchased with your FP40, you may have only
one choice for this key, or you may have multiple choices. See Chapter 4 for more information on
automated test sequences.
SETUP F2 & SETUP F3: These selections allow you to customize the function of F2 and F3 in the
General Setup Menu. This allows you to adjust functions used in the Main Coupler Screen that you
might not need to change often.
For instance, if you always want to have Multi-Curve turned on in the Main Coupler Screen, you
can have it set to ON in the General Setup Menu, freeing up either F2 or F3 in the Main Coupler
Screen for a more commonly changed function, such as CIC.
20 FONIX FP40 Portable Hearing Aid Analyzer
Page 29

Note: If you toggle a function with SETUP F2 or SETUP F3, that function will remain in that setting until you explicitly change it back or turn off the analyzer. For example, if you were to: 1)
Choose MULTICURVE for SETUP F2, 2) Turn MULTICURVE ON using the F2 button in the General
Setup Menu, 3) Choose CIC for SETUP F2, then Multi-Curve would remain ON in the Main Coupler
Screen even though it would no longer be the selection for SETUP F2.
F7 DEFINITION: This selection is in a different section in the General Setup Menu than the
previously described selections. This is because MAIN F2-F4 and SETUP F2-F3 all affect the Main
Coupler Screen. F7 DEFINITION, located in the PROBE SETTINGS section of the General Setup
Menu, affects the F7 key in the Main Probe Screen. A setting of SOURC SEL will make F7 in the
Main Probe Screen toggle between the different source types available on your FP40. This is handy
when you’re doing a real-ear test, and you need to be able to quickly switch your source type. For
example, you may want to switch between a composite signal and a digital speech signal. A setting
of SNGL TONE allows you to present a single pure-tone signal to the aid (instead of running an
entire pure-tone sweep).
2.4 Source Types
There are two main types of sources available on the FP40 analyzer: pure-tone and composite.
Three kinds of pure-tone sweeps come standard with the FP40: normal, fast, and short. When you
purchase the Composite Option, you will receive the Composite, Digital Speech ANSI, and Digital
Speech ICRA signals.
The type of source you should choose for a particular test or type of hearing aid depends upon the
signals you have available and the situation. Here is a description of each of the source types and
when you would want to use them.
2.4.1 Understanding Pure-tone signals
A pure-tone sweep is a test involving a progression of pure tone signals presented at a specified
level. When the sweep is complete, the aid’s frequency response at those frequencies is displayed on
the graph (or data column).
There are three types of pure-tone signals: normal, fast, and short.
• NORMAL: Contains 43 different frequencies and only does one sweep before ending the test.
• FAST: Contains 16 different frequencies and continually sweeps through them until you stop
the test. The fast sweep is meant to be used as a real-time continuous signal convenient for
use while adjusting hearing aids. It is an alternative to the composite signal.
• SHORT: Contains 10 different frequencies and only does one sweep. It is primarily used for
testing loud levels in real-ear measurements.
General Operation 21
Page 30

2.4.1.1 Pure-tone settings
There are several different settings available in the General Setup Menu for pure-tone signals. Here
is an explanation of those settings.
RESET FREQ: The frequency the analyzer returns to when RESET is pressed.
NOISE REDUC: The amount of noise reduction used in pure-tone measurements. See Section
2.4.1.2.
SETTL. TIME: The amount of time each tone is presented before the measurement is made. See
Section 2.4.1.3.
AVG FREQS: The frequencies used with the AVG function that averages the responses of three dif
ferent frequencies. Each frequency set is represented on the screen by the highest frequency in the
set. The sets are:
HFA (High Frequency Average) - 1000, 1600, 2500
SPA (Special Purpose Aids) - 800, 1250, 2000
SPA - 1250, 2000, 3150
“ “ - 1600, 2500, 4000
“ “ - 2000, 3150, 5000
IEC– (HAIC) - 500, 1000, 2000
DISTORTION: The type of harmonic distortion display.
DIST TYPE: Type of harmonic distortion tested. See Section 2.4.1.4.
SWEEP TYPE: Type of pure-tone sweep used in measurements. Choose NORMAL, FAST, or SHORT.
2.4.1.2 Noise Reduction
Noise reduction is used in noisy testing environments. Pure-tone noise reduction takes several measurements at each frequency and averages those measurements together. You can select the amount
of measurements and averaging in the General Setup Menu, in the PURETONE SETTINGS section,
under NOISE REDUC.
Larger noise reduction numbers lead to smoother curves but increase the amount of time it takes to
complete a pure-tone sweep.
-
2.4.1.3 Settling Time
When you are measuring with pure-tone sweeps, you are offered a choice of settling times. By this
we mean that the tone source will be continued for a chosen amount of time before the measure
ment is made. This choice is allowed because some hearing aid circuits take a longer time than oth
ers to adjust to changes in amplitude or frequency. If the measurement is made too quickly, an arti
fact in testing will be created. If the measurement takes too long, the test is longer than necessary.
22 FONIX FP40 Portable Hearing Aid Analyzer
-
-
-
Page 31

In determining the length of time needed for the proper measurement, a good rule is to use twice
the published attack time of the hearing aid. If you are unsure of the attack time, you can experi
ment with longer times and shorter times and see if there is any difference in the test results. Linear
aids can be tested very quickly, so a delay of 20 mS is usually fine. Other aids are quite variable.
-
2.4.1.4 Ha
Harmonic distortion occurs when a hearing aid clips the peak of a pure-tone input signal, resulting
in artifacts at harmonics (integer multiples) of that input signal. For example, if you present a 500
Hz tone to the hearing aid, distortion artifacts could occur at 1000 Hz and 1500 Hz.
The harmonic distortion measurement is expressed as the percentage of the power of these distor
tion artifacts to the power of the input signal. All hearing aids will have some amount of distortion.
Usually, the strongest artifacts occur at the second and third harmonics of the frequency. With the
FP40 analyzer, you can test the amount of distortion available in the second harmonics, the third
harmonics, or both harmonics (considered “total harmonic distortion”). This is selectable in the
General Setup Menu.
rmonic Distortion
-
2.4.2 Understanding Composite signals
There are three types of composite signals: Composite, Digital Speech ANSI, Digital Speech ICRA.
The Composite signal is a continuous broadband signal containing 79 different frequencies pre
sented simultaneously. This makes it much faster than a pure-tone because there is no waiting for a
progression of tones to complete – instead, you get the entire frequency response instantly, updating
about twice a second.
The digital speech signals are interrupted versions of the Composite signal that are used for testing
high end digital hearing aids. Many high end digital aids (though not all) use a technology called
“speech enhancement” or “noise reduction.” These aids respond to any continuous signal as if it
were noise, and lower the gain at the offending frequencies. Unfortunately, these aids regard the
Composite signal or pure-tone sweeps as noise, making them difficult to test using traditional meth
ods.
-
-
The Digital Speech signals were developed as a way to test these high end hearing aids. Instead of
presenting a continuous signal, they present an interrupted signal that the aid regards as speech
instead of noise. There are two varieties: Digital Speech ANSI and Digital Speech ICRA.
2.4.2.1 ICRA vs. ANSI
There are two types of Digital Speech signals: Digital Speech ICRA and Digital Speech ANSI. Both
are interrupted composite signals for testing digital hearing aids. They differ in the speech spectrum
they use.
General Operation 23
Page 32

Digital Speech ANSI uses the same speech spectrum as the Composite signal. This speech spectrum,
taken from the ANSI S3.42 standard, rolls off the high frequencies starting with 3 dB down at 900
Hz and continuing at a rate of 9 dB per octave. Digital Speech ICRA uses the ICRA speech spectrum
developed by the International Collegium of Rehabilitative Audiology. The ICRA spectrum is based
on the Long Term Average Speech Spectrum (LTASS) and rolls off the high frequencies more rapidly
than the ANSI spectrum. Figure 2.4.2.1 shows a comparison of the spectra.
Figure 2.4.2.1—Comparison of Digital Speech ICRA (CRV 1) and Digital Speech ANSI (CRV 2)
2.4.2.2 Noise Reduction
There is only one setting for the composite signals in the General Setup Menu: NOISE RED.
Composite noise reduction is a little different than pure-tone noise reduction, even though both are
used for noisy testing environments.
When a composite signal is running, the analyzer takes several different measurements a second
displays them on the screen. Composite noise reduction performs a “running average” of these com
posite measurements. This means it averages together several of the previous measurements with
the current measurement to produce the next curve. If you select “2X” noise reduction, it will aver
age the last two measurements together. A selection of “4X” averages the last four measurements
together.
Larger noise reduction numbers lead to smoother curves but increase the amount of time it takes
the analyzer to update its composite measurements.
2.4.2.3 Intermodulation Distortion
The composite signals are helpful for identifying intermodulation (IM) distortion. IM distortion
occurs when amplitudes at more than one frequency in a signal combine to create an amplitude at
a frequency not present in the original signal. When viewing a graph run with a composite signal,
look for points along the graph where the line “breaks up.” Such an appearance indicates the pres
ence of IM distortion. See Figure 2.4.2.3 for an example of IM distortion.
-
-
-
24 FONIX FP40 Portable Hearing Aid Analyzer
Page 33

This type of distortion is only apparent when a composite signal source is used because pure-tone
sweeps do not present more than one frequency at a time.
Figure 2.4.2.3—IM distortion
2.4.2.4 Composite source levels
When you adjust the amplitude of a composite signal, you are adjusting the root-mean-square
(RMS) of the signal, not the amplitude of the individual frequency components. None of the ampli
tudes individual frequency components will be as high as the amplitude of the overall signal.
-
This is particularly noticeable when you view the test signal in dB SPL because this allows you to
see the actual power of each frequency component. See Figure 2.4.2.4 as an example of this phe
nomenon. In this figure, the displayed curve has a 70 dB SPL RMS amplitude. Notice that the level
at each frequency varies from –10 dB to –30 dB from the overall amplitude.
The amplitude differences in the individual components of the composite signal will be reflected in
the frequency response of a hearing aid. Keep this in mind when viewing results in dB SPL.
Figure 2.4.2.4—Composite signal with an amplitude of 70 dB SPL RMS
General Operation 25
-
Page 34

2.5 Display Mode
Although the FP40 comes standard with an LCD screen, it is easy to hook up an external monitor
for a larger, more colorful display.
To attach the video monitor:
Hook a standard computer monitor to the port labeled “Video Monitor” on the back of the FP40
analyzer.
To view with the video monitor:
• Press F5 from the Opening Screen of the FP40 analyzer. This is the screen that appears only
when you first turn on the analyzer.
— or —
• Highlight DISPLAY MODE in the General Setup Menu by using the Amplitude and Frequency
knobs. Select VGA by pressing the START/STOP button. You can also use this selection to
switch back to LCD mode.
2.6 Battery Current Drain
You can measure the battery current drain of hearing aids in the Main Coupler Screen and in any
of the screens of the automated test sequences (such as ANSI ’96). To do this, you must insert the
appropriate battery pill into the hearing aid, and plug the battery pill into the jack located on the
left side of the internal sound chamber. See Figure 2.6A.
Figure 2.6A—Using a battery pill to measure the battery current drain
26 FONIX FP40 Portable Hearing Aid Analyzer
Page 35

To turn on the battery current drain measurement in the Main Coupler Screen:
1. Press F1, MENU, from the Main Coupler Screen.
2. Select BATTERY DISP in the third column of the screen, under COUPLER SETTINGS.
3. Press START/STOP to toggle ON.
4. Press F1 to exit back to the Main Coupler Screen. You should now see a battery current read
ing under the Status Box. See Figure 2.6B.
5. Press F7 to select the battery pill that you are using.
To set the default battery pill:
1. Press F1, MENU, from the Main Coupler Screen.
2. Select BATTERY in the third column on the screen, under COUPLER SETTINGS.
3. Press START/STOP to toggle the desired selection.
4. Press F8 to store that selection as the default.
-
Figure 2.6B—Coupler screen with battery drain
Note: You must use a pure-tone or composite source for the battery current drain to function. It
will not work with the Digital Speech source types.
General Operation 27
Page 36

2.7 Using the DATA button
Although it’s usually more useful to display test results in the familiar graph format, it can often be
useful to look at the actual numerical data. You can do this in the Main Coupler Screen or in the
real-ear measurement screens.
To switch back and forth between graphical and numerical data format, press the DATA/GRAPH
button on the FP40 main panel. See Figure 2.7.
Figure 2.7—DATA coupler screen
Notes:
• Only one measurement curve can be displayed in numerical format at a time. When working
with multiple measurement curves, select the curve you want to view with F6 in the Main
Coupler Screen and F3 in a real-ear measurement screen.
• The DATA/GRAPH button only works in the Main Coupler Screen and the real-ear measure
ment screens. You can’t use it to view numerical data in an automated test sequence screen.
-
2.8 External Sound Chamber or Speaker
If you are in a noisy testing environment, it might be useful to have an external sound chamber.
The 6040 sound chamber has better sound isolation than the standard internal sound chamber of
the FP40. It also has a larger work space in the chamber, which makes it easier to take aids in and
out of the chamber.
When performing real-ear measurements, it’s often more convenient to have an external speaker
on a swing arm or a floor stand so you can move the speaker around the patient, rather than the
patient around the speaker. This makes external speakers convenient for clinicians who don’t move
their analyzers around often.
28 FONIX FP40 Portable Hearing Aid Analyzer
Page 37

To use an external sound chamber or an external speaker, plug it into the jack labeled “external
speaker” on the back of the FP40.
Hint: Whenever you have an external sound source plugged into the external speaker jack on the
FP40 analyzer, all sound from the analyzer goes to the external sound source, no matter what oper
ational screen you are viewing. To avoid confusion, unplug the external sound source when it’s not
in use.
2.9 Printing
You can print the screen display either by using the internal thermal printer, or by using the
External Printer Kit to connect an external printer. In either case, printing performs a screen dump
of the current screen on your display. (Help messages and function key labels will not print.)
Here are some general instructions:
• Press PRINT to start printing. Press PRINT again to stop printing.
• Press FEED to feed the paper.
2.9.1 Selecting the printer
-
1. Press F1 from almost any screen to enter the General Setup Menu.
2. Select PRINT in the GENERAL SETTINGS column using the frequency and amplitude knobs.
3. Press START/STOP to cycle through your choices. They are:
• INTERNAL for the thermal printer,
• HPCL MONO for an external black and white HP-style printer,
• HPCD COLOR for an external color HP-style printer,
• EPSON 9 MONO for an external black and white Epson printer,
• EPSON 9 COLOR for an external color Epson printer.
4. Press F1 to exit from the General Setup Menu.
2.9.2 Using the thermal printer
To use the thermal printer, just follow the directions found in Section 2.8.1 to make sure that
INTERNAL is selected for PRINT in the General Setup Menu, and push the PRINT button.
Possible errors:
• If the printer is out of paper, it won’t function, and you will see the message “PLEASE INSTALL
NEW ROLL OF PAPER IN THE PRINTER” on the bottom of your screen.
General Operation 29
Page 38

• If the print head is up, you will see the message PLEASE PUSH LEVER NEXT TO THE
PRINTER. To correct this, push the black lever to the left of the thermal printer.
To change the paper:
1. Remove the printer door by pushing the small black knob on the printer door to the right.
2. Remove the paper roller.
3. Place the new paper roll on the roller and insert it into the paper slot. Refer to the drawing on
the inside of the printer door.
4. Pull the black lever to the left of the printer to raise the print head.
5. Thread the paper through the printer.
6. Push the black lever to the left of the printer to lower the print head again.
7. Press FEED and PRINT to test the operation.
8. Replace the printer door.
To change the print density:
The print density controls the darkness of the printout. There are five degrees of darkness with 0
being the lightest and 5 being the darkest. (It is not adjustable on the FP40-D analyzer.)
Select the PRINT DENSITY in the General Setup Menu.
To save printouts:
Although the paper we use with the FP40 is a good quality thermal paper, any thermal printing can
eventually fade over time. To minimize fading, store away from the light in a cool, dry place. Do
not store the strips in plastic or put cellophane tape on them, and avoid fingerprints.
If you want to be absolutely certain that you will have the data for many years, use a regular copier
to duplicate the printed results.
2.9.3 Using an external printer
Follow the directions found in Section 1.6.2 for instructions on hooking up an external printer.
Note: When you use an external printer and an external monitor, it will print in the format shown
on the video monitor. If you use an external printer and the FP40’s LCD display, it will print in the
format shown on the LCD display.
Will your printer work?
Some external printers, both black & white and color, may be used with the FP40 and FP40-D. Both
Epson nine-pin dot-matrix printers, and HP printers which support HP PCL (Hewlett Packard Printer
Computer Language) version 3.0 or higher are compatible. To use these printers, you must purchase
30 FONIX FP40 Portable Hearing Aid Analyzer
Page 39

the External Printer Package from Frye Electronics containing a custom cable (PN 119-0312-00), a
series-to-parallel converter, and a printer cable.
The FP40 will work with all new HP LaserJet printers, and with many Deskjet printers (check lan
guage specifications in the printer manual). Also, the Epson FX-870, FX-880, and FX-1170 printers
are compatible. If the printer uses PPA (Printer Performance Architecture) it will be incompatible
with FONIX instruments. Examples are the Deskjet printers from the 720, 820, and 1000 series. A
list of compatible printers is maintained on our web site, www.frye.com, under the “Support” menu.
Some notes on using an external printer
• Although the FP40 has only one serial port, it is possible to have both the external printer and
a computer hooked up at the same time to the analyzer. You will need a special Y adapter. It is
not possible to use the computer to control the FP40 while printing.
• You can change the SPEED of the connection between the FP40 and the external printer in the
General Setup Menu. Choose 9600, 19200, 38400, or 57600 baud.
-
2.9.4 Printing a label
If a label is desired to identify the measurements taken, you can toggle the creation of a label with
all printouts by pressing the F9 buton in most screens. Here is a sample label:
Figure 2.9.4—Label
General Operation 31
Page 40

2.10 The Opening Screen
The Opening Screen of the FP40 (Figure 2.10) contains some useful information including:
• Software version of your analyzer,
• Option code of your analyzer,
• RS232 availability,
• Frye Electronics contact information.
In the Opening Screen, you can turn on and off the screensaver, and switch from LCD to VGA dis
play mode. The screensaver turns off the LCD backlighting if the unit hasn’t been used in 15 min
utes. You can deactivate it by pressing any key.
Figure 2.10—Opening Screen of the FP40
2.11 The Battery Option (not available on FP40-D)
FP40s that have a battery pack will have a “fuel gauge” on the main display reporting the state of
charge of the battery.
-
-
The reading on the fuel gauge will be accurate in a minute or two after pushing the OPERATE but
ton. A new, fully charged battery will operate the instrument for approximately three hours. The
fuel gauge will be accurate plus and minus 20%. There is no way to completely predict how long
a charge will last because of all the variables of temperature, battery condition, power supply vari
ance, and load.
Close examination of the fuel gauge will reveal an arrow pointing to the right when the battery
is being charged, while an inverse arrow pointing to the left will be displayed when the battery is
being discharged. If the fuel gauge is halfway between E and F, you have approximately half the
battery time left, and so on.
32 FONIX FP40 Portable Hearing Aid Analyzer
-
-
Page 41

You may still be able to operate when the gauge shows empty, but you are on reserve. Battery operation shuts down when the battery voltage reaches approximately 10 volts.
If the software fails and the battery discharges to 9.2V, there is an automatic hardware shutdown to
protect the batteries.
Be sure to recharge the batteries within 24 hours if the instrument shuts down (having reached
10V), to prevent damage to the batteries.
Replace the batteries when you are dissatisfied with the longevity of the charge, or when the bat
tery does not hold a charge for more than an hour.
If you find it impossible to turn off the instrument using the OPERATE button in units with a
Battery Option, hold OPERATE down and then push RESET twice.
-
General Operation 33
Page 42

Page 43

Chapter 3: Coupler Measurements
The Main Coupler Screen is the first operational screen you encounter when using the FP40. In it,
you can take coupler frequency response curves and view them in either dB GAIN or dB SPL. By
default, the FP40 comes with three different types of pure-tone sweeps that you can use as signals
to generate the response curves. You can also add the Composite and Digital Speech signals for test
ing AGC and digital hearing aids.
3.1 The Main Coupler Screen
The display of the Main Coupler Screen varies depending upon whether you have chosen a puretone source (available on all FP40 analyzers) or a Composite/Digital Speech source (optional).
3.1.1 Viewing a Pure-tone display
-
Figure 3.1.1—Pure-tone coupler screen
1. Display type: dB GAIN or dB SPL
2. Signal type
3. Pure-tone sweep type
4. Amount of noise reduction used (see Section 2.4.1.2)
5. Status of reference microphone
6. Leveling status
7. Source level of signal used in graph
8. Battery current drain (only if turned on)
Coupler Measurements 35
Page 44

3.1.2 Viewing a Composite display
Figure 3.1.2—Composite coupler screen
1. Display type: dB GAIN or dB SPL
2. Signal type
3. Composite weighting
4. Amount of noise reduction used (see Section 2.4.1.2)
5. Status of reference microphone
6. Leveling status
7. Source level of signal
8. RMS out measured by analyzer of current graph
9. Battery current drain (only if turned on)
3.2 Leveling
Leveling is the process by which the response of the sound chamber is measured and computer-corrected so that a “flat” sound field is achieved. The leveling status can be saved into the FP40 analyz
er’s permanent memory so you don’t have to level the analyzer every time you turn it on. However,
if you get your analyzer calibrated, or if you get a software upgrade, you should always level the
chamber again (and save the leveling).
If you are getting bad coupler frequency responses that you suspect are the fault of the analyzer
rather than the fault of the hearing aid, the first step of troubleshooting is to level the sound cham
ber. Even if the screen says LEVELED, the response of the measurement microphone may have
-
-
36 FONIX FP40 Portable Hearing Aid Analyzer
Page 45

altered since the analyzer was last leveled, invalidating the leveling. When in doubt, level the sound
chamber again.
3.2.1 Leveling without the reference microphone (standard)
The leveling process described here is adequate for most testing situations. If you have the Probe
Option, you can also level the sound chamber using the reference (probe) microphone. That meth
od is described in Section 3.2.2.
1. Look in the Coupler Status Box. Make sure it says “REFERENCE MIC OFF.” If the reference
microphone is ON, turn it off in the General Setup Menu.
2. Open the sound chamber.
3. Place the measurement microphone at the center of the speaker cone in the sound chamber.
See Figure 3.2.1.
-
Figure 3.2.1—Leveling without the reference microphone.
4. Close the chamber lid.
5. Press LEVEL.
6. Press START/STOP.
To save the leveling information so it will be used the next time you turn on the analyzer, go to
Section 3.2.3.
3.2.2 Leveling with the reference microphone
If your unit has the Probe Option, you can use the probe microphone as a reference microphone in
leveling. This method is more exact than the leveling method described in Section 3.2.1, but you
must level the chamber every time you change the hearing aid.
Coupler Measurements 37
Page 46

1. Set up the aid for testing as described in Section 3.3. If you are using a battery pill for testing, don’t plug it in yet. If you are using a regular battery for testing, do not turn on the hear
ing aid.
2. Insert the measurement microphone into the coupler.
3. Place the reference (probe) microphone next to the measurement microphone. Use some FunTak to secure the probe tube next to the microphone of the hearing aid. See Figure 3.2.2.
4. Press F1 from a coupler measurement screen.
5. Use the AMPLITUDE and FREQUENCY knobs to select REFERENCE MIC under COUPLER
SETTINGS.
6. Press [START/STOP] to toggle on.
7. Press F1 to return to the coupler measurement
screen.
8. Press the LEVEL button.
9. Press the START/STOP button. This will level the
sound chamber.
When you want to test a different aid, you must level
the sound chamber again to account for the difference
in the size of the hearing aid. (If the hearing aid is an
identical model, you won’t have to re-level.)
-
3.2.3 Saving the leveling information
To save the sound chamber leveling so that you won’t
have to re-level the sound chamber the next time the
analyzer is turned on:
1. Press MENU to enter the General Setup Menu.
2. Press F5 to store the coupler leveling.
3. Press F1 to return to the testing screen.
Figure 3.2.2—Leveling with reference
microphone
3.3 Hearing Aid Setup
To set up the analyzer and the hearing aid for testing, you connect the hearing aid to a coupler. The
standard couplers of the FP40 analyzer are the HA-1 and HA-2 couplers. These couplers contain 2
cc of space, simulating the amount of space in a person’s ear canal.
Other available couplers include the MZ-series couplers (used in the OES and JIS Options), and the
CIC coupler.
38 FONIX FP40 Portable Hearing Aid Analyzer
Page 47

3.3.1 Setting up a BTE
3.3.2 Setting up an ITE/ITC/CIC
1. Adjust the tone and gain controls of the
aid to the desired positions. If desired,
insert a battery pill into the aid.
2. Insert the end of the earhook of the hear
ing aid into the plastic tubing of the ear
level adapter.
3. Insert the measurement microphone into
the HA-2 2-cc coupler.
4. Snap the ear level adapter onto the end of
the coupler.
5. Place the hearing aid/coupler combination
into the sound chamber so that the micro
phone of the aid is directly over the center
of the speaker.
1. Roll some Fun-Tak into a rod long enough
to go around the transmitting end of the
aid. Modeling clay can also be used, but it
doesn’t work as well.
-
-
2. Bend the Fun-Tak rod around the canal
of the aid, making the resulting “donut”
flush with the end of the aid. (Some users
choose to seal the vent opening at this end
with a small amount of Fun-Tak.)
Coupler Measurements 39
Page 48

3. Align the sound opening of the aid with
the hole at the conical end of the coupler.
Look through the open end of the coupler
to be sure the sound opening of the aid is
clear of obstructions and correctly placed.
4. Seal the outside opening of any vent on
the aid with a small kernel of Fun-Tak.
5. Complete the acoustical sealing of the aid
to the coupler by using a pencil or finger.
You may want to double-check the aid
placement through the open end of the
coupler at this point.
40 FONIX FP40 Portable Hearing Aid Analyzer
Page 49

3.3.3 Setting up a body aid
6. Slowly insert the microphone into the
coupler. You may feel an initial resis
tance when the mic reaches the O-ring.
Continue to push the microphone until it
stops.
7. Place the completed assembly over the
center of the speaker in the test chamber.
With ITEs, the position of the aid can
affect the frequency response. If possible,
point the faceplate of the aid toward the
right or the left.
8. If you are using a battery pill, be sure the
metal conductor strip does not obstruct
the sound path.
1. Adjust the tone and gain controls of the
aid to the desired positions.
2. Place the hearing aid into the sound cham
ber so that the microphone of the aid is
centered over the speaker.
3. Insert the FP40 microphone into the HA-2
coupler and then snap the receiver onto
the end of the coupler.
4. Place the coupler outside of the sound
chamber and close the lid.
-
-
3.3.4 Setting up an eyeglass aid
1. If possible, remove the ear piece containing the hearing aid from the glasses.
2. Attach the receiver nub of the aid to the
ear level adapter on the HA-2 coupler.
3. Place the assembly in the sound chamber
with the microphone of the aid at the cen
ter of the speaker.
4. If it is not possible to disassemble the eye
glass aid, you must fold it on itself and
get as close as possible to the setup just
described.
Coupler Measurements 41
-
Page 50

3.4 Frequency responses
The Main Coupler Screen lets you take the frequency response of the hearing aid. You can:
• Use a variety of signal sources
• View multiple responses at once
• Find the single frequency response of the aid
• Take a three frequency average
• View the harmonic distortion in bars or in a separate table
• Switch between viewing curves in output and gain
• Test with or without the reference microphone
This section will tell you how to do all of these things.
3.4.1 Choosing a source type
The first step in taking a frequency response is to choose the signal you will be using as a source.
The sources available on the FP40 analyzer are described in Section 2.4.
To select a pure-tone
1. Press F1—MENU to enter the General Setup Menu.
2. If you have the Composite signal, you will see the item SOURCE as the first item in the left
column. If you don’t see this selection, skip to step 3.
a. Select SOURCE with the FREQUENCY and AMPLITUDE knobs.
b. Push START/STOP to select TONE.
3. Select SWEEP TYPE with the FREQUENCY and AMPLITUDE knobs in the middle column of
the screen. See Figure 3.4.1.
4. Select the desired pure-tone sweep type using START/STOP. In general, select NORM to per
form a single sweep containing many frequencies. Select FAST to perform continuous sweeps
containing fewer frequencies.
5. Press F1—EXIT to return to the Main Coupler Screen.
source:
-
42 FONIX FP40 Portable Hearing Aid Analyzer
Page 51

Figure 3.4.1—Selecting a pure-tone sweep
To select a
1. Press F1—MENU to enter the General Setup Menu.
2. Select SOURCE with the FREQUENCY and AMPLITUDE knobs.
3. Press [START/STOP] to cycle through your choices. To select the Composite signal, choose
COMPOSITE. If you have the Digital Speech Option, you will also have access to DIGSP
(Digital Speech ANSI) and DIGSP ICRA (Digital Speech ICRA).
4. Press F1—EXIT to return to the Main Coupler Screen.
Composite/Digital Speech source:
3.4.2 Taking the measurement
1. Make sure the sound chamber is leveled, as described in Section 3.2. You don’t need to level
the sound chamber every time you turn it on, but it’s a good idea to level the chamber (and
save the leveling) about once a week.
2. Set up the hearing aid in the sound chamber as described in Section 3.3.
3. Choose a source type as described in Section 3.4.1.
4. Adjust the source to the desired level by using the AMPLITUDE knob. If you are using a
composite/digital speech signal, you will see the RMS SOURCE in the STATUS box change as
you adjust the knob. If you are using a pure-tone signal, you will see the SOURCE change in
the lower right hand corner of the screen.
5. Press START/STOP. This will start the measurement. If you are using a NORM (or SHORT)
pure-tone source signal, the analyzer will perform one pure-tone sweep measurement and
stop automatically. Otherwise, wait for the measurement to stabilize, and press START/STOP
to stop the measurement.
ANSI
Coupler Measurements 43
Page 52

3.4.3 Viewing multiple measurements
It’s often useful to view several different frequencies responses together on the same screen. This is
especially important when testing AGC hearing aids. To do this, use the Multi-curve function.
To take multiple measurements:
1. Look at the screen just above F2 and F3. If one of them is “OFF MULTICRV,” press the corre
sponding function button (F2 or F3) to turn it on. Skip to step 6. Otherwise, proceed to step
2 for instructions on selecting Multi-curve for F2 or F3.
2. Press F1 to enter the General Setup Menu.
3. Use the AMPLITUDE and FREQUENCY knobs to select MAIN F2 or MAIN F3. Press START/
STOP repeatedly to select MULTICRV.
4. Press F1 to return to the Main Coupler Screen.
5. Press the function key (F2 or F3) that says “OFF MULTICRV” to turn it on.
6. Look at the screen. In the upper right hand corner of the screen, you will see a MULTICURVE
REPORT box that will contain a legend for four curves. This will give you data about each
curve.
7. Press F6 to select the curve you want to use for the measurement.
8. Follow the directions found in Section 3.4.2 for instructions on how to take a frequency
response measurement.
9. Repeat steps 6-8 to take up to four distinct measurements. If you select a curve that already
contains a frequency response, the old frequency response will be erased when you take a
new response.
To turn off the display of a curve:
1. Press F6 to select the desired curve.
-
2. Press F7 to turn off the display of that curve. This will not erase the curve.
3. Press F7 to redisplay the curve.
To erase a curve:
There are two ways to erase a curve.
• Press F8. This will erase all four curves in the Multi-curve buffer.
• Press F6 to select the desired curve, and take a new measurement. This will replace the old
curve with the new curve.
3.4.4 Taking a single frequency response
1. Look at the first line in the STATUS box in the Main Coupler Screen. If it says PURE-TONE or
BURST, skip to step 6. Otherwise, proceed to step 2.
44 FONIX FP40 Portable Hearing Aid Analyzer
Page 53

2. Press F1 to enter the General Setup Menu.
3. Select SOURCE with the AMPLITUDE and FREQUENCY knobs.
4. Press START/STOP to select TONE.
5. Press F1 to return to the Main Coupler Screen.
6. Open the sound chamber and listen to the signal. You will hear a continuous pure-tone sig
nal. Close the sound chamber.
7. Look at the lower right side of the screen. You will see a box listing the SOURCE, FREQ, and
MIC GAIN (or MIC SPL) of the signal.
8. Adjust the amplitude and frequency of the signal using the AMPLITUDE and FREQUENCY
knobs.
9. Watch the MIC GAIN (or MIC SPL) in the lower right side of the screen change as you adjust
the amplitude and frequency of the signal.
3.4.5 Taking a three frequency average
To take the three frequency average of a hearing aid, you use the AVG feature.
1. Press F1 to enter the General Setup Menu.
2. Select TONE for the SOURCE type, if necessary. If you don’t have the Composite signal on
your analyzer, you won’t see a selection for SOURCE type.
3. Use the FREQUENCY and AMPLITUDE knobs to select MAIN F2 or MAIN F3.
4. Press START/STOP repeatedly until you select AVG.
5. Use the FREQUENCY and AMPLITUDE knobs to select AVG FREQS under PURE-TONE
SETTINGS.
-
6. Press START/STOP to toggle the desired three frequency average, represented by the highest
of the frequencies. See Section 2.4.1 for a list of those frequencies.
7. Press F1 to return to the Main Coupler Screen.
8. Look at the lower right side of the screen. You will see a box listing the SOURCE, FREQ, and
MIC GAIN (or MIC SPL) of the signal. FREQ will be changing rapidly as the analyzer switches
between the three frequencies.
9. Adjust the amplitude of the signal using the AMPLITUDE knob. Watch the MIC GAIN (or MIC
SPL) in the lower right side of the screen change as you adjust the knob.
3.4.6 Viewing harmonic distortion
1. Press F1 to enter the General Setup Menu.
2. Select TONE for the SOURCE type, if necessary. If you don’t have the Composite signal on
your analyzer, you won’t see a selection for SOURCE type.
Coupler Measurements 45
Page 54

3. Use the FREQUENCY and AMPLITUDE knobs to select DISTORTION under PURE-TONE
SETTINGS.
4. Press START/STOP to toggle between displaying the harmonic distortion in “bar” format on
the graph or “table” format next to the graph.
5. Use the AMPLITUDE to select DIST TYPE.
6. Press START/STOP to select the type of harmonic distortion measurement to make. See
Section 2.4.1.4 for more details.
7. Press F1 to return to the Main Coupler Screen.
8. Run a pure-tone frequency response by following the directions found in Section 3.4.2. The
harmonic distortion results will appear either as bars on the graph or as a separate table.
3.4.7 Viewing battery current drain
Follow the directions in Section 2.6 for instructions on turning on the battery drain display and
selecting the appropriate battery pill. You must use a composite or pure-tone sweep source.
You must use a battery pill to view battery current drain.
3.4.8 Switching between gain and output
Look at the screen just above F2 and F3. If one of the function button labels reads “ON GAIN” or
“OFF GAIN,” press the corresponding function button (F2 or F3) to toggle the selection. This will
switch between viewing the response graph in dB GAIN or dB SPL.
When you view the graph in dB GAIN, you are looking at the difference between the input (the
source signal) and the output (measured by the analyzer’s microphone). This is nice because you
are seeing only what the hearing aid is amplifying.
When you view the graph in dB SPL, you are viewing everything that is measured by the analyzer’s
microphone. The source signal is not subtracted.
3.4.9 Testing with the reference microphone
You can use the FP40 to perform coupler measurements with or without the reference microphone.
We generally recommend to test without the reference microphone when performing coupler mea
surements because it’s easier, faster, and almost as accurate. However, testing with the reference
microphone, when done correctly, is slightly more accurate than testing without it. See Figure 3.4.9
for pictures of aids tested with the reference microphone.
Things to keep in mind when testing with the reference microphone:
• You must relevel the sound chamber with the reference microphone every time you switch
hearing aids. See Section 3.2.2 for instructions.
46 FONIX FP40 Portable Hearing Aid Analyzer
-
Page 55

• You must position the reference microphone properly. If you don’t have the reference microphone positioned next to the microphone of the hearing aid, you will get inaccurate results.
Worse, if you leave the reference microphone outside the chamber when it is turned on, you
will get wildly inaccurate test results.
To turn on the reference microphone:
1. Press F1 to enter the General Setup Menu.
2. Use the AMPLITUDE and FREQUENCY knobs to select REFERENCE MIC under COUPLER
SETTINGS.
3. Press START/STOP to toggle the selection from OFF to ON.
4. Press F1 to return to the Main Coupler Screen. You will read REFEENCE MIC ON in the
STATUS box.
Figure 3.4.9A—Test setup for BTE aid using 3.4.9B—Test setup for ITE aid using
reference microphone. reference microphone
3.5 Digital Aids
All digital aids can be tested, but some of the high-end models requires a little more thought and
care; these aids have a “noise suppression” (or “speech enhancement”) feature. This noise sup
pression feature, not to be confused the automatic compression of AGC hearing aids, checks if the
sound going into the hearing aid is a continuous signal that could be regarded as noise. If the aid
decides that the sound is noise, it lowers the gain at the corresponding frequencies. Conventional
testing techniques, such as a pure-tone sweep or a Composite signal, can cause the high-end digital
aid to go into this noise suppression mode. This means that the gain or output you see on the ana
lyzer’s display will not necessarily reflect the normal response of the aid to speech.
-
-
Coupler Measurements 47
Page 56

3.5.1 Testing with Digital Speech
To test digital aids with noise suppression, we have taken our standard continuous Composite signal
and interrupted it at intervals just long enough to trick the hearing aid into thinking it is hearing
speech instead of noise. This program is called “Digital Speech” and comes equipped with two dif
ferent speech spectra: the ANSI S3.42 spectrum that is similar to the Composite signal spectrum,
and the ICRA spectrum that was used in the creation of some high end digital hearing aids.
The nice thing about Digital Speech on the FP40 is that it works the same way as any other type of
signal works. You don’t have to learn any new button pushes, and you can treat the digital aid just
as you would any other hearing aid. In fact, there’s no reason that you can’t use the Digital Speech
signal for testing an analog hearing aid.
To use digital speech:
Follow the instructions from Section 3.4.1 to choose a Digital Speech source (DIGSP ANSI or DIGSP
ICRA), and test the aid according to Section 3.4.2. You can present the signal to the aid as long as
you need to, without worrying about the aid going into its “noise suppression” mode.
To understand ICRA vs. ANSI:
There are two Digital Speech signals available: Digital Speech ICRA (DIGSP ICRA) and Digital
Speech ANSI (DIGSP ANSI). They have different speech weightings. DIGSP ANSI rolls off the high
frequencies of the broadband signal at the same rate as the Composite Signal. DIGSP ICRA rolls off
the high frequencies of the broadband signal more quickly. Figure 3.5.1 shows a comparison of the
two speech spectra.
-
Figure 3.5.1—Comparison of DIGSP ANSI (CRV 1) and DIGSP ICRA (CRV 2)
3.5.2 Testing with the Composite Signal
If you don’t have Digital Speech on your analyzer, you can still perform accurate measurements of
the hearing aid using the Composite signal. Most noise suppression features on high end digital aids
will accept a continuous signal for several seconds before decreasing the gain of the hearing aid.
48 FONIX FP40 Portable Hearing Aid Analyzer
Page 57

To use the Composite signal to test high end digital aids, you first need to figure out how long you
can present the signal before the aid’s noise suppression goes into effect.
Follow these instructions:
1. Follow the instructions from Section 3.4.1 to select the Composite signal as the source type.
2. Use the AMPLITUDE knob to select 65 dB.
3. Press START/STOP and watch the response curve carefully. If the noise suppression of the aid
is working properly, you should see the amplitude of the curve drop after several seconds.
Some aids might take 3-5 seconds while other aids will take 10-15 seconds. Press START/
STOP again when finished.
4. Estimate the amount of time it took for the noise suppression to “kick in.” If you don’t see
any noticeable difference in the response of the aid after 15 seconds, either the aid’s noise
suppression isn’t working, or it’s not the type of aid that requires special consideration when
testing.
Now test normally using the Composite signal. Make sure to turn off the signal (by pressing START/
STOP again) before the time you estimated in step 4 passes. This will allow you to get an accurate
measurement before the aid goes into noise suppression mode.
3.5.3 Testing with pure-tone sweeps
Unfortunately, the only way to test a high-end digital hearing aid using only a pure-tone sweep is to
put the aid in “test” mode and turn off the noise suppression feature of the hearing aid. Most digital
hearing aids have a way to do this in their programming software. Contact your hearing aid manu
facturer for details.
-
3.6 Directional Hearing Aids
When fitting a directional aid, it is very important to make sure the microphones of the hearing aid
are providing a directional benefit. This is typically done by measuring the response of the hearing
aid when the source is in front of the patient—the forward response—and the response of the hear
ing aid when the source is behind the patient—the reverse response.
When testing a directional aid in the sound chamber, it is important to position the aid correctly
in order to test the forward and reverse responses. After the measurements have been completed,
compare the forward and reverse responses to each other.
Since the FP40 analyzer has a small sound chamber, directional testing is best done with the cham
ber in the upright position that is usually associated with real-ear measurements. The hearing aid,
connected to the coupler, can positioned in front of the speaker on a stand or the back of a chair.
In a pinch, the operator can stand to the side of the sound field and just hold the aid at a fixed dis
tance from the speaker. If you have the FP40 portable model without the real-ear option, you will
need the microphone extension cord (072-0300-00) for the folowing procedure.
The reference microphone should be OFF for these measurements.
Coupler Measurements 49
-
-
-
Page 58

3.6.1 Preparing for the measurement
1. Set up your analyzer so that the speaker is in the upright position. See Section 5.1.1.2.
2. Position the stand or chair you are going to use to set up the hearing aid. If you are using
a chair, face the chair to the side, so that the sound field will not bounce against the large
flat surface of the back of the chair. The testing surface should be about 12 inches from the
speaker.
3. Use Fun-Tak to affix the large measurement microphone to the testing surface. If you are
going to be holding the aid during the test, then hold the measurement microphone about 12
inches from the speaker while standing to the side of the sound field. See Figure 3.6.1.
4. Push the LEVEL button on your analyzer from the coupler measurement screen. This will
level the sound field.
5. Attach the hearing aid to the coupler and insert the measurement microphone, as usual. You
are now ready to test.
Figure 3.6.1—Preparing for a coupler directional measurement
3.6.2 Taking the Forward Measurement
1. Position the hearing aid on the testing surface so that it is facing forward. Use Fun-Tak to
hold the assembly in place. Alternately, hold the hearing aid in place while standing to the
side of the sound field. See Figure 3.6.2.
2. Make sure you are in the Main Coupler screen.
3. Make sure MULTICURVE is turned ON. See Section 3.4.3 for details.
4. Select a Composite or Digital Speech signal source, if available. Otherwise, use the pure-tone
FAST signal. See Section 3.4.1 for details.
50 FONIX FP40 Portable Hearing Aid Analyzer
Page 59

5. Use the AMPLITUDE knob to select an appropriate source level. Typically this measurement
should be done so that it is above the noise floor of the testing environment, but below the
compression knee point of the aid, if possible. If you have a quiet testing environment, use
50 dB SPL. Noisier testing environments may require you to use a higher source level to get a
good measurement.
6. Press START/STOP to start the measurement. Press it again to stop the measurement once it
has stabilized.
Figure 3.6.2—Testing the forward coupler response of a directional aid
3.6.3. Taking the Reverse Measurement
1. Position the hearing aid so that it is faced away from the sound field speaker. Different hearing aids have different null points, so you will want to adjust the positioning so that the
sound field speaker is pointing towards what should be the null point of the directional aid.
See Figure 3.6.3.
2. Make sure the aid is the same distance from the speaker that you used for the forward mea
surement.
3. Press F6 to select CURVE 2.
4. Make sure the source type and level are selected that you used for the forward measurement.
5. Press START/STOP to start the measurement. If you are using a Digital Speech or Composite
source, you can actually rotate the hearing aid while the measurement is running to deter
mine the null spot of the directional microphones – look for when the response drops the
most.
Coupler Measurements 51
-
-
Page 60

6. Press START/STOP once the measurement has stabilized. Compare the reverse measurement
to the forward measurement to see the directional advantage that the aid provides.
Figure 3.6.3 —Testing the reverse coupler response of a directional aid
3.7 The CIC Option
The CIC Option is a way of performing a coupler test of a CIC hearing aid that more accurately
reflects the real-ear performance of that aid than a regular 2-cc coupler measurement. It is not a
way to check the manufacturing specifications of CIC hearing aid because those specifications are
based upon 2-cc coupler measurements.
The CIC Option consists of a CIC coupler and software correction factors. Both need to be used in
order to correctly perform the measurement.
To measure a CIC hearing aid:
1. Attach the CIC coupler to the CIC aid just as you would attach an HA-1 coupler to the aid,
and set the hearing aid up for testing as shown in Section 3.3.2.
2. Press F1 to enter the General Setup Menu.
3. Use the AMPLITUDE and FREQUENCY knobs to select MAIN F2 or MAIN F3.
4. Press START/STOP repeatedly to select CIC.
5. Press F1 to return to the Main Coupler Screen.
52 FONIX FP40 Portable Hearing Aid Analyzer
Page 61

6. Press F2 or F3 (selected in step 3) to turn the CIC correction factors ON.
7. Test as usual. See Section 3.4.2.
See Figure 3.7 for a comparison of a CIC aid tested with an HA-1 coupler and the same aid tested
with a CIC coupler and correction factors.
Figure 3.7—CIC vs. HA-2 comparison
3.8 The OES Option
The OES (Occluded Ear Simulator) Option allows you to simulate the test results you would get
using a standard ear simulator (IEC 711 or Zwislocki coupler), provided the hearing aid or mold
being tested in not vented. It consists of three MZ couplers (MZ-1, MZ-2, and MZ-3) and corre
sponding correction factors.
To use the OES Option:
1. Use the proper MZ coupler and connect the aid as usual. See Figure 3.8A.
2. Press F1 to enter the General Setup Menu.
3. Use the AMPLITUDE and FREQUENCY knobs to select MAIN F2 or MAIN F3.
4. Press START/STOP repeatedly to select OES.
5. Press F1 to return to the Main Coupler Screen.
6. Press F2 or F3 (selected in step 3) to turn the OES correction factors ON.
7. Test as usual. See Section 3.4.2.
Corrections will be made to all measurement curves, data displays, and individual measurements.
See Figure 3.8B for a comparison of an aid tested with an HA-2 coupler, and the same aid tested
with an MZ-3 coupler and OES correction factors.
-
Coupler Measurements 53
Page 62

TYPE OF AID COUPLER COMMENT
ITE, ITC MZ-1
BTE, or MZ-1
EYEGLASS
MZ-2
MZ-3
BODY* MZ-2 With snap-on receivers, use the MZ-2 without the Ear Level Hearing Aid Adapter attaced.
With custom earmold attached. (NOTE: Vents must be plugged.)
Without custom earmold attached, when a 3-mm horn earmold
is planned, use with the Ear-Level Hearing Aid Adapter that
normally snaps onto the HA-2, 2cc coupler.
Without custom earmold attached, when a conventional #13 tub-
ing) earmold is planned, attach a length of #13 tubing that corre
sponds to the length of the sound channel of the wearer’s earmold.
Figure 3.8A—Choosing the proper MZ coupler
-
Figure 3.8B—MZ-3 vs HA-2 comparison
54 FONIX FP40 Portable Hearing Aid Analyzer
Page 63

Chapter 4: Automated Test Sequences
There are several different automated test sequences available on the FP40 analyzer:
• ANSI S3.22-2003 • JIS
• ANSI S3.22-1996 • ISI
• ANSI S3.22-1987 • Profiler
• ANSI S3.42-1992 • IEC
• ACIC
The ANSI S3.22 is the FDA’s hearing aid “labeling” standard. All hearing aids manufactured in the
United States are labeled to this standard. ANSI 03, ANSI 96, and ANSI 87 are three versions of the
same labeling standard. See Section 4.1, 4.2, and 4.3 for more information. ACIC is ANSI 87 with
the CIC correction factors. It is meant to be used with the CIC coupler, and is for informational pur
poses only.
-
The ANSI S3.42-1992 is a voluntary standard for non-linear hearing aids. It uses the composite sig
nal to take a series of frequency responses at different input levels so you can make sure the aid is
compressing correctly. It is not directly related to ANSI 03, ANSI 96, or ANSI 03. See Section 4.4 for
more information.
The IEC, JIS, and ISI are automated test sequences designed for the international hearing aid
industry. IEC is used primarily in Europe, JIS is used primarily in Japan, and ISI is used primarily in
India. See Section 4.5 for more information on the IEC automated test sequence. Instructions on the
JIS and ISI test sequences are available upon request.
The Profiler was designed as a fast way of determining all the important characteristics of a hearing
aid in a very short amount of time. It is used to quickly identify aids that need repair or replace
ment, and to validate new hearing aid fittings. See Section 4.6 for more information.
-
-
4.1 ANSI S3.22-2003
The ANSI S3.22 standard is the FDA’s hearing aid “labeling” standard. All hearing aids sold in the
United States must be labeled to this standard. The ANSI 03 automated test sequence performs all
the measurements specified in the 2003 revision of the standard.
As of the publishing of this manual, the FDA has indicated that it will publish this standard in the
federal registry in Fall 2005. After this happens, there will be a period of comment before the stan
dard is officially adopted by the FDA and put into use. When this occurs, all newly designed hearing
aids will be labeled to the 2003 standard. It is not known at this time whether previously designed
hearing aids will also be labeled to this standard.
-
Automated Test Sequences 55
Page 64

Here are the major differences between ANSI 03 and ANSI 96:
• When you set up an AGC aid for an ANSI 03 test sequence, you will start with its compression
controls set to minimum (with the compression knee point set as high as possible). Just before
the input/output measurements, the test sequence will pause to allow you to set the compres
sion controls of the aid to maximum (with the compression knee point set as low as possible).
In ANSI 96, AGC aids are tested with their compression controls set to maximum for all mea
surements.
• When you adjust the gain control of the hearing aid midway through the ANSI 03 automated
test sequence, the measured reference test gain value needs to be within 1.5 dB of the target
value. In ANSI 96, the measured valued needs to be instead of within 1 dB of the target value.
• The EIN formula in ANSI 03 uses a 50 dB SPL input instead of the 60 dB SPL input used in
ANSI 03. With ANSI 96, any aid with a compression knee point below 60 dB SPL showed arti
ficially high EIN results. This means that ANSI 03 EIN test results should be better (lower) for
AGC aids.
4.1.1 Setting up the aid for testing
When possible, follow the procedure recommended by the hearing aid manufacturer when setting
up the aid to perform an ANSI test sequence. Otherwise, use the following guidelines:
-
-
-
• Set the controls of the aid (except the compression controls) to give the greatest possible out
put and gain.
• Set the aid for the widest frequency response range.
• Set AGC aids to achieve minimum possible compression.
• Make sure the gain control of the aid is full-on.
Follow the instructions from Section 3.3 to set up the aid in the test box for testing.
4.1.2 Setting up the analyzer for testing
To enter the ANSI 03 screen:
1. From the Main Coupler Screen, look at the FP40’s display above the F4 function key. If it says
“AN03,” skip to step 6.
2. Press F1 – Menu.
3. Use the AMPLITUDE and FREQUENCY knobs to select MAIN F4 under FUNCTION KEY
DEFIN.
4. Press START/STOP to choose AN03. This will let you use the F4 function key to enter the
ANSI 03 screen from the Main Coupler Screen.
5. Press F1 to return to the Main Coupler Screen.
6. Press F4 to enter the ANSI 03 screen.
-
56 FONIX FP40 Portable Hearing Aid Analyzer
Page 65

To change the ANSI 03 settings:
1. From the ANSI 03 screen, press F1 to enter the General Setup Menu.
2. Use the AMPLITUDE and FREQUENCY knobs to select MENU TYPE.
3. Press START/STOP to choose PARTIAL. The menu will now only display the selections applicable to ANSI 03.
4. Use the AMPLITUDE and FREQUENCY knobs in conjunction with the START/STOP button
to choose the settings for NOISE REDUC, SETTL. TIME, and AVG FREQS under PURETONE
SETTINGS. These settings are explained in Section 2.4.1.
5. Use the AMPLITUDE and FREQUENCY knobs in conjunction with the START/STOP button to
select whether or not you will use the REFERENCE MIC for testing. We generally recommend
selecting OFF. See Section 3.4.9.
6. Use the AMPLITUDE and FREQUENCY knobs in conjunction with the START/STOP button to
select the type of battery pill used in the measurement. This is used in testing battery current
drain.
7. Press F1 to return to the ANSI 03 screen.
8. Press F2 to choose the type of aid you are testing. The selections are AGC, ADAPTIVE AGC,
and LINEAR 50.
• Choose LINEAR 50 for linear aids.
• Choose AGC for most AGC aids.
• Choose ADAPTIVE AGC if the aid has adaptive release times. This is also a suitable selec
tion for digital aids that require extra time to adjust to input signals.
-
9. Use F5 to turn ON or OFF the telecoil measurement. The ANSI 03 telecoil measurement
requires the Telewand.
10. Press DATA/GRAPH. If you are testing a linear hearing aid, skip to step 15.
11. Press F2 to choose a frequency and press F3 to select whether or not you want to run an
input/output (I/O) curve at this frequency. Repeat this for each of the five available frequencies.
12. Use F5 to select the amount of time the first frequency of each I/O curve is presented before
the measurement is made.
13. Use F6 to select the amount of time each subsequent frequency is presented before a mea
surement is made. This should be at least twice as long as the manufacturer specified attack
time.
14. Use F8 to SET AGC ON or OFF. SET AGC ON will cause the test sequence to pause in order
to allow you to adjust the AGC controls of the aid before running the input/output curves as
required by ANSI 03. If it is not possible for you to adjust these controls, SET AGC to OFF,
but be advised that test results may vary from manufacturing specifications.
15. Use F9 if you would like to identify the ear tested.
16. Return to the main function button selections by pressing DATA/GRAPH.
17. Press F8 to save your settings, if desired.
Automated Test Sequences 57
-
Page 66

4.1.3 Running the test sequence
1. Level the sound chamber if necessary. See Section 3.2 for details.
2. Set up the aid for testing. See Section 4.1.1.
3. Close the sound chamber.
4. Press START/STOP when you are ready to begin the test.
5. Wait for several tests to be run. For most aids, the analyzer will pause after performing sev
eral measurements in order for you to turn down the gain of the aid.
6. If the analyzer pauses, open the sound chamber and adjust the gain control of the aid until
the MEASURED gain matches the TARGET gain to within 1.5 dB when the sound chamber is
closed.
7. Press START/STOP to resume testing.
8. The analyzer will pause again, if you are performing a telecoil measurement, and instruct you
to put the aid in telecoil mode. Do so. Otherwise, skip to step 13.
9. Plug the Telewand into the External Speaker jack on the back of the FP40 and hold the wand
over the aid as you would hold a telephone receiver to your ear. That is, for BTE aids, hold
the wand flat against the body of the aid. For ITE/ITC/CIC aids, hold the wand against the
faceplate of the aid. The aid should be positioned vertically, as it would be worn, in order to
produce the best telecoil response.
10. Press START/STOP to take the telecoil measurements.
11. Put the aid back into microphone mode when the analyzer instructs you to.
12. Unplug the telewand from the External Speaker jack on the back of the FP40.
13. If you have set the aid type to AGC or ADAPTIVE, as described in step 8 of Section 4.1.2, and
if the SET AGC is ON, as described in step 14, the analyzer will pause to allow you to adjust
the AGC controls. Set the compression to maximum, or as recommended by the hearing aid
manufacturer. Otherwise, wait for the test sequence to complete.
-
14. Press START/STOP to complete the test sequence.
4.1.4 Viewing the results
See Figure 4.1.4 for an example of an ANSI 03 test sequence (including the telecoil measurement).
1. OSPL90: Output measurement at 90 dB SPL
2. RESP60: Response measurement at 60 db SPL at reference test gain
3. SPLITS: Telecoil response curve measurement
4. NR: Noise reduction used in tests
5. SPA/HFA: Frequencies used for the three frequency average
6. MAX: Maximum frequency response measured and the frequency at which it occurred
7. SPA/HFA OSPL90: Three frequency average of the OSPL90 curve
58 FONIX FP40 Portable Hearing Aid Analyzer
Page 67

8. SPA/HFA FOG: Three frequency average of a full-on gain measurement at 50 dB SPL
9. REFTG TARGET and MEASURED: The calculated reference test gain and the actual measured
reference test gain
10. EQ INP NOISE: Equivalent input noise
11. RESP LIMIT and F1 and F2: The response limit level and the two frequencies where the
response curve crossed over this level
12. THD: The total harmonic distortion measurements
13. HFA-SPLITS: The three frequency average of the telecoil SPLITS curve
14. RSETS: The difference between the high frequency average of the response curve and the
SPLITS curve
15. BATTERY: Battery current drain
16. I/O CURVES: Input/output measurements at up to five different frequencies
Figure 4.1.4—ANSI 03 results
4.2 ANSI S3.22-1996
Although the ANSI S3.22 was revised in 1996, the FDA did not adopt this new version of the standard until March 2000. As a result, all hearing aids designed (or with significant design changes)
after March 17, 2000 must be labeled to the ANSI S3.22-1996 standard. All hearing aids manu
factured today, but with no significant design changes since March 17, 2000, can continue to be
labeled to the ANSI S3.22-1987. See Section 4.3 for more details on ANSI 87.
4.2.1 Setting up the aid for testing
When possible, follow the procedure recommended by the hearing aid manufacturer when setting
up the aid to perform an ANSI test sequence. Otherwise, use the following guidelines:
• Set the controls of the aid (except the compression controls) to give the greatest possible out
put and gain.
Automated Test Sequences 59
-
-
Page 68

• Set the aid for the widest frequency response range.
• Set AGC aids to achieve greatest possible compression.
• Make sure the gain control of the aid is full-on.
Follow the instructions from Section 3.3 to set up the aid in the test box for testing.
4.2.2 Setting up the analyzer for testing
To enter the ANSI 96 screen:
1. From the Main Coupler Screen, look at the FP40’s display above the F4 function key. If it says
“AN96,” skip to step 6.
2. Press F1 – Menu.
3. Use the AMPLITUDE and FREQUENCY knobs to select MAIN F4 under FUNCTION KEY
DEFIN.
4. Press START/STOP to choose AN96. This will let you use the F4 function key to enter the
ANSI 96 screen from the Main Coupler Screen.
5. Press F1 to return to the Main Coupler Screen.
6. Press F4 to enter the ANSI 96 screen.
To change the ANSI 96 settings:
1. From the ANSI 96 screen, press F1 to enter the General Setup Menu.
2. Use the AMPLITUDE and FREQUENCY knobs to select MENU TYPE.
3. Press START/STOP to choose PARTIAL. The menu will now only display the selections appli
cable to ANSI 96.
4. Use the AMPLITUDE and FREQUENCY knobs in conjunction with the START/STOP button
to choose the settings for NOISE REDUC, SETTL. TIME, and AVG FREQS under PURETONE
SETTINGS. These settings are explained in Section 2.4.1.
5. Use the AMPLITUDE and FREQUENCY knobs in conjunction with the START/STOP button to
select whether or not you will use the REFERENCE MIC for testing. We generally recommend
selecting OFF. See Section 3.4.9.
6. Use the AMPLITUDE and FREQUENCY knobs in conjunction with the START/STOP button to
select the type of battery pill used in the measurement. This is used in testing battery current
drain.
7. Press F1 to return to the ANSI 96 screen.
8. Press F2 to choose the type of aid you are testing. The selections are AGC, ADAPTIVE AGC,
LINEAR 50, LINEAR 60.
• Choose LINEAR 60 for most linear aids.
• Choose LINEAR 50 for high-gain aids.
• Choose AGC for most AGC aids.
• Choose ADAPTIVE AGC if the aid has adaptive release times.
-
60 FONIX FP40 Portable Hearing Aid Analyzer
Page 69

9. Use F5 to turn ON or OFF the telecoil measurement. The ANSI 96 telecoil measurement
requires the Telewand.
10. Press DATA/GRAPH if you are testing an AGC aid. This will change the function key labels.
Otherwise, skip to step 14.
11. Press F2 to choose a frequency and press F3 to select whether or not you want to run an
input/output (I/O) curve at this frequency. Repeat this for each of the five available frequen
cies.
12. Use F5 to select the amount of time the first frequency of each I/O curve is presented before
the measurement is made.
-
13. Use F6 to select the amount of time each subsequent frequency is presented before a mea
surement is made. This should be at least twice as long as the manufacturer specified attack
time.
14. Use F9 if you would like to identify the ear tested.
15. Return to the main function button selections by pressing DATA/GRAPH.
16. Press F8 to save your settings, if desired.
4.2.3 Running the test sequence
1. Level the sound chamber if necessary. See Section 3.2 for details.
2. Set up the aid for testing. See Section 4.2.1.
3. Close the sound chamber.
4. Press START/STOP when you are ready to begin the test.
5. Wait for several tests to be run. For most aids, the analyzer will pause after performing sev
eral measurements in order for you to turn down the gain of the aid.
6. If the analyzer pauses, open the sound chamber and adjust the gain control of the aid until
the MEASURED gain matches the TARGET gain to within 1 dB when the sound chamber is
closed.
7. Press START/STOP to resume testing.
-
-
8. The analyzer will pause again, if you are performing a telecoil measurement, and instruct you
to put the aid in telecoil mode. Do so. Otherwise, wait for the test sequence to finish.
9. Plug the Telewand into the External Speaker jack on the back of the FP40 and hold the wand
over the aid as you would hold a telephone receiver to your ear. That is, for BTE aids, hold
the wand flat against the body of the aid. For ITE/ITC/CIC aids, hold the wand against the
faceplate of the aid.
10. Press START/STOP to take the telecoil measurements.
11. Put the aid back into microphone mode when the analyzer instructs you to.
12. Unplug the telewand from the External Speaker jack on the back of the FP40.
13. Press START/STOP to complete the test sequence.
Automated Test Sequences 61
Page 70

4.2.4 Viewing the results
See Figure 4.2.4 for an example of an ANSI 96 test sequence (including the telecoil measurement).
1. OSPL90: Output measurement at 90 dB SPL
2. RESP50 (or 60): Response measurement at 50 (or 60) db SPL at reference test gain
3. SPLITS: Telecoil response curve measurement
4. NR: Noise reduction used in tests
5. SPA/HFA: Frequencies used for the three frequency average
6. MAX: Maximum frequency response measured and the frequency at which it occurred
7. SPA/HFA OSPL90: Three frequency average of the OSPL90 curve
8. SPA/HFA FOG: Three frequency average of a full-on gain measurement at 50 (or 60) dB SPL
9. REFTG TARGET and MEASURED: The calculated reference test gain and the actual measured
reference test gain
10. EQ INP NOISE: Equivalent input noise
11. RESP LIMIT and F1 and F2: The response limit level and the two frequencies where the
response curve crossed over this level
12. THD: The total harmonic distortion measurements
13. HFA-SPLITS: The three frequency average of the telecoil SPLITS curve
14. STS-SPLITS: The difference between the high frequency average of the response curve and
the SPLITS curve
15. BATTERY: Battery current drain
16. I/O CURVES: Input/output measurements at up to five different frequencies
Figure 4.2.4—ANSI 96 results
62 FONIX FP40 Portable Hearing Aid Analyzer
Page 71

4.3 ANSI S3.22-1987
The ANSI S3.22-1987 standard is an older version of the ANSI S3.22-1996 standard, discussed
in Section 4.2. It is still used, however, in the labeling of hearing aids designed before March 17,
2000.
In ANSI 87, AGC aids are set at full-on gain for all measurements instead of being reduced to refer
ence test gain, as they are in ANSI 96, and input/output measurements are only taken at 2000 Hz,
as opposed to the five different frequencies offered with ANSI 96.
4.3.1 Setting up for the test
Follow the instructions found in Section 4.2.1 for instructions on setting up the aid for testing.
To enter the ANSI 87 screen:
1. From the Main Coupler Screen, look at the FP40’s display above the F4 function key. If it says
“AN87” (or ANSI for units with older software versions), skip to step 6.
2. Press F1 – Menu.
3. Use the AMPLITUDE and FREQUENCY knobs to select MAIN F4 under FUNCTION KEY
DEFIN.
4. Press START/STOP to choose AN87 (or ANSI for units with older software versions). This will
let you use the F4 function key to enter the ANSI 87 screen from the Main Coupler Screen.
5. Press F1 to return to the Main Coupler Screen.
6. Press F4 to enter the ANSI 87 screen.
To change the ANSI 87
settings:
-
1. Press F2 to choose the type of aid you are testing. The selections are AGC 50, LINEAR 50,
LINEAR 60.
• Choose LINEAR 60 for most linear aids.
• Choose LINEAR 50 for high-gain aids.
• Choose AGC for AGC aids.
Note: If you are testing a digital aid, you should usually select AGC for this setting. However,
ask the hearing aid manufacturer for guidance.
2. Press F3 to select the last frequency of the three frequency average used in the test sequence.
See Section 2.4.1 for details.
3. Press F5 to turn the telecoil test off and on. The telecoil test requires the external telecoil
board.
4. Press F6 to select the noise reduction used in the measurements.
Automated Test Sequences 63
Page 72

5. Press F7 to select the battery type used in the measurements.
6. Press F8 to select whether or not you want to perform an equivalent input noise (EQIN also
known as EIN) measurement.
Note: The equivalent input noise measurement is difficult without a very quiet environment,
especially with low gain aids.
7. Decide whether you want to test with or without the reference microphone. See Section 3.4.9
for instructions on the reference microphone.
4.3.2 Running the test sequence
1. Level the sound chamber, if necessary. See Section 3.2 for details.
2. Set up the aid for testing. See Section 4.2.1.
3. Close the sound chamber.
4. Press START/STOP when you are ready to begin the test.
5. If you turned on the telecoil test:
a. Plug the external telecoil board into the external speaker jack on the back of the FP40.
b. Set the aid to receive telecoil signals
c. Position the aid and coupler on the telecoil board so that the TCOIL reading on the display
is as large as possible.
d. Press START/STOP to take the measurement.
e. Return the aid and coupler assembly to the sound chamber, and put the aid back to micro
phone mode.
f. Unplug the telecoil board.
g. Press START/STOP to resume the test.
-
6. Wait for several tests to be run. For most linear aids, the analyzer will pause after performing
several measurements in order for you to turn down the gain of the aid.
7. If the analyzer pauses, open the sound chamber and adjust the gain control of the aid until
the HFA (or SPA) MEASURED gain matches the HFA (or SPA) TARGET gain to within 1 dB
when the sound chamber is closed.
8. Press START/STOP to complete the test sequence.
4.3.3 Viewing the results
See Figure 4.3.3 for an example of ANSI 87 results
1. SSPL90: Output measurement at 90 dB SPL
2. RESP50 (or 60): Response measurement at 50 (or 60) db SPL
3. NR: Noise reduction used in tests
4. SPA/HFA: Frequencies used for the three frequency average
64 FONIX FP40 Portable Hearing Aid Analyzer
Page 73

5. MAX: Maximum frequency response measured and the frequency at which it occurred
6. SPA/HFA SSPL90: Three frequency average of the OSPL90 curve
7. SPA/HFA FOG: Three frequency average of a full-on gain measurement at 50 (or 60) dB SPL
8. REF TEST GAIN: The measured reference test gain
9. EQ INP NOISE: Equivalent input noise
10. RESP LIMIT and F1 and F2: The response limit level and the two frequencies where the
response curve crossed over this level
11. THD: The total harmonic distortion measurements
12. BATTERY: Battery current drain
13. I/O CURVE: Input/output measurement at 2000 Hz
Figure 4.3.3—ANSI 87 results
4.4 ANSI S3.42-1992
The ANSI 92 test sequence is a series of tests designed for non-linear hearing aids. Although it is
not used by manufacturers to label hearing aids, it can give you valuable information not present in
the ANSI S3.22 labeling standard. ANSI 92 is only available if you have the Composite Option on
your analyzer.
ANSI 92 uses the Composite signal to run a family of frequency responses at different input levels.
The Composite signal is critical for accurate testing of non-linear hearing aids because of a wellknown effect associated with pure-tone sweeps known as “artificial blooming.” When a pure-tone
sweep is presented to a non-linear hearing aid, the aid’s AGC circuits can sometimes react by inflat
ing their gain at low frequencies. This can result in inaccurate frequency response curves. This
artificial blooming of the low frequencies does not occur when a broadband signal, such as the
Composite signal, is used.
-
Automated Test Sequences 65
Page 74

4.4.1 Setting up for the test
Follow the instructions found in Section 4.2.1 for instructions on setting up the aid for testing.
To enter the ANSI 92 screen:
1. From the Main Coupler Screen, look at the FP40’s display above the F4 function key. If it says
“AN92” , skip to step 6.
2. Press F1—Menu.
3. Use the AMPLITUDE and FREQUENCY knobs to select MAIN F4 under FUNCTION KEY
DEFIN.
4. Press START/STOP to choose AN92. This will let you use the F4 function key to enter the
ANSI 92 screen from the Main Coupler Screen.
5. Press F1 to return to the Main Coupler Screen.
6. Press F4 to enter the ANSI 92 screen.
To change the ANSI 92
1. Press F2 to select the desired range of input levels for the frequency response curves.
2. Press F3 to select the settling time. This is the amount of time that the analyzer presents the
Composite signal before taking the measurement. You should choose a value twice the published attack specification.
3. Press F6 to choose the amount of noise reduction used for the measurements. See Section
2.4.2.2.
4. Press F7 to select the type of battery pill used. If you don’t want to test the battery current
drain of the aid, you can ignore this selection.
settings:
4.4.2 Running the test sequence
1. Level the sound chamber if necessary. See Section 3.2 for details.
2. Set up the aid for testing. See Section 4.2.1.
3. Close the sound chamber.
4. Press START/STOP when you are ready to begin the test.
5. Wait for several tests to be run. For most aids, the analyzer will pause after performing sev
eral measurements in order for you to turn down the gain of the aid.
6. If the analyzer pauses, open the sound chamber and adjust the gain control of the aid until
the MEASURED gain matches the TARGET gain to within 1 dB when the sound chamber is
closed.
-
7. Press START/STOP to complete the test sequence.
66 FONIX FP40 Portable Hearing Aid Analyzer
Page 75

4.4.3 Viewing the results
See Figure 4.4.3 for an an example of ANSI 92 results.
1. NSPL90: RMS of Composite signal response curve taken at 90 dB SPL
2. FULL-ON NOISE GAIN: RMS of response curve taken with the Composite signal at 60 dB SPL
minus RMS of the input signal
3. TARGET REF GAIN: Calculated reference test gain
4. ACTUAL REF GAIN: Measured reference test gain
5. CRV 5-9: Response curves at varying amplitudes
6. I/O: Input/output measurement using Composite signal
Figure 4.4.3. —ANSI 92 results
4.5 IEC
The IEC (International Electrotechnical Commission) test sequence allows you to test hearing aids
according to the IEC 118-7 standard, the performance part of the IEC hearing aid standard, as
amended in 1994.
4.5.1 Setting up the aid for testing
When possible, follow the procedure recommended by the hearing aid manufacturer when setting
up the aid to perform an IEC test sequence. Otherwise, use the following guidelines:
• Set the controls of the aid to give the greatest possible output and gain. For AGC aids, this is
usually accomplished by setting the aid for the minimum compression
• Set the aid for the widest frequency response range.
• Make sure the gain control of the aid is full-on.
Automated Test Sequences 67
Page 76

Follow the instructions from Section 3.3 to set up the aid in the test box for testing.
4.5.2 Setting up the analyzer for testing
To enter the IEC screen:
1. From the Main Coupler Screen, look at the FP40’s display above the F4 function key. If it says
“IEC” skip to step 6.
2. Press F1 – Menu.
3. Use the AMPLITUDE and FREQUENCY knobs to select MAIN F4 under FUNCTION KEY
DEFIN.
4. Press START/STOP to choose IEC. This will let you use the F4 function key to enter the IEC
screen from the Main Coupler Screen.
5. Press F1 to return to the Main Coupler Screen.
6. Press F4 to enter the IEC screen.
To change IEC
1. Press F2 to choose the source level for full-on gain measurements and whether or not you
would like to take an I/O measurement. type of aid you are testing. The selections are AGC
50, LINEAR 50, LINEAR 60.
• Choose 60 for most linear aids.
• Choose 50 for high-gain linear aids.
• Choose I/O 60 for AGC aids with the AGC circuit disabled
• Choose I/O 50 for most AGC aids
Note: If you are testing a digital aid, you should usually select I/O 50 for this setting.
However, ask the hearing aid manufacturer for guidance.
2. Press F3 to set the reference test frequency. If possible, use the frequency recommended by
the manufacturer. Otherwise, use 2500 Hz for high frequency emphasis aids and 1600 Hz for
all other aids.
3. Press F5 to select the harmonic distortion test frequency.
4. Press F6 to select the noise reduction used to take the measurements.
5. Press F7 to select the battery type.
6. Press F8 to select whether or not you want to perform an equivalent input noise (EQIN also
known as EIN) measurement.
settings:
Note: The equivalent input noise measurement is difficult without a very quiet environment,
especially with low gain aids.
7. Decide whether you want to test with or without the reference microphone. See Section 3.4.9
for more information.
68 FONIX FP40 Portable Hearing Aid Analyzer
Page 77

4.5.3 Running the test sequence
1. Level the sound chamber if necessary. See Section 3.2 for details.
2. Set up the aid for testing. See Section 4.5.1.
3. Close the sound chamber.
4. Press START/STOP when you are ready to begin the test.
5. Wait for several tests to be run. The analyzer will pause after performing several measure
ments in order for you to turn down the gain of the aid.
6. Open the sound chamber and adjust the gain control of the aid until the MEASURED gain
matches the TARGET gain to within 1 dB when the sound chamber is closed.
Note: If you prefer, you can set the target reference gain to match the manufacturer’s speci-
fications as the IEC 118-7 standards instructs instead of using the FP40’s calculated target
value. However, we have never found any difficulties with using the FP40’s calculated target
reference gain.
7. Press START/STOP to complete the test sequence.
8. If you have chosen to measure an I/O curve, press the DATA/GRAPH button to display the
measurement.
4.5.4 Viewing the results
See Figure 4.5.4 for an example of IEC results.
1. Response curve at 60 dB SPL
2. OSPL90: Measurement at the reference test gain of 90 dB SPL
3. MAX: Maximum frequency response measured and the frequency at which it occurred
4. REFERENCE TEST GAIN CALCULATED
-
5. REFERENCE TEST GAIN MEASURED
6. TOTAL HARMONIC DISTORTION
7. EQIV INPUT NOISE: Equivalent input noise
8. BATTERY: Battery current drain
9. OSPL90 Curve: Response curve taken at 90 dB SPL
10. FOG 50: Full-on gain response curve taken at 50 (or 60) dB SPL
11. I/O curve: Input/output measurement taken at the reference test frequency
Automated Test Sequences 69
Page 78

Figure 4.5.4—IEC results
4.6 Profiler
The Profiler is an automated test sequence designed to tell you all the important information about
the hearing aid in a very short period of time. It was originally modeled after the ANSI 92 test
sequence, but it was expanded the test to also include the most useful measurements from ANSI
87/96. This gives you a complete picture of the hearing aid, allowing you to quickly determine
whether the aid is in need of replacement or repair, or whether it has been programmed correctly.
The Profiler is run at the normal user settings for almost all the measurements, eliminating the time
and effort required to put the aid in “test” mode.
4.6.1 Setting up for the test
To enter the Profiler screen:
1. From the Main Coupler Screen, look at the FP40’s display above the F4 function key. If it says
“PROF” skip to step 6.
2. Press F1 – Menu.
3. Use the AMPLITUDE and FREQUENCY knobs to select MAIN F4 under FUNCTION KEY
DEFIN.
4. Press START/STOP to choose PROF. This will let you use the F4 function key to enter the
Profiler screen from the Main Coupler Screen.
5. Press F1 to return to the Main Coupler Screen.
6. Press F4 to enter the Profiler screen.
To change the Profiler’s settings:
1. Press F2 to choose the type of source signal used for the speech curves. You have a choice of
Composite (COMP), Digital Speech ICRA (DSPI), and Digital Speech ANSI (DSPA).
Page 79

2. If you have chosen DSPA or DSPI in step 1, select the length of time each speech curve will
be presented with F3.
3. Select the type of equivalent input noise measurement taken with F5. The HFA/SPA/IEC
selections use a three frequency average to obtain the EIN. RMS uses a root-mean-square
average to take the measurement.
4. Choose the amount of noise reduction used in the soft speech curve with F6.
5. Choose the battery type with F7.
4.6.2 Running the test sequence
1. Level the sound chamber if necessary. See Section 3.2 for details.
2. Set the aid to normal user settings. If the aid has a volume control, it should be set to the set
ting most used by the client.
3. Attach the aid to the appropriate coupler and place it in the sound chamber.
4. Close the door of the sound chamber.
5. Press START/STOP to begin the measurement.
6. After taking most of the measurements, the analyzer will pause. If the aid has a volume
control, use it to turn the aid to full-on gain and press START/STOP to complete the test.
Otherwise, press the DATA/GRAPH button to end the test.
4.6.3 Viewing the results
See Figure 4.6.3 for an example of a Profiler test sequence.
1. OSPL90: Pure-tone sweep at 90 dB SPL
2. Total harmonic distortion measurements
3. MAX OUT: Maximum output from the OSPL90 measurement
4. NOISE RED: Noise reduction used for soft measurement curve
5. CRV GAIN: RMS of the medium speech curve or overall average gain of the aid
6. EQ INP NOISE: Equivalent input noise and the type of measurement used to take it
-
7. BATTERY: Battery current drain
8. S, M, and L: Soft, medium, and loud speech curves taken at 50, 65, and 80 db SPL respec
tively
9. R: Full-on gain response curve taken at 65 dB SPL
Automated Test Sequences 71
-
Page 80

Figure 4.6.3—Profiler results
4.7 ACIC
The ACIC test sequence is the ANSI 87 test sequence with CIC correction factors. Follow the instructions in Section 4.3 to run the ACIC test sequence. Make sure to use a CIC coupler.
The ACIC test sequence is for informational puproses only. It cannot be used for comparison to
manufacturer’s specifications, which assume a 2-cc coupler.
72 FONIX FP40 Portable Hearing Aid Analyzer
Page 81

Chapter 5: Real-Ear Measurements
The Probe Option of the FONIX FP40 allows you to test hearing aids in the client’s ear, also known
as real-ear measurements. There are three real-ear measurement screens: Insertion Gain, SPL,
and Audibility Index. Each display presents different format from which to evaluate your hear
ing aid fitting. There is also a Target 2-cc coupler screen that lets you take coupler measurements
and compare them to appropriate targets. The available test stimuli include pure-tone sweeps, the
Composite signal, the Digital Speech signals, and live speech (in spectrum analysis mode).
To take real-ear measurements, the FP40’s build-in sound chamber converts easily to a sound field
speaker. The larger microphone of the M200 dual microphone set, used as the measurement micro
phone in coupler measurements, turns into a reference microphone for real-ear measurements. The
smaller microphone of the dual microphone set, used as a reference microphone when taking cou
pler measurements, turns into the measurement microphone when taking real-ear measurements.
5.1 Preparation for Real-Ear Measurements
There are two steps to set up for a real-ear measurement. In the first step, you set the analyzer up
for testing. In the second step, you set the client up for testing with the analyzer. Once this is done,
you’re ready to take the real-ear measurements.
-
-
-
5.1.1 Setting up the analyzer for testing
To set the analyzer up for testing, you need to prepare the microphones and set up the sound field
speaker.
5.1.1.1 To set up the microphones and monitor headset
If not already in place, slide the Velcro mounting sleeves onto the reference and probe microphones.
See Figure 5.1.1.1.
Figure 5.1.1.1—Attaching the mounting sleeves
Real-Ear Measurements 73
Page 82

Plug in the monitor headset if you want to be able to “listen in” on the sound received in the client’s
spring catch
interlocking stop plates
velcro
speaker jack
recessed channel
slips over uprigh
t
speaker post
speaker jack
pop-up
speaker post
ear. The monitor jack, marked “headphones” is found on the back of the FP40. The volume on the
headphones is controlled with the knob next to the jack.
5.1.1.2 To set up the internal sound field speaker
Remove the test box from the FP40 compartment:
• Lift the compartment lid on the right side of the FP40 and remove the foam coupler holder.
The test box is secured in the compartment with an interlocking stop in the back, a spring
catch in front, and velcro on the bottom. See Figure 5.1.1.2A.
Side view Top view
Figure 5.1.1.2A—Sound chamber/sound field speaker
• Release the front spring catch of the sound chamber by pulling it forward.
• Lift the test box up and forward to remove it from the compartment. There will be a little
resistance from the velcro on the bottom.
Install the test box/speaker on the metal post
• Locate the metal post on the right side of the compartment.
• Pull the far end of the post up and forward until it locks in the vertical position.
• Open the test box and mount the speaker on the pole. The recessed metal channel on the out
side of the box slides over the upright pole. See Figure 5.1.1.2B. The speaker is now ready for
real ear testing.
-
74 FONIX FP40 Portable Hearing Aid Analyzer
Page 83

speaker post
recessed
channel
speaker jack
Figure 5.1.1.2B—Upright sound field speaker
Note: Do not close the chamber while it is on the post. In a closed position it may accidentally fall
off.
You may find it most convenient to position the FP40 at one edge of a table. If the client is seated
at the side of the table, the speaker can be rotated so that the correct angle for testing is very easily
achieved. See Figure 5.1.2.1.
Replace the test box/speaker when test is complete
• Remove the test box/speaker from the post and close it.
• The upright post is locked in place with a spring catch. Pull the catch outward to release the
post and return it to the horizontal position.
• Make sure all cables in the compartment are put away so they will not interfere with replacing
the test box.
• Set the test box back in the compartment, interlocking the back stop plates. As you do this,
guide the speaker wire so it stays to the side of the test box, not underneath it. Press down on
the front of the test box to snap the front catch in place.
Real-Ear Measurements 75
Page 84

5.1.1.3 To set up an external sound field speaker
If you have a permanent location for your analyzer, you may find it more convenient to use an
external sound field speaker for your real-ear measurements. This external sound field speaker can
be mounted on either a floor stand or a swing arm. See Figure 5.1.1.3 for an example of the swing
arm setup.
When performing real-ear measurements, plug in this sound field speaker to the jack on the back of
the FP40 labeled “External Speaker.”
Figure 5.1.1.3—External speaker setup
5.1.2 Setting up the client for testing
To set up the client for testing, you need to position the client in relation to the sound field speaker,
place the earhook and the reference microphone appropriately, insert the probe tube, and level the
sound field speaker.
5.1.2.1 To position the sound field speaker
The sound field speaker should be about 12 inches (30 cm) from the surface of the client’s head
(near the temple) and pointing toward the ear to be tested. We recommend an azimuth angle of 45
degrees (halfway between the client’s nose and ear). The height of the loudspeaker should be level
with, or a little above the ear. See Figure 5.1.2.
76 FONIX FP40 Portable Hearing Aid Analyzer
Page 85

Top View
Speaker
(45 degrees)
12"
Reference Mic
Probe Mic
12"
Reference Mi
c
Probe Mi
c
Front View
Speaker
(45 degrees)
Figure 5.1.2.1—Positioning of the sound field speaker for real-ear measurements
5.1.2.2 To place the earhook and reference microphone
1. Place the wedge-style earhook on the client’s ear. Alternately, place an earhook (without a
wedge) on the client’s ear, and place the Velcro headband around the client’s head.
2. Attach the reference microphone, facing for
ward, on the wedge of the earhook, directly
above the ear to be tested. The reference micro
phone should be as close to the head as pos
-
-
sible. See Figure 5.1.2.2.
3. Adjust the round Velcro pad on the wedge style
earhook by turning it, so that the inside pad fits
firmly against the client’s neck.
Real-Ear Measurements 77
Figure 5.1.2.2—Placing the reference
microphone
Page 86

5.1.2.3 To insert the probe tube
There are several different methods used for properly inserting the probe tube. Here are two easy
methods.
Method 1
1. Place an unattached probe tube on a flat surface along with the client’s earmold or shell.
2. Place or hold the ear mold next to the probe tube, so that the tube rests along the bottom
of the canal part of the earmold, with the tube
extending at least 5 mm (1/5 inch) past the canal
opening. If there is a large vent, you can slide the
tube down the vent until it protrudes at least 5
mm past the canal opening.
3. Mark the probe tube where it meets the outside
surface of the earmold with a marking pen. See
Figure 5.1.2.3A.
4. Attach the probe tube to the body of the probe
microphone.
5. Attach the probe microphone to the round Velco
pad on the earhook.
6. Insert the probe tube (without the earmold or
aid) into the client’s ear so that the mark is at the
location where the bottom of the outer surface of
the earmold will be, once the earmold is in place.
See Figure 5.1.2.2
Method 2
Figure 5.1.2.3A—Marking the probe
tube
This method is easiest if you have the Composite Option. It uses the fact that there is a dip in gain
caused by a standing wave created by the 6 kHz frequency reflecting off the eardrum.
1. Press F5 to enter Probe Mode.
2. Press F7 to select the Composite signal. You may have to press the button repeatedly.
3. Press START/STOP to start a measurement.
4. Insert the probe tube carefully, looking at the composite measurement. At some point, there
will be a large dip at 6 kHz caused by the standing wave inside the ear. Keep inserting the
probe tube until that dip goes away. See Figure 5.1.2.3B.
Hints: To help keep the probe tube in place, position the tube so that it runs through the tragal
notch, resting against the lower edge of the tragus. If necessary, reposition the body of the probe
microphone lower on the Velcro button of the ear hanger. If desired, use surgical tape to hold the
tube in position.
78 FONIX FP40 Portable Hearing Aid Analyzer
Page 87

Figure 5.1.2.3B – Unaided response with correct insertion of the probe tube
5.1.2.4 To level the sound field
Leveling is a process that takes into consideration all the inconsistencies in the sound field. In order
to get accurate measurements, it is critical that the sound field is leveled for every patient and every
ear. The leveling process only uses the reference microphone placed above the client’s ear. It does
not use the probe microphone, so it doesn’t matter whether you insert the probe tube before or
after you level the sound field speaker.
If you have the Composite Option, leveling is done with a flat-weighted composite signal and takes
just a few seconds. If you don’t have the Composite Option, leveling is done with a pure-tone
sweep, taking slightly longer than composite leveling.
1. Position the client in front of the sound field speaker as described in Section 5.1.2.1.
2. Position the earhook and reference microphone as described in Section 5.1.2.2.
3. Enter the real-ear measurement screen by pressing F5 from the Coupler Screen.
4. Press LEVEL and START/STOP. This will attempt to level the sound field speaker.
If leveling is achieved, the word LEVELED will appear in the Status box. See Figure 5.1.2.4. If level
ing is not achieved, the word UNLEVELED will appear in the Status box. There is an intermediate
stage where neither LEVELED or UNLEVELED appears. Pushing the LEVEL and START button again
will often produce the desired leveling.
The client must be in the same position for leveling and real-ear testing.
Real-Ear Measurements 79
-
Page 88

Figure 5.1.2.4—Leveling the sound field speaker
5.2 The Target Screen
The Target screen is used to enter the patient’s threshold and uncomfortable levels, select a fitting
rule, and create a target. You can modify most real-ear targets in this screen to fit the specific needs
of your client. (DSL targets cannot be modified.)
5.2.1 Viewing the target screen
See Figure 5.2.1 for an example of the target screen. If the target screen is entered while the realear screen is in SPL display mode (see Section 5.4), you will not see the insertion gain graph on the
left side of the display.
80 FONIX FP40 Portable Hearing Aid Analyzer
Page 89

WARNING:
Choose OUTPUT LIMITING carefully (see procedure below). You do not want to damage
your client’s hearing or cause them discomfort during testing. To ensure safety and com-
fort, the FP40 system reacts automatically when the OUTPUT LIMITING level is exceeded
at the Probe Microphone. When the level measured at the Probe Microphone exceeds the
pre-set limit, the words “PROBE OUTPUT LIMIT EXCEEDED” appear on the screen, and
the program automatically stops.
The default setting for OUTPUT LIMITING is 120 dB SPL. You can set the OUTPUT
LIMITING to any level between 90 and 140 dB SPL in 5-dB increments (see procedure
below). In special cases, when you select 130 or 140 dB SPL, be aware that extra care
is necessary with any output that may exceed 132 dB SPL. Keep in mind that the
sound pressure level at the eardrum can be higher than that measured at
the mid-ear canal position, especially at high frequencies. For this reason, we recom-
mend extreme caution when using pure tones for “in-situ” SSPL measurements.
Whenever the output limiting function has stopped the test signal, you
must either turn down the hearing aid, lower the source SPL, or change the
output limit.
To view or change the OUTPUT LIMITING setting:
1. Push F1 [SETUP MENU].
2. Use the AMPLITUDE & FREQUENCY knobs to move the cursor to PROBE PARAM
ETERS — OUTPUT LIMITING
3. Use the [START/STOP] button to choose the desired limit.
4. Return to PROBE by pushing F1 [EXIT MENU].
-
Real-Ear Measurements 81
Page 90

SANITATION NOTICE
DO NOT REUSE PROBE TUBES.
Use a new probe tube for each ear to prevent the pos
sible spread of infection. Sterilization of probe tubes
is not possible, and germicidal solutions can leave a
residue inside the tubing which can result in errors. Do
not cut off any portion of the tube.
DO NOT REUSE INSERT EARPHONE EARTIPS
Insert earphone eartips are used primarily for perform
ing RECD and audiometric measurements. Sterilization
of these eartips is not possible. When performing these
measurements, make sure to use a new ear tip for each
patient.
-
-
82 FONIX FP40 Portable Hearing Aid Analyzer
Page 91

Figure 5.2.1—The Target screen
1. Insertion gain target graphical display.
2. Fitting rule used in generation of the target.
3. Chosen ear.
4. UCL status: predicted or measured.
5. Age of client.
6. Frequency column.
7. HTL data for corresponding frequencies.
8. UCL data for corresponding frequencies. UCLs can be predicted or measured.
9. Insertion gain target data. (DSL LIN and DSL WDRC targets not displayed in this column)
10. HL graphical display for HTL and UCL data.
Note: If DSL WDRC is the chosen fitting rule, the compression threshold will also be displayed,
next to the UCL status at the top of the screen.
5.2.2 Creating a target
1. Press F5 to enter the real-ear measurement screen from the Main screen.
2. Press F2, if necessary, to highlight SPL (SPL-o-gram), IG (Insertion Gain), or AI (Audibility
Index) as the real-ear measurement type. Note: You must select SPL here to create DSL tar
gets.
3. Press F4 to enter the target screen.
4. Press F1, if necessary, to select the desired ear.
5. Look at the label above F2. HTL should be highlighted. If not, push F2 to highlight HTL.
Real-Ear Measurements 83
-
Page 92

6. Use the FREQUENCY and AMPLITUDE knobs to input the hearing threshold levels for the
selected ear. The numerical values will appear in the HTL dB HL column in the table just to
the right of the large graph. As you enter the HTL values, the smaller graph on the right side
of the screen will be updated.
7. Press F2 to highlight UCL if you would like to enter measured UCL values using the
FREQUENCY and AMPLITUDE knobs. If you would like the analyzer to predict these values
from the client’s threshold values, skip this step.
8. Press F3 to select the desired fitting rule.
9. Press F6 to select the client’s age if the client is a child. If the client in an adult, you can skip
this step.
10. Press F5 to generate the target. Predicted UCL values are also generated if you have not
entered any measured values.
Notes:
• If you are only going to perform insertion gain measurements, there is no need to input the
UCL or age values. They are not used in the insertion gain measurement method.
• If you selected IG in Step 2 of the above instructions, an insertion gain graph will appear on
the left side of the target screen. When you generate the target, as described in Step 10, the
insertion gain target will be displayed on that graph.
• If you have selected the DSL WDRC fitting rule, you can use F2 to select CT and the
AMPLITUDE knob to modify the compression threshold status. The compression threshold is
displayed at the top middle part of the screen, next to the UCL status.
• The fitting rule NAL-2 is often referred to as NAL-R in other hearing aid analysis systems.
• It is sometimes useful to clear threshold values. To do this, use F2 to select HTL. Next, press
F8 to clear the threshold values. You can also use this method for clearing UCL values and tar
gets.
• It is possible to print the target screen with or without a label. Use F9 to toggle whether or not
you want any printouts to include a label.
-
5.2.3 Setting the default target
If you consistently use the same fitting rule, you may set it as your analyzer’s default. To do this,
select the desired fitting rule with F3 in the Target screen. Next, press START/STOP. You will see a
WAIT message appear on the screen momentarily. When this message disappears, the selected fit
ting rule is stored as the default.
84 FONIX FP40 Portable Hearing Aid Analyzer
-
Page 93

5.2.4 Creating your own target
Advanced users may want to be able to input their own targets, without applying any particular fitting rule. To do this:
1. Use F3 to select DIRECT.
2. Press F5. This will clear any existing targets and put you in a target editing mode.
3. Use the AMPLITUDE and FREQUENCY knobs to generate your own insertion gain target.
(You cannot input target values in terms of dB SPL.)
5.2.5 Modifying an existing target
All non-DSL targets can be modified. To modify an existing target:
1. Generate the target as described in Section 5.2.2.
2. Press F2 until TAR is highlighted.
3. Use the AMPLITUDE and FREQUENCY knobs to make any desired modifications. The target
will be labeled with a note denoting that it has been modified. See Figure 5.2.5.
Figure 5.2.5—Modifying an existing target
5.3 Insertion Gain Measurements
The insertion gain test shows you how much gain the hearing aid is providing above the ear’s natural resonance. When performing an insertion gain measurement, you enter your client’s thresholds
to create a target, take the unaided response, take the aided response, and compare the insertion
gain response to the insertion gain target, adjusting the hearing aid accordingly.
Real-Ear Measurements 85
Page 94

5.3.1 Viewing the Insertion Gain screen
Here is an picture of the Insertion Gain screen.
1. Insertion gain graph
2. Source type for current curve
3. Noise reduction status for current curve
4. Reference microphone status
5. Smoothing status
6. Leveling status
7. RMS source level used to take measurement
8. RMS of the current curve. Not available with pure-tone source types.
9. Output limit status
10. Selected ear
11. Fitting rule used to create insertion gain target
12. Graph containing unaided and aided gain responses
Figure 5.3.1—Insertion Gain display
5.3.2 Taking an unaided response
The unaided response is the first step in the insertion gain measurement procedure.
1. Enter the Probe Mode by either pressing F5 from the Main screen or F4 from the Target
screen.
2. Look at the label above F2. IG and UNAIDED should be selected. If not, press F2
3. Position the client in front of the sound field speaker, insert the probe microphone, and per
form the leveling procedure. This is described in Section 5.1.2.
86 FONIX FP40 Portable Hearing Aid Analyzer
-
Page 95

4. Select the desired source with F7. Use either NORM (for a pure-tone sweep), or COMP (for a
composite signal).
5. Use the AMPLITUDE knob to select the desired amplitude. Unaided measurements are usu
ally made with 65 or 70 dB SPL.
6. Press START/STOP to start the measurement. If you are using a composite source, press
START/STOP again when the measurement stabilizes to stop the measurement. See Figure
5.3.2.
The analyzer will automatically set itself up for an aided measurement. To perform another unaided
measurement, press F2 to select UNAIDED again.
Figure 5.3.2—The unaided response
-
Note: Every time you leave the insertion gain screen to go to the menu or the target screen, unaid
ed will automatically be selected when you return to the insertion gain screen.
5.3.3 Taking an aided response
The aided response is the second step in the insertion gain procedure.
1. Insert the aid into the ear, making sure the probe tube remains in position.
2. Look at the label above F3. AIDED 1 should be highlighted, assuming you followed the
instructions from Section 5.3.2.
3. Select the source type with F7. See Section 2.4 for an explanation of source types.
4. Set the source level by using the AMPLITUDE knob.
5. Press START/STOP to start the measurement. The aided response will appear on the small
graph on the right, and the insertion gain response will appear on the larger graph on the
left. If a composite, Digital Speech, or fast pure-tone sweep is being used as the source type,
press START/STOP to stop the measurement once it has stabilitized.
Real-Ear Measurements 87
-
Page 96

6. Press F3 to select Aided 2, and repeat steps 3-5 to perform another measurement. A third
aided response may be run in a similar fashion.
Figure 5.3.3—The aided response
Other functions
• Turn on/off the display of the selected aided curve by pressing F6.
• Clear all measurement curves by pressing F8.
• Set the OUTPUT LIMIT under PROBE SETTINGS in the Menu screen. This sets how loud a
signal the probe microphone will level without automatically shutting down the sound field
speaker to protect the client. Enter the Menu screen by pressing F1. Use the AMPLITUDE
and FREQUENCY knobs to select the setting, and use the START/STOP button to toggle the
desired selection.
• Use the F9 button to toggle whether or not you want a label included with a real-ear measure
ment printout.
-
5.3.4 Viewing insertion gain
Insertion gain is the difference between the unaided response and the aided response. In other
words, it is the amount of amplification provided by the hearing aid, not including the natural
amplification of the unaided ear.
If you have created a target, as described in Section 5.1, it will be displayed as a thick solid line in
the large graph on the left side of the real-ear insertion gain screen. Any measured insertion gain
responses will be displayed as thinner lines on the same graph. You can display up to three differ
ent insertion gain measurements at the same time. See Figure 5.3.1 for a view of the insertion gain
display.
88 FONIX FP40 Portable Hearing Aid Analyzer
-
Page 97

5.3.5 Testing Open Fit Hearing Aids
Open fit hearing aids have been known to interfere with the reference microphone measurement
outside the ear. To determine if a particular hearing aid is interfering with the reference micro
phone, perform the following measurement in the insertion gain screen. The feedback cancellation
and other features normally used by the patient should be enabled on the hearing aid.
1. Measure the aided response as described in Section 5.3.3.
• The sound field speaker should be LEVELED.
• The reference microphone setting should be ON. The reference microphone status is dis
played in Status box.
• [F3] should be set to AIDED 1.
• The source amplitude should be set to 65 dB SPL. Use the Amplitude knob to adjust the
source if necessary.
• [F7] should be set to DIGSP ANSI or COMPOSITE.
-
-
2. Press [START/STOP] to start the measurement. Press [START/STOP] again when the measure
ment has stabilized.
3. Use [F3] to select AIDED 2
4. Press [F1] to open the menu. Use the Amplitude and Frequency knobs to select REFERENCE
MIC under PROBE SETTINGS. Press [START/STOP] to change the setting to OFF. Press [F1] to
return to the Insertion Gain screen..
5. Measure the aided response as described in Section 5.3.3.
• The source amplitude should be set to 65 dB SPL. Use the Amplitude knob to adjust the
source if necessary.
• [F7] should be set to the source type used in Step 1.
6. Press [START/STOP] to start the measurement. Press [START/STOP] again when the measure
ment has stabilized.
7. Look at the difference between AIDED 1 and AIDED 2.
If there is no more than 2 dB of difference between AIDED 1 and AIDED 2 at any frequency, you
can perform real-ear measurements using that particular model of open ear hearing aid without
adjusting the hearing aid analyzer. If the two measurements are different by 3 dB or greater at any
frequency, it is recommended to disable the reference microphone when performing REMs using
this type of device. To disable the reference microphone, follow the instructions found in Step 4
above.
-
-
When performing a real-ear measurement while the reference microphone is disabled, it is par
ticularly important to make sure the patient doesn’t move after the sound field speaker has been
leveled because the reference microphone will not be able to compensate for any changes in the
patient’s position.
Real-Ear Measurements 89
-
Page 98

5.4 SPL Measurements (including real-ear DSL)
The real-ear SPL screen permits the user to view all the major components of the hearing loss and
the hearing aid fitting on one SPL screen with real ear measurements. The hearing thresholds and
uncomfortable loudness levels, which are generally measured in HL, are converted to SPL. Target
insertion gains are also converted to dB SPL. Provision is made to show three aided responses, in
SPL, at three different source amplitude levels. Having all this information in a common format provides a convenient way to view the hearing loss and the amplification solution provided without the
confusion of different frames of reference.
5.4.1 Understanding the SPL approach
The idea behind the real-ear SPL screen is to run three aided response measurements on each
hearing aid. (Unaided measurements are not necessary in the SPL approach.) These measurement
curves are to make sure:
• soft sounds are audible (AIDED 1)
• moderate sounds are comfortable and meet the target (AIDED 2)
• loud sounds do not exceed the user’s uncomfortable loudness level (AIDED 3)
The factory default amplitudes used in this program are generally 50, 65 and 90 dB. (Sometimes
this differs, depending on the default fitting rule and the configuration of the analyzer.) The user
may choose other amplitude levels while conducting the tests. To change the level of the SPL target,
modify the amplitude and source type of AIDED 2.
As with other SPL measurements, the reference microphone is turned off during this test. Sound
field leveling is still necessary but extra care should be taken by the client not to move around once
leveling has been achieved.
Some notes on the SPL display:
• When a pure tone or warble signal sweep is chosen for the SPL test type, it is always speech
weighted (unless the amplitude is 85 dB or above). The target is also speech weighted. The
measurements and the target will therefore look different from the insertion gain targets that
have been commonly used. The speech weighting makes the shape of the pure tone and war
ble curves conform to that of the composite signal.
• The same target formulas that are used with the Insertion Gain program; NAL-2, Berger,
POGO, 1/2 Gain, 1/3 Gain, and 2/3 Gain are available for the SPL approach. All targets
are converted to real-ear SPL by including the AIDED 2 source and the average
unaided ear canal into the calculation. Whenever you change the source amplitude of
AIDED 2, the target will change. The target is intended to be at the user’s Most Comfortable
Level.
• The reference microphone is automatically disabled in the SPL screen. Therefore, no particular
adjustment needs to be made to the FP40 analyzer to test open fit hearing aids.
-
90 FONIX FP40 Portable Hearing Aid Analyzer
Page 99

5.4.2 Understanding the specifics of DSL
The Desired Sensation Level (DSL) method is a hearing aid selection and fitting approach with
the goal of making amplified speech audible. The desired sensation levels for amplified speech are
determined at each frequency for all degrees of sensorineural hearing loss. The DSL method is not
an insertion gain formula approach (i.e. NAL, POGO), but it does use probe microphone instrumen
tation as well as 2-cc coupler measurements in the test box. DSL was originally developed for use
with children and later expanded to include adults.
In order to perform a DSL real-ear fitting, follow the general SPL instructions found in Section
5.4.4. Make sure to select DSL WDRC or DSL LIN when generating the target. In order to perform
DSL coupler measurements, including real-ear to coupler difference (RECD) measurements, follow
the instructions found in Section 5.6.
When DSL is the selected fitting method, the FP40 makes several accommodations in the real-ear
and target screens. These accommodations happen automatically, so you don’t really have to worry
about them, but it’s useful to know what’s going on.
When DSL is selected:
• The Composite signal is weighted using the adult or child long-term average speech spectrum
(LTASS) instead of the normal ANSI weighting. Keep this in mind if comparing real-ear DSL
measurements to measurements made with a different type of target.
• The Digital Speech signal is weighted using the adult or child LTASS instead of ANSI or ICRA
speech weighting. The Digital Speech source selection is denoted as DIGSP LTASS to reflect its
speech weighting.
• A “speech banana” appears on the real-ear SPL screen along with the target, HTL, and UCL
data. This speech banana disappears when a measurement is taken, in order to cut down on
the number of lines on the screen at the same time.
• There is a CT (compression threshold) selection in the target screen with DSL WDRC is the
selected fitting rule. This does not apply for DSL LIN.
• There are no corresponding insertion gain targets since DSL is not meant to be viewed in
terms of insertion gain.
• There is no way to edit a real-ear DSL target.
-
Figure 5.4.2 shows an example of the real-ear SPL screen with a DSL target.
Figure 5.4.2—Real-ear SPL screen using a DSL WDRC target
Real-Ear Measurements 91
Page 100

5.4.3 Viewing the SPL screen
See Figure 5.4.3 for a picture of the SPL testing screen.
1. Curve box containing the source type and amplitude of each of the three measurement
curves.
2. Source type for current curve
3. Noise reduction status for current curve
4. Reference microphone status
5. Smoothing status
6. Leveling status
7. RMS source level used to take measurement
8. RMS of the current curve. Not available with pure-tone source types.
9. Output limit status
10. Selected ear
11. Selected age of client
12. SPL graph for aided measurements, HTL, UCL, and AIDED 2 target
13. UCL values shown in dB SPL
14. Target for AIDED 2 shown in dB SPL
15. HTL values shown in dB SPL
16. Selected fitting rule
Figure 5.4.3—SPL Testing screen
5.4.4 Taking the SPL measurements
1. Create the real-ear target, if desired, by following the instructions found in Section 5.2. Make
sure to choose SPL in step 2 of that section.
92 FONIX FP40 Portable Hearing Aid Analyzer
 Loading...