


Hardware and Software User Manual
Revision Date: 1/3/2017

TELEDYNE LECROY
Copyright © 2017 Teledyne LeCroy, Inc.
FTS, Frontline, Frontline Test System, ComProbe Protocol Analysis System and ComProbe are registered
trademarks of Teledyne LeCroy, Inc.
The Bluetooth SIG, Inc. owns the Bluetooth® word mark and logos, and any use of such marks by Teledyne
LeCroy, Inc. is under license.
All other trademarks and registered trademarks are property of their respective owners.
i Frontline BPA low energy Hardware & Software User Manual

TELEDYNE LECROY
Contents
Chapter 1 Frontline Hardware & Software 1
1.1 What is in this manual 2
1.2 Computer Minimum System Requirements 2
1.3 Software Installation 2
Chapter 2 Getting Started 3
2.1 BPA low energy Hardware 3
2.2 Data Capture Methods 3
2.2.1 Opening Data Capture Method 3
2.2.2 Frontline® BPA low energy Data Capture Methods 5
2.3 Control Window 6
2.3.1 Control Window Toolbar 7
2.3.2 Configuration Information on the Control Window 7
2.3.3 Status Information on the Control Window 8
2.3.4 Frame Information on the Control Window 8
2.3.5 Control Window Menus 8
2.3.6 Minimizing Windows 12
Chapter 3 Configuration Settings 13
3.1 BPAle I/O Settings - Datasource 13
3.1.1 BPA Low Energy datasource Toolbar/Menu 13
3.1.2 BPA low energy Devices Under Test 14
3.1.3 BPA Low Energy LE Device Database 16
3.1.4 BPA low energy Datasource Information 18
3.1.5 BPA low energy Update Firmware 18
3.2 Decoder Parameters 19
3.2.1 Decoder Parameter Templates 21
3.2.2 Selecting A2DP Decoder Parameters 23
3.2.3 L2CAP Decoder Parameters 23
3.2.4 RFCOMM Decoder Parameters 25
Chapter 4 Capturing and Analyzing Data 29
4.1 Capture Data 29
4.1.1 Air Sniffing: Positioning Devices 29
4.1.2 Capturing Data to Disk - General Procedure 31
4.1.3 Extended Inquiry Response 33
Frontline BPA low energy Hardware & Software User Manual ii

TELEDYNE LECROY
4.2 Protocol Stacks 34
4.2.1 Protocol Stack Wizard 34
4.2.2 Creating and Removing a Custom Stack 35
4.2.3 Reframing 36
4.2.4 Unframing 36
4.2.5 How the Analyzer Auto-traverses the Protocol Stack 37
4.2.6 Providing Context For Decoding When Frame Information Is Missing 37
4.3 Analyzing Protocol Decodes 38
4.3.1 The Frame Display 38
4.3.2 low energy Timeline 73
4.3.3 Coexistence View 90
4.3.4 Message Sequence Chart (MSC) 118
4.4 Packet Error Rate Statistics 127
4.4.1 Packet Error Rate - Channels 128
4.4.2 Packet Error Rate - Pie Chart and Expanded Chart 129
4.4.3 Packet Error Rate - Legend 130
4.4.4 Packet Error Rate - Additional Statistics 130
4.4.5 Packet Error Rate - Sync Selected Packets With Other Windows 131
4.4.6 Packet Error Rate - Export 131
4.4.7 Packet Error Rate - Scroll Bar 132
4.5 Analyzing Byte Level Data 133
4.5.1 Event Display 133
4.5.2 The Event Display Toolbar 134
4.5.3 Opening Multiple Event Display Windows 136
4.5.4 Calculating CRCs or FCSs 136
4.5.5 Calculating Delta Times and Data Rates 136
4.5.6 Switching Between Live Update and Review Mode 137
4.5.7 Data Formats and Symbols 137
4.6 Data/Audio Extraction 141
Chapter 5 Navigating and Searching the Data 145
5.1 Find 145
5.1.1 Searching within Decodes 146
5.1.2 Searching by Pattern 148
5.1.3 Searching by Time 149
iii Frontline BPA low energy Hardware & Software User Manual

TELEDYNE LECROY
5.1.4 Using Go To 151
5.1.5 Searching for Special Events 153
5.1.6 Searching by Signal 154
5.1.7 Searching for Data Errors 156
5.1.8 Find - Bookmarks 159
5.1.9 Changing Where the Search Lands 160
5.1.10 Subtleties of Timestamp Searching 160
5.2 Bookmarks 161
5.2.1 Adding, Modifying or Deleting a Bookmark 161
5.2.2 Displaying All and Moving Between Bookmarks 162
Chapter 6 Saving and Importing Data 164
6.1 Saving Your Data 164
6.1.1 Saving the Entire Capture File 164
6.1.2 Saving the Entire Capture File with Save Selection 165
6.1.3 Saving a Portion of a Capture File 166
6.2 Adding Comments to a Capture File 166
6.3 Confirm Capture File (CFA) Changes 167
6.4 Loading and Importing a Capture File 167
6.4.1 Loading a Capture File 167
6.4.2 Importing Capture Files 168
6.5 Printing 168
6.5.1 Printing from the Frame Display/HTML Export 168
6.5.2 Printing from the Event Display 171
6.6 Exporting 172
6.6.1 Frame Display Export 172
6.6.2 Exporting a File with Event Display Export 172
Chapter 7 General Information 176
7.1 System Settings and Progam Options 176
7.1.1 System Settings 176
7.1.2 Changing Default File Locations 179
7.1.3 Side Names 181
7.1.4 Timestamping 182
7.2 Technical Information 184
7.2.1 Performance Notes 184
Frontline BPA low energy Hardware & Software User Manual iv

TELEDYNE LECROY
7.2.2 BTSnoop File Format 185
7.2.3 Progress Bars 187
7.2.4 Event Numbering 188
7.2.5 Useful Character Tables 188
7.2.6 DecoderScript Overview 190
7.2.7 Bluetooth low energy ATT Decoder Handle Mapping 191
Contacting Technical Support 192
Appendicies 194
Appendix A: Application Notes 195
A.1 Decrypting Encrypted Bluetooth® low energy 196
A.1.1 How Encryption Works in Bluetooth low energy 196
A.1.2 Pairing 196
A.1.3 Pairing Methods 197
A.1.4 Encrypting the Link 198
A.1.5 Encryption Key Generation and Distribution 198
A.1.6 Encrypting The Data Transmission 199
A.1.7 Decrypting Encrypted Data Using Frontline® BPA 600 low energy Capture 199
A.2 Bluetooth® low energy Security 204
A.2.1 How Encryption Works in Bluetooth low energy 205
A.2.2 Pairing 205
A.2.3 Pairing Methods 206
A.2.4 Encrypting the Link 207
A.2.5 Encryption Key Generation and Distribution 207
A.2.6 Encrypting The Data Transmission 208
A.2.7 IRK and CSRK Revisited 208
A.2.8 Table of Acronyms 209
A.3 Bluetooth Virtual Sniffing 210
A.3.1 Introduction 210
A.3.2 Why HCI Sniffing and Virtual Sniffing are Useful 210
A.3.3 Bluetooth Sniffing History 211
A.3.4 Virtual Sniffing—What is it? 211
A.3.5 The Convenience and Reliability of Virtual Sniffing 212
A.3.6 How Virtual Sniffing Works 212
A.3.7 Virtual Sniffing and Bluetooth Stack Vendors 212
v Frontline BPA low energy Hardware & Software User Manual

TELEDYNE LECROY
A.3.8 Case Studies: Virtual Sniffing and Bluetooth Mobile Phone Makers 213
A.3.9 Virtual Sniffing and You 213
Frontline BPA low energy Hardware & Software User Manual vi

Chapter 1 Frontline Hardware & Software
Frontline Test Equipment family of protocol analyzers work with the following technologies.
l Classic Bluetooth
l Bluetooth low energy (BPA LE supports Bluetooth low energy features through Bluetooth 4.2, except
optional extended packet length.)
l Dual Mode Bluetooth (simultaneous Classic and low energy)
l Bluetooth Coexistence: Bluetooth with 802.11 Wi-Fi
l Bluetooth HCI (USB, SD, High Speed UART)
l NFC
l 802.11 (Wi-Fi)
l SD
l HSU (High Speed UART)
The Frontline hardware interfaces with your computer that is running our robust software engine called the
ComProbe Protocol Analysis System or Frontline software. Whether you are sniffing the air or connecting
directly to the chip Frontline analyzers use the same powerful Frontline software to help you test,
troubleshoot, and debug communications faster.
Frontline software is an easy to use and powerful protocol analysis platform. Simply use the appropriate
Frontline hardware or write your own proprietary code to pump communication streams directly into the
Frontline software where they are decoded, decrypted, and analyzed. Within the Frontline software you see
packets, frames, events, coexistence, binary, hex, radix, statistics, errors, and much more.
This manual is a user guide that takes you from connecting and setting up the hardware through all of the
Frontline software functions for your Frontline hardware. Should you have any questions contact the
Frontline Technical Support Team.
Frontline BPA low energy Hardware & Software User Manual 1

TELEDYNE LECROY Chapter 1 Frontline Hardware & Software
1.1 What is in this manual
The Frontline User Manual comprises the following seven chapters. The chapters are organized in the
sequence you would normally follow to capture and analyze data: set up, configure, capture, analyze, save.
You can read them from beginning to end to gain a complete understanding of how to use the Frontline
hardware and software or you can skip around if you only need a refresher on a particular topic. Use the
Contents, Index, and Glossary to find the location of particular topics.
l Chapter 1 Frontline Hardware and Software. This chapter will describe the minimum computer
requirements and how to install the software.
l Chapter 2 Getting Started. Here we describe how to set up and connect the hardware, and how to apply
power. This chapter also describes how to start the Frontline software in Data Capture Methods. You will
be introduced to the Control window that is the primary operating dialog in the Frontline software.
l Chapter 3 Configuration Settings. The software and hardware is configured to capture data. Configuration
settings may vary for a particular Frontline analyzer depending on the technology and network being
sniffed. There are topics on configuring protocol decoders used to disassemble packets into frames and
events.
l Chapter 4 Capturing and Analyzing Data. This Chapter describes how to start a capture session and how
to observe the captured packets, frames, layers and events.
l Chapter 5 Navigating and Searching the Data. Here you will find how to move through the data and how
to isolate the data to specific events, often used for troubleshooting device design problems.
l Chapter 6 Saving and Importing Data. When a live capture is completed you may want to save the
captured data for future analysis, or you may want to import a captured data set from another developer
or for use in interoperability testing. This chapter will explain how to do this for various data file formats.
l Chapter 7 General Information. This chapter provides advanced system set up and configuration
information, timestamping information, and general reference information such as ASCII, baudot, and
EBCDIC codes. This chapter also provides information on how to contact Frontline's Technical Support
team should you need assistance.
1.2 Computer Minimum System Requirements
Frontline supports the following computer systems configurations:
l Operating System: Windows 7/8/10
l USB Port: USB 2.0 High-Speed or or later
The Frontline software must operate on a computer with the following minimum characteristics.
l Processor: Core i5 processor at 2.7 GHz
l RAM: 4 GB
l Free Hard Disk Space on C: drive: 20 GB
1.3 Software Installation
Download the installation software from FTE.com. Once downloaded, double-click the installer and follow the
directions.
Use this link: http://www.fte.com/bpale-soft.
2 Frontline BPA low energy Hardware & Software User Manual
Chapter 2 Getting Started
In this chapter we introduce you to the Frontline hardware and show how to start the Frontline analyzer
software and explain the basic software controls and features for conducting the protocol analysis.
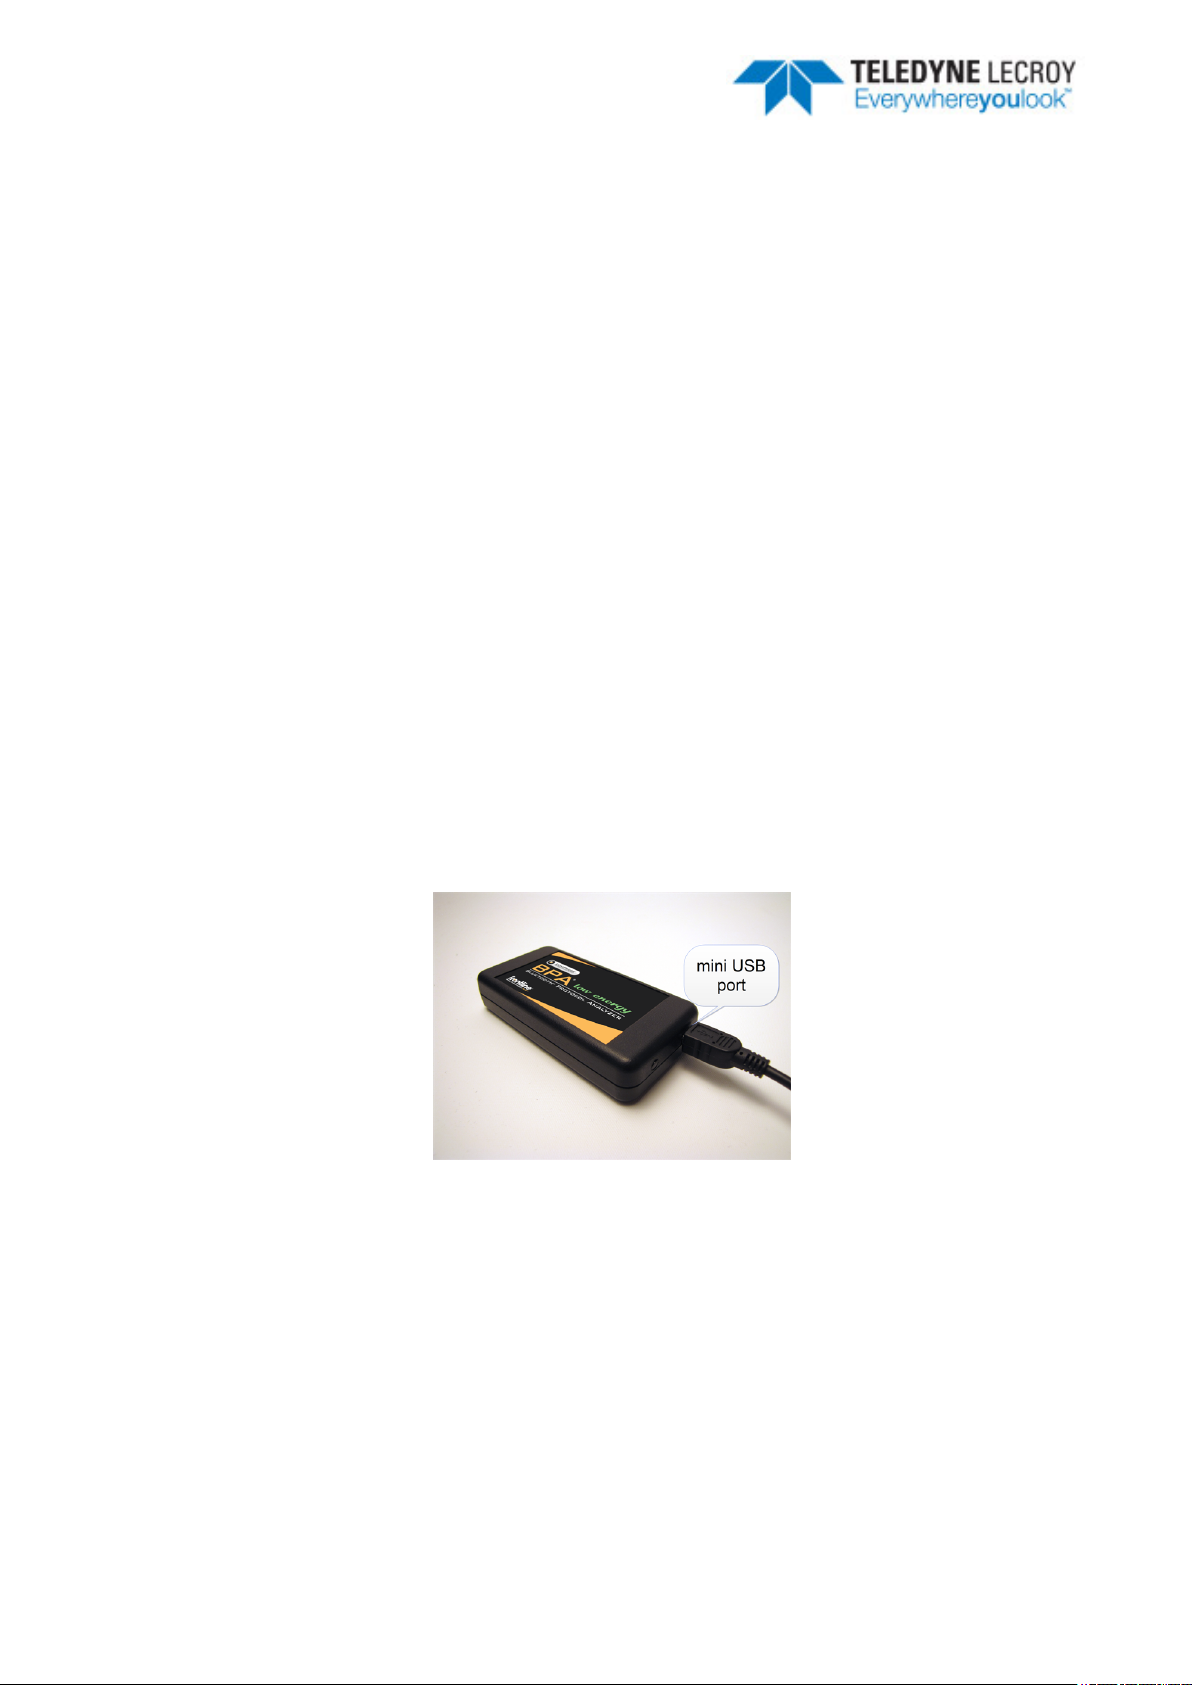
2.1 BPA low energy Hardware
1. Insert the USB cable mini-connector into the USB port on the Frontline BPA low energy hardware.
2. Insert the other end of the USB cable into the PC.
Figure 2.1 - BPA low energy Hardware USB Port
2.2 Data Capture Methods
This section describes how to load TELEDYNE LECROY Frontline Protocol Analysis System software, and how
to select the data capture method for your specific application.
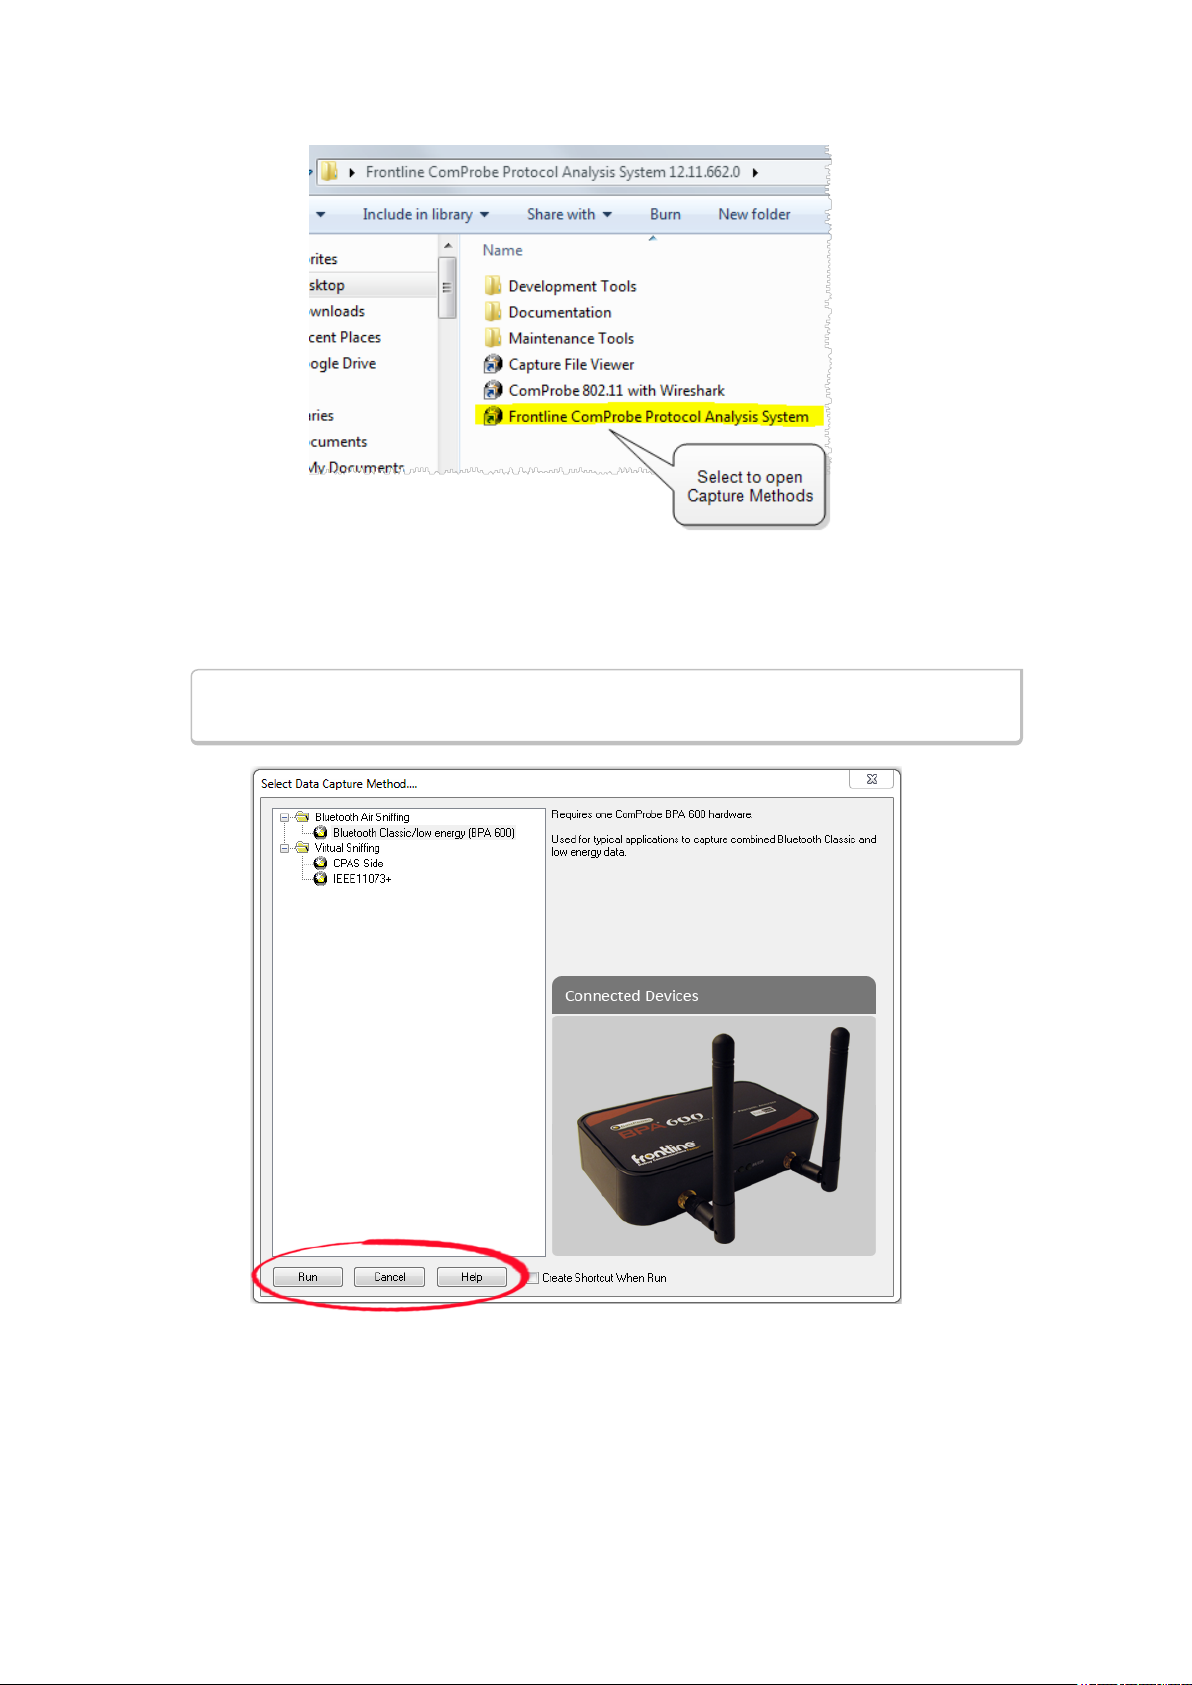
2.2.1 Opening Data Capture Method
On product installation, the installer creates a folder on the windows desktop labeled "Frontline <version #>".
1. Double-click the " Frontline <version #>" desktop folder
This opens a standard Windows file folder window.
Frontline BPA low energy Hardware & Software User Manual 3
TELEDYNE LECROY Chapter 2 Getting Started
Figure 2.2 - Desktop Folder Link
2. Double-click on Frontline ComProbe Protocol Analysis System and the system displays the Select
Data Capture Method... dialog.
Note: You can also access this dialog by selecting Start > All Programs > Frontline
(Version #) > Frontline ComProbe Protocol Analysis System
Figure 2.3 - Example: Select Data Capture Method..., BPA 600
Three buttons appear at the bottom of the dialog; Run, Cancel, and Help.
4 Frontline BPA low energy Hardware & Software User Manual
Chapter 2 Getting Started TELEDYNE LECROY
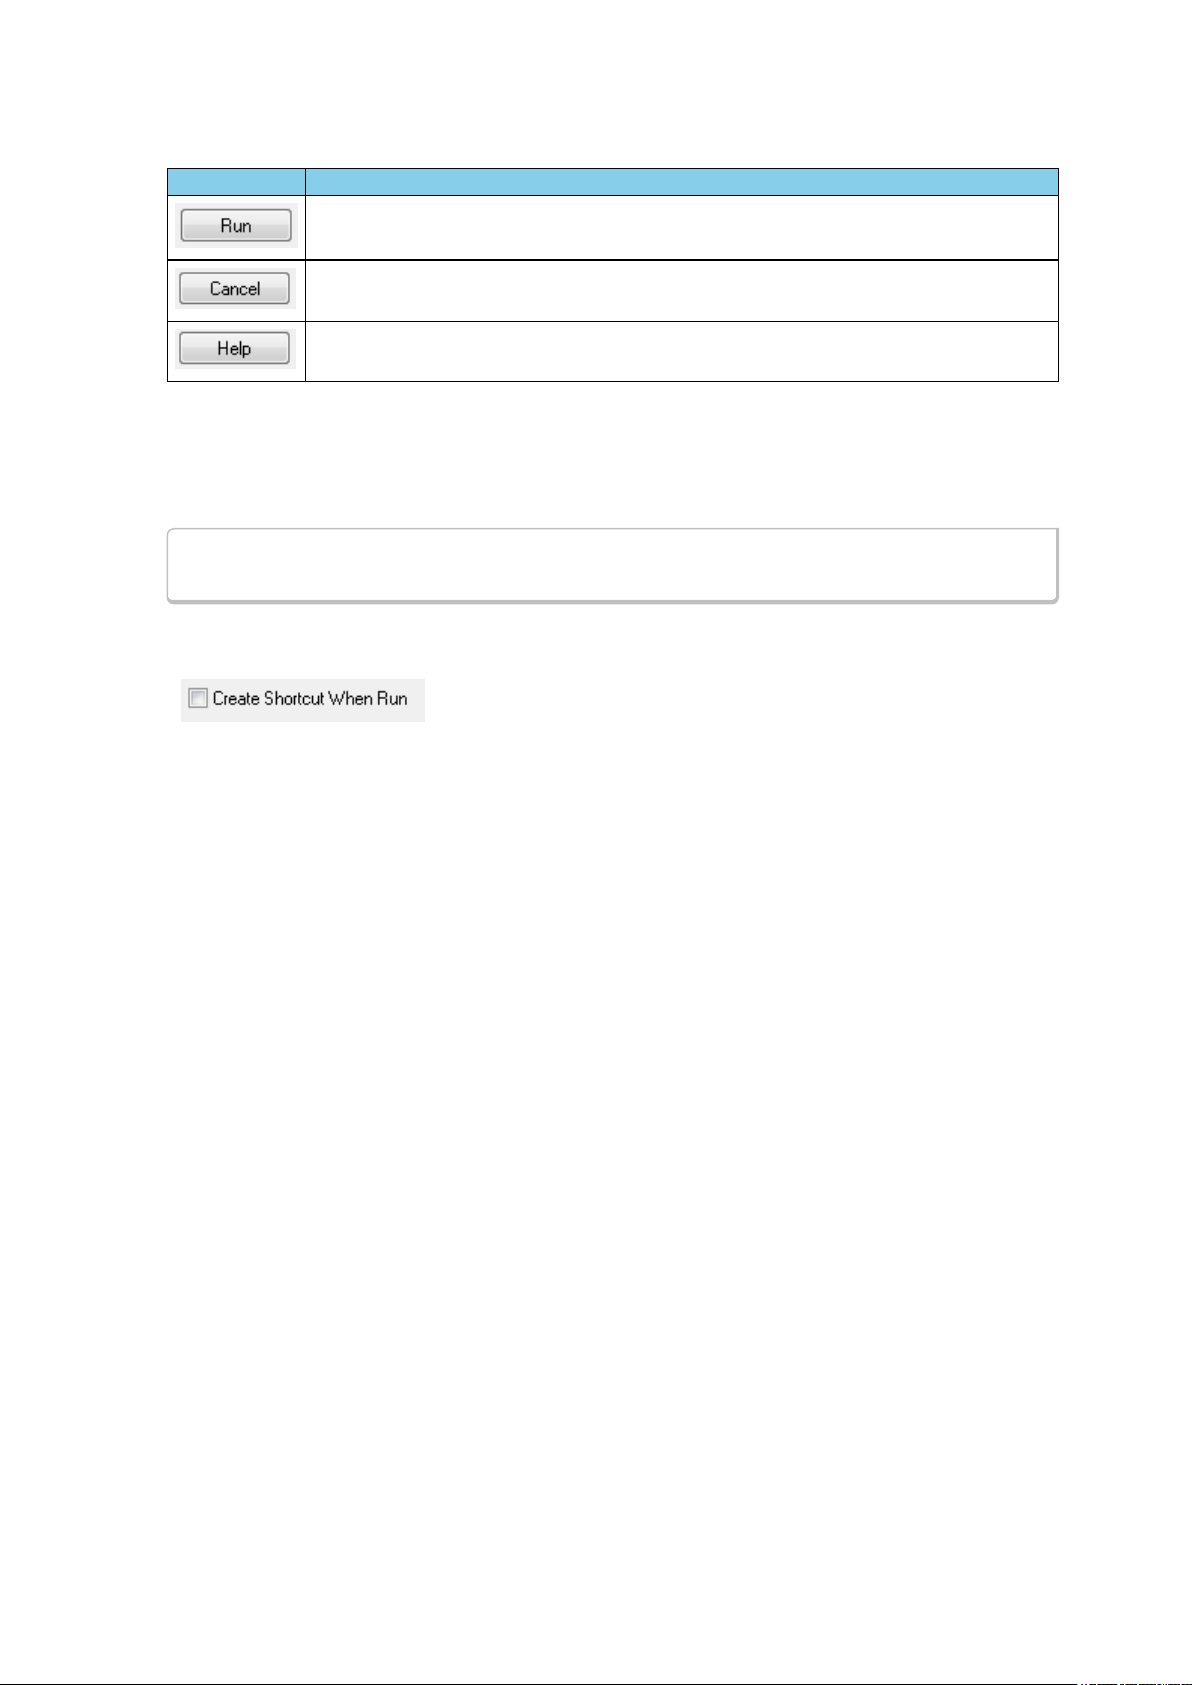
Select Data Capture Method dialog buttons
Button Description
Becomes active when a capture method is selected. Starts the selected capture
method.
Closes the dialog and exits the user back to the computer desktop.
Opens Frontline Help. Keyboard shortcut: F1.
3. Expand the folder and select the data capture method that matches your configuration.
4. Click on the Run button and the Frontline Control Window will open configured to the selected
capture method.
Note: If you don't need to identify a capture method, then click the Run button to start the
analyzer.
Creating a Shortcut
A checkbox labeled Create Shortcut When Run is located near the
bottom of the dialog. This box is un-checked by default. Select this
checkbox, and the system creates a shortcut for the selected method, and
places it in the "Frontline ComProbe Protocol Analysis System <version#>"
desktop folder and in the start menu when you click the Run button. This function allows you the option to
create a shortcut icon that can be placed on the desktop. In the future, simply double-click the shortcut to
start the analyzer in the associated protocol.
Supporting Documentation
The Frontline <version #>directory contains supporting documentation for development (Automation,
DecoderScript™, application notes), user documentation (Quick Start Guides and the Frontline User Manual),
and maintenance tools.
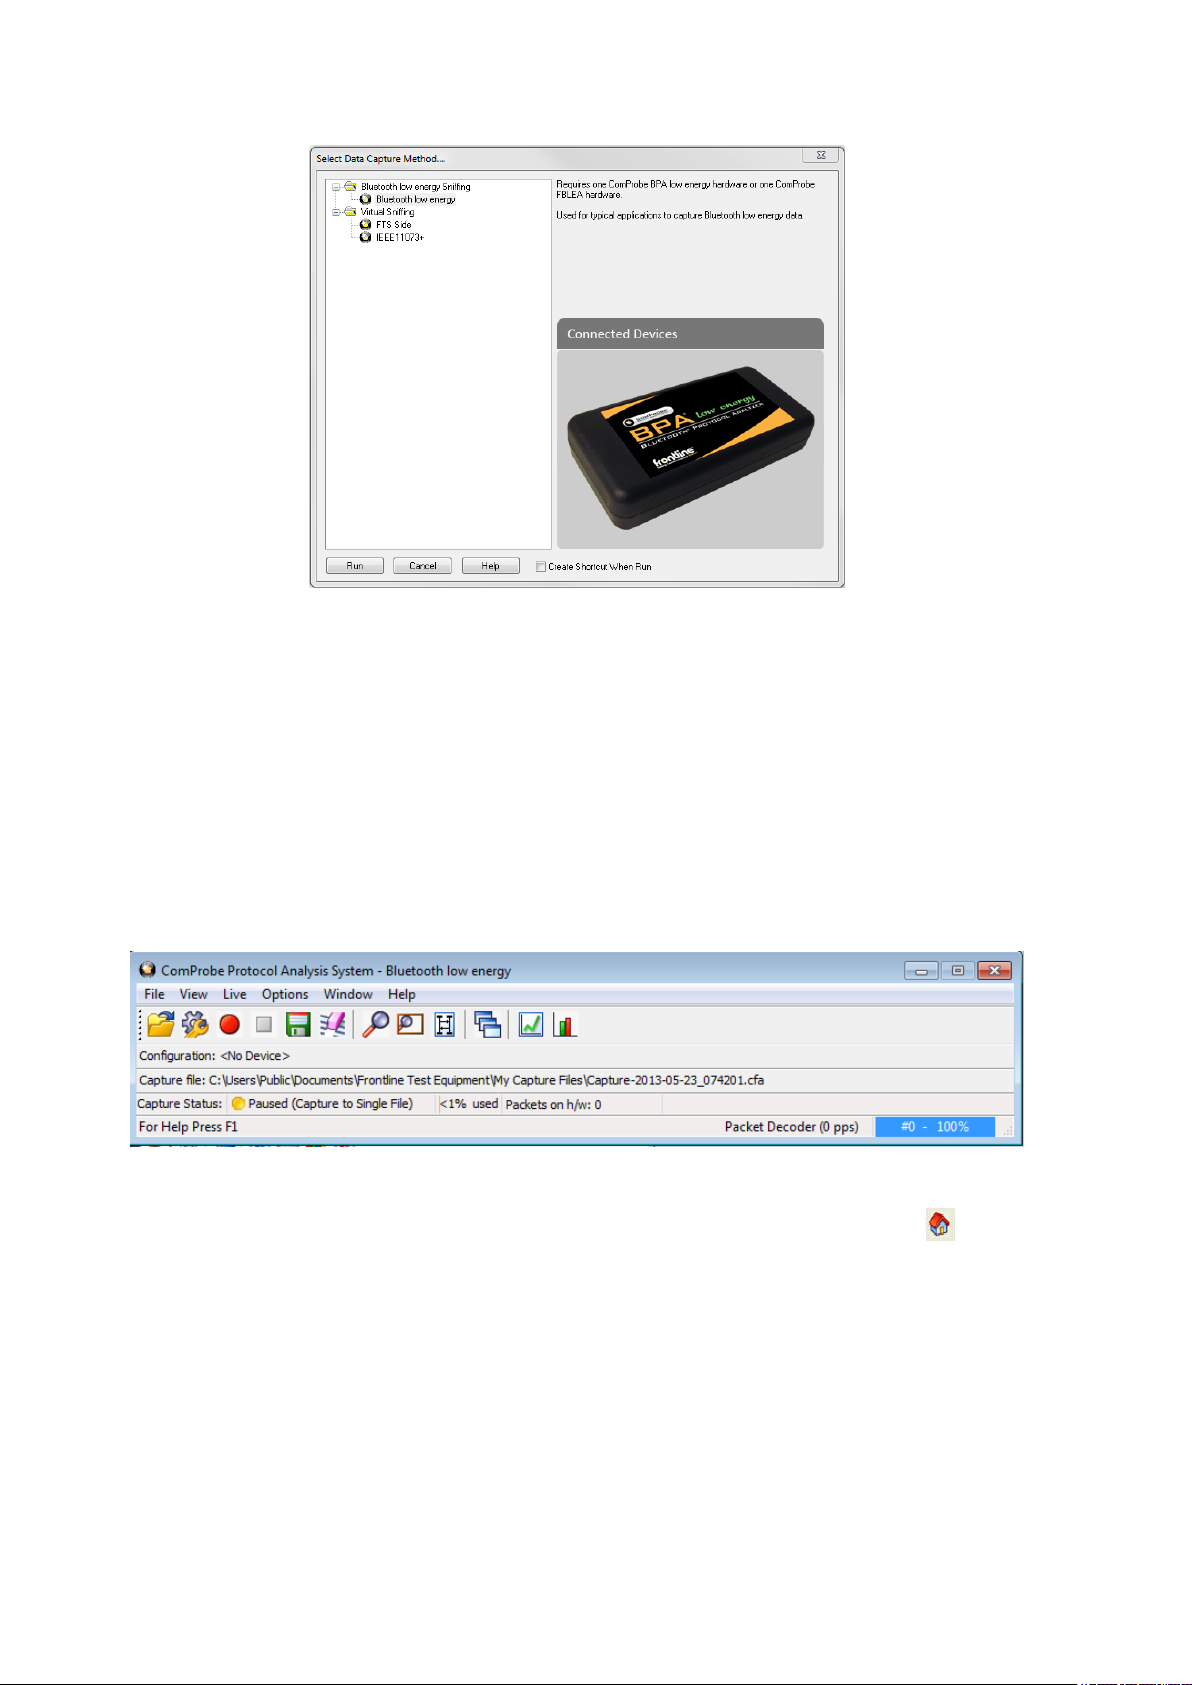
2.2.2 Frontline®BPA low energy Data Capture Methods
The Frontline Protocol Analysis System has different data capture methods to accommodate various
applications.
Frontline BPA low energy Hardware & Software User Manual 5
TELEDYNE LECROY Chapter 2 Getting Started
Figure 2.4 - BPA low energy Select Data Capture Method
l Bluetooth low energy
o
This method requires one Frontline BPA low energy hardware or one Frontline FBLEA hardware.
o
Used for typical applications to capture Bluetooth low energy data.
2.3 Control Window
The analyzer displays information in multiple windows, with each window presenting a different type of
information. The Control window opens when the Run button is clicked in the Select Data Capture
Method window. The Control window provides access to each Frontline analyzer functions and settings as
well as a brief overview of the data in the capture file. Each icon on the toolbar represents a different data
analysis function.
Figure 2.5 - Control Window
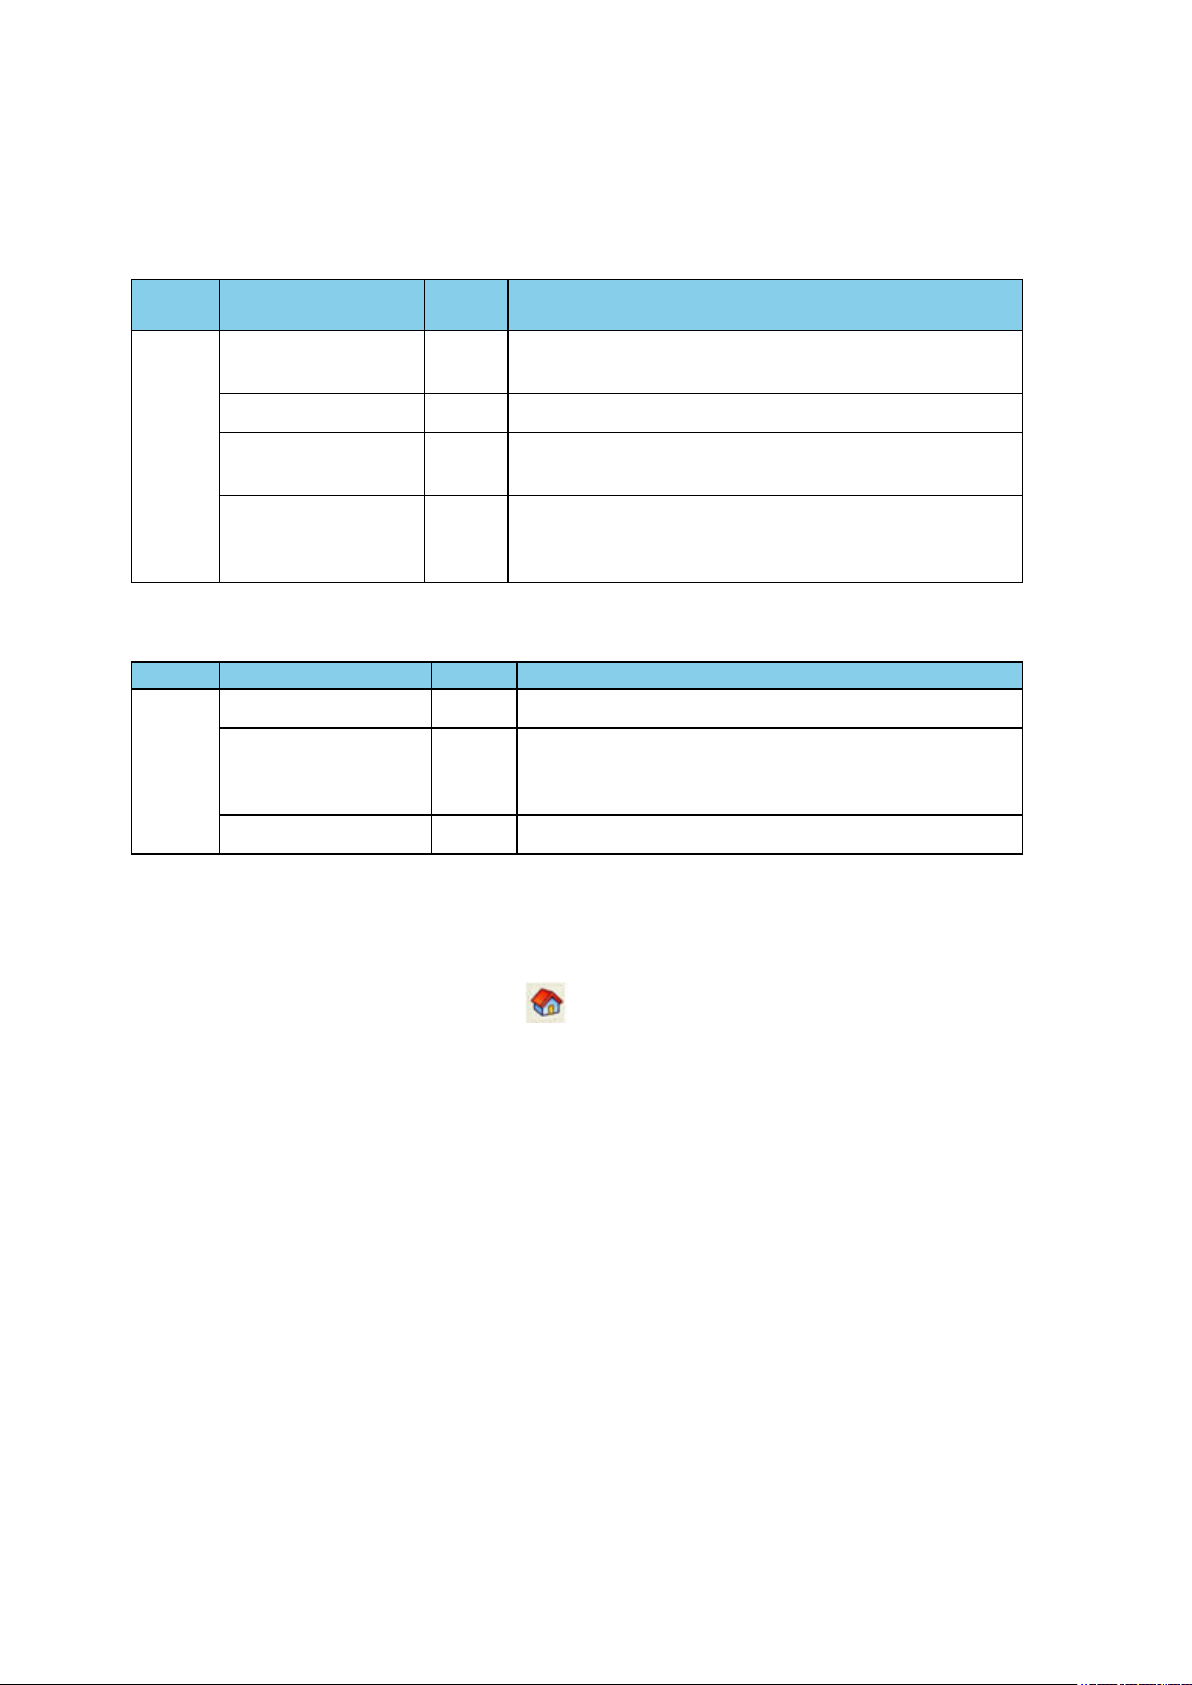
Because the Control window can get lost behind other windows, every window has a Home icon that
brings the Control window back to the front. Just click on the Home icon to restore the Control window.
When running the Capture File Viewer, the Control window toolbar and menus contain only those
selections needed to open a capture file and display the About box. Once a capture file is opened, the
analyzer limits Control window functions to those that are useful for analyzing data contained in the current
file. Because you cannot capture data while using Capture File Viewer, data capture functions are
unavailable. For example, when viewing Ethernet data, the Signal Display is not available. The title bar of the
Control window displays the name of the currently open file. The status line (below the toolbar) shows the
configuration settings that were in use when the capture file was created.
6 Frontline BPA low energy Hardware & Software User Manual
Chapter 2 Getting Started TELEDYNE LECROY
2.3.1 Control Window Toolbar
Toolbar icon displays vary according to operating mode and/or data displayed. Available icons appear in color,
while unavailable icons are not visible. Grayed-out icons are available for the Frontline hardware and software
configuration in use but are not active until certain operating conditions occur. All toolbar icons have
corresponding menu bar items or options.
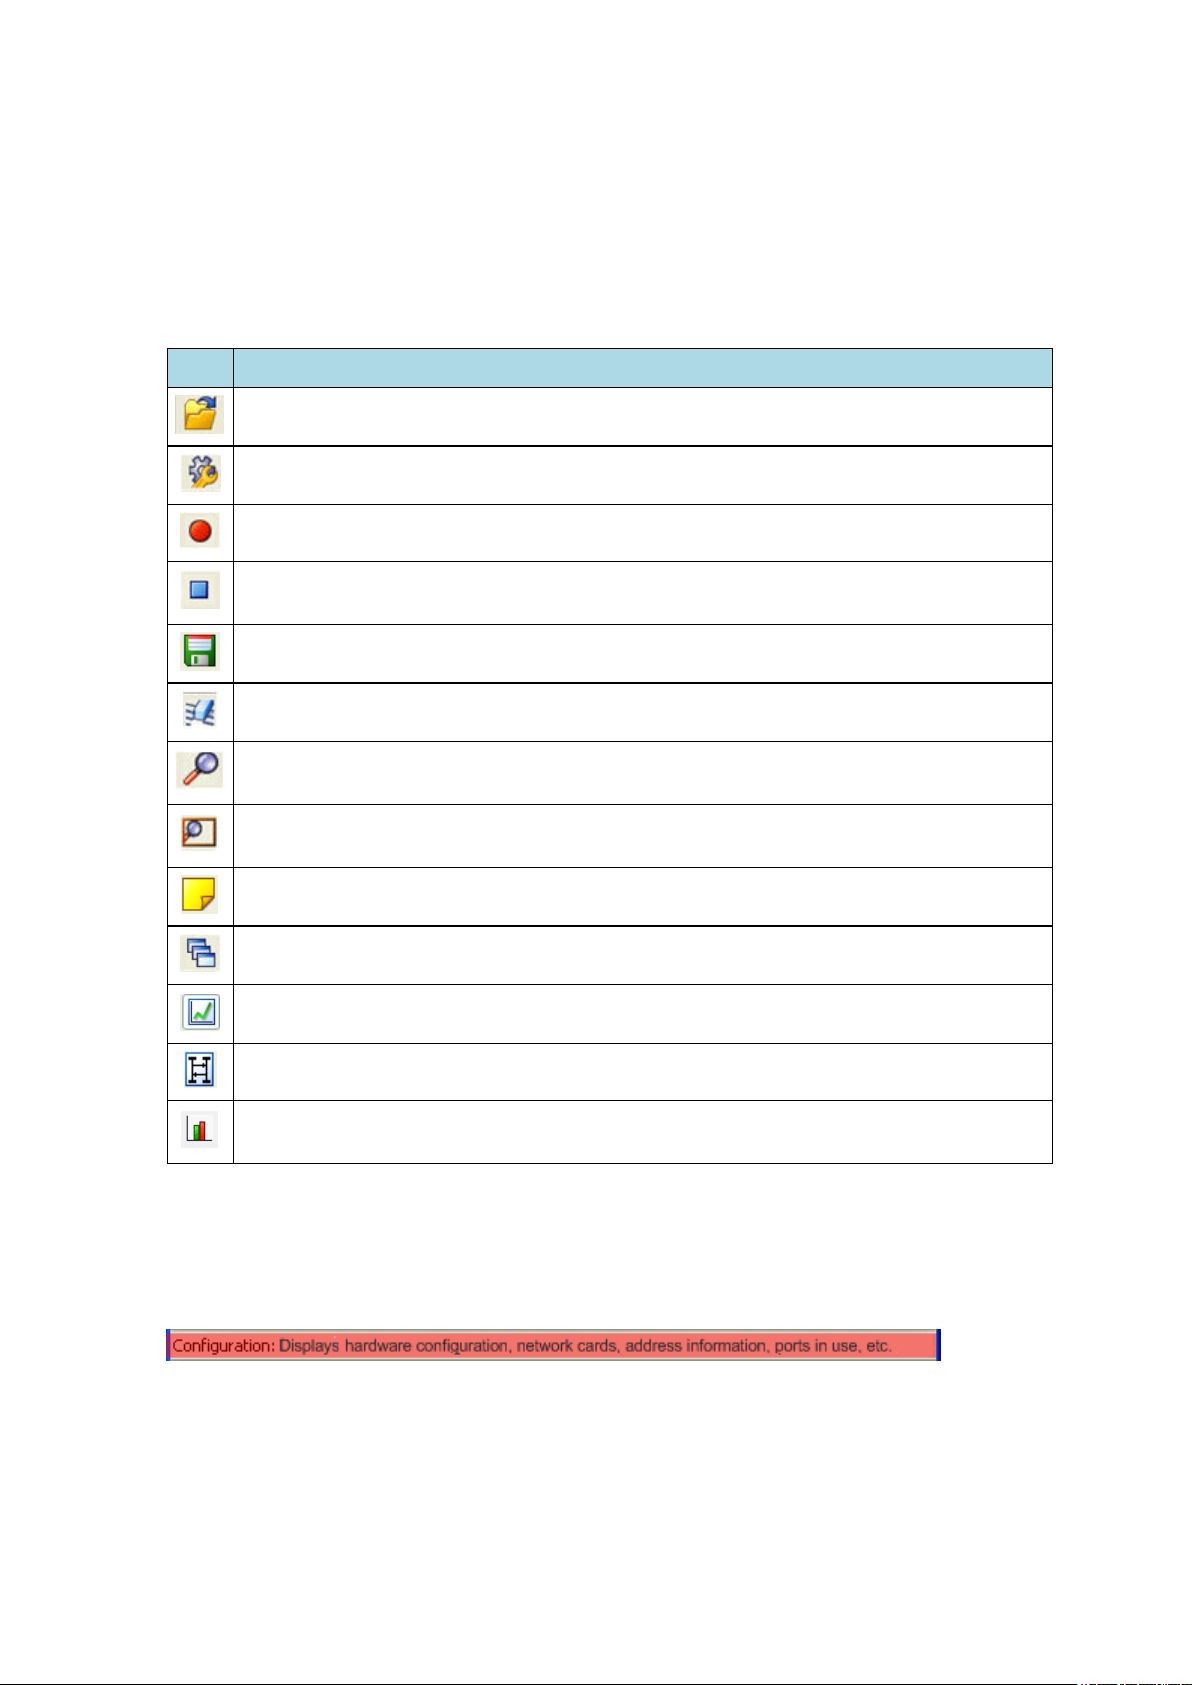
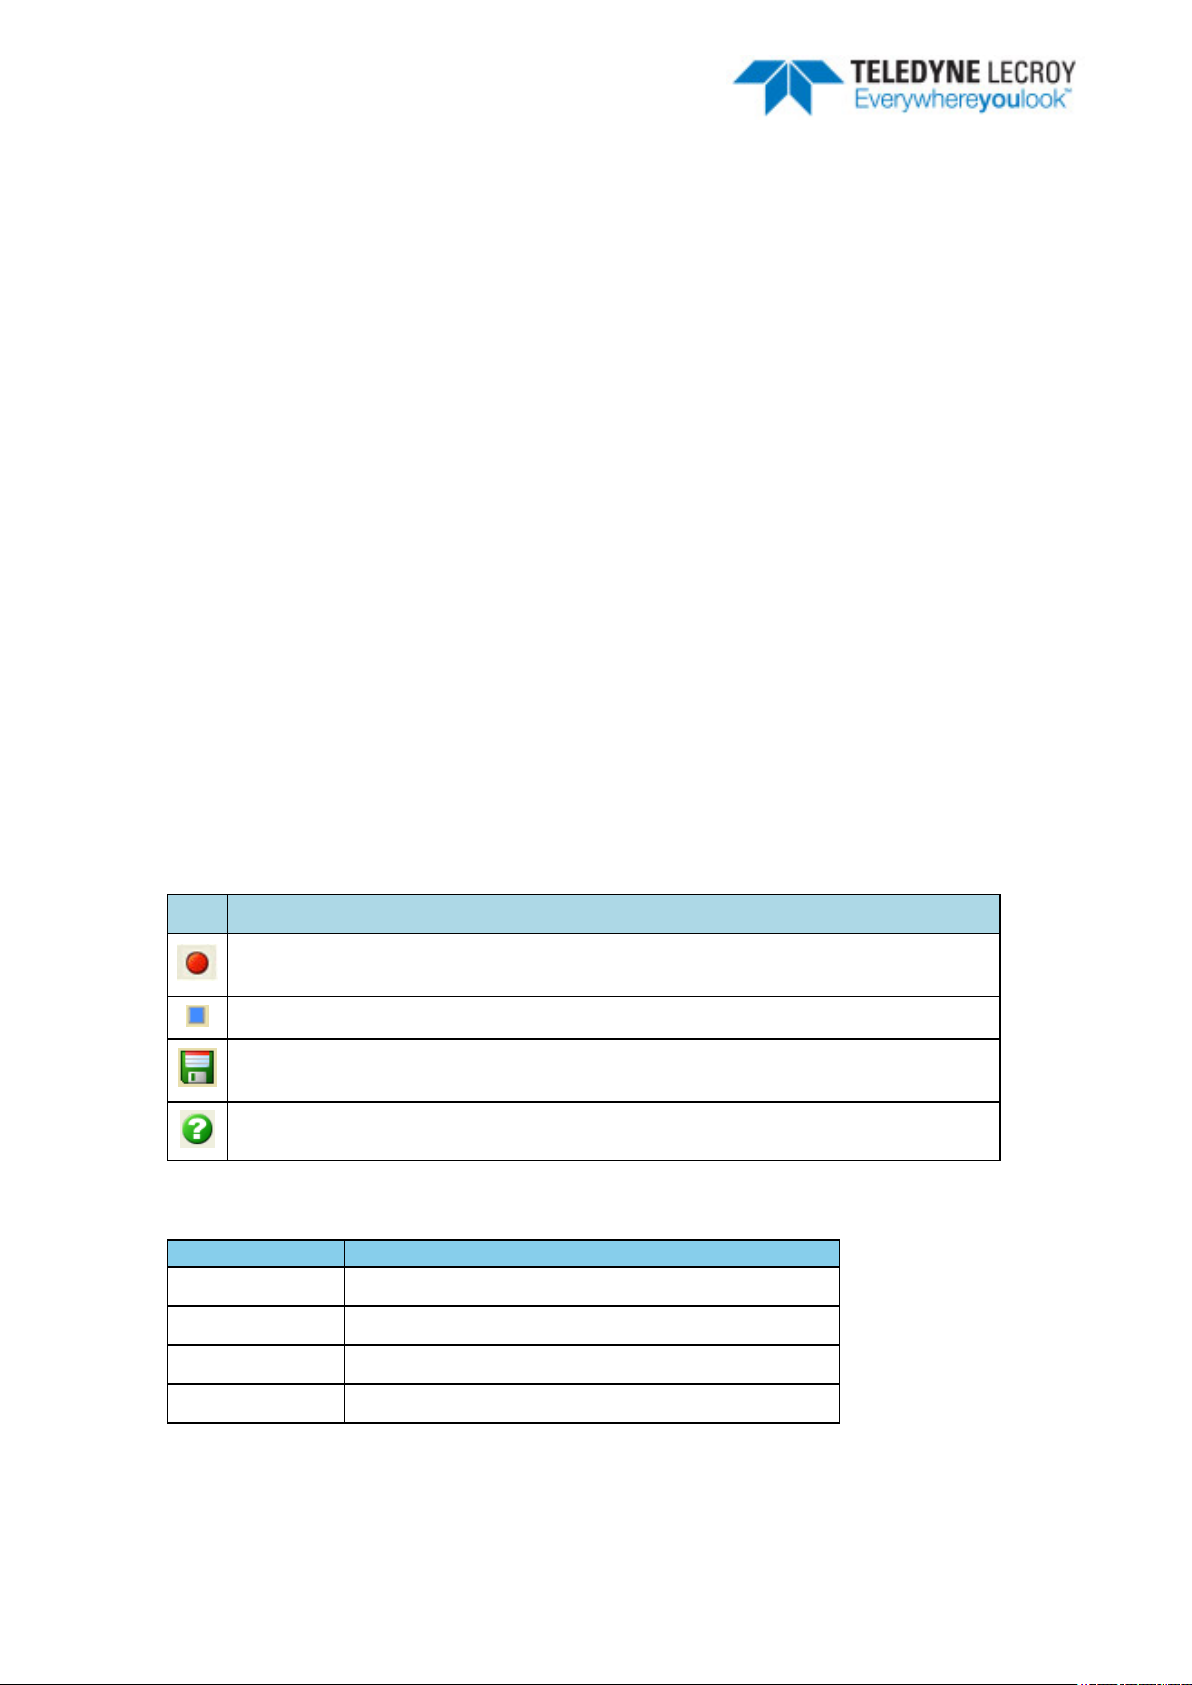
Table 2.1 - Control Window Toolbar Icons
Icon Description
Open File - Opens a capture file.
I/O Settings - Opens settings
Start Capture - Begins data capture to disk
Stop Capture - Available after data capture has started. Click to stop data capture. Data can
be reviewed and saved, but no new data can be captured.
Save - Saves the capture file.
Clear - Clears or saves the capture file.
Event Display - (framed data only) Opens a Event Display, with the currently selected bytes
highlighted.
Frame Display - (framed data only) Opens a Frame Display, with the frame of the currently
selected bytes highlighted.
Notes - Opens the Notes dialog.
Cascade - Arranges windows in a cascaded display.
Low energy - Opens the low energy Timeline dialog.
MSC Chart - Opens the Message Sequence Chart
Bluetooth low energy Packet Error Rate Statistics - Opens the Packet Error Rate Statistics
window.
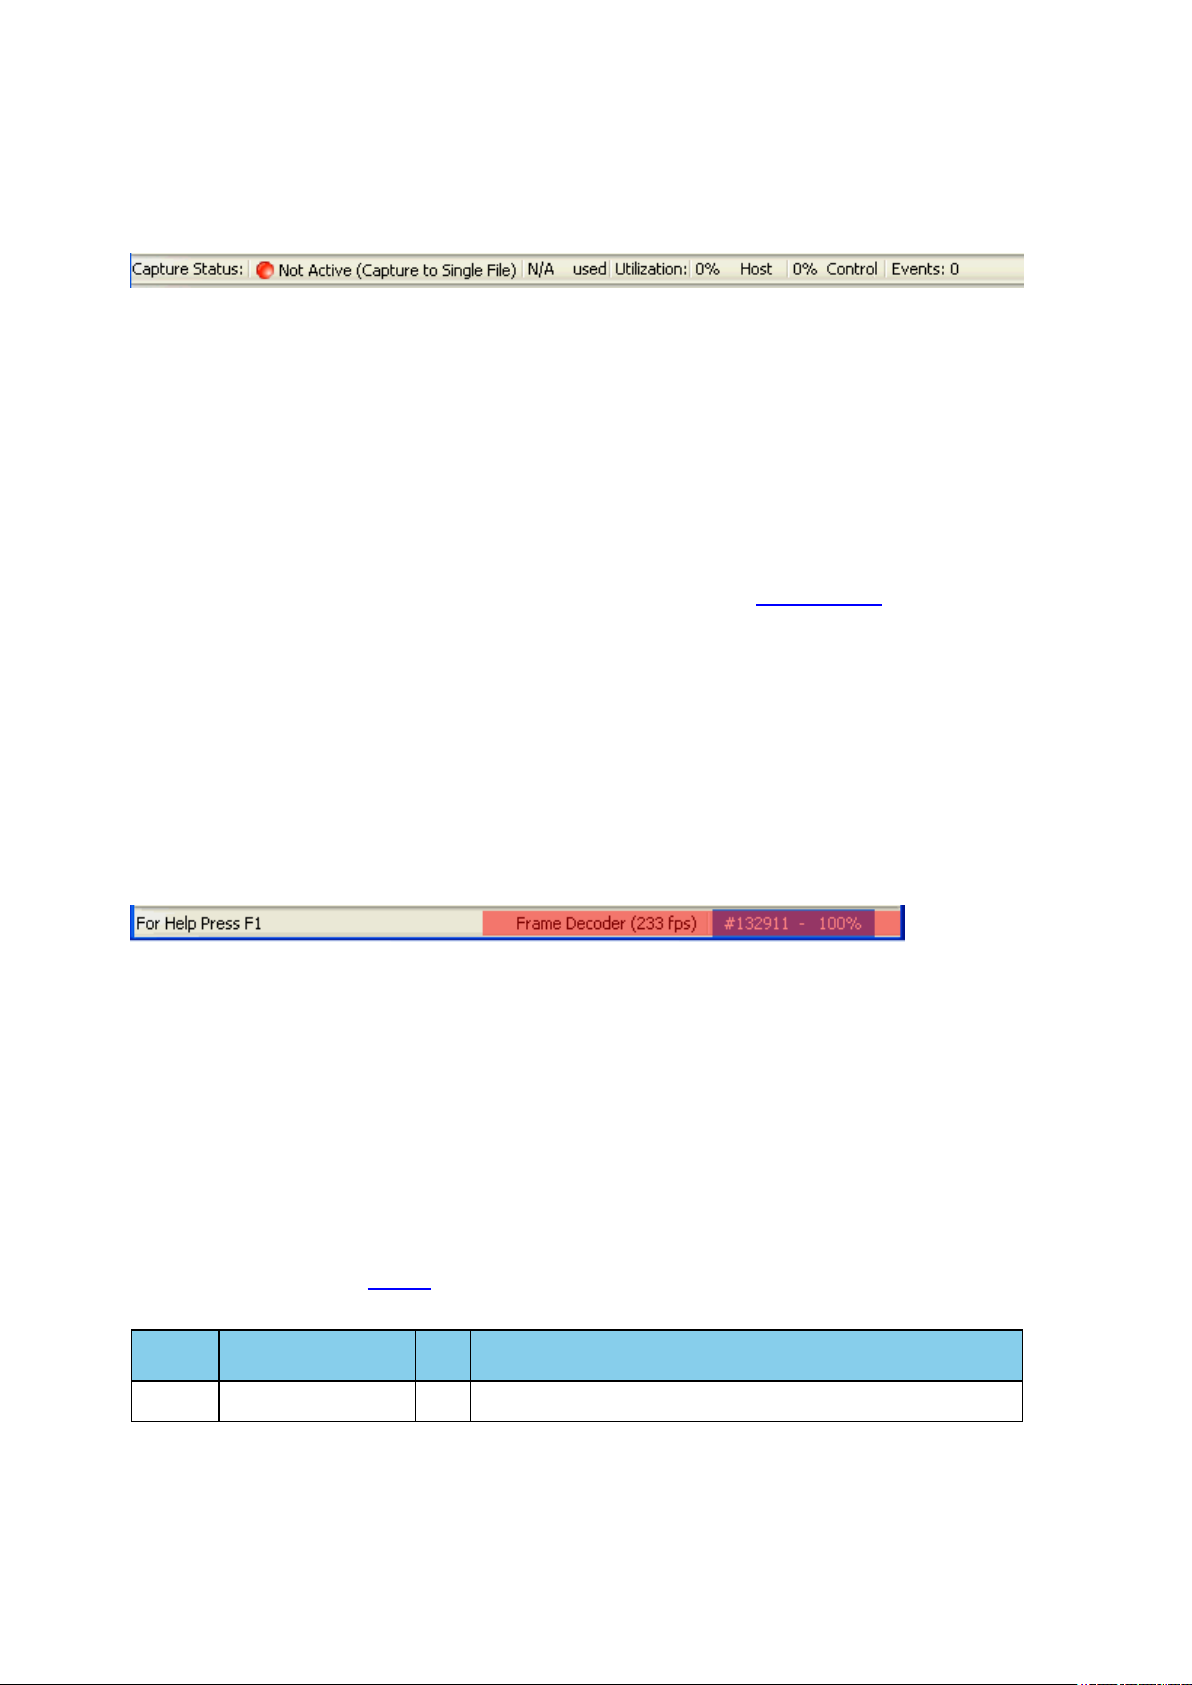
2.3.2 Configuration Information on the Control Window
The Configuration bar (just below the toolbar) displays the hardware configuration and may include I/O
settings. It also provides such things as name of the network card, address information, ports in use, etc.
Frontline BPA low energy Hardware & Software User Manual 7
TELEDYNE LECROY Chapter 2 Getting Started
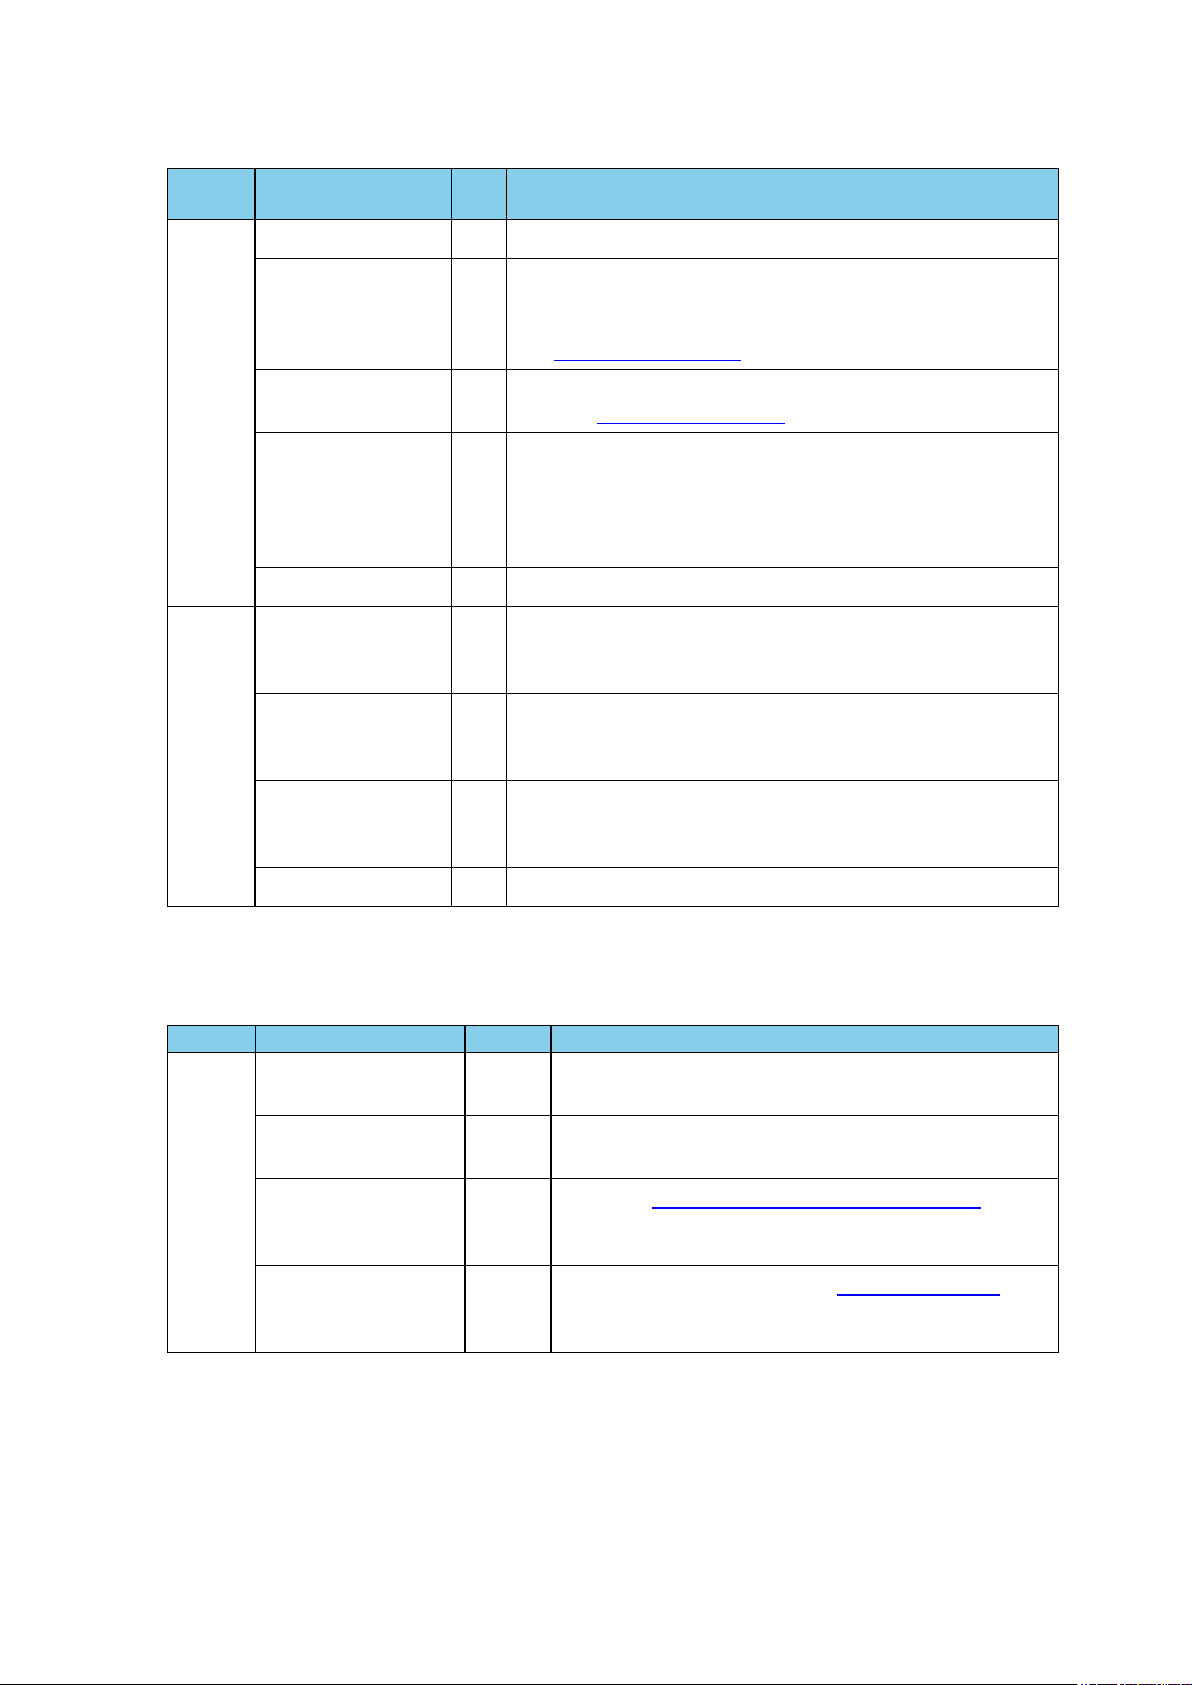
2.3.3 Status Information on the Control Window
The Status bar located just below the Configuration bar on the Control window provides a quick look at
current activity in the analyzer.
l Capture Status displays Not Active, Paused or Running and refers to the state of data capture.
o
Not Active means that the analyzer is not currently capturing data.
o
Paused means that data capture has been suspended.
o
Running means that the analyzer is actively capturing data.
l
% Used
The next item shows how much of the buffer or capture file has been filled. For example, if you are
capturing to disk and have specified a 200 Kb capture file, the bar graph tells you how much of the
capture file has been used. When the graph reaches 100%, capture either stops or the file begins to
overwrite the oldest data, depending on the choices you made in the System Settings.
l
Utilization/Events
The second half of the status bar gives the current utilization and total number of events seen on the
network. This is the total number of events monitored, not the total number of events captured. The
analyzer is always monitoring the circuit, even when data is not actively being captured. These graphs
allow you to keep an eye on what is happening on the circuit, without requiring you to capture data.
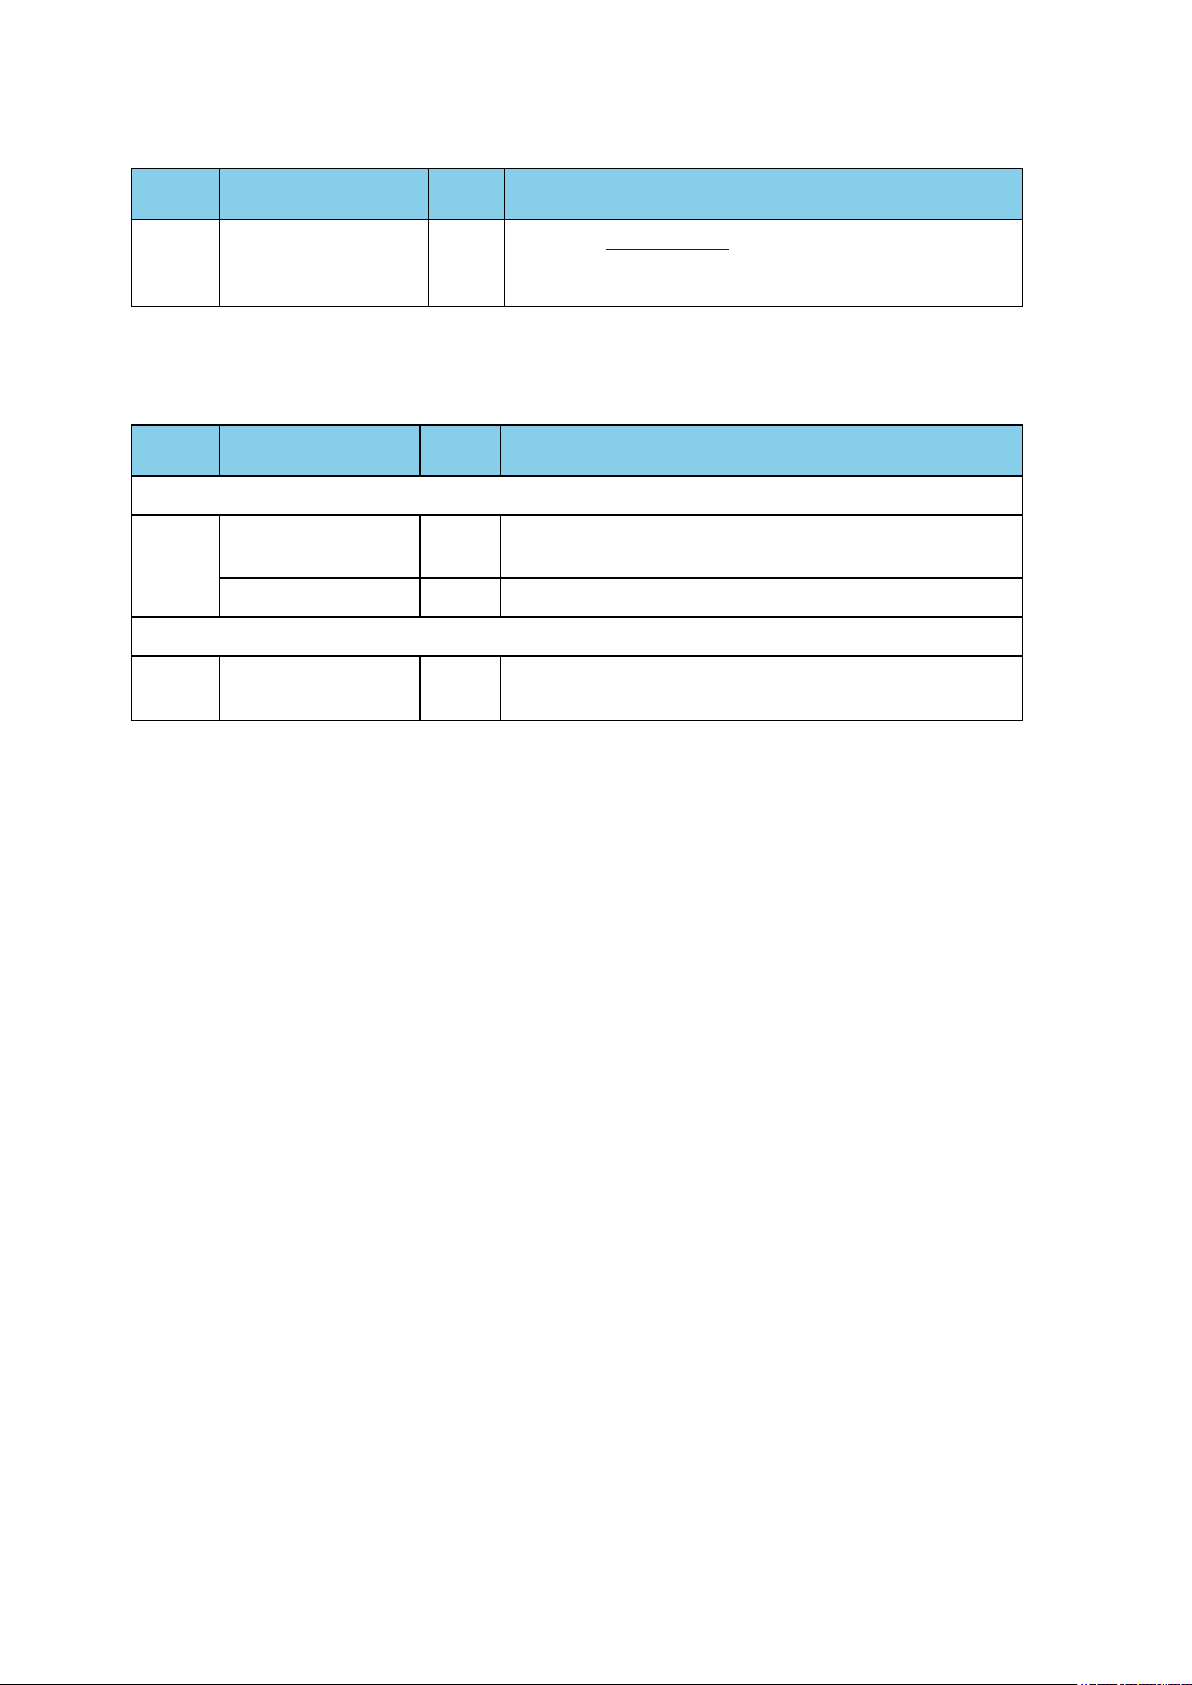
2.3.4 Frame Information on the Control Window
Frame Decoder information is located just below the Status bar on the Control window. It displays two pieces
of information.
l Frame Decoder (233 fps) displays the number of frames per second being decoded. You can toggle this
display on/off with Ctrl-D, but it is available only during a live capture.
l #132911 displays the total frames decoded.
l 100% displays the percentage of buffer space used.
2.3.5 Control Window Menus
The menus appearing on the Control window vary depending on whether the data is being captured live or
whether you are looking at a .cfa file. The following tables describe each menu.
Table 2.2 - Control Window File Menu Selections
Mode Selection
Live
Close
Hot
Key
Closes Live mode.
Description
8 Frontline BPA low energy Hardware & Software User Manual
Chapter 2 Getting Started TELEDYNE LECROY
Table 2.2 - Control Window File Menu Selections (continued)
Mode Selection
Capture
File
Go Live
Reframe
Hot
Key
Returns to Live mode
If you need to change the protocol stack used to interpret a
capture file and the framing is different in the new stack, you
need to reframe in order for the protocol decode to be correct.
Reframing on page 36
See
Description
Live &
Capture
File
Unframe
Recreate
Companion File
Reload Decoders
Open Capture File
Save
Exit ComProbe
Protocol Analysis
System
Recent capture files A list of recently opened capture files will appear.
Removes start-of-frame and end-of-frame markers from your
data. See
This option is available when you are working with decoders. If
you change a decoder while working with data, you can
recreate the ".frm file", the companion file to the ".cfa file".
Recreating the ".frm file" helps ensure that the decoders will
work properly.
The plug-ins are reset and received frames are decoded again.
Ctrl--OOpens a Windows Open file dialog. at the default location
"...\Public Documents\Frontline Test Equipment\My Capture
Files\". Capture files have a .cfa extension.
Ctrl-SSaves the current capture or capture file. Opens a Windows
Save As dialog at the default location "...\Public
Documents\Frontline Test Equipment\My Capture Files\".
Shuts down the ComProbe Protocol Analysis System and all
open system windows.
Unframing on page 36
The View menu selections will vary depending on the Frontline analyzer in use.
Table 2.3 - Control Window View Menu Selections
Mode Selection Hot key Description
Live &
Capture
File
Event Display
Frame Display
Bluetooth low
energy Timeline
Bluetooth low
energy Packet Error
Rate Statistics
CtrlShift-E
CtrlShift-M
Opens the Event Display window for analyzing byte level
data.
Opens the Frame Display window for analyzing protocol
level data
Opens the
analyzing protocol level data in a packet chronological
format and in packet throughput graph.
Opens the
show a dynamic graphical representation of the error rate
for each low energy channel.
Bluetooth low energy Timeline window
Bluetooth
low energy
PER Stats window
for
to
Frontline BPA low energy Hardware & Software User Manual 9
TELEDYNE LECROY Chapter 2 Getting Started
Table 2.4 - Control Window Edit Menu Selections
Mode Selection
Capture
File
The Live menu selections will vary depending on the Frontline analyzer in use.
Mode Selection
The following two rows apply to all Frontline products except Set in Target.
Notes
Table 2.5 - Control Window Live Menu Selections
Hot-
key
CtrlShiftO
Hot-
Key
Description
Opens the
comments to a capture file.
Notes window
Description
that allows the user to add
Live
The following rows apply to all Frontline products
Live Clear Shift-
Start Capture
Stop Capture
Shift-F5Begins data capture from the configured wireless devices.
F10 Stops data capture from the configured wireless devices.
Clears or saves the capture file.
F10
10 Frontline BPA low energy Hardware & Software User Manual

Chapter 2 Getting Started TELEDYNE LECROY
Table 2.5 - Control Window Live Menu Selections (continued)
Mode Selection
Live &
Capture
File
Hardware Settings
I/O Settings
Hot-
Key
Description
0 - Classic
1 - Bluetooth low energy
0 - Classic
1 - Bluetooth low energy
System Settings
Directories...
Check for New
Releases at Startup
Side Names...
Protocol Stack...
Set Initial Decoder
Parameters...
AltEnter
Opens the System Settings dialog for configuring capture
files.
Opens the
the default file locations.
When this selection is enabled, the program automatically
checks for the latest Frontline protocol analyzer software
releases.
Opens the
names of the slave and master wireless devices.
Opens the
protocol stack they want the analyzer to use when
decoding frames.
Opens the
may be times when the context for decoding a frame is
missing. For example, if the analyzer captured a response
frame, but did not capture the command frame, then the
decode for the response may be incomplete. The Set Initial
Decoder Parameters dialog provides a means to supply the
context for any frame. The system allows the user to define
any number of parameters and save them in templates for
later use.Each entry in the window takes effect from the
beginning of the capture onward or until redefined in the Set
Subsequent Decoder Parameters dialog. This selection is
not present if no decoder is loaded that supports this
feature.
File Locations dialog
Side Names dialog
Select a Stack dialog
Set Initial Decoder Parameters window
where the user can change
used to customize the
where the user defines the
. There
Set Subsequent
Decoder
Parameters...
Automatically
Request Missing
Decoder
Information
Enable/Disable
Audio Expert
System
Frontline BPA low energy Hardware & Software User Manual 11
Opens the
where the user can override an existing parameter at any
frame in the capture. Each entry takes effect from the
specified frame onward or until redefined in this dialog on a
later frame. This selection is not present if no decoder is
loaded that supports this feature.
When checked, this selection opens a dialog that asking for
missing frame information. When unchecked, the analyzer
decodes each frame until it cannot go further and it stops
decoding. This selection is not present if no decoder is loaded
that supports this feature.
When enabled, the
wise it is not available. Only available when an Audio
Expert System licensed device is connected.
Set Subsequent Decoder Parameters dialog
Audio Expert System
is active, other
TELEDYNE LECROY Chapter 2 Getting Started
The Windows menu selection applies only to the Control window and open analysis windows: Frame
Display, Event Display, Message Sequence Chart, Bluetooth Timeline, Bluetooth low energy
Timeline, and Coexistence View. All other windows, such as the datasource, are not affected by these
selections.
Table 2.6 - Control Window Windows Menu Selections
Mode Selection
Live &
Capture
File
Cascade
Close All Views
HotKey
Ctrl-W Arranges open analysis windows in a cascaded view with
window captions visible.
Closes Open analysis windows.
Description
Minimize Control
Minimizes All
Frame Display
Event Display
Mode Selection Hot-Key Description
Live &
Capture
File
Help Topics
About Frontline
Protocol Analysis
System
Support on the Web
and
Table 2.7 - Control Window Help Menu Selections
When checked, minimizing the Control window also
minimizes all open analysis windows.
When these windows are open the menu will display these
selections. Clicking on the selection will bring that window
to the front.
Opens the Frontline Help window.
Provides a pop-up showing the version and release
information, Frontline contact information, and copyright
information.
Opens a browser to
fte.com
technical support page.
2.3.6 Minimizing Windows
Windows can be minimized individually or as a group when the Control window is minimized. To minimize
windows as a group:
1.
Go to the Window menu on the Control window.
2. Select Minimize Control Minimizes All. The analyzer puts a check next to the menu item,
indicating that when the Control window is minimized, all windows are minimized.
3. Select the menu item again to deactivate this feature.
4. The windows minimize to the top of the operating system Task Bar.
12 Frontline BPA low energy Hardware & Software User Manual
Chapter 3 Configuration Settings
In this section the Frontline software is used to configure an analyzer for capturing data .
3.1 BPAle I/O Settings - Datasource
3.1.1 BPA Low Energy datasource Toolbar/Menu
The datasource dialog toolbar and menu options are listed below.
Table 3.1 - BPA Low Energy Datasource Toolbar
Icon Description
Start Sniffing button to begin sniffing. All settings are saved automatically when you
start sniffing.
Pause button to stop sniffing.
Save button to save the configuration if you made changes but did not begin sniffing. All
settings are saved automatically when you start sniffing.
Help button opens the help file.
Table 3.2 - BPA Low Energy datasource Menu
Menu Item Description
File
Save and Exit options, self explanatory.
View
BPA Low Energy
Help
Frontline BPA low energy Hardware & Software User Manual 13
Hides or displays the toolbar
Start Sniffing, Stop Sniffing
Opens ComProbe
Help
, and
About BPA Low Energy
.
TELEDYNE LECROY Chapter 3 Configuration Settings
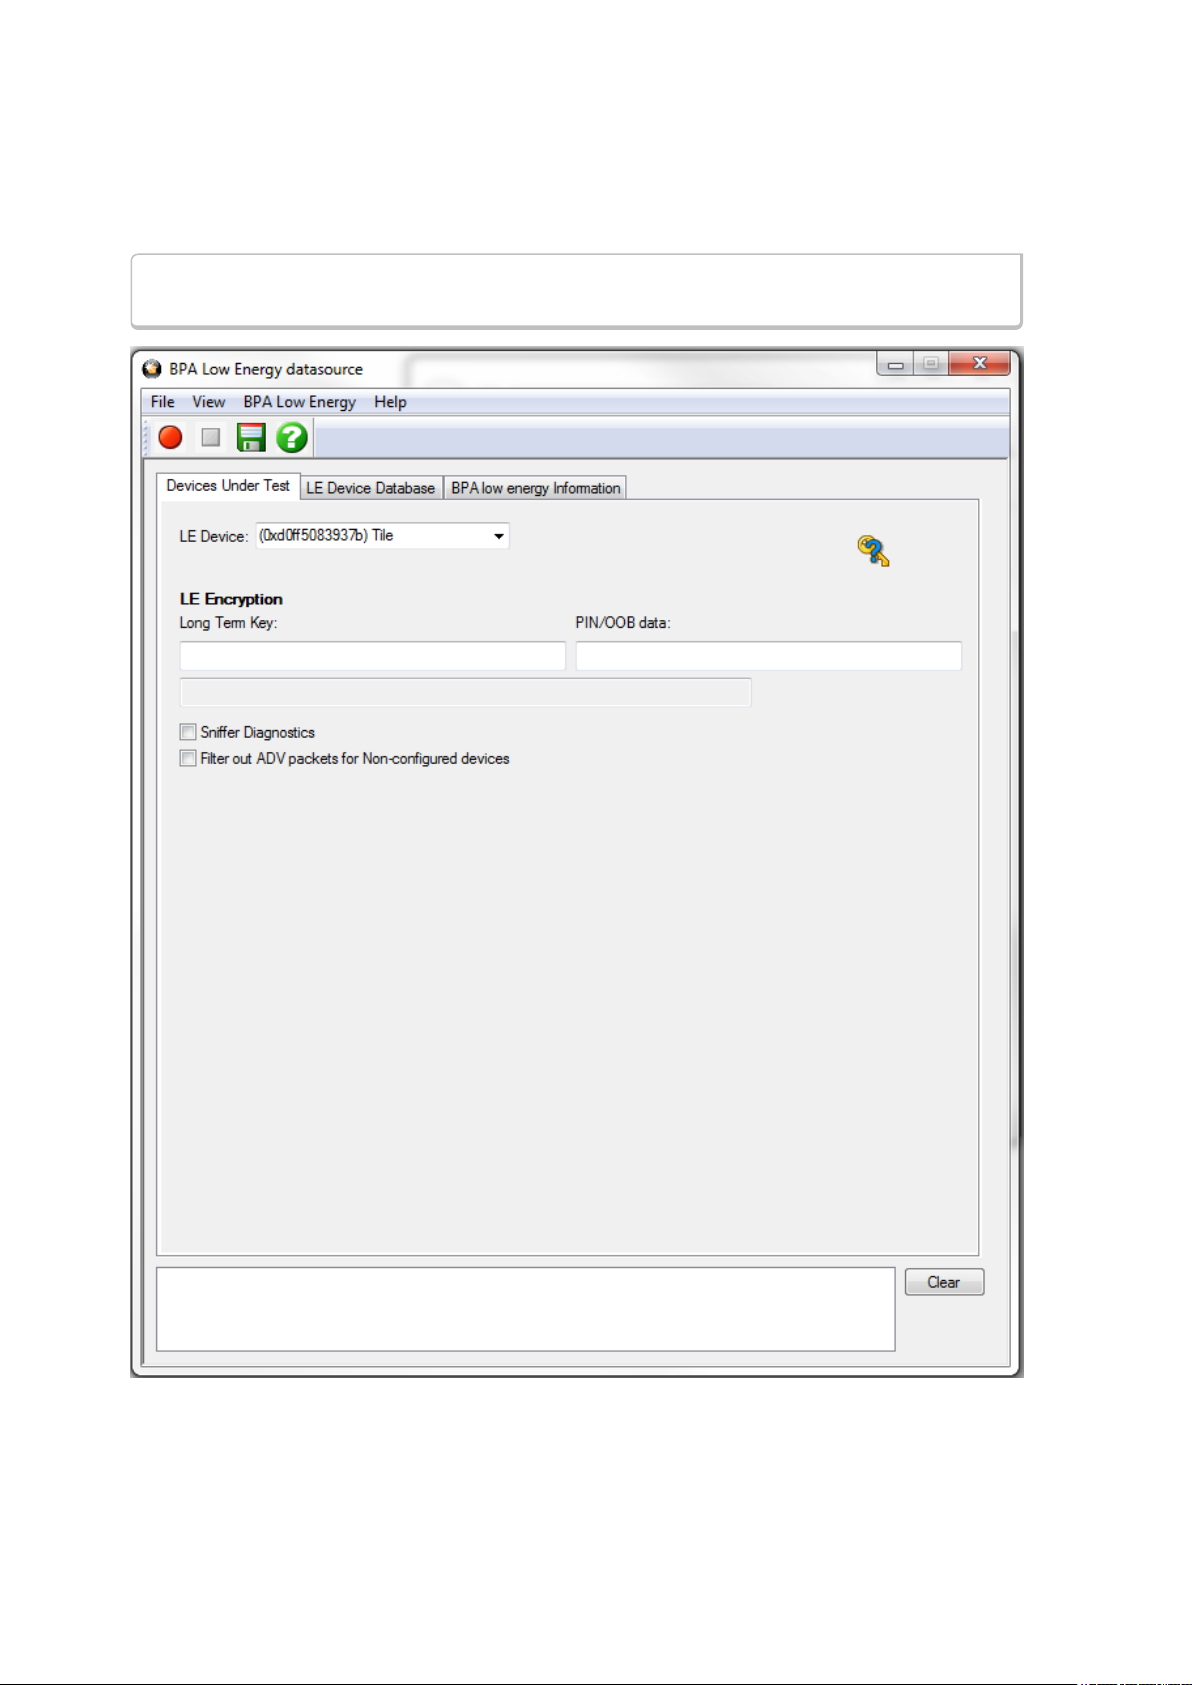
3.1.2 BPA low energy Devices Under Test
You can select the ComProbe BPA low energy analyzer for sniffing Bluetooth low energy communications on
available devices.
Note: Frontline BPA LE supports Bluetooth low energy features through Bluetooth 4.2,
except optional extended packet length.
Figure 3.1 - BPA Low Energy datasource Devices Under Test Tab
The default value in the LE Device drop down is Sync with First Master. Devices in the LE Device
Database may be selected. Once a device is selected or if any other change is made to the Devices Under
14 Frontline BPA low energy Hardware & Software User Manual
Chapter 3 Configuration Settings TELEDYNE LECROY
Test tab, the toolbar save button becomes available. Clicking on this button will save the current Devices
Under Test settings that will be available the next time you open ComProbe BPA low energy analysis.
To begin sniffing Bluetooth low energy simply click the red Start button on the datasource toolbar.
Specifying the LE Device Address
You may specify the LE device you are testing by typing in or choosing its address (BD_ADDR). You can type it
directly into the drop down, or choose it from the existing previous values list in the drop down.
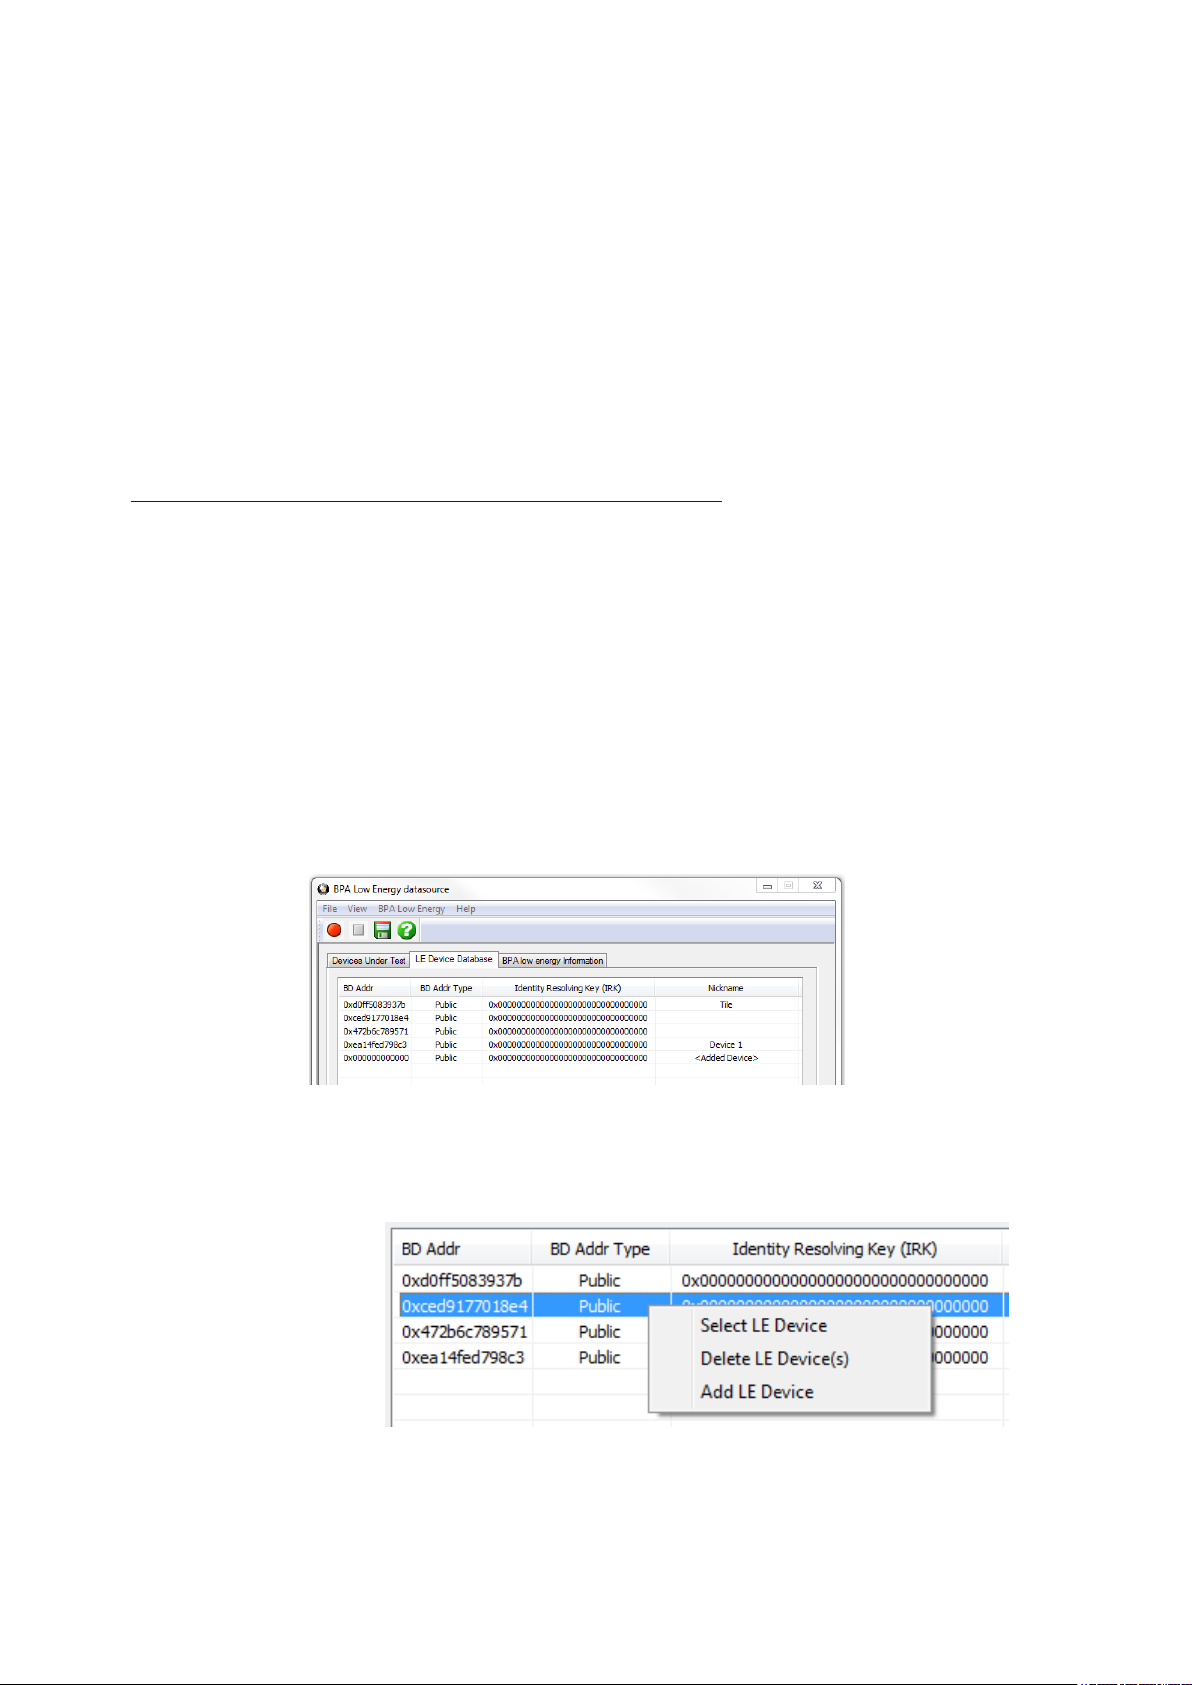
Alternatively you can open the LE Device Database tab, right-click on any device in the list, and click on
Select LE Device in the pop-up menu. The selected device's BD_Addr and Nickname will appear in the
LE Device field.
To enter the device manually type the address - 12 digit hex number (6 octets). The "0x" is automatically
typed in the drop down control.
Note: If one device changes its address and the other device does not, then select the
device address that does not change for the LE Device Address field.
Once you have the devices address identified, the next step is to identify the Encryption.
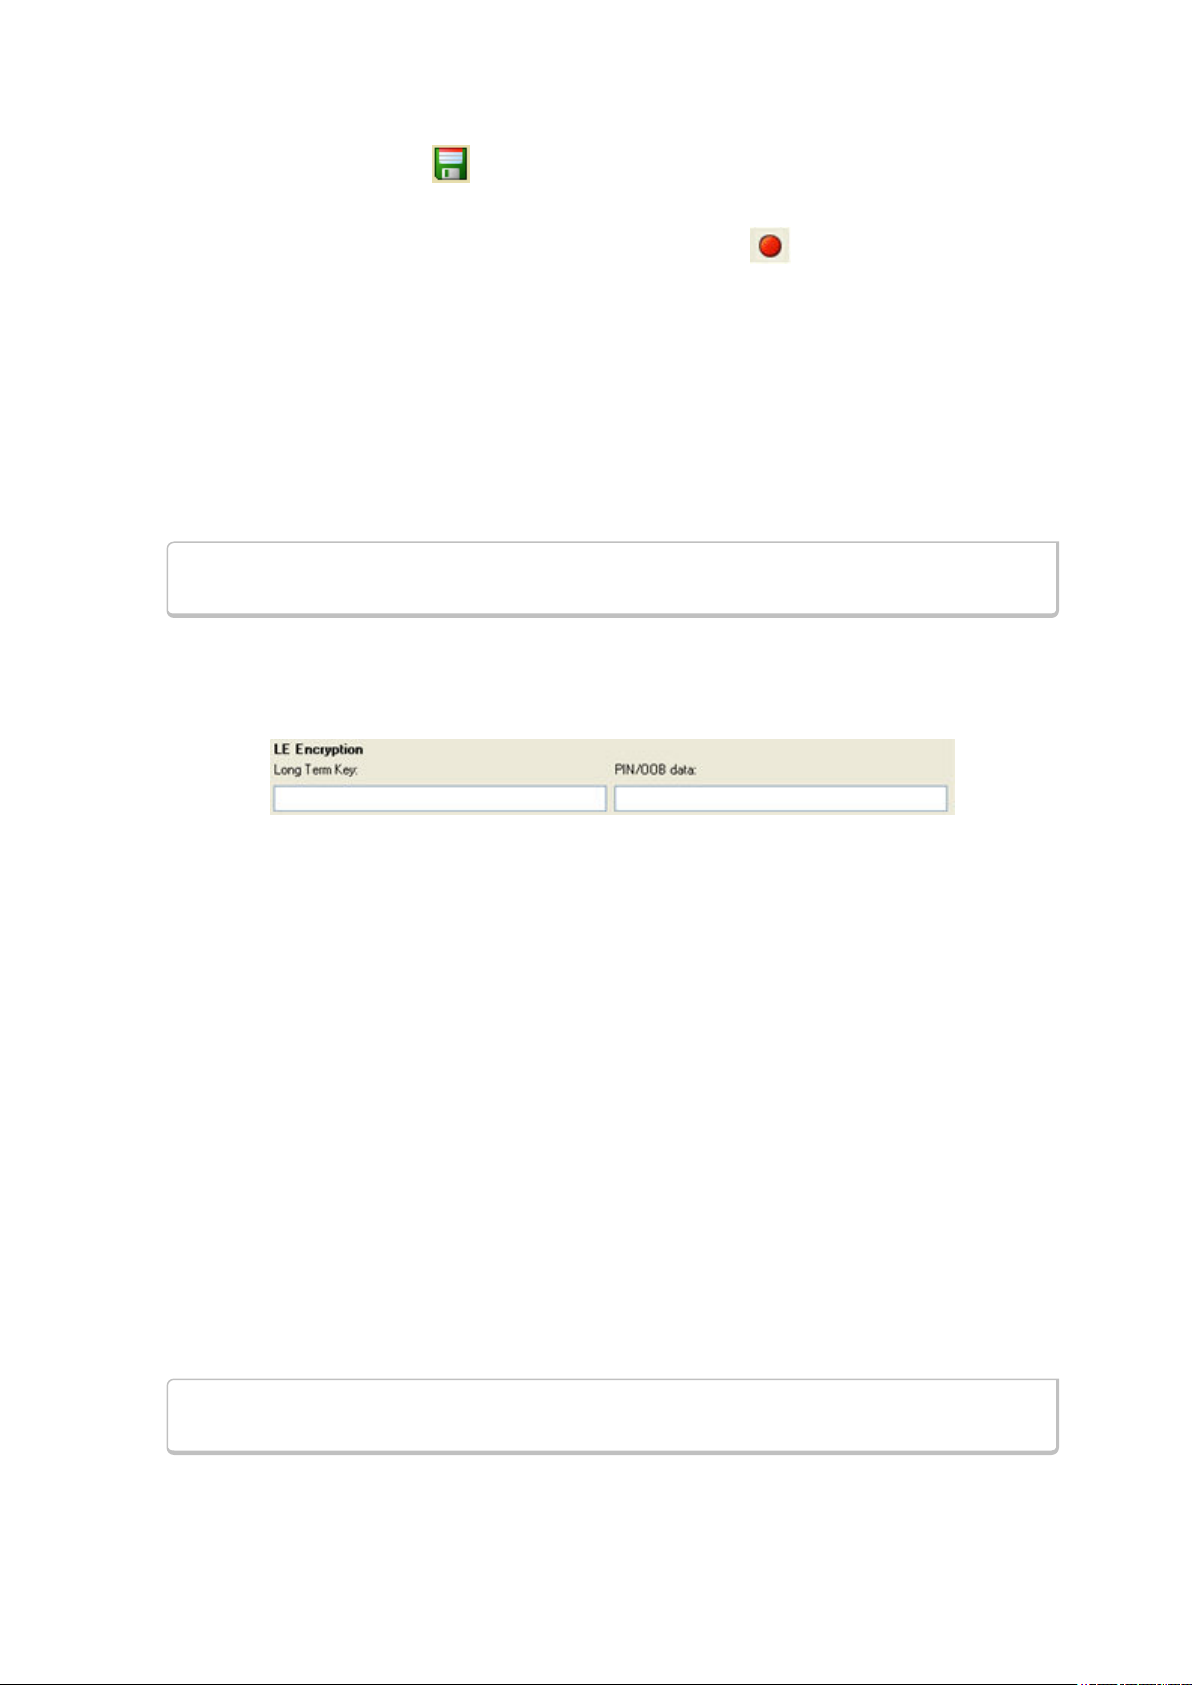
LE Encryption
Figure 3.2 - BPA low energy Devices Under Test LE Encryption
1. Enter the Long Term Key for the LE Encryption.
The Long Term Key is similar to the Link key in Classic. It is a persistent key that is stored in both devices
and used to derive a fresh encryption key each time the devices go encrypted.
Click here to learn more about the Long Term Key.
In LE, the long term key is generated solely on the slave device and then, during pairing, is distributed to a
master device that wants to establish an encrypted connection to that slave in the future. Thus the long term
key is transmitted over the air, albeit encrypted with a one-time key derived during the pairing process and
discarded afterwards (the so called short term key).
The long term key is directional, i.e. it is only used to for connections from the master to the slave (referring
to the roles of the devices during the pairing process). If the devices also want to connect the other way
round in the future, the device in the master role (during the pairing process) also needs to send its own long
term key to the device in the slave role during the pairing process (also encrypted with the short term key of
course), so that the device which was in the slave during the pairing process can be a master in the future and
connect to the device which was master during the pairing process (but then would be in a slave role).
Since most simple LE devices are only ever slave and never master at all, the second long term key exchange
is optional during the pairing process.
Note: f you use Copy/Paste to insert the Long Term Key , ComProbe software will auto
correct (remove invalid white spaces) to correctly format the key
Frontline BPA low energy Hardware & Software User Manual 15
TELEDYNE LECROY Chapter 3 Configuration Settings
2. Enter a PIN or out-of-band (OOB) value for pairing.
This optional information offers alternative pairing methods.
Click here to learn more about these possible pairing values.
One of two pieces of data allow alternative pairing:
1. PIN is a six-digit (or less if leading zeros are omitted) decimal number.
2. Out-of-Band (OOB) data is a 16-digit hexadecimal code which the devices exchange via a channel that is
different than the le transmission itself. This channel is called OOB.
For off-the-shelf devices we cannot sniff OOB data, but in the lab you may have access to the data exchanged
through this channel.
Click here to see how to capture data after completing the configuration.
Sniffer Diagnostics: Checking this box will record communications traffic between ComProbe software
and the ComProbe BPA low energy hardware. Most often used in conjunction with Frontline Technical
Support instructions should the user have problems with their hardware. Checking this box will not affect
capture, analysis, or display of data.
Filter out ADV packets for Non-Configured devices: Checking this box will filter out advertising packets
from devices not specified in the LE Device field. If "Sync with First Master" has been selected in the LE
Device field checking this box will have not affect. the purpose of this option is to reduce the advertising
traffic in situations where there are many devices; advertising traffic can clutter the captured data with
unnecessary packets.
3.1.3 BPA Low Energy LE Device Database
The LE Device Database contains information about low energy devices that have been discovered or
entered by the user.
Figure 3.3 - BPA Low Energy datasource LE Device Database Tab
The LE Device Database is automatically updated when you perform certain operation such as entering
encryption information from the Devices Under Test dialog.
Device Control Menu
Right-clicking anywhere in
the device list will display the
device control menu that will
Select, Delete, or Add a
device.. Clicking on one of
these menu items will
perform the following
actions.
16 Frontline BPA low energy Hardware & Software User Manual
Chapter 3 Configuration Settings TELEDYNE LECROY
Table 3.3 - LE Device Database Control Menu
Menu
Item
Select
Will place this device into the
be selected/highlighted in the list prior to making this menu selection. If multiple devices have
been selected/highlighted in the list, the first device in the list is placed in the Device Under
Test.
LE Device
Action
field in the
Device Under Test
tab. The device must
Delete
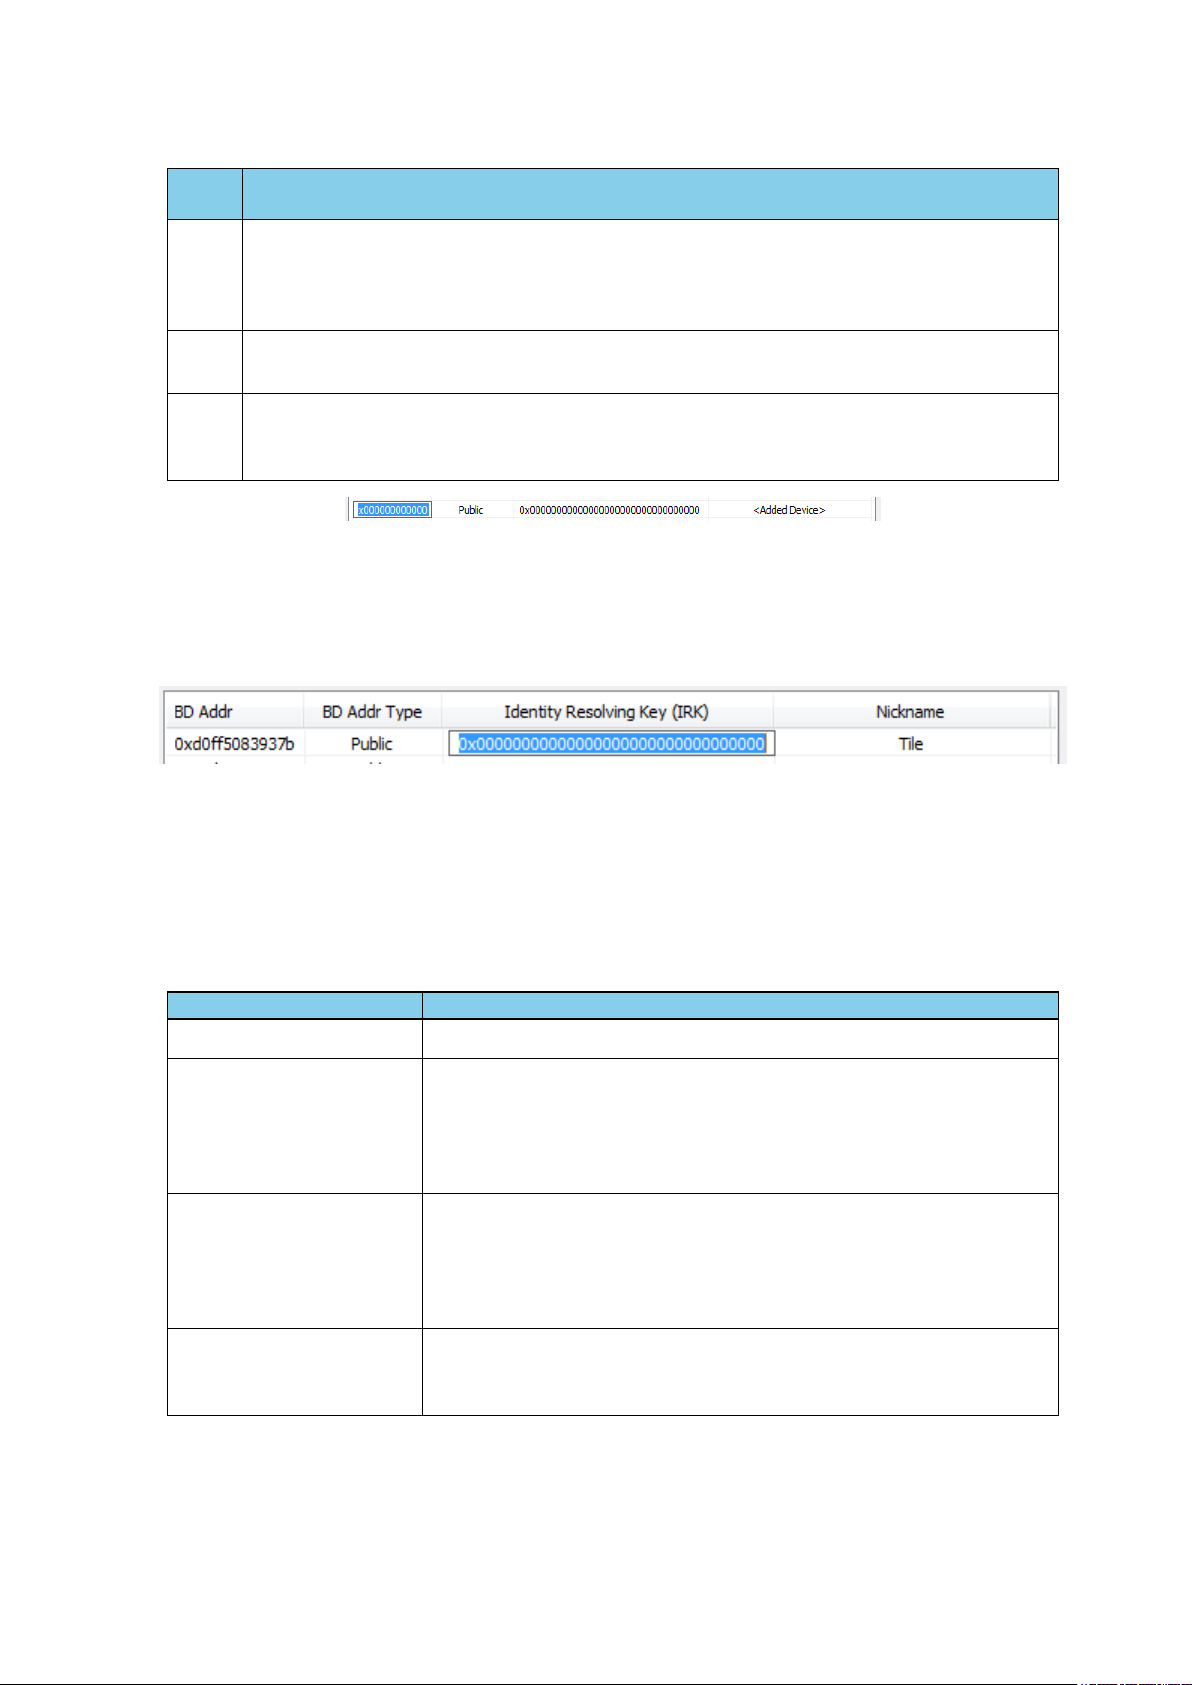
Add
Will deleted the selected/highlighted device from the database. Selecting/highlighting multiple
devices in the list will delete all of those devices.
Used for manual entry of a device into the database. A new device entry will append to the
end of the device list. To enter data double click on the field and type in the data. For the BD_
Addr Type field, double click and tab to select available types. See the following image.
Figure 3.4 - Add Menu Option Fields Display
Editing a Device
Any device entry can be edited by double-clicking in the field. An edit box will open and new device
information can be typed in.
Figure 3.5 - Editing IRK Field
When editing the BD_Addr Type field "<Tab to toggle>" appears. Press the keyboard Tab key until your
selected device address type appears.
LE Device Database Fields
In the LE Device Database table the following columns appear.
Table 3.4 - BPA Low Energy Datasource LE Device Database Fields
Column Description
BD_Add
BD_Addr Type
Identity Resolving Key
(IRK)
Nickname
r The address of the
May be either "Public" or "Random". "Public"addresses are set to BD_
Addr. "Random" is either a 'static" or "private" address. "Static" address
is a 48 bit randomly generated address. "Private" address is a 48 bit
"non-resolvable" address or "resolvable' address. A "resolvable" address
is generated using an IRK.
Will appear when BD_Addr Type is Random, Private, and Resolvable. A
host device with a list of IRKs can search the list to identify a peer
device that has previously authenticated with the host. This field can be
used to identify Bluetooth low energy devices that have previously
authenticated.
A user-added name for the device, often used to make device
identification easier during the analysis. Can be any alpha-numeric
string.
Bluetooth
low energy device
Frontline BPA low energy Hardware & Software User Manual 17
TELEDYNE LECROY Chapter 3 Configuration Settings
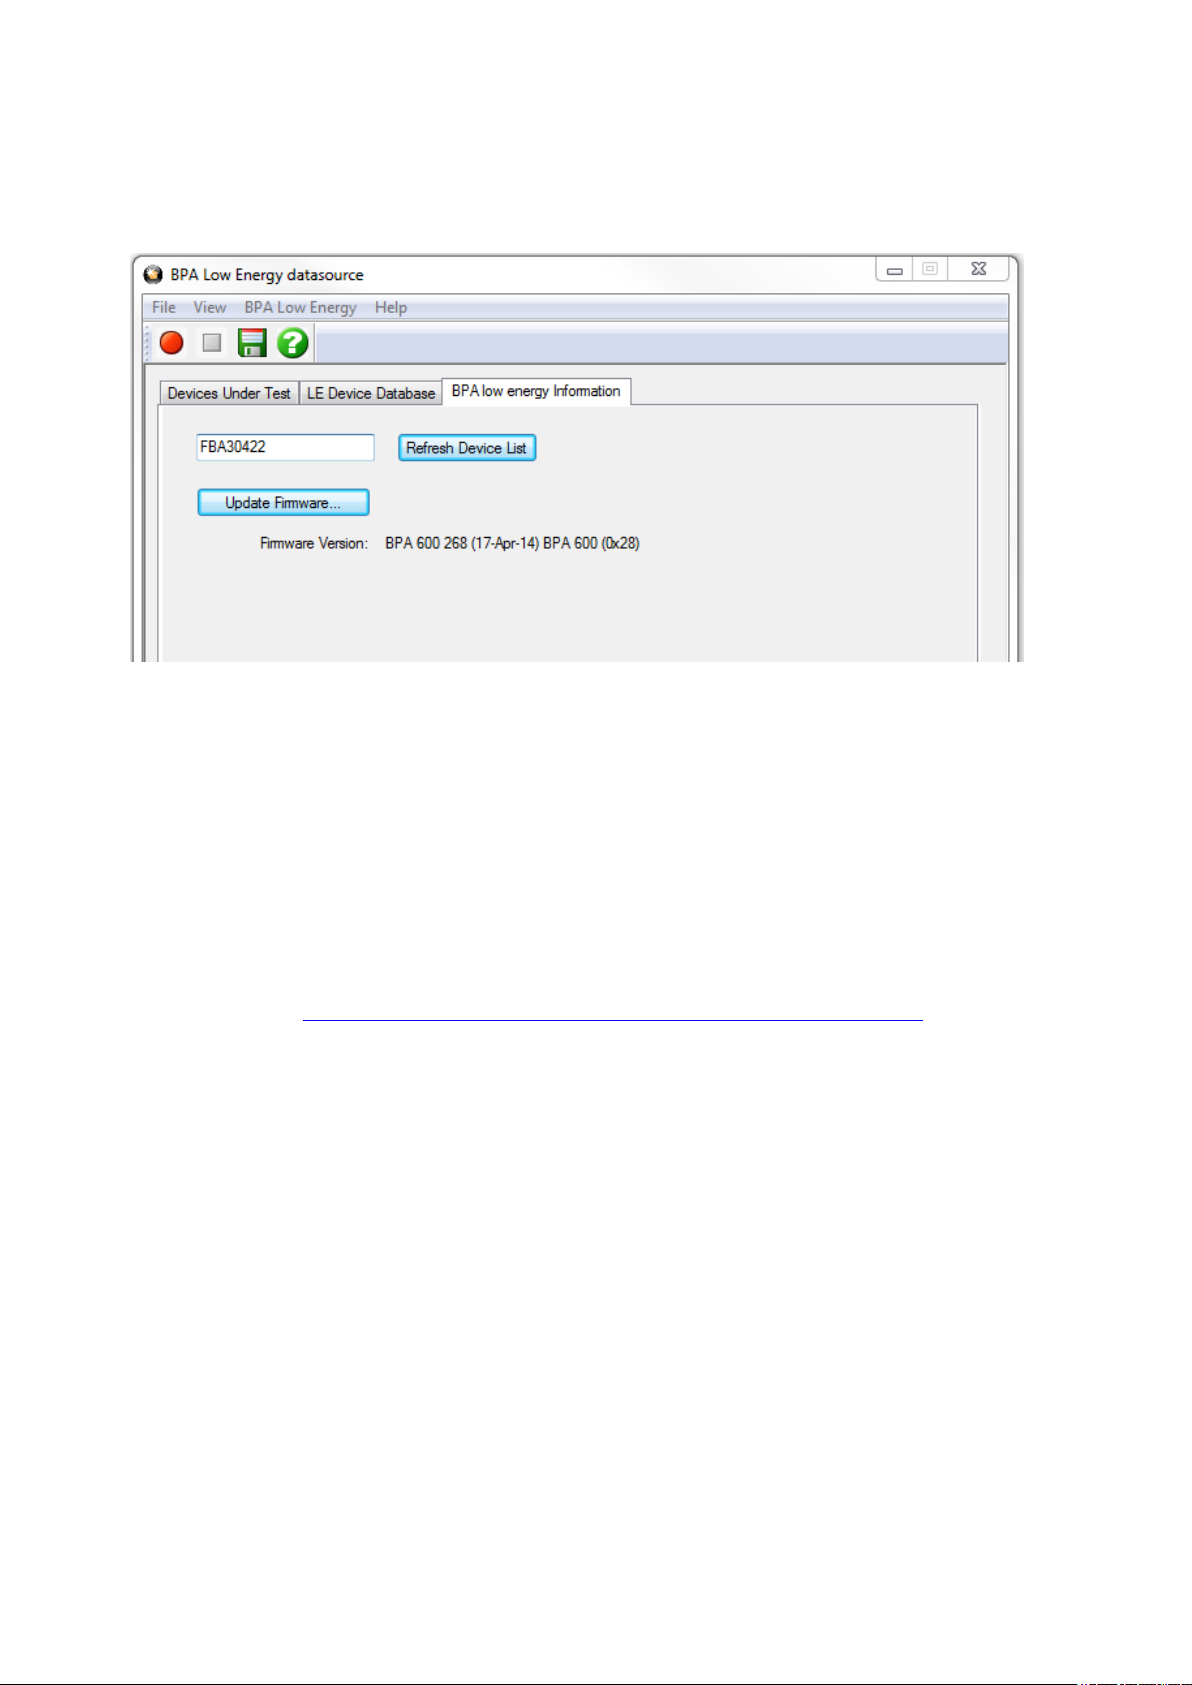
3.1.4 BPA low energy Datasource Information
The ComProbe BPA low energy Information tab is one of the three tabs that appear when you first start the
low energy analyzer.
Figure 3.6 - BPA low energy Information Tab
There are several pieces of information on this display:
l Displayed in the text window is the serial number of the connected BPA 600 device. To update the device
list click Refresh Device List.
l If you want to load the latest ComProbe BPAle hardware firmware, you select the Update Firmware
button..
l The current firmware is displayed under Firmware Version.
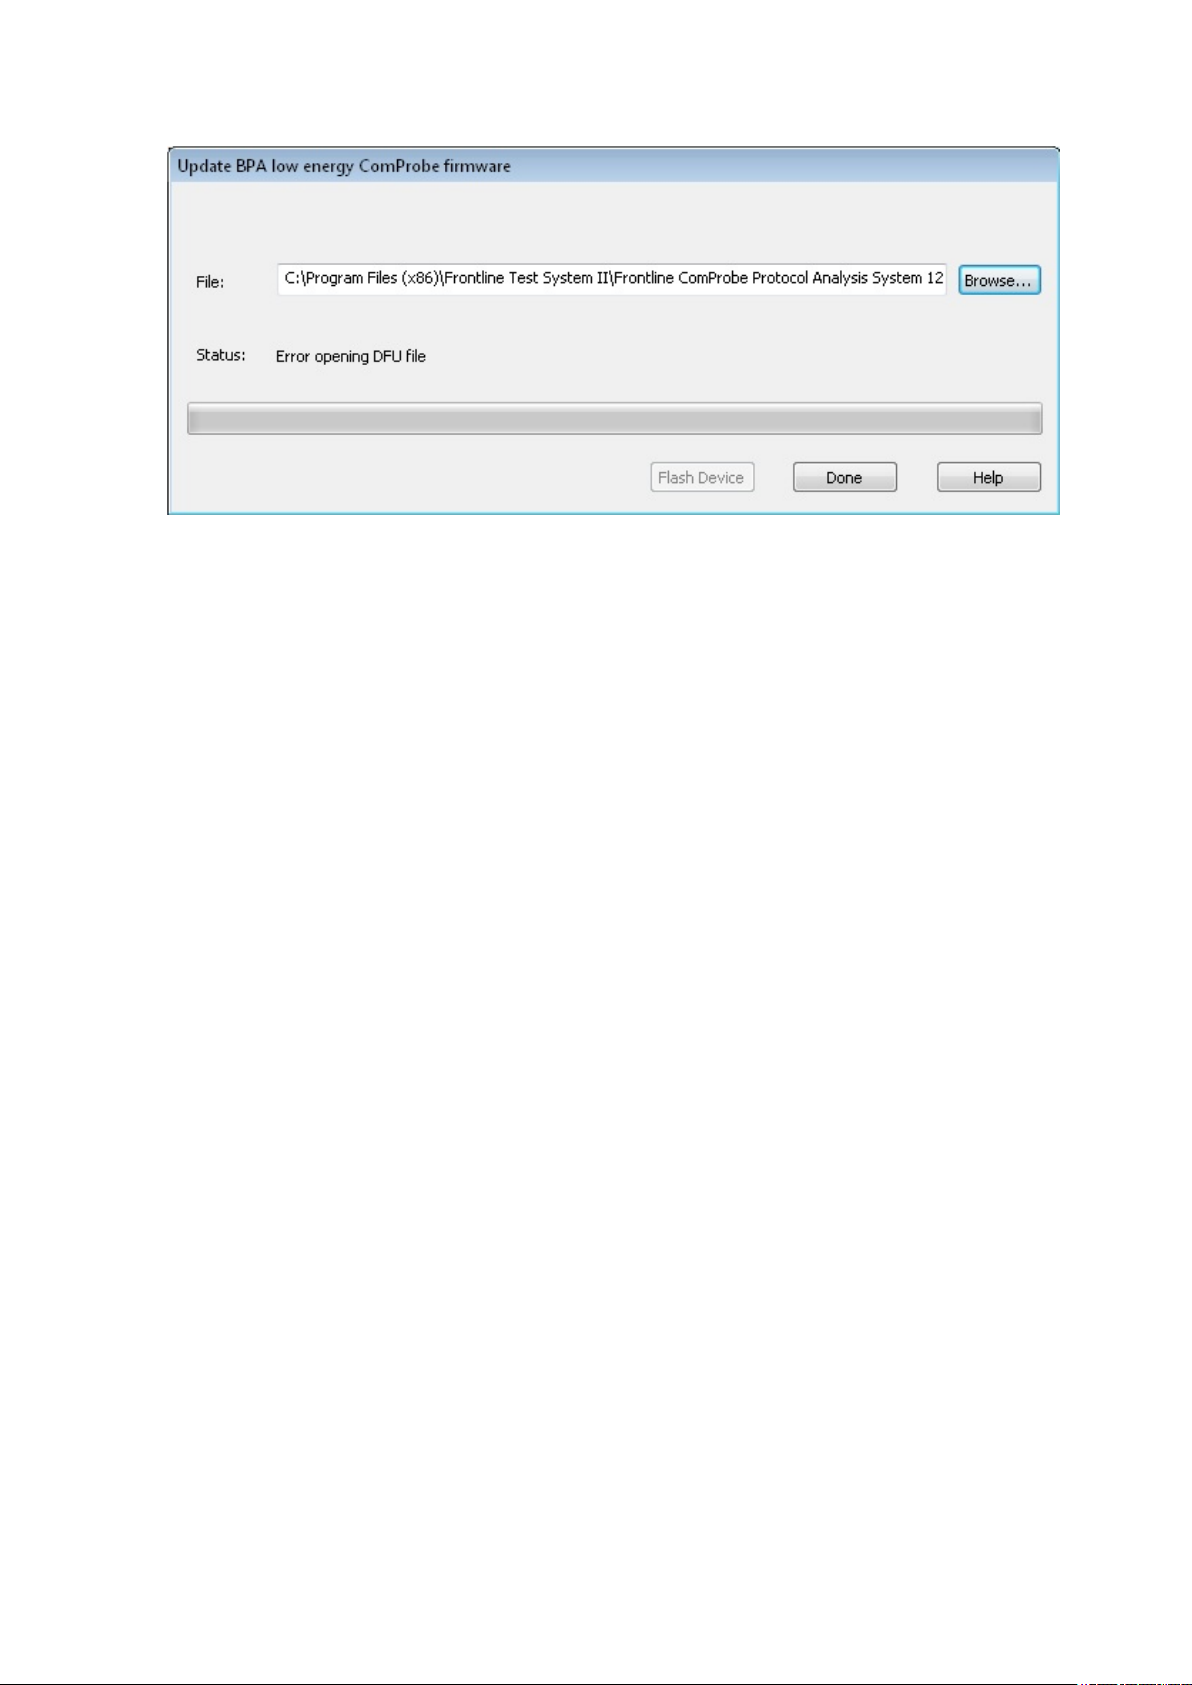
3.1.5 BPA low energy Update Firmware
When you select the Update Firmware on the BPA Low Energy datasource information tab, the
Update BPA low energy ComProbe firmware dialog appears. You use this dialog to update your low
energy analyzer with the latest firmware.
It is very important that you update the firmware. If the firmware versions are not the same, you will not be
able to start sniffing.
18 Frontline BPA low energy Hardware & Software User Manual
Chapter 3 Configuration Settings TELEDYNE LECROY
Figure 3.7 - BPA low energy Information Tab Update Firmware Dialog
1. Make sure the ComProbe BPA low energy analyzer is attached.
2. Select the location of the firmware file.
3. Select Flash Device. The download begins, with the Status bar displaying the progress. When the
download is complete, you can check the firmware version by checking the Status field.
4. Select Done when the update is finished.
3.2 Decoder Parameters
Some protocol decoders have user-defined parameters. These are protocols where some information cannot
be discovered by looking at the data and must be entered by the user in order for the decoder to correctly
decode the data. For example, such information might be a field where the length is either 3 or 4 bytes, and
which length is being used is a system option.
There may be times when the context for decoding a frame is missing. For example, if the analyzer captures a
response frame but does not capture the command frame, then the decode for the response may be
incomplete. The Set Initial Decoder Parameters window allows you to supply the context for any frame.
The dialog allows you to define any number of parameters and save them in a template for later use
The decoder template function provides the capacity to create multiple templates that contain different
parameters. This capability allows you to maintain individual templates for each Bluetooth® network
monitored. Applying a template containing only those parameters necessary to decode transmissions
particular to an individual network, enhances the efficiency of the analyzer to decode data.
If you have decoders loaded which require decoder parameters, a window with one tab for every decoder
that requires parameters appears the first time the decoder is loaded.
For help on setting the parameters, click the Help button on each tab to get help information specific to that
decoder.
If you need to change the parameters later,
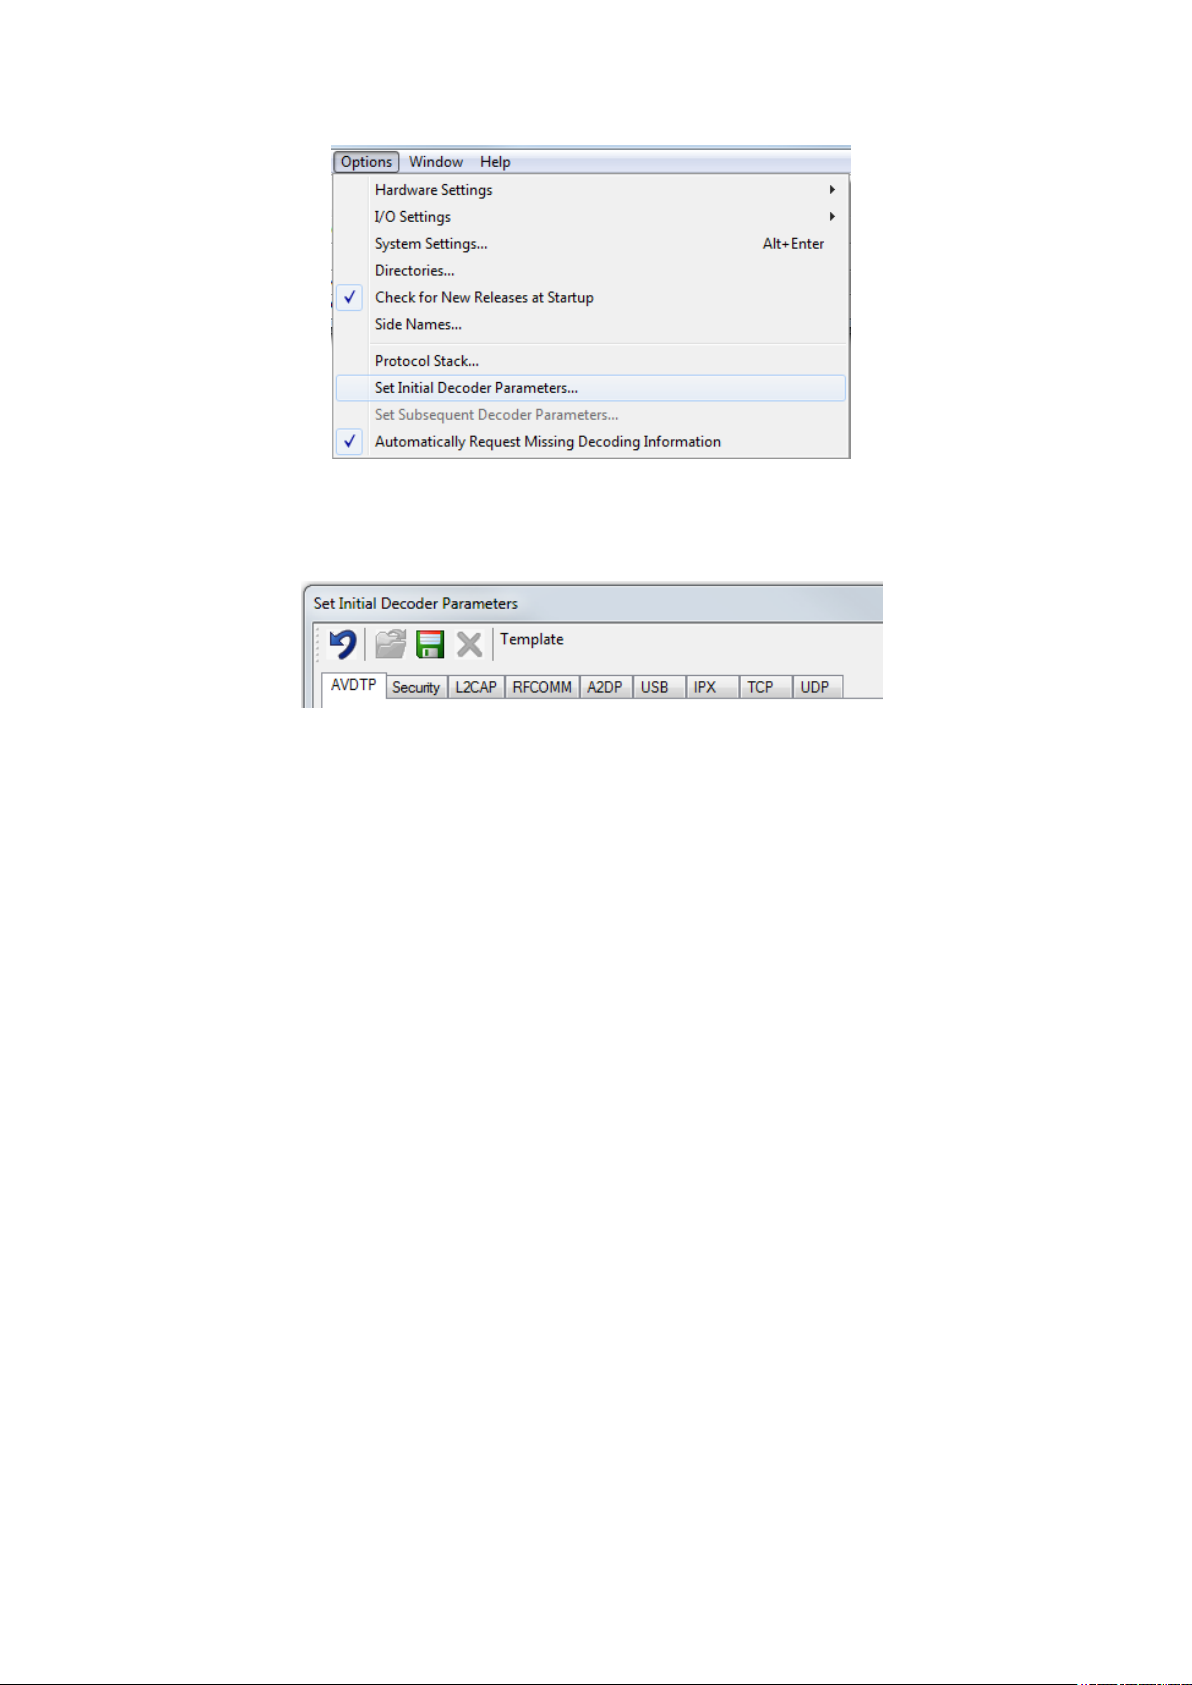
l Choose Set Initial Decoder Parameters... from the Options menu on the Control and Frame
Display windows.
Frontline BPA low energy Hardware & Software User Manual 19
TELEDYNE LECROY Chapter 3 Configuration Settings
Figure 3.8 - Select Set Initial Decoder Parameters... from Control window
The Set Initial Decoder Parameters window opens with a tab for each decoder that requires
parameters.
Figure 3.9 - Tabs for each decoder requiring parameters.
l Each entry in the Set Initial Decoder Parameters window takes effect from the beginning of the
capture onward or until redefined in the Set Subsequent Decoder Parameters dialog.
Override Existing Parameters
The Set Subsequent Decoder Parameters dialog allows the user to override an existing parameter at any
frame in the capture where the parameter is used.
If you have a parameter in effect and wish to change that parameter
l Select the frame where the change should take effect
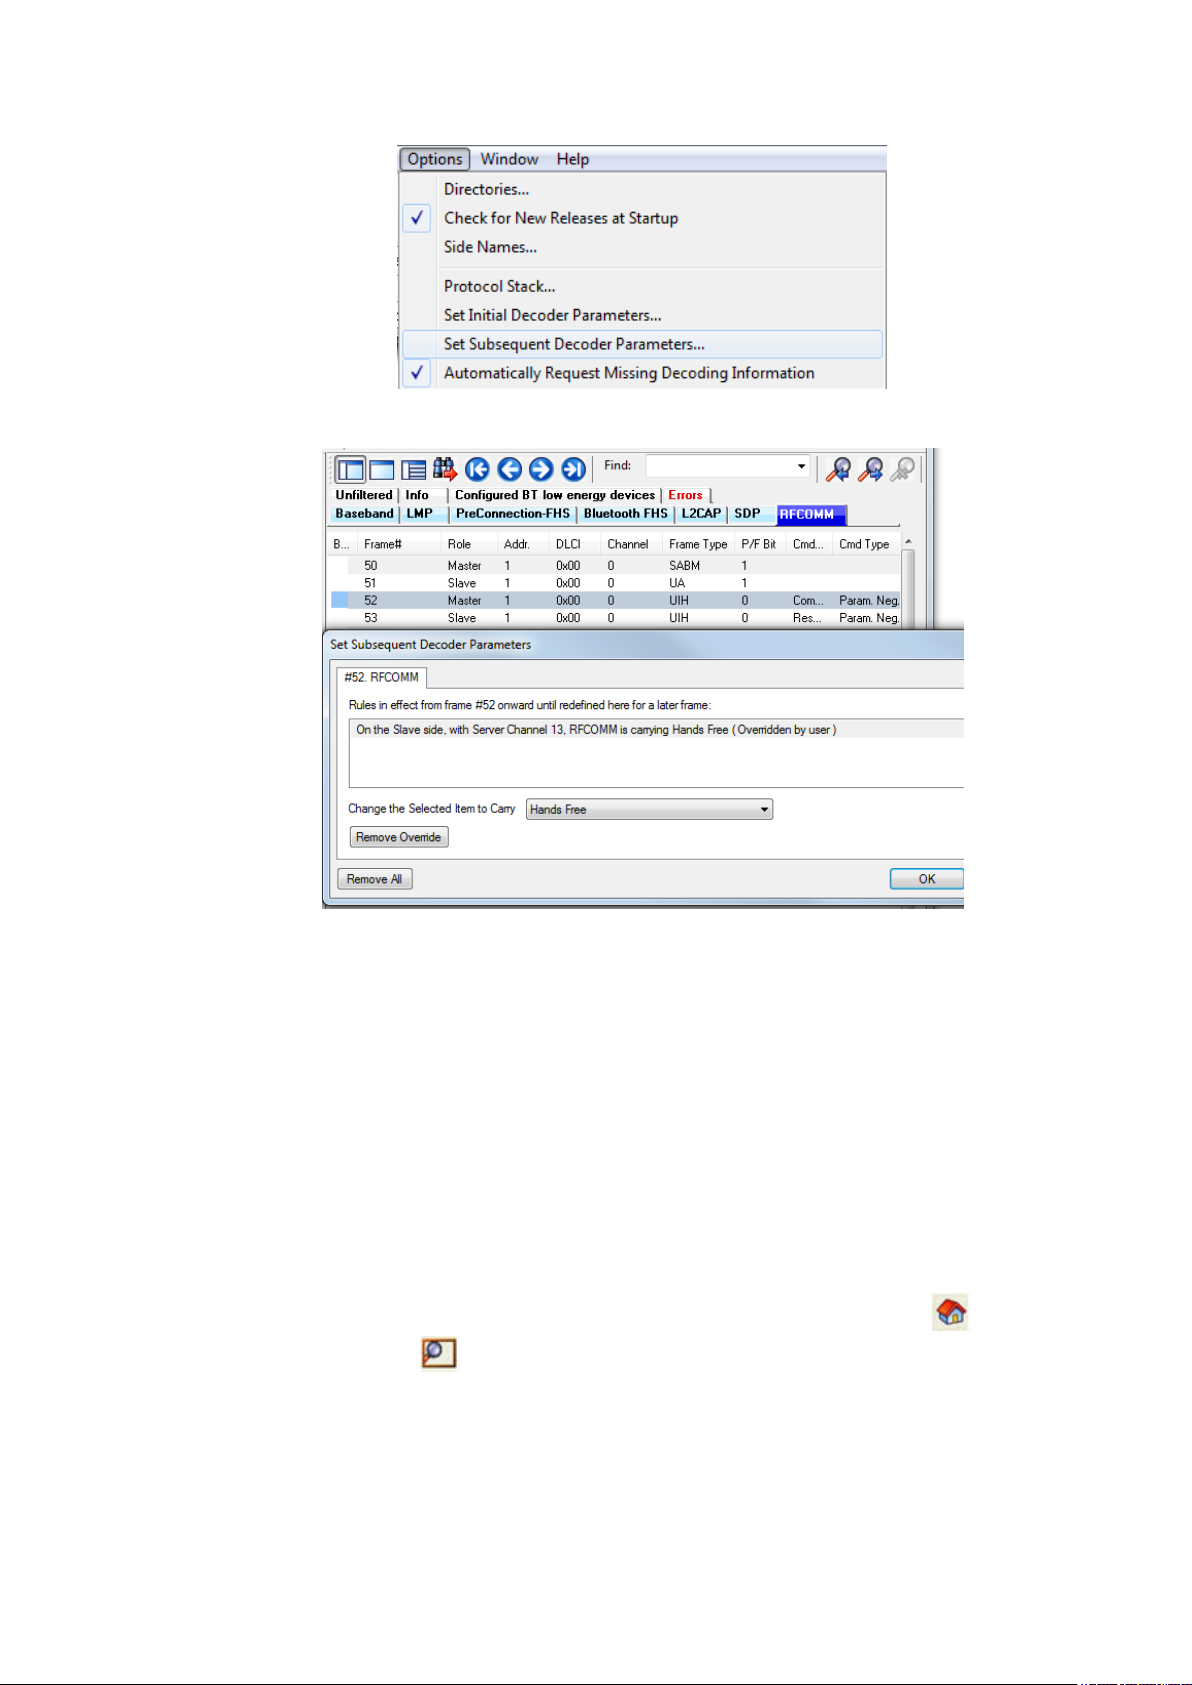
l Select Set Subsequent Decoder Parameters... from the Options menu, and make the needed
changes. You can also right-click on the frame to select the same option.
20 Frontline BPA low energy Hardware & Software User Manual
Chapter 3 Configuration Settings TELEDYNE LECROY
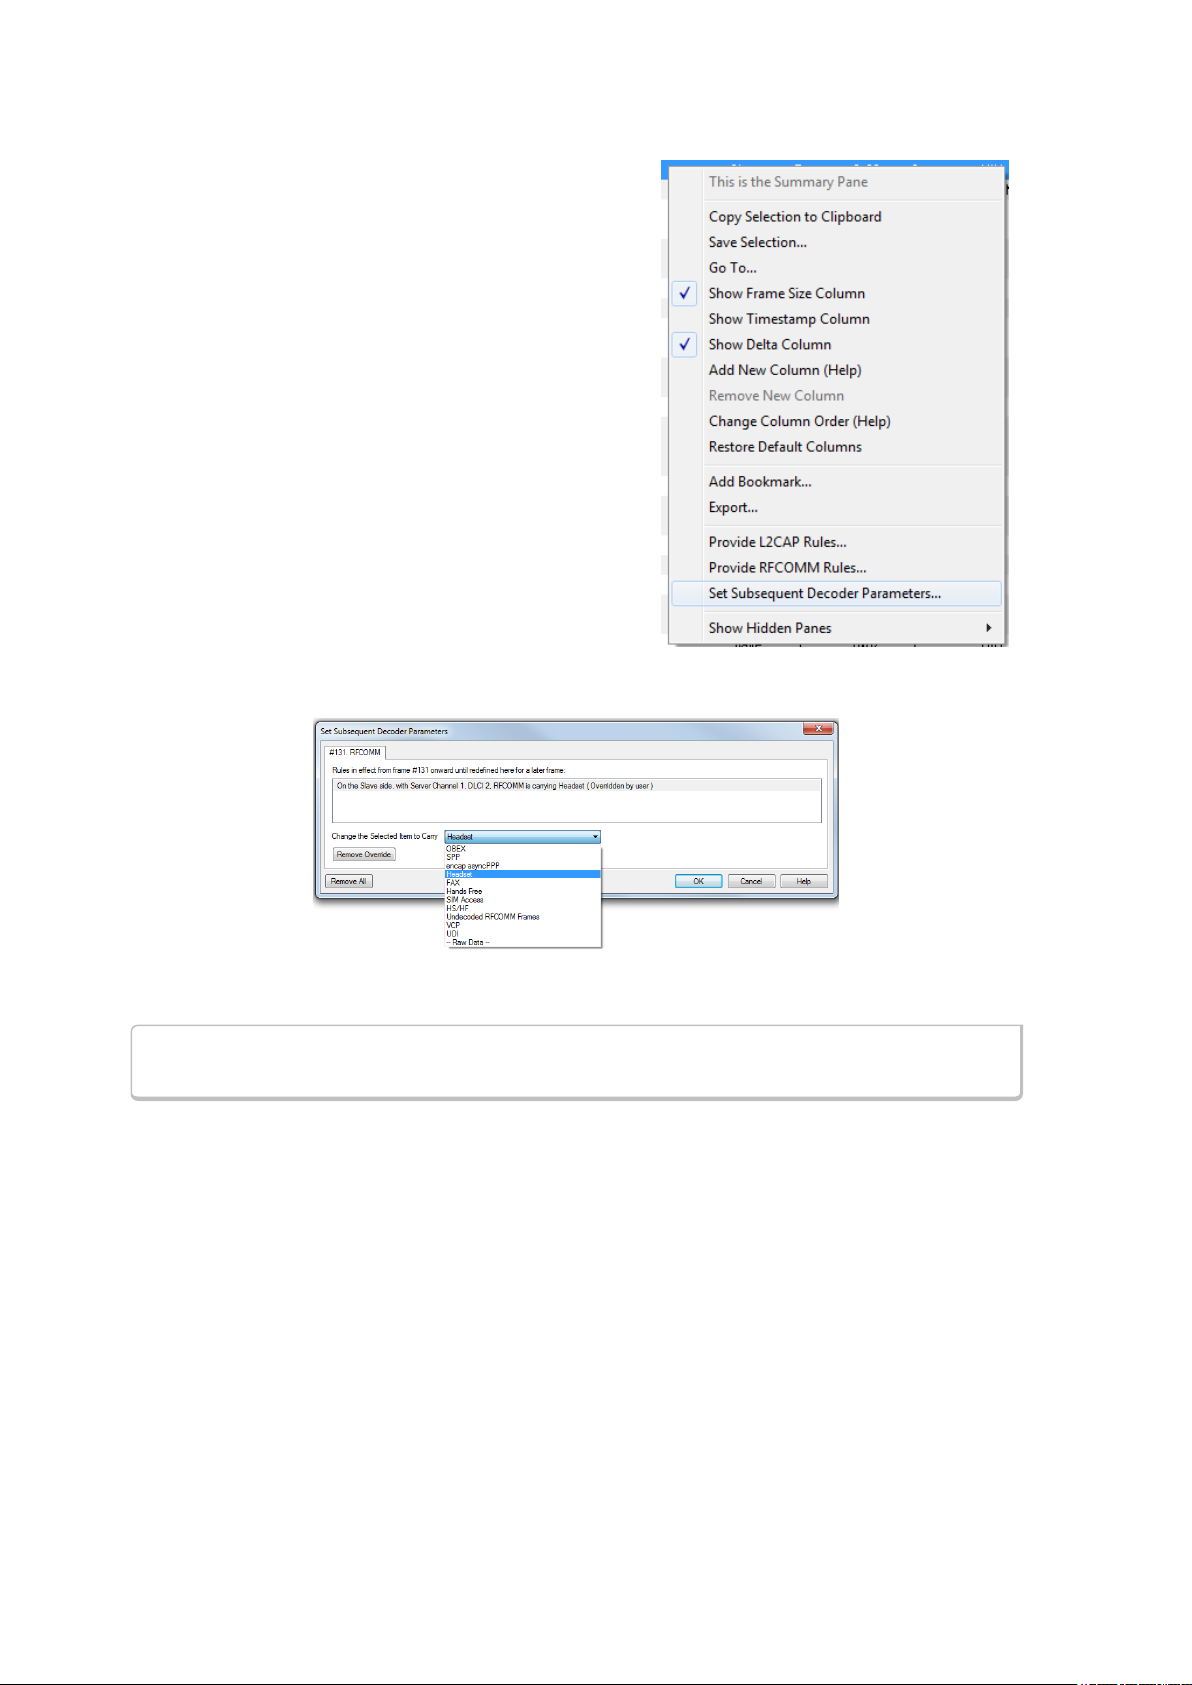
Figure 3.10 - Set Subsequent Decoder Parameters... from Control window
Figure 3.11 - Example: Set Subsequent Decode for Frame #52, RFCOMM
l Each entry in the Set Subsequent Decoder Parameters dialog takes effect from the specified frame
onward or until redefined in this dialog on a later frame.
l The Remove Override button will remove the selected decode parameter override.
l The Remove All button will remove all decoder overrides.
If you do not have decoders loaded that require parameters, the menu item does not appear and you don't
need to worry about this feature.
3.2.1 Decoder Parameter Templates
3.2.1.1 Select and Apply a Decoder Template
1.
Select Set Initial Decoder Parameters... from the Options menu on the Control window
or the Frame Display window.
Frontline BPA low energy Hardware & Software User Manual 21
TELEDYNE LECROY Chapter 3 Configuration Settings
2.
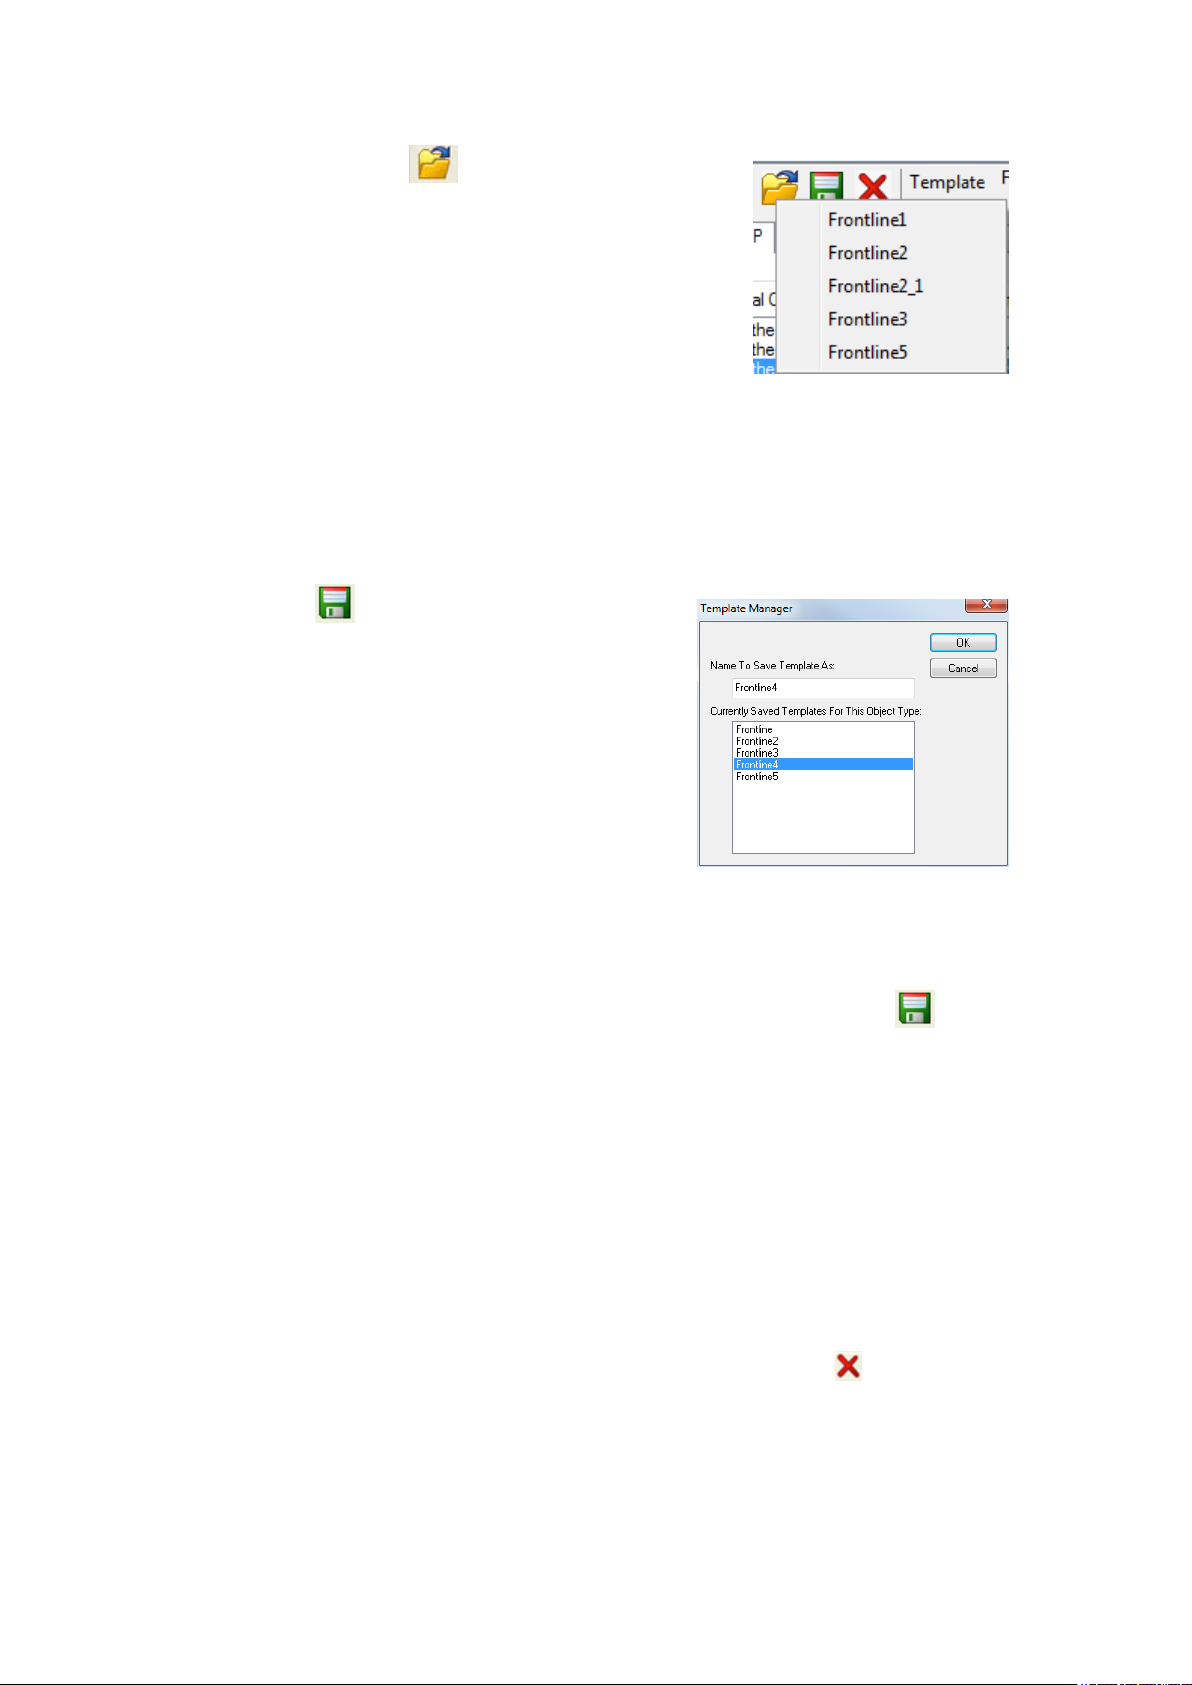
Click the Open Template icon in the toolbar and select the
desired template from the pop up list. The system displays the
content of the selected template in the Initial Connections list at
the top of the dialog
3. Click the OK button to apply the selected template and decoders'
settings and exit the Set Initial Decoder Parameters dialog.
3.2.1.2 Adding a New or Saving an Existing Template
Add a Template
A template is a collection of parameters required to completely decode communications between multiple
devices. This procedure adds a template to the system and saves it for later use:
1.
Click the Save button at the top of the Set Initial
Decoder Parameters dialog to display the Template
Manager dialog.
2. Enter a name for the new template and click OK.
The system saves the template and closes the Template
Manager dialog.
3. Click the OK button on the Set Initial Decoder
Parameters window to apply the template and close the
dialog.
Save Changes to a Template
This procedure saves changes to parameters in an existing template.
1.
After making changes to parameter settings in a user defined template, click the Save button at
the top of the Set Initial Decoder Parameters window to display the Template Manager dialog.
2. Ensure that the name of the template is listed in the Name to Save Template As text box and click
OK.
3. The system displays a dialog asking for confirmation of the change to the existing template. Click the
Yes button.
The system saves the parameter changes to the template and closes the Save As dialog.
4. Click the OK button on the Set Initial Decoder Parameters window to apply the template and
close the window.
3.2.1.3 Deleting a Template
1.
After opening the Set Initial Decoder Parameters window click the Delete button in the
toolbar.
The system displays the Template Manager dialog with a list of saved templates.
22 Frontline BPA low energy Hardware & Software User Manual
Chapter 3 Configuration Settings TELEDYNE LECROY
2. Select (click on and highlight) the template marked for deletion and click the Delete button.
The system removes the selected template from the list of saved templates.
3. Click the OK button to complete the deletion process and close the Delete dialog.
4. Click the OK button on the Set Initial Decoder Parameters window to apply the deletion and
close the dialog.
3.2.2 Selecting A2DP Decoder Parameters
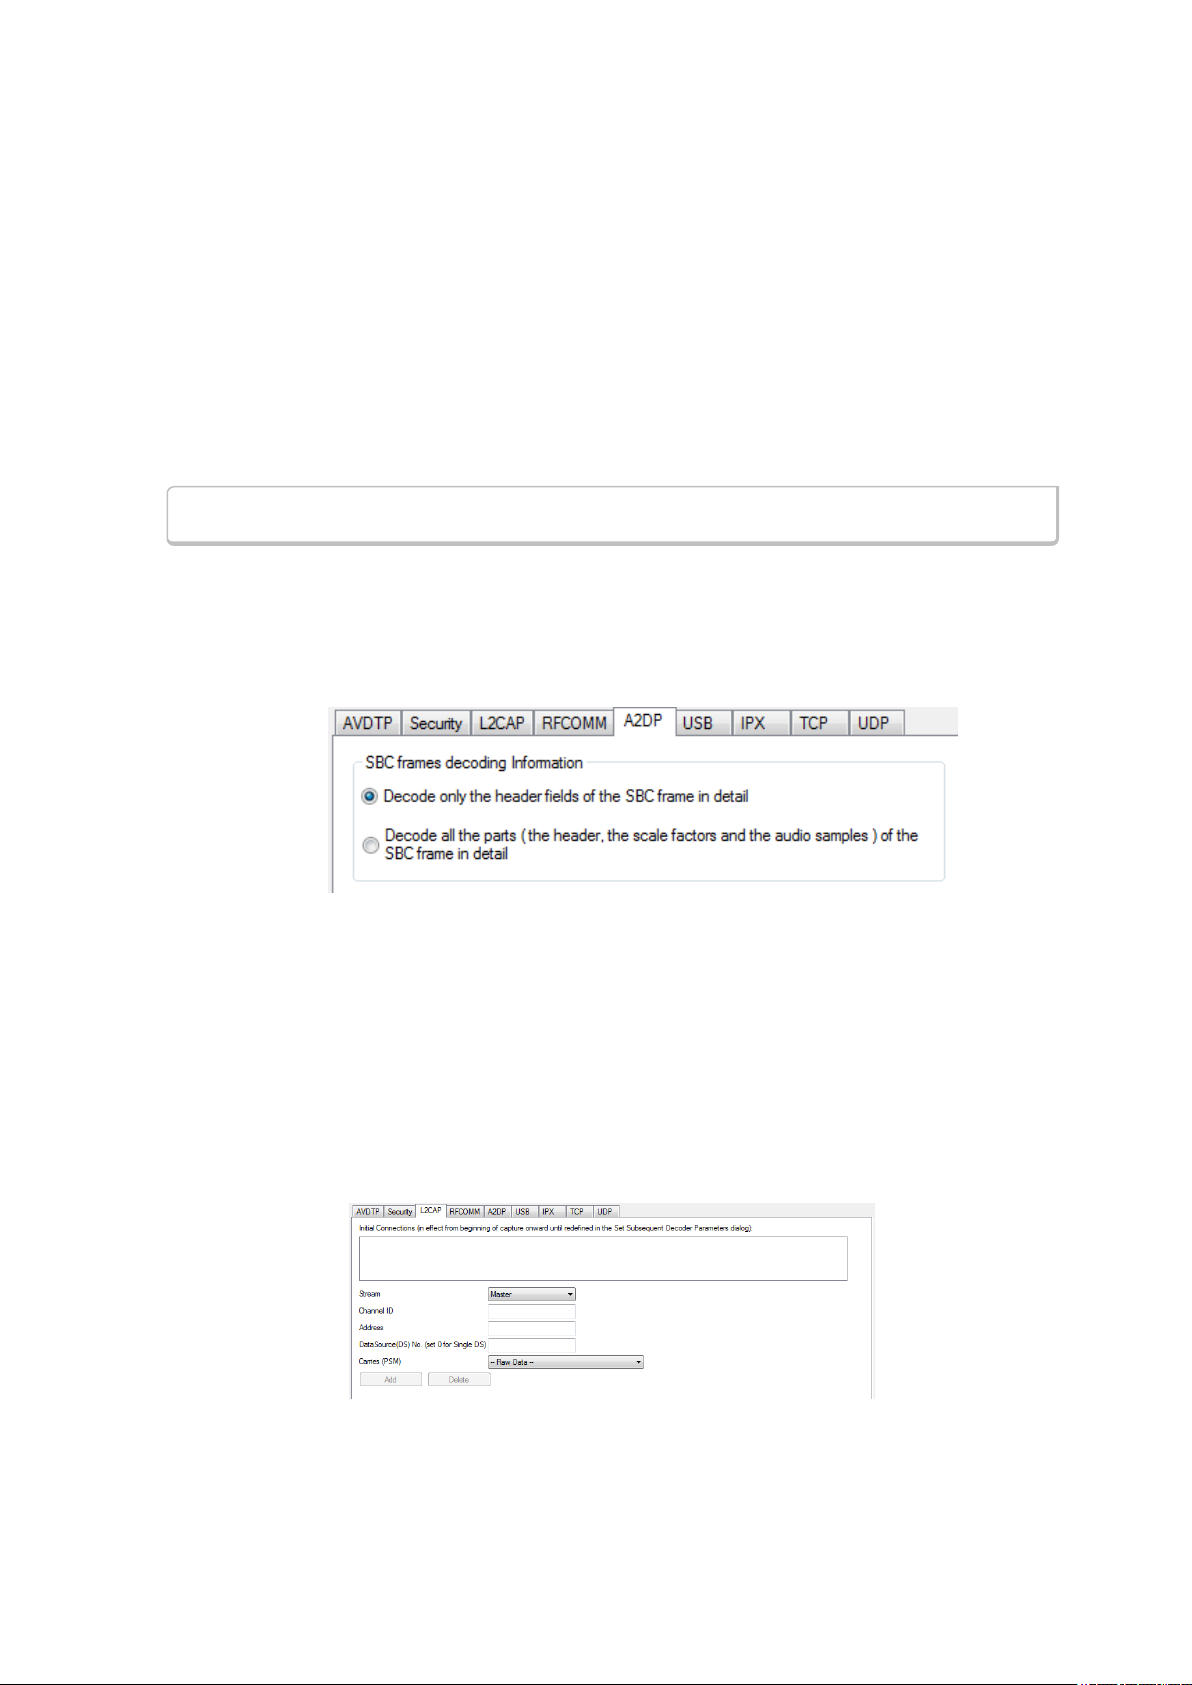
Decoding SBC frames in the A2DP decoder can be slow if the analyzer decodes all the parts (the header, the
scale factor and the audio samples) of the frame. You can increase the decoding speed by decoding only the
header fields and disregarding other parts. You can select the detail-level of decoding using the Set Initial
Decoder Parameters window.
Note: By default the decoder decodes only the header fields of the frame.
1. Select Set Initial Decoder Parameters from the Options menu on the Control window or the
Frame Display window.
2. Click on the A2DP tab.
3. Choose the desired decoding method.
Figure 3.12 - A2DP Decoder Settings
4. Follow steps to save the template changes or to save a new template.
5. Click the OK button to apply the selection and exit the Set Initial Decoder Parameters window.
3.2.3 L2CAP Decoder Parameters
3.2.3.1 About L2CAP Decoder Parameters
Each entry in the Set Initial Decoder Parameters dialog takes effect from the beginning of the capture onward
or until redefined in the Set Subsequent Decoder Parameters dialog.
Figure 3.13 - L2CAP Decoder parameters tab
Frontline BPA low energy Hardware & Software User Manual 23

TELEDYNE LECROY Chapter 3 Configuration Settings
The L2CAP Set Initial Decoder Parameters dialog requires the following user inputs to complete a
Parameter :
l Stream - This identifies the role of the device initiating the frame (master or slave)
l Channel ID - The channel number 0 through 78
l Address - This is the physical connection values for the devices. Each link in the net will have an address.
A piconet can have up to seven links. The Frame Display can
provide address information.
l Data Source (DS) No. -When only one data source is employed,
set this parameter to 0 (zero), otherwise, set to the desired data
source number.
Carries (PSM) - Select the protocol that L2CAP traverses to from the
following:
l AMP Manager
l AMP Test Manager
l SDP
l RFCOMM
l TCS
l LPMP
l BNEP
l HCRP Control
l HCRP Data
l HID
l AVCTP
l AVDTP
l CMTP
l MCAP Control
l IEEE P11073 20601
l -Raw Data-
Adding, Deleting, and Saving L2CAP Parameters
1. From the Set Initial Decoder Parameters window, click on the L2CAP tab.
2. Set or select the L2CAP decoder parameters.
3. Click on the ADD button. The Initial Connection window displays the added parameters.
24 Frontline BPA low energy Hardware & Software User Manual

Chapter 3 Configuration Settings TELEDYNE LECROY
Figure 3.14 - Parameters Added to Decoder
4. To delete a parameter from the Initial Connections window, select the parameter and click on the
Delete button.
5. Decoder parameters cannot be edited. The only way to change a parameter is to delete the original as
described above, and recreate the parameter with the changed settings and selections and then click
on the Add button.
6. L2CAP parameters are saved when the template is saved.
3.2.3.2 L2CAP Override Decode Information
The Set Subsequent Decoder Parameters dialog allows the user to override an existing parameter at any
frame in the capture where the parameter is used.
If you have a parameter in effect and wish to change that parameter:
1. Select the frame where the change should take effect
2. Select Set Subsequent Decoder Parameters from
the Options menu, or by selecting a frame in the frame
display and choosing from the right-click pop-up menu,
and make the needed changes. Refer to
3. Change the L2CAP parameter by selecting from the rule
to change, and click on the listed parameters.
4. If you wish to remove an overridden rule click on
Remove Override button. If you want to remove all
decoder parameter settings click on Remove All.
5. Click OK.
Each entry in the Set Subsequent Decoder Parameters
dialog takes effect from the specified frame onward or until
redefined in this dialog on a later frame.
Note: If the capture has no user defined overrides, then the
system displays a dialog stating that no user defined
overrides exist.
3.2.4 RFCOMM Decoder Parameters
3.2.4.1 About RFCOMM Decoder Parameters
Each entry in the Set Initial Decoder Parameters dialog takes effect from the beginning of the capture
onward or until redefined in the Set Subsequent Decoder Parameters dialog.
Frontline BPA low energy Hardware & Software User Manual 25

TELEDYNE LECROY Chapter 3 Configuration Settings
Figure 3.15 - RFCOMM parameters tab
The RFCOMM Set Initial Decoder Parameters tab requires the following user inputs to complete a
parameter:
l Stream - Identifies the role of the device initiating the frame (master or slave)
l Server Channel - The Bluetooth® channel number 0 through 78
l DLCI - This is the Data Link Connection Identifier, and identifies the ongoing connection between a client
and a server
l Data Source (DS) No.- When only one data source is employed, set this parameter to 0 (zero),
otherwise, set to the desired data source
l Carries (UUID) - Select from the list to apply the Universal Unique Identifier (UUID) of the application
layer that RFCOMM traverses to from the following:
o
OBEX
o
SPP
o
encap asyncPPP
o
Headset
o
FAX
o
Hands Free
o
SIM Access
o
VCP
o
UDI
o
-Raw Data-
Adding, Deleting, and Saving RFCOMM Parameters
1. From the Set Initial Decoder Parameters window, click on the RFCOMMtab.
2. Set or select the RFCOMMdecoder parameters.
3. Click on the ADD button. The Initial Connection window displays the added parameters.
Figure 3.16 - Parameters Added to Decoder
26 Frontline BPA low energy Hardware & Software User Manual

Chapter 3 Configuration Settings TELEDYNE LECROY
4. To delete a parameter from the Initial Connections window, select the parameter and click on the
Delete button.
5. Decoder parameters cannot be edited. The only way to change a parameter is to delete the original as
described above, and recreate the parameter with the changed settings and selections and then click
on the Add button.
6. RFCOMM parameters are saved when the template is saved as described in on page 1
3.2.4.2 RFCOMM Missing Decode Information
ComProbe software usually determines the protocol carried in an RFCOMM payload by monitoring previous
traffic. However, when this fails to occur, the Missing Decoding Information Detected dialog appears
and requests that the user supply the missing information.
The following are the most common among the many possible reasons for a failure to determine the
traversal:
l The capture session started after transmission of the vital information
l The analyzer incorrectly received a frame with the traversal information
l The communication monitored takes place between two players with implicit information not included in
the transmission
In any case, either view the RFCOMM payload of this frame (and other frames with the same channel) as hex
data, or assist the analyzer by selecting a protocol using this dialog.
Note that you may use the rest of the analyzer without addressing this dialog. Additional information gathered
during the capture session may help you decide how to respond to the request for decoding information.
If you are not sure of the payload carried by the subject frame, look at the raw data shown under data in the
Decode pane in the Frame Display. You may notice something that hints as to the profile in use.
In addition, look at some of the frames following the one in question. The data may not be recognizable to the
analyzer at the current point due to connection setup, but might be discovered later on in the capture.
3.2.4.3 RFCOMM Override Decode Information
The Set Subsequent Decoder Parameters dialog allows the user to override an existing parameter at any
frame in the capture where the parameter is used.
If you have a parameter in effect and wish to change that parameter:
Frontline BPA low energy Hardware & Software User Manual 27
TELEDYNE LECROY Chapter 3 Configuration Settings
1. Select the frame where the change should take effect,
and select Set Subsequent Decoder Parameters
from the Options menu, or by selecting a frame in the
frame display and choosing from the right-click pop-up
menu, and make the needed changes.
2. Change the RFCOMM parameter by selecting from the
Change the Selected Item to Carry drop down list.
3. If you wish to remove an overridden rule click on
Remove Override button. If you want to remove all
decoder parameter settings click on Remove All.
4. Choose the protocol the selected item carries from the
drop-down list, and click OK.
Each entry in the Set Subsequent Decoder Parameters
dialog takes effect from the specified frame onward or until
redefined in this dialog on a later frame.
Figure 3.17 - Set Subsequent Decoder Parameters selection list
Note: If the capture has no user defined overrides, then the system displays a dialog
stating that no user defined overrides exist.
28 Frontline BPA low energy Hardware & Software User Manual

Chapter 4 Capturing and Analyzing Data
The following sections describe the various ComProbe software functions that capture and display data
packets.
4.1 Capture Data
4.1.1 Air Sniffing: Positioning Devices
When capturing over the air packets, proper positioning of the Frontline hardware and the Devices Under
Test (DUTs) will result in the best possible captures and will mitigate sources of path loss and interference.
The following procedures will help optimize the capture process especially if you are have problems
obtaining reliable …captures.
Problems with indoor radio propagation
Even in free space, it is well understood that radio frequencies attenuate over distance. The free-space ruleof-thumb dictates that radio energy decreases in strength by 20 dB by each 10-to-1 increase in range. In the
real-world, the effects of objects in an outdoor environment cause reflection, diffraction, and scattering
resulting in greater signal losses. Indoors the situation can be worse. Reflections occur from walls and other
large flat surfaces. Diffraction occurs from objects with sharp edges. Scattering is produced from objects with
rough surfaces and from small objects. Also any object directly in the path of the radiation can present a hard
or soft partition depending on the partition's material properties. Path losses from partitions are difficult to
estimate.
Estimating indoor propagation loss
One estimate of indoor path loss, based on path loss data from a typical building, provides a power
rule. At 2.4 GHz, the following relationship provides an approximate estimate of indoor path loss:
This approximation is expected to have a variance of 13 dB.
Frontline BPA low energy Hardware & Software User Manual 29

TELEDYNE LECROY Chapter 4 Capturing and Analyzing Data
Mitigating path loss and interference
Bluetooth device design contributes to mitigating environmental effects on propagation through spread
spectrum radio design, for example. However, careful planning of the testing environment can also
contribute to reliable data capture process.
The first step to ensuring reliable air-sniffing data capture is to understand the RF characteristics of the
Devices Under Test (DUTs). The Bluetooth Class, antenna types, and radiation patterns are all important factors
that can affect the placement of the DUTs and the Frontline hardware. Radiation patterns are rarely spherical,
so understanding your device's radiation patterns can greatly enhance successful data capture. Position
devices to avoid radiation attenuation by the surroundings.
This step is optional: Consider conductive testing to establish a baseline capture. Conductive testing isolates
the DUTs and analyzer from environmental effects.
The next step is to ensure that the testing environment is as clutter-free as possible.
l Line-of-sight obstructions should be eliminated between the Frontline hardware and the DUTs because
they cause a reduction in signal strength. Obstructions include, but are not limited to: water bottles,
coffee cups, computers, computer screens, computer speakers, and books. A clear, unobstructed line-ofsight is preferred for DUT and Frontline hardware positioning.
l If using an analyzer connected to a computer, position the computer on an adjacent table or surface away
from the analyzer and DUTs, taking advantage of the cables' length. If this is not possible, position the
computer behind the analyzer as far away as possible. If using the Frontline FTS4BT, which is a dongle,
either use an extension USB cable or position the computer such that the dongle is positioned towards the
DUTs.
l The preferred placement is positioning the DUTs and the Frontline hardware at the points of an
equilateral triangle in the same horizontal plane, i.e. placed on the same table or work surface. The sides
of the triangle should be between 1 and 2 meters for Bluetooth transmitter classes 1 and 2. The distance
for transmitter class 3 should be 1/2 meter.
Figure 4.1 - Devices Equally Spaced in the Same Horizontal Plane
Finally, eliminate other RF sources.
30 Frontline BPA low energy Hardware & Software User Manual

Chapter 4 Capturing and Analyzing Data TELEDYNE LECROY
l Wi-Fi interference should be minimized or eliminated. Bluetooth shares the same 2.4 GHz frequency
bands as Wi-Fi technology. Wi-Fi interference can cause loss of packets and poor captures. In a laboratory
or testing environment do not place the DUTs and Frontline hardware in close proximity with Wi-Fi
transmitting sources such as laptops or routers. Turning off Wi-Fi on the computer running the Frontline
software is recommended.
Poor Placement
A poor test configuration for the analyzer is placing the DUTs very close to each other and the analyzer far
away. The DUTs, being in close proximity to each other, reduce their transmission power and thus make it
hard for the analyzer to hear the conversation. If the analyzer is far away from DUTs, there are chances that
the analyzer may miss those frames, which could lead to failure in decryption of the data.
Obstacles in close proximity to or in between the analyzer and the DUTs can interfere and cause reduction in
signal strength or interference. Even small objects can cause signal scattering.
Figure 4.2 - Example: Poor Capture Environment
4.1.2 Capturing Data to Disk - General Procedure
Note: Capture is not available in Viewer mode.
1.
Click the Start Capture button to begin capturing to a file. This icon is located on the Control ,
Event Display, and Frame Display windows.
2. Files are placed in My Capture Files by default and have a .cfa extension. Choose Directories from the
Options menu on the Control window to change the default file location.
Note: For the Dashboard, when you capture to series of files, the window displays
the data from the beginning of the first capture, even when a new file in the series is
created. This is because the Dashboard is a "Session Monitor", which means that
even if you capture to a series of files, the data from the first file is always
displayed. The display does not refresh when a new capture file in a series is
created.
3. Watch the status bar on the Control window to monitor how full the file is. When the file is full, it
begins to wrap, which means the oldest data will be overwritten by new data.
Frontline BPA low energy Hardware & Software User Manual 31

TELEDYNE LECROY Chapter 4 Capturing and Analyzing Data
4.
Click the Stop Capture icon to temporarily stop data capture. Click the Start Capture icon again
to resume capture. Stopping capture means no data will be added to the capture file until capture is
resumed, but the previously captured data remains in the file.
5.
To clear captured data, click the Clear icon .
l If you select Clear after selecting Stop Capture, a dialog appears asking whether you want to
save the data.
o
You can click Save File and enter a file name when prompted .
o
If you choose Do Not Save, all data will be cleared.
o
If you choose Cancel, the dialog closes with no changes.
l If you select the Clear icon while a capture is occurring:
o
The capture stops.
o
A dialog appears asking if you want to save the capture
o
You can select Yes and save the capture or select No and close the dialog. In either case, the
existing capture file is cleared and a new capture file is started.
o
If you choose Cancel, the dialog closes with no changes.
To see how to capture to a single file, choose System Settings from the Options menu on the Control window.
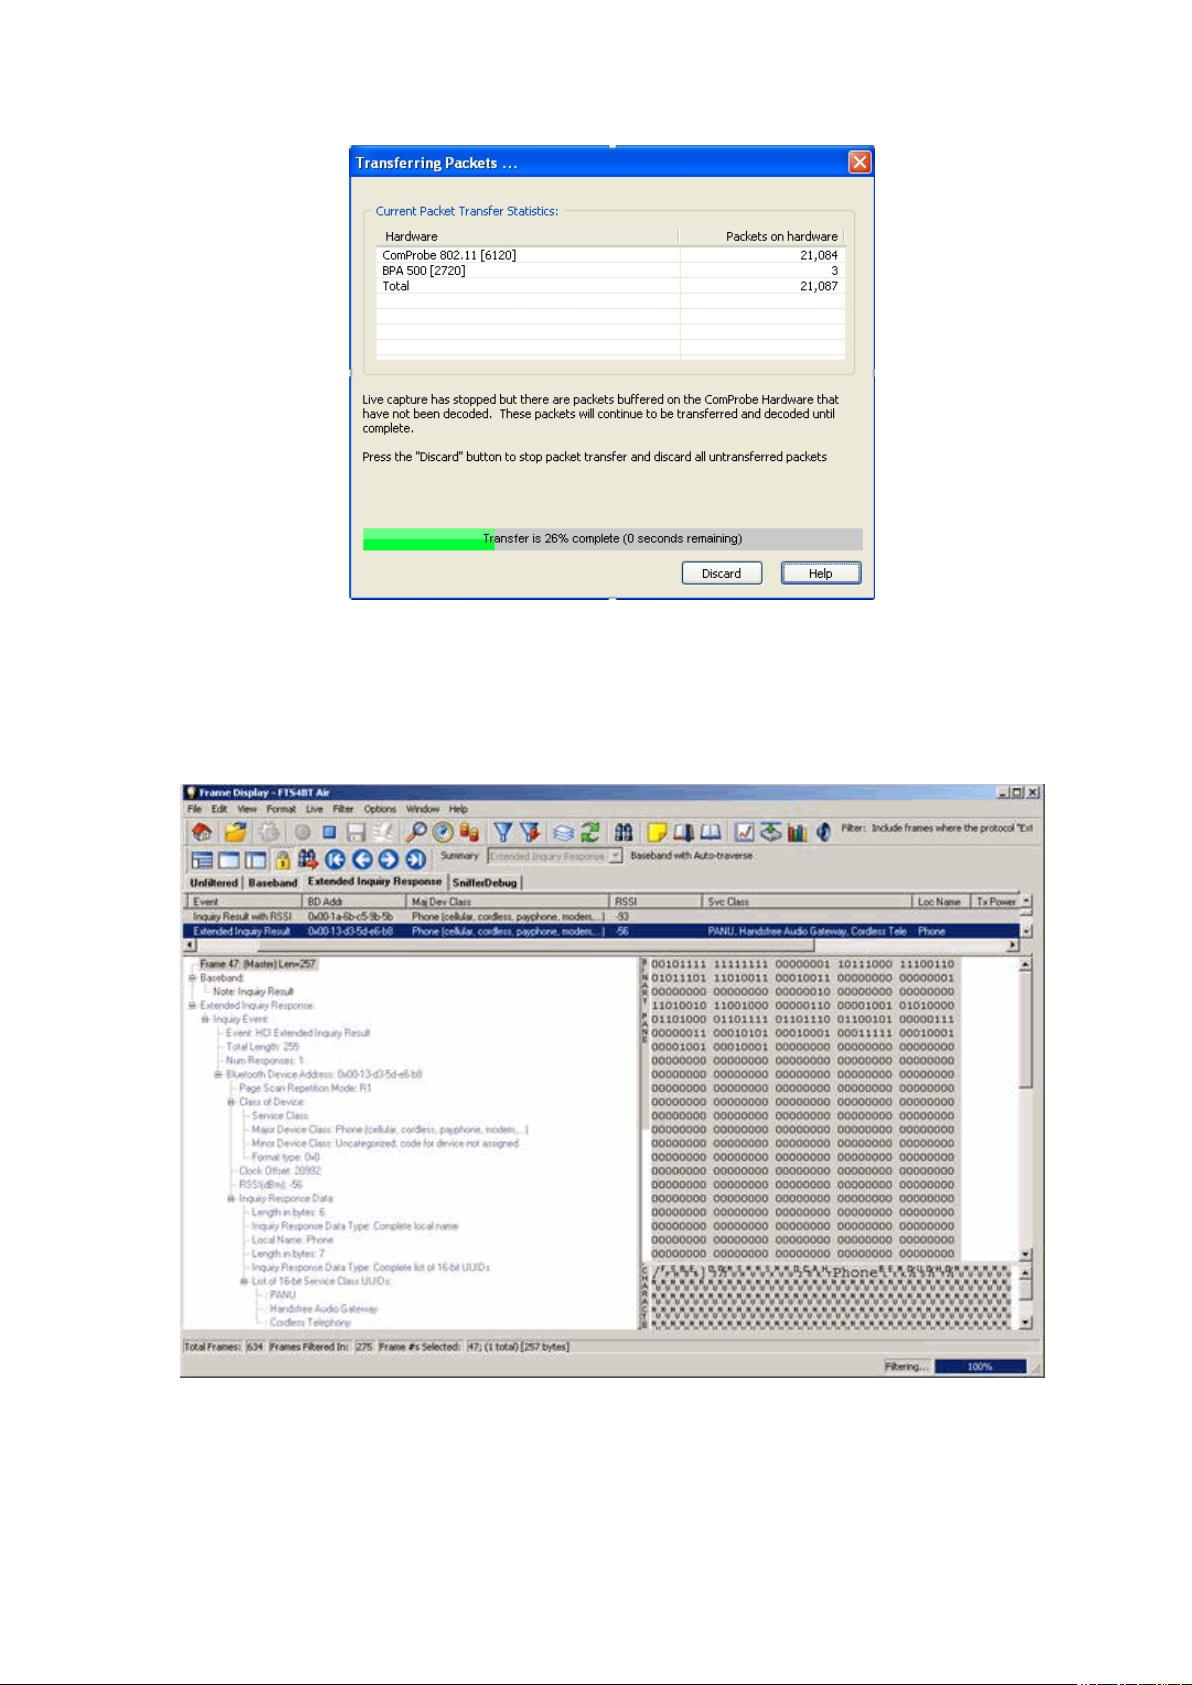
When live capture stops, no new packets are sniffed but there can still be packets that were previously
sniffed but not yet read by the ComProbe analyzer. This happens when packets are being sniffed faster than
the ComProbe analyzer can process them. These packets are stored either on the ComProbe hardware itself
or in a file on the PC. If there are remaining packets to be processed when live capture stops the
Transferring Packets dialog below is displayed showing the packets yet to be read by the ComProbe
analyzer. The dialog shows the name of each ComProbe hardware device, its process id in square brackets,
and the number of packets remaining. These stored packets are read until they’re exhausted or the user
clicks the Discard button on the dialog.
Unlike 802.11, Bluetooth packets never come in faster than the datasource can process them. However,
Bluetooth packets must still be stored so that they can be read in chronological order with the 802.11 packets.
32 Frontline BPA low energy Hardware & Software User Manual
Chapter 4 Capturing and Analyzing Data TELEDYNE LECROY
Figure 4.3 - Packet Transfer Dialog
4.1.3 Extended Inquiry Response
Extended Inquiry Response (EIR) is a tab that appears automatically on the Frame Display window
when you capture data.
Figure 4.4 - Frame Display Extended Inquire Response
EIR displays extensive information about the Bluetooth® devices that are discovered as data is being captured.
EIR provides more information during the inquiry procedure to allow better filtering of devices before
Frontline BPA low energy Hardware & Software User Manual 33

TELEDYNE LECROY Chapter 4 Capturing and Analyzing Data
connection; and sniff subrating, which reduces the power consumption in low-power mode.Before the EIR
tab was created, this type of information was not available until a connection was made to a device.
Therefore, EIR can be used to determine whether a connection can/should be made to a device prior to
making the connection.
Note: If a Bluetooth device does not support Extended Inquiry Response, the tab
displays Received Signal Strength Indication (RSSI) data, which is less extensive
than EIR data.
4.2 Protocol Stacks
4.2.1 Protocol Stack Wizard
The Protocol Stack wizard is where you define the
protocol stack you want the analyzer to use when
decoding frames.
To start the wizard:
1. Choose Protocol Stack from the Options
menu on the Control window or click the
Protocol Stack icon on the Frame
Display.
2. Select a protocol stack from the list, and
click Finish.
Most stacks are pre-defined here. If you have
special requirements and need to set up a custom
stack, see Creating and Removing a Custom Stack
on page 35.
1. If you select a custom stack (i.e. one that was defined by a user and not included with the analyzer),
the Remove Selected Item From List button becomes active.
2. Click the Remove Selected Item From Listbutton to remove the stack from the list. You cannot
remove stacks provided with the analyzer. If you remove a custom stack, you need to define it again in
order to get it back.
If you are changing the protocol stack for a capture file, you may need to reframe. See Reframing on page 36
for more information.
You cannot select a stack or change an existing one for a capture file loaded into the Capture File Viewer (the
Capture File Viewer is used only for viewing capture files and cannot capture data). Protocol Stack changes
can only be made from a live session.
34 Frontline BPA low energy Hardware & Software User Manual

Chapter 4 Capturing and Analyzing Data TELEDYNE LECROY
4.2.2 Creating and Removing a Custom Stack
To create a custom stack:
1. Choose Protocol Stack from the
Options menu on the Control
window or click the Protocol Stack
icon on the Frame Display
toolbar.
2. Select Build Your Own from the
list and click Next.
3. The system displays an information
screen that may help you decide if
you need to define your own
custom stack. Defining a custom
stack means that the analyzer uses
the stack for every frame. Frames
that do not conform to the stack
are decoded incorrectly. Click
Next to continue.
Select Protocols
1. Select a protocol from the list on
the left.
2. Click the right arrow button to
move it to the Protocol Decode
Stack box on the right, or doubleclick the protocol to move it to the
right.
3. To remove a protocol from the
stack, double-click it or select it
and click the left arrow button.
4. If you need to change the order of the protocols in the stack, select the protocol you want to move,
and click on the Move Up and Move Down buttons until the protocol is in the correct position.
5. The lowest layer protocol is at the top of the list, with higher layer protocols listed underneath.
Auto-traversal (Have the analyzer Determine Higher Layers)
If you need to define just a few layers of the protocol stack, and the remaining layers can be determined
based on the lower layers:
1. Click the All additional stack layers can be determined automatically button.
2. If your protocol stack is complete and there are no additional layers, click the There are no
additional stack layers button.
3. If you select this option, the analyzer uses the stack you defined for every frame. Frames that do use
this stack are decoded incorrectly.
Frontline BPA low energy Hardware & Software User Manual 35

TELEDYNE LECROY Chapter 4 Capturing and Analyzing Data
Save the Stack
1. Click the Add To Predefined List button.
2. Give the stack a name, and click Add.
In the future, the stack appears in the Protocol Stack List on the first screen of the Protocol Stack wizard.
Remove a Stack
1. Select it in the first screen and click Remove Selected Item From List.
2. If you remove the stack, you must to recreate it if you need to use it again.
Note: If you do not save your custom stack, it does appear in the predefined list, but
applies to the frames in the current session. However, it is discarded at the end of the
session.
4.2.3 Reframing
If you need to change the protocol stack used to interpret a capture file and the framing is different in the
new stack, you need to reframe in order for the protocol decode to be correct. You can also use Reframe to
frame unframed data. The original capture file is not altered during this process.
Note: You cannot reframe from the Capture File Viewer .
To reframe your data, load your capture file, select a protocol stack, and then select Reframe from the File
menu on the Control window. Reframe is only available if the frame recognizer used to capture the data is
different from the current frame recognizer.
In addition to choosing to Reframe, you can also be prompted to Reframe by the Protocol Stack Wizard.
1. Load your capture file by choosing Open from the File menu on the Control window, and select the
file to load.
2. Select the protocol stack by choosing Protocol Stack from the Options menu on the Control
window, select the desired stack and click Finish.
3. If you selected a protocol stack that includes a frame recognizer different from the one used to
capture your data, the Protocol Stack Wizard asks you if you want to reframe your data. Choose
Yes.
4. The analyzer adds frame markers to your data, puts the framed data into a new file, and opens the
new file. The original capture file is not altered.
See Unframing on page 36for instructions on removing framing from data.
4.2.4 Unframing
This function removes start-of-frame and end-of-frame markers from your data. The original capture file is
not altered during this process. You cannot unframe from the Capture File Viewer (accessed by selecting
Capture File Viewer or Load Capture File to start the software and used only for viewing capture files).
36 Frontline BPA low energy Hardware & Software User Manual

Chapter 4 Capturing and Analyzing Data TELEDYNE LECROY
To manually unframe your data:
1. Select Unframe from the File menu on the Control window. Unframe is only available if a
protocol stack was used to capture the data and there is currently no protocol stack selected.
In addition to choosing to Unframe, you can also be prompted to Unframe by the Protocol Stack Wizard.
1. Load your capture file by choosing Open from the File menu on the Control window.
2. Select the file to load.
3. Choose Protocol Stack from the Options menu on the Control window
4. Select None from the list
5. Click Finish. The Protocol Stack Wizard asks you if you want to unframe your data and put it into a
new file.
6. Choose Yes.
The system removes the frame markers from your data, puts the unframed data into a new file, and opens
the new file. The original capture file is not altered.
See Reframing on page 36 for instructions on framing unframed data.
4.2.5 How the Analyzer Auto-traverses the Protocol Stack
In the course of doing service discovery, devices ask for and receive a Protocol Descriptor List defining which
protocol stacks the device supports. It also includes information on which PSM to use in L2CAP, or the channel
number for RFCOMM, or the port number for TCP or UDP. The description below talks about how the
analyzer auto-traverses from L2CAP using a dynamically assigned PSM, but the principle is the same for
RFCOMM channel numbers and TCP/UDP port numbers.
The analyzer looks for SDP Service Attribute Responses or Service Search Attribute Responses carrying
protocol descriptor lists. If the analyzer sees L2CAP listed with a PSM, it stores the PSM and the UUID for the
next protocol in the list.
After the SDP session is over, the analyzer looks at the PSM in the L2CAP Connect frames that follow. If the
PSM matches one the analyzer has stored, the analyzer stores the source channel ID and destination channel
ID, and associates those channel IDs with the PSM and UUID for the next protocol. Thereafter, when the
analyzer sees L2CAP frames using those channel IDs, it can look them up in its table and know what the next
protocol is.
In order for the analyzer to be able to auto-traverse using a dynamically assigned PSM, it has to have seen the
SDP session giving the Protocol Descriptor Lists, and the subsequent L2CAP connection using the PSM and
identifying the source and channel IDs. If the analyzer misses any of this process, it is not able to auto-traverse.
It stops decoding at the L2CAP layer.
For L2CAP frames carrying a known PSM (0x0001 for SDP, for example, or 0x0003 for RFCOMM), the analyzer
looks for Connect frames and stores the PSM along with the associated source and destination channel IDs. In
this case the analyzer does not need to see the SDP process, but does need to see the L2CAP connection
process, giving the source and destination channel IDs.
4.2.6 Providing Context For Decoding When Frame Information Is Missing
There may be times when you need to provide information to the analyzer because the context for decoding
a frame is missing. For example, if the analyzer captured a response frame, but did not capture the command
frame indicating the command.
Frontline BPA low energy Hardware & Software User Manual 37

TELEDYNE LECROY Chapter 4 Capturing and Analyzing Data
The analyzer provides a way for you to supply the context for any frame, provided the decoder supports it.
(The decoder writer has to include support for this feature in the decoder, so not all decoders support it.
Note that not all decoders require this feature.)
If the decoder supports user-provided context, three items are active on the Options menu of the Control
window and the Frame Display window. These items are Set Initial Decoder Parameters,
Automatically Request Missing Decoding Information, and Set Subsequent Decoder Parameters.
(These items are not present if no decoder is loaded that supports this feature.)
Set Initial Decoder Parameters is used to provide required information to decoders that is not context
dependent but instead tends to be system options for the protocol.
Choose Set Initial Decoder Parameters in order to provide initial context to the analyzer for a decoder. A
dialog appears that shows the data for which you can provide information.
If you need to change this information for a particular frame :
1. Right-click on the frame in the Frame Display window
2. Choose Provide <context name>.
Alternatively, you can choose Set Subsequent Decoder Parameter from the Options menu.
3. This option brings up a dialog showing all the places where context data was overridden.
4. If you know that information is missing, you can't provide it, and you don't want to see dialogs asking
for it, un-check Automatically Request Missing Decoding Information.
5. When unchecked, the analyzer doesn't bother you with dialogs asking for frame information that you
don't have. In this situation, the analyzer decodes each frame until it cannot go further and then simply
stop decoding.
4.3 Analyzing Protocol Decodes
4.3.1 The Frame Display
To open this window
Click the Frame Display icon on the Control window toolbar, or select Frame Display from the
View menu.
38 Frontline BPA low energy Hardware & Software User Manual

Chapter 4 Capturing and Analyzing Data TELEDYNE LECROY
Figure 4.5 - Frame Display with all panes active
Frame Display Panes
The Frame Display window is used to view all frame related information. It is composed of a number of
different sections or "panes", where each pane shows a different type of information about a frame.
l Summary Pane - The Summary Pane displays a one line summary of each frame for every protocol
found in the data, and can be sorted by field for every protocol. Click here for an explanation of the
symbols next to the frame numbers.
l Decode Pane - The Decode Pane displays a detailed decode of the highlighted frame. Fields selected in
the Decode Pane have the appropriate bit(s) or byte(s) selected in the Radix, Binary, Character , and
Event panes
l Radix Pane - The Radix Pane displays the logical data bytes in the selected frame in either hexadecimal,
decimal or octal.
l Binary Pane - The Binary Pane displays a binary representation of the logical data bytes.
Frontline BPA low energy Hardware & Software User Manual 39

TELEDYNE LECROY Chapter 4 Capturing and Analyzing Data
l Character Pane - The Character Pane displays the character representation of the logical data bytes in
either ASCII, EBCDIC or Baudot.
l Event Pane - The Event Pane displays the physical data bytes in the frame, as received on the network.
By default, all panes except the Event Pane are displayed when the Frame Display is first opened.
Protocol Tabs
Protocol filter tabs are displayed in the Frame Display above the Summary pane.
l These tabs are arranged in separate color-
coded groups. These groups and their
colors are General (white), Classic
Bluetooth (blue), Bluetooth low energy
(green), 802.11 (orange), USB (purple),
NFC (brown) and SD (teal). The General
group applies to all technologies. The
other groups are technology-specific.
l Clicking on a protocol filter tab in the General group filters in all packets containing that protocol
regardless of each packet’s technology.
l Clicking on a protocol filter tab in a technology-specific group filters in all packets containing that protocol
on that technology.
l A protocol filter tab appears in the General group only if the protocol occurs in more than one of the
technology-specific tab groups. For example, if L2CAP occurs in both Classic Bluetooth and Bluetooth low
energy , there will be L2CAP tabs in the General group, the Classic Bluetooth group, and the Bluetooth
low energy group.
Select the Unfiltered tab to display all packets.
There are several special tabs that appear in the Summary Pane when certain conditions are met. These
tabs appear only in the General group and apply to all technologies. The tabs are:
l Bookmarks appear when a bookmark is first seen.
l Errors appear when an error is first seen. An error is a physical error in a data byte or an error in the
protocol decode.
l Info appears when a frame containing an Information field is first seen.
The tabs disappear when the capture buffer is cleared during live capture or when decoders are reloaded,
even if one of the tabs is currently selected. They subsequently reappear as the corresponding events are
detected.
Comparing Frames
If you need to compare frames, you can open additional Frame Display windows by clicking on the
Duplicate View icon . You can have as many Frame Display windows open at a time as you wish.
Frame Wrapping and Display
In order to assure that the data you are seeing in Frame Display are current, the following messages appear
describing the state of the data as it is being captured.
40 Frontline BPA low energy Hardware & Software User Manual

Chapter 4 Capturing and Analyzing Data TELEDYNE LECROY
l All Frame Display panes except the Summary pane display "No frame selected" when the selected
frame is in the buffer (i.e. not wrapped out) but not accessible in the Summary pane. This can happen
when a tab is selected that doesn’t filter in the selected frame.
l When the selected frame wraps out (regardless of whether it was accessible in the Summary pane) all
Frame Display panes except the Summary pane display "Frame wrapped out of buffer".
l When the selected frame is still being captured, all Frame Display panes except the Summary pane
display "Frame incomplete".
4.3.1.1 Frame Display Toolbar
The buttons that appear in the Frame Display window vary according to the particular configuration of the
analyzer. For controls not available the icons will be grayed-out.
Table 4.1 - Frame Display Toolbar Icons
Icon Description
Control – Brings the Control window to
the front.
Open File - Opens a capture file.
I/O Settings - Opens the I/O Settings
dialog.
Start Capture - Begins data capture to a
user designated file.
Stop Capture - Closes a capture file and
stops data capture to disk.
Save - Save the currently selected bytes
or the entire buffer to file.
Clear- Discards the temporary file and
clears the display.
Event Display – Brings the Event Display
window to the front.
Show Message Sequence Chart Message Sequence Chart (MSC)
displays information about the messages
passed between protocol layers.
Duplicate View - Creates a second Frame
Display window identical to the first.
Apply/Modify Display Filters - Opens the
Display Filter dialog.
Quick Protocol Filter - brings up a dialog
box where you can filter or hide one or
more protocol layers.
Frontline BPA low energy Hardware & Software User Manual 41

TELEDYNE LECROY Chapter 4 Capturing and Analyzing Data
Table 4.1 - Frame Display Toolbar Icons(continued)
Icon Description
Protocol Stack - brings up the Protocol
Stack Wizard where you can change the
stack used to decode framed data
Reload Decoders - When Reload
Decoders is clicked, the plug-ins are
reset and received frames are redecoded. For example, If the first frame
occurs more than 10 minutes in the past,
the 10-minute utilization graph stays
blank until a frame from 10 minutes ago or
less is decoded.
Find - Search for errors, string patterns,
special events and more.
Display Capture Notes - Brings up the
Capture Notes window where you can
view or add notes to the capture file.
Add/Modify Bookmark - Add a new or
modify an existing bookmark.
Display All Bookmarks - Shows all
bookmarks and lets you move between
bookmarks.
low energy Timeline- Opens the low
energy Timeline
Bluetooth low energy Packet Error Rate
Statistics Opens the Packet Error Rate
Statistics display
Bluetooth Classic Packet Error Rate
Statistics - Opens the Packet Error Rate
Statistics display.
Reload Decoders - When Reload Decoders is clicked, the plug-ins are reset
and received frames are re-decoded. For example, If the first frame occurs
more than 10 minutes in the past, the 10-minute utilization graph stays blank
until a frame from 10 minutes ago or less is decoded.
Filter: Text giving the filter currently in
use. If no filter is being used, the text
reads "All Frames" which means that
nothing is filtered out. To see the text of
the entire filter, place the cursor over the
text and a ToolTip pops up with the full
text of the filter.
The following icons all change how the panes are arranged on the Frame
Display. Additional layouts are listed in the View menu.
42 Frontline BPA low energy Hardware & Software User Manual

Chapter 4 Capturing and Analyzing Data TELEDYNE LECROY
Table 4.1 - Frame Display Toolbar Icons(continued)
Icon Description
Show Default Panes - Returns the panes
to their default settings.
Show Only Summary Pane - Displays
only the Summary pane.
Shall All Panes Except Event Pane Makes the Decode pane taller and the
Summary pane narrower.
Toggle Display Lock - Prevents the
display from updating.
Go To Frame
First Frame - Moves to the first frame in
the buffer.
Previous Frame - Moves to the previous
frame in the buffer.
Next Frame - Moves to the next frame in
the buffer.
Last Frame - Moves to the last frame in
the buffer.
Find on Frame Display only searches the
Decode Pane for a value you enter in the
text box.
Find Previous Occurrence - Moves to the
previous occurrence of the value in the
Frame Display Find.
Find Next Occurrence - Moves to the next
occurrence of the value in the Frame
Display Find.
Cancel Current Search - Stops the
current Frame Display Find.
Frontline BPA low energy Hardware & Software User Manual 43

TELEDYNE LECROY Chapter 4 Capturing and Analyzing Data
Table 4.1 - Frame Display Toolbar Icons(continued)
Icon Description
Summary Drop Down Box: Lists all the
protocols found in the data in the file. This
box does not list all the protocol decoders
available to the analyzer, merely the
protocols found in the data. Selecting a
protocol from the list changes the
Summary pane to display summary
information for that protocol. When a low
energy predefined Named Filter (like
Nulls and Polls) is selected, the
Summary drop-down is disabled.
Text with Protocol Stack: To the right of the Summary Layer box is some text
giving the protocol stack currently in use.
Note: If the frames are sorted in other than ascending frame number order, the order of the
frames in the buffer is the sorted order. Therefore the last frame in the buffer may not have
the last frame number.
4.3.1.2 Frame Display Status Bar
The Frame Display Status bar appears at the bottom of the Frame Display. It contains the following
information:
l Frame #s Selected: Displays the frame number or numbers of selected (highlighted) frames, and the
total number of selected frames in parentheses
l Total Frames: The total number of frames in the capture buffer or capture file in real-time
l Frames Filtered In: The total number of frames displayed in the filtered results from user applied filters
in real-time
4.3.1.3 Hiding and Revealing Protocol Layers in the Frame Display
Hiding protocol layers refers to the ability to prevent a layer from being displayed on the Decode pane.
Hidden layers remain hidden for every frame where the layer is present, and can be revealed again at any
time. You can hide as many layers as you wish.
Note: Hiding from the Frame Display affects only the data shown in the Frame Display and not any
information in any other window.
There are two ways to hide a layer.
1. Right-click on the layer in the Decode pane, and choose Hide [protocol name] Layer In All
Frames.
44 Frontline BPA low energy Hardware & Software User Manual

Chapter 4 Capturing and Analyzing Data TELEDYNE LECROY
2. Click the Set Protocol Filtering button on the Summary pane toolbar. In the Protocols to Hide
box on the right, check the protocol layer(s) you want hidden. Click OK when finished.
To reveal a hidden protocol layer:
1. Right-click anywhere in the Decode pane
2. Choose Show [protocol name] Layer from the right-click menu, or click the Set Protocol Filtering
button and un-check the layer or layers you want revealed.
4.3.1.4 Physical vs. Logical Byte Display
The Event Display window and Event Pane in the Frame Display window show the . In other words,
they show the actual data as it appeared on the circuit. The Radix, Binary and Character panes in the Frame
Display window show the , or the resulting byte values after escape codes or other character altering codes
have been applied (a process called ).
As an example, bytes with a value of less than 0x20 (the 0x indicates a hexadecimal value) cannot be
transmitted in Async PPP. To get around this, a 0x7d is transmitted before the byte. The 0x7d says to take the
next byte and subtract 0x20 to obtain the true value. In this situation, the Event pane displays 0x7d 0x23,
while the Radix pane displays 0x03.
4.3.1.5 Sorting Frames
By default, frames are sorted in ascending numerical sequence by frame number. Click on a column header
in the Summary pane to sort the frames by that column. For example, to sort the frames by size, click on the
Frame Size column header.
An embossed triangle next to the header name indicates which column the frames are sorted by. The
direction of the triangle indicates whether the frames are in ascending or descending order, with up being
ascending.
Note that it may take some time to sort large numbers of frames.
4.3.1.6 Frame Display - Find
Frame Display has a simple Find function that you can use to search the Decode Pane for any alpha
numeric value. This functionality is in addition to the more robust Search/Find dialog.
Frame Display Find is located below the toolbar on the Frame Display dialog.
Figure 4.6 - Frame Display Find text entry field
Where the more powerful Search/Find functionality searches the Decode, Binary, Radix, and Character
panes on Frame Display using TImestamps, Special Events, Bookmarks, Patterns, etc.,
Frontline BPA low energy Hardware & Software User Manual 45

TELEDYNE LECROY Chapter 4 Capturing and Analyzing Data
Figure 4.7 - Search/Find Dialog
Find on Frame Display only searches the Decode Pane for a value you enter in the text box.
To use Find:
1. Select the frame where you want to begin the search.
2. Enter a value in the Find text box.
Note: The text box is disabled during a live capture.
Select Find Previous Occurrence to begin the search on frames prior to the frame you
3.
selected, or Find Next Occurrence to begin the search on frames following the frame you
selected.
The next occurrence of the value (if it is found) will be
highlighted in the Decode Pane.
4. Select Find Previous Occurrence or Find Next Occurrence
to continue the search.
There are several important concepts to remember with Find.
l When you enter a search string and select Enter, the search moves forward.
l If you select Find Previous Occurrence, when the search reaches the first frame it will then cycle to
the last frame and continue until it reaches the frame where the search began.
l Shift + F3 is a shortcut for Find Previous Occurrence.
46 Frontline BPA low energy Hardware & Software User Manual

Chapter 4 Capturing and Analyzing Data TELEDYNE LECROY
l If you select Find Next Occurrence, when the search reaches the last frame it will then cycle to the first
frame and continue until it reaches the frame where the search began.
l F3 is a shortcut for Find Next Occurrence.
l You cannot search while data is being captured.
l After a capture is completed, you cannot search until Frame Display has finished decoding the frames.
l Find is not case sensitive.
l The status of the search is
displayed at the bottom of the
dialog.
l The search occurs only on the
protocol layer selected.
l To search across all the protocols on the Frame Display, select the Unfiltered tab.
l A drop-down list displays the search values entered during the current
session of Frame Display.
l The search is cancelled when you select a different protocol tab during
a search.
l You can cancel the search at any time by selecting the Cancel Current
Search button.
4.3.1.7 Synchronizing the Event and Frame Displays
The Frame Display is synchronized with the Event Display. Click on a frame in the Frame Display and
the corresponding bytes is highlighted in the Event Display. Each Frame Display has its own Event
Display.
As an example, here's what happens if the following sequence of events occurs.
1.
Click on the Frame Display icon in Control window toolbar to open the Frame Display.
2.
Click on the Duplicate View icon to create Frame Display #2.
3.
Click on Event Display icon in Frame Display #2. Event Display #2 opens. This Event
Display is labeled #2, even though there is no original Event Display, to indicate that it is
synchronized with Frame Display #2.
4. Click on a frame in Frame Display #2. The corresponding bytes are highlighted in Event Display
#2.
5. Click on a frame in the original Frame Display. Event Display #2 does not change.
4.3.1.8 Working with Multiple Frame Displays
Multiple Frame Displays are useful for comparing two frames side by side. They are also useful for comparing
all frames against a filtered subset or two filtered subsets against each other.
Frontline BPA low energy Hardware & Software User Manual 47

TELEDYNE LECROY Chapter 4 Capturing and Analyzing Data
l
To create a second Frame Display, click the Duplicate View icon on the Frame Display toolbar.
This creates another Frame Display window. You can have as many Frame Displays open as you
wish. Each Frame Display is given a number in the title bar to distinguish it from the others.
l
To navigate between multiple Frame Displays, click on the Frame Display icon in the Control
window toolbar.
A drop-down list appears, listing all the currently open Frame Displays.
l Select the one you want from the list and it comes to the front.
Note: When you create a filter in one Frame Display, that filter does not automatically
appear in the other Frame Display. You must use the Hide/Reveal feature to display a
filter created in one Frame Display in another.
Note: When you have multiple Frame Display windows open and you are capturing data,
you may receive an error message declaring that "Filtering cannot be done while receiving
data this fast." If this occurs, you may have to stop filtering until the data is captured.
4.3.1.9 Working with Panes on Frame Display
When the Frame Display first opens, all panes are displayed except the Event pane (To view all the panes,
select Show All Panes from the View menu).
l
The Toggle Expand Decode Pane icon makes the decode pane longer to view lengthy decodes
better.
l
The Show Default Panes icon returns the Frame Display to its default settings.
l
The Show only Summary Pane icon displays on the Summary Pane.
To close a pane, right-click on the pane and select Hide This Pane from the pop-up menu, or de-select
Show [Pane Name] from the View menu.
To open a pane, right-click on the any pane and select Show Hidden Panes from the pop-up menu and
select the pane from the fly-out menu, or select Show [Pane Name] from the View menu.
To re-size a pane, place the cursor over the pane border until a double-arrow cursor appears. Click and drag
on the pane border to re-size the pane.
4.3.1.10 Frame Display - Byte Export
The captured frames can be exported as raw bytes to a text file.
48 Frontline BPA low energy Hardware & Software User Manual

Chapter 4 Capturing and Analyzing Data TELEDYNE LECROY
1. From the Frame Display File menu select Byte Export....
Figure 4.8 - Frame Display File menu, Byte Export
2. From the Byte Export window specify the frames to export.
l All Frames exports all filtered-in frames including those scrolled off the Summary pane. Filtered-
in frames are dependent on the selected Filter tab above the Summary pane. Filtered-out
frames are not exported.
l Selected Frames export is the same as All Frames export except that only frames selected in the
Summary pane will be exported.
Figure 4.9 - Byte Export dialog
Click the OK button to save the export. Clicking the Cancel button will exit Byte Export.
3. The Save As dialog will open. Select a directory location and enter a file name for the exported
frames file.
Frontline BPA low energy Hardware & Software User Manual 49

TELEDYNE LECROY Chapter 4 Capturing and Analyzing Data
Figure 4.10 - Save As dialog
Click on the Save button.
The exported frames are in a text file that can be opened in any standard text editing application. The header
shows the export type, the capture file name, the selected filter tab, and the number of frames. The body
shows the frame number, the timestamp in the same format shown in the Frame Display Summary pane,
and the frame contents as raw bytes.
Figure 4.11 - Sample Exported Frames Text File
4.3.1.11 Panes in the Frame Display
4.3.1.11.1 Summary Pane
The Summary pane displays a one-line summary of every frame in a capture buffer or file, including
frame number, timestamp, length and basic protocol information. The protocol information included for each
frame depends on the protocol selected in the summary layer box (located directly below the main toolbar).
On a two-channel circuit, the background color of the one-line summary indicates whether the frame came
from the DTE or the DCE device. Frames with a white background come from the DTE device, frames with a
gray background come from the DCE device.
Frame numbers in red indicate errors, either physical (byte-level) or frame errors. If the error is a frame
error in the displayed protocol layer, the bytes where the error occurred is displayed in red. The Decode
Pane gives precise information as to the type of error and where it occurred.
The Summary pane is synchronized with the other panes in this window. Click on a frame in the Summary
pane, and the bytes for that frame is highlighted in the Event pane while the Decode pane displays the full
decode for that frame. Any other panes which are being viewed are updated accordingly. If you use one pane
to select a subset of the frame, then only that subset of the frame is highlighted in the other panes.
50 Frontline BPA low energy Hardware & Software User Manual

Chapter 4 Capturing and Analyzing Data TELEDYNE LECROY
Protocol Tabs
Protocol filter tabs are displayed in the Frame Display above the Summary pane.
l These tabs are arranged in separate color-coded groups. These groups and their colors are General
(white), Classic Bluetooth (blue), Bluetooth low energy (green), 802.11 (orange), USB (purple), and SD
(brown). The General group applies to all technologies. The other groups are technology-specific.
Figure 4.12 - Example Protocol Tags
l Clicking on a protocol filter tab in the General group filters in all packets containing that protocol
regardless of each packet’s technology.
l Clicking on a protocol filter tab in a technology-specific group filters in all packets containing that protocol
on that technology.
l A protocol filter tab appears in the General group only if the protocol occurs in more than one of the
technology-specific tab groups. For example, if L2CAP occurs in both Classic Bluetooth and Bluetooth low
energy , there will be L2CAP tabs in the General group, the Classic Bluetooth group, and the Bluetooth low
energy group.
Select the Unfiltered tab to display all packets.
There are several special tabs that appear in the Summary pane when certain conditions are met. These
tabs appear only in the General group and apply to all technologies. The tabs are:
l Bookmarks appear when a bookmark is first seen.
l Errors appear when an error is first seen. An error is a physical error in a data byte or an error in the
protocol decode.
l Info appears when a frame containing an Information field is first seen.
The tabs disappear when the capture buffer is cleared during live capture or when decoders are reloaded,
even if one of the tabs is currently selected. They subsequently reappear as the corresponding events are
detected.
The tabs disappear when the capture buffer is cleared during live capture or when decoders are reloaded,
even if one of the tabs is currently selected. They subsequently reappear as the corresponding events are
detected.
Use the navigation icons, keyboard or mouse to move through the frames. The icons and move
you to the first and last frames in the buffer, respectively. Use the Go To icon to move to a specific
frame number.
Placing the mouse pointer on a summary pane header with truncated text displays a tooltip showing the full
header text.
Frontline BPA low energy Hardware & Software User Manual 51

TELEDYNE LECROY Chapter 4 Capturing and Analyzing Data
Figure 4.13 - Summary pane (right) with Tooltip on Column 5 (Tran ID)
Sides in Bluetooth low energy
A Bluetooth low energy data connection consists of connection events, which are a series of transmissions on
the same channel. In each connection event the master transmits first, then the slave, and then the devices
take turns until the connection event is finished.
When the data connection is encrypted and the packets are successfully decrypted, the sniffer can determine
exactly who sent which packet (only non-empty, encrypted packets – empty packets are never encrypted).
These packets are labeled either ‘M’ for master or ‘S’ for slave.
When the data connection is unencrypted or when encrypted packets are not successfully decrypted by the
sniffer, the sniffer cannot distinguish the two devices’ (master and slave) packets by their content, just by the
packet timing. In those cases we label each device as side ‘1’ or ‘2’, not as master or slave. In each connection
event, packets sent by the device which transmitted first in the connection event are labeled ‘1’, and packets
sent by the device which transmitted second are labeled ‘2’.
If no packets in the connection event are missed by the sniffer, the device labeled ‘1’ is the master and the
device labeled ‘2’ is the slave. However, if we do not capture the very first packet in a connection event (i.e.
the packet sent by the master) but do capture the packet sent by the slave, we label the slave as side ‘1’ since
it is the first device we heard in the connection event. Because there is potential clock drift since the last
connection event, we cannot use the absolute timing to correct this error; there would still be cases where
we get it wrong. Therefore we always assign ‘1’ to the first packet in a connection event. So even though it is
rare, there are connection events where packets sent by the slave device are labeled ‘1’ and packets sent by
the master are labeled ‘2’.
Finally, in a noisy environment it is also possible that the sniffer does not capture packets in the middle of a
connection event. If this occurs and the sniffer cannot determine the side for the remaining packets in that
connection event, the side is labeled ‘U’ for “unknown”.
4.3.1.11.2 Bluetooth low energy Data Encryption/Master and Slave
Assignment
A Bluetooth low energy data connection consists of connection events, which are a series of transmissions on
the same channel. In each connection event the master transmits first, then the slave, and then the devices
take turns until the connection event is finished.
When the data connection is encrypted and the packets are successfully decrypted, the sniffer can determine
exactly who sent which packet (only non-empty, encrypted packets – empty packets are never encrypted).
These packets are labeled either ‘M’ for master or ‘S’ for slave.
When the data connection is unencrypted or when encrypted packets are not successfully decrypted by the
sniffer, the sniffer cannot distinguish the two devices’ (master and slave) packets by their content, just by the
packet timing. In those cases we label each device as side ‘1’ or ‘2’, not as master or slave. In each
connection event, packets sent by the device which transmitted first in the connection event are labeled ‘1’,
and packets sent by the device which transmitted second are labeled ‘2’.
52 Frontline BPA low energy Hardware & Software User Manual

Chapter 4 Capturing and Analyzing Data TELEDYNE LECROY
If no packets in the connection event are missed by the sniffer, the device labeled ‘1’ is the master and the
device labeled ‘2’ is the slave. However, if we do not capture the very first packet in a connection event (i.e.
the packet sent by the master) but do capture the packet sent by the slave, we label the slave as side ‘1’ since
it is the first device we heard in the connection event. Because there is potential clock drift since the last
connection event, we cannot use the absolute timing to correct this error; there would still be cases where
we get it wrong. Therefore we always assign ‘1’ to the first packet in a connection event. So even though it is
rare, there are connection events where packets sent by the slave device are labeled ‘1’ and packets sent by
the master are labeled ‘2’.
Finally, in a noisy environment it is also possible that the sniffer does not capture packets in the middle of a
connection event. If this occurs and the sniffer cannot determine the side for the remaining packets in that
connection event, the side is labeled ‘U’ for “unknown”.
4.3.1.11.3 Bluetooth low energy Decryption Status
Occasionally you may have a packet with an event status of “received without errors,” but a decryption status
of “unable to decrypt.” There are three main causes for this, and in order of likelihood they are:
1. Wrong Long-Term Key – having the wrong long-term key will cause this error, so the first thing to
check is that your long term key is entered correctly in the datasource settings.
2. Dropped Packets – Too much interference with a ComProbe device will cause dropped packets and
may cause this error. As a rule of thumb, it is always a good idea to ensure the ComProbe device is
positioned away from sources of interference, and is placed in between the two devices being sniffed.
3. Faulty Device – although the chances of this are low, it is possible that a device is not encrypting
packets properly. This is likely to happen only if you are a firmware developer working on encryption.
4.3.1.11.4 Customizing Fields in the Summary Pane
You can modify the Summary Pane in Frame Display.
Summary pane columns can be reordered by dragging any column to a different position.
Fields from the Decode pane can be added to the summary pane by dragging any Decodepane field to the
desired location in the summary pane header. If the new field is from a different layer than the summary
pane a plus sign (+) is prepended to the field name and the layer name is added in parentheses. The same
field can be added more than once if desired, thus making it possible to put the same field at the front and
back (for example) of a long header line so that the field is visible regardless of where the header is scrolled
to.
An added field can be removed from the Summary pane by selecting Remove New Column from the
right-click menu.
The default column layout (both membership and order) can be restored by selecting Restore Default
Columns from the Format or right-click menus.
Changing Column Widths
To change the width of a column:
1. Place the cursor over the right column divider until the cursor changes to a solid double arrow.
2. Click and drag the divider to the desired width.
3. To auto-size the columns, double-click on the column dividers.
Hiding Columns
To hide a column:
Frontline BPA low energy Hardware & Software User Manual 53

TELEDYNE LECROY Chapter 4 Capturing and Analyzing Data
1. Drag the right divider of the column all the way to the left.
2. The cursor changes to a split double arrow when a hidden column is present.
3. To show the hidden column, place the cursor over the divider until it changes to a split double arrow,
then click and drag the cursor to the right.
4. The Frame Size, Timestamp, and Delta columns can be hidden by right-clicking on the header and
selecting Show Frame Size Column, Show Timestamp Column, or Show Delta Column.
Follow the same procedure to display the columns again.
Moving Columns - Changing Column Order
To move a column :
1. Click and hold on the column header
2. Drag the mouse over the header row.
3. A small white triangle indicates where the column is moved to.
4. When the triangle is in the desired location, release the mouse.
Restoring Default Column Settings
To restore columns to their default locations, their default widths, and show any hidden columns
1. Right-click on any column header and choose Restore Default Column Widths, or select Restore
Default Column Widths from the Format menu.
4.3.1.11.5 Frame Symbols in the Summary Pane
Table 4.2 - Frame Symbols
Symbol Description
A green dot means the frame was decoded successfully, and the protocol listed in the Summary
Layer drop-down box exists in the frame. No dot means the frame was decoded successfully, but
the protocol listed in the Summary Layer drop-down box does not exist in the frame.
A green circle means the frame was not fully decoded. There are several reasons why this might
happen.
l One reason is that the frame compiler hasn't caught up to that frame yet. It takes some time
for the analyzer to compile and decode frames. Frame compilation also has a lower priority
than other tasks, such as capturing data. If the analyzer is busy capturing data, frame
compilation may fall behind. When the analyzer catches up, the green circle changes to either
a green dot or no dot.
l Another reason is if some data in the frame is context dependent and we don't have the
context. An example is a compressed header where the first frame gives the complete
header, and subsequent frames just give information on what has changed. If the analyzer
does not capture the first frame with the complete header, it cannot decode subsequent
frames with partial header information.
A magenta triangle indicates that a bookmark is associated with this frame. Any comments
associated with the bookmark appear in the column next to the bookmark symbol.
4.3.1.11.6 Decode Pane
The Decode pane (aka detail pane) is a post-process display that provides a detailed decode of each
frame transaction (sometimes referred to as a frame). The decode is presented in a layered format that can
54 Frontline BPA low energy Hardware & Software User Manual

Chapter 4 Capturing and Analyzing Data TELEDYNE LECROY
be expanded and collapsed depending on which layer or layers you are most interested in. Click on the plus
sign to expand a layer. The plus sign changes to a minus sign. Click on the minus sign to collapse a layer. Select
Show All or Show Layers from the Format menu to expand or collapse all the layers. Layers retain their
expanded or collapsed state between frames.
Protocol layers can be hidden, preventing them from being
displayed on the Decode pane. Right-click on any protocol
layer and choose Hide [protocol name] from the right-click
menu.
Each protocol layer is represented by a color, which is used
to highlight the bytes that belong to that protocol layer in the
Event, Radix, Binary and Character panes. The colors are not assigned to a protocol, but are assigned to
the layer.
The Event, Radix, Binary, Character and Decode panes are all synchronized with one another. Clicking on
an element in any one of the panes highlights the corresponding element in all the other panes.
Click the Toggle Expand Decode Pane icon to make the Decode pane taller. This allows for more of
a lengthy decode to be viewed without needing to scroll.
4.3.1.11.7 Radix or Hexadecimal Pane
The Radix pane displays the logical bytes in the frame in
either hexadecimal, decimal or octal. The radix can be
changed from the Format menu, or by right-clicking on the
pane and choosing Hexadecimal, Decimal or Octal.
Because the Radix pane displays the logical bytes rather
than the physical bytes, the data in the Radix pane may be
different from that in the Event pane. See Physical vs.
Logical Byte Display for more information.
Colors are used to show which protocol layer each byte
belongs to. The colors correspond to the layers listed in the
Decode pane.
The Event, Radix, Binary, Character and Decode panes are all synchronized with one another. Clicking on an
element in any one of the panes highlights the corresponding element in all the other panes.
4.3.1.11.8 Character Pane
The Character pane represents the logical bytes in the
frame in ASCII, EBCDIC or Baudot. The character set
can be changed from the Format menu, or by rightclicking on the pane and choosing the appropriate
character set.
Because the Character pane displays the logical bytes
rather than the physical bytes, the data in the Character
pane may be different from that in the Event pane. See
Physical vs. Logical Byte Display for more information.
Colors are used to show which protocol layer each byte
belongs to. The colors correspond to the layers listed in
the Decode pane.
Frontline BPA low energy Hardware & Software User Manual 55

TELEDYNE LECROY Chapter 4 Capturing and Analyzing Data
The Event, Radix, Binary, Character and Decode panes are all synchronized with one another. Clicking on
an element in any one of the panes highlights the corresponding element in all the other panes.
4.3.1.11.9 Binary Pane
The Binary pane displays the logical bytes in the frame in binary.
Because the Binary pane displays the logical bytes rather than the physical bytes, the data in the Binary pane
may be different from that in the Event pane. See Physical vs. Logical Byte Display for more information.
Colors are used to show which protocol layer each byte belongs to. The colors correspond to the layers listed
in the Decode pane.
The Event, Radix, Binary, Character and Decode panes are all synchronized with one another. Clicking on
an element in any one of the panes highlights the corresponding element in all the other panes.
4.3.1.11.10 Event Pane
The Event pane shows the physical
bytes in the frame. You can choose
between displaying only the data
events or displaying all events by
clicking the All Events icon .
Displaying all events means that special
events, such as Start of Frame, End
of Frame and any signal change
events, are displayed as special
symbols within the data.
The status lines at the bottom of the pane give the same information as the status lines in the Event Display
window. This includes physical data errors, control signal changes (if appropriate), and timestamps.
Because the Event pane displays the physical bytes rather than the logical bytes, the data in the Event pane
may be different from that in the Radix, Binary and Character panes. See Physical vs. Logical Byte Display
for more information.
Colors are used to show which protocol layer each byte belongs to. The colors correspond to the layers listed
in the Decode pane.
The Event, Radix, Binary, Character and Decode panes are all synchronized with one another. Clicking
on an element in any one of the panes highlights the corresponding element in all the other panes.
4.3.1.11.11 Change Text Highlight Color
Whenever you select text in the Binary, Radix, or
Character panes in Frame Display, the text is
displayed with a highlight color. You can change the
color of the highlight.
1. Select Change Text Highlight Color from
the Options menu. You can also access the
option by right clicking in any of the panes.
2. Select a color from the drop-down menu.
3. Click OK.
The highlight color for the text is changed.
Select Cancel to discard any selection. Select Defaults to return the highlight color to blue.
56 Frontline BPA low energy Hardware & Software User Manual

Chapter 4 Capturing and Analyzing Data TELEDYNE LECROY
4.3.1.12 Protocol Layer Colors
4.3.1.12.1 Data Byte Color Notation
The color of the data in the panes specifies which layer of the protocol stack the data is from. All data from
the first layer is bright blue, the data from the second layer is green, the third layer is pink, etc. The protocol
name for each layer in the Decode pane is in the same color. Note that the colors refer to the layer, not to a
specific protocol. In some situations, a protocol may be in two different colors in two different frames,
depending on where it is in the stack. You can change the default colors for each layer.
Red is reserved for bytes or frames with errors. In the Summary pane, frame numbers in red mean there is
an error in the frame. Also, the Errors tab is displayed in red. This could be a physical error in a data byte or
an error in the protocol decode. Bytes in red in the Radix, Character, Binary and Event panes mean there
is a physical error associated with the byte.
4.3.1.12.2 Red Frame Numbers and Bytes
Red is reserved for bytes or frames with errors. In the Summary pane, frame numbers in red mean there is
an error in the frame. This could be a physical error in a data byte or an error in the protocol decode.
4.3.1.12.3 Changing Protocol Layer Colors
You can differentiate different protocol layers in the Decode, Event, Radix, Binary and Character panes.
1. Choose Select Protocol Layer Colors from the Options menu to change the colors used.
The colors for the different layers is displayed.
2. To change a color, click on the arrow next to each layer and select a new color.
3. Select OK to accept the color change and return to Frame Display.
Select Cancel to discard any selection. Select Defaults to return the highlight colors to the default settings.
Figure 4.14 - Frame Display Protocol Layer Color Selector
4.3.1.13 Filtering
Filtering allows the user to control the display which capture frames are displayed. Filters fall into two general
categories:
Frontline BPA low energy Hardware & Software User Manual 57

TELEDYNE LECROY Chapter 4 Capturing and Analyzing Data
1. Display filters allow a user to look at a subset of captured data without affecting the capture content.
Frames matching the filter criteria appear in the Frame Display; frames not matching the criteria
will not appear.
2. Connection filters Two options are available.
a. A Bluetooth connection: Displays only the frames associated with a Classic Bluetooth link or a
Bluetooth low energy access address. A new Frame Display will open showing only the
protocol tabs, frames, summary, and events associated with that particular Bluetooth
connection.
b. A specific wireless or wired technology. Displays all of the frames associated with:
l Classic Bluetooth
l Bluetooth low energy
l 802.11
l HCI
A new Frame Display will open showing only the protocol tabs, frames, summary and events
associated with the selected technology.
4.3.1.13.1 Display Filters
A display filter looks at frames that have already been captured. It looks at every frame in the capture buffer
and displays those that match the filter criteria. Frames that do not match the filter criteria are not displayed.
Display filters allow a user to look at a subset of captured data without affecting the capture content. There
are three general classes of display filters:
l Protocol Filters
l Named Filters
l Quick Filter
Protocol Filters
Protocol filters test for the existence of a specific single layer. The system creates a protocol filter for each
decoder that is loaded if that layer is encountered in a capture session.
There are also three special purpose filters that are treated as protocol filters:
l All Frames with Errors
l All Frames with Bookmarks
l All Special Information Nodes
Named Filters
l Named filters test for anything other than simple single layer existence. Named filters can be constructed
that test for the existence of multiple layers, field values in layers, frame sizes, etc., as well as
combinations of those things. Named filters are persistent across sessions.
l Named filters are user-defined. User-defined filters persist in a template file. User defined filters can be
deleted.
58 Frontline BPA low energy Hardware & Software User Manual

Chapter 4 Capturing and Analyzing Data TELEDYNE LECROY
Quick Filters
l Quick Filters are combinations of Protocol Filters and/or Named Filters that are displayed on the Quick
Filter tab.
l Quick Filters cannot be saved and do not persist across sessions.
l Quick Filters are created on the Quick Filter Dialog.
4.3.1.13.1.1 Creating a Display Filter
There are two steps to using a display filter. Define the filter conditions, and then apply the filter to the data
set. The system combines both filter definition and application in one dialog.
1.
Click the Display Filters icon on the Frame Display window or select Apply/Modify
Display Filters from the Filter menu to open the Set Condition dialog box. The Set Condition
dialog is self configuring which means that when you Select each frame under Conditions the
following displayed fields depend on your selection. With each subsequent selection the dialog fields
will change depending on you selection in that field.
Figure 4.15 - Example: Set Conditions Self Configuring Based on Protocol Selection
Figure 4.16 - Example: Set Conditions Self Configuring Based on Frame Range
2. Select Include or Exclude to add filtered data or keep out filtered data respectively.
3. Select the initial condition for the filter from the drop-down list.
4. Set the parameters for the selected condition in the fields provided. The fields that appear in the
dialog box are dependent upon the previous selection. Continue to enter the requested parameters in
the fields provided until the condition statement is complete.
Frontline BPA low energy Hardware & Software User Manual 59

TELEDYNE LECROY Chapter 4 Capturing and Analyzing Data
5. Click OK. The system displays the Save Named Condition dialog. Provide a name for the filter
condition or accept the default name provided by the system and click OK. Prohibited characters are
left bracket '[', right bracket ']' and equal sign '='. The Set Condition dialog box closes, creates a tab
on the Frame Display with the filter name, and applies the filter.
The filter also appears in the Quick Filtering and Hiding Protocols dialog.
When a display filter is applied, a description of the filter appears to the right of the toolbar in the Frame
Display windows.
Notes:
l The system requires naming and saving of all filters created by the user.
l The OK button on the Set Condition dialog box is unavailable (grayed out) until the condition selections
are complete.
l When you have multiple Frame Display windows with a display filter or filters, those filter do not
automatically appear in other Frame Display windows. You must use the Hide/Reveal feature to display
a filter created in one Frame Display in different Frame Display window.
4.3.1.13.1.2 Including and Excluding Radio Buttons
All filter dialog boxes contain an Include and an Exclude radio button. These buttons are mutually exclusive.
The Include/Exclude selection becomes part of the filter definition, and appears as part of the filter
description displayed to the right of the Toolbar.
Include: A filter constructed with the "Include" button selected, returns a data set that includes frames that
meet the conditions defined by the filter and omits frames that do not.
Exclude: A filter constructed with the "Exclude" button selected, returns a data set that excludes frames that
meet the conditions defined by the filter and consists of frames that do not.
4.3.1.13.1.3 Named Display Filters
You can create a unique display filter by selecting a data type on the Frame Display and using a right click
menu. When you create a Name Filter, it appears in the Quick Filtering dialog, where you can use it do
customize the data you see in the Frame Display panes.
1. Select a frame in the Frame Display Summary Pane.
2. Right click in the one of the data columns in the Summary Pane: CRC, NESN, DS, Packet Success,
Ethertype, Source Address, etc.
3. Select Filter in (data type) = . The Filtering
Results dialog appears.
4. Enter a name for the filter
5. Select OK.
The filter you just created appears in the Named Filters
section of the Quick Filtering dialog.
4.3.1.13.1.4 Using Compound Display
Filters
Compound filters use boolean logic to create complex and precise filters. There are three primary Boolean
logic operators: AND, OR, and NOT.
60 Frontline BPA low energy Hardware & Software User Manual

Chapter 4 Capturing and Analyzing Data TELEDYNE LECROY
The AND operator narrows the filter, the OR operator broadens the filter, and the NOT operator excludes
conditions from the filtered results. Include parentheses in a compound filter to nest condition sets within
larger condition sets, and force the filter-processing order.
There are two steps to using a compound filter. Define the filter conditions, and then apply the filter to the
data set. The analyzer combines both filter definition and application in one dialog.
1.
Click the Display Filters icon on the Frame Display window or select Apply/Modify
Display Filters… from the filter menu to open the Set Condition dialog box.
2. Click the Advanced button on the Set Condition dialog box.
3. Select Include or Exclude radio button.
Now you can set the conditions for the filter.
4. Select the initial condition for the filter from
the combo box at the bottom of the dialog for
Select each frame.
5. Set the parameters for the selected condition
in the fields provided. The fields that appear in
the dialog box are dependent upon the
previous selection. Continue to enter the
requested parameters in the fields provided
until the conditions statement is complete.
Figure 4.17 - Two Filter Conditions Added with an AND Operator
6.
Click the plus icon on the left side of the dialog box and repeat steps 4 and 5 for the next
condition. Use the up and down arrow icons on the left side of the dialog box to order your
conditions, and the delete button to delete conditions from your filter.
7. Continue adding conditions until your filter is complete.
8. Include parentheses as needed and set the boolean operators.
9. Click OK.
10. The system displays the Save Named Condition dialog. Provide a name for the filter condition or
accept the default name provided by the system and click OK.
Frontline BPA low energy Hardware & Software User Manual 61

TELEDYNE LECROY Chapter 4 Capturing and Analyzing Data
Figure 4.18 - Save Named Filter Condition Dialog
The Set Condition dialog box closes, creates a tab on the Frame Display with the filter name, and applies
the filter.
When a display filter is applied, a description of the
filter appears to the right of the toolbar in the
Frame Display windows.
Note: The OK button on the Set Condition dialog box is unavailable (grayed out) until the
condition selections are complete.
4.3.1.13.1.5 Defining Node and Conversation Filters
There are two steps to using Node and Conversation display filter. Define the filter conditions, and then apply
the filter to the data set. The analyzer combines both filter definition and application in one dialog.
1.
Click the Display Filters icon on the Frame Display window or select Apply/Modify
Display Filters… from the filter menu to open the Set Condition dialog box.
2. From the Select each frame combo box choose frames with the conversation as the initial
condition.
3. Select an address type—IP, MAC, TCP/UDB—from the Typecombo box (The address type selection
populates both Address combo boxes with node address in the data set that match the type selection).
4. Select a node address from the first Address combo box.
5. Choose a direction arrow from the direction box . The left arrow filters on all frames
where the top node address is the destination, the right arrow filters on all frames
where the top node address is the source, and the double arrow filters on all
frames where the top node address is either the source or the destination.
6. If you want to filter on just one node address, skip step 7 and continue with step 8.
7. If you want to filter on traffic going between two address nodes (i.e. a conversation), select a node
address from the second Address combo box..
8. Click OK. The Set Condition dialog box closes and the analyzer applies the filter.
When a display filter is applied, a description of the filter appears to the right of the toolbar in the Frame
Display windows.
Note: The OK button is unavailable (grayed out) until the condition selections are
complete.
62 Frontline BPA low energy Hardware & Software User Manual

Chapter 4 Capturing and Analyzing Data TELEDYNE LECROY
4.3.1.13.1.6 The Difference Between Deleting and Hiding Display Filters
If you wish to remove a filter from the system permanently, then use the Delete procedure. However, if all
you want to do is remove a filter as a means to un-clutter the display, then use the Hide procedure.
Deleting a saved filter removes the filter from the current session and all subsequent sessions. In order to
retrieve a deleted filter, the user must recreate it using the Set Conditions dialog.
Hiding a filter merely removes the filter from the display. A hidden filter can be reapplied using the
Show/Hide procedure.
Deleting Saved Display Filters
1. Select Delete Display Filters from the
Filter menu in the Frame Display
window to open the Delete Named
Condition dialog. The system displays the
Delete Named Condition dialog with a
list of all user defined filters.
2. Select the filter to be deleted from the list.
3. Click the Delete button.
4. Click OK. The Delete Named Condition
dialog box closes and the system deletes
the filter.
Hiding and Revealing Display Filters
If a display filter is showing the following steps will
hide that filter but will not delete it.
1.
Select Hide/Show Display
Filters… from the Filter menu on
the Frame Display window
to open the Hide/Show Filters
dialog. The system displays the
Hide/Show Filters dialog with a
list of all user defined filters.
2. Select the filter to be hidden from
the combo box.
3. Click the Hide button. The Hide button is only showing if the selected filter is currently showing in the
Frame Display.
4. Click OK. The Hide/Show Filters dialog box closes, and the system hides the filter and removes the
filter tab from the Frame Display.
If a display filter is hidden the following steps will reveal that filter in the Frame Display.
1.
Select Hide/Show Display Filters… from the Filter menu in the Frame Display window to
open the Hide/Show Filters dialog. The system displays the Hide/Show Filters dialog with a list of
all user defined filters.
2. Select the filter to be revealed from the combo box.
3. Click the Show button.
Frontline BPA low energy Hardware & Software User Manual 63

TELEDYNE LECROY Chapter 4 Capturing and Analyzing Data
4. Click OK. The Hide/Show Filters dialog box closes and the system reveals the filter in the Frame
Display.
You can also open the Quick Filter dialog and check the box next to the hidden filter to show or hide a display
filter.
Figure 4.19 - Using Named Filters Section of Quick Filters to Show/Hide Filters
Note: When you have multiple Frame Display windows with a display filter or filters, those
filter do not automatically appear in other Frame Display windows. You must use the
Hide/Show dialog to display a filter created in one Frame Display in different Frame
Display window.
4.3.1.13.1.7 Editing Filters
Modifying a Condition in a Filter
1.
Click the Display Filters icon on the Frame
Display window or select Apply/Modify
Display Filters… from the Filter menu to open the
Set Condition dialog box. The Set Condition dialog
box displays the current filter definition at the top of
the dialog. To display another filter, click the Open
icon, and select the filter from the pop-up list of all the saved filters.
2. Edit the desired parameter of the condition: Because the required fields for a condition statement
depend upon previously selected parameters, the Set Condition dialog box may display additional
fields that were not present in the original filter. In the event this occurs, continue to enter the
requested parameters in the fields provided until the condition statement is complete.
3. Click OK. The system displays the Save Named Condition dialog. Ensure that the filter name is
displayed in the text box at the top of the dialog, and click OK. If you choose to create an additional
filter, then provide a new name for the filter condition or accept the default name provided by the
system and click OK.) The Set Condition dialog box closes, and the system applies the modified
filter.
Note: When a display filter is applied, a description of the filter appears to the right of the
toolbar in the Frame Display windows.
64 Frontline BPA low energy Hardware & Software User Manual

Chapter 4 Capturing and Analyzing Data TELEDYNE LECROY
Deleting a Condition in a Filter
If a display filter has two or more conditions you can delete conditions. If there is only one condition set in the
filter you must delete the filter using Delete Display Filters… from the Filters menu.
1.
Click the Display Filters icon on the Frame Display window or select Apply/Modify
Display Filters… from the Filter menu to open the Set Condition dialog box. Click on the
Advanced button to show the condition in Boolean format. The dialog box displays the current filter
definition. To display another filter, click the Open icon, and select the filter from the pop-up list
of all the saved filters.
Figure 4.20 - Set Condition Dialog in Advanced View
2. Select the desired condition from the filter definition.
3.
Click the Delete Selected Line icon.
4. Edit the Boolean operators and parentheses as needed.
5. Click OK. The system displays the Save Named Condition dialog. Ensure that the filter name is
displayed in the text box at the top of the dialog, and click OK. (If you choose to create an additional
filter, then provide a new name for the filter condition or accept the default name provided by the
system and click OK.) The Set Condition dialog box closes, and the system applies the modified
filter.
Note: When a display filter is applied, a description of the filter appears to the right of the
toolbar in the Frame Display windows.
Renaming a Display Filter
1.
Select Rename Display Filters… from the Filter menu in the Frame Display window to
open the Rename Filter dialog. The system displays the Rename Filter dialog with a list of all user
defined filters in the Filters combo box.
Frontline BPA low energy Hardware & Software User Manual 65

TELEDYNE LECROY Chapter 4 Capturing and Analyzing Data
Figure 4.21 - Rename Filters Dialog
2. Select the filter to be renamed from the combo box.
3. Enter a new name for the filter in the New Name box. Optionally click the Apply button and the new
name will appear in the Filters combo box and the New Name box will empty. This option allows
you to rename several filters without closing the Rename Filter dialog each time.
4. Click OK. The Rename Filter dialog box closes and the system renames the filter.
4.3.1.13.2 Connection Filtering
Connection Filtering allows the user to view a subset of the total available packets within the Frame Display.
The subset can include data from a single Bluetooth connection, or all of the BR/EDR packets, all of the low
energy packets, all of the 802.11 packets, or all of the HCI packets.
Bluetooth Applicability
A connection (device pair) is identified by
1. A Link for Classic Bluetooth,
2. An Access Address for Bluetooth low energy.
The link ID is a number that the ComProbe software assigns to identify a pair of devices in a BR/EDR
connection. In the Frame Display details pane, the Baseband layer contains the link ID field if the field’s
value is not 0.
An Access Address is contained in every Bluetooth low energy packet. The Access Address identifies a
connection between a slave and a master or an advertising packet.
Connection filtering displays only the frames, protocols, summary, details, and events for the selected
connections.
Note: Connection Filters are not persistent across sessions.
4.3.1.13.2.1 Creating a Connection Filter
In the Frame Display there are four ways to create a connection filter.
From the Frame Display Filter menu
Click on the Frame Display Filter menu Connection Filter selection. From the drop down menu, select
Classic or Bluetooth low energy. The options are
l Classic Bluetooth:
o
All will filter in all Classic Bluetooth frames. You are in effect filtering out any Bluetooth low energy
frames and are selecting to filter in all the Classic Bluetooth links.
66 Frontline BPA low energy Hardware & Software User Manual

Chapter 4 Capturing and Analyzing Data TELEDYNE LECROY
o
Links displays all the master-slave links. You can select only one link to filter in. The selected link will
filter in only the frames associated with that link.
l Bluetooth low energy:
o
All will filter in all Bluetooth low energy frames. You are in effect filtering out any Classic Bluetooth
frames and are selecting to filter in all Bluetooth low energy access addresses.
o
Access Addresses displays all the low energy slave device's access address. You can select only one
access address to filter. The selected link will filter in only the frames associated with that access
address.
l 802.11:
o
All will filter in all 802.11 frames. You are in effect filtering out any other technology frames.
l HCI:
o
All will filter in all HCI frames. You are in effect filtering out any other technology frames.
Figure 4.22 - Connection Filter from the Frame Display Menu
From the Frame Display toolbar
Right-click anywhere in the toolbar and select Connection Filter from the pop-up menu. The procedure for
creating a connection filter are identical as described in From the Frame Display Filter menu, above.
Figure 4.23 - Connection Filter from the Frame Display Toolbar right-click
From the Frame Display panes
Right-click anywhere in a Frame Display pane and select Connection Filter in the pop-up menu. The
procedure for creating a connection filter are identical as described in From the Frame Display Filter menu,
above.
Frontline BPA low energy Hardware & Software User Manual 67

TELEDYNE LECROY Chapter 4 Capturing and Analyzing Data
Figure 4.24 - Connection Filter from the Frame Display Pane right-click
From the Frame Display frame selection
Select a frame in the summary pane. Right-click and select Connection Filter in the pop-up menu. The
procedure for creating a connection filter are identical as described in From the Frame Display Filter menu,
above.
If the frame you have selected is associated with a Classic Bluetooth link or a Bluetooth low energy access
address, an additional pop-up menu item will appear as shown in the example image below. This selection is a
predetermined filter based on your selection. In the example, frame "6471" is associated with "Link 4", so the
predetermined filter assumes that you may want create a connection filter for that link. Clicking on
Connection Filter Link = 4 will filter in "Link 4" frames without opening all the drop-down menus.
68 Frontline BPA low energy Hardware & Software User Manual

Chapter 4 Capturing and Analyzing Data TELEDYNE LECROY
Figure 4.25 - Connection Filter from frame selection right-click
Creating from any Frame Display window
A Connection Filter can be created from any open Frame Display window, and the filtering will always be
applied to the original captured data set.
4.3.1.13.2.2 Connection Filter Display
Once you have selected which connections to filter in, another Frame Display will open. The original Frame
Display will remain open, and can be minimized.
Note: The system currently limits the number of frame displays to 5. This limit includes
any Frame Displays opened using Duplicate View from the Toolbar (see Working
with Multiple Frame Displays on page 47)
The new Frame Display with the filtered connection frames will only contain the data defined by the filter
criteria. That is, the criteria could be a single link or data for a particular technology.
Frontline BPA low energy Hardware & Software User Manual 69

TELEDYNE LECROY Chapter 4 Capturing and Analyzing Data
Display Example 1: Bluetooth low energy Access Address selected
Figure 4.26 - Front Display: Filtered on Access Address 0x8e89bed6
In the figure above is an example Bluetooth low energy data set connection filtered on Access Address =
0x8e89bed6. The Frame Display in the front is the filtered data set. One way to note the difference between
the original and the filtered display is to observe the Protocol Tabs. In the filtered display there are four low
energy protocol tabs as compared to nine in the original display. This access address connection is not using
five of the protocols.
From any open Frame display the user can set another Connection Filter based on the original data set.
Display Example 2: All 802.11 data filtered in
In this example, there is a capture file with Classic Bluetooth, Bluetooth low energy, and 802.11. To view just
the 802.11 data set, 802.11 = All is selected from the right-click pop up menu.
70 Frontline BPA low energy Hardware & Software User Manual
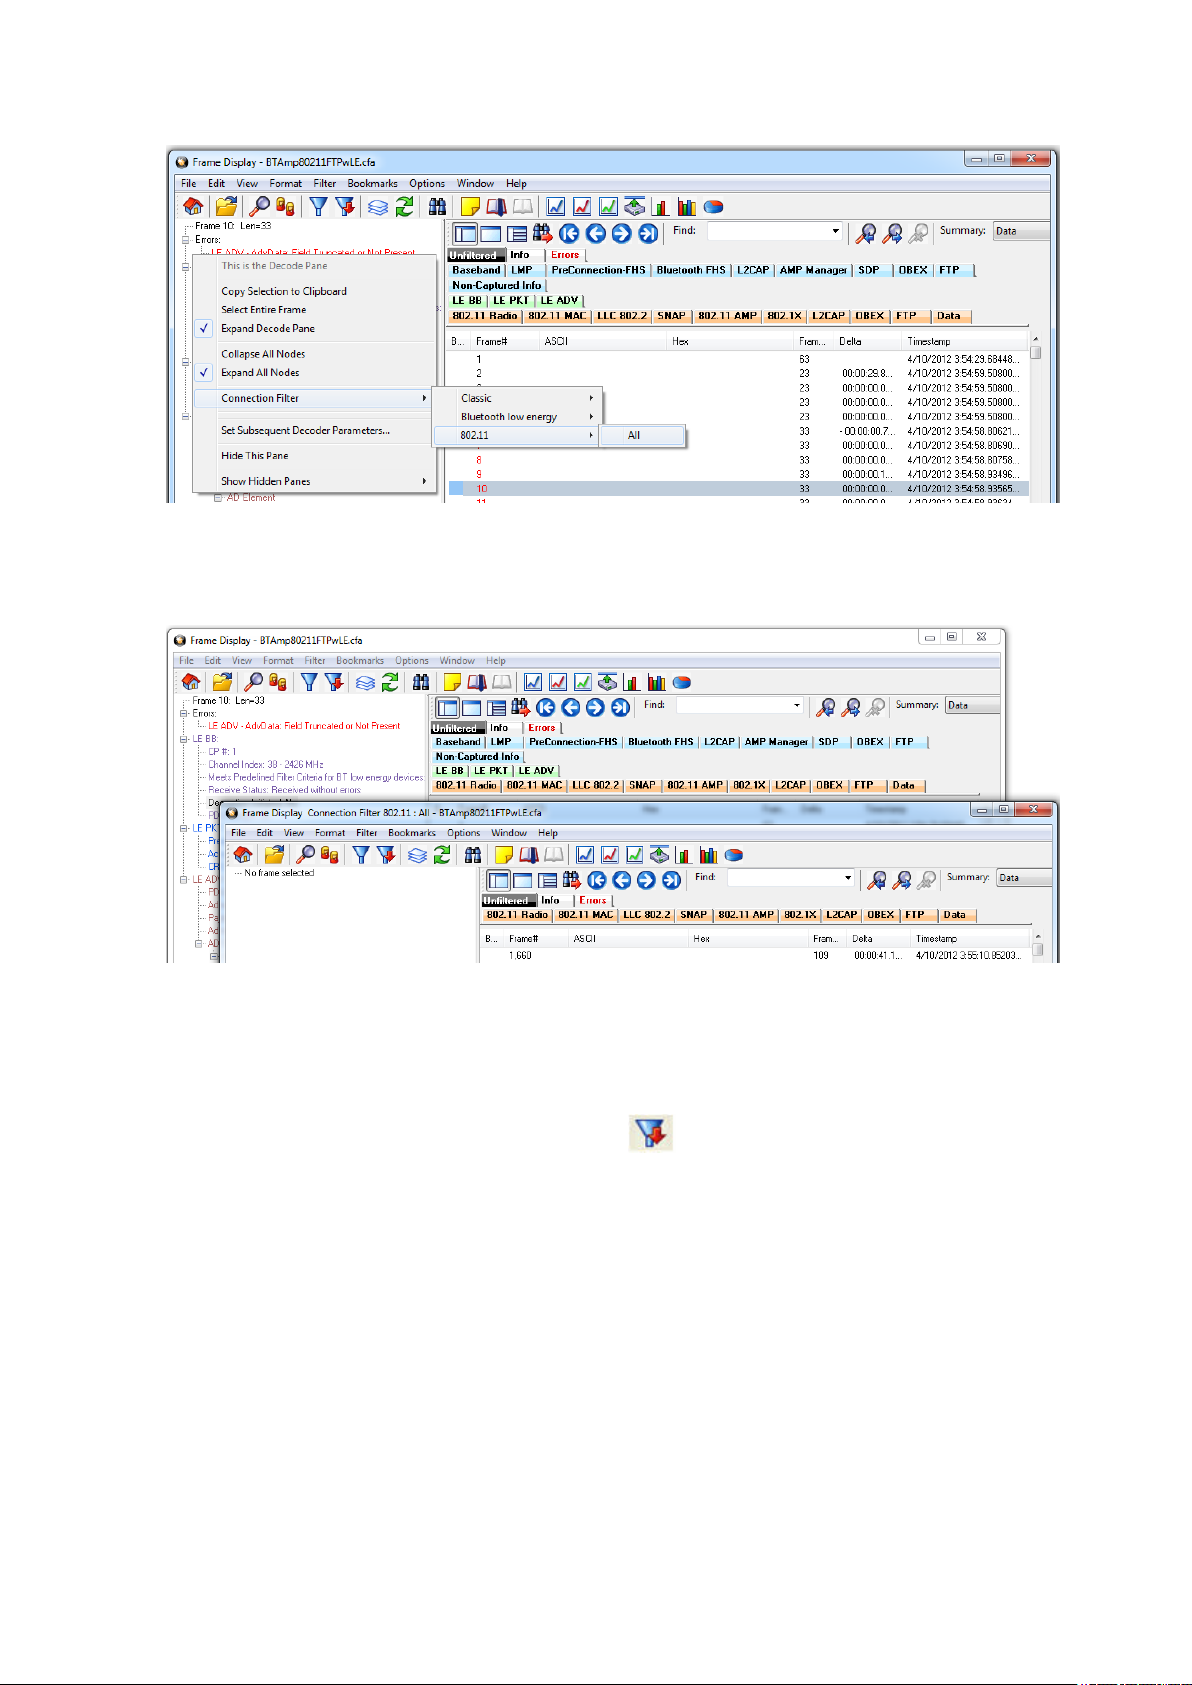
Chapter 4 Capturing and Analyzing Data TELEDYNE LECROY
Figure 4.27 - Unfiltered: Capture File with Classic, low energy, and 802.11
When the Frame Display with the filtered 802.11 data set appears, only the Protocol Tabs for 802.11 are
present and the tabs for Classic Bluetooth and Bluetooth low energy have been filtered out.
Figure 4.28 - Connection Filter selecting All 802.11 frames, front
4.3.1.13.3 Protocol Filtering from the Frame Display
4.3.1.13.3.1 Quick Filtering on a Protocol Layer
On the Frame Display , click the Quick Filtering icon or select Quick Filtering from the Filter
menu.
This opens a dialog that lists all the protocols discovered so far. The protocols displayed change depending on
the data received.
Frontline BPA low energy Hardware & Software User Manual 71

TELEDYNE LECROY Chapter 4 Capturing and Analyzing Data
Figure 4.29 - Frame Display Quick Filtering and Hiding Protocols Dialog
The box on the left is Protocols To Filter In. When you select the checkbox for a protocol in the Protocols
to Filter In, the Summary pane will only display those frames that contain data from that protocol.
If you filter on more than one protocol, the result are all frames that contain at least one
of those protocols. For example, if you filter on IP and IPX NetBIOS, you receive all frames
that contain either IP or IPX NetBIOS (or both). A Quick Filter tab then appears on the
Frame Display. Changing the filter definition on the Quick Filter dialog changes the filter applied on the
Quick Filter tab. Quick filters are persistent during the session, but are discarded when the session is closed.
The box in the center is the Protocols To Hide. When you select the checkbox for a protocol in the
Protocols To Hide, data for that protocol will not appear in the Decode, Binary, Radix, and Character
panes. The frames containing that type data will still appear in the Summary pane, but not in the Decode,
Binary, Radix, and Character panes.
The box on the right is the Named Filters. It contains filters that you
create using the and dialogs. When you select the checkbox for the
Name Filters, a tab appears on the Summary Pane that displays the
frame containing the specific data identified in the filter. The named
Filter tab remains on the Frame Display Summary Pane
unless you hide it using the dialog.
With low energy, the Configured BT Low energy devices
and Exclude NULLS and POLLs are default named filters.
Check the small box next to the name of each protocol you want to filter
in, hide, or Named Filter to display.
Then click OK
4.3.1.13.3.2 Easy Protocol Filtering
There are two types of easy protocol filtering. The first method lets you filter on the protocol shown in the
Summary pane, and the second lets you filter on any protocol discovered on the network so far.
Filtering on the Summary Layer Protocol
To filter on the protocol in the Summary in the Frame Display window pane:
1. Select the tab of the desired protocol, or open the Summary combo box.
2. Select the desired protocol.
3. To filter on a different layer, just select another tab, or change the layer selection in the combo box.
72 Frontline BPA low energy Hardware & Software User Manual

Chapter 4 Capturing and Analyzing Data TELEDYNE LECROY
Filtering on all Frames with Errors
To filter on all frames with errors:
1.
Open the Frame Display window.
2.
Click the starred Quick Filter icon or select Quick Filtering from the Filter menu
3. Check the box for All Frames With Errors in the Protocols To Filter In pane, and click OK.
4. The system creates a tab on the Frame Display labeled "Errors" that displays the
results of the All Frames With Errors filter.
Note: When you have multiple Frame Display windows open and you are capturing data,
you may receive an error message declaring that "Filtering cannot be done while receiving
data this fast." If this occurs, you may have to stop filtering until the data is captured.
4.3.2 low energy Timeline
The Bluetooth low energy Timeline displays packet information with an emphasis on temporal
information and payload throughput. The timeline also provides selected information from Frame Display.
The timeline provides a rich set of diverse information about low energy packets, both individually and as a
range. Information is conveyed using text, color, packet size, and position.
Figure 4.30 - Bluetooth low energy Timeline
You access the Timeline by selecting Bluetooth low energy Timeline from the View menu or by pressing
the Bluetooth low energy Timeline icon on the Control window toolbar and Frame Display toolbar.
In computing throughput, packets that have a CRC error are excluded.
Frontline BPA low energy Hardware & Software User Manual 73

TELEDYNE LECROY Chapter 4 Capturing and Analyzing Data
4.3.2.1 low energy Timeline Toolbar
The toolbar contains the following:
Table 4.3 - Bluetooth low energy Timeline Toolbar
Icon Description
Lock - The Lock button only appears in live mode and is automatically depressed when the
user scrolls.
Unlock
First Packet
Previous Packet
Next Packet
Last Packet
Previous Interframe Spacing (IFS) Error
l Interframe Spacing is considered valid if it is within 150 μs + or – 2us
l If the Interframe Spacing is less than 148 us or greater than 152 us but less than or equal to 300
μs, it is considered an IFS error.
Next Interframe Spacing (IFS) Error
l Interframe Spacing is considered valid if it is within 150 μs + or – 2us
l If the Interframe Spacing is less than 148 us or greater than 152 μs but less than or equal to 300
us, it is considered an IFS error.
Previous Error Packet
Next Error Packet
Zoom In
Zoom Out
Reset - The Reset button appears only in live mode. Reset causes all packet data up to that
point to be deleted from the Packet Timeline display. This does not affect the data in Frame
Display. Resetting the display may be useful when the most recent throughput values are of
interest.
4.3.2.2 low energy Timeline Menu Bar
The Bluetooth low energy Timeline menu bar contains the following:
74 Frontline BPA low energy Hardware & Software User Manual

Chapter 4 Capturing and Analyzing Data TELEDYNE LECROY
Table 4.4 - Bluetooth low energy Timeline Menus
Menu Selection Description
File Reset Resets Timeline to display beginning at current
frame. Available only in Live mode.
Exit Closes the timeline window
Format
Show Device Address Rows
Show Radio Rows
Displays rows of packets from sending devices.
The source device address will appear on the
left of each row.
Displays rows packets received on radios 0,1,
or 2. The radio number will appear on the left of
each row.
Frontline BPA low energy Hardware & Software User Manual 75

TELEDYNE LECROY Chapter 4 Capturing and Analyzing Data
Table 4.4 - Bluetooth low energy Timeline Menus (continued)
Menu Selection Description
Zoom
Zoom In Displays less of the timeline, but in greater detail.
Keyboard Shortcut: (Ctrl +)
Zoom Out Displays more of the timeline, in less detail.
Keyboard Shortcut: (Ctrl -)
Zoom In Tool Displays a magnifying glass icon with
a + and an arrow that allows for precise
positioning on the timeline. Clicking
will show less of the timeline around
the point where the tools is clicked.
Zoom Out Tool Similar to the Zoom In Tool except with a "-"
sign in the magnifying glass, and clicking will
show more of the timeline around the point
where the tool is clicked.
Selection Tool
Single Segment Zoom
of 1.25 ms markers withing the segment.
2.5 ms (1x2) Displays one 2.5 ms segment with 2 markers.
11.25 ms (1x9) Displays one 11.25 ms segment with 9 markers.
33.75 ms (1x27) Displays one 33.75 ms segment with 27
: Each selection defines the time displayed, "1" segment, and number
markers.
125 ms (1x100) Displays one 125 ms segment with 100
markers.
437.5 ms (1x350) Displays one 437.5 ms segment with 350
markers.
1.875 s (1x1500) Displays one 1.875 s segment with 1500
markers.
3.75 s (1x3000) Displays one 3.75 ms segment with 3000
markers.
Multiple Segment Zoom
segments, and number of 1.25 ms markers withing the segment. For example, selecting
"7.5 ms (6 1.25 ms time intervals (3x2))" will display "7.5 ms" of the total timeline in "3"
segments of with "2" markers per segment for a total of "6" markers.
7.5 ms (6 1.25 ms time intervals (3x2)) 3 segments, 2 markers per segment: 1.25 ms x
22.5 ms (18 1.25 ms time intervals (6x3)) 6 segment, 3 markers per segment
90 ms (72 1.25 ms time intervals (12x6)) 12 segments, 6 markers per segment
202.5 ms (162 1.25 ms time intervals
(18x9))
360 ms (288 1.25 ms time intervals
(24x12))
: Each selection defines the timeline view port, the number of
6 = 7.5 ms total; 1.25 ms x 2 = 2.5 ms per
segment.
18 segments, 9 markers per segment
24 segments, 12 markers per segment
76 Frontline BPA low energy Hardware & Software User Manual

Chapter 4 Capturing and Analyzing Data TELEDYNE LECROY
Table 4.4 - Bluetooth low energy Timeline Menus (continued)
Menu Selection Description
562.5 ms (450 1.25 ms time intervals
(30x15))
810 ms (648 1.25 ms time intervals
(36x18))
1.1025 s (882 1.25 ms time intervals
(42x21))
1.44 s (1152 1.25 ms time intervals
(48x24))
1.8225 s (1458 1.25 ms time intervals
(54x27))
2.25 s (1800 1.25 ms time intervals
(60x30))
2.7225 s (2178 1.25 ms time intervals
(66x33))
3.24 s (2592 1.25 ms time intervals
(72x36))
3.8025 s (30421.25 ms time intervals
(78x39))
4.41 s (3528 1.25 ms time intervals
(84x42))
30 segments, 15 markers per segment
36 segments, 18 markers per segment
30 segments, 15 markers per segment
48 segments, 24 markers per segment
45 segments, 27 markers per segment
60 segments, 30 markers per segment
66 segments, 33 markers per segment
72 segments, 36 markers per segment
78 segments, 39 markers per segment
84 segments, 42 markers per segment
5.0625 s (4050 1.25 ms time intervals
(90x45))
90 segments, 45 markers per segment
Frontline BPA low energy Hardware & Software User Manual 77

TELEDYNE LECROY Chapter 4 Capturing and Analyzing Data
Table 4.4 - Bluetooth low energy Timeline Menus (continued)
Menu Selection Description
Navigate First Packet
Last Packet
Previous Packet
Next Packet
Previous Invalid IFS Packet. Goes to the previous invalid IFS packet from the
Next Invalid IFS Packet Goes to the next invalid IFS packet from the
Previous Error Packet
Goes to the first packet.
Keyboard Shortcut: Home
Goes to the last packet.
Keyboard Shortcut: End
Goes to the packet prior to the currently selected
packet.
Keyboard Shortcut: Left Arrow
Goes to the next packet after the currently
selected packet.
Keyboard Shortcut: Right Arrow
currently selected packet. If there is no previous
invalid IFS packet this item is not active.
currently selected packet. If there are no invalid
IFS packets following the current selection, this
item is not active.
Goes to the first error packet prior to the current
selection. If there are no error packets available,
this item is not active.
Keyboard Shortcut: Ctrl+Left Arrow
Next Error Packet
Selected Packet Keyboard Shortcut: Enter
Toggle Display Lock
Help Help Topics Displays
Goes to the first error packet following the current
selection. If there are no error packets available,
this item is not active.
Keyboard Shortcut: Ctrl+Right Arrow
Available only in Live mode.
To prevent timeline scrolling during capture, click
on this time and the display will lock in its current
position. Capture will continue but the displays will
remain static.
To resume scrolling during capture, click again on
this menu item.
topics.
Bluetooth
low energy Timeline help
78 Frontline BPA low energy Hardware & Software User Manual

Chapter 4 Capturing and Analyzing Data TELEDYNE LECROY
4.3.2.3 low energy Timeline Legend
This legend identifies the color coding found in the timeline.
l When you select a packet in the timeline, items in the legend that
relate to the packet are highlighted.
l Bold text indicates that the type of packet has been seen in the
timeline.
4.3.2.4 Throughput Displays
Throughput is payload over time. There are 3 categories of throughput:
4.3.2.5 Average and 1 Second Packet Throughput
The figure depicts the Average and 1 Second Packet Throughput displays. This display appears when you select the Packet Throughput radio button.
l Average Packet Throughput is the total packet size over the entire session divided by the total
time. Total time is calculated by taking the difference in timestamps between the first and last packet.
l 1-Second Packet Throughput is the total packet size over the most recent one second.
l Width = peak =: This displays the maximum throughput seen so far.
l A horizontal bar indicates percentage of max seen up to that point, and text gives the actual
throughput.
4.3.2.6 Average and 1 Second Payload Throughput
The figure depicts the Average and One Second Payload Throughput display. This display appears
when you select the Payload Throughput radio button.
l Average Payload Throughput is the total payload over the entire session divided by the total time.
l 1-second Payload Throughput is the total payload over the most recent one second.
l Width = peak =: This displays the maximum throughput seen so far.
Note: 1-second throughput behaves differently than average throughput. In particular,
while average throughput can be very large with only a couple of packets (since it’s
dividing small packet or payload size by small time), 1-second throughput can be very
small since it divides by an entire one second.
4.3.2.7 Throughput Graph
The following figure depicts the Throughput Graph.
Frontline BPA low energy Hardware & Software User Manual 79

TELEDYNE LECROY Chapter 4 Capturing and Analyzing Data
Figure 4.31 - Bluetooth low energy Timeline Throughput Graph
The Swap button switches the position of the Timeline and the Throughput graph.
Selecting Throughput Display
l Selecting Packet Throughput displays just the Packet Throughput in graph form and displays the
Average and Average and 1 Second Packet Throughput on the left side of the dialog. The y-axis
numbers appear in blue.
l Selecting Payload Throughput displays just the Payload Throughput in graph form and displays
the Average and Average and 1 Second Payload Throughput on the left side of the dialog.. The y-axis
numbers appear in green.
l Selecting Include MIC will include the transmitted 32 bit Message Integrity Check data in the
throughput.
You may want to include Message Integrity Checks in your throughput even though MIC is not application
data. MICs are transmitted and you may want to included in the throughput as a measure of how active
your radio was.
In this example the 1 Second
Payload Throughput is 1,360
bits/sec when Include MIC is
not checked. By checking the
Include MIC box the MIC data is
included in the throughput data
and 1 Second Payload
Throughput increases to 1,840
bits/sec. This capture file has 15
MICs in the last second of the file.
A MIC is 32 bits for a total of 32
bits X 15 MICs = 480 bits.
The easiest way to view MIC
data is to use the Frame
Display.
1. Using the Decoder
pane scroll through the
frames until LE Data
shows "Encrypted
MIC".
2. Place the cursor on the
Encrypted MIC data
and while holding the
80 Frontline BPA low energy Hardware & Software User Manual

Chapter 4 Capturing and Analyzing Data TELEDYNE LECROY
left mouse button drag the field to the Summary pane.
3. An Encrypted MIC column is added to the Summary pane.
Figure 4.32 - Creating Encrypted MIC in Frame Display Summary pane
4.3.2.8 The Timeline
The low energy Timeline shows Bluetooth packets within a specific period of time. Time is shown as one or
more contiguous segments. Within each segment are one or more source access address or radio rows.
Figure 4.33 - Bluetoothlow energy Timeline
4.3.2.9 How Packets Are Displayed
Bluetooth low energy packets are displayed in the low energy timeline in Segments and Rows.
Frontline BPA low energy Hardware & Software User Manual 81

TELEDYNE LECROY Chapter 4 Capturing and Analyzing Data
l Segments are "pieces" of the timeline. You can zoom in to show just one segment, or you can zoom
out to show multiple segments. In multiple segment displays the segments are contiguous from top to
bottom. Refer to the diagram below. The top-most segment contains the beginning timestamp on the
left. The timeline proceeds from left to right in a segment, and continues in the next segment down
beginning on the left of that segment. If you zoom out to show two segments the viewable timeline
appears in those two segments. You will use the scroll bar on the right to scroll through the timeline.
In a one-segment display the viewable timeline appears in that one segment. You will scroll through
the timeline using the scroll bar appearing at the bottom of the timeline display.
l Rows show either the access address of the configured devices or of all discovered devices. Because
the segments are contiguous in multiple segment displays, the rows in each segment are identical.
In the following diagram we see a three segment display showing the timeline flow.
Figure 4.34 - Diagram of low energy Timeline Flow with Segment and Row Relationship
l Rows can display either source device access addresses or the three radios receiving the data..You choose
with methods by selecting Show Device Address Rows or Show Radio Rows from the Format
menu.
Show Device Address Rows will display rows of
packets from sending devices. The source device address
will appear on the left of each row.
Show Radio Rows will display rows packets received
on radios 0,1, or 2. The radio number will appear on the
left of each row.
o
The Addr rows display packets sent by that access address for all devices or configured devices. You
select All Devices or Configured Devices using the radio buttons.The address shown is the access
address for the device.
82 Frontline BPA low energy Hardware & Software User Manual

Chapter 4 Capturing and Analyzing Data TELEDYNE LECROY
Figure 4.35 - Device Address Rows
o
The Radio rows display packets received by that radio (0, 1, or 2).
Figure 4.36 - Radio Rows
l The mouse wheel scrolls the timeline horizontally when displaying a single segment, and scrolls vertically
when displaying multiple segments
l You can also zoom by using the right-click menu (which displays magnification values), using the + and -
Zoom buttons on the toolbar, or by selecting a value from the Zoom menu.
l Packet length indicates duration
l The Timeline and Frame Display are synchronized so the packet range selected by the user in one is
automatically selected in the other. For the selected packet range, the Timeline shows various duration
values (Gap, Timestamp Delta, and Span), but only if both the first and last packet in the range are
available in the Timeline. If not, those values are shown as “n/a”. Packets that are not displayed in the
Timeline are Sniffer Debug packets, non-LE packets (e.g. WiFi), and packets that are not from a
Configured Device the Configured Devices radio button is checked.
Frontline BPA low energy Hardware & Software User Manual 83

TELEDYNE LECROY Chapter 4 Capturing and Analyzing Data
Figure 4.37 - low energy Timeline and Frame Display Packet Synchronization
4.3.2.10 low energy Timeline Visual Elements
The low energy Timeline consists of the following visual elements:
l Time Markers - Time markers indicated by vertical blue lines are shown at 1.25 ms intervals. The markers
are provided to help visualize the timescale and are also useful when using dual-mode chips that do
BR/EDR and LE at the same time. Time markers snap to the beginning of the first data packet by default,
but they can be snapped to the beginning or end of any packet by right-clicking on a packet and selecting
Align Time Marker to Beginning of Packet or Align Time Marker to End of Packet. All other
markers will shift relative to that new reference point.
Figure 4.38 - Timeline Markers Shown Snapped to End of Packet
l Timestamp - The beginning and ending timestamp for each segment is displayed beneath each segment.
When showing multiple segments the beginning timestamp is the same as the ending timestamp of the
previous segment.
In addition to the timestamps the segment information bar shows the zoom value in the center of the bar.
84 Frontline BPA low energy Hardware & Software User Manual

Chapter 4 Capturing and Analyzing Data TELEDYNE LECROY
Figure 4.39 - Bluetooth le Timeline Segment Timestamp and Zoom Value
Note: The raw timestamp value is the number of 100-nanosecond intervals since the
beginning of January 1, 1601. This is standard Windows time.
l Packet Info Line - The packet info line appears just above the timeline and displays information for the
currently selected packet.
Figure 4.40 - Bluetooth le Timeline Packet Info Line
l When you select multiple packets, the info line includes:
o
Gap - duration between the end of the first selected packet and the beginning of the last selected
packet.
o
Timestamp Delta - Duration between the beginnings of the first and last packets selected.
o
Span - Duration between the beginning of the first selected packet and the end of the last selected
packet
Figure 4.41 - Bluetooth le Timeline Packet Info Line for Multiple Selected Packets
l Floating Information Window (aka Tooltip) - The information window displays when the mouse cursor
hovers on a packet. It persists as long as the mouse cursor stays on the packet.
l Discontinuities - Discontinuities are indicated by cross-hatched slots. See the Discontinuities section.
l Packet Status - Packet status is indicated by color codes. Refer to low energy Timeline Legends.
l Right-Click Menu. - The right-click menu provides zooming and time marker alignment.
Frontline BPA low energy Hardware & Software User Manual 85

TELEDYNE LECROY Chapter 4 Capturing and Analyzing Data
l Graphical Packet Depiction - each packet within the visible range is graphically depicted. See the Packet
Depiction section.
l
Swap Button - The Swap button switches the position of the Timeline and the Throughput
graph.
l Show Running Average - -Selecting this check box shows a running average in the Throughput Over Time
graph as an orange line .
4.3.2.11 low energy Packet Discontinuities
The following figure depicts a discontinuity between two packets.
Figure 4.42 - Bluetooth® low energy Packet Discontinuity
To keep the timeline and the throughput graph manageable, big jumps in the timestamp are not represented
linearly. Instead, they are shown as discontinuities. A discontinuity exists between a pair of packets when the
timestamp delta (the timestamp of the second packet minus the timestamp of the first packet) is (1) more
than 4.01 seconds or (2) is negative. The reason that the discontinuity trigger is set at 4.01 seconds is because
the maximum connection interval time is 4 seconds.
A discontinuity is indicated by a cross-hatched pattern drawn between two packets and a corresponding
vertical dashed line in the throughput graph. When the timestamp delta is greater than 4.01 seconds, the
discontinuity is a cosmetic convenience that avoids excessive empty space. When the timestamp delta is
negative, the discontinuity is necessary so that the packets can be drawn in the order that they occur.
4.3.2.12 low energy Timeline Navigating and Selecting Data
Buttons, menu items, and keystrokes can be used to go to the next or previous packet, next or previous
invalid interframe spacing (IFS), next or previous error packet, and the first or last packet.
l
If there is no selected packet in the timeline, First Packet , Next Packet , and Last Packet
are enabled, but Previous Packet is not.
l A single packet is selected either by clicking on it, navigating to it, or selecting it in the Frame Display.
o
Single Segment Navigation:
n Selecting Previous Packet will select the next packet in time (moving back in time to the left)
regardless of which row it is on. If the previous packet is not in the display or if a portion of the
packet is visible, the display will scroll to the next packet and it will appear selected on the left of
the display. The timestamp will change with the scrolling of the display.
86 Frontline BPA low energy Hardware & Software User Manual

Chapter 4 Capturing and Analyzing Data TELEDYNE LECROY
n Selecting Next Packet will select the next packet in time (moving forward in time to the right). If
the next packet is not in the display, the display will scroll to the next packet and it will appear
selected on the right of the display. The timestamp will change with the scrolling of the display.
o
Multiple Segment Navigation:
n Selecting Previous Packet will select the next packet moving back in time (to the left) on the
segment and will select the previous packet regardless of which or segment it is in.
If the selected packet overlaps with the previous segment, the display will show the packet
selected in both segments.
If the previous packet is not shown in the timeline display or a portion of the packet is
displayed,the display will move the view port back in time and will display the selected packet in
the top segment on the left edge. Each segment's timestamps will synchronously change as the
view port scrolls backwards in time.
n Selecting Next Packet will select the next packet moving forward in time (to the right)on the to the
next packet regardless of which row or segment it is in.
If the next packet overlaps on a following segment, the display will show the packet selected in
both segments.
If the next packet is not shown in the timeline display on any segment or a portion of the packet is
displayed, the display will move the view port forward in time and will display the selected packet
in the bottom segment on the right edge. Each segment's timestamps will synchronously change as
the view port scrolls forward in time. All subsequent selected next packets will appear on the right
of the bottom segment.
l Multiple packets are selected either by dragging the mouse or by holding down the shift key while
navigating or clicking.
l When a single packet is selected in the timeline it is also becomes selected in the Frame Display. When
multiple packets are selected in the timeline, only one of them is selected in the Frame Display.
l The keyboard left arrow key goes to the previous packet. The right arrow key goes to the next packet.
The Ctrl-left arrow key goes to the previous error packet. The Ctrl-right arrow key goes to the next error
packet.
l The mouse scroll wheel will scroll the timeline as long as the cursor is in the dialog.
4.3.2.13 low energy Timeline Zooming
Zoom features can be accessed from the Bluetooth low energy Timeline Zoom menu by right-clicking on
the Timeline window.
A couple of things to remember about Zooming.
l Zooming using the toolbar buttons in a single segment display is relative to the center of the display. That is
as you zoom out those packets on the left and right halves will move closer to the center. If you zoom in,
those packets in the left and right halves will move towards the left and right edges respectively.
l Zooming using the toolbar buttons in a multiple segment display is relative to the number of segments. If
you have a single display and zoom out they will become two segments, then three segments, then six,
and so forth.
l Selecting a Zoom icon (+ or -) on the toolbar zooms in our out.
l The current Zoom setting is shown in the center of the timeline segment information bar at the bottom of
each timeline segment.
Frontline BPA low energy Hardware & Software User Manual 87

TELEDYNE LECROY Chapter 4 Capturing and Analyzing Data
l If you are in multiple segments the segment information bar will show the zoom level with the text "
(Contiguous time segment x/n)" where "x" is 1,2, 3... segment and "n" is the total number of segments. For
example: :"(Contiguous time segment 2/3)".
4.3.2.14 Zoom menu
Figure 4.43 - low energy Timeline Zoom menu
88 Frontline BPA low energy Hardware & Software User Manual

Chapter 4 Capturing and Analyzing Data TELEDYNE LECROY
4.3.2.15 Single Segment Zoom
Zoom Menu Single Segment: Each selection defines the timeline displayed, the number of segments, and
number of 1.25 ms markers withing the segment. For example, selecting "33.75 ms (1x27)" will display
"33.75 ms" of the throughput graph in "1" segment with "27" markers.
The scroll bar at the bottom of the segment will scroll the throughput graph view port.
4.3.2.16 Multiple Segments
Zoom Menu Multiple Segment: Each selection defines the timeline view port, the number of segments, and
number of 1.25 ms markers withing the segment. For example, selecting "7.5 ms (6 1.25 ms time intervals
Frontline BPA low energy Hardware & Software User Manual 89

TELEDYNE LECROY Chapter 4 Capturing and Analyzing Data
(3x2))" will display "7.5 ms" of the total timeline in "3" segments of with "2" markers per segment for a total
of "6" markers.
The scroll bar at the left of the segments will scroll the view through the timeline.
4.3.3 Coexistence View
(Click here to see an introduction video...)
The Coexistence View displays Classic Bluetooth, Bluetooth low energy, and 802.11 packets and throughput
in one view. You access the Coexistence View by clicking its button in the Control window or
Frame Display toolbars, or Coexistence View from the View menus.
Figure 4.44 - Coexistence View Window
4.3.3.1 Coexistence View Menus
Table 4.5 - Coexistence View File Menu Selections
Selection Description
Reset Resets the Coexistence View window to its default settings.
Exit Closes the Coexistence View window.
The following tables
describe each of the
Coexistence View
Menus.
90 Frontline BPA low energy Hardware & Software User Manual

Chapter 4 Capturing and Analyzing Data TELEDYNE LECROY
Table 4.6 - Coexistence View Format Menu Selections
Selection Description
Show Packet
Number
When checked, the packet number shows below the packet in the Viewport.
Show Packet
Type
Show Packet
Subtype
Hide Packet
Text
Auto Hide
Packet Text
When
Duration >
31.25 ms
Increase Auto
Hide Packet
Count from
4,000 to
20,000 (May
Be Slow)
Use All
Packets for
Throughput
Indicators
.
When checked, the packet type shows below the packet in the Viewport.
When checked, the packet subtype shows below the packet in the Viewport, if
applicable.
When checked, hides any text shown below the packet in the Viewport. Applies the
text shown by the Show Packet Number,
Subtype
When checked, automatically hides any text shown below the packet in the Viewport
when the Viewport duration exceeds 31.25 ms. Applies the text shown by the Show
Packet Number,
The Viewport duration is shown at the bottom of the Viewport. This selection reduces
display clutter when viewing a larger timeline section.
When not checked, the default, the packets in the viewport are hidden if the number
of visible packets exceeds 4,000.
When checked, the default count increased from 4,000 to 20,000 packets before the
packets are hidden. Choosing this selection may slow down the displaying of the
packets.
When checked, all captured packets are used for average throughput calculations
and all packets in the last one second of the capture session are used for the 1 sec
throughput. See
throughput indicator
menu selections.
Show Packet Type
The following three selections are mutually exclusive.
on page 98
All
for more information. Performs the same function as the
radio button.
Show Packet Type
Show Packet Subtype
, and
Show Packet
, and
menu selections.
Use Selected
Packets for
Throughput
Indicators
Use Viewport
Packets for
Throughput
Indicators
Set 802.11 Tx
Address
Show Packet
Throughput
When checked, the packets selected in the Viewport are used for average throughput
calculations, and selected packets in the one second before the last selected packet
are used for the 1 sec throughput. See
same function as the throughput indicator
When checked, all packets appearing in the Viewport are used for average
throughput calculations, and all packets in the one second before the last packet in
the Viewport are used for the 1 sec throughput. See
Performs the same function as the throughput indicator
When checked, this selection is used to specify the 802.11 source address, where
any packet with that source address is considered a Tx packet and is shown with a
purple border in the timelines. Performs the same function as the SET button. Refer
on page 106
to
The following three selections are mutually exclusive.
When checked, the Throughput Graph and Throughput Indicator shows data based
on packet throughput. Performs the same function as the
button.
on page 98
Selected
for more information. Performs the
radio button.
on page 98
Viewport
for more information.
radio button.
Throughput Packet
radio
Frontline BPA low energy Hardware & Software User Manual 91

TELEDYNE LECROY Chapter 4 Capturing and Analyzing Data
Table 4.6 - Coexistence View Format Menu Selections (continued)
Selection Description
Show Payload
Throughput
When checked, the Throughput Graph and Throughput Indicator shows data based
on payload throughput. Performs the same function as the
radio button.
Throughput Payload
Show Both
Packet And
Payload
Throughput
Show 5 GHz
Timeline
Show 2.4 GHz
Timeline
Show Both
2.4 GHz and 5
GHZ
Timelines
Show
Timelines
Which Have
or Had
Packets (Auto
Mode)
When checked, the Throughput Graph will graph both the data based on packets
throughput in darker colors and payloay throughput in lighter colors. The Throughput
Indicator will show calculations based on packet throughput. Performs the same
function as the
The following four selections are mutually exclusive.
When checked, the 5 GHz Timeline is visible and the 2.4 GHz Timeline is not visible.
Only 802.11 5 GHz packets are shown. Performs the same function as the
5 GHz
When checked, the 2.4 GHz Timeline is visible and the 5 GHz Timeline is not visible.
The timeline will show Classic Bluetooth, Bluetooth Low Energy, and 802.11 2.4
GHz packets. Performs the same function as the
When checked, the 2.4 GHz Timeline and the 5GHZ Timeline is visible. Performs the
same function as the
When check,shows only timelines which have had packets at some point during this
session. If no packets are present, the 2.4 GHz Timeline is visible. Performs the
same function as the
radio button.
Throughput Both
Timeline Both
Timeline Auto
radio button.
radio button.
radio button.
Timeline 2.4 GHz
Timeline
radio button.
Show Low
Energy
Packets From
Configurated
Devices Only
Show All Low
Energy
Packets
Large
Throughput
Graph
The following two selections are mutually exclusive.
When checked, shows in the 2.4 GHz Timeline only packets from
enegry devices configured for this session, and uses these packets for throughput
calculations. Performs the same function as the
button.
When checked, shows in the 2.4 GHz Timeline all Bluetooth low energy packets
captured in this session, and uses these packets for throughput calculations.
Performs the same function as the
When checked, the Throughput Graph appears in the bottom half of the window,
swapping position with the timeline.
When not checked, the Throughput Graph appears in its default position at the top of
the window.
Performs the same function as clicking the Swap button. See on page 100.
LE Devices All
LE Devices Configured
radio button.
Bluetooth
low
radio
92 Frontline BPA low energy Hardware & Software User Manual

Chapter 4 Capturing and Analyzing Data TELEDYNE LECROY
Table 4.6 - Coexistence View Format Menu Selections (continued)
Selection Description
Show Dots in
Throughput
Graph ( Dots
Reveal
Overlapped
Data Points)
When checked, displays dots on the Throughput Graph. Dots are different sizes for
each technology so that they reveal overlapping data points which otherwise
wouldn’t be visible. A tooltip can be displayed for each dot. Performs the same
function as the
Dots
button. See
on page 100
.
Show
Zoomed
Throughput
Graph
Freeze Y
Scales in
Zoom
Throughput
Graph
Show Tooltips
in Upper-Left
Corner of
Screen
When checked, dispalys a Zoomed Throughput Graph above the Throughput Graph.
The Zoomed Throughput Graph shows the details of the throughput in the time range
covered by the viewport in the Throughput Graph. Performs the same function as the
Show Zoom button.
When not checked, the Zoomed Throughput Graph is hidden. Performs the same
function as the Hide Zoom button.
See on page 100
.
Only active when the Zoomed Throughput Graph is visible.
When checked, it freezes the y-axis scales and makes it possible to compare all
time ranges and durations. Performs the same fuction as the Freeze Y button, which
appears with the Zoomed Throughput Graph.
When not checked, the y-axis scales are unfroozen. Performs the same function as
the Unfreeze Y button, which appears with the Zoomed Throughput Graph.
See on page 100
When checked, Timeline and Throughput Graph tooltips will appear in the upper-left
corner of your computer sceen. You can relocate the tool tip for convenience or to
see the timeline or throughput graph unobstructed while displaying packet
information. See
on page 108
.
Table 4.7 - Coexistence View Zoom Menu Selections
Selection Description Hot Key
Zoom In
Zoom Out
The following two selectioins are mutually exclusive.
Scroll Tool (Mouse Wheel Scrolls - Ctrl Key
Switches to Zoom Tool)
Zoom Tool (Mouse Wheel Zooms- Ctrl Key
Switches to Scroll Tool)
When clicked,
Viewport time duration
decreased.
When clicked,
Viewport time duration
increases
When checked, sets the mouse wheel to scroll
the Viewport. Pressing the Ctrl key while
scrolling switches to zooming the Viewport.
When checked, sets the mouse wheel to zoom
the Viewport. Pressing the Ctrl key while
zooming switches to scrolling the Viewport.
Ctrl+Plus
Ctrl+Minus
Frontline BPA low energy Hardware & Software User Manual 93
 Loading...