

User Reference Guide
®
For Windows
Fresh Roast Systems Incorporated
200 Ocean Lane Drive, Suite 806
Key Biscayne, Florida 33149-1447 USA
www.freshroastsystems.com
TM
TM
GENESiS
COLOR
TM
COLOR
TM

© 2011 Fresh Roast Systems, Inc. All rights reserved.
Fresh Roast Systems ColorTrack Professional User Reference Guide
If this guide is distributed with software that includes an end user agreement, this guide,
as well as the software described in it, is furnished under license and may be used or
copied only in accordance with the terms of such license. Except as permitted by any
such license, no part of this guide may be reproduced, stored in a retrieval system, or
transmitted, in any form or by any means, electronic, mechanical, recording, or otherwise,
without the prior written permission of Fresh Roast Systems, Inc. Please note that the
content in this guide is protected under copyright law even if it is not distributed with the
software that includes an end user license agreement.
The content of this guide is furnished for informational use only, is subject to change
without notice, and should not be construed as a commitment by Fresh Roast Systems,
Inc. Fresh Roast Systems, Inc. assumes no liability or responsibility for any errors or
inaccuracies that may appear in the informational content contained in this guide.
Please remember that any artwork or images included in this guide that you may want to
use may be protected under copyright law. The unauthorized incorporation of such
material into any work or materials of your own could be a violation of the rights of the
copyright owner. Please obtain any permission required from the copyright owner.
Any references to company names in sample images or artwork in this guide are for
demonstration purposes only and are not intended to refer to any actual organization or
entity.
Fresh Roast Systems, The Fresh Roast Systems logo, Gensis and ColorTrack logo are
either registered trademarks or trademarks of Fresh Roast Systems, Inc. in the United
States and/or other countries.
Fresh Roast Systems, Inc. 200 Ocean Lane Drive, Suite 806, Key Biscayne, Florida
33149-1447 USA
Printed in the USA.
TM
TM
GENESiS
COLOR
TM
User Reference Guide 3 User Reference Guide 4
TM
GENESiS
COLOR
TM
TM
GENESiS
COLOR
TM
Introduction
The ColorTrack Genesis System
The ColorTrack Genesis Laser is a revolutionary portable reflectance meter for
evaluating color/shade. This revolutionary technology is entirely unique employing a
concentric laser optic system that overcomes many of the past obstacles to accurate,
consistent and easy to use color analysis. What is so unique about the ColorTrack Genesis
is this optics system which provides significant flexibility through tolerances to use such
as distance and angle to target.
The Genesis theory is relatively simple. The illumination provided by the laser reflects
off the sample material or target. The resulting reflectance is then calculated by a receptor
in the device and converted to a voltage which determines how dark or light the sample
is. In most systems, the resulting reflectance is significantly affected by distance and
angles and the photon loss due to these variables can have dramatic effect on results. The
Genesis laser eliminates this problem and basically experiences little or no photon loss
within previously unattainable range and angle due to its geometry and method of
illumination. This is what makes the Genesis device unique.
The simple hand held device can be held at virtually any distance, angle or position over
a sample and results will not vary. In other words, operator error is reduced to virtually
zero and sample preparation is virtually eliminated as a variable. “Hills and valleys” in
samples are accurately and consistently eliminated making the reading of solid materials
such as whole bean coffee, fruits and vegetables, nuts, etc., as accurate as if they were in
liquid or powder form. The operator simply aims the device at the sample and gets a
reading accurate to as little as one ten thousandth of a point regardless of the surface of
the sample or the manner in which the operator uses the device.
Another important feature of the ColorTrack technology is its exclusive “dynamic
sampling”. As in all the ColorTrack products, the sample is not illuminated on a static
basis. Because you move the illumination randomly over the sample and the laser takes
readings the entire time at very high speed, the sample is scanned on a much more
comprehensive basis than any other device of its type. While other devices take only a
few static illumination readings, ColorTrack takes as many as 10,000 readings per
second. All of this combined with a fully digital laser with on-board real-time processing
is what makes ColorTrack so amazingly accurate and fast.
The Genesis device also is the only device that both records scans and/or displays realtime results. This allows for fast easy scanning without anything more than pointing the
device at the sample and then watching the real time display.
The ColorTrack Genesis base unit is an extremely streamlined device. Its tough ABS case
makes it durable and lightweight. Its design is so simple that virtually anyone can use it
in a matter of minutes. In addition, the unit was designed to be flexible in its use allowing
it to be used in a multitude of different applications including, but not limited to use with
the optional ColorTrack bench unit and the exclusive ColorTrack inline R/T monitoring
and logging system.
The device consists of a simple one button unit. The single button on the front of the
device starts and stops recording of scans. Once pressed, the system will begin averaging
and recording scans for any given sample. Just point and shoot. You can also use the
manual software facilities to control everything from a single computer without any
interaction with the device.
There are three separate applications for the Genesis device. Because it is entirely
portable and hand held it can be used as easily as a flashlight. Entirely USB powered, the
operator needs only a tablet or hand held computer to take readings anywhere, anytime.
As a hand held unit, the device can be carried from point to point, station to station just
like any other portable device. Once powered, it’s ready to use. Simply point and shoot.
The optional bench unit operates on
all the same principles of hand held use. Once the sample dish is filled, placed in the
turntable and inserted into the unit, it will begin to read the moving sample on a real time
basis. When ready to record the results the operator simply pushed the record button.
When it is released, the results will be displayed on the computer.
The Genesis device can also be used in conjunction with the ColorTrack R/T monitoring
and logging system. This real time logging device can monitor any control device and
store every one second of data for the given device(s). When the Genesis is added to the
system, the patented real time color analysis is logged as well. An invaluable tool for
process control and QC/QA, this patented process is available nowhere else in the world
and is entirely exclusive to ColorTrack.
Applications
Hand Held
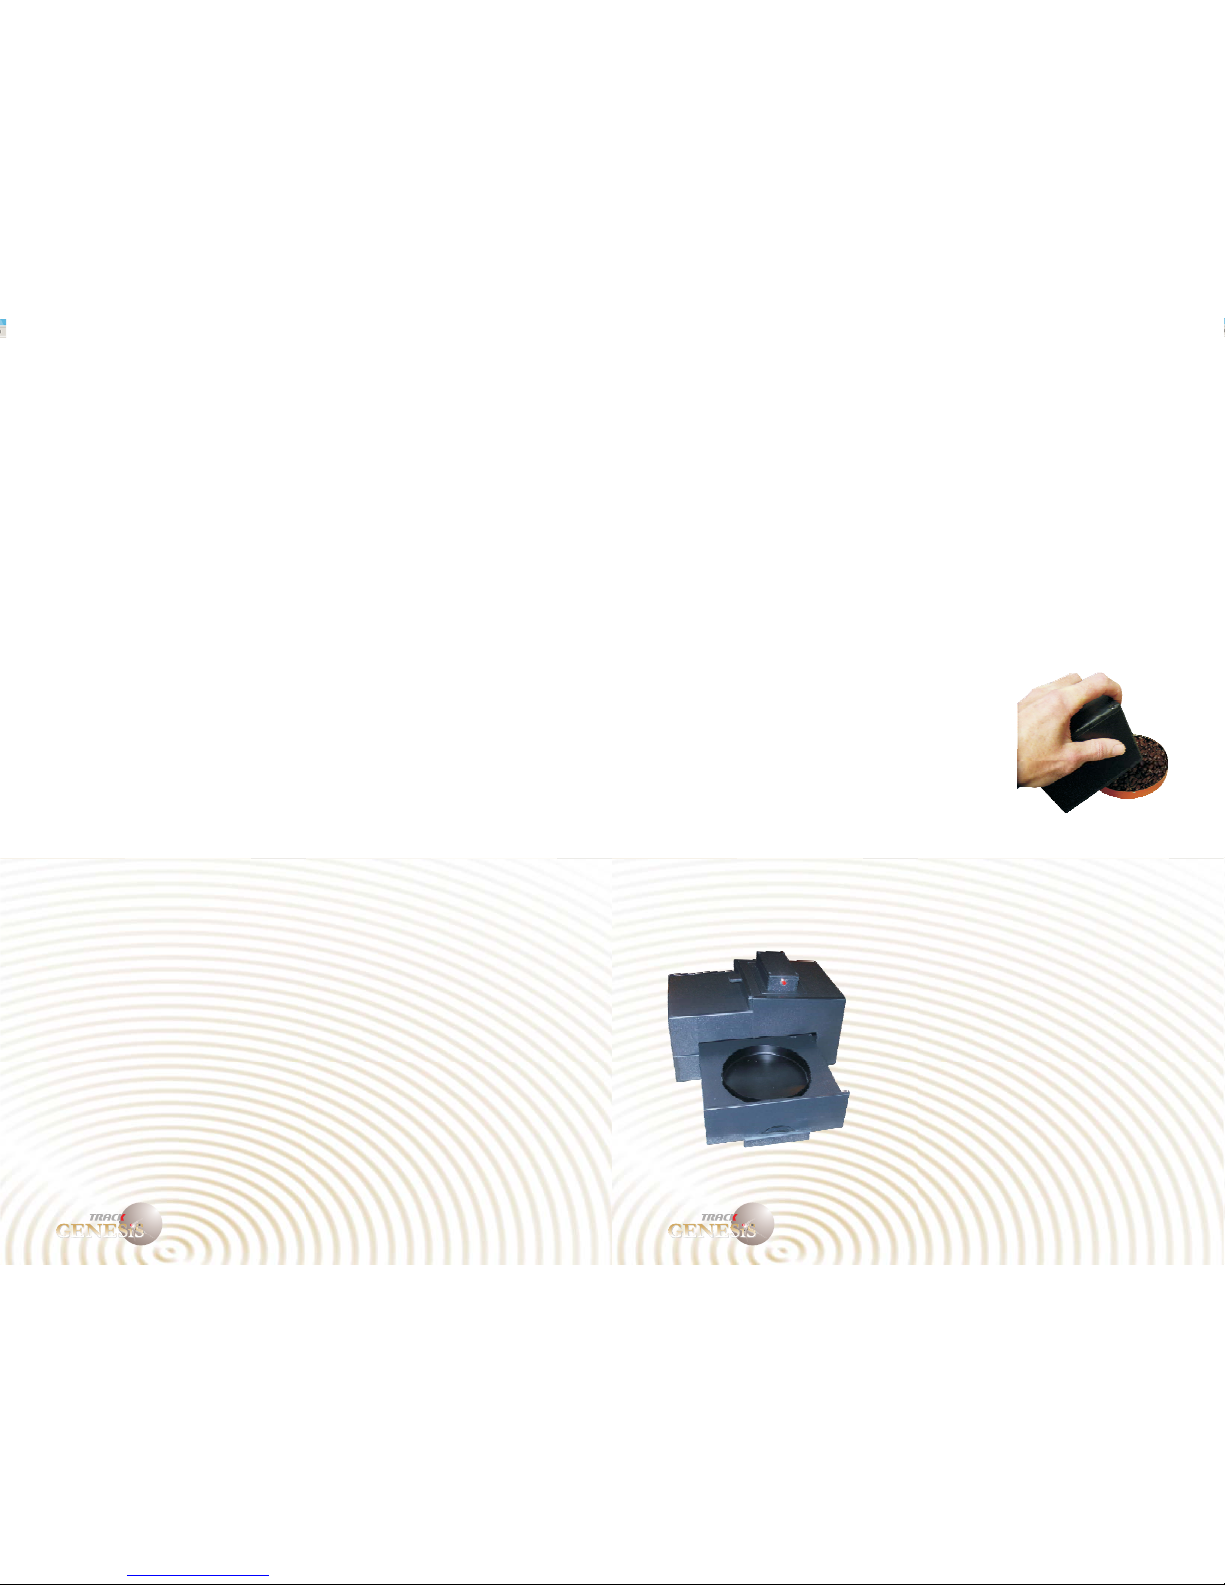
Bench Unit and Turntable
R/T and Inline
The device can also be plugged into its custom companion bench unit with motorized
automatic turntable creating a true laboratory device.
QuickStart
tall the ColorTrack Software
If you purchased a ColorTrack system without a computer controller you
will need to install the ColorTrack program on your computer. To do so,
place the installation disk or USB drive into your computer and then
access the drive. Select the install icon (setup.exe) and then follow the
instructions as they appear on-screen. After you've installed the program,
reboot your computer.
Connect the supplied USB cord to the ColorTrack device and then
connect the cord to any USB connection on your computer. Start the
ColorTrack program from the icon on the desktop. The main screen will
be displayed and assuming everything is installed correctly there will be
an indicator in the lower right hand corner of the screen indicating that
the laser is active and ready for use. In addition, if your laser is properly
connected it will automatically start reading and displaying values.
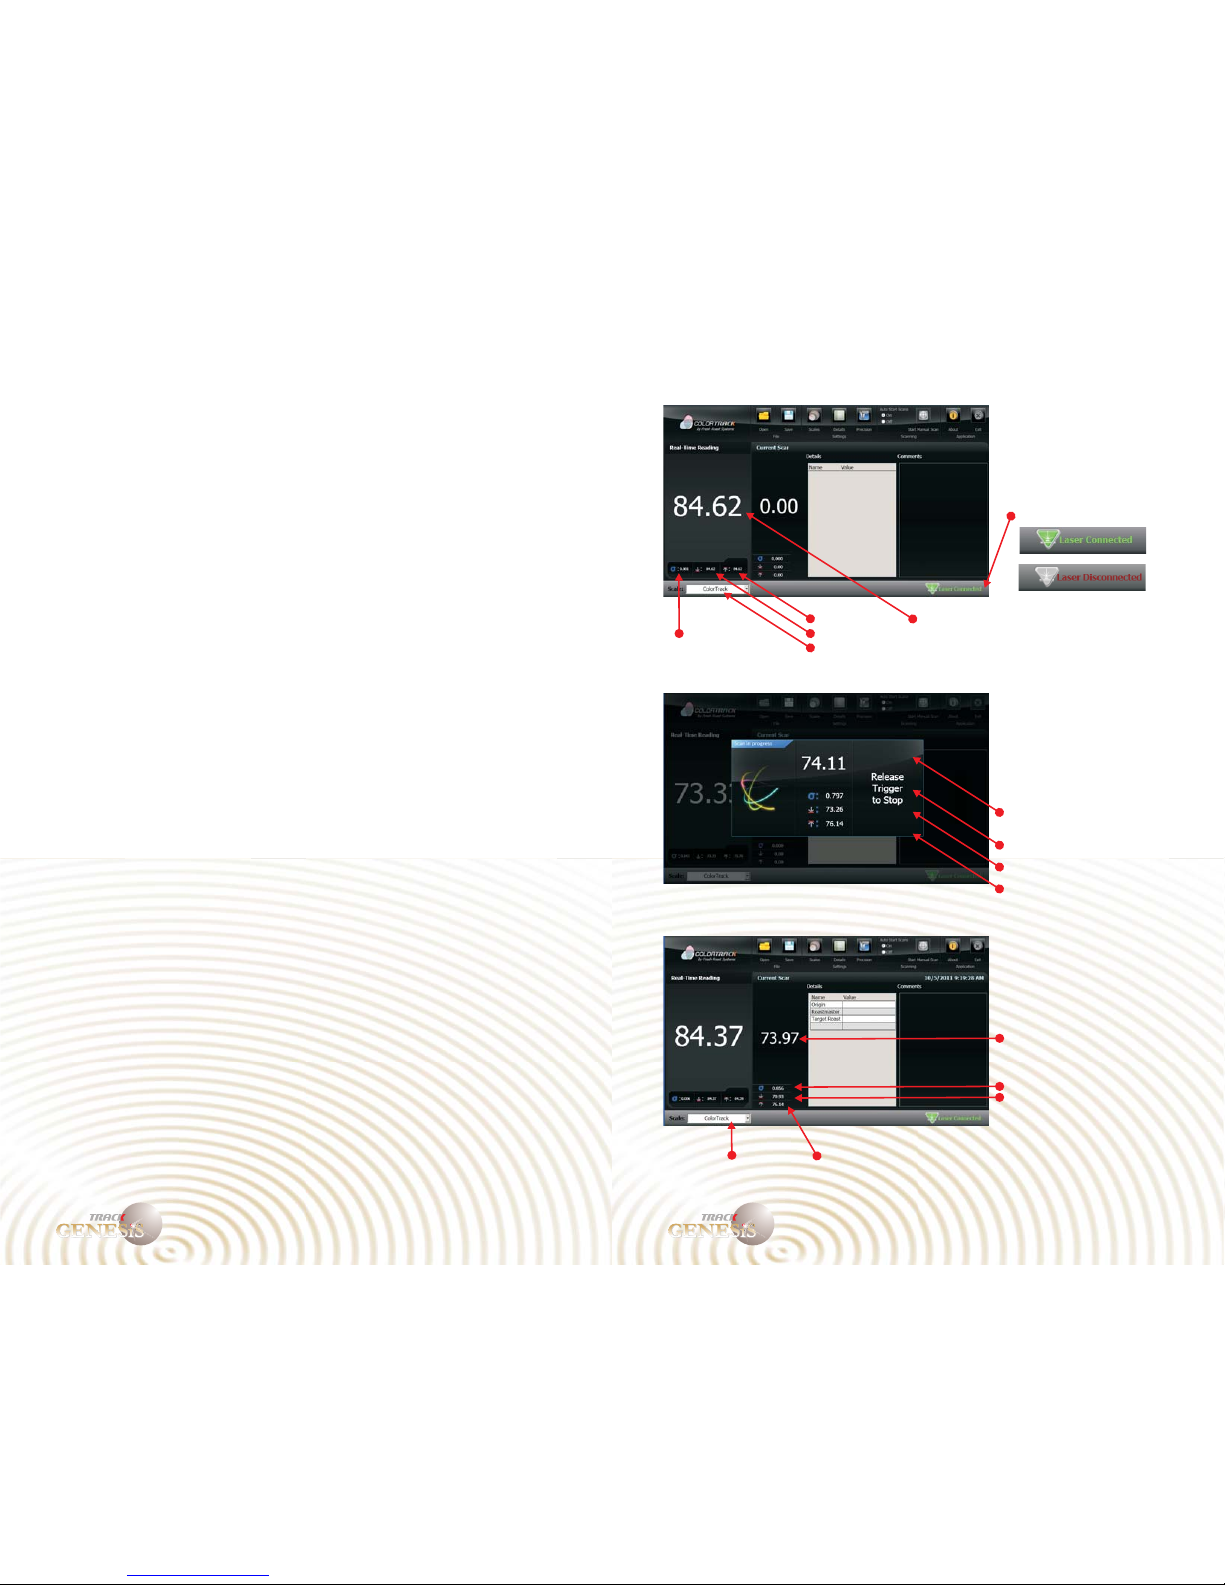
Run/Record a Scan
With the USB cord securely connected, and ColorTrack software running
point the laser at a sample. The ColorTrack program will automatically
begin reading from the device in real-time displaying the results on
screen. To record a final result press the red button on the front of the
laser and hold it for a few seconds while waving it over the sample.
Release it when you feel you have a good stabilized result. The value
will be recorded and displayed in a separate window on your screen.
Ins
Connect the Device
User Reference Guide 5 User Reference Guide 6
TM
GENESiS
COLOR
TM
TM
GENESiS
COLOR
TM
Ready Mode
Recording Mode
Results Mode
Real-time Minimum Reading
Real-time Maximum Reading
Real-time Standard Deviation
Real-time Recorded Reading
Recorded Minimum Reading
Recorded Maximum Reading
Recorded Standard Deviation
Recorded Average Reading
Active Scale
Minimum Reading
Maximum Reading
Real-time Average Reading
Active Scale
Standard Deviation
Laser Connection Indicator
User Reference Guide 7 User Reference Guide 8
TM
GENESiS
COLOR
TM
TM
GENESiS
COLOR
TM
Basic Operation
The ColorTrack Genesis can be used in a number of different ways. The
three basic applications are as a hand held device, a bench or laboratory
unit and with the ColorTrack R/T software as a real-time in line
monitoring system. The hand held and bench unit use basically the same
operation and software and are explained in detail in the next section.
The R/T system incorporates a drastically different system and is
documented in a separate manual included with purchase of the
ColorTrack R/T system.
As a hand held device the ColorTrack device
offers extreme flexibility and portability to
analyze anywhere and anytime. The device
requires nothing more than a USB connection to
a notebook or tablet computer and becomes a
fully portable color analyzer. The method for
connecting the hardware is identical for both the
hand held and the bench unit. Once the software is
started and the device is connected to your computer using the supplied
USB cable, the unit is ready for operation. For the hand held simply
point the device at your sample and the values will be displayed on your
computer in real-time.
The bench unit operates virtually the same way
as the hand held except that the laser is placed
into a cradle in the top of the bench unit and
samples are placed in a dish and inserted
into a drawer with a turntable. Once the
laser is in place and connected to your
computer and a sample is placed in the
drawer and the drawer is closed, the
turntable will start rotating and the laser will
begin to fire and start displaying real time
values on your computer. All of the other
Hand Held and Bench Unit
User Reference Guide 9 User Reference Guide 10
TM
GENESiS
COLOR
TM
TM
GENESiS
COLOR
TM
functions for scanning, recording, features, options and general use of the
software are identical for both methods of operation and are covered
jointly in detail next.
It should be noted that the reason for using the bench unit is to increase
accuracy and eliminate variables. The bench unit provides a much more
controlled environment as any laboratory device should. Elimination of
any variable will almost always increase accuracy and repeatability. For
instance, the bench unit positions the laser in a fixed position both at the
given angle and distance. In addition, the bench unit allows you to
prepare samples more carefully using methods such as leveling.
Although this is not necessary for accurate results, it will increase
accuracy for applications in which a significantly high level of precision
is required.
As already explained, once the device is connected to a computer it is
ready to use. There are some basic concepts in taking samples that should
be observed to insure accurate readings. The device is unique in that it
does not require complex sample
preparation. You can point it at any
angle and virtually any distance
within a foot or two and it will
return consistent results. It should
be noted that consistency in angle
and distance will increase the
accuracy of results. It is
Operation
Scanning
It should be noted that the reason for using the bench unit is to increase
accuracy and eliminate variables. The bench unit provides a much more
Sample Preparation
The ColorTrack system does not require complex sample preparation but
for best results, consistent preparation methods should be observed and
employed. It is highly recommended that samples be prepared carefully
to avoid contamination or inconsistencies that may skew results. When
preparing your samples, try and prepare a level sample. Most importantly
is to prepare samples in such a way as to insure that the bottom of the
dish or container is not viewed or scanned by the laser as this will affect
results.
recommended that the device be pointed at the sample at a distance of
roughly 2-3 inches and waved slightly over the sample. This allows the
device to read more of the sample and give truer results.
When scanning in real-time, point the device at your sample as described
above and watch the real-time display. As the program averages the
readings it will narrow results to a point where it will not change or
change very little. In other words, when you first start scanning a sample
the resulting values will jump up and down from minimum readings to
maximum readings. Over a few seconds the resulting value will stabilize
through averaging. Once it stops moving up or down in value even as
you move the device around over the sample, you have an accurate
reading
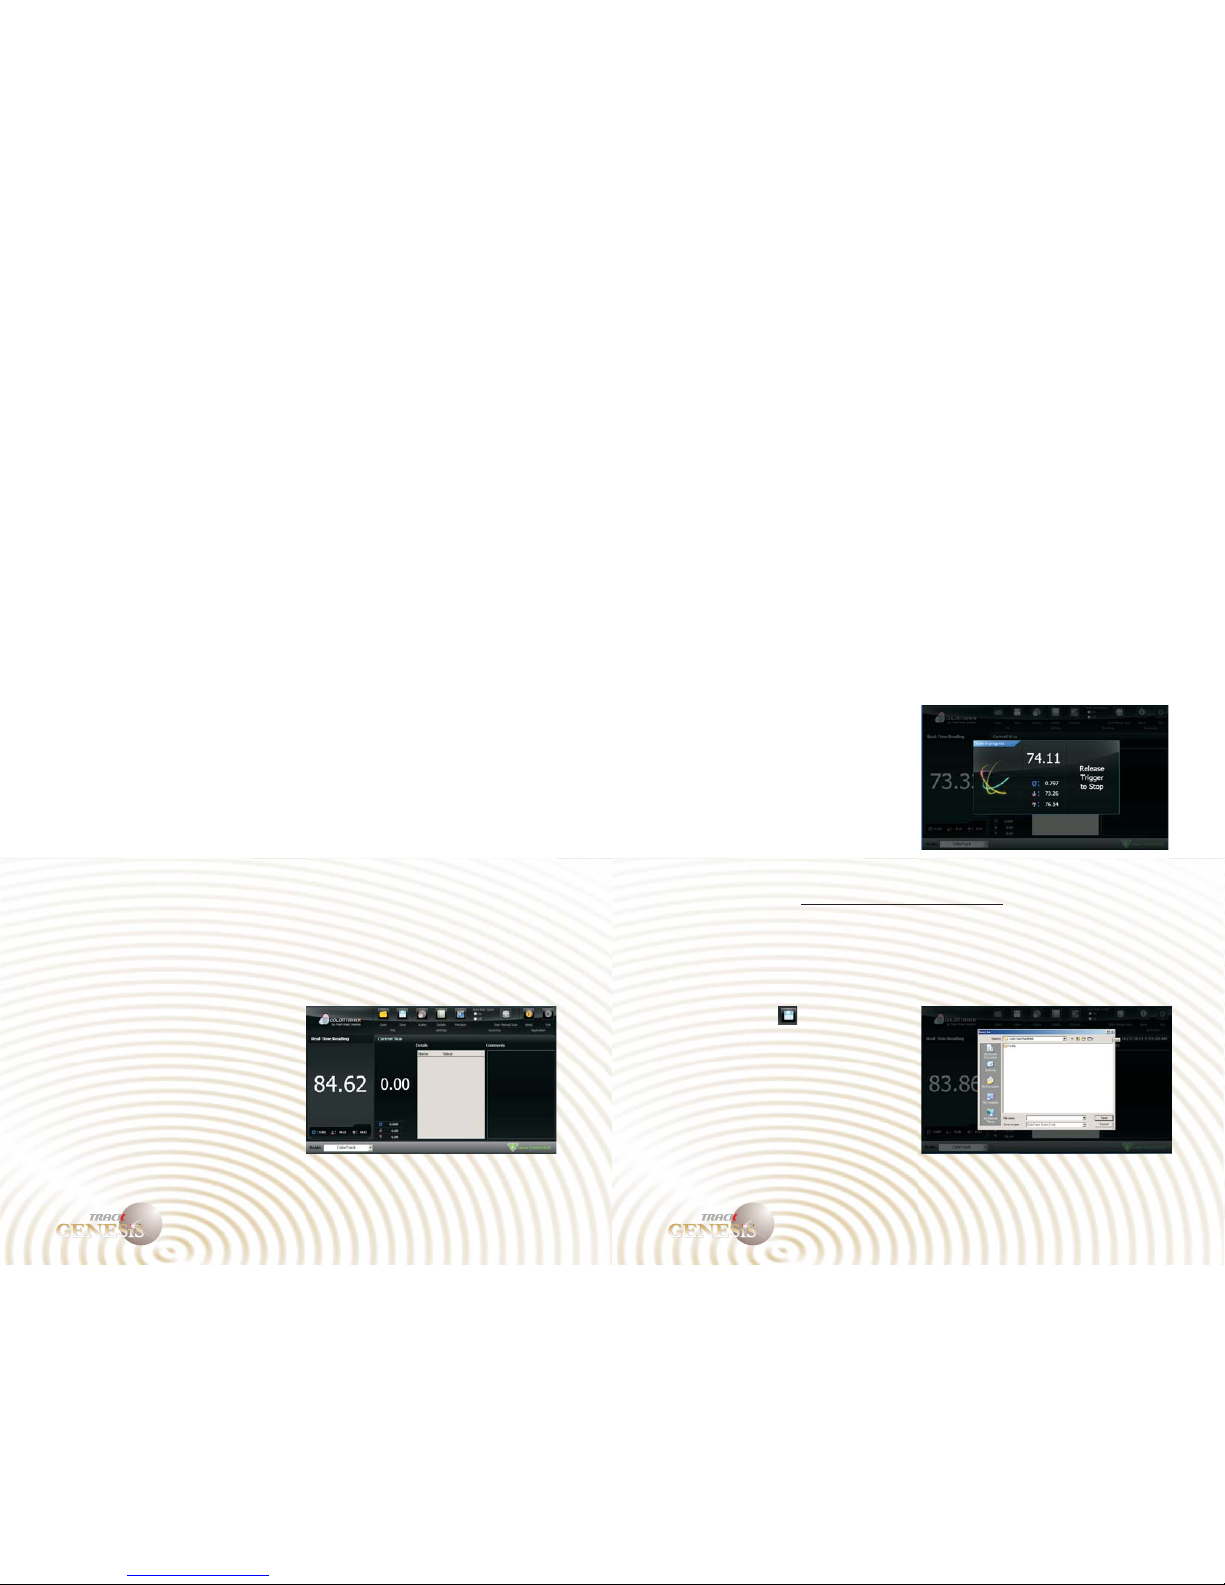
Aside from the real-time readout you may also record a result. Follow
the same procedure to start
scanning and when you are ready
to record, simply press and hold
the red trigger on the front of the
device. The device will continue to
scan, average and record results as
long as the trigger is depressed.
When you have completed your
scan, release the trigger and a static
final result will be displayed
including the average, minimum and maximum reading along with the
standard deviation.
You can save any and/or all of your
recorded results to a database on
your computer that you may also
customize (See “Details Settings”)
The system will save the results
from your current scan for future
Recording Results
Saving Results
(See also: Manual Start/Stop)
Note: Always make sure you release the trigger before moving the device
away or off of the sample or target. Late release of the trigger can cause
the system to read area outside of the sample area.
User Reference Guide 11 User Reference Guide 12
TM
GENESiS
COLOR
TM
TM
GENESiS
COLOR
TM
reference along with any other related information in the database
template that you’d like to attach such as dates, times, comments, sample
names, sample type, etc.
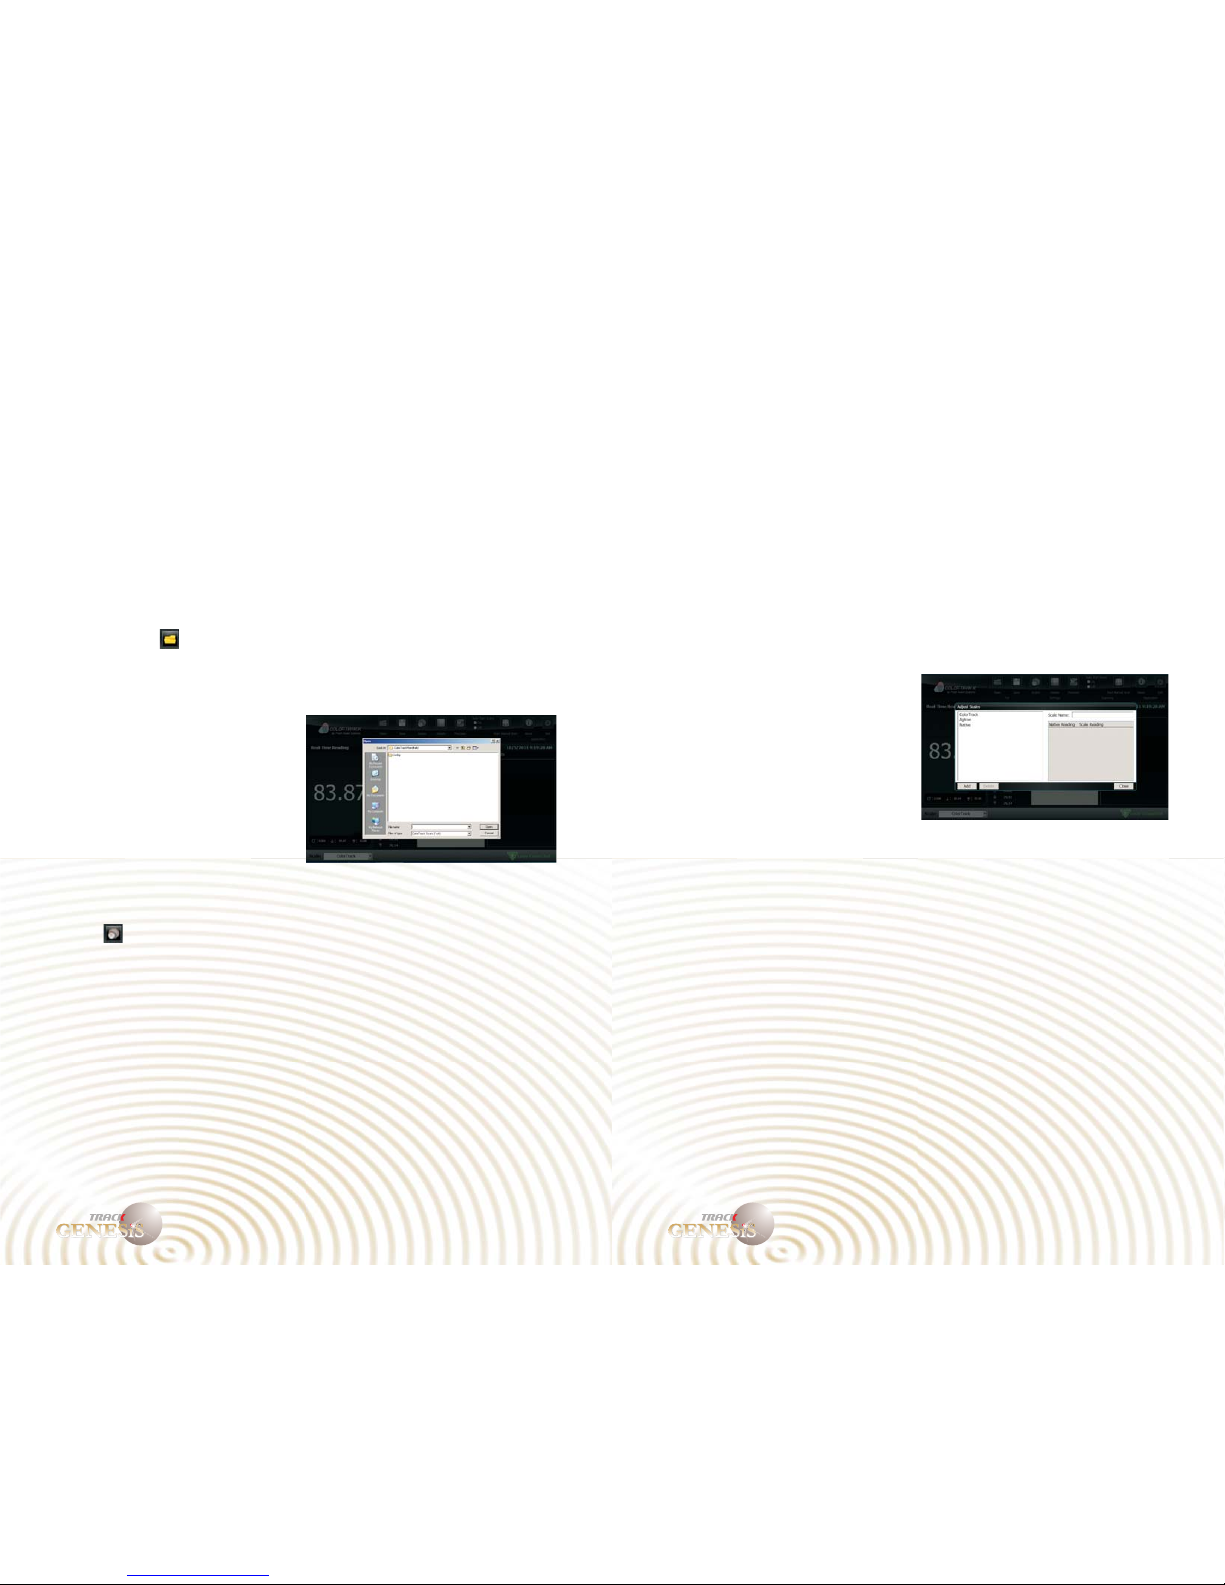
To save results simply press the Save button at the top of the screen after
any newly recorded scan. This will bring up a standard Windows File
Save dialog box. Save the file as you would any Windows file. All you
need to do is enter a name. The format and file extension (.CTF) are
automatically created for you. Once you have entered a name for the file
press the Save File button and your file will be saved. Just remember that
results files are saved, opened and stored the same way as any Windows
file.
Again, opening saved results files is no different than opening files in
any other Windows application. To open a previously saved results file,
press the Open button at the top of
the screen. A standard Windows
Open File dialog will appear with
all of your saved results files.
Simply select the file you want to
open and press the Open button on
the dialog box. The results file will
be loaded into the ColorTrack
program with all of the values and
data associated with the previously
selected saved result.
The Scales function in the ColorTrack software is unique and affords you
a powerful tool. There are many scales for analyzing color such as
Opening Files
Scales
By default the scale will be ColorTrack, however if you'd like to use a
different scale you can change the current scale. To do this, drop down
the Scale list and select the desired scale. The results will be recalculated
to reflect results in the selected scale. You may toggle between any
number of scales if for instance you want to record multiple values from
different scales for the same sample. Once you click on a scale the
system will default to the selected scale and will remain the default scale
until manually changed in the same manner.
ColorTrack, Agtron, Collerette, LaB* as well as standard color models
such as RGB and CYMK.
The Scales function basically allows you to add, create and/or edit a
scales. In other words, you can have many different color models on your
system not to mention creating custom scales of your own if so needed.
Operation is straight forward and you simply correlate native values to
any given scale. So, if you have known Agtron values for samples, you
can create or edit the Agtron scale so that the ColorTrack reads
identically. In essence, it allows you to calibrate the ColorTrack to any
known reflectivity device.
You may also create entirely customized scales to fit your needs. For
instance you may desire broader range. If you have a material or sample
that falls into a very tight or limited range, you can create a scale that
stretches the range to create greater
differentiation for the scale. For
example, if you have a series of
samples that fall within ColorTrack
values of only 50-60, you may
want greater differentiation than 10
points. Simply create a new scale
in which the 50 value equals 10
and the 60 value equals 100. This
will in effect stretch the range. The
ColorTrack will automatically insert the calculations to adjust the
readings when scanning each time the alternate scale is selected.
If you'd like to adjust the way any of the scales work, or if you'd like to
add a new scale you may do so by using the Scales section of the control
panel. Select the Scales button and you will be presented with a list of
your existing scales and those that come with your software. There are a
number of fields: Scale Name, Actual Light Reading, Desired Light
Reading, Actual Dark Reading, Desired Dark Reading, Maximum Value,
and Minimum Value. These fields go into a formula that results in the
converted value.
The formula is similar to the Fahrenheit to Celsius conversion. You may
notice that maximum value and minimum value are not used in the
formula. This is because the maximum and minimum values are only
used to find the range of the chart's x axis.

User Reference Guide 13 User Reference Guide 14
TM
GENESiS
COLOR
TM
TM
GENESiS
COLOR
TM
Let’s look at exactly how to create the scale in the previous example.
Press the Scales button at the top of the screen. The Adjust Scales dialog
box will be displayed. On the left are the existing scales and on the right
are the values for correlation. Select the scale you want to edit by
highlighting it or press the Add button to create an entirely new scale. To
build your scale simply enter native values on the left and desired values
on the right. In the previously
mentioned example we wanted a
scale that read between 50-60 to
read from 10-100. To do this, enter
50 on the left under Native
Reading and 10 on the right under
Scale Reading. Go to the next line
and enter 60 on the left under
Native Reading and 100 on the
right under Scale reading. The new
or edited scale will be saved when you exit and will then appear in the
Scales drop down selection box at the lower left hand portion of your
screen. Anytime you want to use the new or edited scale, simply select it
from the drop down box and results will adjust to the selected scale. You
can also toggle back and forth and select different scales.
In the above example what will actually happen is that the software will
still read a native 50 value internally, but when the alternate scale is
selected, the program will display 10 as a value. When the system reads
60, the program will display 100. For any values in between, the system
will make a calculation based on the range and increments in between on
a straight line percentage basis and or formulae should you enter more
than two values for scaling.
One note on scales is that the simple example above is merely
representative of how the scaling function works. Ideally, you would
have many more, or at least three values (light, medium and dark) to
correlate to. The more values and points of correlation you have, the
more accurate the scale will be.
As stated earlier, you can enter additional information for your results by
attaching data fields which are filled out at the end of a recorded scan. To
Details Settings/ Creating Database Fields
create fields select Details Setting from the menu. A list of the current
fields available will be listed on the left. To edit or change the fields,
simply type in the value or heading
for the field. You may enter as
many fields as you like. After you
have finished the new fields will
show up and you can then type in
the actual value to the right of the
heading on each recorded scan or
when desired. Any data entered and
then saved to a file will include all
of the database criteria and values
as well.
Precision
Manual Start/Stop
The precision is the decimal
precision you require to be
displayed. You can set the
precision by going to menu and
then adjusting the decimal places
to be used for each scan for both
the average and the standard
deviation. You may add up to four decimal places of display.
The Manual Start function allows
you to start and stop recording
scans from your computer as
opposed to the device and trigger.
In order to use this function you
need to disable the Auto Start
Scans function by selecting the
radio button at the top of the
screen. This will give control for
recording scans to your computer
controls versus the trigger on the
device.
This is commonly used when the
device is installed in a ColorTrack

User Reference Guide 15 User Reference Guide 16
TM
GENESiS
COLOR
TM
TM
GENESiS
COLOR
TM
bench unit or if the device is not being used by hand or is in someway
mounted to perform scans, e.g., on a tripod.
Once you have disabled the auto scan feature all control is returned to the
controls in your software. To start a scan simply press the start button at
the top of the screen. It will continue to read until you press the stop
button at which time it will display the final results just as if you had
pressed the button on the device itself.
The About function will list your
status and software version. You
can use this function to check that
you have the most up to date
version of the ColorTrack
software.
About
Exit
The Exit function will shut down the software.
Understanding and Interpreting the Results
There are a number of values and data displayed in the results window and graph
which you may or may not find useful for your specific purposes. Understand the
data will allow you to decide which results data serves your purposes best.
The basic data at the top of the graph window will display five important
components of the scan in units based on the selected scale:
- The average is the average for the sample based on total number of
scans at any given value. Total number of scans or “hits” can be calculated as
time of scan multiplied by 10,000 as the laser is producing 10,000 reading per
second. So, for a twenty second scan the average would be average of 200,000
readings.
- Logically, these values represent the entire range
of values found in the sample from lightest to darkest or darkest to lightest
depending on which scale you are using.
- In probability theory and statistics, the standard
deviation of a statistical population, a data set, or a probability distribution is the
square root of its variance. Standard deviation is a widely used measure of the
variability or dispersion, being algebraically more tractable though practically
less robust than the expected deviation or average absolute deviation. It shows
how much variation there is from the "average" (mean).
A low standard deviation would indicate that the readings for the given sample
tend to be very close to the mean, whereas a high standard deviation would
indicate that the readings were spread out over a large range of values. In other
words, this value will most likely indicate the level of consistency of a sample as
it relates to color and reflectivity.
1. Average
2. Minimum and Maximum
3. Standard Deviation
 Loading...