

Page 1

R8000 SERIES
COMMUNICATIONS SYSTEM ANALYZER
AUTOTUNE USER GUI DE
Harris XL-200 Port able
Freedom Communicati on Tec hnologies
2002 Synergy Blvd, Suite 200
Kilgore, Texas 75662
Copyright 2017 Freedom Communication Technologies
All Rights Reserved
Printed in U.S.A.
FCT-1201A
Page 2

Harris XL-200 Portable Series AutoTune™ User Guide
i
AUTOTUNE™ SOFTWARE LICENSE AGREEMENT
The software license agreement governing use of the R8000 Series
Communications System Analyzer AutoTune™ software is located in FCT-1365
R8000 Series Communications System Analyzer Operator’s Manual.
CREDITS
The Freedom Communication Technologies logo and Freedom Communication
Technologies are registered ® trademarks of Freedom Communication
Technologies.
Harris is a registered trademark of Harris Corporation.
OpenG License
Copyright (c) 2002, Cal-Bay Systems, Inc. <info@calbay.com>
Copyright (c) 2002, Jean-Pierre Drolet <drolet_jp@hotmail.com>
Copyright (c) 2002-2007, Jim Kring <jim@jimkring.com>
Copyright (c) 2002-2005, Rolf Kalbermatter <rolf.kalbermatter@citeng.com>
Copyright (c) 2003-2004, Paul F. Sullivan <Paul@SULLutions.com>
Copyright (c) 2004, Enrique Vargas <vargas@visecurity.com>
Copyright (c) 2004, Heiko Fettig <heiko.fettig@gmx.net>
Copyright (c) 2004, Michael C. Ashe <michael.ashe@imaginatics.com>
Copyright (c) 2005-2006, MKS Instrument s, Inc., auth or: Doug Femec
<doug_femec@mkins t.com>, IM dafemec
Copyright (c) 2006, JKI <info@jameskring.com>
Copyright (c) 2006, JKI <info@jameskring.com>; Authors: Jim Kring
<jim@jimkring.com>, Philippe Guerit <pjm_labview@yahoo.com>
Copyright (c) 2007, JKI <info@jameskring.com> (Author: Jim Kring
<jim.kring@jameskring.com>)
Copyright (c) 2008, Ton Plomp <t.c.plomp@gmail.com>
All rights reserved.
Redistribution and use in source and binary forms, with or without modification,
are permitted provided that the following conditions are met:
- Redistributions of source code must retain the above copyright notice, this
list of conditions and the following disclaimer.
- Redistributions in binary form must reproduce the above copyright notice, this
list of conditions and the following disclaimer in the documentation and/or
other materials provided with the distribution.
- Neither the name of the SciWare, James Kring, Inc., nor the names of its
contributors may be used to endorse or promote products derived from this
software without specific prior written permission.
Page 3

Harris XL-200 Portable Series AutoTune™ User Guide
ii
THIS SOFTWARE IS PROVIDED BY THE COPYRIGHT HOLDERS AND
CONTRIBUTORS "AS IS" AND ANY EXPRESS OR IMPLIED WARRANTIES,
INCLUDING, BUT NOT LIMITED TO, THE IMPLIED WARRANTIES OF
MERCHANTABILITY AND FITNE SS FOR A PARTICULAR PURPOSE ARE
DISCLAIMED. IN NO EVENT SHALL THE COPYRIG HT HOLDER OR
CONTRIBUTORS BE LIABLE FOR ANY DIRECT, INDIRECT, INCIDENTAL,
SPECIAL, EXEMPLARY, OR CONSEQUENTIAL DAMAGES (INCLUDING, BUT
NOT LIMITED TO, PROCUREMENT OF SUBSTITUTE GOODS OR SERVICES;
LOSS OF USE, DATA, OR PROFITS; OR BUSINESS INTERRUPTION)
HOWEVER CAUSED AND ON ANY THEORY OF LIA BILITY, WHETHER IN
CONTRACT, STRICT LIABILITY, OR TORT (INCLUDING NEGLIGENCE OR
OTHERWISE) ARISING IN ANY WAY OUT OF THE USE OF THIS
SOFTWARE, EVEN IF ADVISED OF THE POSSIBILITY OF SUCH DAMAGE.
MGI License
Copyright (c) 2010-2013, Moore Good Ideas, inc.
All rights reserved.
Redistribution and use in source and binary forms, with or without modific ati o n,
are permitted provided that the following conditions are met:
- Redistributions of source code must retain the above copyright notice, this
list of conditions and the following disclaimer.
- Redistributions in binary form must reproduce the above copyright notice, this
list of conditions and the following disclaimer in the documentation and/or
other materials provided with the distribution.
- Neither the name of Moore Good Ideas, Inc., nor the names of its
contributors may be used to endorse or promote products derived from this
software without specific prior written permission.
THIS SOFTWARE IS PROVIDED BY THE COPYRIGHT HOLDERS AND
CONTRIBUTORS "AS IS" AND ANY EXPRESS OR IMPLIED WARRANTIES,
INCLUDING, BUT NOT LIMITED TO, THE IMPLIED WARRANTIES OF
MERCHANTABILITY AND FITNE SS FOR A PARTICULAR PURPOSE ARE
DISCLAIMED. IN NO EVENT SHALL THE COPYRIG HT HOLDER OR
CONTRIBUTORS BE LIABLE FOR ANY DIRECT, INDIRECT, INCIDENTAL,
SPECIAL, EXEMPLARY, OR CONSEQUENTIAL DAMAGES (INCLUDING, BUT
NOT LIMITED TO, PROCUREMENT OF SUBSTITUTE GOODS OR SERVICES;
LOSS OF USE, DATA, OR PROFITS; OR BUSINESS INTERRUPTION)
HOWEVER CAUSED AND ON ANY THEORY OF LIA BILITY, WHETHER IN
CONTRACT, STRICT LIABILITY, OR TORT (INCLUDING NEGLIGENCE OR
OTHERWISE) ARISING IN ANY WAY OUT OF THE USE OF THIS
SOFTWARE, EVEN IF ADVISED OF THE POSSIBILITY OF SUCH DAMAGE.
Page 4

Harris XL-200 Portable Series AutoTune™ User Guide
iii
TABLE OF CONTENTS
1. Introduction .................................................................................................... 1
2. Scope ............................................................................................................ 1
3. Conventions ................................................................................................... 1
3.1. PPM ......................................................................................................... 1
4. Important Notes ............................................................................................. 1
4.1. Required firmware ................................................................................... 1
4.2. Conventional channel sel ec ti on ............................................................... 1
4.3. Supported models .................................................................................... 1
5. Harris XL-200 Portable Radio Test Setup ...................................................... 1
5.1. XL-200 Portable Test Setup ..................................................................... 1
6. Harris XL-200 Portable Alignment and Test Descriptions .............................. 2
6.1. Synthesizer Performa nce Test ................................................................. 2
6.2. TCXO Frequency ..................................................................................... 3
6.3. RSSI ........................................................................................................ 4
6.4. TX Power ................................................................................................. 6
6.5. Tx CTCSS/CDCSS Modulation and Composite Deviation ....................... 7
6.6. P25 Phase 1 Tx Modulation Fidelity (C4FM) Test ................................... 8
6.7. P25 Phase 1 Tx Deviation (C4FM) Test .................................................. 9
6.8. P25 Phase 1 Rx Sensitivity (C4FM) Test ............................................... 10
6.9. P25 Phase 2 Rx Sensitivity (TDMA) Test .............................................. 11
Basic Troubleshooting ..................................................................................... 12
7. Support Information ..................................................................................... 13
7.1. Technical Support .................................................................................. 13
7.2. Sales ...................................................................................................... 13
APPENDIX A. Test Limits .............................................................................. A-1
APPENDIX B. Sample Test Result Report ..................................................... B-1
APPENDIX C. Revision History ...................................................................... C-1
Page 5

Harris XL-200 Portable Series AutoTune™ User Guide
iv
LIST OF FIGURES
Figure 5-1. XL-200 Portable Test Setup Diagram ................................................ 1
Figure B-1. Sample Test Result Report ............................................................ B-2
Page 6

Harris XL-200 Portable Series AutoTune™ User Guide
v
LIST OF TABLES
Table 6-1. Synthesizer Performance test results .................................................. 2
Table 6-2. Analyzer Configuration for TCXO Frequency ....................................... 3
Table 6-3. TCXO Frequency alignment results ..................................................... 3
Table 6-4. TCXO Frequency test results ............................................................... 3
Table 6-5. Analyzer Configuration for RSSI .......................................................... 4
Table 6-6. RSSI alignment results ........................................................................ 4
Table 6-7. RSSI test results .................................................................................. 5
Table 6-8. Analyzer Configuration for TX Power ................................................... 6
Table 6-9. TX Power test results ........................................................................... 6
Table 6-10. Analyzer Configuration for Tx CTCSS/CDCSS Modulation test ......... 7
Table 6-11. Tx CTCSS/CDCSS Modulation test results ....................................... 7
Table 6-12. Analyz er Config urat ion for P25 Phase 1 Tx Tests (C4FM) ................ 8
Table 6-13. Tx P25 Phase 1 Modulation Fidelity (C4FM) results .......................... 8
Table 6-14. Tx P25 Phase 1 Symbol Deviation (C4FM) results ............................ 8
Table 6-15. Analyzer Configuration for P25 Phase 1 Tx Deviation (C4FM) test ... 9
Table 6-16. Tx P25 Phase 1 Deviation (C4FM) test results .................................. 9
Table 6-17. Analyzer Configuration for P25 Phase 1 Rx Sensitivity (C4FM) test 10
Table 6-18. P25 Phase 1 Rx Sensitivity (C4FM) test results .............................. 10
Table 6-19. Analyzer Configuration for P25 Phase 2 Rx Sensitivity (TDMA) test11
Table 6-20. P25 Phase 2 Rx Sensitivity (TDMA) test results .............................. 11
Table 6-21. Harris XL-200 Portable Series Troubl es hooting Chart ..................... 12
Table A-1. Default Harris XL-200 Portable Limits ............................................. A-2
Page 7

Harris XL-200 Portable Series AutoTune™ User Guide
1
1. Introduction
The Freedom Communication Technologies R8000 Series Communications System
Analyzer AutoTune™ (hereafter “AutoTune”) provides an automated test and alignment
solution for supported two-way radios.
2. Scope
This document includes information regarding the tests and alignments performed for
supported radios by AutoTune. This document is restricted to radio-specific information
for Harris XL-200 Portable series radios.
Please refer to the R8000 Series Communications System Analyzer Owner’s Manual
(FCT-1365) for an overview and basic operating instructions for AutoTune itself.
3. Conventions
3.1. PPM
“ppm” is “parts per million”. This specification is generally limited to frequency-related
measurements. If the frequency units are in MHz, then the ppm specification is in Hz.
For example, a 169.075 MHz frequency with a ±1.5 ppm specification is allowed to vary
by 1.5 * 169.075 MHz, or about ±254 Hz.
4. Important Notes
4.1. Required firmware
Harris XL-200P series radios must be running XLP R02D01 firmware or later for
AutoTune to successfully run. XLP R03C09 firmware or later is required for AutoTune to
successfully run the RSSI align.
4.2. Conventional channel sel ec t ion
The radio must have a conventional channel selected before AutoTune servicing
begins. A trunked channel if selected is known to cause radio communication
initialization failures.
4.3. Supported models
The following Harris XL-200 series models are supported by AutoTune:
• XL-200P
Page 8
Harris XL-200 Portable Series AutoTune™ User Guide
1
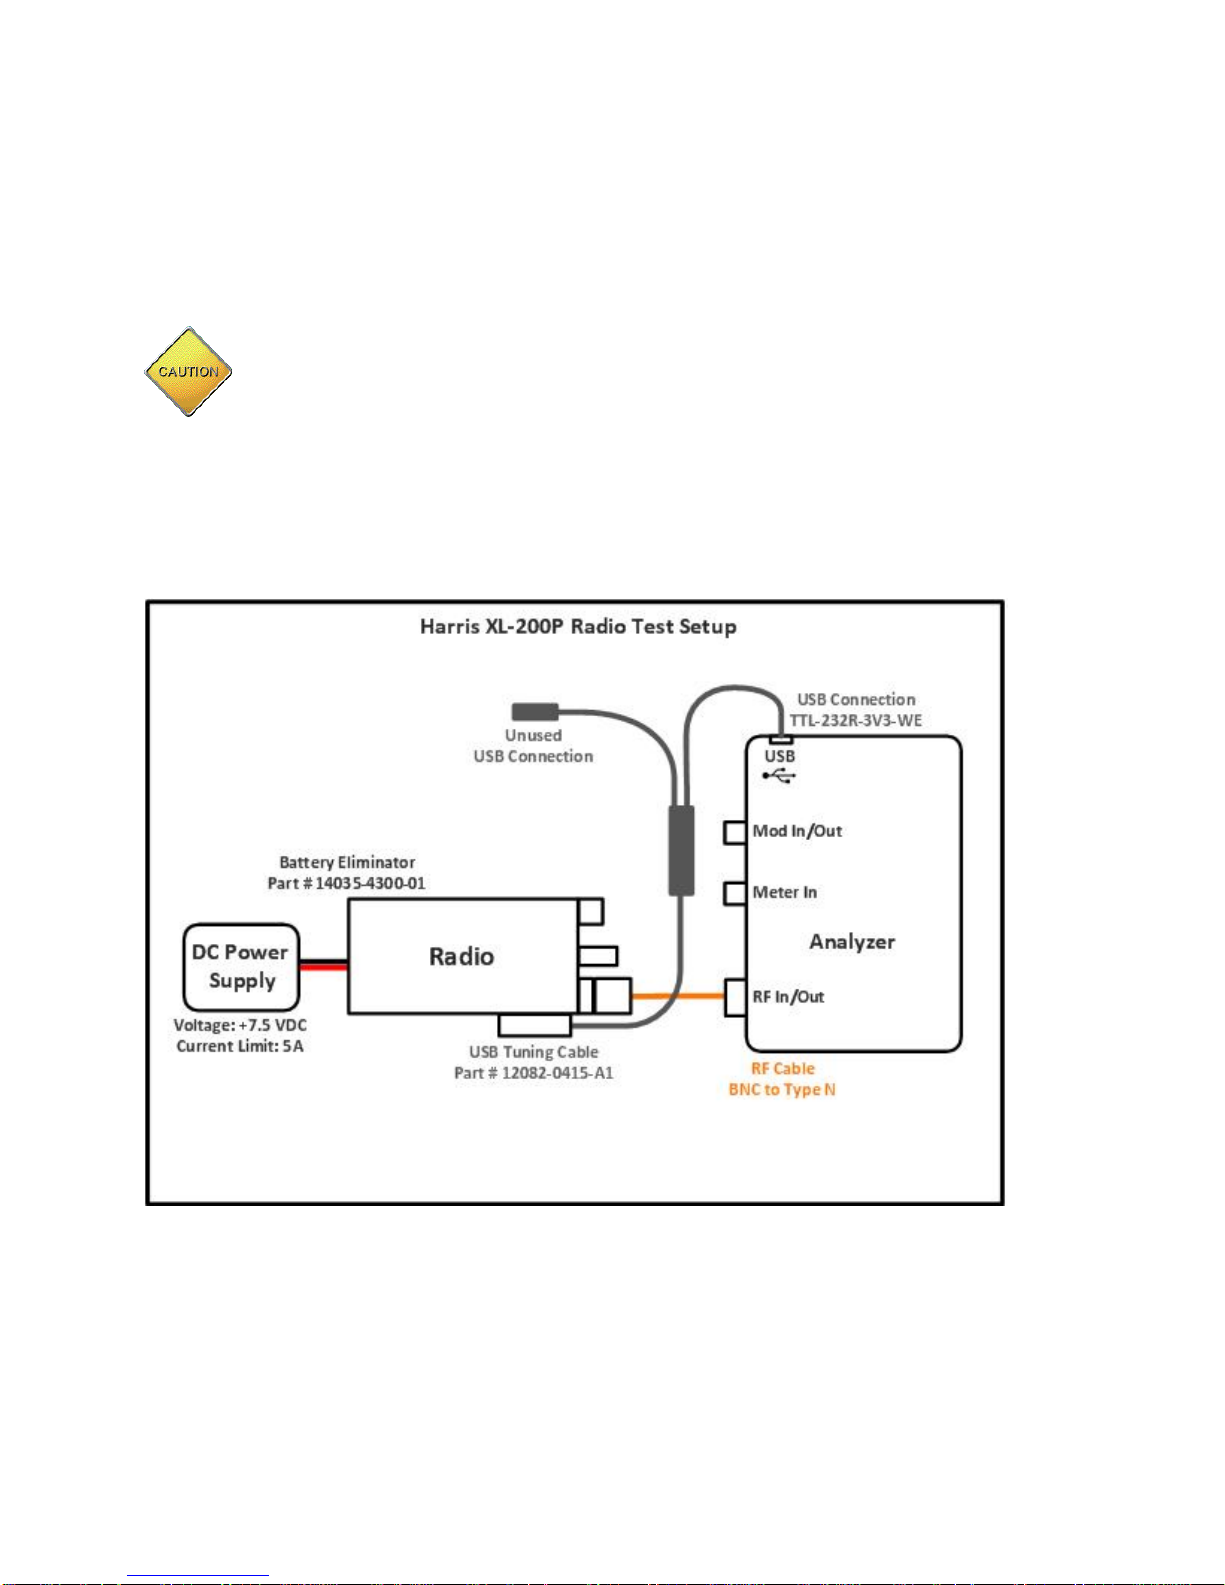
5. Harris XL-200 Portable Radio Test Setup
In order to perform the test and alignment procedures, the XL-200 Portable radio mus t
be connected to the R8000 Communications System Analyzer as shown in the figure
below.
Make certain that the radio under test is configured as described in the
corresponding diagram before attempting to perform the indicated alignment
or test. Failure to do so may result in poor radio performance and/or damage
to the analyzer or radio equipment under test.
5.1. XL-200 Portable Test Setup
Refer to the diagrams below for proper test setup.
Figure 5-1. XL-200 Portable Test Setup Diagram
Page 9

Harris XL-200 Portable Series AutoTune™ User Guide
2
Name
Description
Result
Pass or Fail. Synthesizer circuit locked
Frequency
Test Frequency
Synth Lock
Synthesizer circuit locked
6. Harris XL-200 Portable Alignment and Test Descriptions
Note: Throughout this section are references to Test Frequency that are band and
mode specific. A table of the frequencies used by each band may be found in the
respective radio service manual.
6.1. Synthesizer Perfor m ance Test
The Synthesizer Performance test checks the lock range of the synthesizer circuits.
6.1.1. Test
The radio is set to the first Rx test frequency at the lower end of the first Rx RF Band.
The user will be asked to check the radio display for an alarm message. If no alarm
message is display, the synthesizer circuit is locked. All ends of the Rx RF Bands are
tested. Next, the radio is set to the first Tx test frequency at the lower end of the first Tx
RF Band. The radio is keyed for 2 seconds. The user will be asked to check the radio
display for an alarm message. If no alarm message is display, the synthesizer circuit is
locked. All ends of the Tx RF Bands are tested.
Table 6-1. Synthesizer Performance test results
Page 10

Harris XL-200 Portable Series AutoTune™ User Guide
3
RF Control
Port
Frequency
Modulation
Output Level /
Attenuation
Generate
RF IN/OUT
Test Frequency
FM
-70 dBm
Monitor
RF IN/OUT
Test Frequency
FM
30 dB
Name
Description
Result
Pass or Fail. Frequency Error within Max Limit, Min Limit.
Frequency
Test Frequency
Freq Error
Measured frequency er r or
Min Limit
Minimum Limit (inclusive) for frequency error alignment
Max Limit
Maximum Limit (inclusive) for frequency error alignment
Old Softpot
Radio softpot before alignment
New Softpot
Radio softpot after alignment
Name
Description
Result
Pass or Fail. Frequency Error within Max Limit, Min Limit.
Frequency
Test Frequency
Freq Error
Measured frequency er r or
Min Limit
Minimum Limit (inclusive) for frequency error
Max Limit
Maximum Limit (inclusive) for frequency error
Softpot
Radio softpot producing the frequency error
6.2. TCXO Frequency
Table 6-2. Analyzer Configuration for TCXO Frequency
6.2.1. Alignment
The radio is placed into Test Mode at the first Rx Test Frequency, and the analyzer is
set to generate as listed in Table 6-2. The radio is queried to tune the TCXO softpot and
returns the new softpot value. The new softpot radio is written to the radio. After
programming the new softpot value, the radio is set to the first Tx Test Frequency and
commanded to transmit. The analyzer is set to measure as listed in Table 6-2. The
frequency error is measured by the analyzer and compared to the test limits. The final
results are written to the log file.
Table 6-3. TCXO Frequency alignment results
6.2.2. Test
The radio is placed into Test Mode at the first Tx Test Frequency and commanded to
transmit. The analyzer is set to measure as listed Table 6-2. The frequency error is
measured by the analyzer and compared to the test limits. This process is repeated for
each Test Frequency. The final results are written to the log file.
Table 6-4. TCXO Frequency test results
Page 11

Harris XL-200 Portable Series AutoTune™ User Guide
4
RF Control
Port
Frequency
Modulation
Output Level /
Attenuation
Generate
RF IN/OUT
Test Freq
None
-95 dBm
Name
Description
Result
Pass or Fail. RSSI within Max Limit, Min Limit.
Frequency
Test Frequency
Old Softpot
Radio softpot before alignment
New Softpot
Radio softpot after alignment
RSSI
Measured frequency er r or
Min Limit
Minimum Limit (inclusive) for RSSI alignment
Max Limit
Maximum Limit (inclusive) for RSSI alignment
6.3. RSSI
Table 6-5. Analyzer Configuration for RSSI
6.3.1. Alignment
The radio is placed into Test Mode at the first Rx Test Frequency, and the analyzer is
set to generate as listed in Table 6-5. The radio RSSI level is checked without a carrier
signal for interference. If interference is detected, the radio Rx frequency and the
analyzer frequency are changed by 75kHz until there is no interference. The analyzer
RF signal is turned on. The RSSI level is measured by the radio at the RSSI softpot
limits. These RSSI measurements are used to calculate the softpot value which
matches the RSSI level to the output level of the analyzer, and the calculated softpot is
saved to the radio. The RSSI level is measured by the radio and compared to the test
limits. This process is repeated for each Test Frequency. The final results are written to
the log file.
Table 6-6. RSSI alignment results
6.3.2. Test
The radio is placed into Test Mode at a Rx Test Frequency, and the analyzer is set to
generate as listed Table 6-5. The radio RSSI level is check without a carrier signal for
interference. If interference is detected, the rest of the test is skipped, and results are
written to the log file. The analyzer RF signal is turned on. The RSSI level is measured
by the radio and compared to the test limits. This proc ess is re pe at ed f or each Test
Frequency. The final results are written to the log file.
Page 12

Harris XL-200 Portable Series AutoTune™ User Guide
5
Name
Description
Result
Pass or Fail. Frequency Error within Max Limit, Min Limit.
Frequency
Test Frequency
RSSI Intrf
Measured RSSI level to check for interference with no RF
signal
RSSI
Measured RSSI level
Min Limit
Minimum Limit (inclusive) for RSSI
Max Limit
Maximum Limit (inclusive) for RSSI
Softpot
Radio softpot producing the RSSI
Table 6-7. RSSI test results
Page 13

Harris XL-200 Portable Series AutoTune™ User Guide
6
RF
Control
Port
Frequency
Modulation
Attenuation
Monitor
RF IN/OUT
Test Frequency
FM
40 dB
Name
Description
Result
Pass or Fail. Power Out within Max Limit, Min Limit
Frequency
Test Frequency
Power Out
Measured radio output level
Min Limit
Minimum Limit (inclusive) for Power Out
Max Limit
Maximum Limit (inclusive) for Power Out
6.4. TX Power
Table 6-8. Analyzer Configuration for TX Power
6.4.1. Test
The radio is commanded to transmit. Beginning at the first Tx Test Freq uency, the
output level is measured at each TX Test Frequency, for Low and High Power, and
compared to the test limits. The final results are written to the log file.
Table 6-9. TX Power test results
Page 14

Harris XL-200 Portable Series AutoTune™ User Guide
7
RF
Control
Port
Frequency
Modulation
Attenuation
Dev Avg
Monitor
RF IN/OUT
Test Frequency
FM
30 dB
+/-Peak / 2
Name
Description
Result
Pass or Fail. CTCSS or CDCSS deviation levels are within
limits, and CTCSS tone/CDCSS code is accurate.
Frequency
Test Frequency
CTCSS Dev
Measured CTCSS or CDCSS deviation level
Min Dev
Minimum CTCSS or CDCSS deviation level (inclusive)
Max Dev
Maximum CTCSS or CDCSS deviation level (inclusive)
Meas Tone|Meas Code
Measured CTCSS tone frequency or CDCSS code
6.5. Tx CTCSS/CDCSS Modula ti on a nd Composite Deviation
The Tx CTCSS/CDCSS Modulation test measures the radio’s CTCSS or CDCSS
deviation levels and tone or code accuracy for each test frequency.
Table 6-10. Analyzer Configuration for Tx CTCSS/CDCSS Modulation test
6.5.1. Test
For each test frequency and bandwidth (Wide, Narrow, NPSPAC) supported, the radio
transmits CTCSS tones and CDCSS codes at rated deviation levels. The ±Peak / 2averaged deviations of these individual tones/codes and the composite levels are
measured with the analyzer for CTCSS tone or CDCSS code accuracy. The test results
are written to the log file.
Table 6-11. Tx CTCSS/CDCSS Modulation test results
Page 15

Harris XL-200 Portable Series AutoTune™ User Guide
8
RF
Control
Port
Frequency
Modulation
Attenuation
Dev Avg
Monitor
RF IN/OUT
Test Frequency
C4FM
30 dB
Peak Avg
Name
Description
Result
Pass or Fail. Modulation fidelity is between Min Limit and Max
Limit.
Frequency
Test Frequency
Meas Mod Fidelity
Measured P25 Phase 1 C4FM modulation fidelity
Min Mod Fidelity
Minimum passable modulation fidelity level
Max Mod Fidelity
Maximum passable modulation fidelity level
Name
Description
Result
Pass or Fail. Sy mbol deviation is between Min Limit and Max
Limit.
Frequency
Test Frequency
Meas Sym Deviation
Measured P25 Phase 1 C4FM symbol deviation
Min Sym Deviation
Minimum symbol deviation fidelity level
Max Sym Deviation
Maximum symbol deviati on fi del i ty level
6.6. P25 Phase 1 Tx Tests (C4FM)
The Tx P25 Phase 1 Tx Tests (C4FM) measures the radio’s P25 Phase 1 C4FM
modulation fidelity level and symbol deviation at multiply test frequencies with a random
pattern.
Table 6-12. Analyzer Configuration for P25 Phase 1 Tx Tests (C4FM)
6.6.1. Test
The radio is set to a digital channel at low power at the first Tx Test Freq uenc y and
commanded to transmit a random deviation pattern. The modulation fidelity and symbol
deviation of this tone is measured with the analyzer. This process is repeated for each
Test Frequency. The test results are written to the log file.
Table 6-13. Tx P25 Phase 1 Modulation Fidelity (C4FM) results
Table 6-14. Tx P25 Phase 1 Symbol Deviation (C4FM) results
Page 16

Harris XL-200 Portable Series AutoTune™ User Guide
9
RF
Control
Port
Frequency
Modulation
Attenuation
Dev Avg
Monitor
RF IN/OUT
Test Frequency
C4FM
30 dB
Peak Avg
Name
Description
Result
Pass or Fail. Deviation is between Min Limit and Max Limit.
Frequency
Test Frequency
Meas Dev
Measured P25 Phase 1 C4FM deviation
Min Dev
Minimum passable deviation level
Max Dev
Maximum passable deviation level
6.7. P25 Phase 1 Tx Deviation (C4FM) Test
The Tx P25 Phase 1 Tx Deviation (C4FM) test measures the radio’s P25 Phase 1
C4FM deviation level at specific test frequencies for both High and Low Patterns.
Table 6-15. Analyzer Configuration for P25 Phase 1 Tx Deviation (C4FM) test
6.7.1. Test
The radio is set to a digital channel at low power at the first Tx Test Frequency and
commanded to transmit a pattern. The Peak-averaged deviation of this tone is
measured with the analyzer. This process is repeated for each Test Frequency and
High and Low patterns. The test results are written to the log file.
Table 6-16. Tx P25 Phase 1 Deviation (C4FM) test results
Page 17

Harris XL-200 Portable Series AutoTune™ User Guide
10
RF
Control
Port
Frequency
Modulation
Output Level
Generate
RF IN/OUT
Test Frequency
C4FM
-117 dBm
Name
Description
Result
Pass or Fail. BER level within Max Limit
Frequency
Test Frequency
BER
Radio Bit Error Rate (BER) level
Max Limit
Maximum Limit (inclusive) for Bit Error Rate (BER)
Min Limit
Minimum Limit (exclusive) for Bit Error Rate (BER)
6.8. P25 Phase 1 Rx Sensitivity (C4FM) Test
The P25 Phase 1 Rx Sensitivity (C4FM) test measures the radio’s P25 Phase 1 C4FM
sensitivity level at several Rx test frequencies.
Table 6-17. Analyzer Configuration for P25 Phase 1 Rx Sensitivity (C4FM) test
6.8.1. Test
The analyzer is setup by applying the Modulation signal in Table 6-17 to the radio. The
radio is set to a digital zone and the first Rx test frequency. The radio’s reported C4FM
BER level is measured and compared against the test limits. This process is repeated
for each Test Frequency. The final results are written to the log file.
Table 6-18. P25 Phase 1 Rx Sensitivity (C4FM) test results
Page 18

Harris XL-200 Portable Series AutoTune™ User Guide
11
RF
Control
Port
Frequency
Modulation
Output Level
Generate
RF IN/OUT
Test Frequency
TDMA
-117 dBm
Name
Description
Result
Pass or Fail. BER level within Max Limit
Frequency
Test Frequency
BER
Radio Bit Error Rate (BER) level
Max Limit
Maximum Limit (inclusive) for Bit Error Rate (BER)
Min Limit
Minimum Limit (exclusive) for Bit Error Rate (BER)
6.9. P25 Phase 2 Rx Sensitivity (TDMA) Test
The P25 Phase 2 Rx Sensitivity (TDMA) test measures the radio’s P25 Phase 2 TDMA
sensitivity level at several Rx test frequencies.
Table 6-19. Analyzer Configuration for P25 Phase 2 Rx Sensitivity (TDMA) test
6.9.1. Test
The analyzer is setup by applying the Modulation signal in Table 6-19 to the radio. The
radio is set to a digital zone at the first RX Test Frequency. The radio’s reported TDMA
BER level is measured and compared against the test limits. This process is repeated
for each Test Frequency. The final results are written to the log file.
Table 6-20. P25 Phase 2 Rx Sensitivity (TDMA) test results
Page 19

Harris XL-200 Portable Series AutoTune™ User Guide
12
Symptom
Possible Cause
Possible Solution
Analyzer consistently fails
• Radio on a
• Change radio channel to a
placing radio into test mode.
Analyzer consistently fails
• Current mission
• Boot radio into “Wifi
personality.
Analyzer occasionally fails
• USB hub in use
• USB hubs are known to
port.
Tx Power test power
• Cable Sweep not
• Enable Settings > System
entered as negative values.
Basic Troubleshooting
to communicate with radio
to communicate with radio
and radio display softkeys
are blank.
to communicate with radio
output levels are lower
than expected.
trunking channel
plan corrupted
while setting
mission plan to
test mode.
enabled
conventional channel.
Trunking channel mod e can
prevent AutoTune from
programming mode” by
pressing the PTT and Bottom
Side Button and powering up
the radio. Wait 5 seconds.
Connect the radio to RPM and
re-flash or overwrite the radio
occasionally prevent or drop
radio communication. C onnect
the radio programming cable
directly to an analyzer USB
Settings… > Cable Sweep >
Cable Sweep. Change cable
attenuation values to
correspond with the RF cable
in use. For example, if 0.5 dB
of loss expected at 100 MHz
and 1.5 dB of loss is expected
at 1 GHz, enter “-0.5 dB” as
the 100 MHz loss value and –
“1.5 dB” as the 1 GHz loss
value. Cable losses are
Table 6-21. Harris XL-200 Portable Series Troubleshooting Chart
Page 20

Harris XL-200 Portable Series AutoTune™ User Guide
13
7. Support Information
7.1. Technical Support
Telephone/Fax: 903.985.8999
Email: service@freedomcte.com
Web: http://freedomcte.com/support/
7.2. Sales
Telephone/Fax: 903.985.8999
Email: sales@freedomcte.com
Web: http://freedomcte.com/sales/
Page 21

Harris XL-200 Portable Series AutoTune™ User Guide
A-1
APPENDIX A. Test Limits
The factory limits contain the default limits as defined by the radio manufacturer
and generally should not be modified. However, if extenuating circumstances
cause a need to modify the limits this is accommodated by AutoTune. Refer to
the R8000 Series Communications System Analyzer Owner’s Manual (FCT-
1365) for modification instr uc ti ons .
The following tables list the default test limits for Harris XL-200 Portable radio
model supported by AutoTune.
Page 22

Harris XL-200 Portable Series AutoTune™ User Guide
A-2
Section
Test Name
Limit
Default Value
6.2
TCXO Frequency
Reference Oscillator Align
Min = -0.05 ppm
Max = 0.05 ppm
Reference Oscillator Test
Min = -0.4 ppm
Max = 0.4 ppm
6.3
RSSI
RSSI Align
Min = -3.0 dBm
Max = 3.0 dBm
RSSI Test
Min = -3.0 dBm
Max = 3.0 dBm
RSSI Level
Max = -95 dBm
RSSI Interference Threshold
Max = -115 dBm
6.4
TX Power (Test)
TX Power Test VHF Low
Min = 0.7 W
Max = 1.3 W
TX Power Test UHF Low
Min = 0.70 W
Max = 1.3 W
TX Power Test 700MHz Low
Min = 0.2 W
Max = 0.8 W
TX Power Test 800MHz Low
Min = 0.2 W
Max = 0.8 W
TX Power Test VHF High
Min = 5.6 W
Max = 7.6 W
TX Power Test UHF High
Min = 4.7 W
Max = 6.3 W
TX Power Test 700MHz High
Min = 2.2 W
Max = 3.2 W
TX Power Test 800MHz High
Min = 2.8 W
Max = 3.8 W
6.5
Tx CTCSS/CDCSS
Tx CTCSS/CDCSS Modulation
Deviation Wide
Min = 0.5 kHz
Max = 1.0 kHz
Tx CTCSS/CDCSS Modulation
Deviation Narrow
Min = 0.315 kHz
Max = 0.465 kHz
Tx CTCSS/CDCSS Modulation
Deviation NPSPAC
Min = 0.4 kHz
Max = 0.8 kHz
6.6
P25 Phase1 Tx Tests
P25 Phase1 Tx Modulation
Min = 0.0 %
P25 Phase1 Tx Symbol Deviation
Min = 1.620 kHz
6.7
P25 Phase2 Tx
P25 Phase1 Tx Modulation C4FM
High Pattern
Min = 2.544 kHz
Max = 3.110 kHz
P25 Phase1 Tx Modulation C4FM
Low Pattern
Min = 0.849 kHz
Max = 1.037 kHz
6.8
P25 Phase1 Rx
Sensitivity (C4FM)
P25 Phase1 Rx Sensitivity C4FM
Min = 0 %
Max = 5 %
6.9
P25 Phase2 Rx
Sensitivity (TDMA)
P25 Phase2 Rx Sensitivity T DMA
Min = 0 %
Max = 5 %
Modulation and
Composite Deviation
C4FM
Modulation TDMA
Table A-1. Default Harris XL-200 Portable Limits
Fidelity C4FM
C4FM
Max = 0.5 %
Max = 1.980 kHz
Page 23

Harris XL-200 Portable Series AutoTune™ User Guide
B-1
APPENDIX B. Sample Test Result Report
Note: Results shown below are representative of actual results. Actual results
and report format may vary .
=================================================================================
Test Result Report
=================================================================================
Model #: Harris XL-200 Portable Date/Time: 7/11/2017 2:10 PM
Serial #: A40300003218 Operator ID: 6
Info: FLASH Version: R03D09
TCXO Frequency Align
=====================
Result Frequency Freq Error Min Limit Max Limit Old Softpot New Softpot
------ ------------ ---------- --------- --------- ----------- -----------
Pass 136.0000 MHz -2 Hz -7 Hz 7 Hz 463 461
TCXO Frequency Test
====================
Result Frequency Freq Error Min Limit Max Limit Softpot
------ ------------ ---------- --------- --------- -------
Pass 136.0000 MHz -1 Hz -54 Hz 54 Hz 461
Pass 174.0000 MHz -2 Hz -70 Hz 70 Hz 461
Pass 378.0000 MHz -9 Hz -151 Hz 151 Hz 461
Pass 522.0000 MHz -14 Hz -209 Hz 209 Hz 461
Pass 776.0000 MHz -27 Hz -310 Hz 310 Hz 461
Pass 798.0000 MHz -26 Hz -319 Hz 319 Hz 461
Pass 816.0000 MHz -27 Hz -326 Hz 326 Hz 461
Pass 861.0000 MHz -24 Hz -344 Hz 344 Hz 461
RSSI Align
===========
Result Frequency Old Softpot New Softpot RSSI Max Limit Min Limit
------ ------------ ----------- ----------- -------- --------- ---------
Pass 136.0000 MHz 175 175 0.0 dBm 3.0 dBm -3.0 dBm
Pass 139.8000 MHz 175 175 0.0 dBm 3.0 dBm -3.0 dBm
Pass 143.6000 MHz 175 175 0.0 dBm 3.0 dBm -3.0 dBm
Pass 147.7000 MHz 175 175 0.0 dBm 3.0 dBm -3.0 dBm
Pass 151.2000 MHz 175 175 0.0 dBm 3.0 dBm -3.0 dBm
Pass 155.0000 MHz 175 175 0.0 dBm 3.0 dBm -3.0 dBm
Pass 158.8000 MHz 175 175 0.0 dBm 3.0 dBm -3.0 dBm
Pass 162.6000 MHz 175 175 0.0 dBm 3.0 dBm -3.0 dBm
Pass 166.4000 MHz 175 175 0.0 dBm 3.0 dBm -3.0 dBm
Pass 170.2000 MHz 175 175 0.0 dBm 3.0 dBm -3.0 dBm
Pass 174.0000 MHz 174 175 0.0 dBm 3.0 dBm -3.0 dBm
Pass 378.0000 MHz 173 173 0.0 dBm 3.0 dBm -3.0 dBm
Pass 394.0000 MHz 173 173 0.0 dBm 3.0 dBm -3.0 dBm
Pass 408.0000 MHz 174 174 0.0 dBm 3.0 dBm -3.0 dBm
Pass 422.0000 MHz 174 174 0.0 dBm 3.0 dBm -3.0 dBm
Pass 436.0000 MHz 174 174 0.0 dBm 3.0 dBm -3.0 dBm
Pass 450.0000 MHz 174 174 0.0 dBm 3.0 dBm -3.0 dBm
Pass 464.0000 MHz 173 173 1.0 dBm 3.0 dBm -3.0 dBm
Pass 478.0000 MHz 173 173 0.0 dBm 3.0 dBm -3.0 dBm
Pass 492.0000 MHz 173 173 0.0 dBm 3.0 dBm -3.0 dBm
Pass 506.0000 MHz 173 173 -1.0 dBm 3.0 dBm -3.0 dBm
Pass 522.0000 MHz 172 172 0.0 dBm 3.0 dBm -3.0 dBm
Pass 768.0000 MHz 172 172 0.0 dBm 3.0 dBm -3.0 dBm
Pass 769.6000 MHz 172 172 0.0 dBm 3.0 dBm -3.0 dBm
Pass 771.2000 MHz 171 171 0.0 dBm 3.0 dBm -3.0 dBm
Pass 772.8000 MHz 170 171 0.0 dBm 3.0 dBm -3.0 dBm
Pass 774.4000 MHz 170 171 0.0 dBm 3.0 dBm -3.0 dBm
Pass 776.0000 MHz 171 171 0.0 dBm 3.0 dBm -3.0 dBm
Pass 851.0000 MHz 169 169 0.0 dBm 3.0 dBm -3.0 dBm
Pass 852.9000 MHz 169 169 0.0 dBm 3.0 dBm -3.0 dBm
Pass 856.7000 MHz 171 171 0.0 dBm 3.0 dBm -3.0 dBm
Pass 861.0000 MHz 168 168 0.0 dBm 3.0 dBm -3.0 dBm
TX Power Test - Low Power
==========================
Result Frequency Power Out Min Limit Max Limit
------ ------------ --------- --------- ---------
Pass 136.0000 MHz 1.08 W 0.70 W 1.30 W
Pass 174.0000 MHz 1.09 W 0.70 W 1.30 W
Pass 378.0000 MHz 1.01 W 0.70 W 1.30 W
Pass 522.0000 MHz 1.03 W 0.70 W 1.30 W
Pass 776.0000 MHz 0.47 W 0.20 W 0.80 W
Pass 798.0000 MHz 0.46 W 0.20 W 0.80 W
Pass 816.0000 MHz 0.49 W 0.20 W 0.80 W
Pass 861.0000 MHz 0.49 W 0.20 W 0.80 W
TX Power Test - High Power
===========================
Result Frequency Power Out Min Limit Max Limit
------ ------------ --------- --------- ---------
Pass 136.0000 MHz 6.49 W 5.60 W 7.60 W
Pass 174.0000 MHz 6.54 W 5.60 W 7.60 W
Pass 378.0000 MHz 4.97 W 4.70 W 6.30 W
Pass 522.0000 MHz 5.03 W 4.70 W 6.30 W
Pass 776.0000 MHz 2.50 W 2.20 W 3.20 W
Pass 798.0000 MHz 2.47 W 2.20 W 3.20 W
Pass 816.0000 MHz 2.97 W 2.80 W 3.80 W
Pass 861.0000 MHz 2.93 W 2.80 W 3.80 W
Tx CTCSS (156.7 Hz) Modulation Wide
====================================
Result Frequency CTCSS Dev Min Limit Max Limit Meas Tone
------ ------------ --------- --------- --------- ---------
Pass 174.0000 MHz 0.677 kHz 0.5 kHz 1.0 kHz 156.8 Hz
Pass 816.0000 MHz 0.677 kHz 0.5 kHz 1.0 kHz 156.7 Hz
Pass 861.0000 MHz 0.677 kHz 0.5 kHz 1.0 kHz 156.8 Hz
Tx CDCSS (627) Modulation Wide
===============================
Result Frequency CDCSS Dev Min Limit Max Limit Meas Code
------ ------------ --------- --------- --------- ---------
Pass 174.0000 MHz 0.629 kHz 0.5 kHz 1.0 kHz 627
Pass 816.0000 MHz 0.637 kHz 0.5 kHz 1.0 kHz 627
Pass 861.0000 MHz 0.624 kHz 0.5 kHz 1.0 kHz 627
Tx CTCSS (156.7 Hz) Modulation Narrow
======================================
Result Frequency CTCSS Dev Min Limit Max Limit Meas Tone
------ ------------ --------- --------- --------- ---------
Pass 174.0000 MHz 0.383 kHz 0.315 kHz 0.465 kHz 156.7 Hz
Pass 522.0000 MHz 0.383 kHz 0.315 kHz 0.465 kHz 156.8 Hz
Pass 776.0000 MHz 0.383 kHz 0.315 kHz 0.465 kHz 156.7 Hz
Pass 798.0000 MHz 0.383 kHz 0.315 kHz 0.465 kHz 156.8 Hz
Tx CDCSS (627) Modulation Narrow
=================================
Result Frequency CDCSS Dev Min Limit Max Limit Meas Code
Page 24

Harris XL-200 Portable Series AutoTune™ User Guide
B-2
------ ------------ --------- --------- --------- ---------
Pass 174.0000 MHz 0.348 kHz 0.315 kHz 0.465 kHz 627
Pass 522.0000 MHz 0.354 kHz 0.315 kHz 0.465 kHz 627
Pass 776.0000 MHz 0.352 kHz 0.315 kHz 0.465 kHz 627
Pass 798.0000 MHz 0.350 kHz 0.315 kHz 0.465 kHz 627
Tx CTCSS (156.7 Hz) Modulation NPSPAC
======================================
Result Frequency CTCSS Dev Min Limit Max Limit Meas Tone
------ ------------ --------- --------- --------- ---------
Pass 816.0000 MHz 0.535 kHz 0.4 kHz 0.8 kHz 156.7 Hz
Pass 861.0000 MHz 0.535 kHz 0.4 kHz 0.8 kHz 156.8 Hz
P25 Phase 1 Tx Modulation Fidelity C4FM
========================================
Result Frequency Mod Fidelity Max Limit
------ ------------ ------------ ---------
Pass 136.0000 MHz 0.422 % 5.000 %
Pass 174.0000 MHz 0.438 % 5.000 %
Pass 378.0000 MHz 0.549 % 5.000 %
Pass 522.0000 MHz 0.580 % 5.000 %
Pass 776.0000 MHz 0.706 % 5.000 %
Pass 798.0000 MHz 0.639 % 5.000 %
Pass 816.0000 MHz 0.641 % 5.000 %
Pass 861.0000 MHz 0.665 % 5.000 %
P25 Phase 1 Tx Symbol Deviation C4FM
=====================================
Result Frequency Symbol Dev Min Limit Max Limit
------ ------------ ---------- --------- ---------
Pass 136.0000 MHz 1.823 kHz 1.620 kHz 1.980 kHz
Pass 174.0000 MHz 1.821 kHz 1.620 kHz 1.980 kHz
Pass 378.0000 MHz 1.822 kHz 1.620 kHz 1.980 kHz
Pass 522.0000 MHz 1.823 kHz 1.620 kHz 1.980 kHz
Pass 776.0000 MHz 1.824 kHz 1.620 kHz 1.980 kHz
Pass 798.0000 MHz 1.823 kHz 1.620 kHz 1.980 kHz
Pass 816.0000 MHz 1.822 kHz 1.620 kHz 1.980 kHz
Pass 861.0000 MHz 1.821 kHz 1.620 kHz 1.980 kHz
P25 Phase 1 Tx Deviation C4FM High Pattern
===========================================
Result Frequency Meas Dev Min Dev Max Dev
------ ------------ --------- --------- ---------
Pass 136.0000 MHz 2.880 kHz 2.544 kHz 3.110 kHz
Pass 174.0000 MHz 2.871 kHz 2.544 kHz 3.110 kHz
Pass 378.0000 MHz 2.876 kHz 2.544 kHz 3.110 kHz
Pass 522.0000 MHz 2.878 kHz 2.544 kHz 3.110 kHz
Pass 776.0000 MHz 2.873 kHz 2.544 kHz 3.110 kHz
Pass 798.0000 MHz 2.878 kHz 2.544 kHz 3.110 kHz
Pass 816.0000 MHz 2.880 kHz 2.544 kHz 3.110 kHz
Pass 861.0000 MHz 2.879 kHz 2.544 kHz 3.110 kHz
P25 Phase 1 Tx Deviation C4FM Low Pattern
==========================================
Result Frequency Meas Dev Min Dev Max Dev
------ ------------ --------- --------- ---------
Pass 136.0000 MHz 0.963 kHz 0.849 kHz 1.037 kHz
Pass 174.0000 MHz 0.964 kHz 0.849 kHz 1.037 kHz
Pass 378.0000 MHz 0.970 kHz 0.849 kHz 1.037 kHz
Pass 522.0000 MHz 0.971 kHz 0.849 kHz 1.037 kHz
Pass 776.0000 MHz 0.974 kHz 0.849 kHz 1.037 kHz
Pass 798.0000 MHz 0.972 kHz 0.849 kHz 1.037 kHz
Pass 816.0000 MHz 0.970 kHz 0.849 kHz 1.037 kHz
Pass 861.0000 MHz 0.974 kHz 0.849 kHz 1.037 kHz
P25 Rx Sensitivity BER (C4FM)
==============================
Result Frequency BER Min Limit Max Limit
------ ------------ ------- --------- ---------
Pass 136.0000 MHz 0.631 % 0.0 % 5.1 %
Pass 174.0000 MHz 0.609 % 0.0 % 5.1 %
Pass 378.0000 MHz 0.935 % 0.0 % 5.1 %
Pass 522.0000 MHz 1.261 % 0.0 % 5.1 %
Pass 768.0000 MHz 1.421 % 0.0 % 5.1 %
Pass 776.0000 MHz 1.805 % 0.0 % 5.1 %
Pass 851.0000 MHz 2.327 % 0.0 % 5.1 %
Pass 861.0000 MHz 3.125 % 0.0 % 5.1 %
P25 Phase2 Rx Sensitivity (TDMA)
=================================
Result Frequency BER Min Limit Max Limit
------ ------------ ------- --------- ---------
Pass 136.0000 MHz 0.059 % 0.0 % 5.1 %
Pass 174.0000 MHz 0.026 % 0.0 % 5.1 %
Pass 378.0000 MHz 0.206 % 0.0 % 5.1 %
Pass 522.0000 MHz 0.376 % 0.0 % 5.1 %
Pass 768.0000 MHz 0.342 % 0.0 % 5.1 %
Pass 776.0000 MHz 0.650 % 0.0 % 5.1 %
Pass 851.0000 MHz 1.157 % 0.0 % 5.1 %
Pass 861.0000 MHz 1.720 % 0.0 % 5.1 %
Tests performed by AutoTune © 2017 Freedom Communication Technologies, Inc. All Rights Reserved.
APP Version 2.3.3.310
Figure B-1. Sample Test Result Report
Page 25

Harris XL-200 Portable Series AutoTune™ User Guide
C-1
A – Original Release
M. Hammer
W.Black
12/17/17
0160
Revision – Change
Requested By
Approved By
Rel. Date
ECO#
APPENDIX C. Revision History
 Loading...