

Page 1

ADMINISTRATION GUIDE
FortiGuard Analysis and
Management Service
Version 1.2.0
www.fortinet.com
Page 2

FortiGuard Analysis and Management Service Administration Guide
Version 1.2.0
31 October 2008
13-12000-406-20081031
© Copyright 2008 Fortinet, Inc. All rights reserved. No part of this publication including text, examples,
diagrams or illustrations may be reproduced, transmitted, or translated in any form or by any means,
electronic, mechanical, manual, optical or otherwise, for any purpose, without prior written permission of
Fortinet, Inc.
Trademarks
Dynamic Threat Prevention System (DTPS), APSecure, FortiASIC, FortiBIOS, FortiBridge, FortiClient,
FortiGate, FortiGate Unified Threat Management System, FortiGuard, FortiGuard-Antispam, FortiGuardAntivirus, FortiGuard-Intrusion, FortiGuard-Web, FortiLog, FortiAnalyzer, FortiManager, Fortinet, FortiOS,
FortiPartner, FortiProtect, FortiReporter, FortiResponse, FortiShield, FortiVoIP, and FortiWiFi are
trademarks of Fortinet, Inc. in the United States and/or other countries. The names of actual companies
and products mentioned herein may be the trademarks of their respective owners.
Page 3

Contents
Contents
Introduction ........................................................................................ 7
About this document......................................................................................... 7
Document conventions.................................................................................. 7
Typographic conventions........................................................................ 8
Fortinet documentation .................................................................................... 8
Fortinet Tools and Documentation CD .......................................................... 8
Fortinet Knowledge Center .......................................................................... 8
Comments on Fortinet technical documentation .......................................... 8
Customer service and technical support ........................................................ 9
Setup ................................................................................................. 11
About the portal web site................................................................................ 11
Obtaining a trial contract ................................................................................ 14
Configuring a device to use the service........................................................ 16
Verifying the connectivity between the service and the device ................... 17
Configuring remote logging and central management ................................ 17
Expanding or renewing service...................................................................... 19
Renewing contracts..................................................................................... 20
Adding purchased contracts........................................................................ 21
Required port numbers................................................................................... 23
Dashboard ........................................................................................ 25
The Dashboard main menu............................................................................. 25
Widgets............................................................................................................. 26
Adding and customizing pages...................................................................... 27
Configuring widgets........................................................................................ 27
Configuring the Resource Monitor .............................................................. 28
Configuring the Network Monitor................................................................. 29
Configuring the Trap Console ..................................................................... 30
Configuring the Report widgets................................................................... 31
Customizing the Dashboard page.................................................................. 34
FortiGuard Analysis and Management Service Version 1.2.0 Administration Guide
13-12000-406-20081031 3
Page 4

Contents
Management..................................................................................... 35
Device............................................................................................................... 35
Viewing device information ......................................................................... 35
Adding and editing devices ......................................................................... 37
Authorizing the service on devices ............................................................. 38
De-authorizing the service on devices ........................................................ 39
Sending manual or automatic configuration revisions ................................ 39
Viewing configuration revisions................................................................... 40
Searching configuration revisions ............................................................... 41
Comparing configuration revisions.............................................................. 41
Restoring configuration revisions................................................................ 43
Running scripts .......................................................................................... 44
Viewing available firmware images............................................................. 44
Changing firmware from the portal web site ............................................... 45
Changing firmware from the device ............................................................ 46
Scripts .............................................................................................................. 47
Creating scripts ........................................................................................... 47
Viewing available configuration scripts ....................................................... 48
Topology Tool.................................................................................................. 49
Creating a network diagram........................................................................ 52
Viewing a network diagram......................................................................... 52
Settings ............................................................................................................ 52
Viewing service account information........................................................... 53
Adding, editing and removing administrators.............................................. 55
Editing your login profile.............................................................................. 56
Changing your service account ID .............................................................. 56
Configuring an alert profile.......................................................................... 57
Analysis ............................................................................................ 59
Log Viewer ....................................................................................................... 60
Viewing logs................................................................................................ 60
Customizing the log view ............................................................................... 62
Customizing the log column views.............................................................. 62
Filtering logs................................................................................................ 63
Log File Browser ............................................................................................. 65
Deleting log files from the FortiGate web-based manager.......................... 66
Reports............................................................................................................. 67
Viewing generated reports .......................................................................... 67
Deleting reports........................................................................................... 68
e-Discovery ...................................................................................................... 69
Viewing e-Discovery tasks .......................................................................... 69
Creating tasks for e-Discovery.................................................................... 72
FortiGuard Analysis and Management Service Version 1.2.0 Administration Guide
4 13-12000-406-20081031
Page 5

Contents
Index .................................................................................75
FortiGuard Analysis and Management Service Version 1.2.0 Administration Guide
13-12000-406-20081031 5
Page 6

Contents
FortiGuard Analysis and Management Service Version 1.2.0 Administration Guide
6 13-12000-406-20081031
Page 7

Introduction About this document
Introduction
The FortiGuard Analysis and Management Service is a subscription-based
service that provides remote management and logging and reporting capabilities
for all FortiGate units. The FortiGuard Analysis and Management Service is
available for FortiGate units running FortiOS 3.0 MR6 or higher.
The subscription-based service is available from the FortiGuard Analysis and
Management Service portal web site, which provides a central location for
configuring logging, reporting and remote management. From the FortiGuard
Analysis and Management Service portal web site you can also view subscription
contract information, such as daily quota and the expiry date of the service.
This document refers to the FortiGuard Analysis and Management Service as “the
service”, a FortiGate unit as “device”, and the FortiGuard Analysis and
Management Service portal web site as the “portal web site”.
This section introduces you to FortiGuard Analysis and Management Service and
the following topics:
• About this document
• Fortinet documentation
• Customer service and technical support
About this document
This document explains how to configure and use the service. This document
contains the following sections:
• Setup – Describes how to create a service account, add a device and its
contract to the service account, and configure devices to use the service.
• Dashboard – Describes how to add widgets and pages, and customize the
Dashboard and pages.
• Management – Describes how to view service account information, add users
and devices, and create and run scripts.
• Analysis – Describes how to view and browse logs, including viewing reports.
Document conventions
The following document conventions are used in this guide:
• In the examples, private IP addresses are used for both private and public IP
addresses.
• Notes and Cautions are used to provide important information:
Note: Highlights useful additional information.
FortiGuard Analysis and Management Service Version 1.2.0 Administration Guide
13-12000-406-20081002 7
Page 8
Fortinet documentation Introduction
!
Caution: Warns you about commands or procedures that could have unexpected or
undesirable results including loss of data or damage to equipment.
Typographic conventions
Fortinet documentation uses the following typographical conventions:
Convention Example
Keyboard input In the Gateway Name field, type a name for the remote VPN
Code examples config sys global
CLI command syntax config firewall policy
Document names FortiGate Administration Guide
File content <HTML><HEAD><TITLE>Firewall
Menu commands Go to VPN > IPSEC > Phase 1 and select Create New.
Program output Welcome!
Variables
peer or client (for example, Central_Office_1).
set ips-open enable
end
edit id_integer
set http_retry_count <retry_integer>
set natip <address_ipv4mask>
end
Authentication</TITLE></HEAD>
<BODY><H4>You must authenticate to use this
service.</H4>
<address_ipv4>
Fortinet documentation
The most up-to-date publications and previous releases of Fortinet product
documentation are available from the Fortinet Technical Documentation web site.
Fortinet Tools and Documentation CD
All Fortinet documentation is available from the Fortinet Tools and Documentation
CD shipped with your Fortinet product. The documents on this CD are current at
shipping time. For up-to-date versions of Fortinet documentation visit the Fortinet
Technical Documentation web site.
Fortinet Knowledge Center
Additional Fortinet technical documentation is available from the Fortinet
Knowledge Center. The knowledge center contains troubleshooting and how-to
articles, FAQs, technical notes, a glossary and more. Visit the Fortinet Knowledge
Center.
Comments on Fortinet technical documentation
Please send information about any errors or omissions in this document, or any
Fortinet technical documentation, to techdoc@fortinet.com.
FortiGuard Analysis and Management Service Version 1.2.0 Administration Guide
8 13-12000-406-20081002
Page 9

Introduction Customer service and technical support
Customer service and technical support
Fortinet Technical Support provides services designed to make sure that your
Fortinet systems install quickly, configure easily, and operate reliably in your
network.
Please visit the Fortinet Technical Support web site to learn about the technical
support services that Fortinet provides.
FortiGuard Analysis and Management Service Version 1.2.0 Administration Guide
13-12000-406-20081002 9
Page 10

Customer service and technical support Introduction
FortiGuard Analysis and Management Service Version 1.2.0 Administration Guide
10 13-12000-406-20081002
Page 11

Setup About the portal web site
Setup
This section explains how to:
• log in to the portal web site
• navigate within the portal web site
• properly set up the service
• connect a device to the service.
This section also explains how to register a purchased contract after a trial
contract has expired or if you have purchased the contract from your sales
representative without a trial. You must configure both the portal web site and the
devices you want associated with the service before you can use the service.
If you are connecting to the portal web site for the first time, you must register your
device or devices on the Fortinet Technical Support web site. You must also
create a trial contract, which is available on the portal web site, if you have not
already purchased a contract from your sales representative.
After setting up the service, you can configure additional devices to connect to the
service. You do not need to configure other Service Account IDs or additional
contracts. You only need to:
• add device serial numbers to the portal web site and authorize the device to
use the service
• configure your devices within their own web-based manager to use the Service
Account ID.
This section includes the following topics:
• About the portal web site
• Obtaining a trial contract
• Configuring a device to use the service
• Expanding or renewing service
• Required port numbers
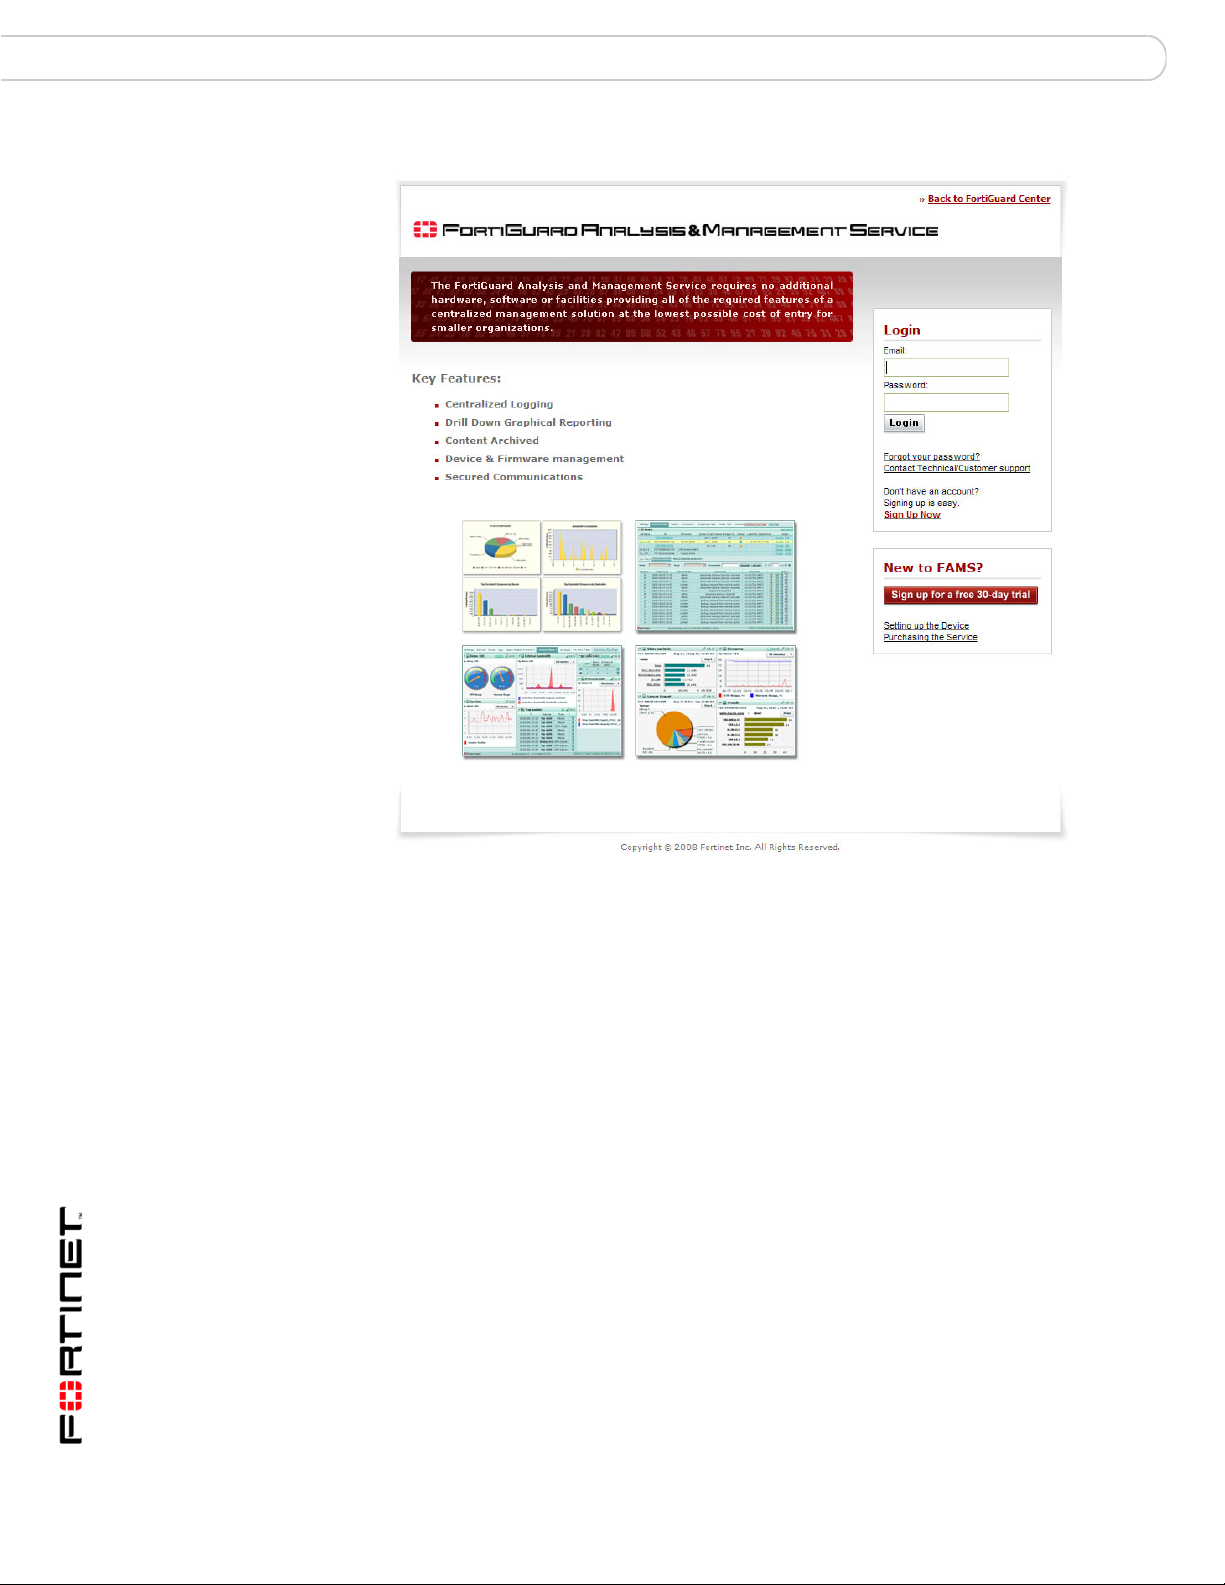
About the portal web site
The service is provided to devices through the Internet, and managed through a
portal web site. The portal web site displays not only customer login fields, but
also a link that enables you to configure a trial contract. There is also a bulleted
list of the key features and benefits of the service. You can view the site from
https://fams.fortinet.com.
FortiGuard Analysis and Management Service Version 1.2.0 Administration Guide
13-12000-406-20081031 11
Page 12
About the portal web site Setup
Figure 1: The portal web site
When you enter the email address and password for logging in, the Service
Account ID appears. You can select which Service Account ID you want to view
when logging in to the portal web site if you have multiple Service Account IDs for
one contract. Certain contracts allow for multiple Service Account IDs, which
provides more flexibility. Contracts can allow both multiple devices and multiple
service account IDs. For more information, see “Obtaining a trial contract” on
page 14.
After logging in to the web site, the layout of the information provides the
administrator quick and easy access to various features. There are three main
menus, Dashboard, Management and Analysis. These main menus contain tabs
and sections to help you view and configure settings.
FortiGuard Analysis and Management Service Version 1.2.0 Administration Guide
12 13-12000-406-20081031
Page 13
Setup About the portal web site
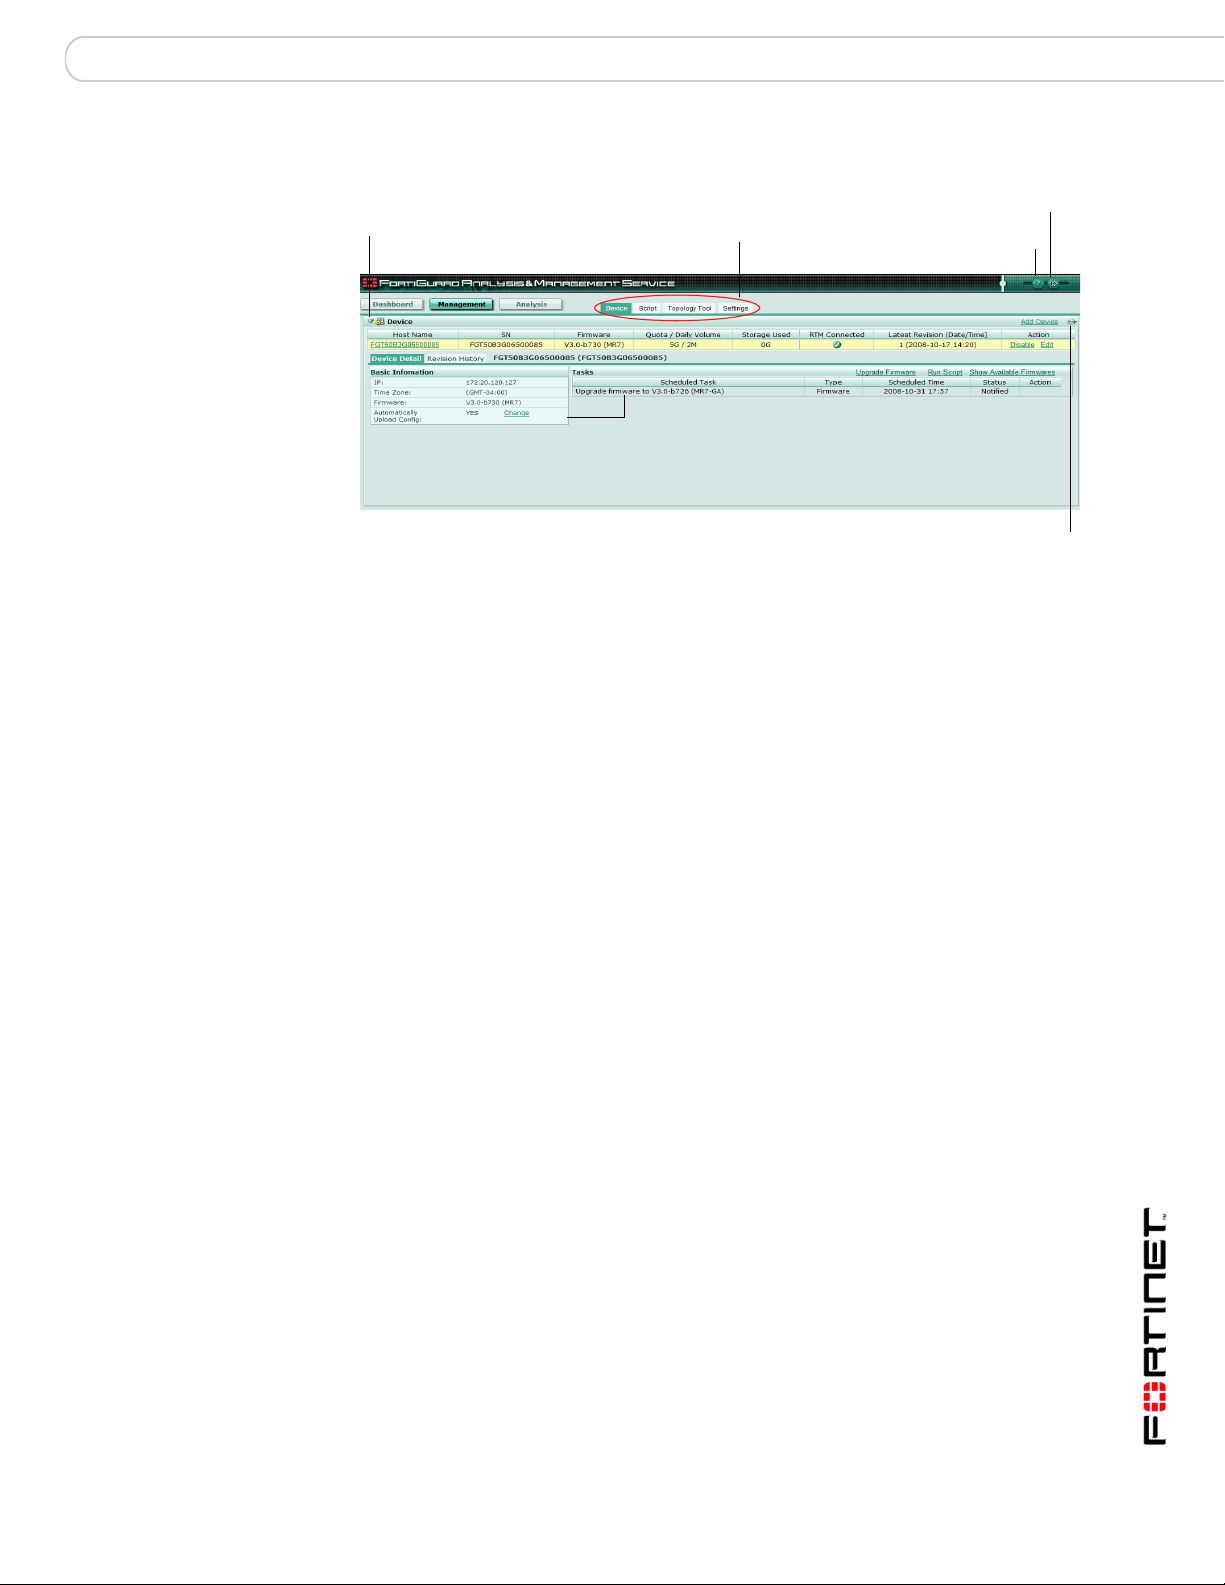
Ta bs
Help
Logout
Sections
Expand Arrow
Refresh
Figure 2: Portal web site layout, Management view
Dashboard main
menu
Management
main menu
Analysis main
menu
The Dashboard main menu provides all features that are related to it,
such as customizing and adding pages. You can add widgets to the
pages as well.
Dashboard The Dashboard tab allows you to configure the
Customize The Customize link allows you to configure a new
New page The New page link allows you to add a new page to
The Management main menu provides remote management features,
such as settings and device information.
Device The Device tab provides information about the
Script The Script tab allows you to upload, input and
Topology Tool The Topology Tool tab allows you to configure a
Settings The Settings tab provides account and user
The Analysis main menu provides logging and reporting features.
Log Viewer The Log Viewer tab allows you to view recent logs
Log File Browser The Log File Browser tab allows you to browse
Report The Report tab provides access to all reports.
e-Discovery The e-Discovery tab allows you to perform advanced
widgets and their layout. You can also make the
Dashboard tab the default page.
page.
the Dashboard menu.
devices, such as connection status to the service,
tasks, and revision history. You can also schedule
upgrades for devices and run scripts.
manage scripts.
network diagram of your network.
information, and allows you to configure alert profiles.
that are received in real-time, as well as historical log
files that are stored on the FortiGuard Analysis
server.
through historical log files.
searches of email messages.
FortiGuard Analysis and Management Service Version 1.2.0 Administration Guide
13-12000-406-20081031 13
Page 14
Obtaining a trial contract Setup
Section Each tab contains sections, which can display a combination of
Help Online help provides help on the various service features and
Log out Log out logs you out of the portal web site.
Refresh icon The Refresh icon, displayed on many pages, allows you to immediately
Obtaining a trial contract
When you first access the portal web site, you can immediately sign up for a trial
contract. With a trial contract, you can familiarize yourself with the features the
service provides before committing to a full contract. The trial contract lasts 30
days, after which you can purchase a full contract from your sales representative.
After purchasing a full contract, use the procedure, “To add a purchased contract
to a Service Account ID” on page 21.
After creating the service account and login, you need to authorize and configure
devices to use the service. Follow the procedures in “Configuring a device to use
the service” on page 16.
information and links to configure additional settings. You can also
expand or hide sections using the Expand Arrow.
For example, in the Device tab, shown in Figure 2 on page 13, the Tasks
section allows you to view the tasks that are occurring (or have already
occurred), as well as to configure an upgrade, run scripts, or show the
firmware available for upgrading the device.
configuration settings.
update the page contents.
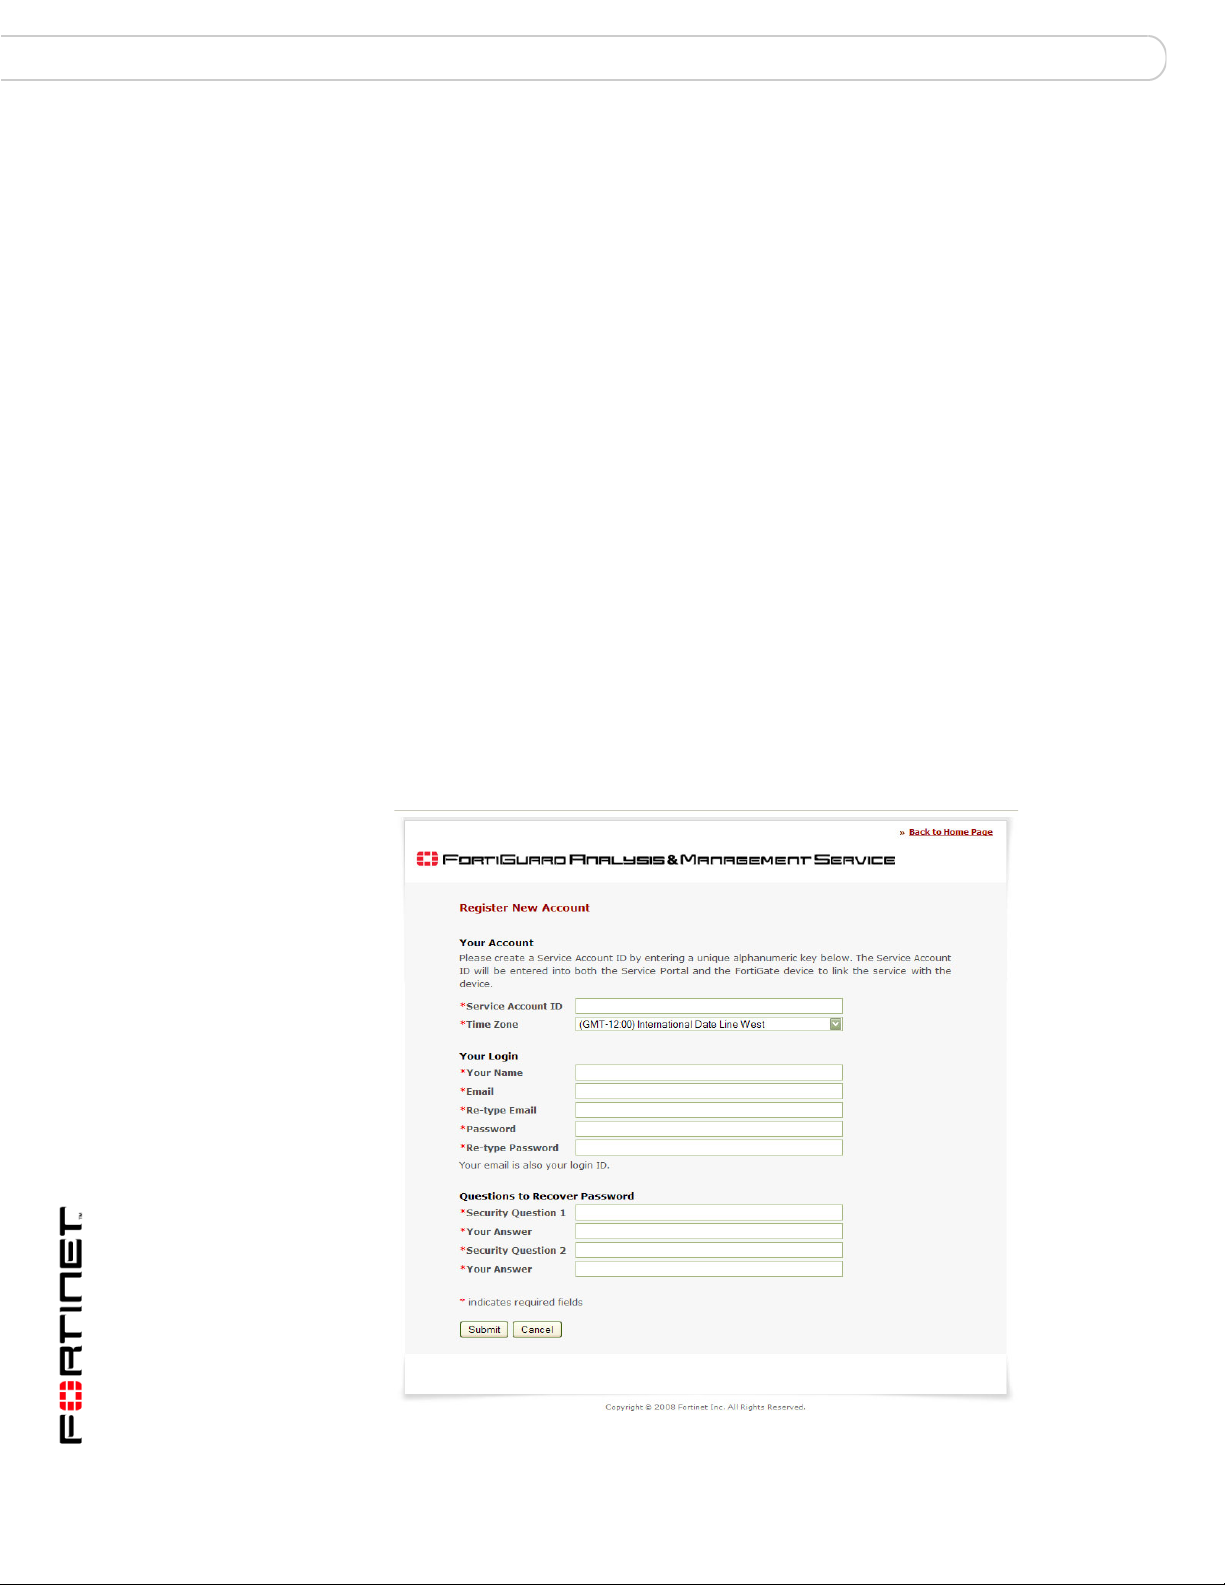
Figure 3: Registering for a trial contact
FortiGuard Analysis and Management Service Version 1.2.0 Administration Guide
14 13-12000-406-20081031
Page 15

Setup Obtaining a trial contract
Note: If you have previously logged in to the service portal, and want to create another trial
contract or enter a purchased contract number, you may need to create a second Service
Account ID. Devices can use only one Service Account ID at a time per contract. Instead,
add new contracts to your existing Service Account ID. For more information, see
“Expanding or renewing service” on page 19.
To obtain a trial contract
1 Go to https://fams.fortinet.com/.
2 Select the Sign Up Now link.
3 Enter the appropriate information for the following fields:
Your account The information you enter in this section will be used to identify the
Your Login You will use the information that you enter here to log in to the
Questions to
Recover Password
account you associate your devices with, and to determine log
and report time periods of the devices.
Service Account ID Enter an identification name. This name
can contain both letters and numbers, and
be up to 20 characters. Use an underscore
( _ ) or hyphen (-) to separate letters or
numbers in the name.
Time Zone Select the time zone that the device is in.
Time measurements, such as log time
stamps and schedules for changing
firmware that may appear for your
managed devices in the portal web site, are
relative to this time zone.
portal web site.
Your Name Enter the email address for the main
administrator, which is similar to the default
admin administrator on a device. This
default user for the portal web site is
referred to as the admin user.
Email Enter the email address that will be used
for sending reports to.
Re-type Email Enter the email address you gave in the
Email field.
Password Enter a password for logging in to the portal
web site.
Re-type Password Enter the password you gave in the
Password field.
These questions will help to identify you when you need to recover
your password. You need to make sure the following information is
easy to retrieve when you need to recover your password.
Security Question 1 Enter a challenge that can be used to verify
your identity in the event you need to
retrieve your password.
Your Answer Enter the answer for Security Question 1.
Security Question 2 Enter a second challenge that can be used
to verify your identity in the event you need
to retrieve your password.
Your Answer Enter the answer for Security Question 2.
FortiGuard Analysis and Management Service Version 1.2.0 Administration Guide
13-12000-406-20081031 15
Page 16
Configuring a device to use the service Setup
Expand Arrow
4 Select Submit.
You are automatically logged in to the portal web site. You should immediately log
out of the portal web site so that you can configure the devices to use FortiGuard
Analysis and Management Service. You will also receive an email from
fams_admin@fortinet.com verifying your trial contract.
If you want to add a purchased contract, you do not have to create a second
service account. Instead, you can add contracts to your existing service account.
For more information, see “Expanding or renewing service” on page 19.
Configuring a device to use the service
You need to configure devices to use the service after signing up for a trial
contract or after purchasing a contract. You need your Service Account ID to
enable the service on your devices. If you want multiple devices associated with
the same Service Account ID, you need to configure each device with that Service
Account ID.
Note: If you do not know your Service Account ID, you can view it by logging in to the
service portal and going to the Settings menu. The Service Account ID is located in
Account Information. Alternatively, log in to the Fortinet Technical Support web site, and
select the service.
To configure the Service Account ID and validate connectivity
1 In the FortiGate web-based manager, go to System > Maintenance >
FortiGuard.
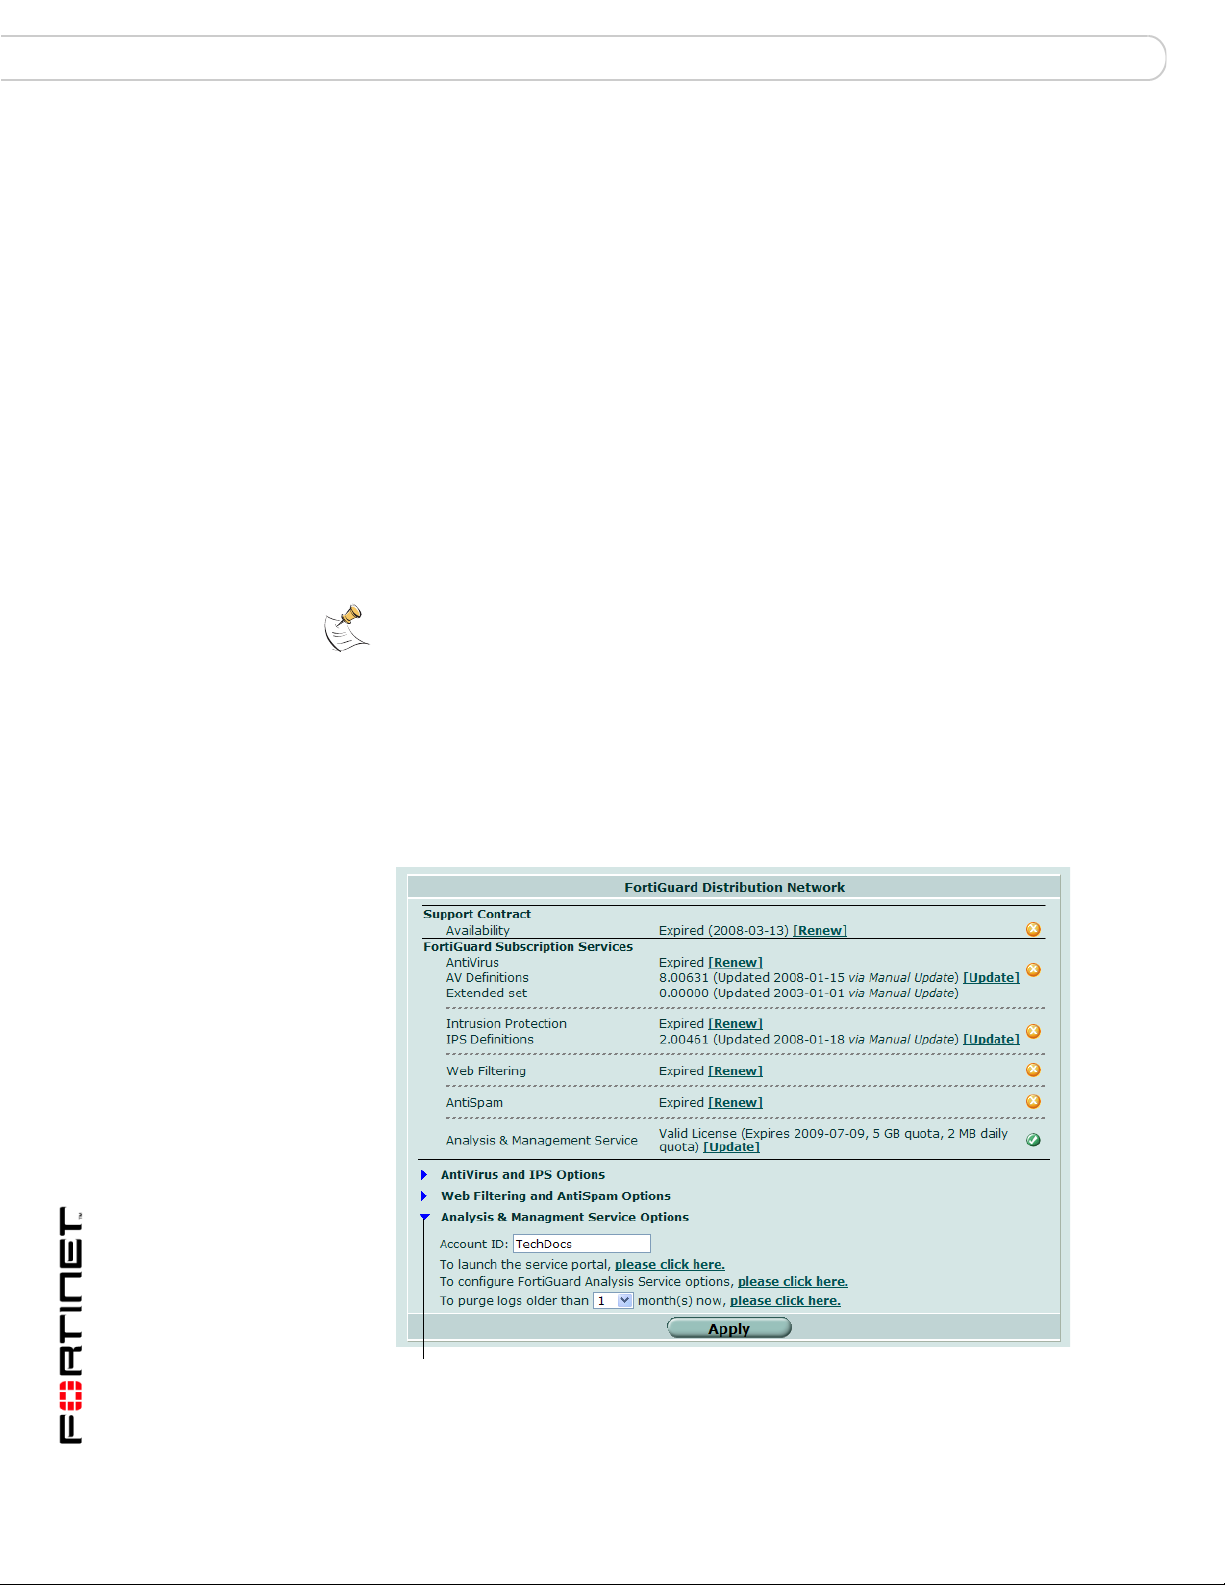
Figure 4: The FortiGuard “Analysis & Management Service Options”, as displayed
in the FortiGate web-based manager
FortiGuard Analysis and Management Service Version 1.2.0 Administration Guide
16 13-12000-406-20081031
Page 17

Setup Configuring a device to use the service
2 Select the Expand Arrow beside Analysis & Management Service Options to
reveal the available options.
3 Enter the service account ID in the Account ID field.
The service account ID entered here will be used to identify that the device is
associated with that service account.
4 Select Apply.
In the FortiGuard Subscription Services area of the FortiGuard page, you should
see a green checkmark in the Analysis & Management Service row, as in Figure
4. You should also see a green checkmark on the System dashboard of your
device, under License Information (beside Analysis and Management Service). If
you see an orange X, your device is not properly connected; if you see a gray X,
your device is not connected. For more information, see “Verifying the connectivity
between the service and the device” on page 17.
After successfully configuring your device, you also need to enable central
management, and, if applicable, configure remote logging. For more information,
see “Configuring remote logging and central management” on page 17.
Verifying the connectivity between the service and the device
The device connects to the Fortinet Distribution Network (FDN) to validate
connectivity with that Service Account ID. After successful validation, the options
for configuring and using the service become available on the device’s web-based
manager. You should also see a green check mark beside Analysis and
Management Services under License Information in the System dashboard of the
device.
If you have not yet authorized the device to use the service, the service license
status may appear to be Expired or Not Registered, and the device will not be
able to connect to the service. To authorize the device, see “Authorizing the
service on devices” on page 38.
If you have authorized the device from the portal web site, but the device is still
unable to connect, verify that the device’s system time and time zone are correct.
If these are incorrect, the SSL connection will fail; you must then enter the correct
system time and zone on the FortiGate unit. For more information, see the
FortiGate Administration Guide.
Configuring remote logging and central management
After configuring the Service Account ID on the device’s web-based manager, you
need to also configure central management and, if applicable, logging. The
service provides both central management of the device as well as logging and
reporting capabilities.
The following procedures describe how to enable and configure both remote
logging and central management.
FortiGuard Analysis and Management Service Version 1.2.0 Administration Guide
13-12000-406-20081031 17
Page 18
Configuring a device to use the service Setup
To configure remote logging to the service
1 In the FortiGate web-based manager, go to Log&Report > Log Config > Log
Setting.
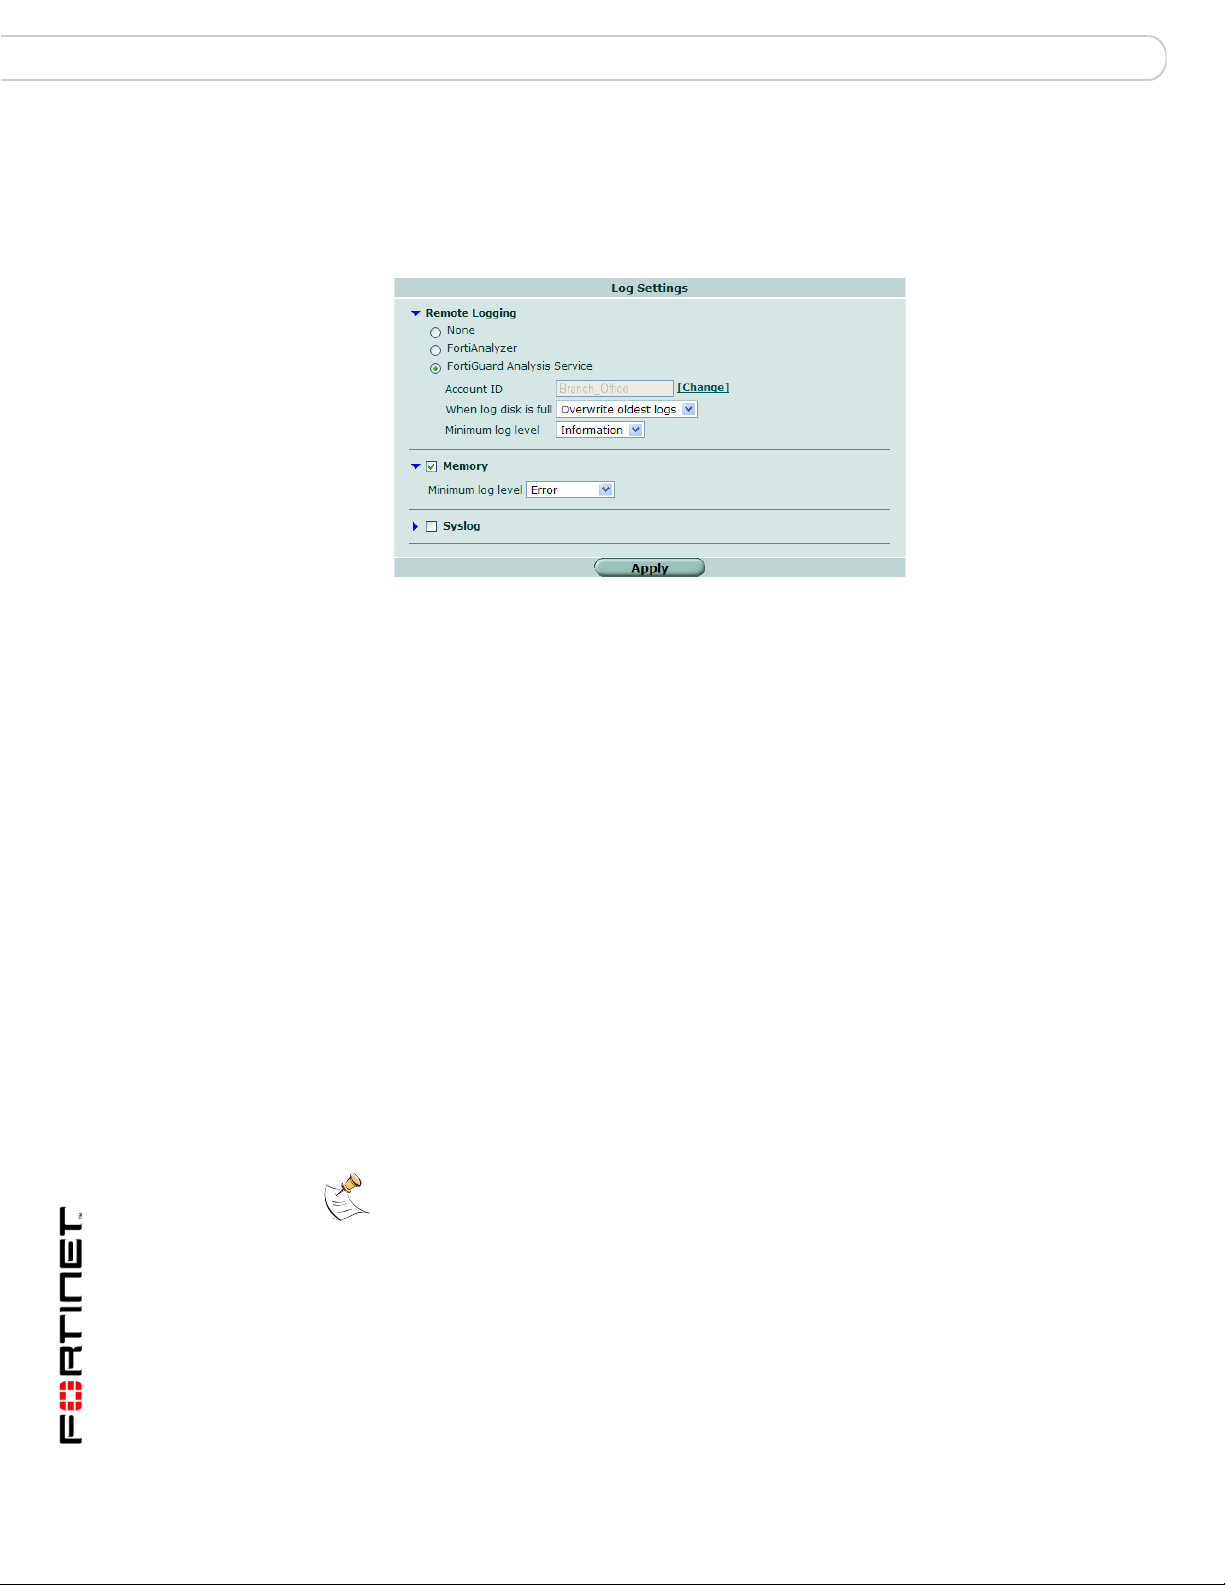
Figure 5: FortiGuard logging options in Log Setting
2 Select the Expand Arrow beside Remote Logging to reveal the available options.
3 Select FortiGuard Analysis Service.
If this check box is grayed out, authorize the device from the portal web site and
configure the Service Account ID before performing this step. For more
information, see “To configure the Service Account ID and validate connectivity”
on page 16.
4 From “When log disk is full”, select what the service should do when the device
reaches its quota: either Overwrite oldest logs or Do not log.
5 From “Minimum log level”, select one of the following log severity levels:
0 - Emergency The system has become unstable.
1 - Alert Immediate action is required.
2 - Critical Functionality is affected.
3 - Error An error condition exists and functionality could be affected.
4 - Warning Functionality could be affected.
5 - Notification Information about normal events.
6 - Information General information about system operations.
Messages with an equal or lesser severity will be sent to the service.
6 Select Apply.
Note: Daylight Savings Time (DST) may affect your location. It is recommended to verify if
your location observes this change, since it affects the accuracy and schedule of logs. For
more information, see the Fortinet Knowledge Center article, New Daylight Saving Time
support.
To configure remote management by the service
1 In the FortiGate web-based manager, go to System > Admin > Central
Management.
FortiGuard Analysis and Management Service Version 1.2.0 Administration Guide
18 13-12000-406-20081031
Page 19
Setup Expanding or renewing service
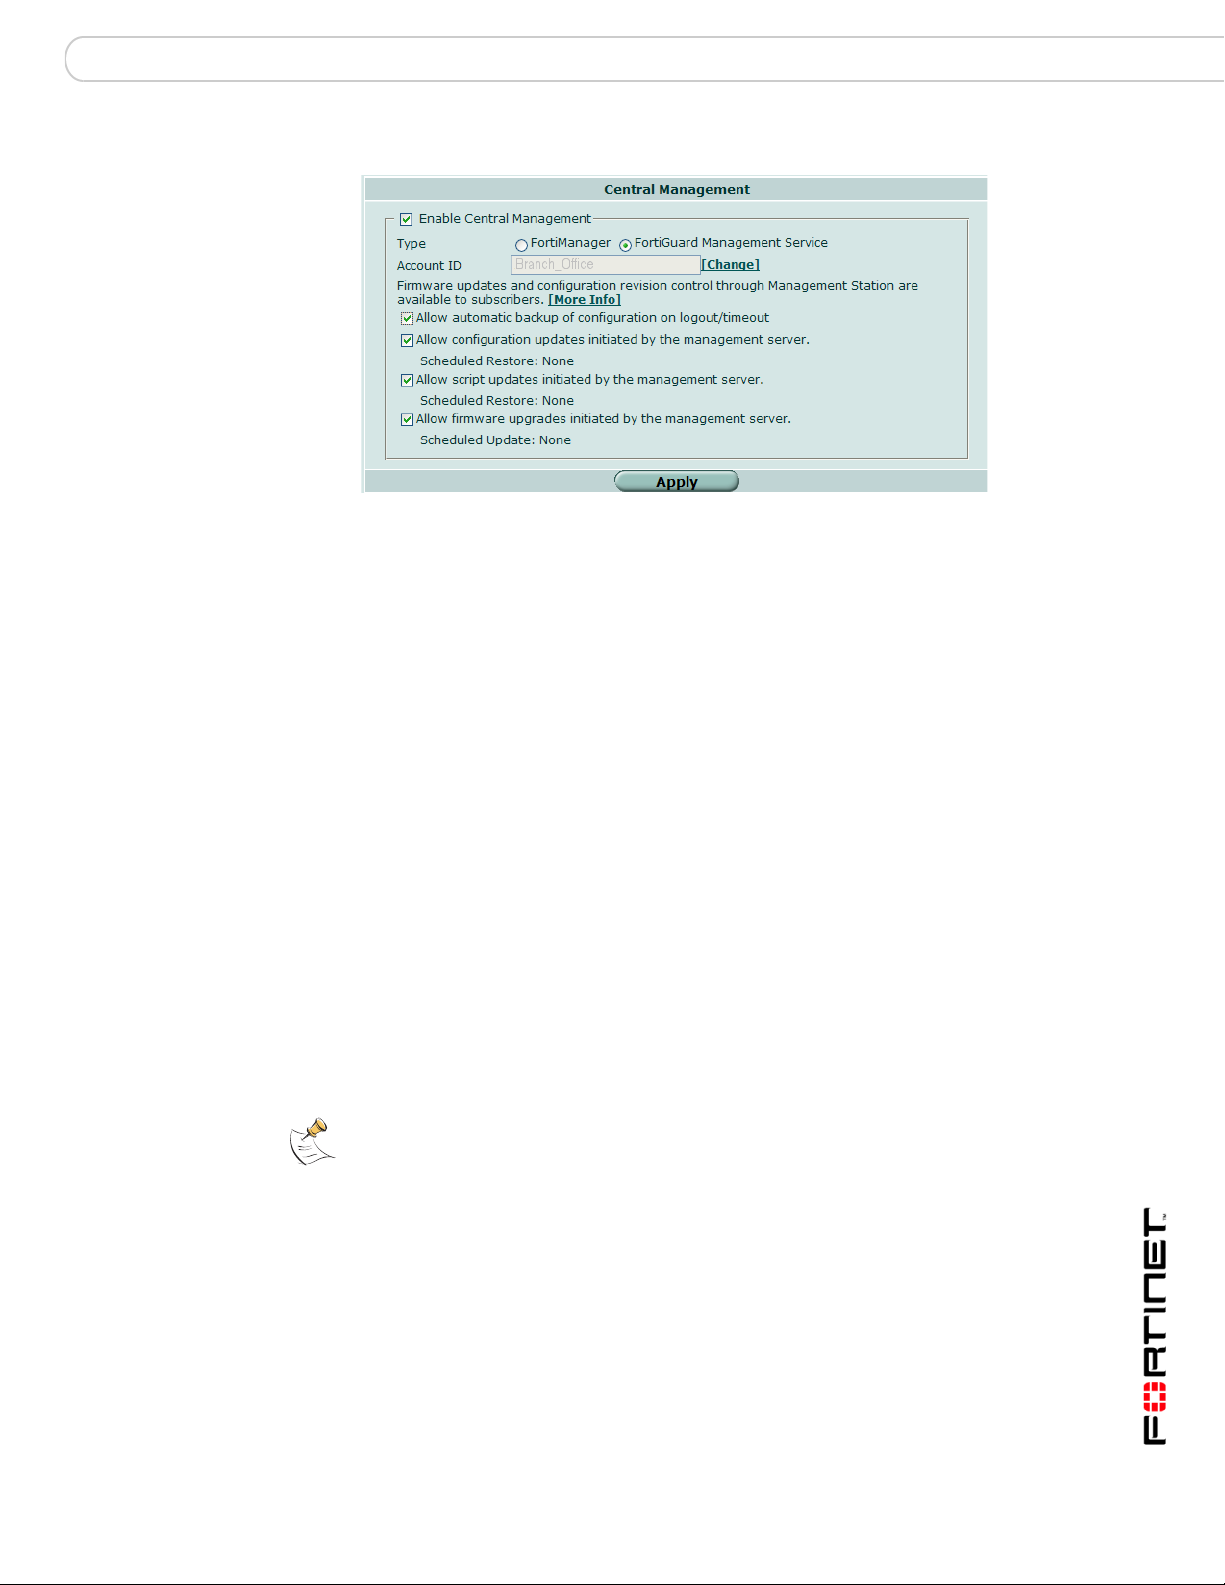
Figure 6: Central Management options
2 Select the check box beside Enable Central Management.
3 From Type, select FortiGuard Management Service.
4 Select Apply.
5 Select any of the following options that you want enabled:
Allow automatic
backup of
configuration on
logout/timeout
Allow configuration
updates initiated by
the management
server
Allow script updates
initiated by the
management server
Allow firmware
upgrades initiated by
the management
server
Automatically upload a new configuration revision to the service
when an administrator logs out or the session times out.
Most configuration changes cause an automatic backup.
Exceptions include VPN certificates, topology, FortiGuard license
status, host name, high availability (HA) override and priority, and
network interface media access control (MAC) address.
Allow the device to receive configuration changes scheduled
from the portal web site.
Allow the device to receive script changes scheduled from the
portal web site.
Allow the device to be upgraded by the management server.
6 Select Apply.
Note: The options for the service in Central Management appear only after you have
configured the Service Account ID.
Expanding or renewing service
You can expand or renew the service after accessing the portal web site for the
first time. The Fortinet Technical Support web site allows you to expand or renew
the service after a trial contract expires, or after you have purchased a full
contract.
FortiGuard Analysis and Management Service Version 1.2.0 Administration Guide
13-12000-406-20081031 19
Page 20
Expanding or renewing service Setup
Renewing contracts
If you want to extend the service period, you can add a renewal contract to the
previous contract.
Note: Contract renewal requires an existing contract. If you have not yet added your first
contract, add the first contract, then add the renewal contract. For more information, see
“Obtaining a trial contract” on page 14 and “Adding purchased contracts” on page 21.
To add a renewal contract
1 Go to the Fortinet Technical Support web site and log in.
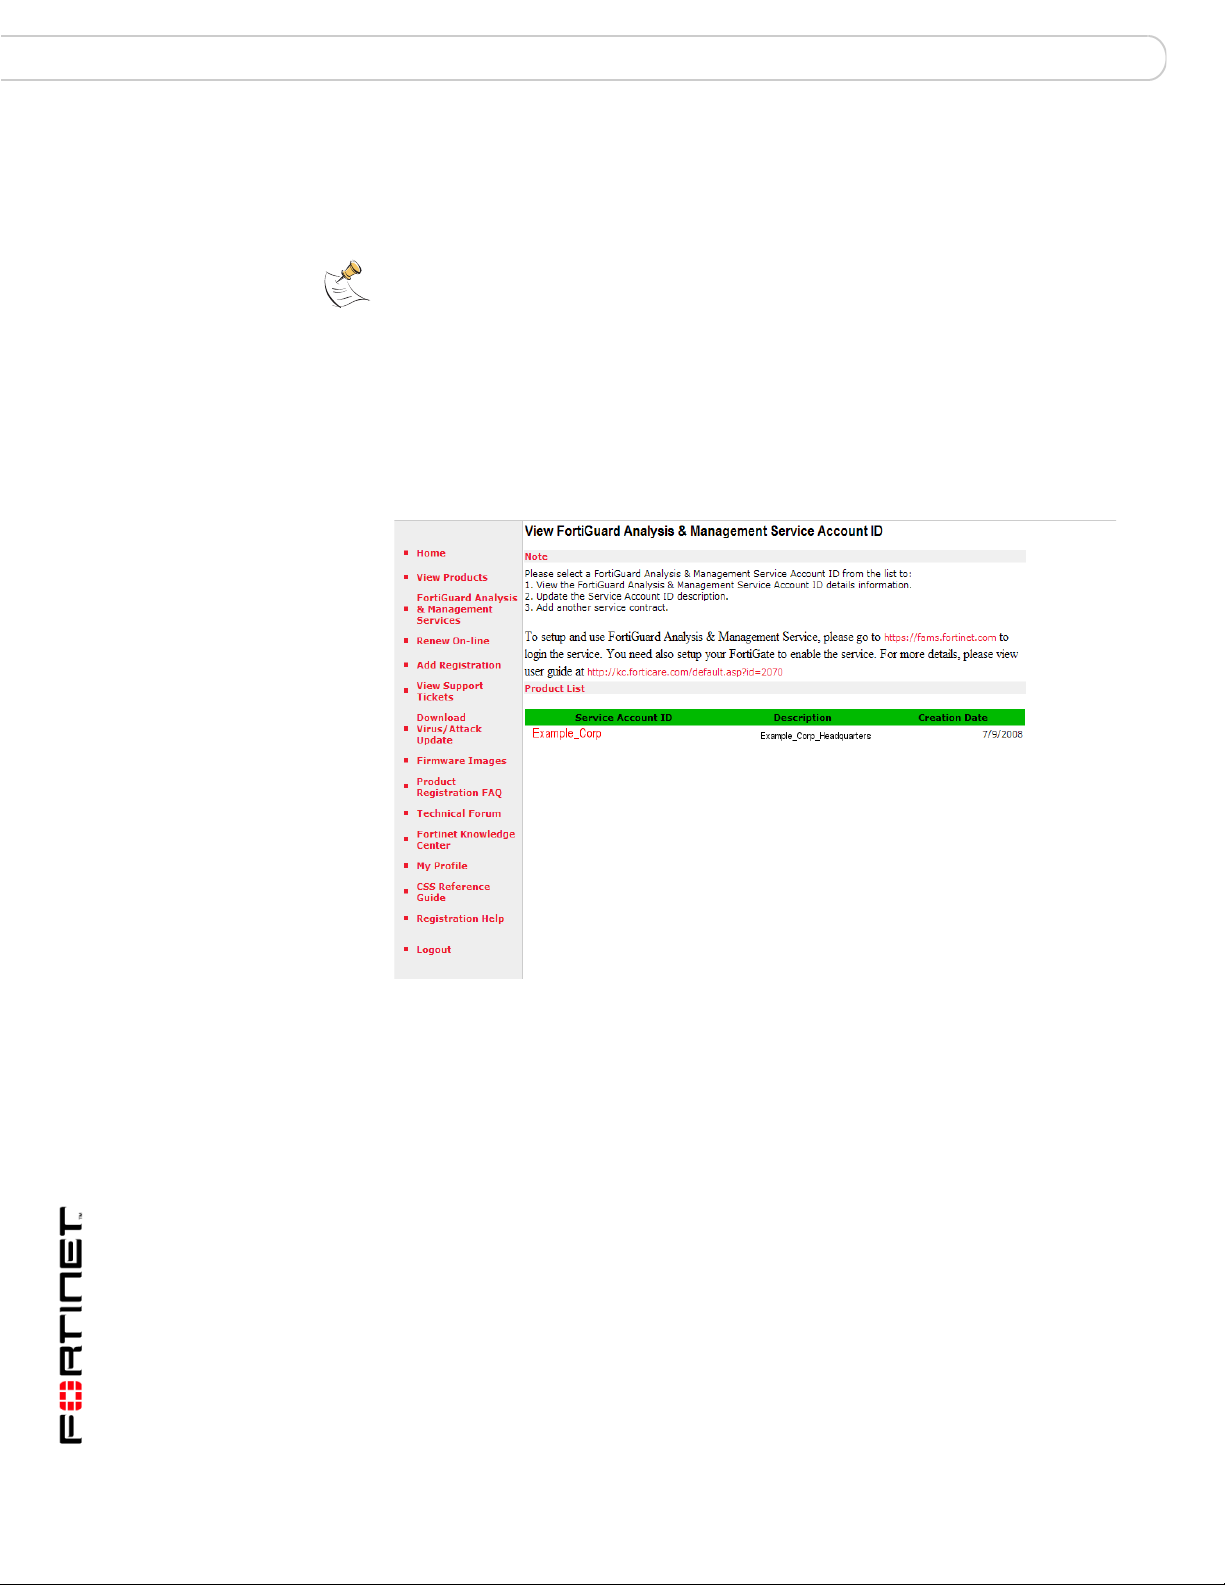
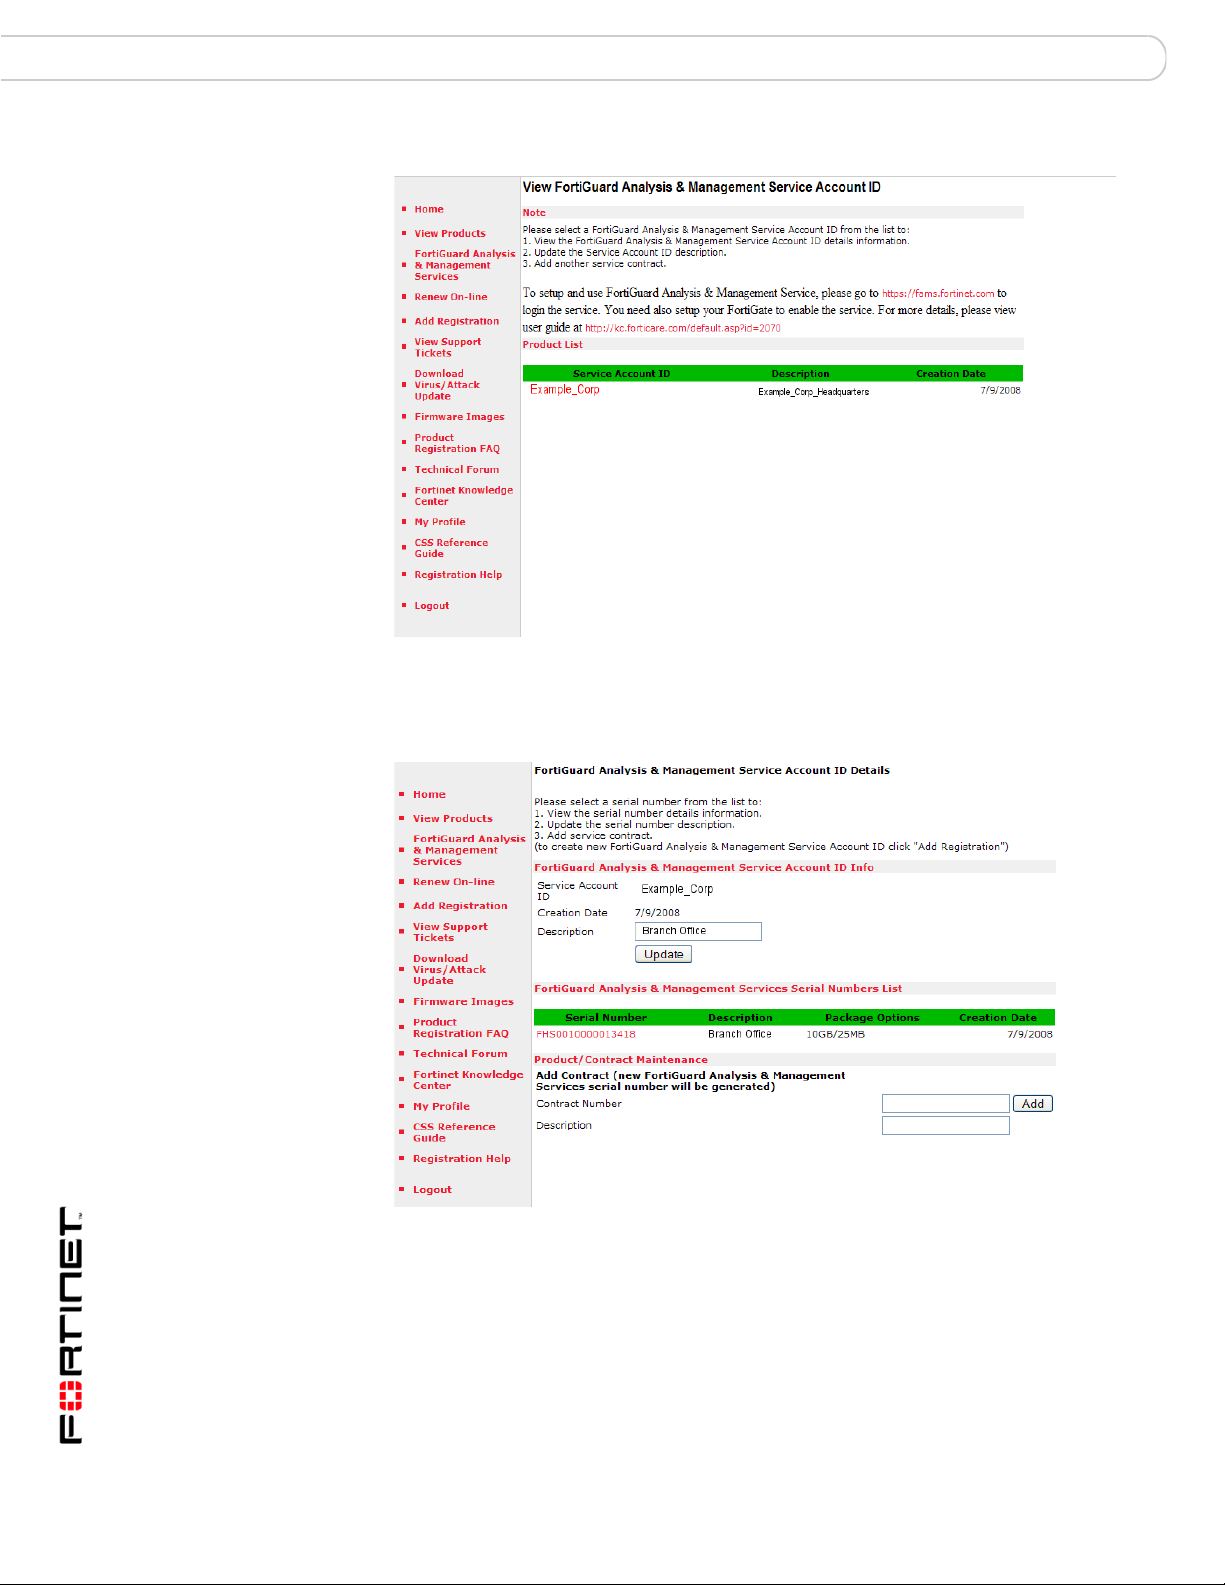
2 Select FortiGuard Analysis & Management Services from the menu on the left.
3 Select the Service Account ID to which you want to apply the contract number.
Figure 7: Locating the Service Account ID
Near the bottom of the page, a serial number list appears.
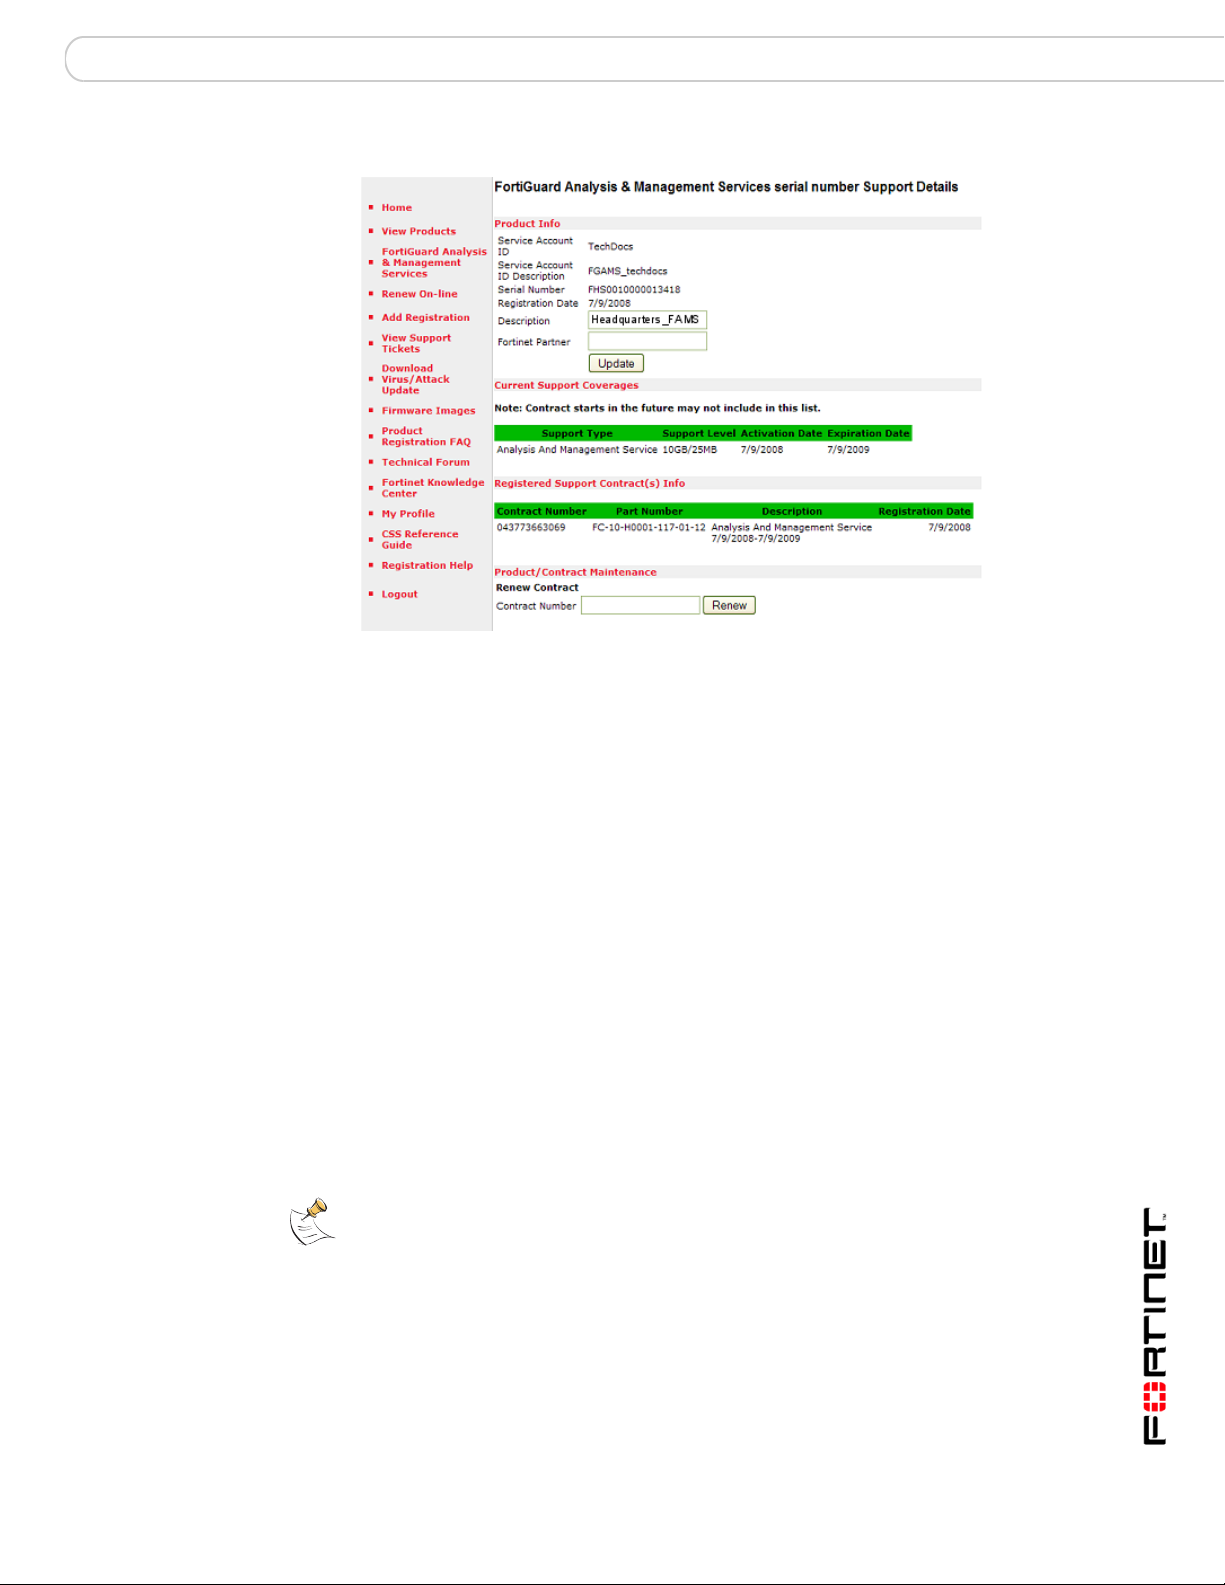
4 Select the Serial Number of the contract that you want to renew.
5 In the Product/Contract Maintenance area, enter the Contract Number.
FortiGuard Analysis and Management Service Version 1.2.0 Administration Guide
20 13-12000-406-20081031
Page 21
Setup Expanding or renewing service
Figure 8: Contract Number
6 Select Renew.
The terms of the contract appear.
7 If you agree, select Agree. A contract term confirmation appears.
If you do not agree to the terms of the service contract, select Don’t Agree.
8 If your contract details appear to be correct, select Complete Registration.
If you have renewed at an increased or decreased service level, you may want to
adjust quota and other settings from the portal web site. For more information, see
“Adding and editing devices” on page 37.
Adding purchased contracts
You can continue service beyond the duration of a trial contract period by adding a
purchased contract. You can also expand the disk space available to your service
account by purchasing a contract for a larger amount of space.
If you have previously obtained a trial contract or entered a purchased service
contract, you do not need to create separate Service Account IDs for each
contract. Instead, you can add service contracts to your existing Service Account
ID. If you choose to create an additional Service Account ID, its service contracts
and portal logins will be separate. Devices can use only one Service Account ID at
a time.
Note: If you have already added your first contract, and want to renew it, see “Renewing
contracts” on page 20.
To add a purchased contract to a Service Account ID
1 Go to the Fortinet Technical Support web site and log in.
2 Select FortiGuard Analysis & Management Services from the menu on the left.
3 Select the Service Account ID to which you want to add the purchased contract.
FortiGuard Analysis and Management Service Version 1.2.0 Administration Guide
13-12000-406-20081031 21
Page 22
Expanding or renewing service Setup
Figure 9: Locating the Service Account ID
Near the bottom of the page, a Product/Contract Maintenance area appears.
4 Enter the Contract Number and a Description in the appropriate fields.
Figure 10: Adding a purchased contract
5 Select Add.
The terms of the contract appear.
6 If you agree, select Agree. A contract term confirmation appears.
If you do not agree to the terms of the service contract, select Don’t Agree.
FortiGuard Analysis and Management Service Version 1.2.0 Administration Guide
22 13-12000-406-20081031
Page 23

Setup Required port numbers
7 If your contract details appear to be correct, select Complete Registration.
If you have added a contract for a different service, or added a contract with
service levels greater than a trial contract, you may want to authorize devices to
use the new service, or adjust settings such as quota, and configure devices to
allow remote logging or central management. Continue setup with “Management”
on page 35.
Required port numbers
The service is provided to authorized devices connecting to the Fortinet
Distribution Network (FDN) through the Internet. For successful access to the
service, all NAT devices and firewalls between the FDN and the devices must
permit required protocols and port numbers.
For more information, see the Fortinet Knowledge Center article, Traffic Types
and TCP/UDP Ports used by Fortinet Products.
FortiGuard Analysis and Management Service Version 1.2.0 Administration Guide
13-12000-406-20081031 23
Page 24

Required port numbers Setup
FortiGuard Analysis and Management Service Version 1.2.0 Administration Guide
24 13-12000-406-20081031
Page 25

Dashboard The Dashboard main menu
Dashboard
The Dashboard main menu allows users to customize what system information
they want to monitor, such as virus activity and system resources, which are
displayed as widgets. Within this menu, users can also add tabs, which are
referred to as pages. These pages contain widgets which you can customize.
The information provided by the widgets allows users to quickly assess what is
occurring on their networks and on the devices. For example, your Virus Report
widget may report that a specific virus has been detected several times. When
you select the virus name in the widget, you are redirected to the FortiGuard
Center’s Virus Encyclopedia page for that virus, which provides additional
information about it.
The following topics are included in this section:
• The Dashboard main menu
• Widgets
• Adding and customizing pages
• Configuring widgets
• Customizing the Dashboard page
The Dashboard main menu
The Dashboard main menu provides users the flexibility they need to monitor the
network and devices. Within this menu, users can add the widgets they want to
view, make a specific page the default page, or edit existing widgets.
You can customize the Dashboard page (located within the Dashboard tab), by
editing the existing default widgets, or by adding or removing widgets. You can
also change the widget layout on this page. The Dashboard page is the default
page that appears when you first access the Dashboard main menu.
You can add nine pages and customize them with different combinations of
widgets. You can also delete these pages.
When customizing the Dashboard page or other pages, you can choose from the
following widgets:
• Resource Monitor • Virus Report
• Network Monitor • IPS Report
• Trap Console • Web Report
• Traffic Report • Spam Report
• Event Report • Report Browser
These widgets are similar to those available on the device’s web-based manager.
There are five default widgets that appear on the Dashboard page: Report
Browser, Resource Monitor, Traffic Report, Event Report, and Web Category
Report.
FortiGuard Analysis and Management Service Version 1.2.0 Administration Guide
13-12000-406-20081031 25
Page 26

Widgets Dashboard
Figure 11: Customized Dashboard page
Widgets
The Dashboard widgets provide valuable information about what is happening on
your network. The information gathered is received from logs and SNMP requests.
You can customize the Dashboard page (the default tab and any that you add), to
display a variety of these widgets.You can also customize each widget to your
requirements.
There are three widgets that receive their information from sources other than
logs: Resource Monitor, Network Monitor and Trap Console. The other widgets,
which include Report Browser, are all report widgets and receive all of their
information from logs.
Most widgets contain the following arrows and icons so that you can better
customize each individual widget:
• Expand Arrow – displays or hides widget details
• Edit – configures widget settings
• Refresh – immediately updates the display
• Print – prints the information of that widget as hardcopy
• Delete – removes the widget from the page.
When you are ready to configure a widget, you can select the + sign beside the
name of the page you want to configure widgets for. The + sign reveals the
Dashboard’s main menu options, which also enable you to set the page as the
default page. The default page is the page that appears when you access the
Dashboard main menu.
FortiGuard Analysis and Management Service Version 1.2.0 Administration Guide
26 13-12000-406-20081031
Page 27

Dashboard Adding and customizing pages
Adding and customizing pages
You can add up to nine pages within the Dashboard main menu, and you can
customize the widgets that you apply to those pages. The following procedure
explains how to do so.
To add and customize a page
1 Go to the Dashboard main menu.
2 Select the New Page link.
3 Select the widget that you want and customize that widget’s information. See
“Configuring widgets” on page 27 for detailed instructions.
The name of each widget should be clear and understandable (for example,
Headquarters_TrafficReport). You can enter up to 42 characters.
4 After configuring the widgets, if applicable, select Change Layout.
5 Select the layout you want from the available layout options.
6 If you want to make this page the default page, select Set Default Page and then
select the check box beside “is default page”.
7 Select Save Settings to save your page.
Configuring widgets
You need to configure widgets when you are adding them to a page. Widgets
provide information that is quickly accessed and viewed by users. You can also
edit these widgets after configuring them. The following information explains how
to configure each individual widget.
Note: When configuring widgets, you must first reveal the Dashboard’s main menu options.
To reveal these options, select the + sign beside the name of the page that you want to
configure widgets for.
Configuring the Resource Monitor
The Resource Monitor provides information about how much or how little CPU,
HDD, and Memory resources are being used on the device. This widget displays
each resource usage, such as CPU, as a gauge.
To configure a Resource Monitor widget, select Add Resource Monitor in Add
Widgets, follow the instructions in the table below, and select OK. If you want to
edit an existing Resource Monitor widget, select the Edit icon in the widget and
then follow the instructions in the table below. Select OK to save the changed
settings.
After configuring the Resource Monitor widget, you can switch from Current to
History. Current allows you to view the line chart while History allows you to view
the gauges that display the resources being monitored.
To switch to History, select Current beside the Edit icon. To switch to Current,
select History beside the Edit icon.
FortiGuard Analysis and Management Service Version 1.2.0 Administration Guide
13-12000-406-20081031 27
Page 28

Configuring widgets Dashboard
Figure 12: Resource Monitor
Monitor Name Enter the name of the resource monitor (for example,
Device Select the device that the information is gathered from.
Polling Interval Select how often the server will poll the device to receive information,
Monitor(s) Select the monitors to include in this widget, with the following options
Charting Options Select the check box if you want the line in the graph to fill in below
OK Select to save the settings (current session only).
Resource_Monitor_Headquarters).
in intervals of 60 seconds, 2 minutes, or 5 minutes.
to specify what each will contain:
Variable The name of the variable.
Color The color that will appear for that variable. You can
select a color from either the list or the color block.
When you select the color block, the Color Palette
appears; select a color and then select OK to apply it to
the variable.
Alert profile The alert profile to use for that variable. For more
information about alert profiles, see “Configuring an
alert profile” on page 55.
Threshold Enter the threshold (maximum) number for the
variable.
the line.
Note: You must select Customize > Save Settings from the
Dashboard if you want your settings to be saved permanently.
•
•
Configuring the Network Monitor
The Network Monitor provides information about what is happening on the
network for which the device is currently configured.
To configure a Network Monitor widget, select Add Network Monitor in Add
Widgets, follow the instructions in the table below, and select OK. If you want to
edit an existing Network Monitor widget, select the Edit icon in the widget and then
follow the instructions in the table below. Select OK to save the changed settings.
FortiGuard Analysis and Management Service Version 1.2.0 Administration Guide
28 13-12000-406-20081031
Page 29

Dashboard Configuring widgets
Figure 13: Network Monitor
Monitor Name Enter the name of the network monitor (for example,
Device Select the device that the information is gathered from.
Polling Interval Select how often the server will poll the device to receive information,
Monitor(s) Select the monitors to include in this widget, with the following options
Add Another Select to add multiple monitors to the list.
Charting Options Select the check box if you want the line in the graph to fill in below
OK Select to save the settings (current session only).
Network_Monitor_Headquarters).
in intervals of 60 seconds, 2 minutes, or 5 minutes.
to specify what each will contain:
Variable The type of variable or monitor that is
available in the list.
Additional Selection Depending on the monitor selected, you can
also select the type of interface (for example,
external).
Color The color that will appear for that variable.
You can select a color from either the list or
the color block.
When you select the color block, the Color
Palette appears; select a color and then
select OK to apply it to the variable.
Alert profile Select the alert profile to use for that variable.
For more information about alert profiles, see
“Configuring an alert profile” on page 55.
Threshold Enter the threshold (maximum) number for
the variable.
the line.
Note: You must select Customize > Save Settings from the
Dashboard if you want your settings to be saved permanently.
•
Configuring the Trap Console
The Trap Console provides information about SNMP traps. The Trap Console
provides monitor or alert information, helping you to determine what trap you need
to monitor.
FortiGuard Analysis and Management Service Version 1.2.0 Administration Guide
13-12000-406-20081031 29
Page 30

Configuring widgets Dashboard
To configure a Trap Console widget, select Add Trap Console in Add Widgets,
follow the instructions in the table below, and select OK. If you want to edit an
existing Trap Console widget, select the Edit icon in the widget and then follow the
instructions in the table below. Select OK to save the changed settings.
Figure 14: Trap Console
Name Enter the name of the trap console (for example,
Trap_Console_Headquarters).
Device Filter Select the device or devices that the information is gathered from. Use
the arrows to move devices over to the right column.
Category Select the category of traps to include in the trap console.
Trap Filter Select the available traps within the selected category. You can
specify one, multiple, or all trap filters using the arrows to move the
traps to the right column.
Add all Add all the available traps within the category
Remove all Remove all the available traps within the
OK Select to save the settings (current session only).
Note: You must select Customize > Save Settings from the
Dashboard if you want your settings to be saved permanently.
•
Configuring the Report widgets
The Report widgets provide information that is gathered from logs on devices,
such as traffic activity, viruses and web activity. Each report can be displayed
either as a bar or pie chart. From anywhere in a chart, you can drill down to view
second-level information for that report.
The seven available report widgets are:
to the right column.
category back to the left column.
• Traffic Report – provides information about network traffic based on traffic logs
FortiGuard Analysis and Management Service Version 1.2.0 Administration Guide
30 13-12000-406-20081031
Page 31

Dashboard Configuring widgets
• Event Report – provides information about event activity that is based on event
logs, such as an administrator logging in to that device’s web-based manager.
• Virus Report – provides specific information about each real or suspected virus
that the device detects; selecting the name of a virus redirects you to the
FortiGuard Center Virus Encyclopedia for additional information
• IPS Report – provides information about IPS anomalies and signatures
• Web Report – provides information about Internet activity and visited web sites
• Spam Report – provides information about spam activity
• Report Browser – displays all reports that are generated; this widget displays
the same information as in Analysis > Report, and does not need to be
configured.
To configure a report widget, select the report widget in Add Widgets, follow the
instructions in the table below, and select OK. If you want to edit an existing report
widget, select the Edit icon in the widget and then follow the instructions in the
table below. Select OK to save the changed settings.
Figure 15: Report configuration screen (Traffic Report displayed)
Title Enter the name of the report. For example, Headquarters_Traffic
Top Level Field Enter the level of information that appears first. For example, you
Second Level Field Enter the level of information that gives details about the top level
Device Select the device from which to gather the information.
Chart Type Select the type of chart used for displaying the information, either a
Report period Select the period of time when these activities or events happened.
FortiGuard Analysis and Management Service Version 1.2.0 Administration Guide
13-12000-406-20081031 31
indicates the type of report and specific context.
would select Source from the Top Level list in a Traffic Report to
have the source IP addresses display first.
information.
You can access this information by selecting the top level information
(for example, a bar in the bar chart).
bar chart (default) or a pie chart.
For example, select 24 hours to display the last 24 hours of network
traffic.
If you want to specify a time range, select Specify from the list. The
options From date and To date appear.
From date The start date and time of the time range. Appears
only when Specify is selected in Report period.
Select the calendar to configure a start date and
time. Select OK after configuring both the date
and time.
Page 32

Configuring widgets Dashboard
To date The end date and time of the time range. Appears
Top Enter the top number of entries to be displayed. For example, select
Color (Bar chart
only)
OK Select to save the settings (current session only).
10 from the list so that only the top 10 events display.
Select the color of the bars on the bar chart. This is available only
when bar chart is selected. You can select a color from either the list
or the color block.
When you select the color block, the Color Palette appears; select a
color and then select OK to apply it to the variable.
Note: You must select Customize > Save Settings from the
Dashboard if you want your settings to be saved permanently.
only when Specify is selected in Report period.
Select the calendar to configure the end date and
time. Select OK after configuring both the date
and time.
•
Figure 16: Traffic Report pie chart displaying the top traffic level by protocol
Figure 17: Traffic Report pie chart displaying second-level information for 80/tcp
FortiGuard Analysis and Management Service Version 1.2.0 Administration Guide
32 13-12000-406-20081031
Page 33

Dashboard Customizing the Dashboard page
Figure 18: Web Report bar chart displaying the web category names
Figure 19: Web Report bar chart displaying second-level information for the Sports
category
Customizing the Dashboard page
You can customize the Dashboard page by adding, rearranging or removing
widgets. The customized widgets and layout can then be saved for future logins.
The following procedure describes how to customize the Dashboard page,
rename it, and delete it. The Dashboard page always appears after you log in to
the portal web site if you have not made another page the default page.
To customize the Dashboard page
1 Go to Dashboard main menu.
2 If the Dashboard page is not the default page, select Dashboard.
3 Select the + sign beside the name to reveal the Dashboard’s main menu options.
4 Edit the Dashboard page so that it is customized to your specific requirements.
5 Select Save Settings to save the customized settings.
6 If you want to rename the Dashboard page, select the name, delete the existing
name, and then enter the new name.
7 To delete the page, select the x beside the name.
•
FortiGuard Analysis and Management Service Version 1.2.0 Administration Guide
13-12000-406-20081031 33
Page 34

Customizing the Dashboard page Dashboard
FortiGuard Analysis and Management Service Version 1.2.0 Administration Guide
34 13-12000-406-20081031
Page 35

Management Device
Management
The Management menu provides remote management features, allowing you to
upload scripts, schedule when to upgrade firmware on a device, and view account
information.
This section includes the following topics:
• Device
• Scripts
• Topology Tool
• Settings
Device
The Device tab provides information about devices, and allows you to schedule
firmware upgrades or run scripts. You can also de-authorize the service for
devices.
The service can receive and deploy configuration revisions between the service
and licensed, managed devices, thus serving as both an off-site backup and a
management portal. From the portal, you can view and search configuration
revisions that have been received from your managed devices, create scripts from
configuration revisions, and restore configuration revisions to devices.
This topic includes the following:
• Viewing device information
• Adding and editing devices
• Authorizing the service on devices
• De-authorizing the service on devices
• Sending manual or automatic configuration revisions
• Viewing configuration revisions
• Searching configuration revisions
• Comparing configuration revisions
• Restoring configuration revisions
• Running scripts
Viewing device information
The Device section (in the Device tab) displays detailed information about each
registered device, including the status of its connection with the service. This
section contains additional tabs at the bottom to allow you to view details, tasks
and revision history for a device.
You can view this detailed information about each device by selecting the device’s
host name, located in the Host Name column of the Device section. Each tab and
section provides information specific for the device you are currently viewing,
which is highlighted in the Device section.
FortiGuard Analysis and Management Service Version 1.2.0 Administration Guide
13-12000-406-20081031 35
Page 36

Device Management
The Device Detail tab displays the Basic Information section, which shows
information such as the internal IP address of the device and the current firmware
version running on the device.
This tab also displays the Tasks section, which shows information about
scheduled tasks. You can also upgrade firmware or run scripts from this section.
For more information, see “Changing firmware from the portal web site” on
page 44 and “Creating scripts” on page 46.
The Revision History tab allows you to search configuration revisions to find a
configuration change that occurred on a device.
To view device information, go to Management > Device.
Figure 20: Devices in the Device section of the Device tab
Device section
Add Device Add a device to the contract.
Host Name The name you entered for your device. This name can be unique, or it
SN The serial number of the device.
Firmware The firmware image currently running on the device. The firmware
Quota / Daily
Volume
Storage Used The amount of storage already used by the device.
RTM Connected The connection status of the device. The orange X status indicates
Last Revision
(Date/Time)
Action Select Disable to de-authorize the service to that device, or Enable to
can be the default host name.
Select the device’s host name to view each device’s information.
image is displayed in the format:
V<version_number>-b<build_number>(<mainentance_
release_ number>)
Example: V3.0-b660(MR6).
Displays the daily volume and quota that is assigned to the device, in
the format <number>G/<number>M. Example, 8G/10M.
that the device has authorized use of the service, but is not
connected. The green check mark indicates that the device is
authorized to use the service and is connected to the service.
The latest revision that occurred. The date and time format is
<number_incremental>(yyyy:mm:dd hh:mm). For example,
3 (2008-05-13 12:16)
the list and that it occurred on May 13, 2008, at 12:16.
Revisions are given an incremental number, starting at 1 and
increasing as revisions are created.
authorize it.
Select Edit to change the daily volume and quota amounts.
means that the latest revision is the third in
FortiGuard Analysis and Management Service Version 1.2.0 Administration Guide
36 13-12000-406-20081031
Page 37

Management Device
Basic Information section
IP The internal IP address of the device.
Time Zone The time zone associated with that device.
Firmware The current firmware image running on the device. The firmware
Automatically
Upload Config
Tasks section
Upgrade
Firmware
Run Script Run a script file. For more information about scripts, see “Creating
Show Available
Firmware
Scheduled Task The name of the scheduled task.
Type The type of task that will be performed. There are three types: Config
Scheduled Time The date and time of when the schedule task will begin. The date and
Status The status of the scheduled task.
Action The action you can take to delete or edit a schedule. The Delete and
Revision History section
image is displayed in the format:
v<firmware_version>-<build_number>(<maintenance
release_number>).
The current action the device will take when a configuration is saved:
NO – the device will not automatically upload the configuration
YES – the device will automatically upload the configuration.
Select Change to change whether the device will automatically upload
a saved configuration or not.
Upgrade the firmware on the device. For more information about
upgrading a device’s firmware, see “Changing firmware from the
device” on page 45 and “Changing firmware from the portal web site”
on page 44.
scripts” on page 46 and “Running scripts” on page 43.
Displays all available firmware for the devices. For more information,
see “Viewing available firmware images” on page 44.
(configuration upload), Script (running a script), and Firmware
(upgrading a firmware image).
time are in the format, yyyy-mm-dd hh:mm:ss.
Edit icons appear after the schedule task starts.
The Revision History section provides a list of backed up
configurations. You can also compare configurations to view what
changed between revisions. For more information, see “Viewing
configuration revisions” on page 39.
Adding and editing devices
You can add devices to the contract or edit the daily volume and quota for a
device. Adding devices to a contract is available only if your contract allows it.
To add a device
1 Go to Management > Device.
2 In the Device section, select Add Device.
3 Enter the appropriate information for the following:
SN Enter the serial number of the device.
Quota (G) Enter the total amount of disk space that the device is allowed to
Daily Volume (M) Enter the amount of disk space that the device is allowed to
Comments Enter any comments or descriptions for that device, if applicable.
4 Select Submit.
FortiGuard Analysis and Management Service Version 1.2.0 Administration Guide
13-12000-406-20081031 37
use.
consume per day.
Page 38

Device Management
To edit a device
1 Go to Management > Device.
2 In the Device section, select Edit.
3 Enter the appropriate information for the following:
New Quota (G) Enter the total amount of disk space that the device is allowed to
New Daily
Volume (M)
Comments Enter any comments or descriptions for that device, if applicable.
use.
Enter the amount of disk space that the device is allowed to
consume per day.
4 Select Submit.
Authorizing the service on devices
You can authorize current registered devices or when adding devices to the
service contract from the Device menu. Authorizing devices on the portal web site
establishes the connection and communication between the device and the
service.
To authorize service on a device
1 Go to Management > Device.
2 In the Device section, beside the device that you want, select Enable in the Action
column.
3 Enter the appropriate information for the following:
New Quota (G) Enter the total amount of disk space that the device is allowed to
New Daily
Volume (M)
Comments Enter any comments or descriptions for that device, if applicable.
use.
Enter the amount of disk space that the device is allowed to
consume per day.
4 Select Submit.
A green check mark appears in the Connected column if the authorization was
successful. If not, an orange X appears in the Connected column. If the orange X
appears, you must go to the device’s web-based manager to reconnect to the
service. For more information about connecting to the service, see“Configuring
remote logging and central management” on page 17.
De-authorizing the service on devices
You can de-authorize the service associated with a device from the Device menu
to disable all connection and communication between the device and the service.
To de-authorize a device from using the service
1 Go to Management > Device.
2 In the Device section, beside the device that you want, select Disable.
A message similar to the following appears:
Are you sure to disable device <fortigate_name>?
3 Select OK.
FortiGuard Analysis and Management Service Version 1.2.0 Administration Guide
38 13-12000-406-20081031
Page 39

Management Device
Current Page
Download
Compare
Delete
Schedule
Sending manual or automatic configuration revisions
The service can receive manual and automatic configuration backups when you
change a licensed device’s configuration.
After the service receives the revisions, you can view or search them. You can
also use a configuration revision to restore a device’s previous configuration, or to
create a script. Use the procedures in “Creating scripts” on page 46 and
“Restoring configuration revisions” on page 43.
You can manually send a configuration revision to the portal web site in one of the
following ways:
• From the FortiGate web-based manager, select the Backup Configuration
button in the upper right corner, select to back up to FortiGuard, and then
select Backup.
• From the FortiGate web-based manager, select System > Maintenance >
Backup & Restore, select to back up to FortiGuard, and then select Backup.
If you want to automatically send configuration revisions on administrator logout
or timeout, enable the feature from System > Admin > Central Management in
the FortiGate web-based manager. For more information, see “Configuring a
device to use the service” on page 16.
Viewing configuration revisions
Configuration revisions can be viewed from the portal web site or the FortiGate
web-based manager.
Configuration revisions will not appear on the portal web site until your devices
are configured to send them. For more information, see “Sending manual or
automatic configuration revisions” on page 39.
If automatic backups are configured, most configuration changes cause devices
to make an automatic backup; however there are exceptions, which include VPN
certificates, topology, FortiGuard license status, host name, high availability (HA)
override and priority, and network interface media access control (MAC) address.
To view configuration revisions on the portal web site, go to Management >
Device > Revision History.
Figure 21: List of configuration revisions for each device
FortiGuard Analysis and Management Service Version 1.2.0 Administration Guide
13-12000-406-20081031 39
Page 40

Device Management
Start Date Select the start date of the time range of configuration files to display.
End Date Select the end date of the time range of configuration files to display.
Keywords Enter search terms, such as CLI keywords, then select Search to display
Search Enter search terms, then select Search to display specific configuration
Reset Select Reset to clear time range and search constraints on the
Current Page By default, the first page of the list of items is displayed. The total
Revision The revision number of the configuration file.
Date/Time The date and time that the configuration revision was created.
Administrator The user name of the administrator who created the configuration
Comments The comment that the administrator entered when creating the
Firmware The firmware version that the configuration revision was created in.
Action Select Download to download a copy of that revision’s configuration file.
specific configuration files.
files.
configuration file view.
number of pages appears after the current page number. For example, if
3/54 appears, you are currently viewing page 3 of 54 pages.
To view pages, select the left and right arrows to display the first,
previous, next, or last page.
To view a specific page, enter the page number in the field and then
press Enter.
revision.
configuration revision.
If the revision was created automatically on a logout or timeout, the
comment will be Automatic backup (session expired).
Select Compare to examine differences between configuration
revisions.
Select Delete to delete a revision.
Select Schedule to schedule a time period to upgrade the firmware on
the device.
Searching configuration revisions
You can search configuration revisions to find a configuration change that
occurred on a device.
To search a revision
1 Go to Management > Device > Revision History.
2 From the Device section, select the SN of the device to search.
3 Select the calendar icon next to the Start Date field, and then select the earliest
date in your search’s date range.
4 Select the calendar icon next to the End Date field and then select the latest date
in your search’s date range.
5 Enter a search keyword in the Keywords field.
The search keyword can be any word in the configuration revision.
6 Select Search.
Configuration revisions containing the keyword appear. When you are ready to
clear the search results and display the unfiltered list, empty the Keywords field
and select Search.
FortiGuard Analysis and Management Service Version 1.2.0 Administration Guide
40 13-12000-406-20081031
Page 41

Management Device
Comparing configuration revisions
As you accrue configuration revisions, you may want to determine what changed
between two revisions. This can be useful for troubleshooting a configuration
change, or for creating scripts.
Both the FortiGate web-based manager and the portal web site provides a “diff”
tool, which enables you to view changes either within the context of each whole
file or as isolated change lines.
To compare configuration revisions from within the portal web site
1 Go to Management > Device > Revision History.
2 Select the Host Name of the device that you want to compare revisions.
3 In the Action column, in the row corresponding to either one of the revisions that
you want to compare, select Compare.
4 From “Compared With”, select the revision number selection method, then select
or type the Revision Number.
Original Revision Enter the number of the original revision configuration. This will be
Compared With Select either Select Revision or Specify Revision to have a
Revision Number The revision configuration that you are going to compare the
the first revision; the second revision, the one that will be
compared to the original, is selected in Revision Number.
specific comparison of the two revision configurations or just the
selected revision.
Select Revision – Compares with another Revision Number that
you choose by selecting from the descriptive list that includes
revision numbers, times, administrators, and associated revision
comments for each revision.
Specify Revision – Compares with another Revision Number that
you choose by typing it.
original revision configuration with.
If you select Select Revision, a list of the revision configurations
appears with the revision number, date and time, user associated
with that revision, and a comment.Select one of these revisions.
If you select Specify Revision, enter a number for the revision
configuration you want to compare with the original revision
configuration.
5 To show only configuration lines which differ, select Show Different Parts Only.
If you select Show Different Parts Only, configuration lines which differ will be
highlighted with color.
6 Select OK.
A new window appears, containing each configuration revision in a separate
column, with changes highlighted.
• Green highlight: added line
• Yellow highlight: changed line
• Red highlight: deleted line
You can scroll down through the changes, or select a double arrow (<< or >>)
located at the top to jump to the exact position of the next or previous change.
FortiGuard Analysis and Management Service Version 1.2.0 Administration Guide
13-12000-406-20081031 41
Page 42

Device Management
To compare configuration revisions from within the FortiGate web-based
manager
1 In the FortiGate web-based manager, go to System > Maintenance > Revision
Control.
2 In the Action column, in the row corresponding to either one of the revisions that
you want to compare, select Diff.
3 In Revision Diff, from “Diff With”, select a second revision for comparison. You can
either:
Original Revision The revision number
Compared With Select one of the following to compare the configurations:
Current Config – Compares with the current configuration on
your device.
Select Revision – Compares with another revision number that
you choose by selecting from the descriptive list that includes
revision numbers, times, administrators, and associated revision
comments for each revision.
Specify Revision – Compares with another revision number that
you choose by typing it.
Revision Number The revision configuration that you are going to compare the
original revision configuration with.
If you select Select Revision, a list of the revision configurations
appears with the revision number, date and time, user associated
with that revision, and a comment.Select one of these revisions.
If you select Specify Revision, enter a number for the revision
configuration you want to compare with the original revision
configuration.
4 Select OK.
A new window appears, containing each configuration revision in a separate
columns, with changes highlighted.
• Green highlight: added line
• Yellow highlight: changed line
• Red highlight: deleted line
You can scroll down through the changes, or select a double arrow (<< or >>)
located at the top to jump to the exact position of the next or previous change.
Restoring configuration revisions
You can restore a previous configuration to your device by using configuration
revisions received by the service.
To restore a configuration revision or script
1 In the FortiGate web-based manager, go to System > Maintenance > Backup &
Restore.
2 In “Restore configuration from”, select FortiGuard to restore a configuration from
the portal web site.
3 Select Browse to locate the configuration revision or script (“template”) to apply.
4 Select Restore.
A success message appears.
Settings successfully uploaded. Please wait while the system
restarts.
FortiGuard Analysis and Management Service Version 1.2.0 Administration Guide
42 13-12000-406-20081031
Page 43

Management Device
!
Note: Instead of restoring a previous configuration, you can also apply a configuration
script. For more information, see “Scripts” on page 46.
Running scripts
Caution: Verify configuration scripts before deployment. Deploying a configuration script
that alters host name, IP address, or the service settings can result in interrupted
connectivity.
You can run scripts or schedule when a script runs from the Tasks section of the
Device menu. Scripts allow you to deploy identical configuration items to many
devices. Scripts are configured from configuration backup files which are then
uploaded to the portal web site. For more information about scripts and
configuring them, see “Scripts” on page 46.
To run a script
1 Go to Management > Device > Device Detail.
2 In the Tasks section, select Run Script.
3 Enter the appropriate information for the following:
Scheduled Time
(GMT:<time_zone>)
Script Select the name of the script you want to run from the list.
Select one of the following:
• Time – Enter the time period in the field or use the Calendar
• ASAP – Select to immediately run the script after you select
4 Select Submit.
Viewing available firmware images
When you select the Show Applicable Firmware link in Tasks, all available
firmware images on the FDN appear. This list includes FortiOS 2.80 firmware and
patch releases.
Figure 22: Firmware images (including FortiOS 2.80)
icon. The script will run at the specified time you enter.
Submit.
FortiGuard Analysis and Management Service Version 1.2.0 Administration Guide
13-12000-406-20081031 43
Page 44

Device Management
!
Release The version numbers of firmware images currently available from the
Platform The device’s model type and number. For example, a FortiGate-100
Build Number
(Build Date)
FDN for your authorized devices. Releases towards the top of the list are
more recent.
Select the Expand Arrows to expand or hide releases within the major or
minor version number.
device would have a platform code of FGT-100.
The build number of the firmware version, and the date and time that the
firmware image was built.
Changing firmware from the portal web site
Caution: Back up the configuration before downgrading. Downgrading the firmware may
reset the device to that firmware’s default configuration, resulting in configuration loss. This
includes the interface IP addresses, as well as HTTP, HTTPS, SSH, and Telnet
administrative access. For backup procedures, see the FortiGate Administration Guide.
The Device Detail tab displays each device’s current firmware version and any
scheduled firmware changes.
Authorized, configured devices periodically poll the service. If you have scheduled
a firmware change, the device will discover the schedule during this poll, and
apply the firmware at the appointed time.
Each device must have a valid firmware update license to download firmware. For
high availability (HA) clusters, this includes all units in the cluster, not just the
primary unit.
You can view your firmware version and schedule a firmware change from the
Tasks section of the Device menu. You can also immediately change the firmware
from the device. For more information, see “Changing firmware from the device”
on page 45.
Note: Downgrading device firmware to FortiOS 3.0 MR6 or lower removes support for the
service.
To schedule a firmware change
1 Go to Management > Device.
2 In the Tasks section, select Upgrade Firmware.
3 Select the “Scheduled Time”, relative to the device’s local time zone, or select
“ASAP” (as soon as possible) to change the firmware immediately when the
device next polls the service.
4 From “Firmware”, select which firmware version to install from the list.
5 Select Submit.
The firmware change scheduled for the device appears in the Device Firmware
tab.
If you have scheduled an immediate change, it will take effect as soon as
possible, when the device next polls the service. Time varies by the speed of your
connection and the size of the firmware image.
FortiGuard Analysis and Management Service Version 1.2.0 Administration Guide
44 13-12000-406-20081031
Page 45

Management Scripts
!
Changing firmware from the device
Caution: Back up the configuration before downgrading. Downgrading the firmware may
reset the device to that firmware’s default configuration, resulting in data loss. This includes
the interface IP addresses, as well as HTTP, HTTPS, SSH, and Telnet administrative
access. For back up procedures, see the FortiGate Administration Guide.
In addition to immediately changing a device’s firmware from within the portal, you
can also immediately change the device’s firmware by logging in to the device’s
web-based manager.
Use the portal web site to schedule when to upgrade the device’s firmware image.
For more information, see “Changing firmware from the portal web site” on
page 44.
Note: The option, Upgrade from FortiGuard network, appears only after the device has
validated the service license.
If you downgrade device firmware to FortiOS 3.0 MR6 or lower, support for the service is
removed.
To immediately change firmware
1 In the FortiGate web-based manager, go to System > Status.
2 In System Information, in Firmware Version, select Update.
Scripts
3 Select “FortiGuard Network” in Upgrade From list.
If you want to downgrade the device’s firmware, enable Allow firmware
downgrade.
4 Select the firmware version.
5 Select OK.
A status message appears: Downloading firmware from FortiGuard
server, please wait.
6 If you are downgrading the firmware, after the image is successfully downloaded,
another message appears.
This operation will downgrade the current firmware version.
Are you sure you want to continue ?
7 Select OK.
Scripts allow you to deploy identical configuration items to many devices. You can
view configured scripts from the Script menu. For example, if all of your devices
use identical administrator access profiles, you can create the access profile once
as a script, and then deploy the script to all devices which should use those same
settings.
The Script tab allows you to upload and deploy configuration scripts.
FortiGuard Analysis and Management Service Version 1.2.0 Administration Guide
13-12000-406-20081031 45
Page 46

Scripts Management
Creating scripts
With a plain text editor, you can create scripts from backed up configuration files,
and then upload them as a script. Alternatively, you can type CLI commands
directly into a script in the portal web site.
The following procedure requires a plain text editor.
Note: Configuration files contain CLI commands. For descriptions of CLI commands, see
the FortiGate CLI Reference.
To create a script from a configuration file
1 Go to Management > Device > Revision History.
2 In the revision history list, locate the configuration file that you want to use as the
basis for your script.
3 Select Download and save to your computer.
4 On your computer, edit the downloaded configuration file within a plain text editor,
removing the settings that you do not want deployed.
For example, if you want to deploy the script to multiple devices, you might
remove device-specific settings, such as host names and interface IP addresses.
For settings which are a comma- or space-delimited list, remember to re-type the
entire list, not just new list items.
5 Save the configuration file.
6 Go to Script.
7 Select Upload.
8 In the Upload Script dialog box, enter a name for the script.
9 Enter comments that describe the script.
10 Select Browse to locate the script file.
11 Select Submit.
The script file is uploaded to the script list. Upload time will vary by connection
speed and file size.
To create a script by entering CLI commands
1 Go to Management > Script.
2 Select Input.
3 In the Script Input dialog box, enter a name for the script.
4 Enter comments that describe the script.
5 In “Script”, type CLI commands exactly as you would type them at the command
prompt.
For example, if you want to deploy the script to multiple devices, you might omit
device-specific settings, such as host names and interface IP addresses. For
settings which are a comma- or space-delimited list, remember to re-type the
entire list, not just new list items.
6 Before submitting the commands, review the script for valid CLI syntax and
correct settings.
FortiGuard Analysis and Management Service Version 1.2.0 Administration Guide
46 13-12000-406-20081031
Page 47

Management Scripts
Current
Page
Download
View
Delete
7 Select Submit.
The script is added to the list of available scripts.
Note: Verify configuration scripts before deployment. Deploying a configuration script that
alters host name, IP address, or the service settings can result in interrupted connectivity.
For more information about CLI commands, see the FortiGate CLI Reference.
Viewing available configuration scripts
The Script tab displays all configuration scripts that you have uploaded or input,
and any deployment schedules for each script.
After entering and uploading the script to the portal web site, scripts can then be
scheduled for deployment. For information on creating scripts, see “Creating
scripts” on page 46.
To view available configuration scripts, go to Management > Script.
Figure 23: Scripts
Current Page By default, the first page of the list of items is displayed. The total
Upload Upload a script file to your computer from the server.
Input Create a script by typing CLI commands.
Name The name of a script.
Checkin-User The name of the user that created the script, either by uploading it from
Date/Time The date and time that the script was created.
Comments Description or comment that the user may have entered when creating
Action Select Download to download the script to your computer.
FortiGuard Analysis and Management Service Version 1.2.0 Administration Guide
13-12000-406-20081031 47
number of pages appears after the current page number. For example, if
3/54 appears, you are currently viewing page 3 of 54 pages.
To view pages, select the left and right arrows to display the first,
previous, next, or last page.
To view a specific page, enter the page number in the field and then
press Enter.
the script list, or submitting it from a FortiGate unit’s web-based
manager.
the script by selecting Input.
Select View to view the script. You can also edit the script while viewing
it.
Select Delete to remove the script. You can also edit scripts while
viewing it.
Page 48

Topology Tool Management
Topology Tool section menus
Topology Tool
The Topology Tool tab, similar to the Topology tab found on most devices, allows
you to create and save a diagram of your specific network. Multiple network
diagrams can also be created and saved on the service’s servers, which can then
be retrieved whenever needed.
The Topology Tool tab provides all the things you need to create a network
diagram, such as Fortinet device icons, connector lines, and text boxes. There are
also two modes to select from: View mode displays the network diagram and Edit
mode provides what you need to create a network diagram.
Note: The View Mode / Edit Mode button acts as a toggle, so that when you are in one
mode, the text displayed indicates that selecting it will switch the display to the other mode.
For example, if you are in Edit mode, the text displays “View Mode”, indicating that
selecting the button will switch you to the View mode.
Figure 24: Network diagram in View mode
FortiGuard Analysis and Management Service Version 1.2.0 Administration Guide
48 13-12000-406-20081031
Page 49

Management Topology Tool
Topology Tool section menus
Drawing Tools
Figure 25: Network diagram in Edit mode
Within the Topology Tool section, additional menus allow you to access network
diagrams and customize the view. These additional menus differ between View
mode and Edit mode, but you can access them the same way. For example, to
open a saved network diagram, go to File > Open.
View Mode menus
File Contains the following menus:
View Contains the following menus:
Help Contains the About menu. This displays
Edit Mode menus
• Open
• Close
• Zoom In
• Zoom Out
• Hide Grid
• Edit Mode
the firmware version of the Topology
To ol .
FortiGuard Analysis and Management Service Version 1.2.0 Administration Guide
13-12000-406-20081031 49
Page 50

Topology Tool Management
File Contains the following menus:
• New
• Open
• Upload
• Download
• Export
• Save
• Save as
• Close
Edit Contains the following menus:
• Bring to Front
• Send to Back
• Group
• Ungroup
• Delete
View Contains the following menus:
• Zoom In
• Zoom Out
• Hide Grid
• Show Mode
Help Contains the About menu. This displays
the firmware version of the Topology
Tool.
In Edit mode, many different icons (or drawing tools) and shapes help you create
a network diagram. These shapes are available in the Shapes section and are
used to show the different Fortinet products that may be incorporated into your
network. The drawing tools are available below the Topology Tool menus.
To find out about each drawing tool, use your mouse to view each one’s tooltip.
Creating a network diagram
You can create a network diagram easily in the Topology Tool tab using the Edit
mode. In Edit mode, you can choose the shapes you want in your diagram, such
as Fortinet product icons or computers, and connector lines as well as many other
options.
Note: The Edit Mode / View Mode button allows you to switch between the two modes. For
example, if the wording on the button is “Edit Mode”, this indicates that you are using View
Mode and that by selecting the control you will switch to Edit Mode.
To create a network diagram
1 Go to Management > Topology Tool.
2 Select Edit Mode to access the drawing tools.
3 Draw the diagram using the available drawing tools and shapes.
FortiGuard Analysis and Management Service Version 1.2.0 Administration Guide
50 13-12000-406-20081031
Page 51

Management Settings
4 Select Save to save the network diagram to the service’s server.
You can save the network diagram to either the Private or Shared folders. If you
save the network diagram to the Private folders, it is accessible only to you. The
Shared folder can be accessed by anyone.
Viewing a network diagram
You can view a network diagram when you are in either Edit mode or View mode.
When you are in View mode, if you open a network diagram, you can also edit the
network diagram using the various icons and shapes.
To view a network diagram
1 Go to Management > Topology Tool.
2 If the diagram you want to view is not already displayed, select File > Open.
3 In Browse File, locate the file and select Open.
•
Settings
Viewing service account information
The Settings tab allows you to configure service account information, and to
define alert profiles, contract numbers, and users associated with the service.
This topic includes:
• Viewing service account information
• Adding and editing devices
• Editing your login profile
• Changing your service account ID
• Configuring an alert profile
The Settings tab includes information on your Service Account ID and users, as
well as service contract information that applies to that service account. You can
also configure alert profiles in Alert Profile.
You can move Account Information, User Information, and Alert Profile around to
rearrange the default arrangement. Use your mouse to arrange the order of these
sections within Settings. When you arrange these sections, they are not saved in
your specific arrangement, even when you log out of the portal web site.
To view service account information, go to Management > Settings.
FortiGuard Analysis and Management Service Version 1.2.0 Administration Guide
13-12000-406-20081031 51
Page 52

Settings Management
Delete
Edit
Figure 26: Settings menu
Account
Information
User Information This section provides information concerning users and their
This section provides information specific to your account, such as
the service account ID, the time zone, and other details about your
contract.
Service
Account ID
Time Zone The time zone that you associated with your service
Expiration
Date
Show
Contract
Details
Max Devices The maximum number of devices licensed to use
Enabled The number of devices currently authorized to use
Storage Quota The maximum amount of disk space, in gigabytes,
Allocated The total amount of the devices’ individual quotas in
Daily Volume The maximum amount of disk space that a device
Allocated The amount of daily volume currently consumable
administration roles. You can also add administrators.
The identifier you created during either a trial
contract or when you purchased a contract, and
used when configuring a device to use the service.
account when creating your contract, either through
the portal web site or the Fortinet Technical Support
web site.
The date the service contract expires.
Display the details of your service contract including
the contract serial number.
SN The serial number of the contract you
Expiration
Date
Quota The maximum amount of disk space
Daily
Vol ume
Description The comment you included when
the service simultaneously under this Service
Account ID.
the service with the Service Account ID.
that you can allocate to devices using the service.
gigabytes.
using the service can consume per day. This must
be less than or equal to the Quota.
per day by devices using the service; a total of their
individual daily quotas.
purchased.
The date the service contract expires.
that you can allocate to devices using
the service.
The maximum amount of disk space
that a device is using with the service.
registering.
FortiGuard Analysis and Management Service Version 1.2.0 Administration Guide
52 13-12000-406-20081031
Page 53

Management Settings
My Profile Display the admin user’s profile information, such as
Add User Add a portal user login. For more information, see
User Name The name of the user that has access to the portal
Email The email address used when logging in to the
Role The specified role of the user. The roles for users
Action Select Delete to remove a user from the list.
Alert Profile Use this section to view and configure alert profiles. For more
information, see “Configuring an alert profile” on page 55.
Create Profile Add a new alert profile.
Name The name of the alert profile.
Description The number of occurrences and the time frame that
Email The email address of the receiver of an alert profile.
Actions Select Delete to remove an alert profile.
email address and security questions. The admin
user is the default user of the service contract and
has read and write privileges, similar to the admin
administrator on a device. This user can only edit
My Profile; the admin user cannot delete his or her
own profile.
“Adding, editing and removing administrators” on
page 52.
web site. This is usually the person’s first and last
name. Use the email address of the user to log in to
the portal web site.
portal.
are:
Admin – read and write privileges
Non-Admin – read privileges only
e-Discovery – access to only the e-Discovery
menu.
Select Edit to change the user’s information.
These actions do not appear next to your own
account. If you want to edit this account, see
“Editing your login profile” on page 53.
they occur in.
Select Edit to change an alert profile.
Note: In high availability (HA) clusters, daily quota that is assigned in HA clusters will be
added up for each member transparently on the FortiOS side; however, at the same time,
the current volume on each member is also counted together by the primary unit.
Adding, editing and removing administrators
If multiple users will be accessing the service portal, you can add those users to
the account from the User Information area.
User roles define access privileges, and can be Non-Admin (read-only
permissions), Admin (full permissions), or e-Discovery (read and write
permissions for the e-Discovery menu).
Email addresses should be kept current. A user can retrieve a forgotten password
by entering the email address configured for his or her account. If the email
address is no longer functional, the user will not be able to retrieve the password,
and an Admin role user must instead delete and recreate the user account.
From the Settings menu, an Admin user can update the user’s email address,
user name, or role but not passwords or security questions. The user must update
his or her own password and security questions by selecting Edit.
FortiGuard Analysis and Management Service Version 1.2.0 Administration Guide
13-12000-406-20081031 53
Page 54

Settings Management
To add or edit account users
1 Go to Management > Settings.
2 In User Information, select either Add User to create a new user, or select the Edit
icon in the row of the user you want to change.
3 Enter the following information:
User Name Enter or change the name of the user.
Password Enter or change the password for the user.
Re-type Password Re-enter the password to confirm its spelling.
Email Enter the user’s email address. Users log in to the portal using
Re-type Email Re-enter the email address to confirm its spelling.
Role Select one of the following:
their email address.
• Admin - to provide full access to all features
• Non-Admin - to provide read-only access to everything except
Edit Profile, which is read-write
• e-Discovery - to provide read and write access to only the
e-Discovery menu.
4 Select Submit.
Note: The Edit action does not appear in the row listing the admin user’s account. User
accounts cannot change their own role. If you want to edit user profiles, see “Editing your
login profile” on page 53.
To remove a user account
1 Go to Management > Settings.
2 In User Information, select Delete in the Action column.
3 Select OK.
Note: The Delete action does not appear in the row for the admin user account. Admin user
accounts cannot delete themselves.
Editing your login profile
When logged in to the service portal, you can edit your account profile to update
your email address, password, security questions or name. Each user has access
to his or her own personal profile.
Users can modify only their own password and security questions, even if their
role is Admin.
To edit your profile
1 Go to Management > Settings.
2 In User Information, select My Profile.
3 Enter the new information for the following:
FortiGuard Analysis and Management Service Version 1.2.0 Administration Guide
54 13-12000-406-20081031
Page 55

Management Settings
Service Account ID The service account identification name for the account. The
User Name Enter your name. Do not include spaces or special characters.
Email Enter a new email address.
Re-type Email Re-enter the email address to confirm its spelling.
Password Enter a new password.
Re-type Password Re-enter the password to confirm its spelling.
Security Question 1 Enter a challenge that can be used to verify your identity in the
You r Answer Enter an answer for Security Question 1.
Security Question 2 Enter a second challenge that can be used to verify your identity in
You r Answer Enter an answer for Security Question 2.
service account ID cannot be edited in My Profile. See “Changing
your service account ID” on page 54 to change your service
account ID.
event that you forget your password and need to retrieve it.
the event that you forget your password and need to retrieve it.
4 Select Submit.
Changing your service account ID
The Account Information area includes the Service Account ID and time zone, and
is displayed the same way for all users and devices connecting to the account.
The Service Account ID is required for configuring a device to connect to the
service. For more information, see “Obtaining a trial contract” on page 14.
Account Information also includes usage statistics for your service contracts, such
as the contract’s expiration date, number of authorized devices, and disk quotas.
For more information, see “Viewing service account information” on page 50.
To change the Service Account ID
1 Go to Management > Settings.
2 In Account Information, beside Service Account ID, select Change.
3 Enter the new Service Account ID without special characters or spaces.
4 Select Submit.
A success message appears.
5 Select OK.
Configuring an alert profile
You can configure an alert profile within the Settings page. Alert profiles provide
notification of when a specified threshold has been reached by sending an email
message to the specified email address. You can add multiple alert profiles from
the Alert Profile section in the Settings page.
To configure an alert profile
1 Go to Management > Settings.
2 In Alert Profile, select Create Profile.
3 Enter the appropriate information for the following:
FortiGuard Analysis and Management Service Version 1.2.0 Administration Guide
13-12000-406-20081031 55
Page 56

Settings Management
Name Enter a name for the alert profile.
When [<nn>]
occurrences within
[<nn_min_hr>]
Send to Enter an email address that will receive the alert profile’s
Message Enter a message for the body of the email.
Select a number from the first list to specify the number of alerts
that must occur before an email notification is sent to the
specified email address.
Select a number from the second list to specify when alert
notification email will be sent if that number of alerts is reached. If
you select Specify (min), you can enter the specific minutes in a
third field.
notification message.
4 Select OK.
FortiGuard Analysis and Management Service Version 1.2.0 Administration Guide
56 13-12000-406-20081031
Page 57

Analysis
Analysis
In the Analysis menu, you can view, search and browse through log files of each
registered device. You can also view and generate reports. The Analysis menu
also includes the e-Discovery tab, which allows you to search for email messages.
The FortiGuard Analysis server can store all log files, such as content logs and
traffic logs. This server is a device that stores log files, similar to a FortiAnalyzer
unit or Syslog server.
Reports are automatically provided for each device and can be generated from
the Report tab. Generated reports are provided as PDF files. Reports display the
gathered log data in bar and pie graphs within the PDF file.
Reports help you to:
• view network usage and patterns to make informed decisions
• discover and address vulnerabilities across dispersed device installations
• minimize the effort required to identify attack patterns when customizing
policies to prevent attacks
• monitor Internet surfing patterns for compliance with your company policy
• identify your web site visitors for potential customers.
The e-Discovery tab allows you to configure a detailed search for specific email
messages. The e-Discovery tab also provides access for third-party users, who
have the e-Discovery role profile, to view specific email messages and to search
for specific email messages
This section includes the following topics:
• Log Viewer
• Customizing the log view
• Deleting log files from the FortiGate web-based manager
• Reports
• e-Discovery
Note: DST is now extended by four weeks in the United States and Canada and may affect
your location. It is recommended to verify if your location observes this change, since it
affects the scope of the report. Fortinet has released supporting firmware. For more
information, see the Fortinet Knowledge Center article, New Daylight Saving Time support.
In previous firmware releases of the service, the feature IP alias was available. In
FortiGuard Analysis and Management Service 1.2.0, the IP alias is no longer available.
FortiGuard Analysis and Management Service Version 1.2.0 Administration Guide
13-12000-406-20081031 59
Page 58

Log Viewer Analysis
Log Viewer
From the Log Viewer tab, you can view recent and specific logs on the registered
devices. There are two types of log viewing options:
• Recent – displays current log messages, as they are received by the service.
• Specific – provides a method of viewing historical log messages by focusing on
specific log types and time frames.
FortiGate log messages present detailed accounts of an event or activity that
occurred on your network. These log messages provide valuable information
about your network, informing you about attacks, misuse and abuse.
The FortiGate Logging in FortiOS 3.0 Technical Note provides detailed information
about all log messages and is available from the Fortinet Knowledge Center web
site.
You can search both recent and historical log messages when viewing them in
either Recent or Specified, by using Type, Level, or Column Settings.
Viewing logs
From the Log Viewer, you can view recent log messages as they are received by
the service from a device. Recent log messages provide current information about
what is happening on your network in real-time.
From the same page, you can also view historical log messages by specifying
when these log messages occurred. For example, you can view logs that occurred
between July 2, 2008 and September 15, 2008.
To view recent logs, go to Analysis > Log Viewer. Recent log messages appear
by default in the Log Viewer section. To view the most current recent logs, select
the Refresh icon.
To view historical logs, go to Analysis > Log Viewer. Select the calendar beside
Period: From and select a start date and time; select the other calendar, beside
Period: To, and then select an end date and time.
FortiGuard Analysis and Management Service Version 1.2.0 Administration Guide
60 13-12000-406-20081031
Page 59

Analysis Log Viewer
Current Page
Column
Settings
Refresh to receive
current log messages
Device
Figure 27: Viewing recent event log messages
Device The device that you are currently viewing log messages from.
Type The type of log messages you are currently viewing. For example,
Level The log severity level. You can use this to filter log messages. For
Column Settings icon Select to add or remove columns. This changes what log
Period: Recent |
Specified
Formatted | Raw By default, log messages are displayed in Formatted mode. Select
Current Page By default, the first page of the list of items is displayed. The total
if Event Log is selected, all event log messages appear.
example, selecting Information displays all log messages that
contain only the log severity level Information. For more
information about log severity levels, see “Configuring remote
logging and central management” on page 17.
information appears within Log Viewer. For more information, see
“Customizing the log column views” on page 61.
By default, Recent appears. Recent displays all current log
messages that are occurring in real-time on the selected device.
Specified displays all historical log messages. When you select
Specified, the fields From and To appear, with calendars. Select
the calendar to specify the dates to view historical log messages
on those dates.
Raw mode to view logs as they would appear within the log file,
without columns.
number of pages displays after the current page number. For
example, if 3/54 appears, you are currently viewing page 3 of 54
pages.
To view pages, select the left and right arrows to display the first,
previous, next, or last page.
To view a specific page, enter the page number in the field and
then press Enter.
FortiGuard Analysis and Management Service Version 1.2.0 Administration Guide
13-12000-406-20081031 61
Page 60

Customizing the log view Analysis
Column
Settings
Figure 28: Viewing historical event log messages
Customizing the log view
The service allows you to customize what columns and log information are
displayed when viewing logs, providing another way to find specific log
information.
Customizing the log column views
You can customize log columns to display only the information you want to view.
You can add, remove and change the position of each column from the Column
Display Settings window. This window appears after you select the Column
Settings icon. Each Column Display Settings window contains the fields
associated with the log file you are currently viewing. For example, the event log
contains the AV Status field, but the traffic log contains no AV Status, just Status.
Customizing the display of log columns is available only in Formatted view. The
following procedures assume that you are currently viewing a log file list in
Analysis > Log Viewer, and that you want to customize the view.
FortiGuard Analysis and Management Service Version 1.2.0 Administration Guide
62 13-12000-406-20081031
Page 61

Analysis Customizing the log view
Figure 29: Column Display Settings window for Event log
To show or hide columns
1 Select Column Settings.
A list of columns available for that log type appears.
2 Select columns that you want displayed or hidden by doing one of the following:
• Select a column name in the Available Fields area to add or remove a single
column, then select a single arrow to move the column to the Display Fields
area.
• Select the double arrow to add or remove all columns.
• Select Default to return all columns to their default displayed/hidden status.
3 Select Submit.
You can revert to the default column settings by selecting Default.
1 Select Column Settings.
2 Select a column name.
3 Select the up or down arrows to change the position of the column in the list.
4 Repeat steps 2 and 3 until all columns are re-arranged in the order you want.
5 Select Submit.
Filtering logs
To change the order of the columns
A list of columns available for the log type appears.
You can filter log messages by using the filter icon to find specific content when
viewing them in the Log Viewer tab. Log filters appear for certain columns only.
The filter setting is disabled by default and displays the filter icon in gray. When
enabled, the filter icon appears green.
FortiGuard Analysis and Management Service Version 1.2.0 Administration Guide
13-12000-406-20081031 63
Page 62

Customizing the log view Analysis
Filter icon
enabled
Filter icon
disabled
Figure 30: Filter icons for logs
When filtering by source or destination IP, you can use the following in the filtering
criteria:
• a single address (2.2.2.2)
• an address range using a wild card (1.2.2.*)
• an address range (1.2.2.1-1.2.2.100)
You can also use a Boolean operator (“or”) to indicate mutually exclusive choices:
• 1.1.1.1 or 2.2.2.2
• 1.1.1.1 or 2.2.2.*
• 1.1.1.1 or 2.2.2.1-2.2.2.10
To filter logs
1 Go to Analysis > Log Viewer.
2 Select a log type to view log messages from.
3 Go to a column in the log type.
4 Select the filter icon in that column’s heading.
5 Using the arrows, move the appropriate keywords from Available Fields to Display
Fields.
6 Select Submit.
To clear log filters
1 Go to Analysis > Log Viewer.
2 Select the log type that contains the column filter that you want to clear.
3 Go to the column.
4 Select the filter icon in that column’s heading.
5 Using the double arrows, move the keywords from Display Fields to Available
Fields.
6 Select Submit.
7 Repeat steps 2 to 6 for each filter.
FortiGuard Analysis and Management Service Version 1.2.0 Administration Guide
64 13-12000-406-20081031
Page 63

Analysis Log File Browser
Current Page
Device
Log File Browser
You can download all log files stored on each device. By downloading the log files,
you can view all log messages that were recorded in that log file outside of the
portal web site. When you download a log file, it is saved as a plain text file. You
can view the downloaded file in any plain text editor, such as Notepad.
To view and download log files, go to Analysis > Log File Browser.
Figure 31: Browsing log files in Analysis > Log File Browser
Device The device that you are currently viewing log messages from.
Type The type of log messages you are currently viewing. For example, if
Period:
Recent | Specified
Log Files The name of the log file you are currently viewing. This name is in the
Log Type The type of log file you are currently viewing.
From The date that the log file started collecting log messages.
To The date that the log file stopped collecting log messages.
Size (bytes) The size of the log file, in bytes.
Action Download the log type to your management computer. You can only
Current Page By default, the first page of the list of items is displayed. The total
Event Log is selected, all event log messages display.
By default, Recent appears. Recent displays all current log messages
that are occurring in real-time on the selected device.
Specified displays all historical log messages. When you select
Specified, the fields From and To appear, with calendars. Select the
calendar to specify the dates to view historical log messages on those
dates.
format: <log_name>_yyyymmdd-hhmm_yyyymmdd-hhmm.log.
For example, elog_20080915-1455_20080915-1508.log means that
this log file is an event log file and was created on September 15,
2008 at 2:55 pm and stopped on the same day at 3:08 pm.
view log files if they are downloaded to a computer.
number of pages displays after the current page number. For
example, if 3/54 appears, you are currently viewing page 3 of 54
pages.
To view pages, select the left and right arrows to display the first,
previous, next, or last page.
To view a specific page, enter the page number in the field and then
press Enter.
FortiGuard Analysis and Management Service Version 1.2.0 Administration Guide
13-12000-406-20081031 65
Page 64

Deleting log files from the FortiGate web-based manager Analysis
To download a log file
1 Go to Analysis > Log File Browser.
2 In the row containing the file you want to download, select Download.
3 After the log file downloads to your computer, open the log file.
For more information about log messages, see the FortiGate Log Message
Reference.
Deleting log files from the FortiGate web-based manager
You may need to delete logs to remove them from a report or to provide additional
space on the FortiGuard Analysis server. You can delete log files from either the
FortiGate web-based manager in System > Maintenance > FortiGuard or from
the portal web site.
Before deleting logs, you should back up log files by downloading them directly
from the FortiGuard Analysis server to ensure that the log files remain available if
needed.
Reports
Deleting log files from the FortiGate web-based manager does not permanently
remove them from the FortiGuard Analysis server. Log files that are deleted from
the FortiGate web-based manager will not be included in the report.
To delete any log files older than n months
1 In the FortiGate web-based manager, go to System > Maintenance >
FortiGuard.
2 Select the Expand Arrow beside Analysis & Management Service Options to
reveal the available options.
3 Select the number of months from the list.
4 Select the link: To purge logs older than n month(s) now, please click here.
5 Select OK.
Reports provide an easier way for you to understand what is happening on your
network without having to search through numerous log messages. Reports
gather log information and put it into a graphical format, providing a quick and
easy way to understand what is happening on your network.
Reports can help you in the following ways:
• minimize the effort required to identify attack patterns when customizing
policies to prevent attacks
• monitor Internet surfing patterns for compliance with company policy
• identify your web site visitors for potential customers.
FortiGuard Analysis and Management Service Version 1.2.0 Administration Guide
66 13-12000-406-20081031
Page 65

Analysis Reports
Generated report
Report ready to be
generated by user
No report
available for this
date
Explains how to
identify the
generated reports
and nongenerated reports
You can access reports on the portal web site either from the Dashboard menu or
from Analysis > Report. The FortiGuard Analysis server provides reports for
each device, and can generate the reports whenever you need them. You can
save reports to your computer if you want to view them outside of the portal web
site.
Figure 32: Reports
Viewing generated reports
After a report is automatically configured and generated by the FortiGuard
Analysis server, you can view that report from the Reports tab.
The FortiGuard Analysis server configures reports for each registered device.
FortiGuard Analysis and Management Service Version 1.2.0 Administration Guide
13-12000-406-20081031 67
Page 66

Reports Analysis
Figure 33: Generated daily report for the period of September 22, 2008 to September
23, 2008
To view a generated report
1 Go to Analysis > Report.
2 From the calendar, select the date that the report was generated on.
A PDF of the report appears.
3 If you want to view this report outside the portal web site, save the report to your
computer.
Deleting reports
Deleting reports provides more space on the FortiGuard Analysis server for
current reports. Fortinet recommends that you save the report before deleting it, to
ensure you have the report should you require it afterward. You must specify when
the reports were generated before deleting them. For example, if you specify
reports from August 31 to September 22, all reports within this time period are
deleted as well. If you want to delete one report, repeat the time period (for
example, September 22 to September 22), to delete the report that was generated
on September 22.
To delete a report
1 Go to Analysis > Report.
2 Select the device from the list.
3 Select Delete.
FortiGuard Analysis and Management Service Version 1.2.0 Administration Guide
68 13-12000-406-20081031
Page 67

Analysis e-Discovery
4 Select the dates using the calendars in Delete Reports.
When selecting dates, remember that reports within the time period will be deleted
as well. For example, if you select September 1 to September 5, the reports
generated on September 2, 3, and 4 will also be deleted.
5 Select Submit.
e-Discovery
The e-Discovery tab allows third-party administrators to search through email
messages, view what searches are taking place, or create new searches. These
searches are referred to as tasks. Users with the e-Discovery administrator role
can also view these tasks or create new ones.
The following topics are included in this section:
• Viewing e-Discovery tasks
• Creating tasks for e-Discovery
Viewing e-Discovery tasks
You can view e-Discovery tasks from the Tasks section of e-Discovery. If users
have the e-Discovery administrator role, this is the only menu that is accessible to
them.
When you select a task from the Task List section and then select the Task Detail
tab, details about the task display in the Basic Information section, such as who
created the task, the start and end times, and who is allowed to view the task. The
Search Criteria section displays information about the search, such as the email
address for the receiver and sender, device, and time period.
To view the e-Discovery tasks, go to Analysis > e-Discovery.
FortiGuard Analysis and Management Service Version 1.2.0 Administration Guide
13-12000-406-20081031 69
Page 68

e-Discovery Analysis
Copy
Ta sk
Delete
Ta sk
Edit
Ta sk
Reschedule
Tasks
<Task name>
Details of the
<Task Name>
Figure 34: An e-Discovery task in the e-Discovery menu
Task List This section displays the current tasks. You can create tasks by selecting
<Task Name> This section provides detailed information about the configured task,
70 13-12000-406-20081031
New Tasks.
Task Name The name of the configured task.
Description The description given to the task.
Creating Time The time the task was created, in the format yyyy-
Status The status of the task and, if completed, the time it
Result The results of the search. For example, if you are
Action Select Copy Task to copy the information in that task
such as who created the task and the criteria of the email message
search. The display name beside the Task Detail and Search Result tabs
corresponds to the selected task’s name.
Basic Information This section provides detailed information about the
FortiGuard Analysis and Management Service Version 1.2.0 Administration Guide
mm-dd hh:mm:ss.
was completed. The format of the time is yyyy-mm-
dd hh:mm:ss.
searching for a group of specific email messages,
the Result column would indicate how many email
messages contain the specific search criteria.
and make it the basis for a new task.
Select Delete to delete the task.
Select Edit to edit the information in the task.
Select Reschedule Task to reschedule the task.
task.
Description The name of the task.
Created By The user who configured the task,
in the format,
user_name@example.com.
Page 69

Analysis e-Discovery
Viewers The users who have permission to
Create Time The time the user configured the
Start Time The time the search began.
End Time The time the search ended.
<Description> The description of the task that the
Search Criteria This section provides detailed information about the search criteria,
including the attachment name.
Search Devices The devices that will be searched for the email
message. There can be multiple devices.
Date Range The time period of the search.
Email The information that is contained in the email
message, such as the subject line, words within the
body of the email message, and attachment name, if
applicable.
Matched
Number
From The sender’s email address.
To The receiver’s email address.
Subject The subject line of the email
Body The words included in the body of
Attachment
Name
Search Results This tab provides all the email messages that were found during the
search. The tab also shows whether or not the email message contains
an attachment.
view the task. For example, if the
“no admin” role was selected, the
users who have the “no admin”
role as access profile can view it.
task, in the format yyyy-mm-dd
hh:mm:ss.
user entered when configuring the
task.
The number of matches found that
contain some or all of the criteria.
message.
the email message.
The attachment name, if
applicable.
Figure 35: Search Results tab with email messages found during the search
FortiGuard Analysis and Management Service Version 1.2.0 Administration Guide
13-12000-406-20081031 71
Page 70

e-Discovery Analysis
Creating tasks for e-Discovery
You can create detailed tasks for both users and third-party administrators to view.
You can also copy an existing task to form the basis of a new task.
The following procedures describe how to create a task, copy a task to use as the
basis for a new task, and how to delete a task.
To view the task settings for e-Discovery, go to Analysis > e-Discovery. Select
the New Task link, complete the tasks described below and select Submit.
Figure 36: e-Discovery task configuration settings
Task Enter a name for the task.
Description Enter a description for this task.
Search Archives
From:
User Access
Permissions:
FortiGuard Analysis and Management Service Version 1.2.0 Administration Guide
72 13-12000-406-20081031
Select a device or multiple devices. The archived email you specify in
this task will be searched on only the selected devices.
All Devices Displays all the devices that can be searched for
Search
Devices
The users that the super administrator wants to allow other
administrators permission to view these tasks.
All Users Displays all the users that have access to the portal
Viewers The administrators that will be allowed to view the
archives. Select one, multiple, or all devices using the
arrows.
Displays all the devices that are chosen for searching
archives. If you want to remove a device, multiple
devices, or all devices, use the arrows.
web site.
tasks. If you want to remove a user, multiple users, or
all users, select the user or users and move them
using the arrows.
Page 71

Analysis e-Discovery
Date Range The time period for the archived email messages that you want to
Email Search
Criteria
search.
From Select the calendar icon and then select the start
To Select the calendar icon and then select the end date.
Enter the appropriate criteria for the search using the following:
From Enter the email address or addresses of the sender or
To Enter the address or addresses of the receiver or
Subject Enter the subject line of the email message or
Body Enter the keywords of the body of the email message
Attachment
Name
date.
senders. Use a comma to separate multiple email
addresses.
receivers. Use a comma to separate multiple email
addresses.
messages. If there is a common keyword in the
subject line of the emails you are looking for, enter the
keyword.
or messages.
Enter the names of any attachments that came with
the email message or messages.
To create tasks for e-Discovery
1 Go to Analysis > e-Discovery.
2 In Tasks, select New Task.
3 Enter the appropriate information in the available fields.
4 Select Submit.
To copy a task and apply it to a new task
1 Go to Analysis > e-Discovery.
2 In Tasks, select Copy Task in the Action column.
3 Change the appropriate information for the new task.
4 Select Submit.
To delete a task
1 Go to Analysis > e-Discovery.
2 In Tasks, select Delete Task in the Action column.
FortiGuard Analysis and Management Service Version 1.2.0 Administration Guide
13-12000-406-20081031 73
Page 72

e-Discovery Analysis
FortiGuard Analysis and Management Service Version 1.2.0 Administration Guide
74 13-12000-406-20081031
Page 73

Index
Index
A
adding purchased contracts 21
adding, configuring, or defining
administrators 55
copying a search task in e-Discovery 74
devices 37
devices to use the service 16
login profile 56
network diagram, topology tool 52
pages 27
purchased contracts 21
remote logging 18
remote management 18
renew contracts 20
scripts 47
search tasks for e-Discovery 73
administrators
adding, editing, removing 55
alert profiles 57
Analysis
customzing log view 62
e-discovery 70
log file browser 65
log viewer 60
reports 67
authorizing the service, devices 38
B
browsing log files 65
C
changing service account id 57
column view
logs 62
comments, documentation 8
comparing configuration revisions 41
configuration revisions
comparing 41
restoring 43
searching 41
configuring alert profile 57
configuring remote logging 18
contracts
renewing the service 20
creating
scripts from configuration file 47
scripts from script menu 48
tasks in e-Discovery 73
customizing dashboard 34
D
daylight savings time (DST) 59
de-authorizing the service 39
device
configuring remote logging 18
devices
adding 37
authorizing the service 38
de-authorizing the service 39
editing 37
documentation
commenting on 8
Fortinet 8
downloading log files 66
E
e-Discovery
copying tasks 74
creating tasks 73
deleting tasks 74
e-Discovery tasks 70
editing login profile 56
F
filtering logs 63
firmware images
changing from a device 46
changing from portal web site 45
FortiGate documentation
commenting on 8
FortiGuard Analysis and Management Service 7
Fortinet documentation 8
Fortinet Knowledge Center 8
I
introduction
Fortinet documentation 8
L
login profile, editing 56
logs
browsing 65
column view 62
downloading 66
filtering 63
viewing historical 62
viewing recent 60
M
Management
device 35
scripts 47
settings 52
FortiGuard Analysis and Management Service Version 1.2.0 Administration Guide
13-12000-406-20081031 75
Page 74

Index
topology tool 49
O
obtaining a trial contract 14
P
port numbers required for the service 23
portal web site URL 11
R
recent logs, viewing 60
remote logging 18
renewing contracts 20
reports
deleting reports 69
viewing generated reports 68
required port numbers 23
restoring configuation revisions 43
running scripts 44
S
script
creating scripts 47
deploy 44
scripts
run scripts from portal web site 44
viewing 48
viewing available configuration 48
searching configuration revisions 41
service
verifying connectivity 17
service account id
changing 57
service account information 53
settings
alert profile 57
service account information 57
T
time, daylight savings 18
topology tool
creating network diagram 52
viewing network diagram 52
trial contract 14
U
user accounts
adding 55
removing 55
using the service
configuring a device 16
configuring remote logging, central management
17
V
verifying connectivity 17
vewing
service account information 53
viewing
configuration revisions 40
configuration scripts 48
device information 35
e-Discovery tasks 70
firmware images on portal web site 44
generated reports 68
historical logs 62
recent logs 60
scripts 48
W
widgets
network monitor 29
reports 31
resource monitor 28
trap console 30
FortiGuard Analysis and Management Service Version 1.2.0 Administration Guide
76 13-12000-406-20081031
Page 75

www.fortinet.com
Page 76

www.fortinet.com
 Loading...