

Page 1
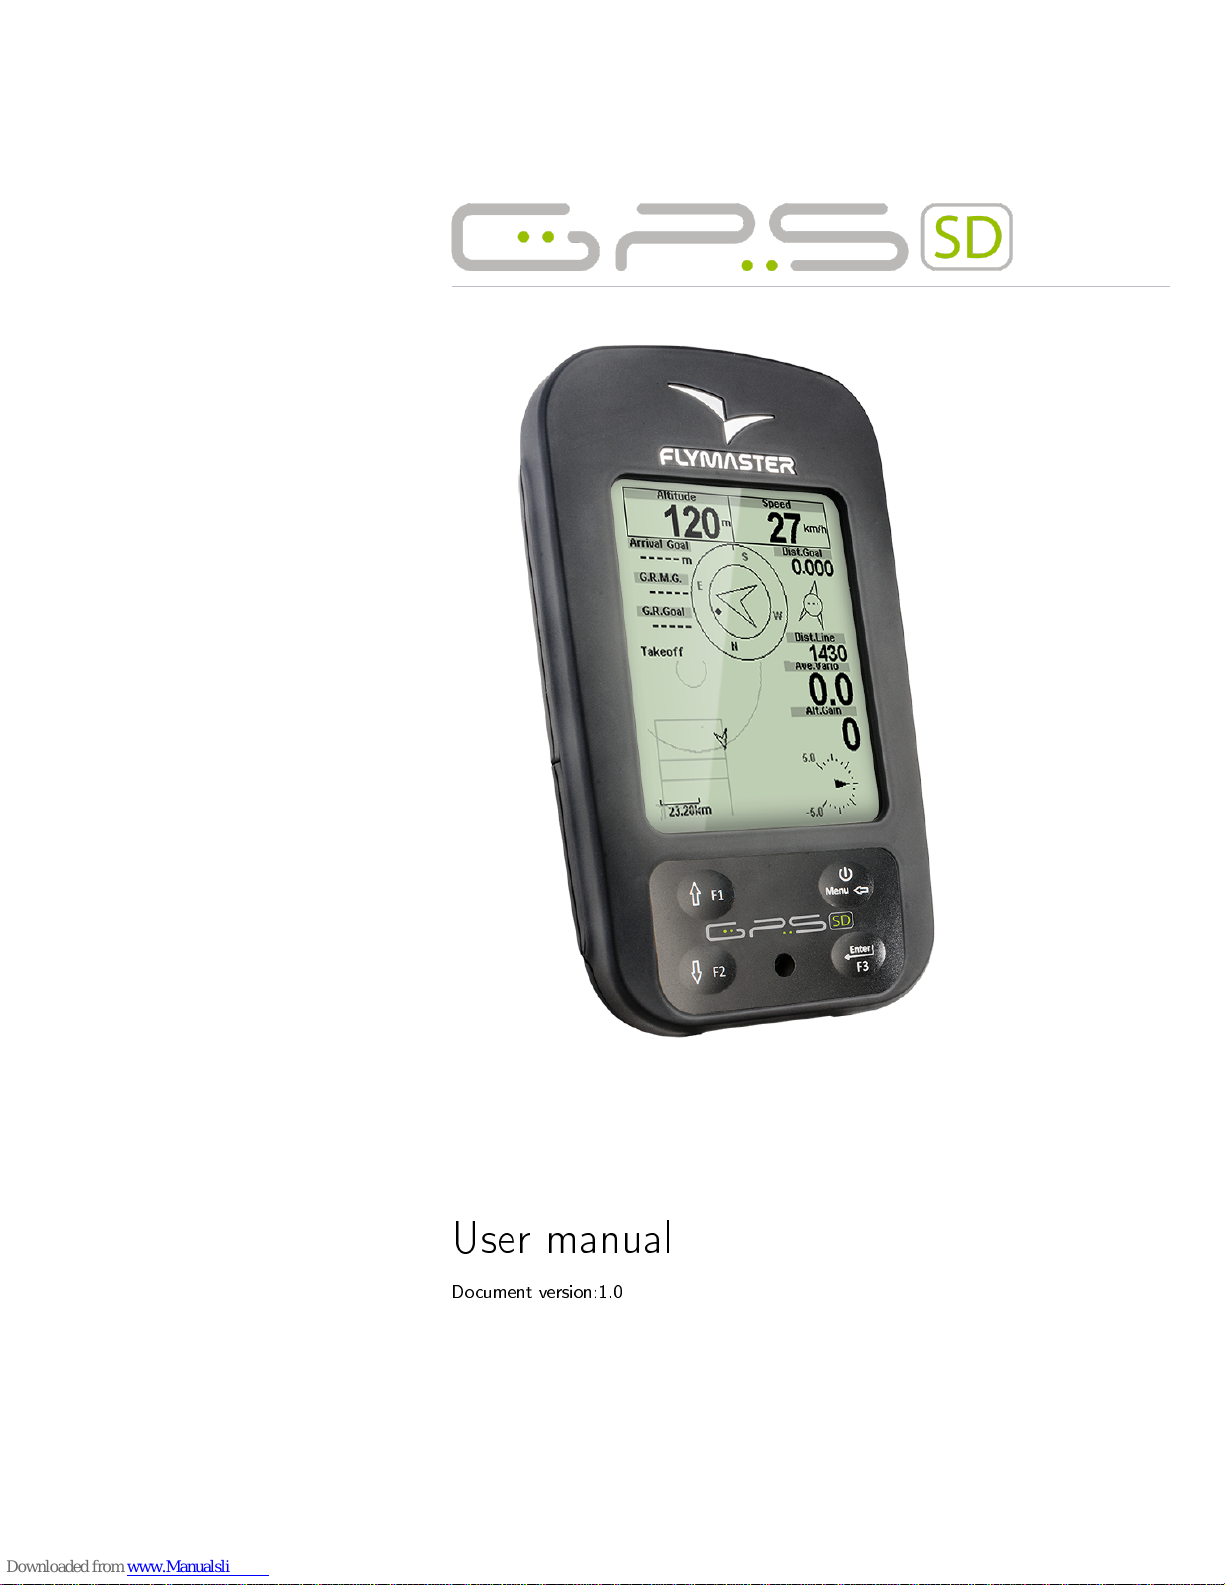
User manual
Document version:1.0
Page 2
All rights reserved. Except as expressly provided herein, no part of this manual may be
reproduced, copied, transmitted, disseminated, downloaded or stored in any storage medium,
for any purpose without the express prior written consent of Flymaster Avionics Lda. herein
Flymaster Avionics.
Flymaster Avionics hereby grants permission to download a copy of this manual onto a hard
drive or other electronic storage medium to be viewed and to print a copy of this manual or of
any revision hereto, provided that such electronic or printed copy of this manual must contain the
complete text of this copyright notice and provided further that any unauthorised commercial
distribution of this manual or any revision hereto is strictly prohibited.
Information in this document is subject to change without notice. Flymaster Avionics re-
serves the right to change or improve its products and to make changes in the content without
obligation to notify any person or organisation of such changes or improvements. Visit the
Flymaster Avionics website (www.ymaster-avionics.com) for current updates and supplemental
information concerning the use and operation of this and other Flymaster Avionics products.
Warning
It is the sole responsibility of the pilot to operate the aircraft in a safe manner,
maintain full surveillance of all ying conditions at all times, and not become distracted by
the Flymaster GPS SD . Flymaster Avionics is not responsible for any damages resulting from
incorrect or no data provided by the Flymaster GPS SD . Flight safety is the sole responsibility
of the pilot.
It is unsafe to operate the Flymaster GPS SD while in the air. Failure by the pilot equipped
with a Flymaster GPS SD to pay full attention to the aircraft and ying conditions while ying
could result in accident with property damage and/or personal injury.
Page 3
Contents
Page
1 Getting Started 4
1.1 Charging the Battery . . . . . . . . . . . . . . . . . . . . . . . . . . . . . . . . . . 4
1.2 GPS SD Keys . . . . . . . . . . . . . . . . . . . . . . . . . . . . . . . . . . . . . . 4
1.3 Using keys Inside Menu . . . . . . . . . . . . . . . . . . . . . . . . . . . . . . . . 5
1.4 Switching GPS SD On and O . . . . . . . . . . . . . . . . . . . . . . . . . . . . 5
1.5 Resetting the GPS SD . . . . . . . . . . . . . . . . . . . . . . . . . . . . . . . . . 6
1.6 Setting the Volume . . . . . . . . . . . . . . . . . . . . . . . . . . . . . . . . . . . 6
1.7 Flight Start and Recording . . . . . . . . . . . . . . . . . . . . . . . . . . . . . . 6
2 Flight Mode 7
3 GPS SD Elements 8
3.1 Graphical Elements . . . . . . . . . . . . . . . . . . . . . . . . . . . . . . . . . . . 8
3.1.1 Battery . . . . . . . . . . . . . . . . . . . . . . . . . . . . . . . . . . . . . 8
3.1.2 Sound . . . . . . . . . . . . . . . . . . . . . . . . . . . . . . . . . . . . . . 8
3.1.3
GPS
. . . . . . . . . . . . . . . . . . . . . . . . . . . . . . . . . . . . . . . 9
3.1.4 Vario . . . . . . . . . . . . . . . . . . . . . . . . . . . . . . . . . . . . . . 9
3.1.5 Navigation Circle . . . . . . . . . . . . . . . . . . . . . . . . . . . . . . . . 11
3.1.6 Airspaces Map . . . . . . . . . . . . . . . . . . . . . . . . . . . . . . . . . 12
3.1.7 Altitude graph . . . . . . . . . . . . . . . . . . . . . . . . . . . . . . . . . 14
3.1.8 Wind Arrow . . . . . . . . . . . . . . . . . . . . . . . . . . . . . . . . . . 14
3.1.9 Map Page . . . . . . . . . . . . . . . . . . . . . . . . . . . . . . . . . . . . 15
3.2 Data eld Elements . . . . . . . . . . . . . . . . . . . . . . . . . . . . . . . . . . . 16
4 Menu mode 21
4.1 Waypoints and Route . . . . . . . . . . . . . . . . . . . . . . . . . . . . . . . . . 22
4.1.1 Waypoints Actions Menu . . . . . . . . . . . . . . . . . . . . . . . . . . . 23
4.1.2 RouteList . . . . . . . . . . . . . . . . . . . . . . . . . . . . . . . . . . . . 24
4.2 RouteNavigator . . . . . . . . . . . . . . . . . . . . . . . . . . . . . . . . . . . . . 25
4.3 Critical Airspaces . . . . . . . . . . . . . . . . . . . . . . . . . . . . . . . . . . . . 26
4.4 Nearby Landings . . . . . . . . . . . . . . . . . . . . . . . . . . . . . . . . . . . . 27
4.5 Flight Log . . . . . . . . . . . . . . . . . . . . . . . . . . . . . . . . . . . . . . . . 27
4.6 Pages . . . . . . . . . . . . . . . . . . . . . . . . . . . . . . . . . . . . . . . . . . 30
4.7 Settings Menu . . . . . . . . . . . . . . . . . . . . . . . . . . . . . . . . . . . . . . 31
4.7.1 Set Altimeter . . . . . . . . . . . . . . . . . . . . . . . . . . . . . . . . . . 32
4.7.2 Time . . . . . . . . . . . . . . . . . . . . . . . . . . . . . . . . . . . . . . . 33
4.7.3 Vario Acoustics . . . . . . . . . . . . . . . . . . . . . . . . . . . . . . . . . 33
4.7.4 Advanced Features . . . . . . . . . . . . . . . . . . . . . . . . . . . . . . . 34
2
Page 4
4.7.5 Trace . . . . . . . . . . . . . . . . . . . . . . . . . . . . . . . . . . . . . . 36
4.7.6 Screen . . . . . . . . . . . . . . . . . . . . . . . . . . . . . . . . . . . . . . 38
4.7.7 Language/Units . . . . . . . . . . . . . . . . . . . . . . . . . . . . . . . . 39
4.7.8 Device Settings . . . . . . . . . . . . . . . . . . . . . . . . . . . . . . . . . 40
4.7.9 RF Probes . . . . . . . . . . . . . . . . . . . . . . . . . . . . . . . . . . . 40
4.7.10 Probe Alerts . . . . . . . . . . . . . . . . . . . . . . . . . . . . . . . . . . 41
4.7.11 Polar . . . . . . . . . . . . . . . . . . . . . . . . . . . . . . . . . . . . . . . 42
4.7.12 FS Keys . . . . . . . . . . . . . . . . . . . . . . . . . . . . . . . . . . . . . 42
4.7.13 Airspace settings . . . . . . . . . . . . . . . . . . . . . . . . . . . . . . . . 43
4.7.14 GPS status . . . . . . . . . . . . . . . . . . . . . . . . . . . . . . . . . . . 44
5 RouteDenition 46
5.1 Route Denition . . . . . . . . . . . . . . . . . . . . . . . . . . . . . . . . . . . . 46
5.2 Setting up the route . . . . . . . . . . . . . . . . . . . . . . . . . . . . . . . . . . 46
6 McCready Functions 47
7 Firmware 48
8 Interfacing with GPSDump 50
8.1 Conguring GPSDump . . . . . . . . . . . . . . . . . . . . . . . . . . . . . . . . . 50
8.2 Uploading Waypoints . . . . . . . . . . . . . . . . . . . . . . . . . . . . . . . . . . 51
8.3 Downloading tracklogs . . . . . . . . . . . . . . . . . . . . . . . . . . . . . . . . . 53
3
Page 5
1 Getting Started
Fully charge battery before using your Flymaster for the rst time.
Figure 1.1: right view
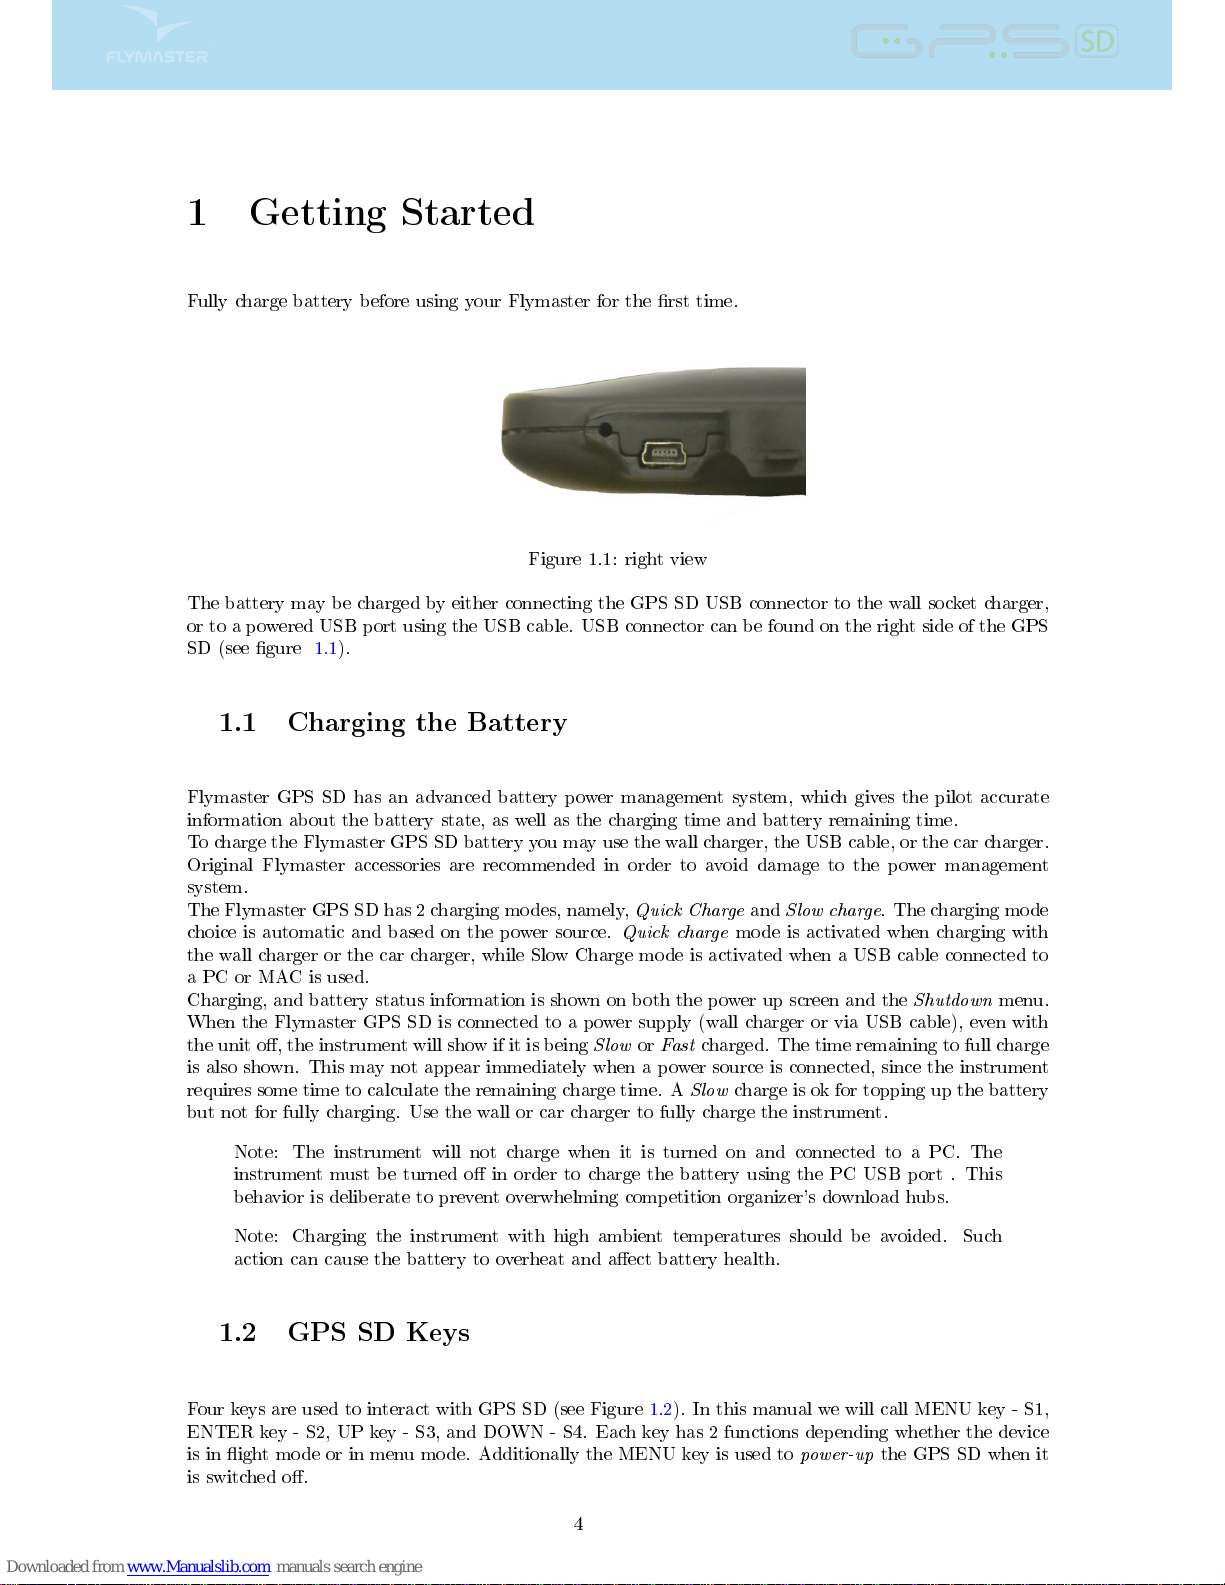
The battery may be charged by either connecting the GPS SD USB connector to the wall socket charger,
or to a powered USB port using the USB cable. USB connector can be found on the right side of the GPS
SD (see gure 1.1).
1.1 Charging the Battery
Flymaster GPS SD has an advanced battery power management system, which gives the pilot accurate
information about the battery state, as well as the charging time and battery remaining time.
To charge the Flymaster GPS SD battery you may use the wall charger, the USB cable, or the car charger.
Original Flymaster accessories are recommended in order to avoid damage to the power management
system.
The Flymaster GPS SD has 2 charging modes, namely,
Quick Charge
and
Slow charge
. The charging mode
choice is automatic and based on the power source.
Quick charge
mode is activated when charging with
the wall charger or the car charger, while Slow Charge mode is activated when a USB cable connected to
a PC or MAC is used.
Charging, and battery status information is shown on both the power up screen and the
Shutdown
menu.
When the Flymaster GPS SD is connected to a power supply (wall charger or via USB cable), even with
the unit o, the instrument will show if it is being
SloworFast
charged. The time remaining to full charge
is also shown. This may not appear immediately when a power source is connected, since the instrument
requires some time to calculate the remaining charge time. A
Slow
charge is ok for topping up the battery
but not for fully charging. Use the wall or car charger to fully charge the instrument.
Note: The instrument will not charge when it is turned on and connected to a PC. The
instrument must be turned o in order to charge the battery using the PC USB port . This
behavior is deliberate to prevent overwhelming competition organizer's download hubs.
Note: Charging the instrument with high ambient temperatures should be avoided. Such
action can cause the battery to overheat and aect battery health.
1.2 GPS SD Keys
Four keys are used to interact with GPS SD (see Figure 1.2). In this manual we will call MENU key - S1,
ENTER key - S2, UP key - S3, and DOWN - S4. Each key has 2 functions depending whether the device
is in ight mode or in menu mode. Additionally the MENU key is used to
power-up
the GPS SD when it
is switched o.
4
Page 6
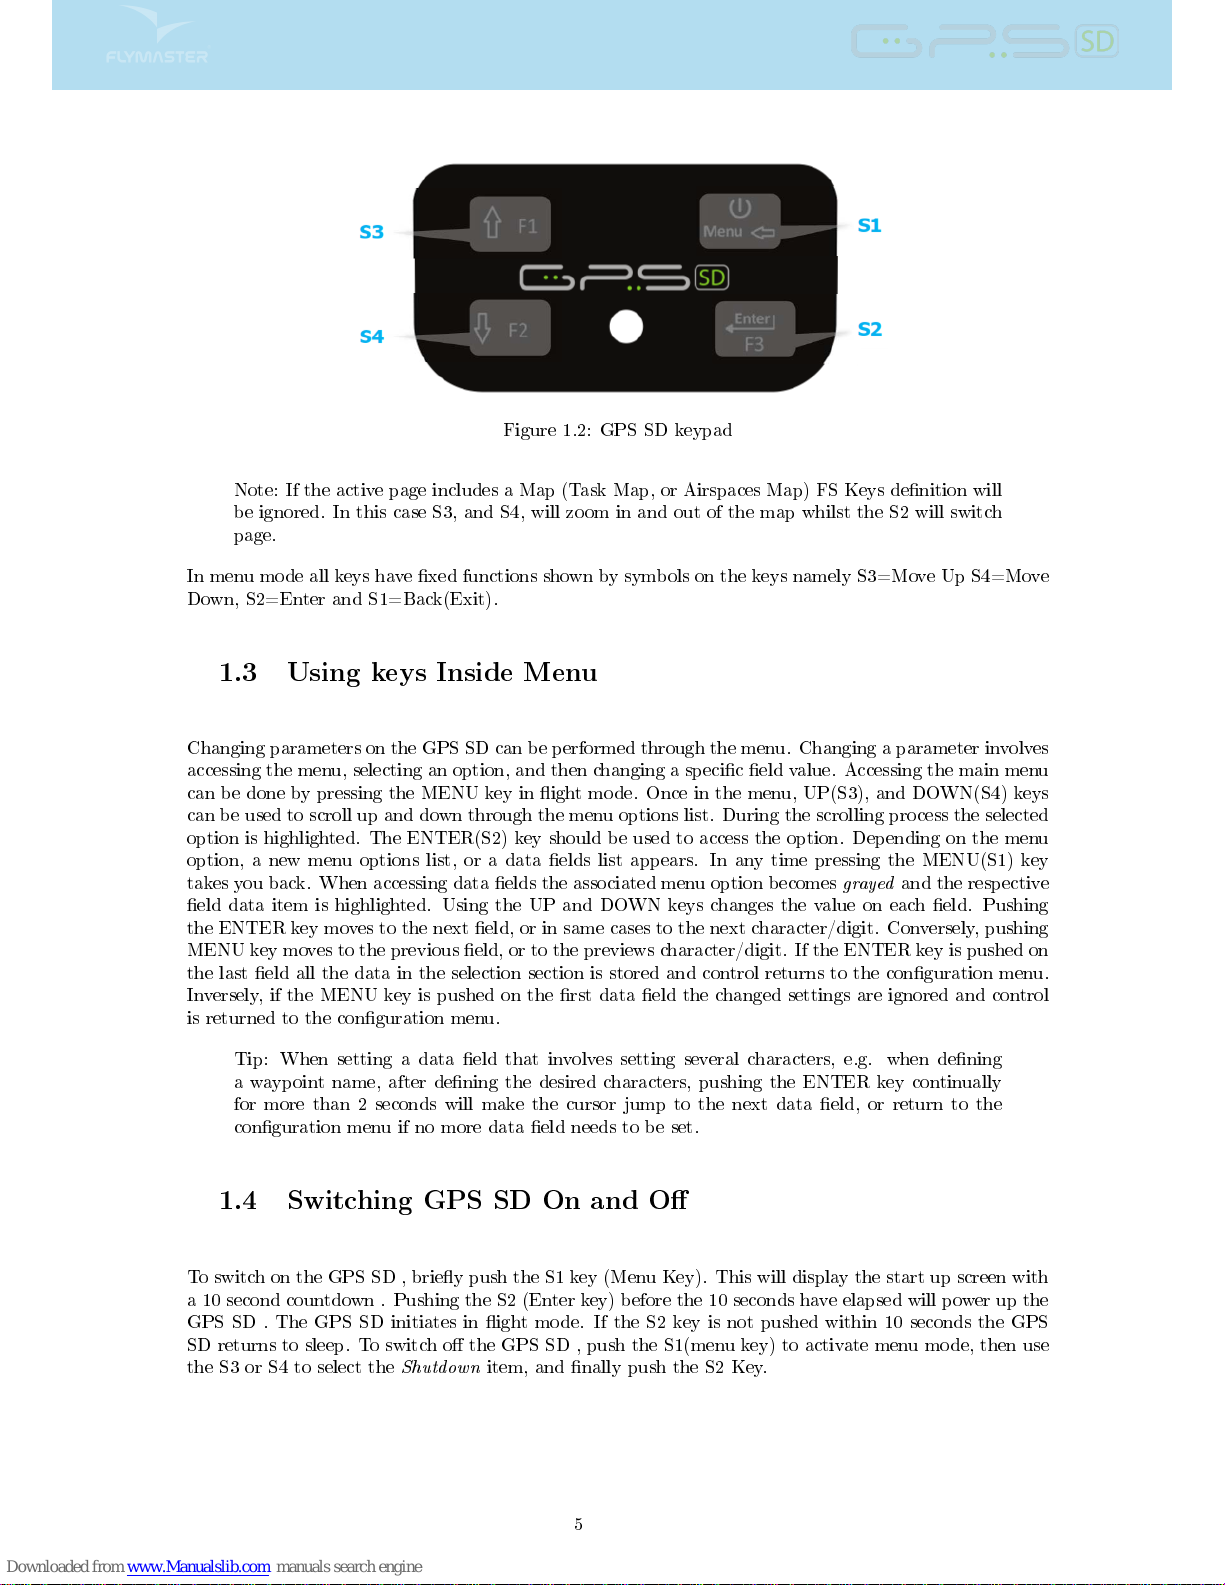
Figure 1.2: GPS SD keypad
Note: If the active page includes a Map (Task Map, or Airspaces Map) FS Keys denition will
be ignored. In this case S3, and S4, will zoom in and out of the map whilst the S2 will switch
page.
In menu mode all keys have xed functions shown by symbols on the keys namely S3=Move Up S4=Move
Down, S2=Enter and S1=Back(Exit).
1.3 Using keys Inside Menu
Changing parameters on the GPS SD can be performed through the menu. Changing a parameter involves
accessing the menu, selecting an option, and then changing a specic eld value. Accessing the main menu
can be done by pressing the MENU key in ight mode. Once in the menu, UP(S3), and DOWN(S4) keys
can be used to scroll up and down through the menu options list. During the scrolling process the selected
option is highlighted. The ENTER(S2) key should be used to access the option. Depending on the menu
option, a new menu options list, or a data elds list appears. In any time pressing the MENU(S1) key
takes you back. When accessing data elds the associated menu option becomes
grayed
and the respective
eld data item is highlighted. Using the UP and DOWN keys changes the value on each eld. Pushing
the ENTER key moves to the next eld, or in same cases to the next character/digit. Conversely, pushing
MENU key moves to the previous eld, or to the previews character/digit. If the ENTER key is pushed on
the last eld all the data in the selection section is stored and control returns to the conguration menu.
Inversely, if the MENU key is pushed on the rst data eld the changed settings are ignored and control
is returned to the conguration menu.
Tip: When setting a data eld that involves setting several characters, e.g. when dening
a waypoint name, after dening the desired characters, pushing the ENTER key continually
for more than 2 seconds will make the cursor jump to the next data eld, or return to the
conguration menu if no more data eld needs to be set.
1.4 Switching GPS SD On and O
To switch on the GPS SD , briey push the S1 key (Menu Key). This will display the start up screen with
a 10 second countdown . Pushing the S2 (Enter key) before the 10 seconds have elapsed will power up the
GPS SD . The GPS SD initiates in ight mode. If the S2 key is not pushed within 10 seconds the GPS
SD returns to sleep. To switch o the GPS SD , push the S1(menu key) to activate menu mode, then use
the S3 or S4 to select the
Shutdown
item, and nally push the S2 Key.
5
Page 7
1.5 Resetting the GPS SD
The reset procedure allows the pilot to restart the GPS SD in the unlikely event that it freezes, or stops
responding (if this ever occur please report it to our support email). To reset the GPS SD push S1 (Menu)
key and the S4 (Down arrow) key, simultaneously, for at least two seconds. The display will go blank and
after will return in Flight mode.
Note: Resetting the GPS SD will also reset ight data, e.g. task status.
1.6 Setting the Volume
The GPS SD sound volume can be adjust using one FS Key, or trough the
Vario Accoustics
option of the
Settings
Menu (see Section 4.7.3). The GPS SD has six dierent sound levels, plus
no sound
. The current
volume level can be seen using the sound element (see Section 3.1.2 for more details).
Pressing the dened FS Key will scroll up the sound level until the maximum value. Pressing more will
mute the sound before start scrolling again starting from the minimum value.
Note: Changing the volume using an FS key is only valid for the current ight, and will not
override the volume level setting. Every time the instrument is turned on, if the sound is
muted, an alarm is generated in order to notify the pilot.
Note: When the instrument is turned on the sound can be muted despite the volume level
settings. This occurs due to the
Auto silent
mode is activated (see Section 4.7.4 for more
details)
1.7 Flight Start and Recording
Most of the GPS SD features are only available after the
Flight Start
. This procedure is taken in order to
avoid wrong calculations due to missing data. Flight starts when all of there 3 conditions are met:
1. GPS 3d x is established;
2. Speed goes over the congured
Start Speed
(default value is 8km/h)
3. Average vario is greater than +-0.15m/s
6
Page 8
2 Flight Mode
The Flymaster GPS SD has two main working modes, namely Flight mode, and Menu mode. Flight mode
is used during ight, and this allows the user to see information such as Altitude, Speed, or Vario. The
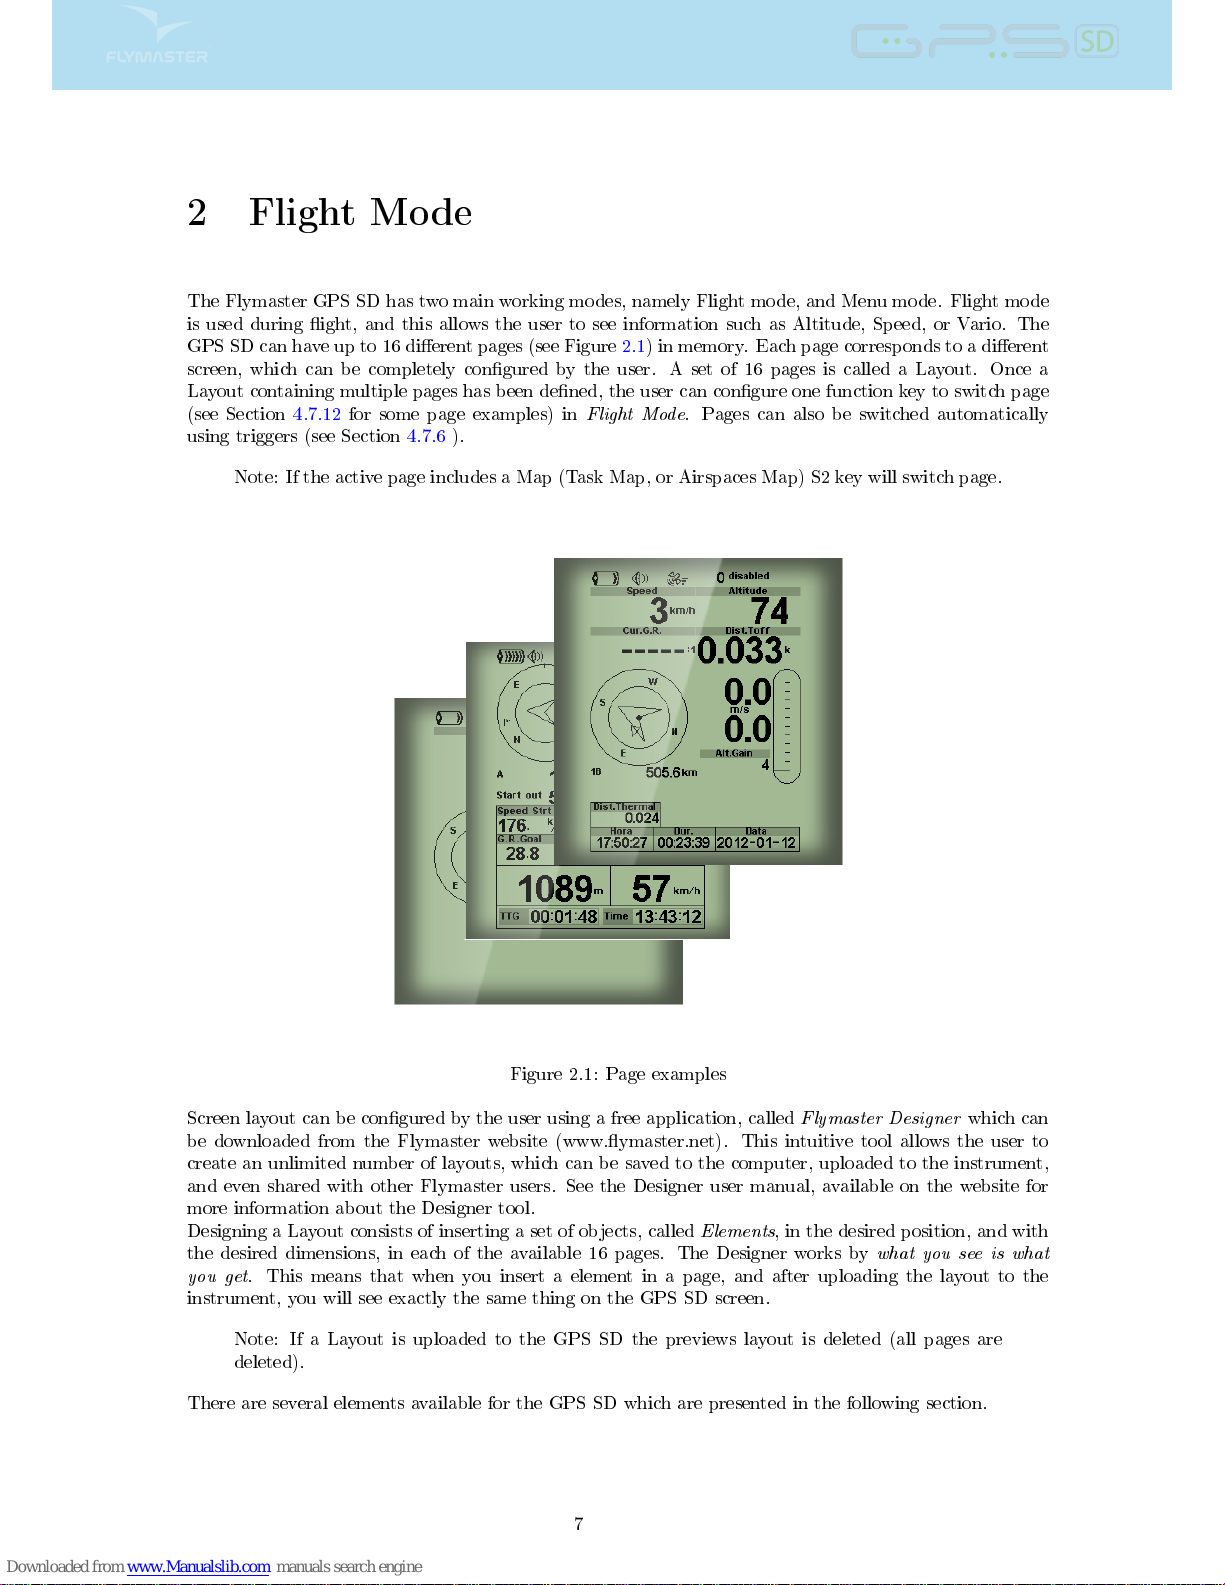
GPS SD can have up to 16 dierent pages (see Figure 2.1) in memory. Each page corresponds to a dierent
screen, which can be completely congured by the user. A set of 16 pages is called a Layout. Once a
Layout containing multiple pages has been dened, the user can congure one function key to switch page
(see Section 4.7.12 for some page examples) in
Flight Mode
. Pages can also be switched automatically
using triggers (see Section 4.7.6 ).
Note: If the active page includes a Map (Task Map, or Airspaces Map) S2 key will switch page.
Figure 2.1: Page examples
Screen layout can be congured by the user using a free application, called
Flymaster Designer
which can
be downloaded from the Flymaster website (www.ymaster.net). This intuitive tool allows the user to
create an unlimited number of layouts, which can be saved to the computer, uploaded to the instrument,
and even shared with other Flymaster users. See the Designer user manual, available on the website for
more information about the Designer tool.
Designing a Layout consists of inserting a set of objects, called
Elements
, in the desired position, and with
the desired dimensions, in each of the available 16 pages. The Designer works by
what you see is what
you get
. This means that when you insert a element in a page, and after uploading the layout to the
instrument, you will see exactly the same thing on the GPS SD screen.
Note: If a Layout is uploaded to the GPS SD the previews layout is deleted (all pages are
deleted).
There are several elements available for the GPS SD which are presented in the following section.
7
Page 9
3 GPS SD Elements
The main objective of an element is to provide information to the user. Elements can be Graphical, or
Data Field type. Each element has its own properties which can be changed in order to alter the element
behaviour, and/or shape.
3.1 Graphical Elements
Graphical elements are characterized by providing information in a graphical way. Most of the graphical
elements have xed dimensions, although their position can be altered.
As the GPS SD rmware evolves the list of Graphical Elements will likely grow. The current list includes
the following graphical elements.
3.1.1 Battery
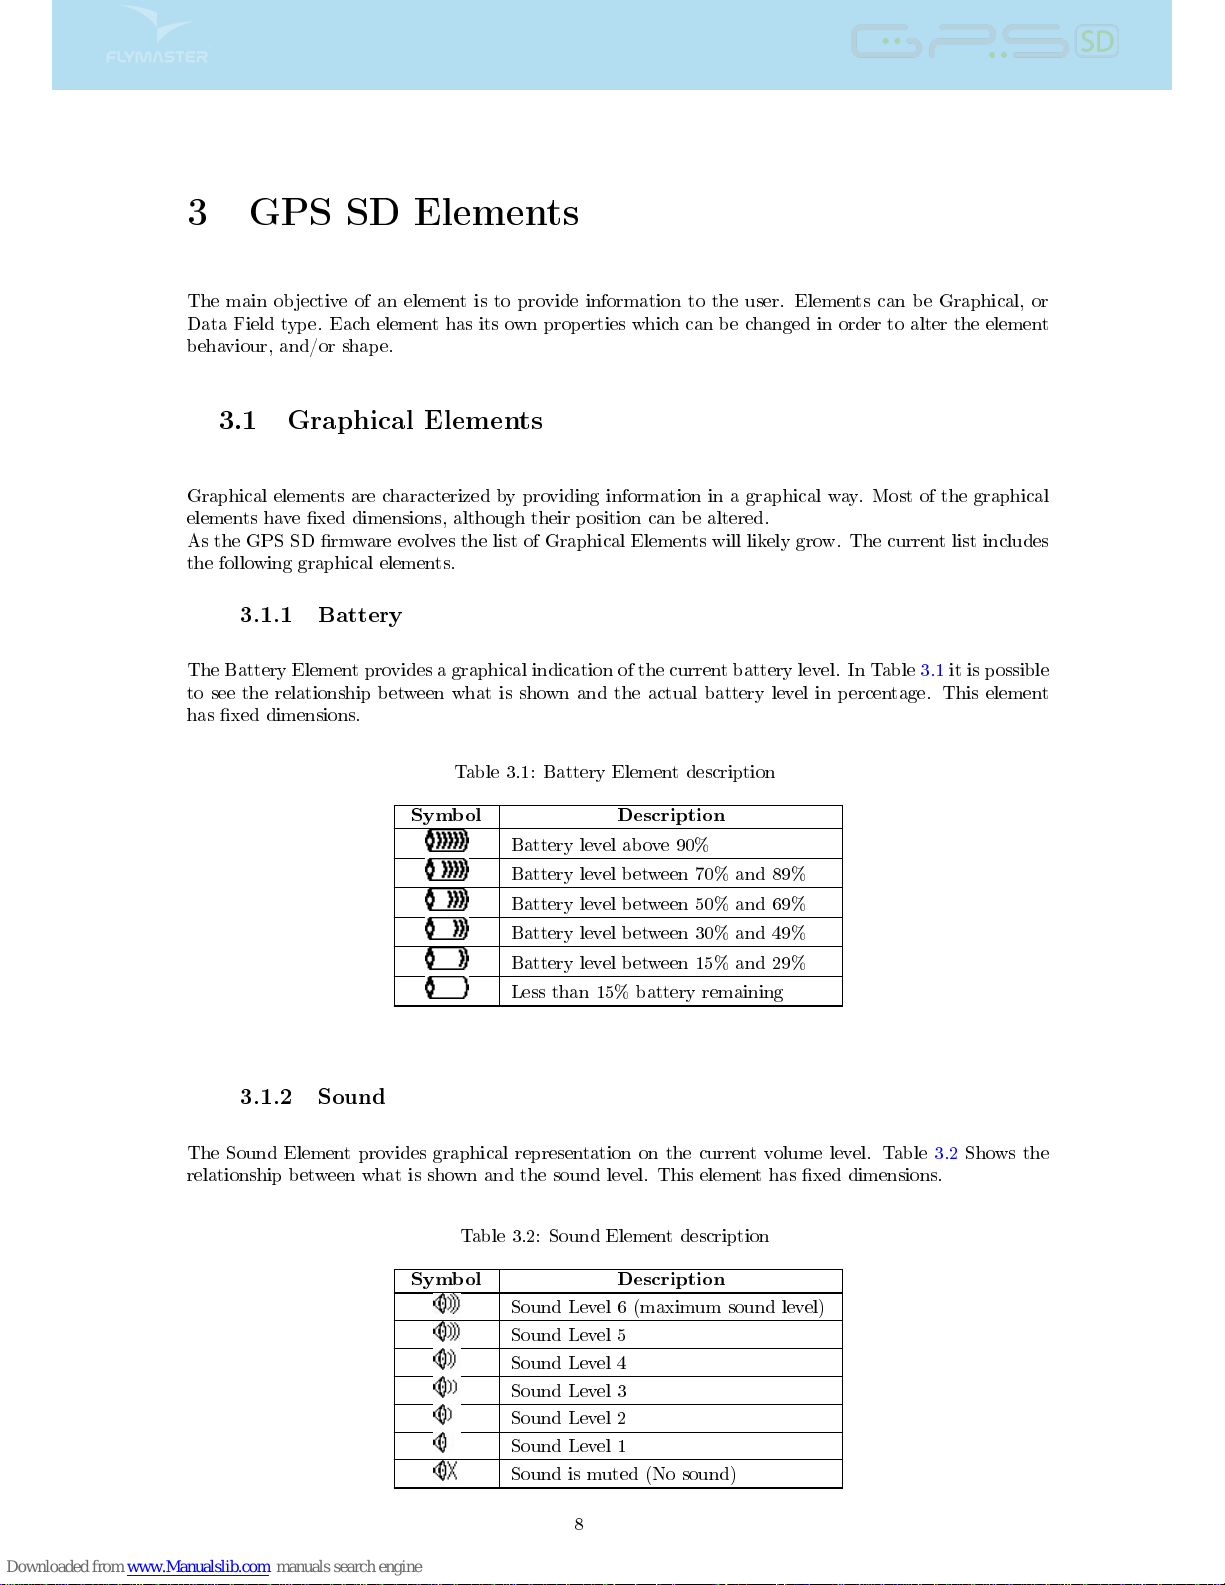
The Battery Element provides a graphical indication of the current battery level. In Table 3.1 it is possible
to see the relationship between what is shown and the actual battery level in percentage. This element
has xed dimensions.
Table 3.1: Battery Element description
Symbol Description
Battery level above 90%
Battery level between 70% and 89%
Battery level between 50% and 69%
Battery level between 30% and 49%
Battery level between 15% and 29%
Less than 15% battery remaining
3.1.2 Sound
The Sound Element provides graphical representation on the current volume level. Table 3.2 Shows the
relationship between what is shown and the sound level. This element has xed dimensions.
Table 3.2: Sound Element description
Symbol Description
Sound Level 6 (maximum sound level)
Sound Level 5
Sound Level 4
Sound Level 3
Sound Level 2
Sound Level 1
Sound is muted (No sound)
8
Page 10
3.1.3
GPS
The
GPS
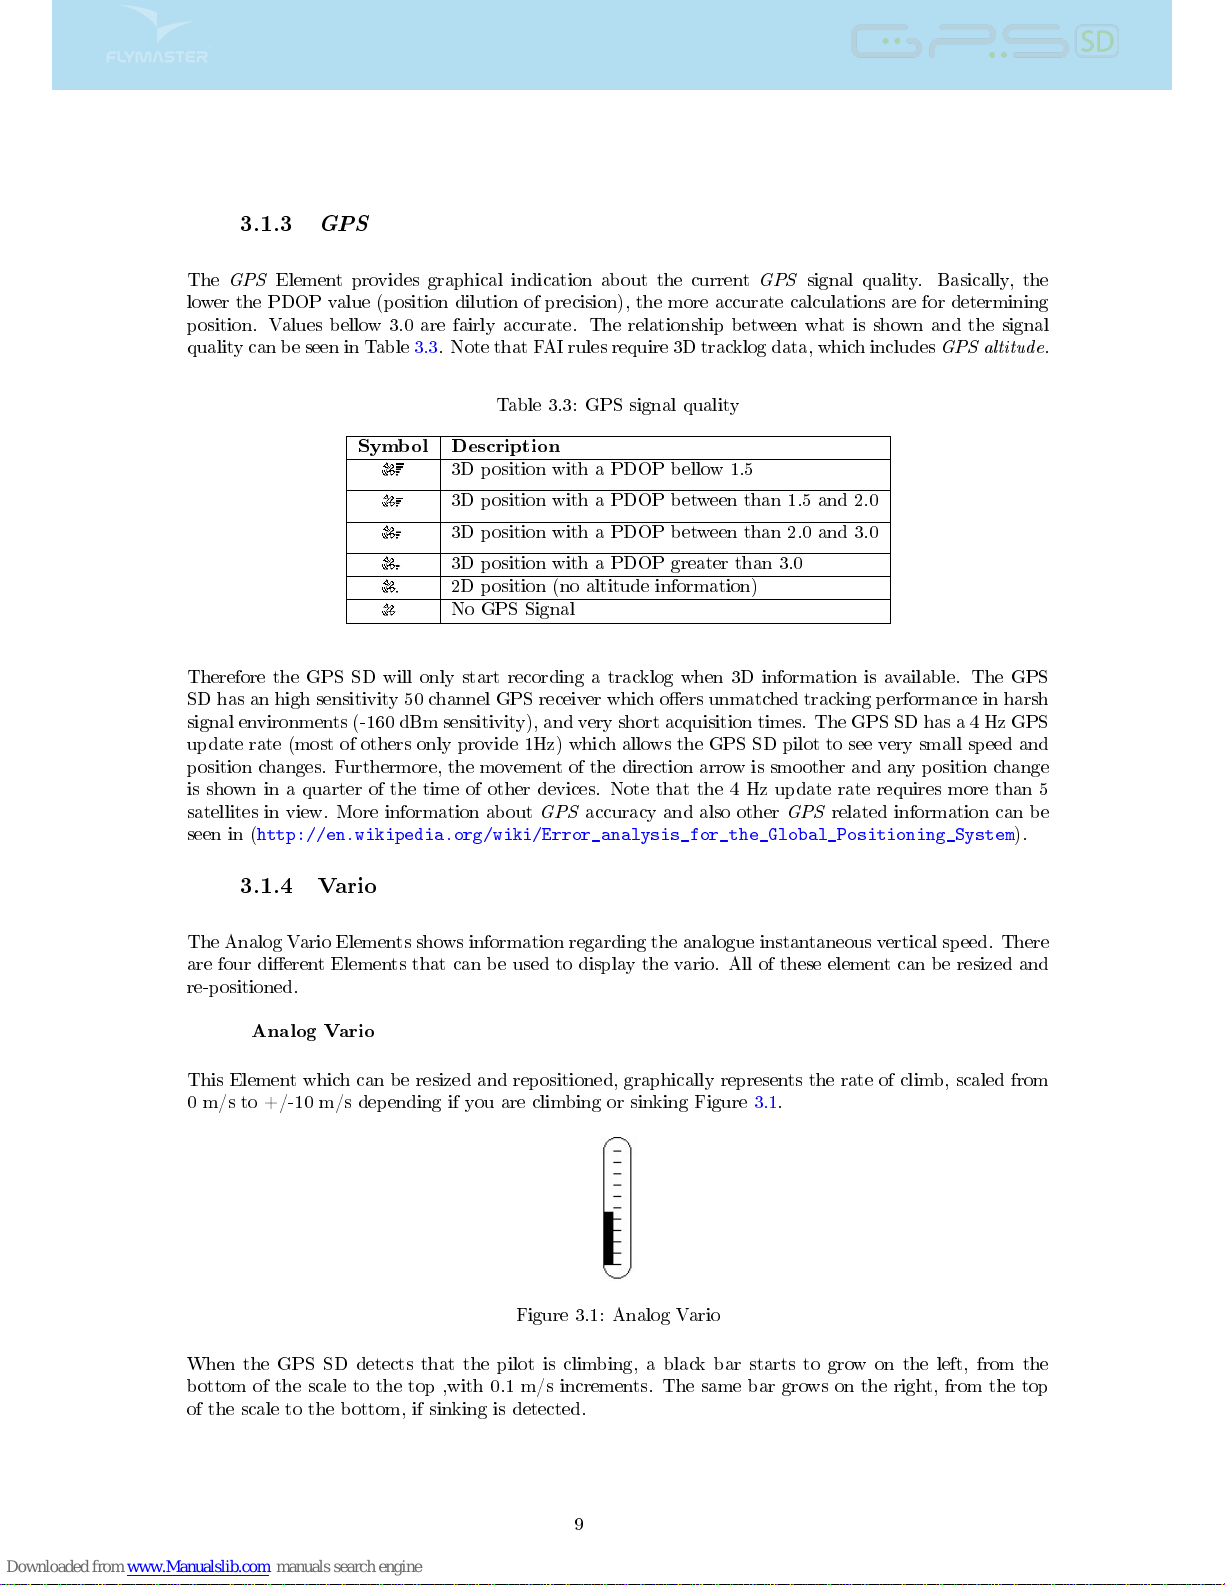
Element provides graphical indication about the current
GPS
signal quality. Basically, the
lower the PDOP value (position dilution of precision), the more accurate calculations are for determining
position. Values bellow 3.0 are fairly accurate. The relationship between what is shown and the signal
quality can be seen in Table 3.3. Note that FAI rules require 3D tracklog data, which includes
GPS altitude
.
Table 3.3: GPS signal quality
Symbol Description
3D position with a PDOP bellow 1.5
3D position with a PDOP between than 1.5 and 2.0
3D position with a PDOP between than 2.0 and 3.0
3D position with a PDOP greater than 3.0
2D position (no altitude information)
No GPS Signal
Therefore the GPS SD will only start recording a tracklog when 3D information is available. The GPS
SD has an high sensitivity 50 channel GPS receiver which oers unmatched tracking performance in harsh
signal environments (-160 dBm sensitivity), and very short acquisition times. The GPS SD has a 4 Hz GPS
update rate (most of others only provide 1Hz) which allows the GPS SD pilot to see very small speed and
position changes. Furthermore, the movement of the direction arrow is smoother and any position change
is shown in a quarter of the time of other devices. Note that the 4 Hz update rate requires more than 5
satellites in view. More information about
GPS
accuracy and also other
GPS
related information can be
seen in (
http://en.wikipedia.org/wiki/Error_analysis_for_the_Global_Positioning_System
).
3.1.4 Vario
The Analog Vario Elements shows information regarding the analogue instantaneous vertical speed. There
are four dierent Elements that can be used to display the vario. All of these element can be resized and
re-positioned.
Analog Vario
This Element which can be resized and repositioned, graphically represents the rate of climb, scaled from
0 m/s to +/-10 m/s depending if you are climbing or sinking Figure 3.1.
Figure 3.1: Analog Vario
When the GPS SD detects that the pilot is climbing, a black bar starts to grow on the left, from the
bottom of the scale to the top ,with 0.1 m/s increments. The same bar grows on the right, from the top
of the scale to the bottom, if sinking is detected.
9
Page 11
Big Analog Vario
The
Big Analog Vario
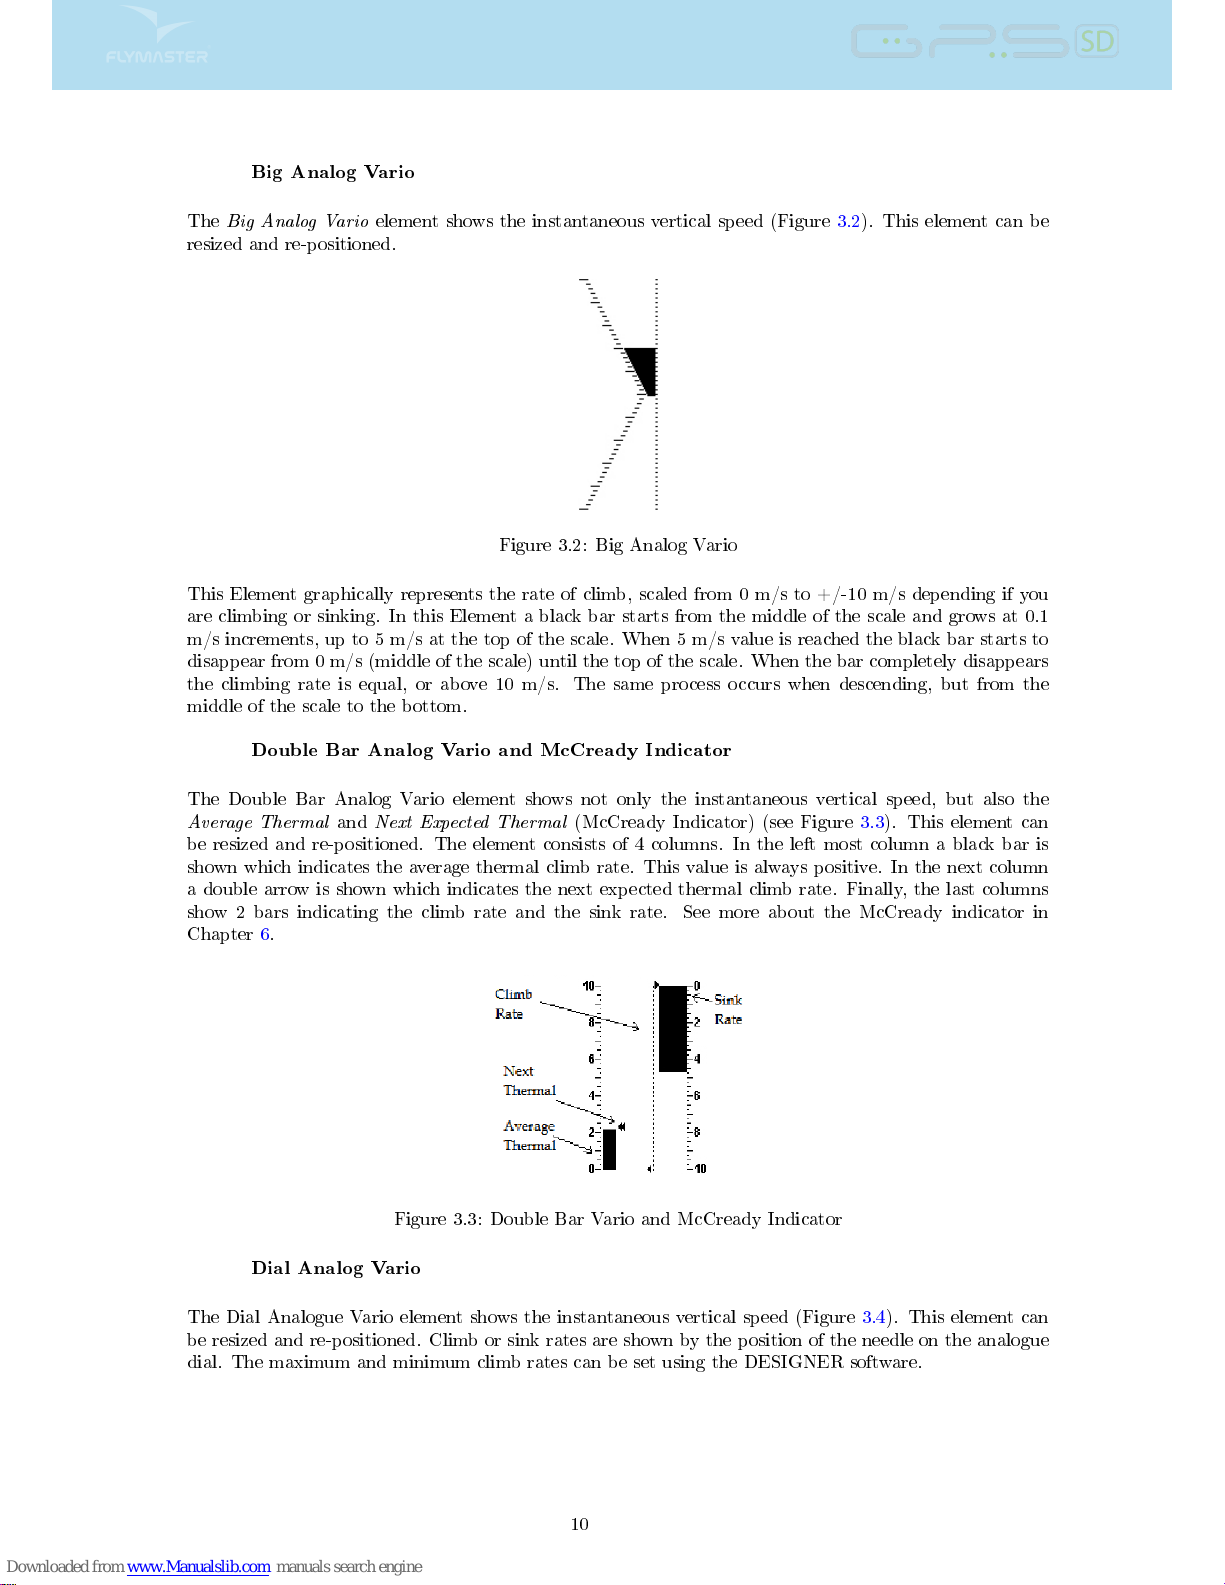
element shows the instantaneous vertical speed (Figure 3.2). This element can be
resized and re-positioned.
Figure 3.2: Big Analog Vario
This Element graphically represents the rate of climb, scaled from 0 m/s to +/-10 m/s depending if you
are climbing or sinking. In this Element a black bar starts from the middle of the scale and grows at 0.1
m/s increments, up to 5 m/s at the top of the scale. When 5 m/s value is reached the black bar starts to
disappear from 0 m/s (middle of the scale) until the top of the scale. When the bar completely disappears
the climbing rate is equal, or above 10 m/s. The same process occurs when descending, but from the
middle of the scale to the bottom.
Double Bar Analog Vario and McCready Indicator
The Double Bar Analog Vario element shows not only the instantaneous vertical speed, but also the
Average Thermal
and
Next Expected Thermal
(McCready Indicator) (see Figure 3.3). This element can
be resized and re-positioned. The element consists of 4 columns. In the left most column a black bar is
shown which indicates the average thermal climb rate. This value is always positive. In the next column
a double arrow is shown which indicates the next expected thermal climb rate. Finally, the last columns
show 2 bars indicating the climb rate and the sink rate. See more about the McCready indicator in
Chapter 6.
Figure 3.3: Double Bar Vario and McCready Indicator
Dial Analog Vario
The Dial Analogue Vario element shows the instantaneous vertical speed (Figure 3.4). This element can
be resized and re-positioned. Climb or sink rates are shown by the position of the needle on the analogue
dial. The maximum and minimum climb rates can be set using the DESIGNER software.
10
Page 12
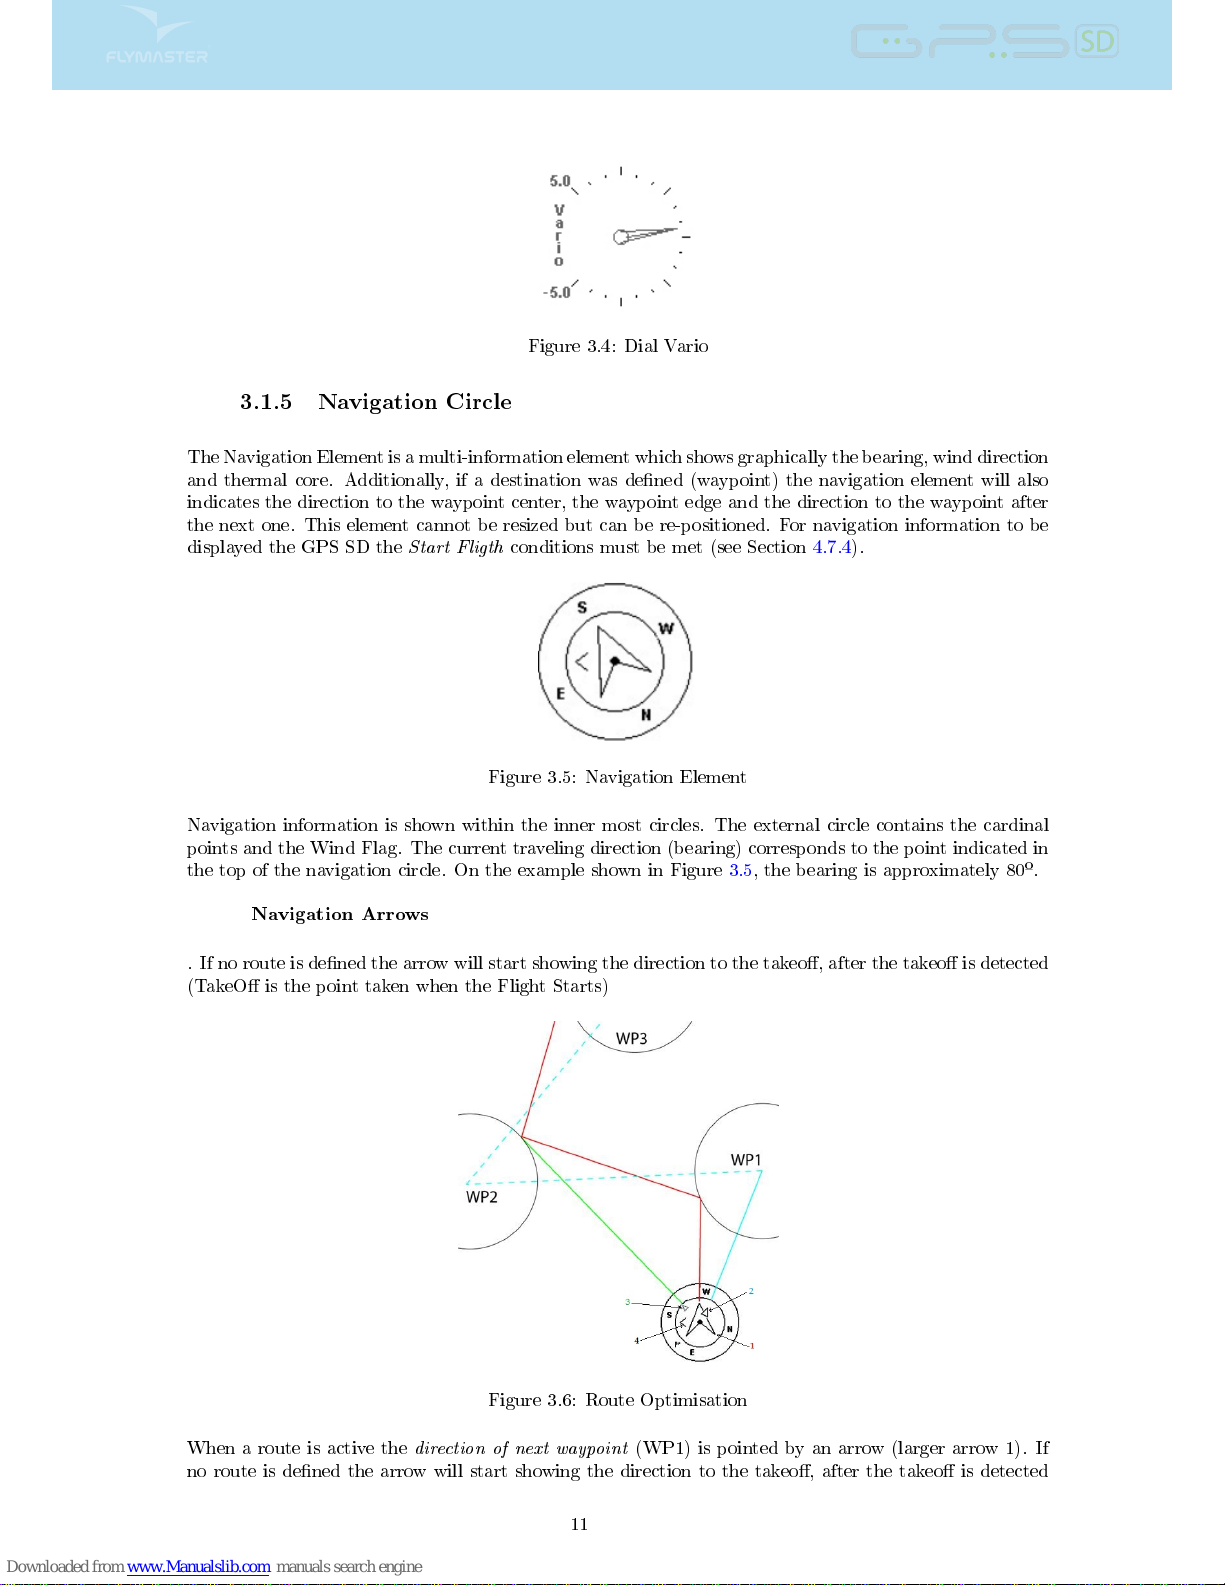
Figure 3.4: Dial Vario
3.1.5 Navigation Circle
The Navigation Element is a multi-information element which shows graphically the bearing, wind direction
and thermal core. Additionally, if a destination was dened (waypoint) the navigation element will also
indicates the direction to the waypoint center, the waypoint edge and the direction to the waypoint after
the next one. This element cannot be resized but can be re-positioned. For navigation information to be
displayed the GPS SD the
Start Fligth
conditions must be met (see Section 4.7.4).
Figure 3.5: Navigation Element
Navigation information is shown within the inner most circles. The external circle contains the cardinal
points and the Wind Flag. The current traveling direction (bearing) corresponds to the point indicated in
the top of the navigation circle. On the example shown in Figure 3.5, the bearing is approximately 80º.
Navigation Arrows
. If no route is dened the arrow will start showing the direction to the takeo, after the takeo is detected
(TakeO is the point taken when the Flight Starts)
Figure 3.6: Route Optimisation
When a route is active the
direction of next waypoint
(WP1) is pointed by an arrow (larger arrow 1). If
no route is dened the arrow will start showing the direction to the takeo, after the takeo is detected
11
Page 13
(TakeO is the point taken when the Flight Starts). Small course corrections are sometimes required and
these are shown on the GPS SD by a
ne adjustment indicator
in the form of a small arrow 4. Arrow 4
to the left means the pilot should turn slightly to the left, and inversely arrow 4 to the right indicates a
small adjustment to the right is needed.
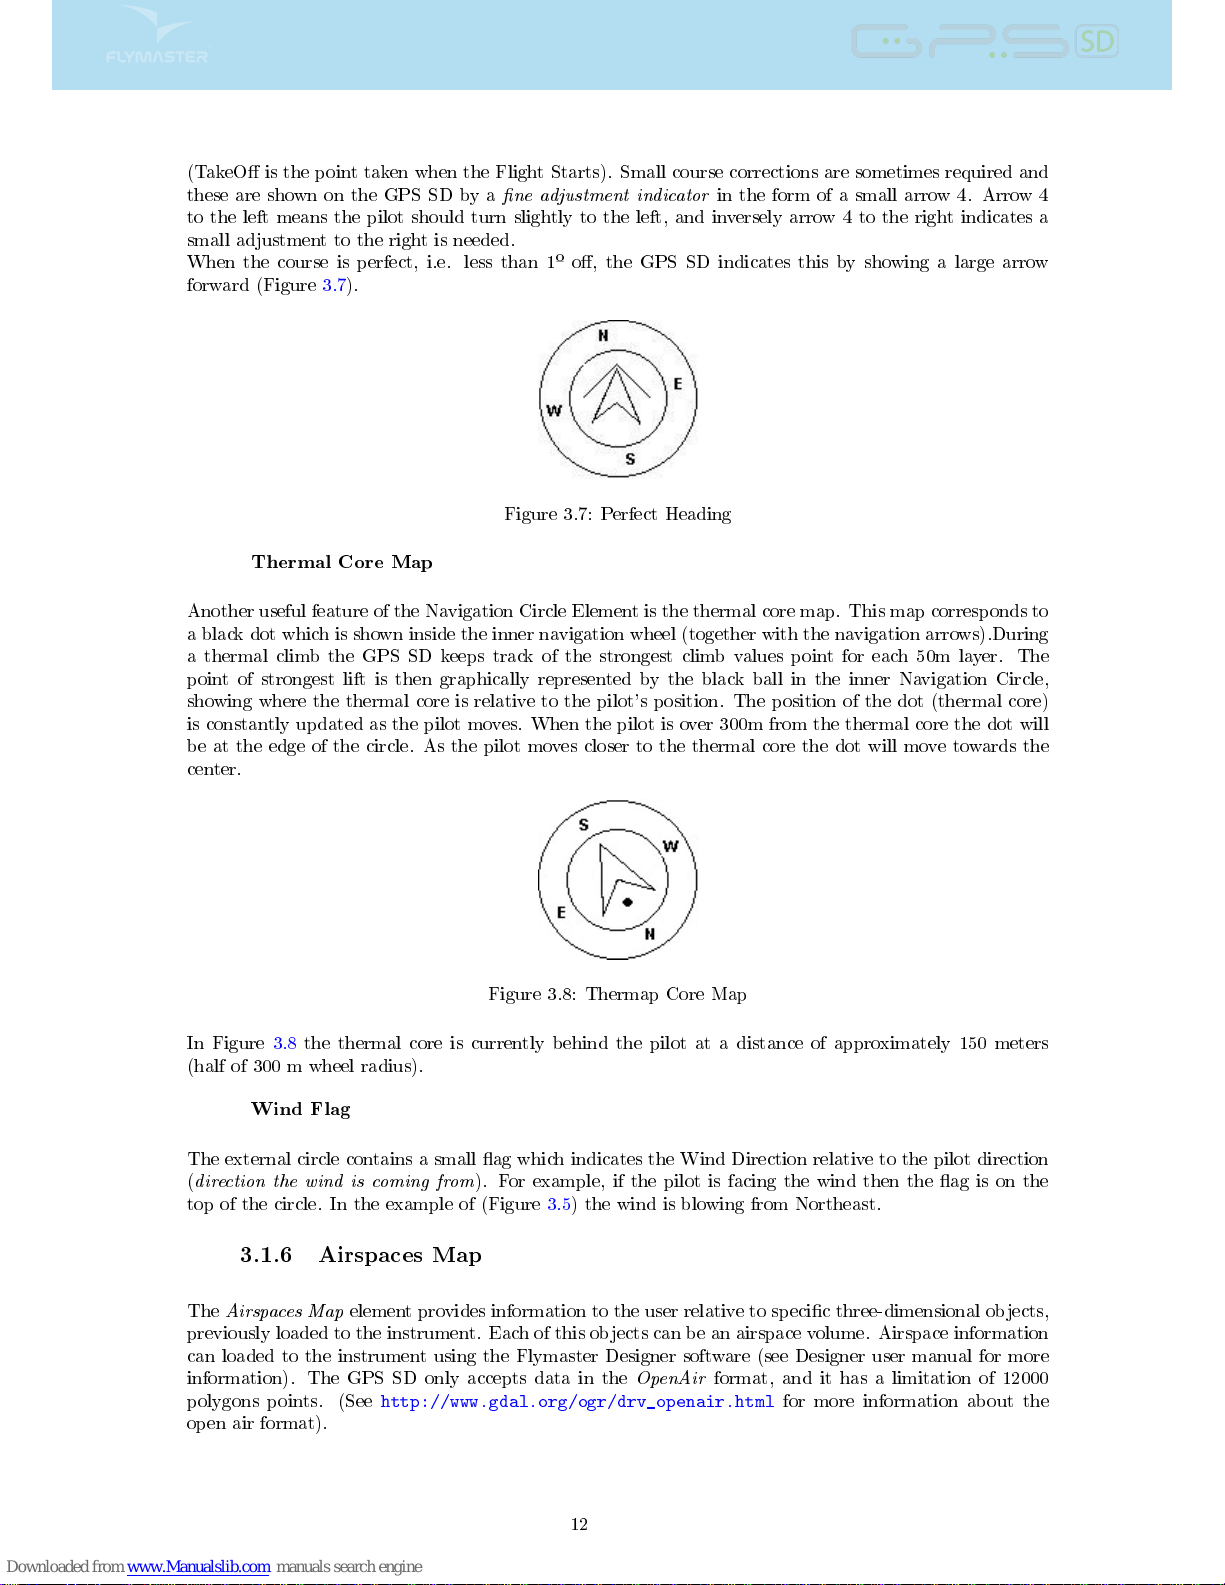
When the course is perfect, i.e. less than 1ºo, the GPS SD indicates this by showing a large arrow
forward (Figure 3.7).
Figure 3.7: Perfect Heading
Thermal Core Map
Another useful feature of the Navigation Circle Element is the thermal core map. This map corresponds to
a black dot which is shown inside the inner navigation wheel (together with the navigation arrows).During
a thermal climb the GPS SD keeps track of the strongest climb values point for each 50m layer. The
point of strongest lift is then graphically represented by the black ball in the inner Navigation Circle,
showing where the thermal core is relative to the pilot's position. The position of the dot (thermal core)
is constantly updated as the pilot moves. When the pilot is over 300m from the thermal core the dot will
be at the edge of the circle. As the pilot moves closer to the thermal core the dot will move towards the
center.
Figure 3.8: Thermap Core Map
In Figure 3.8 the thermal core is currently behind the pilot at a distance of approximately 150 meters
(half of 300 m wheel radius).
Wind Flag
The external circle contains a small ag which indicates the Wind Direction relative to the pilot direction
(
direction the wind is coming from
). For example, if the pilot is facing the wind then the ag is on the
top of the circle. In the example of (Figure 3.5) the wind is blowing from Northeast.
3.1.6 Airspaces Map
The
Airspaces Map
element provides information to the user relative to specic three-dimensional objects,
previously loaded to the instrument. Each of this objects can be an airspace volume. Airspace information
can loaded to the instrument using the Flymaster Designer software (see Designer user manual for more
information). The GPS SD only accepts data in the
OpenAir
format, and it has a limitation of 12000
polygons points. (See
http://www.gdal.org/ogr/drv_openair.html
for more information about the
open air format).
12
Page 14
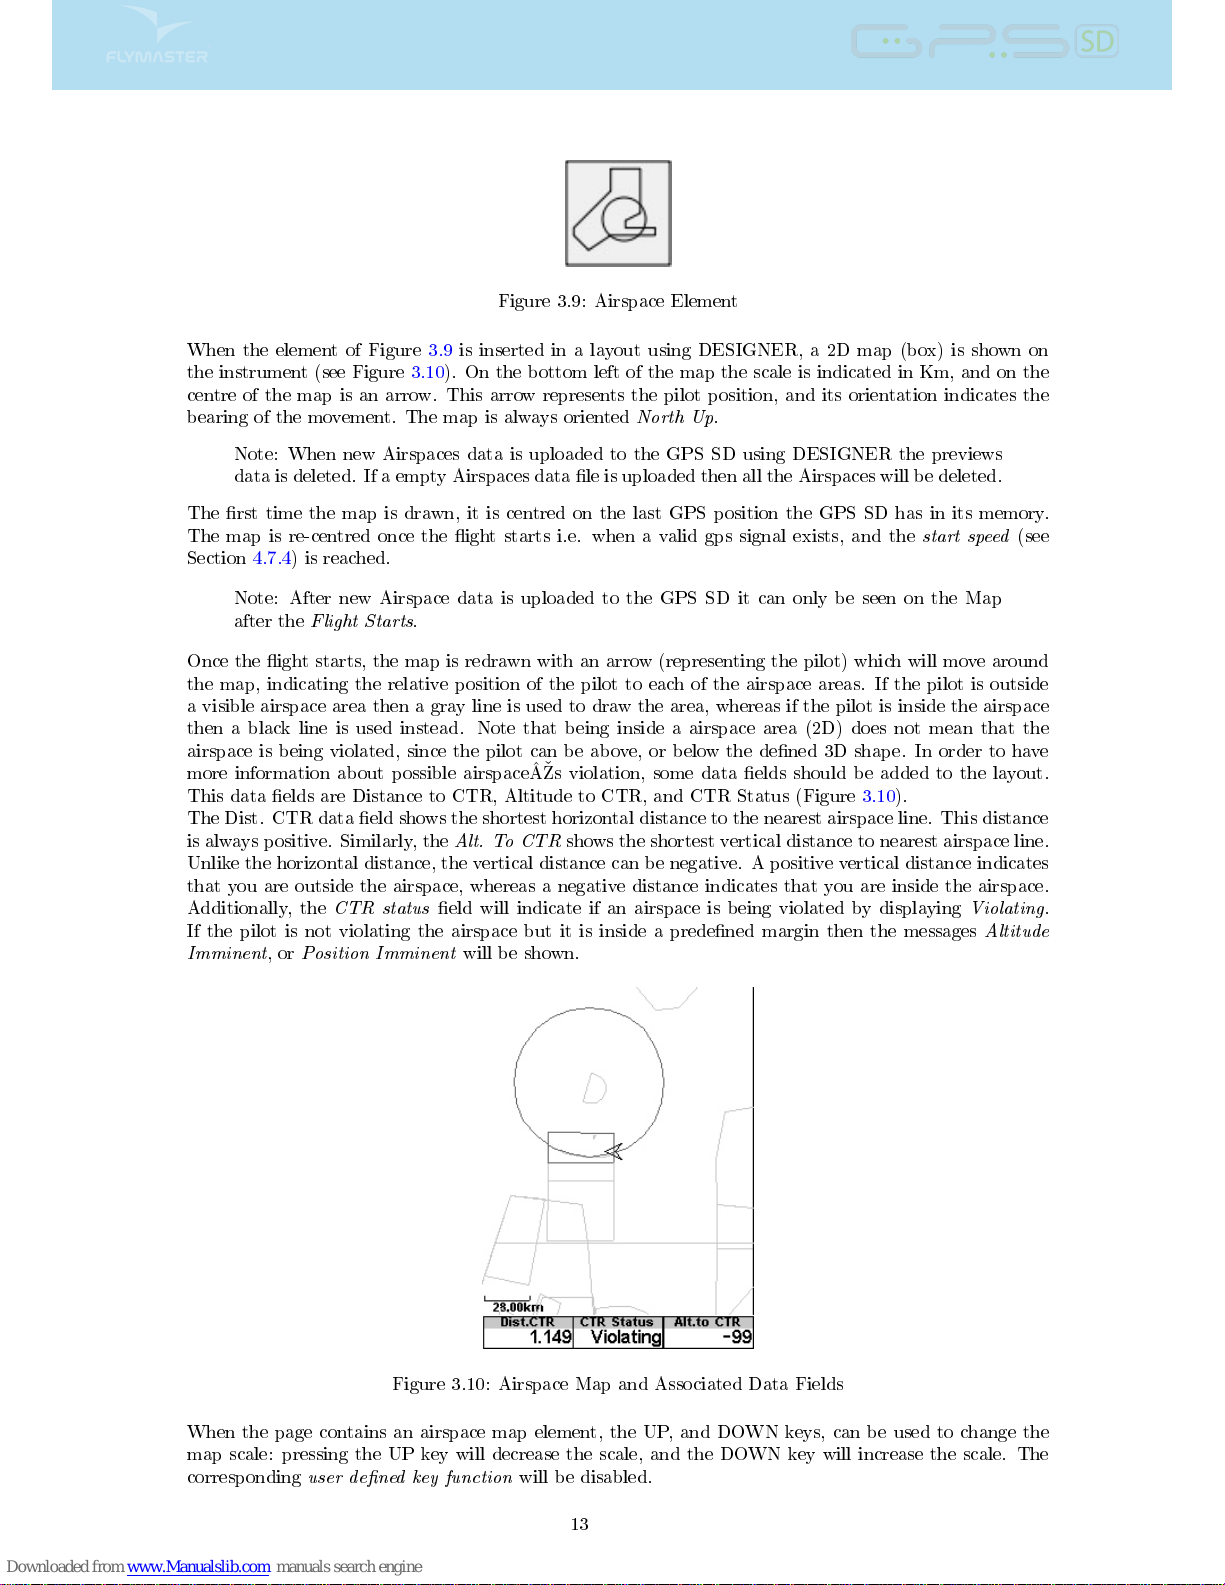
Figure 3.9: Airspace Element
When the element of Figure 3.9 is inserted in a layout using DESIGNER, a 2D map (box) is shown on
the instrument (see Figure 3.10). On the bottom left of the map the scale is indicated in Km, and on the
centre of the map is an arrow. This arrow represents the pilot position, and its orientation indicates the
bearing of the movement. The map is always oriented
North Up
.
Note: When new Airspaces data is uploaded to the GPS SD using DESIGNER the previews
data is deleted. If a empty Airspaces data le is uploaded then all the Airspaces will be deleted.
The rst time the map is drawn, it is centred on the last GPS position the GPS SD has in its memory.
The map is re-centred once the ight starts i.e. when a valid gps signal exists, and the
start speed
(see
Section 4.7.4) is reached.
Note: After new Airspace data is uploaded to the GPS SD it can only be seen on the Map
after the
Flight Starts
.
Once the ight starts, the map is redrawn with an arrow (representing the pilot) which will move around
the map, indicating the relative position of the pilot to each of the airspace areas. If the pilot is outside
a visible airspace area then a gray line is used to draw the area, whereas if the pilot is inside the airspace
then a black line is used instead. Note that being inside a airspace area (2D) does not mean that the
airspace is being violated, since the pilot can be above, or below the dened 3D shape. In order to have
more information about possible airspaceÂs violation, some data elds should be added to the layout.
This data elds are Distance to CTR, Altitude to CTR, and CTR Status (Figure 3.10).
The Dist. CTR data eld shows the shortest horizontal distance to the nearest airspace line. This distance
is always positive. Similarly, the
Alt. To CTR
shows the shortest vertical distance to nearest airspace line.
Unlike the horizontal distance, the vertical distance can be negative. A positive vertical distance indicates
that you are outside the airspace, whereas a negative distance indicates that you are inside the airspace.
Additionally, the
CTR status
eld will indicate if an airspace is being violated by displaying
Violating
.
If the pilot is not violating the airspace but it is inside a predened margin then the messages
Altitude
Imminent
, or
Position Imminent
will be shown.
Figure 3.10: Airspace Map and Associated Data Fields
When the page contains an airspace map element, the UP, and DOWN keys, can be used to change the
map scale: pressing the UP key will decrease the scale, and the DOWN key will increase the scale. The
corresponding
user dened key function
will be disabled.
13
Page 15
3.1.7 Altitude graph
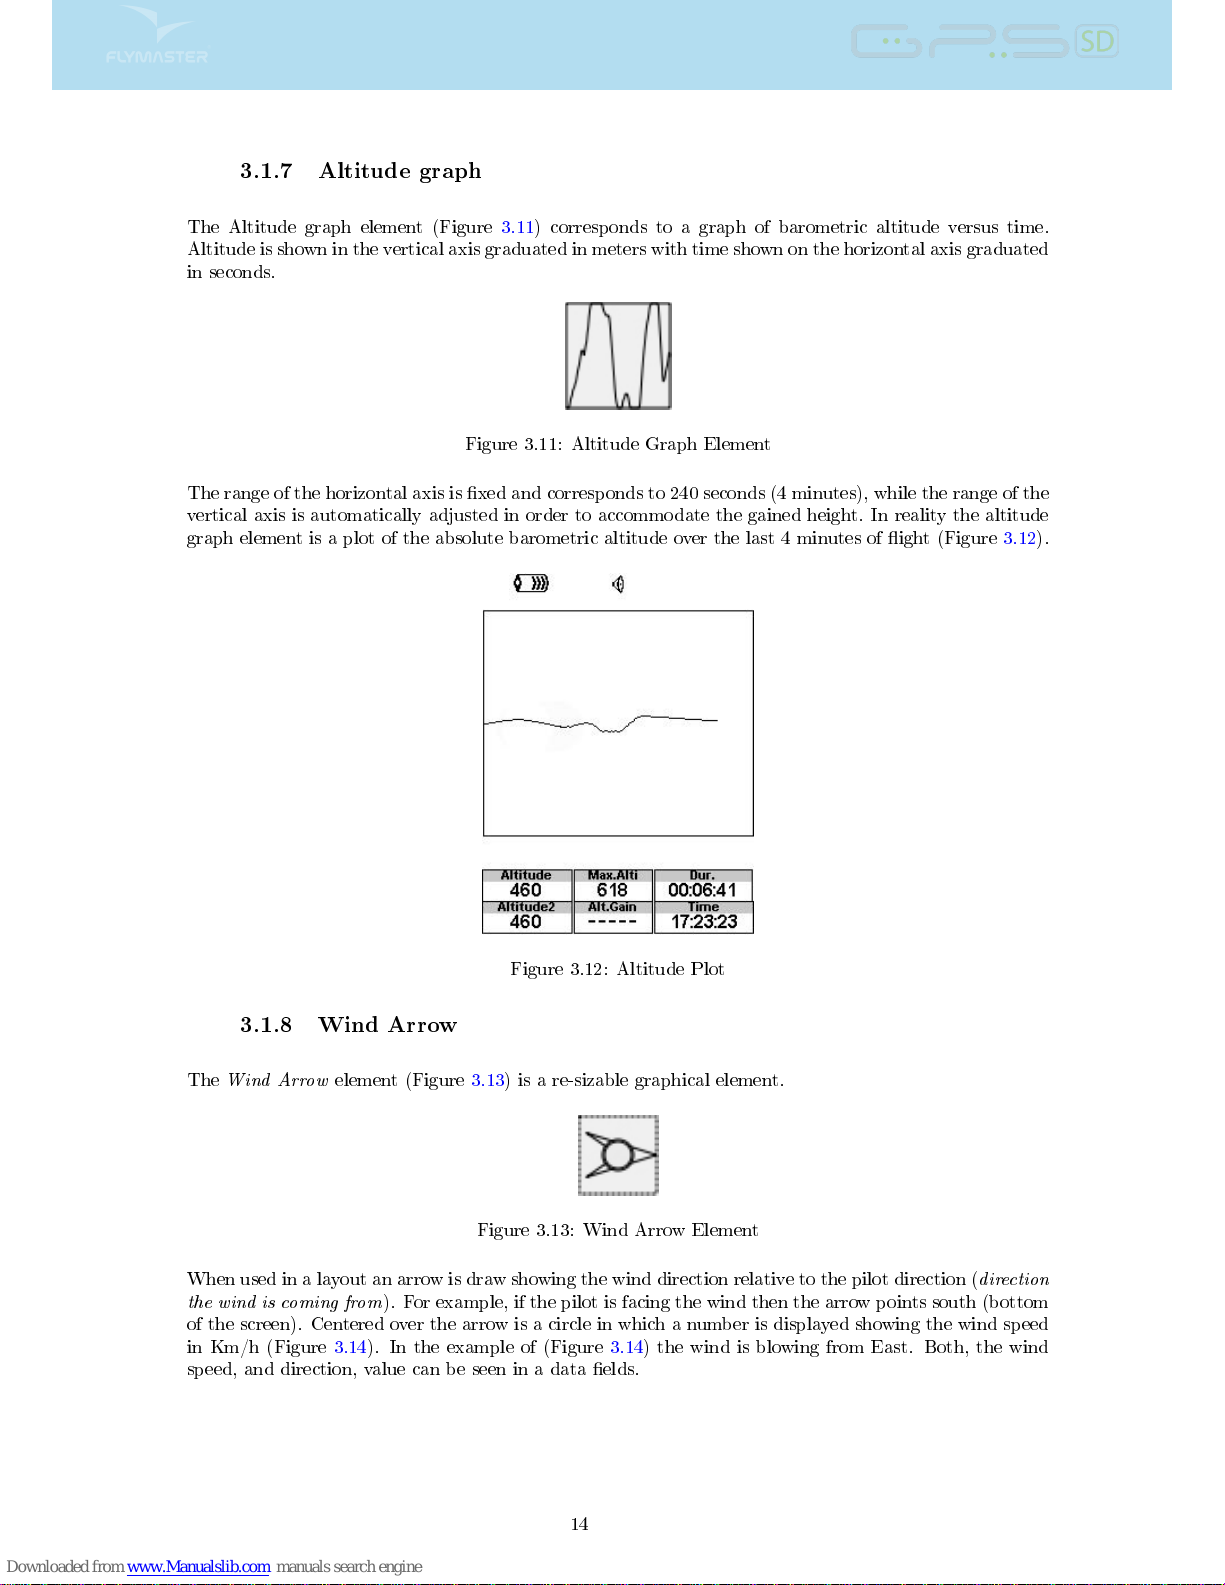
The Altitude graph element (Figure 3.11) corresponds to a graph of barometric altitude versus time.
Altitude is shown in the vertical axis graduated in meters with time shown on the horizontal axis graduated
in seconds.
Figure 3.11: Altitude Graph Element
The range of the horizontal axis is xed and corresponds to 240 seconds (4 minutes), while the range of the
vertical axis is automatically adjusted in order to accommodate the gained height. In reality the altitude
graph element is a plot of the absolute barometric altitude over the last 4 minutes of ight (Figure 3.12).
Figure 3.12: Altitude Plot
3.1.8 Wind Arrow
The
Wind Arrow
element (Figure 3.13) is a re-sizable graphical element.
Figure 3.13: Wind Arrow Element
When used in a layout an arrow is draw showing the wind direction relative to the pilot direction (
direction
the wind is coming from
). For example, if the pilot is facing the wind then the arrow points south (bottom
of the screen). Centered over the arrow is a circle in which a number is displayed showing the wind speed
in Km/h (Figure 3.14). In the example of (Figure 3.14) the wind is blowing from East. Both, the wind
speed, and direction, value can be seen in a data elds.
14
Page 16
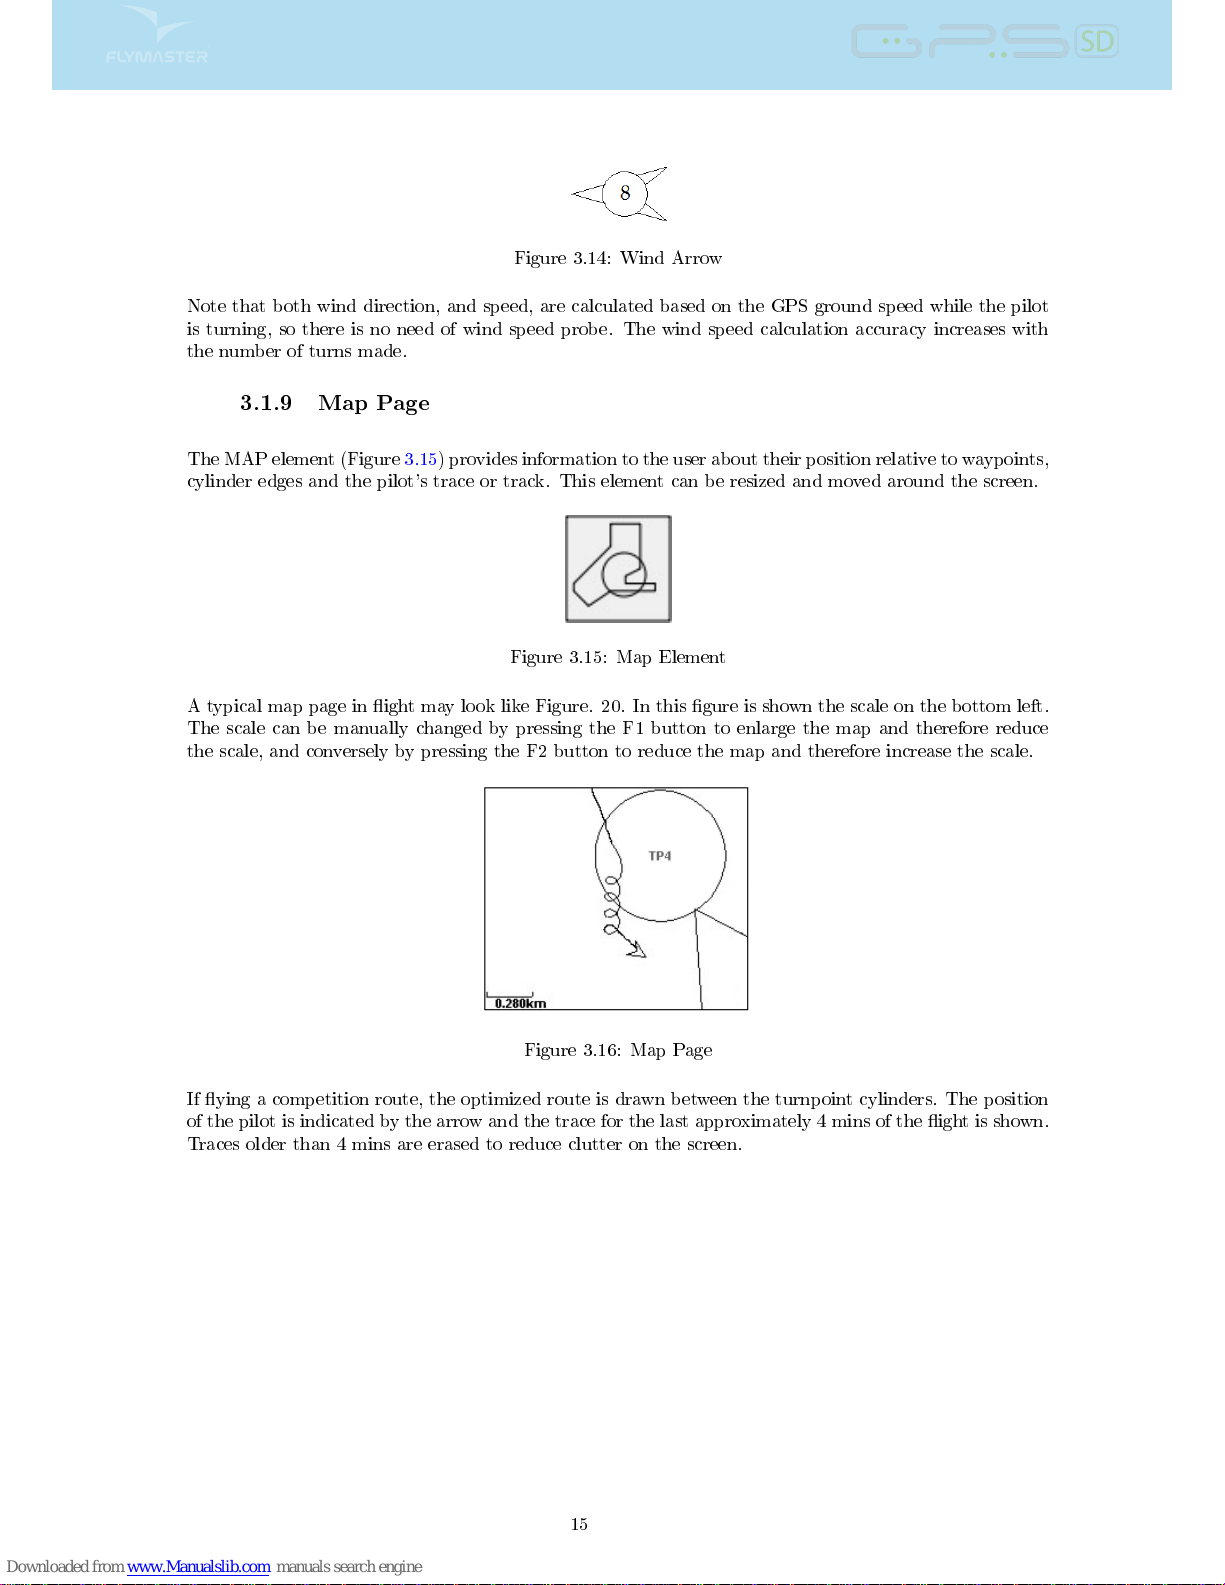
Figure 3.14: Wind Arrow
Note that both wind direction, and speed, are calculated based on the GPS ground speed while the pilot
is turning, so there is no need of wind speed probe. The wind speed calculation accuracy increases with
the number of turns made.
3.1.9 Map Page
The MAP element (Figure 3.15) provides information to the user about their position relative to waypoints,
cylinder edges and the pilot's trace or track. This element can be resized and moved around the screen.
Figure 3.15: Map Element
A typical map page in ight may look like Figure. 20. In this gure is shown the scale on the bottom left.
The scale can be manually changed by pressing the F1 button to enlarge the map and therefore reduce
the scale, and conversely by pressing the F2 button to reduce the map and therefore increase the scale.
Figure 3.16: Map Page
If ying a competition route, the optimized route is drawn between the turnpoint cylinders. The position
of the pilot is indicated by the arrow and the trace for the last approximately 4 mins of the ight is shown.
Traces older than 4 mins are erased to reduce clutter on the screen.
15
Page 17
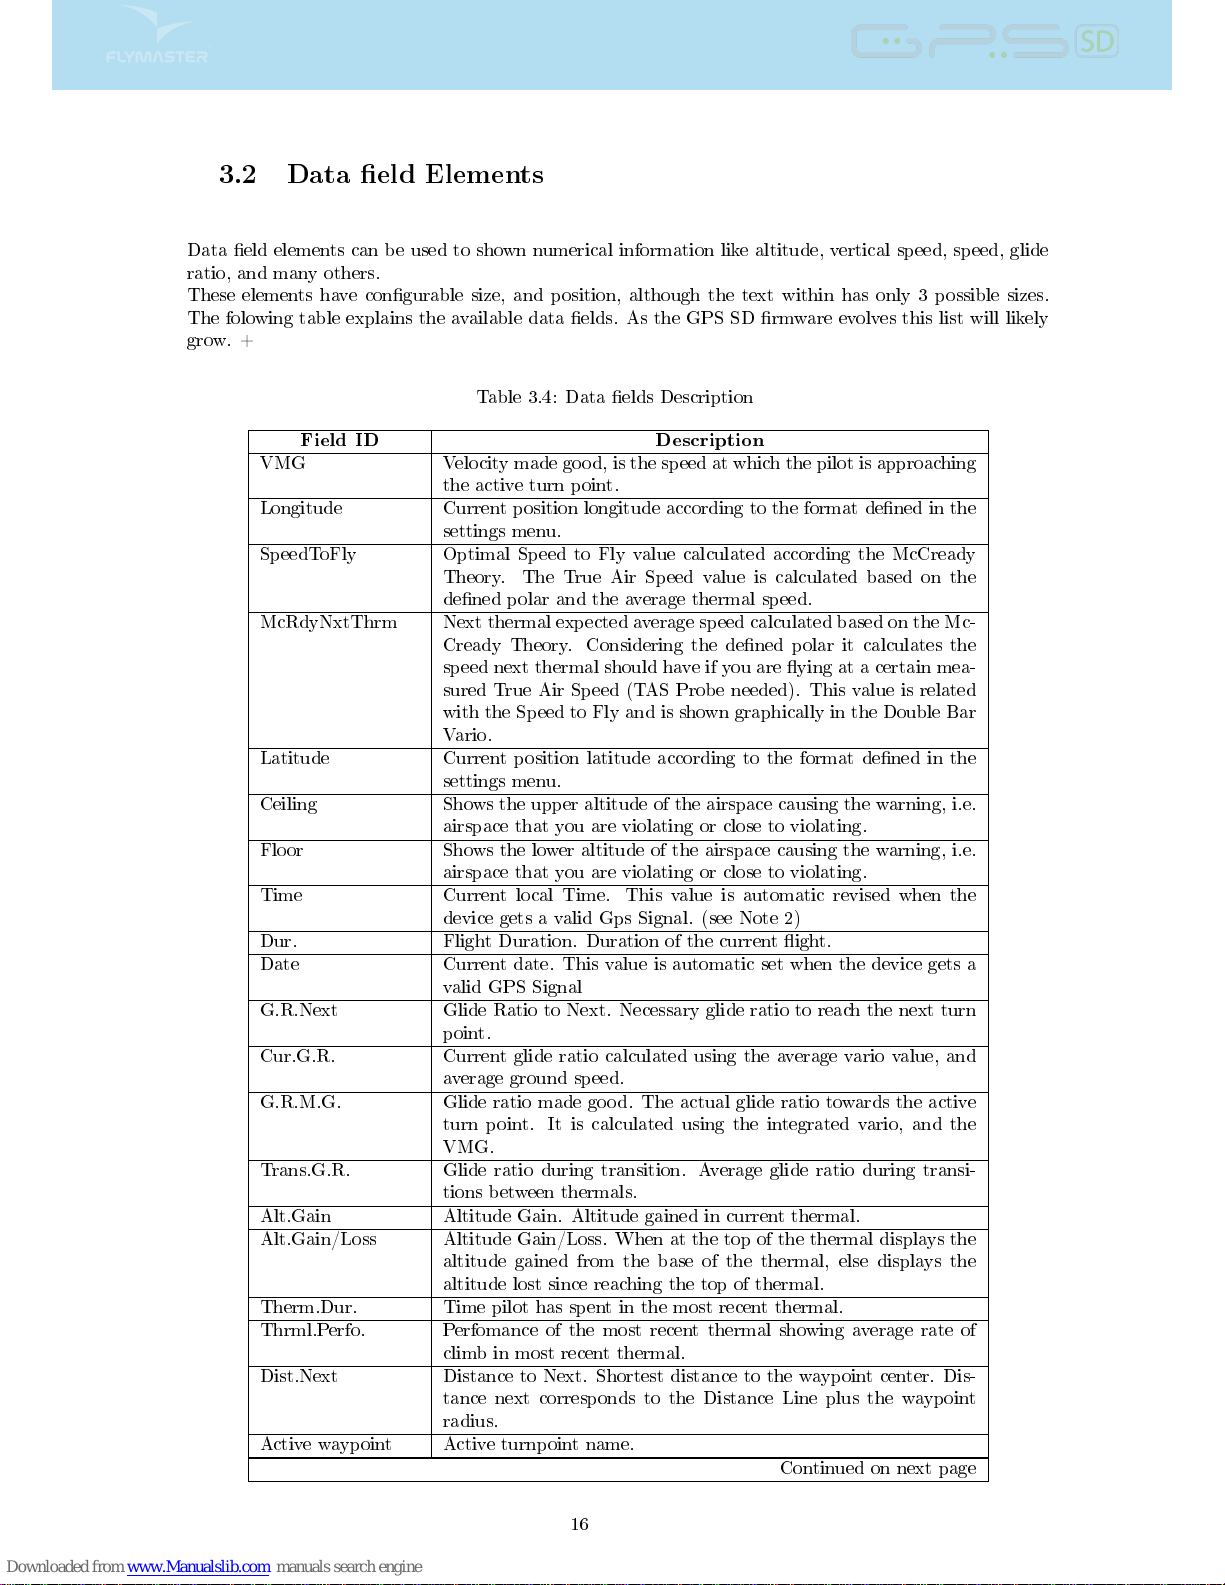
3.2 Data eld Elements
Data eld elements can be used to shown numerical information like altitude, vertical speed, speed, glide
ratio, and many others.
These elements have congurable size, and position, although the text within has only 3 possible sizes.
The folowing table explains the available data elds. As the GPS SD rmware evolves this list will likely
grow. +
Table 3.4: Data elds Description
Field ID Description
VMG Velocity made good, is the speed at which the pilot is approaching
the active turn point.
Longitude Current position longitude according to the format dened in the
settings menu.
SpeedToFly Optimal Speed to Fly value calculated according the McCready
Theory. The True Air Speed value is calculated based on the
dened polar and the average thermal speed.
McRdyNxtThrm Next thermal expected average speed calculated based on the Mc-
Cready Theory. Considering the dened polar it calculates the
speed next thermal should have if you are ying at a certain mea-
sured True Air Speed (TAS Probe needed). This value is related
with the Speed to Fly and is shown graphically in the Double Bar
Vario.
Latitude Current position latitude according to the format dened in the
settings menu.
Ceiling Shows the upper altitude of the airspace causing the warning, i.e.
airspace that you are violating or close to violating.
Floor Shows the lower altitude of the airspace causing the warning, i.e.
airspace that you are violating or close to violating.
Time Current local Time. This value is automatic revised when the
device gets a valid Gps Signal. (see Note 2)
Dur. Flight Duration. Duration of the current ight.
Date Current date. This value is automatic set when the device gets a
valid GPS Signal
G.R.Next Glide Ratio to Next. Necessary glide ratio to reach the next turn
point.
Cur.G.R. Current glide ratio calculated using the average vario value, and
average ground speed.
G.R.M.G. Glide ratio made good. The actual glide ratio towards the active
turn point. It is calculated using the integrated vario, and the
VMG.
Trans.G.R. Glide ratio during transition. Average glide ratio during transi-
tions between thermals.
Alt.Gain Altitude Gain. Altitude gained in current thermal.
Alt.Gain/Loss Altitude Gain/Loss. When at the top of the thermal displays the
altitude gained from the base of the thermal, else displays the
altitude lost since reaching the top of thermal.
Therm.Dur. Time pilot has spent in the most recent thermal.
Thrml.Perfo. Perfomance of the most recent thermal showing average rate of
climb in most recent thermal.
Dist.Next Distance to Next. Shortest distance to the waypoint center. Dis-
tance next corresponds to the Distance Line plus the waypoint
radius.
Active waypoint Active turnpoint name.
Continued on next page
16
Page 18
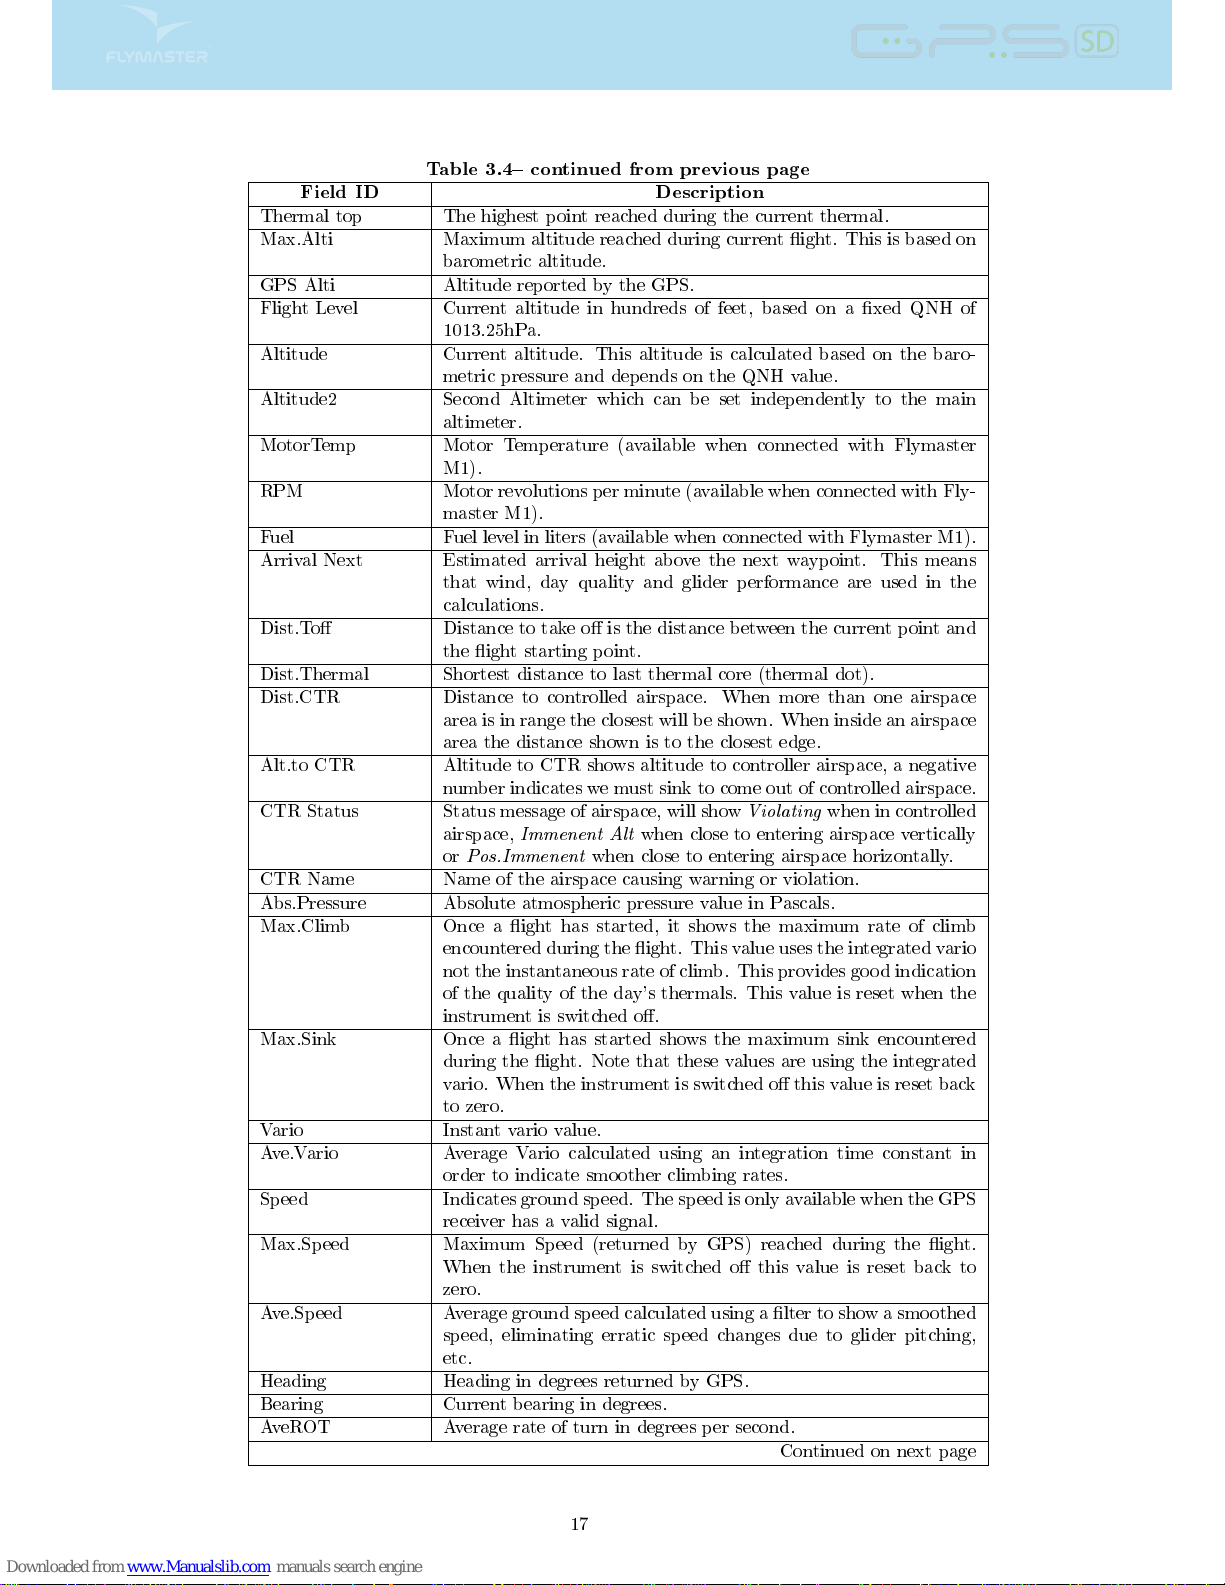
Table 3.4 continued from previous page
Field ID Description
Thermal top The highest point reached during the current thermal.
Max.Alti Maximum altitude reached during current ight. This is based on
barometric altitude.
GPS Alti Altitude reported by the GPS.
Flight Level Current altitude in hundreds of feet, based on a xed QNH of
1013.25hPa.
Altitude Current altitude. This altitude is calculated based on the baro-
metric pressure and depends on the QNH value.
Altitude2 Second Altimeter which can be set independently to the main
altimeter.
MotorTemp Motor Temperature (available when connected with Flymaster
M1).
RPM Motor revolutions per minute (available when connected with Fly-
master M1).
Fuel Fuel level in liters (available when connected with Flymaster M1).
Arrival Next Estimated arrival height above the next waypoint. This means
that wind, day quality and glider performance are used in the
calculations.
Dist.To Distance to take o is the distance between the current point and
the ight starting point.
Dist.Thermal Shortest distance to last thermal core (thermal dot).
Dist.CTR Distance to controlled airspace. When more than one airspace
area is in range the closest will be shown. When inside an airspace
area the distance shown is to the closest edge.
Alt.to CTR Altitude to CTR shows altitude to controller airspace, a negative
number indicates we must sink to come out of controlled airspace.
CTR Status Status message of airspace, will show
Violating
when in controlled
airspace,
Immenent Alt
when close to entering airspace vertically
or
Pos.Immenent
when close to entering airspace horizontally.
CTR Name Name of the airspace causing warning or violation.
Abs.Pressure Absolute atmospheric pressure value in Pascals.
Max.Climb Once a ight has started, it shows the maximum rate of climb
encountered during the ight. This value uses the integrated vario
not the instantaneous rate of climb. This provides good indication
of the quality of the day's thermals. This value is reset when the
instrument is switched o.
Max.Sink Once a ight has started shows the maximum sink encountered
during the ight. Note that these values are using the integrated
vario. When the instrument is switched o this value is reset back
to zero.
Vario Instant vario value.
Ave.Vario Average Vario calculated using an integration time constant in
order to indicate smoother climbing rates.
Speed Indicates ground speed. The speed is only available when the GPS
receiver has a valid signal.
Max.Speed Maximum Speed (returned by GPS) reached during the ight.
When the instrument is switched o this value is reset back to
zero.
Ave.Speed Average ground speed calculated using a lter to show a smoothed
speed, eliminating erratic speed changes due to glider pitching,
etc.
Heading Heading in degrees returned by GPS.
Bearing Current bearing in degrees.
AveROT Average rate of turn in degrees per second.
Continued on next page
17
Page 19
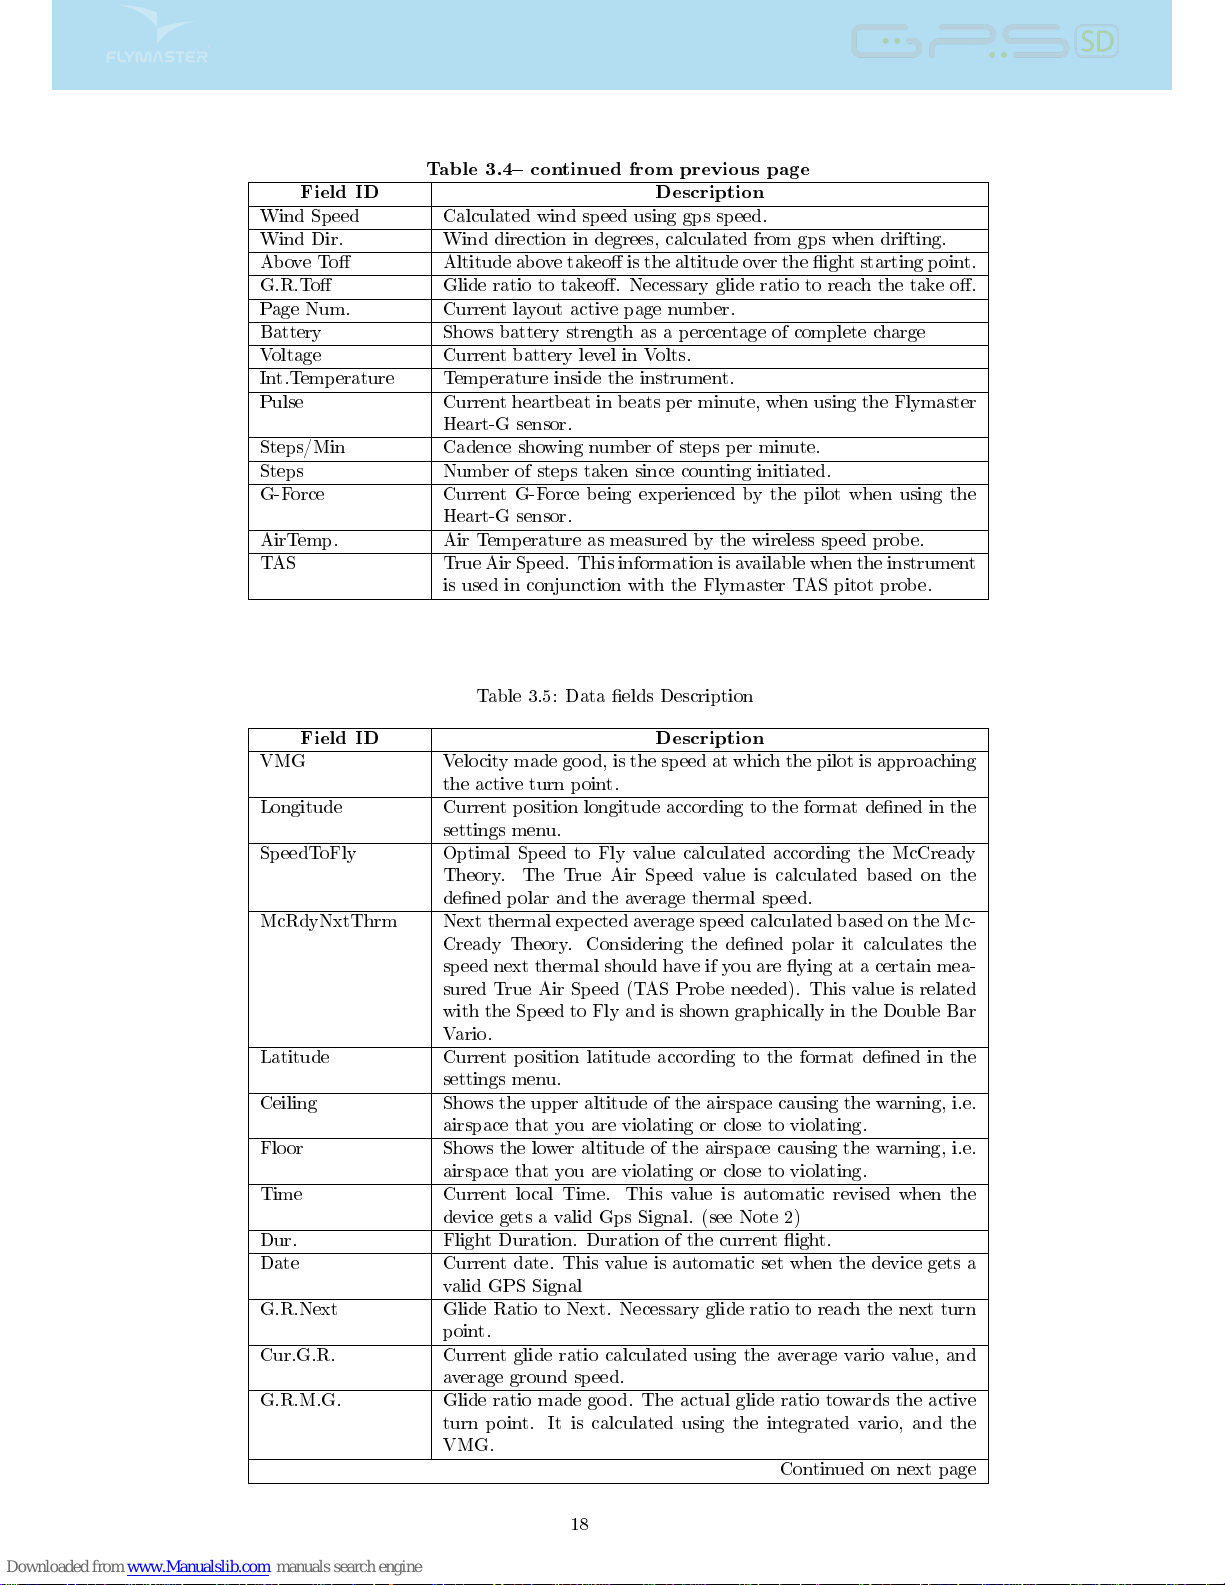
Table 3.4 continued from previous page
Field ID Description
Wind Speed Calculated wind speed using gps speed.
Wind Dir. Wind direction in degrees, calculated from gps when drifting.
Above To Altitude above takeo is the altitude over the ight starting point.
G.R.To Glide ratio to takeo. Necessary glide ratio to reach the take o.
Page Num. Current layout active page number.
Battery Shows battery strength as a percentage of complete charge
Voltage Current battery level in Volts.
Int.Temperature Temperature inside the instrument.
Pulse Current heartbeat in beats per minute, when using the Flymaster
Heart-G sensor.
Steps/Min Cadence showing number of steps per minute.
Steps Number of steps taken since counting initiated.
G-Force Current G-Force being experienced by the pilot when using the
Heart-G sensor.
AirTemp. Air Temperature as measured by the wireless speed probe.
TAS True Air Speed. This information is available when the instrument
is used in conjunction with the Flymaster TAS pitot probe.
Table 3.5: Data elds Description
Field ID Description
VMG Velocity made good, is the speed at which the pilot is approaching
the active turn point.
Longitude Current position longitude according to the format dened in the
settings menu.
SpeedToFly Optimal Speed to Fly value calculated according the McCready
Theory. The True Air Speed value is calculated based on the
dened polar and the average thermal speed.
McRdyNxtThrm Next thermal expected average speed calculated based on the Mc-
Cready Theory. Considering the dened polar it calculates the
speed next thermal should have if you are ying at a certain mea-
sured True Air Speed (TAS Probe needed). This value is related
with the Speed to Fly and is shown graphically in the Double Bar
Vario.
Latitude Current position latitude according to the format dened in the
settings menu.
Ceiling Shows the upper altitude of the airspace causing the warning, i.e.
airspace that you are violating or close to violating.
Floor Shows the lower altitude of the airspace causing the warning, i.e.
airspace that you are violating or close to violating.
Time Current local Time. This value is automatic revised when the
device gets a valid Gps Signal. (see Note 2)
Dur. Flight Duration. Duration of the current ight.
Date Current date. This value is automatic set when the device gets a
valid GPS Signal
G.R.Next Glide Ratio to Next. Necessary glide ratio to reach the next turn
point.
Cur.G.R. Current glide ratio calculated using the average vario value, and
average ground speed.
G.R.M.G. Glide ratio made good. The actual glide ratio towards the active
turn point. It is calculated using the integrated vario, and the
VMG.
Continued on next page
18
Page 20
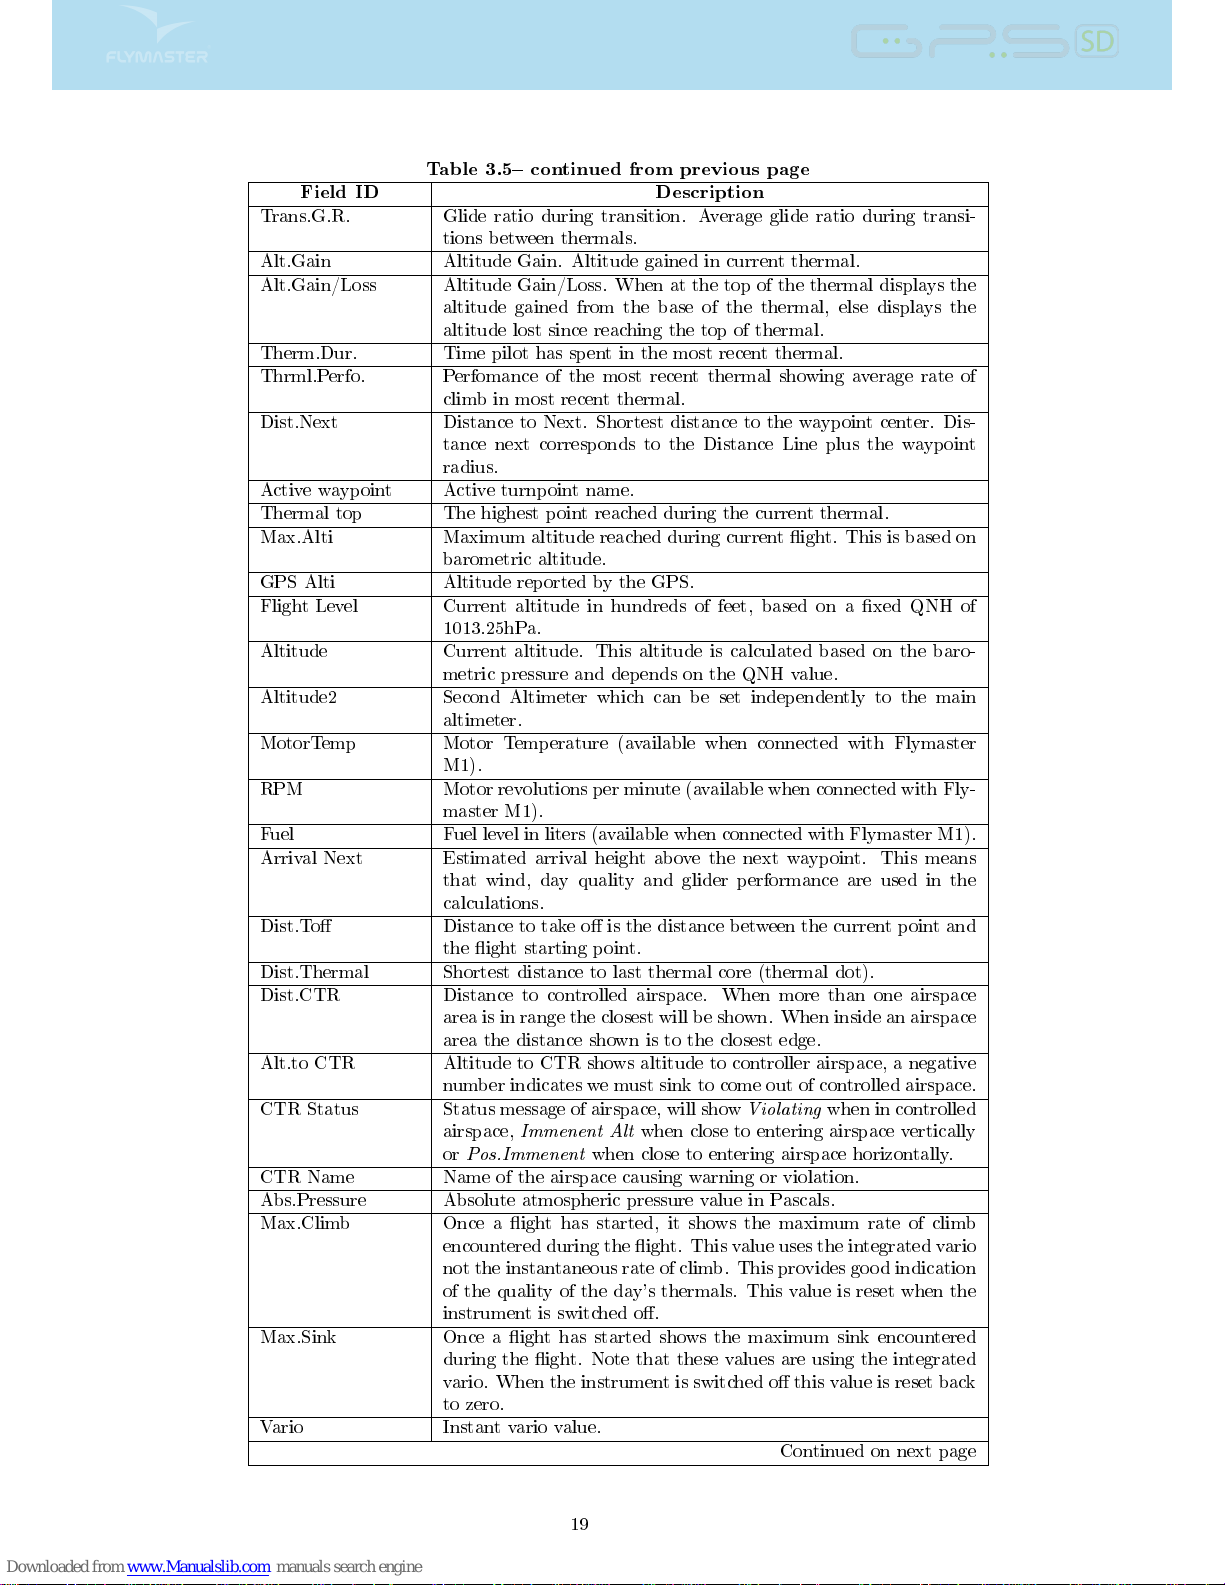
Table 3.5 continued from previous page
Field ID Description
Trans.G.R. Glide ratio during transition. Average glide ratio during transi-
tions between thermals.
Alt.Gain Altitude Gain. Altitude gained in current thermal.
Alt.Gain/Loss Altitude Gain/Loss. When at the top of the thermal displays the
altitude gained from the base of the thermal, else displays the
altitude lost since reaching the top of thermal.
Therm.Dur. Time pilot has spent in the most recent thermal.
Thrml.Perfo. Perfomance of the most recent thermal showing average rate of
climb in most recent thermal.
Dist.Next Distance to Next. Shortest distance to the waypoint center. Dis-
tance next corresponds to the Distance Line plus the waypoint
radius.
Active waypoint Active turnpoint name.
Thermal top The highest point reached during the current thermal.
Max.Alti Maximum altitude reached during current ight. This is based on
barometric altitude.
GPS Alti Altitude reported by the GPS.
Flight Level Current altitude in hundreds of feet, based on a xed QNH of
1013.25hPa.
Altitude Current altitude. This altitude is calculated based on the baro-
metric pressure and depends on the QNH value.
Altitude2 Second Altimeter which can be set independently to the main
altimeter.
MotorTemp Motor Temperature (available when connected with Flymaster
M1).
RPM Motor revolutions per minute (available when connected with Fly-
master M1).
Fuel Fuel level in liters (available when connected with Flymaster M1).
Arrival Next Estimated arrival height above the next waypoint. This means
that wind, day quality and glider performance are used in the
calculations.
Dist.To Distance to take o is the distance between the current point and
the ight starting point.
Dist.Thermal Shortest distance to last thermal core (thermal dot).
Dist.CTR Distance to controlled airspace. When more than one airspace
area is in range the closest will be shown. When inside an airspace
area the distance shown is to the closest edge.
Alt.to CTR Altitude to CTR shows altitude to controller airspace, a negative
number indicates we must sink to come out of controlled airspace.
CTR Status Status message of airspace, will show
Violating
when in controlled
airspace,
Immenent Alt
when close to entering airspace vertically
or
Pos.Immenent
when close to entering airspace horizontally.
CTR Name Name of the airspace causing warning or violation.
Abs.Pressure Absolute atmospheric pressure value in Pascals.
Max.Climb Once a ight has started, it shows the maximum rate of climb
encountered during the ight. This value uses the integrated vario
not the instantaneous rate of climb. This provides good indication
of the quality of the day's thermals. This value is reset when the
instrument is switched o.
Max.Sink Once a ight has started shows the maximum sink encountered
during the ight. Note that these values are using the integrated
vario. When the instrument is switched o this value is reset back
to zero.
Vario Instant vario value.
Continued on next page
19
Page 21
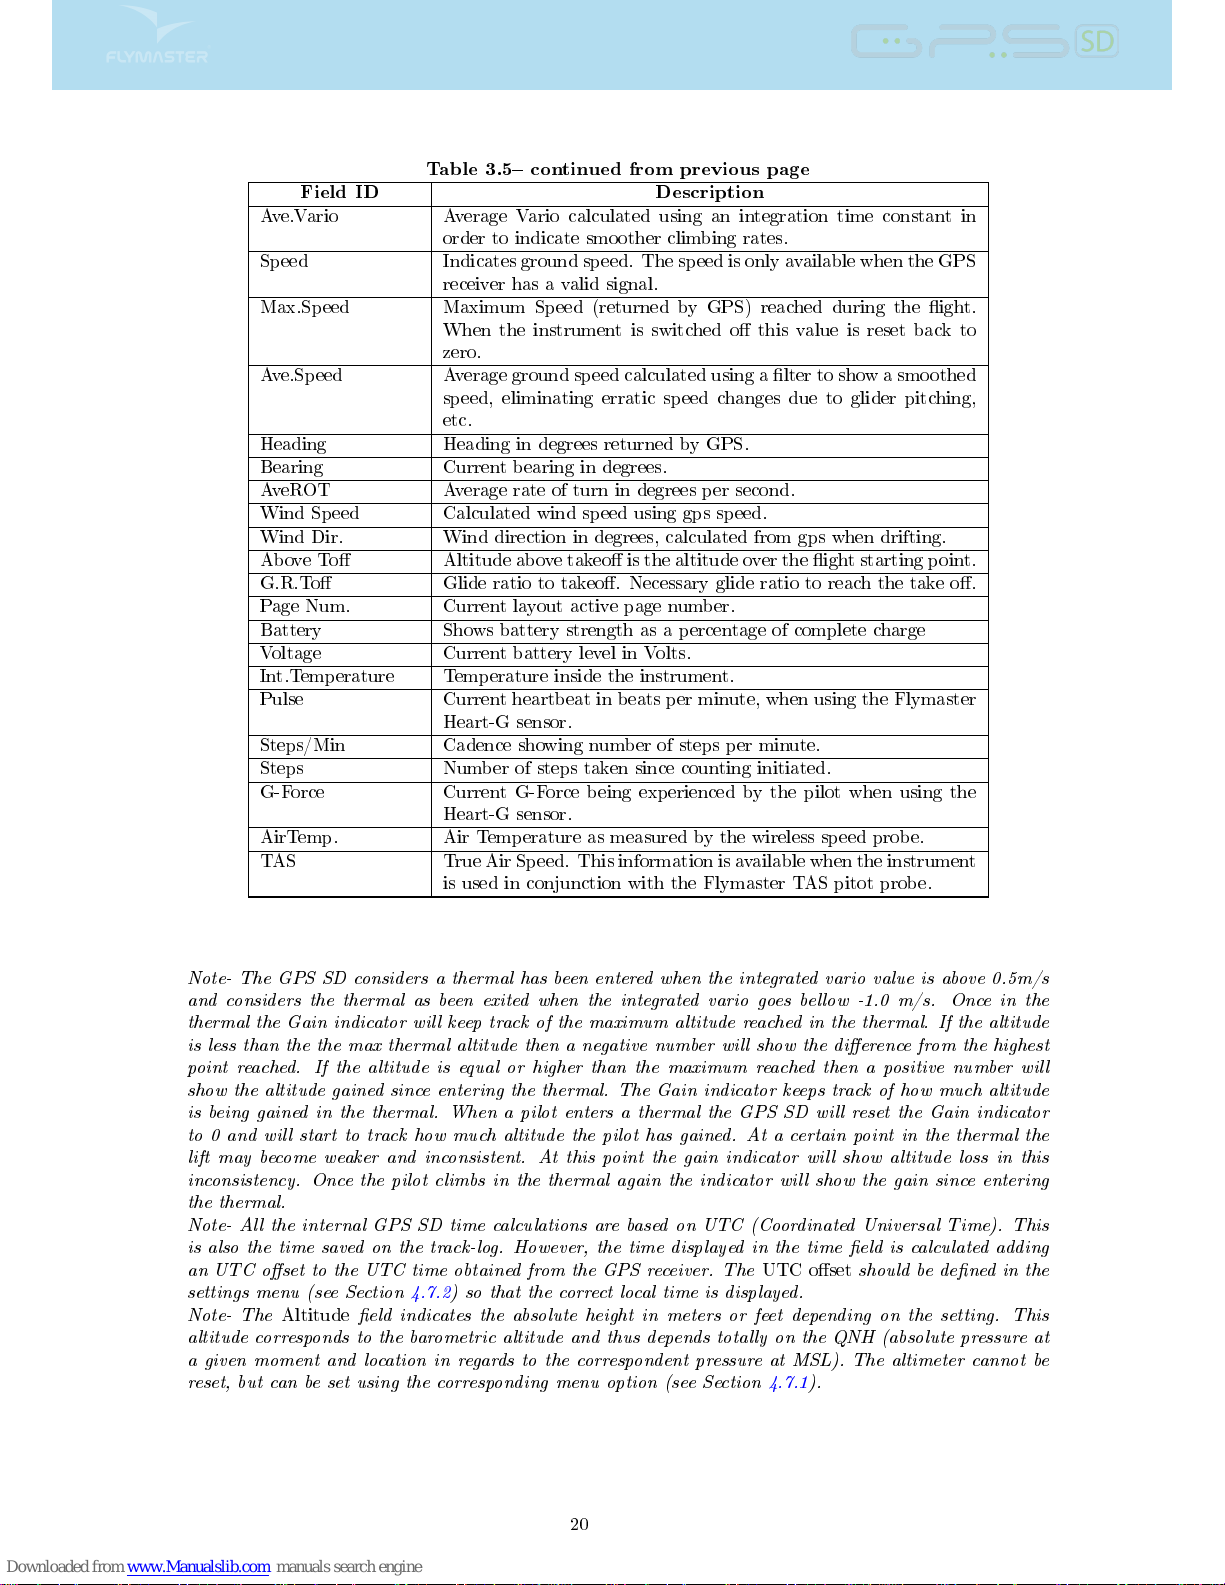
Table 3.5 continued from previous page
Field ID Description
Ave.Vario Average Vario calculated using an integration time constant in
order to indicate smoother climbing rates.
Speed Indicates ground speed. The speed is only available when the GPS
receiver has a valid signal.
Max.Speed Maximum Speed (returned by GPS) reached during the ight.
When the instrument is switched o this value is reset back to
zero.
Ave.Speed Average ground speed calculated using a lter to show a smoothed
speed, eliminating erratic speed changes due to glider pitching,
etc.
Heading Heading in degrees returned by GPS.
Bearing Current bearing in degrees.
AveROT Average rate of turn in degrees per second.
Wind Speed Calculated wind speed using gps speed.
Wind Dir. Wind direction in degrees, calculated from gps when drifting.
Above To Altitude above takeo is the altitude over the ight starting point.
G.R.To Glide ratio to takeo. Necessary glide ratio to reach the take o.
Page Num. Current layout active page number.
Battery Shows battery strength as a percentage of complete charge
Voltage Current battery level in Volts.
Int.Temperature Temperature inside the instrument.
Pulse Current heartbeat in beats per minute, when using the Flymaster
Heart-G sensor.
Steps/Min Cadence showing number of steps per minute.
Steps Number of steps taken since counting initiated.
G-Force Current G-Force being experienced by the pilot when using the
Heart-G sensor.
AirTemp. Air Temperature as measured by the wireless speed probe.
TAS True Air Speed. This information is available when the instrument
is used in conjunction with the Flymaster TAS pitot probe.
Note- The GPS SD considers a thermal has been entered when the integrated vario value is above 0.5m/s
and considers the thermal as been exited when the integrated vario goes bellow -1.0 m/s. Once in the
thermal the Gain indicator will keep track of the maximum altitude reached in the thermal. If the altitude
is less than the the max thermal altitude then a negative number will show the dierence from the highest
point reached. If the altitude is equal or higher than the maximum reached then a positive number will
show the altitude gained since entering the thermal. The Gain indicator keeps track of how much altitude
is being gained in the thermal. When a pilot enters a thermal the GPS SD will reset the Gain indicator
to 0 and will start to track how much altitude the pilot has gained. At a certain point in the thermal the
lift may become weaker and inconsistent. At this point the gain indicator will show altitude loss in this
inconsistency. Once the pilot climbs in the thermal again the indicator will show the gain since entering
the thermal.
Note- All the internal GPS SD time calculations are based on UTC (Coordinated Universal Time). This
is also the time saved on the track-log. However, the time displayed in the time eld is calculated adding
an UTC oset to the UTC time obtained from the GPS receiver. The
UTC oset
should be dened in the
settings menu (see Section 4.7.2) so that the correct local time is displayed.
Note- The
Altitude
eld indicates the absolute height in meters or feet depending on the setting. This
altitude corresponds to the barometric altitude and thus depends totally on the QNH (absolute pressure at
a given moment and location in regards to the correspondent pressure at MSL). The altimeter cannot be
reset, but can be set using the corresponding menu option (see Section 4.7.1).
20
Page 22
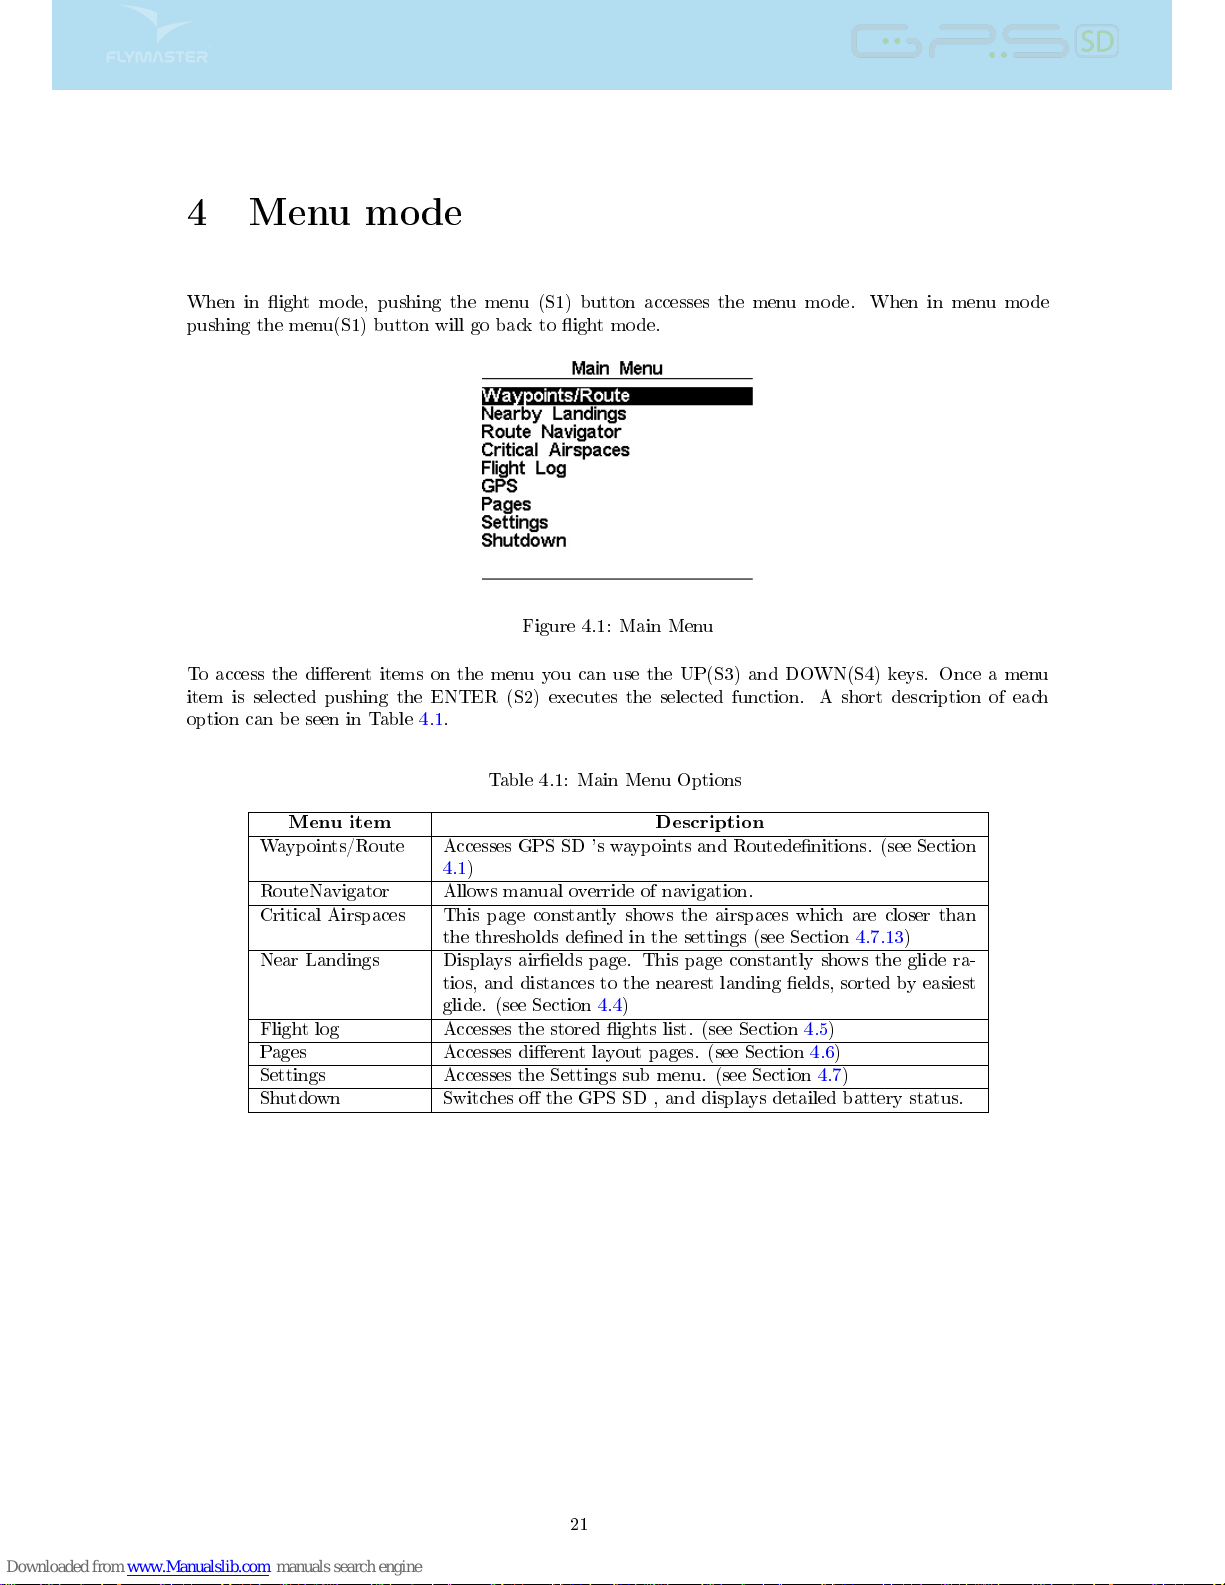
4 Menu mode
When in ight mode, pushing the menu (S1) button accesses the menu mode. When in menu mode
pushing the menu(S1) button will go back to ight mode.
Figure 4.1: Main Menu
To access the dierent items on the menu you can use the UP(S3) and DOWN(S4) keys. Once a menu
item is selected pushing the ENTER (S2) executes the selected function. A short description of each
option can be seen in Table 4.1.
Table 4.1: Main Menu Options
Menu item Description
Waypoints/Route Accesses GPS SD 's waypoints and Routedenitions. (see Section
4.1)
RouteNavigator Allows manual override of navigation.
Critical Airspaces This page constantly shows the airspaces which are closer than
the thresholds dened in the settings (see Section 4.7.13)
Near Landings Displays airelds page. This page constantly shows the glide ra-
tios, and distances to the nearest landing elds, sorted by easiest
glide. (see Section 4.4)
Flight log Accesses the stored ights list. (see Section 4.5)
Pages Accesses dierent layout pages. (see Section 4.6)
Settings Accesses the Settings sub menu. (see Section 4.7)
Shutdown Switches o the GPS SD , and displays detailed battery status.
21
Page 23
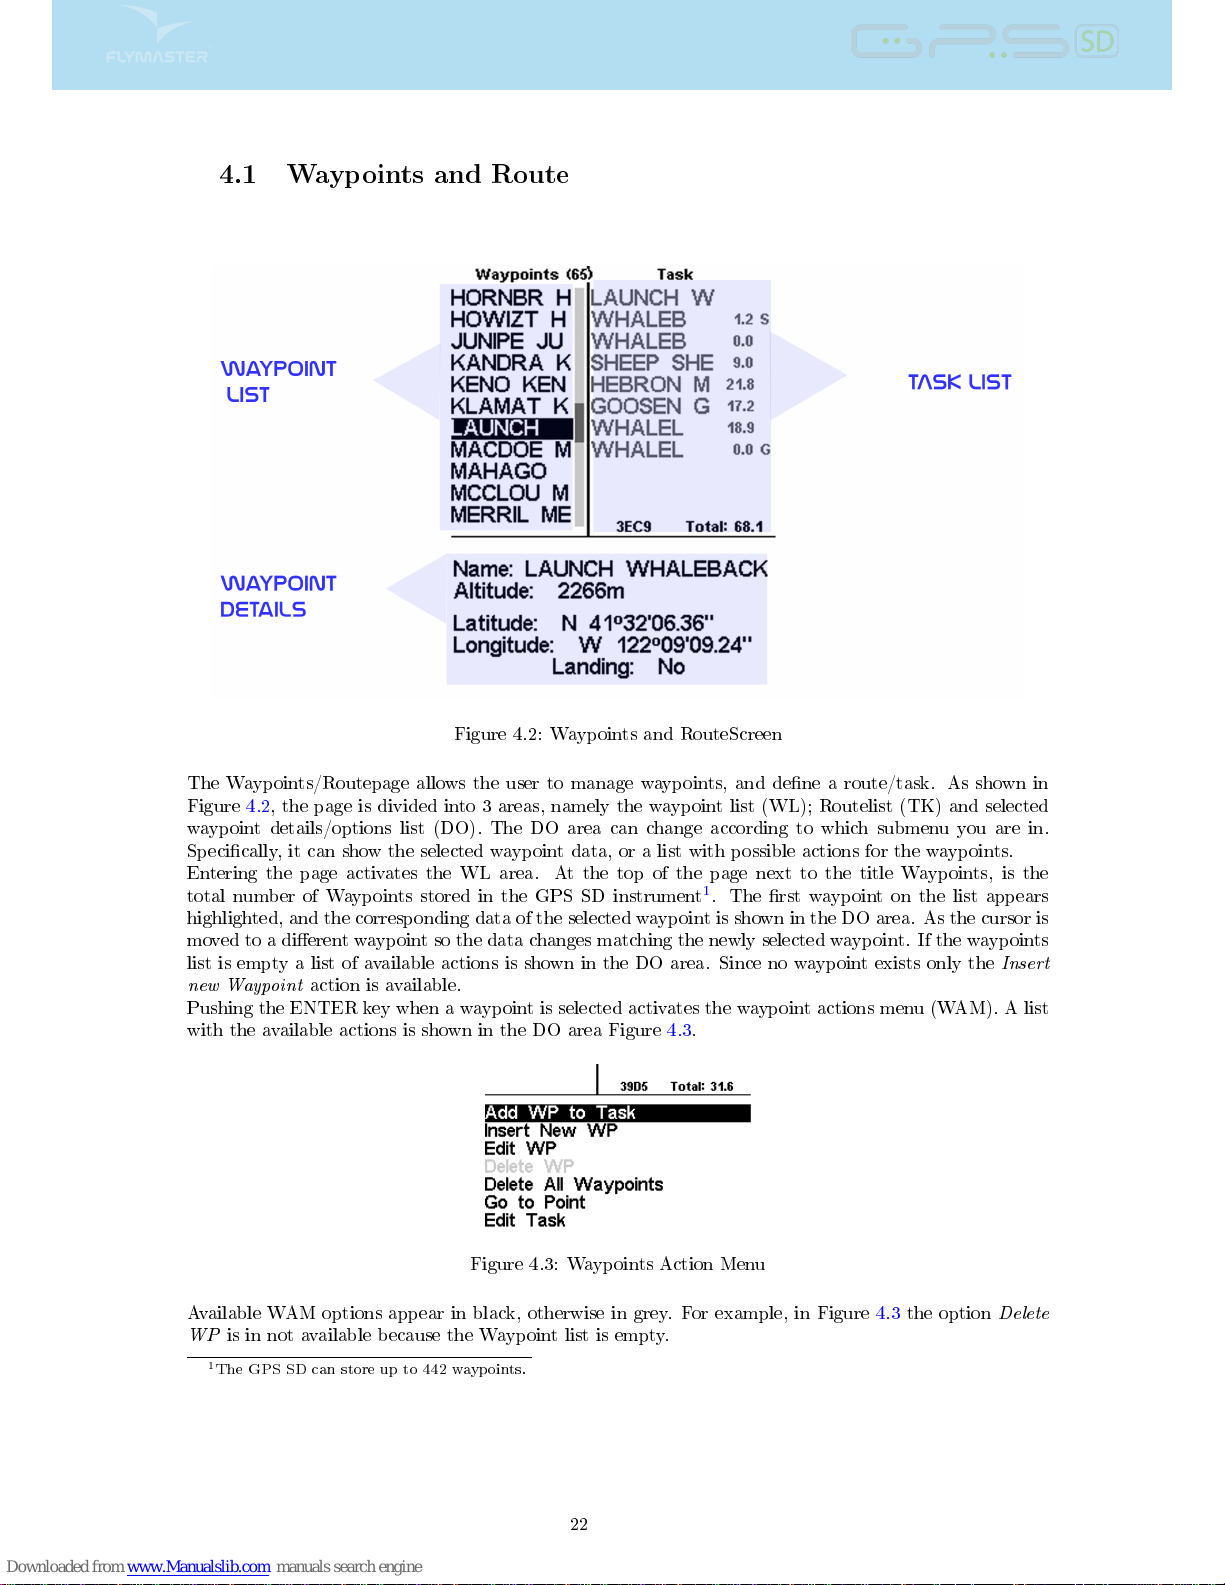
4.1 Waypoints and Route
Figure 4.2: Waypoints and RouteScreen
The Waypoints/Routepage allows the user to manage waypoints, and dene a route/task. As shown in
Figure 4.2, the page is divided into 3 areas, namely the waypoint list (WL); Routelist (TK) and selected
waypoint details/options list (DO). The DO area can change according to which submenu you are in.
Specically, it can show the selected waypoint data, or a list with possible actions for the waypoints.
Entering the page activates the WL area. At the top of the page next to the title Waypoints, is the
total number of Waypoints stored in the GPS SD instrument1. The rst waypoint on the list appears
highlighted, and the corresponding data of the selected waypoint is shown in the DO area. As the cursor is
moved to a dierent waypoint so the data changes matching the newly selected waypoint. If the waypoints
list is empty a list of available actions is shown in the DO area. Since no waypoint exists only the
Insert
new Waypoint
action is available.
Pushing the ENTER key when a waypoint is selected activates the waypoint actions menu (WAM). A list
with the available actions is shown in the DO area Figure 4.3.
Figure 4.3: Waypoints Action Menu
Available WAM options appear in black, otherwise in grey. For example, in Figure 4.3 the option
Delete
WP
is in not available because the Waypoint list is empty.
1
The GPS SD can store up to 442 waypoints.
22
Page 24
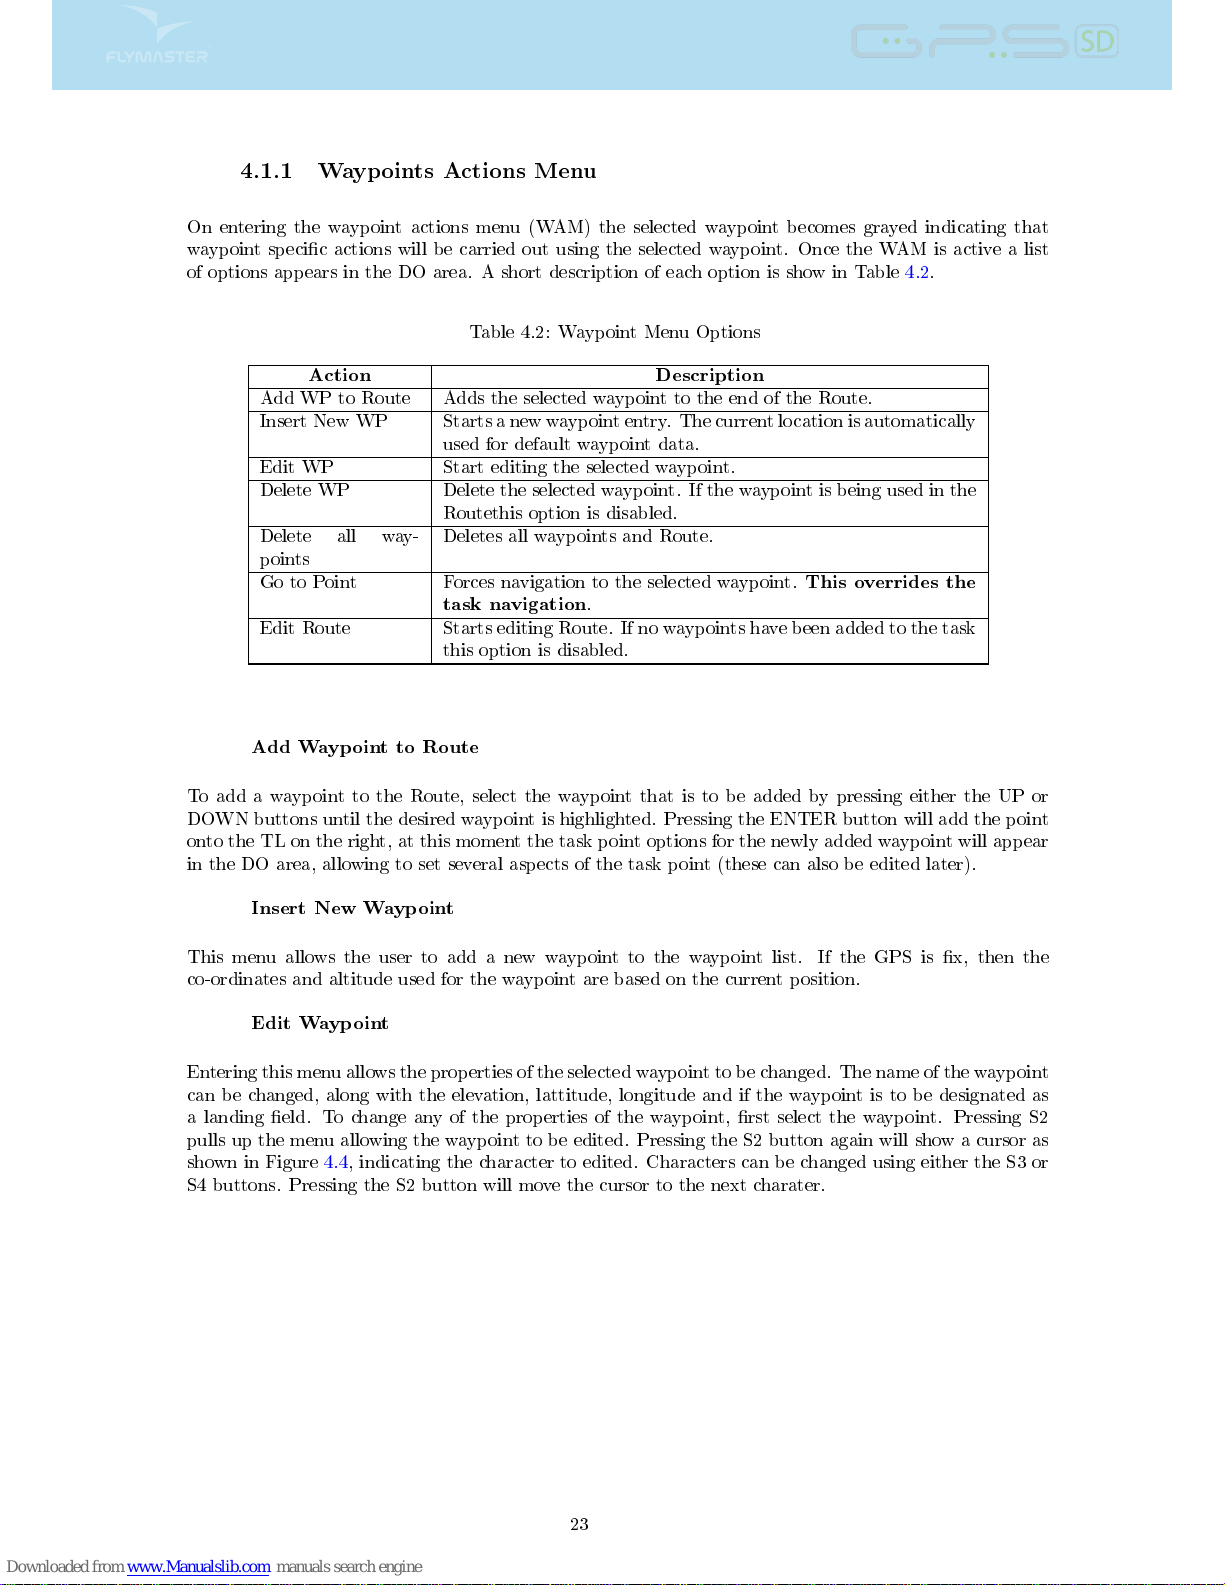
4.1.1 Waypoints Actions Menu
On entering the waypoint actions menu (WAM) the selected waypoint becomes grayed indicating that
waypoint specic actions will be carried out using the selected waypoint. Once the WAM is active a list
of options appears in the DO area. A short description of each option is show in Table 4.2.
Table 4.2: Waypoint Menu Options
Action Description
Add WP to Route Adds the selected waypoint to the end of the Route.
Insert New WP Starts a new waypoint entry. The current location is automatically
used for default waypoint data.
Edit WP Start editing the selected waypoint.
Delete WP Delete the selected waypoint. If the waypoint is being used in the
Routethis option is disabled.
Delete all way-
points
Deletes all waypoints and Route.
Go to Point Forces navigation to the selected waypoint.
This overrides the
task navigation
.
Edit Route Starts editing Route. If no waypoints have been added to the task
this option is disabled.
Add Waypoint to Route
To add a waypoint to the Route, select the waypoint that is to be added by pressing either the UP or
DOWN buttons until the desired waypoint is highlighted. Pressing the ENTER button will add the point
onto the TL on the right, at this moment the task point options for the newly added waypoint will appear
in the DO area, allowing to set several aspects of the task point (these can also be edited later).
Insert New Waypoint
This menu allows the user to add a new waypoint to the waypoint list. If the GPS is x, then the
co-ordinates and altitude used for the waypoint are based on the current position.
Edit Waypoint
Entering this menu allows the properties of the selected waypoint to be changed. The name of the waypoint
can be changed, along with the elevation, lattitude, longitude and if the waypoint is to be designated as
a landing eld. To change any of the properties of the waypoint, rst select the waypoint. Pressing S2
pulls up the menu allowing the waypoint to be edited. Pressing the S2 button again will show a cursor as
shown in Figure 4.4, indicating the character to edited. Characters can be changed using either the S3 or
S4 buttons. Pressing the S2 button will move the cursor to the next charater.
23
Page 25
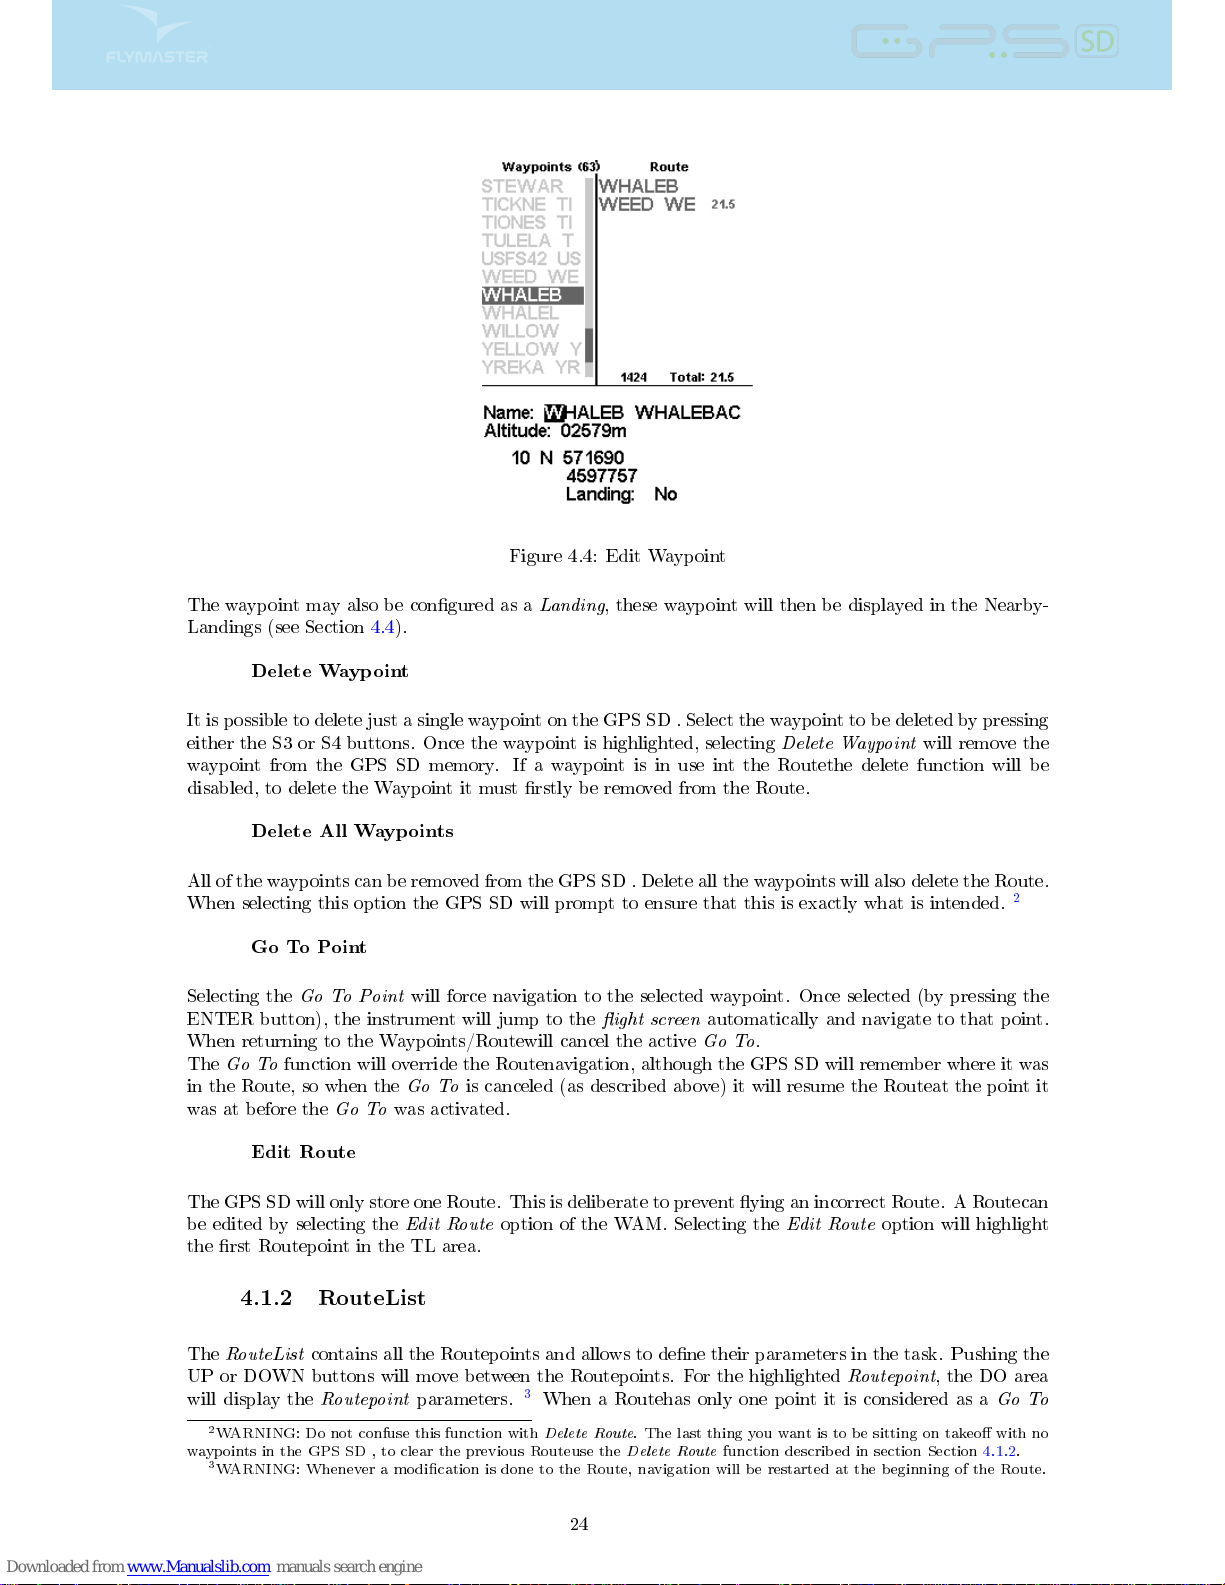
Figure 4.4: Edit Waypoint
The waypoint may also be congured as a
Landing
, these waypoint will then be displayed in the Nearby-
Landings (see Section 4.4).
Delete Waypoint
It is possible to delete just a single waypoint on the GPS SD . Select the waypoint to be deleted by pressing
either the S3 or S4 buttons. Once the waypoint is highlighted, selecting
Delete Waypoint
will remove the
waypoint from the GPS SD memory. If a waypoint is in use int the Routethe delete function will be
disabled, to delete the Waypoint it must rstly be removed from the Route.
Delete All Waypoints
All of the waypoints can be removed from the GPS SD . Delete all the waypoints will also delete the Route.
When selecting this option the GPS SD will prompt to ensure that this is exactly what is intended.
2
Go To Point
Selecting the
Go To Point
will force navigation to the selected waypoint. Once selected (by pressing the
ENTER button), the instrument will jump to the
ight screen
automatically and navigate to that point.
When returning to the Waypoints/Routewill cancel the active
Go To
.
The
Go To
function will override the Routenavigation, although the GPS SD will remember where it was
in the Route, so when the
Go To
is canceled (as described above) it will resume the Routeat the point it
was at before the
Go To
was activated.
Edit Route
The GPS SD will only store one Route. This is deliberate to prevent ying an incorrect Route. A Routecan
be edited by selecting the
Edit Route
option of the WAM. Selecting the
Edit Route
option will highlight
the rst Routepoint in the TL area.
4.1.2 RouteList
The
RouteList
contains all the Routepoints and allows to dene their parameters in the task. Pushing the
UP or DOWN buttons will move between the Routepoints. For the highlighted
Routepoint
, the DO area
will display the
Routepoint
parameters.3When a Routehas only one point it is considered as a
Go To
2
WARNING: Do not confuse this function with
Delete Route
. The last thing you want is to be sitting on takeo with no
waypoints in the GPS SD , to clear the previous Routeuse the
Delete Route
function described in section Section 4.1.2.
3
WARNING: Whenever a modication is done to the Route, navigation will be restarted at the beginning of the Route.
24
Page 26
type route. The GPS SD will automatically start navigating to that point.
Note: When the Routecontains more than one point then the rst turn point will automat-
ically be set as
Take-O
. The
Take-o
is ignored for navigation proposes and is only used for
calculating the total task distance.
Pushing ENTER while on a selected Routepoint will open a
RoutePoint Menu
in the DO area (at the
bottom of the screen), which will allow you to
Edit,MoveorRemove
a point from the Route. Each
Routepoint
dened has a particular type, by default it will be set to Cylinder .
Move Route Point
The order of a task point can be easily changed. To change the order simply select the waypoint using
the UP, and DOWN buttons. Push the ENTER button to activate the actions menu list. Then select the
Move Route Point
option, and push ENTER button. A cursor will be shown next to the selected waypoint.
Using the UP and DOWN buttons move the task point to the desired position and push ENTER.
Remove Route Point
To remove a task point select it using UP, and DOWN buttons, and then pushing the ENTER button to
activate the Task Point Menu, chose the
Remove Route Point
option and push ENTER to remove it from
the list.
Delete Route
Delete Routewill delete the entire route. On any waypoint push the ENTER button to activate the actions
menu list. Select the
Delete Route
option from the menu, and push the ENTER button to conrm. The
route will be deleted and the WL area activated.
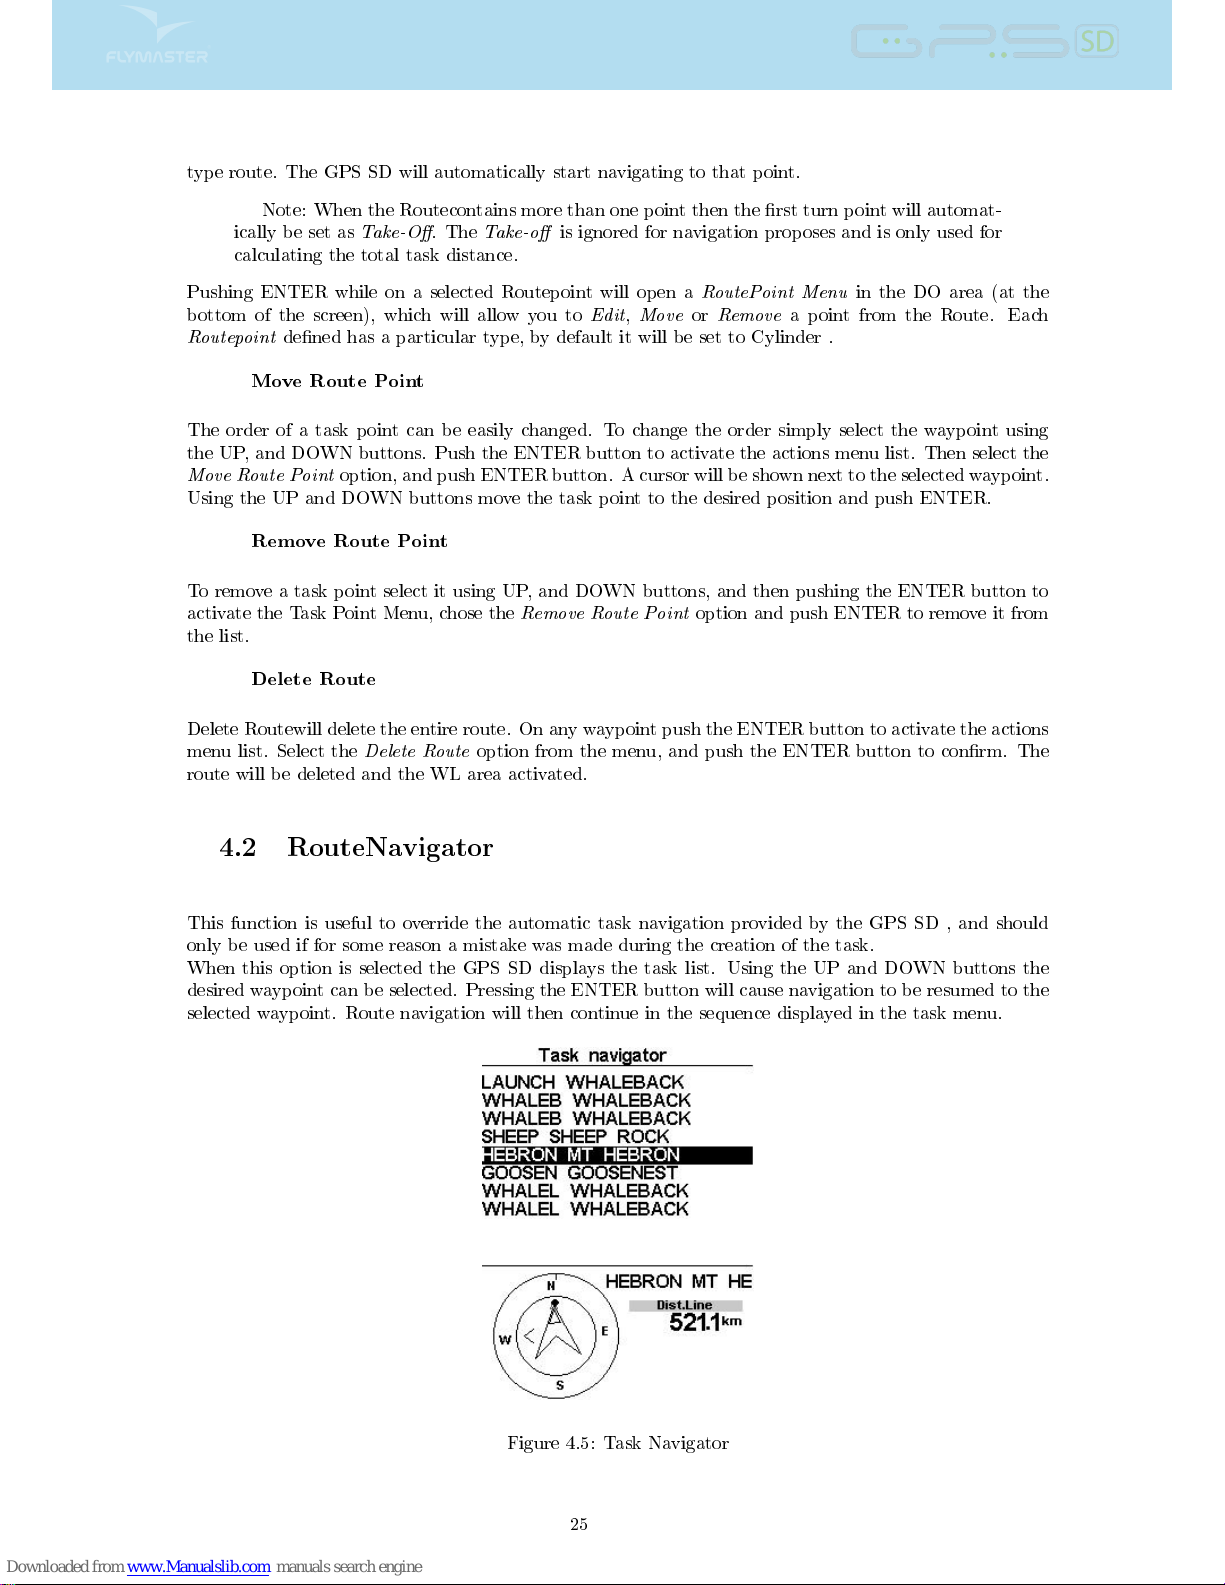
4.2 RouteNavigator
This function is useful to override the automatic task navigation provided by the GPS SD , and should
only be used if for some reason a mistake was made during the creation of the task.
When this option is selected the GPS SD displays the task list. Using the UP and DOWN buttons the
desired waypoint can be selected. Pressing the ENTER button will cause navigation to be resumed to the
selected waypoint. Route navigation will then continue in the sequence displayed in the task menu.
Figure 4.5: Task Navigator
25
Page 27
When entering into the Task Navigator menu, all of the route points are shown as both the short name
and long name (Figure 4.5). Selecting any of the routepoints will show a navigation wheel in the lower
part of the screen showing the direction to that point along with the distance to the waypoint cylinder.
The distance shown is the Distance to Line, which is the closest point on the cylinder to where the pilot
is. This is not necessarily the optimum point on the cylinder.
The
Start
waypoint will be grayed since it is not possible to navigate to a start. Pressing the menu button
will get you back to the ight screen without any change to the navigation.
Note: An override to the navigation will assume that the start has been done.
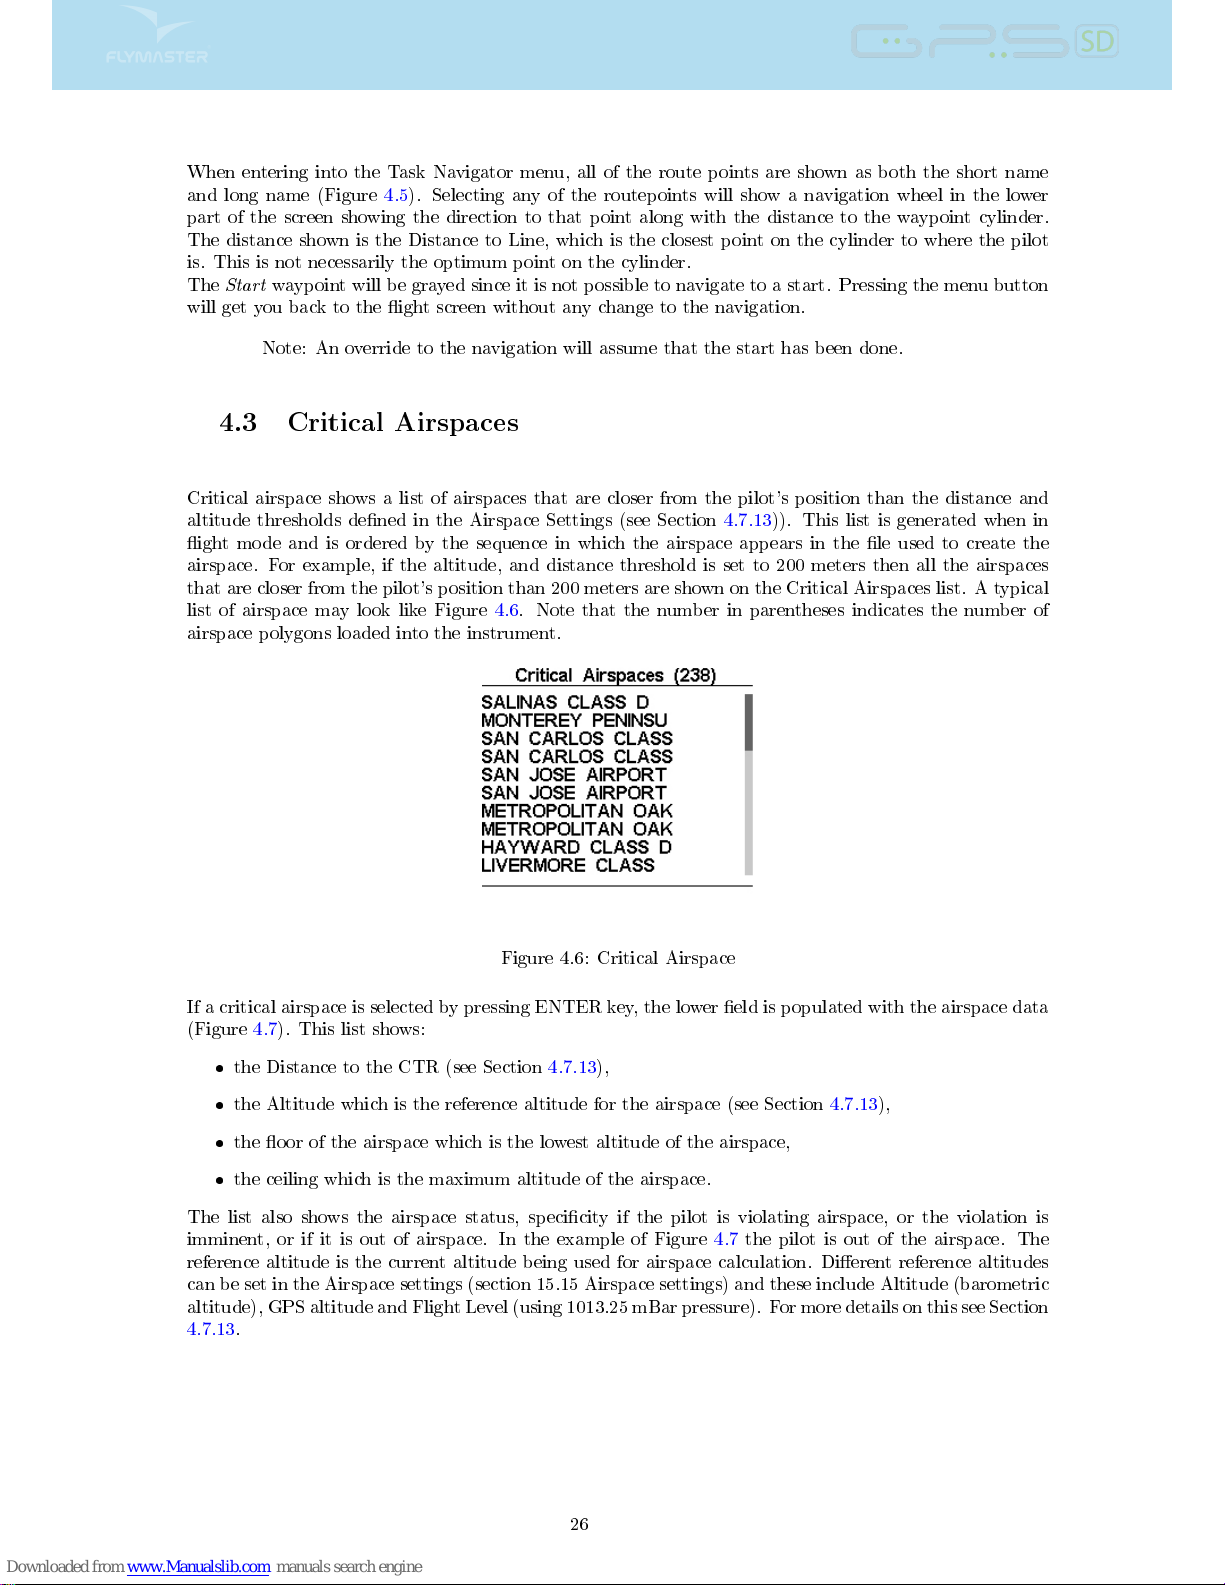
4.3 Critical Airspaces
Critical airspace shows a list of airspaces that are closer from the pilot's position than the distance and
altitude thresholds dened in the Airspace Settings (see Section 4.7.13)). This list is generated when in
ight mode and is ordered by the sequence in which the airspace appears in the le used to create the
airspace. For example, if the altitude, and distance threshold is set to 200 meters then all the airspaces
that are closer from the pilot's position than 200 meters are shown on the Critical Airspaces list. A typical
list of airspace may look like Figure 4.6. Note that the number in parentheses indicates the number of
airspace polygons loaded into the instrument.
Figure 4.6: Critical Airspace
If a critical airspace is selected by pressing ENTER key, the lower eld is populated with the airspace data
(Figure 4.7). This list shows:
the Distance to the CTR (see Section 4.7.13),
the Altitude which is the reference altitude for the airspace (see Section 4.7.13),
the oor of the airspace which is the lowest altitude of the airspace,
the ceiling which is the maximum altitude of the airspace.
The list also shows the airspace status, specicity if the pilot is violating airspace, or the violation is
imminent, or if it is out of airspace. In the example of Figure 4.7 the pilot is out of the airspace. The
reference altitude is the current altitude being used for airspace calculation. Dierent reference altitudes
can be set in the Airspace settings (section 15.15 Airspace settings) and these include Altitude (barometric
altitude), GPS altitude and Flight Level (using 1013.25 mBar pressure). For more details on this see Section
4.7.13.
26
Page 28
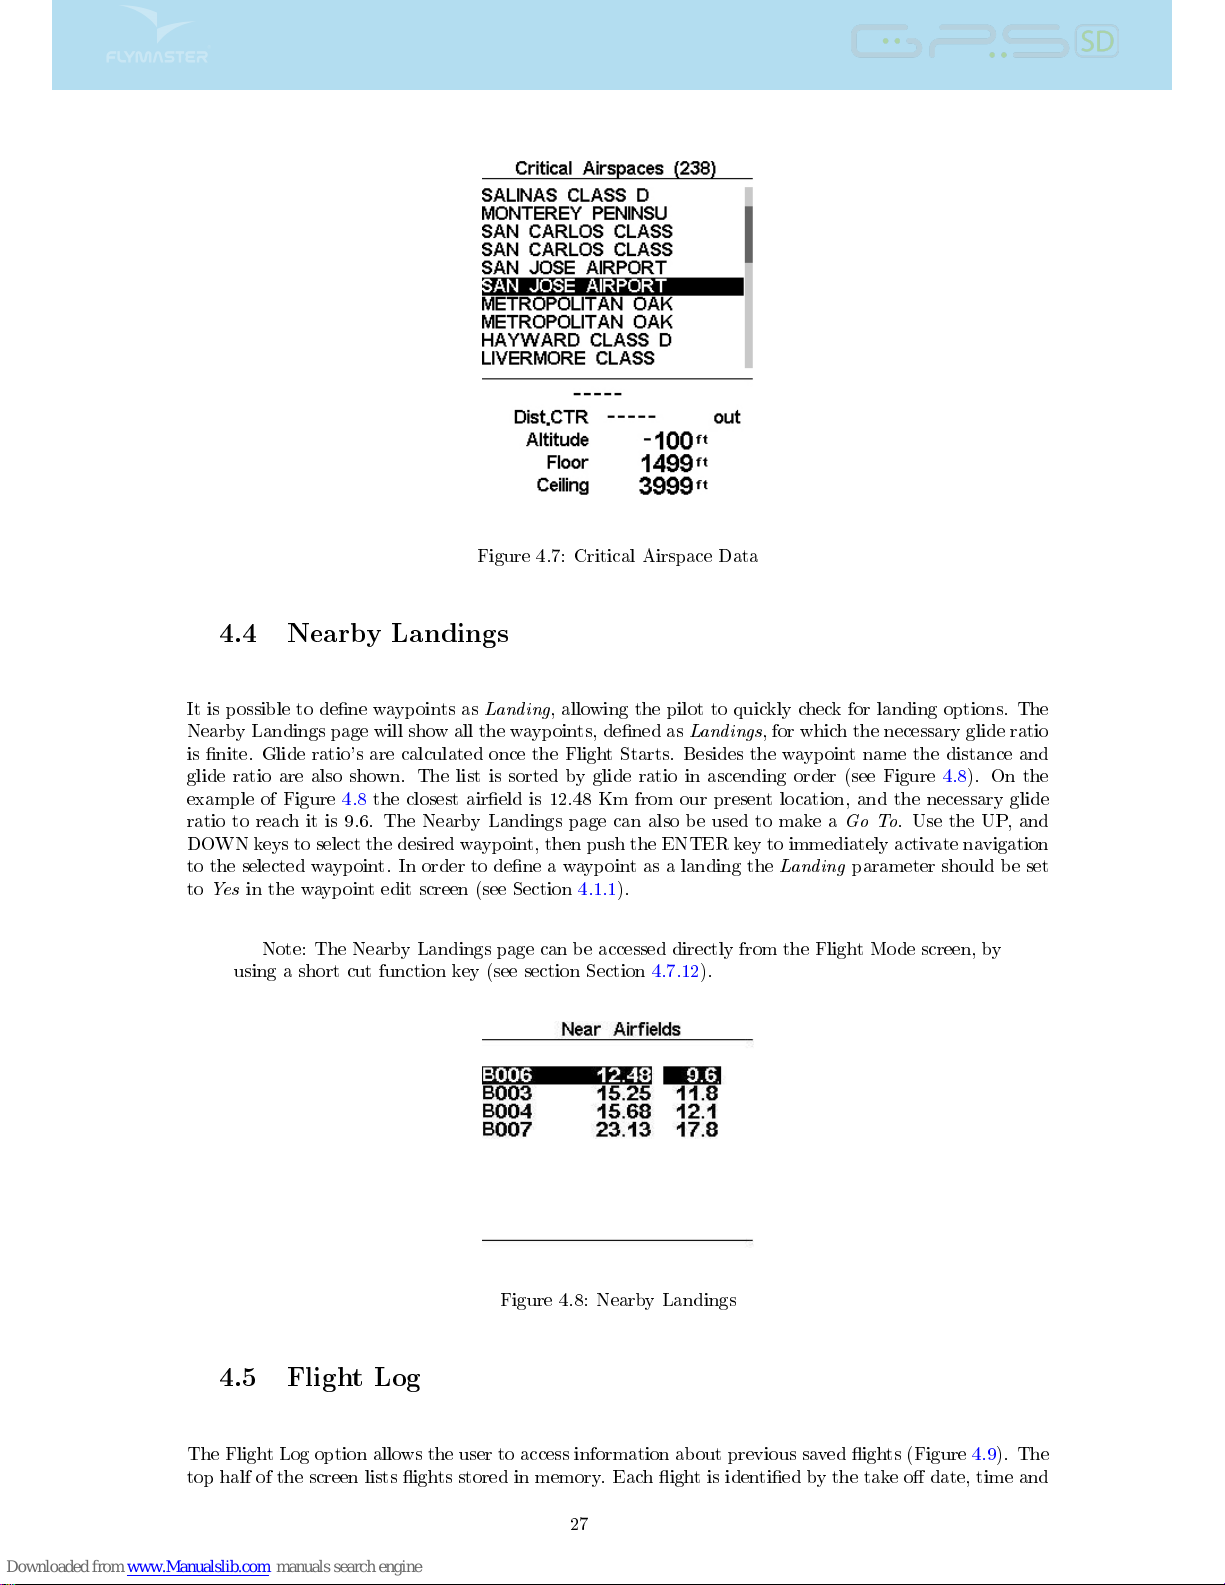
Figure 4.7: Critical Airspace Data
4.4 Nearby Landings
It is possible to dene waypoints as
Landing
, allowing the pilot to quickly check for landing options. The
Nearby Landings page will show all the waypoints, dened as
Landings
, for which the necessary glide ratio
is nite. Glide ratio's are calculated once the Flight Starts. Besides the waypoint name the distance and
glide ratio are also shown. The list is sorted by glide ratio in ascending order (see Figure 4.8). On the
example of Figure 4.8 the closest aireld is 12.48 Km from our present location, and the necessary glide
ratio to reach it is 9.6. The Nearby Landings page can also be used to make a
Go To
. Use the UP, and
DOWN keys to select the desired waypoint, then push the ENTER key to immediately activate navigation
to the selected waypoint. In order to dene a waypoint as a landing the
Landing
parameter should be set
to
Yes
in the waypoint edit screen (see Section 4.1.1).
Note: The Nearby Landings page can be accessed directly from the Flight Mode screen, by
using a short cut function key (see section Section 4.7.12).
Figure 4.8: Nearby Landings
4.5 Flight Log
The Flight Log option allows the user to access information about previous saved ights (Figure 4.9). The
top half of the screen lists ights stored in memory. Each ight is identied by the take o date, time and
27
Page 29
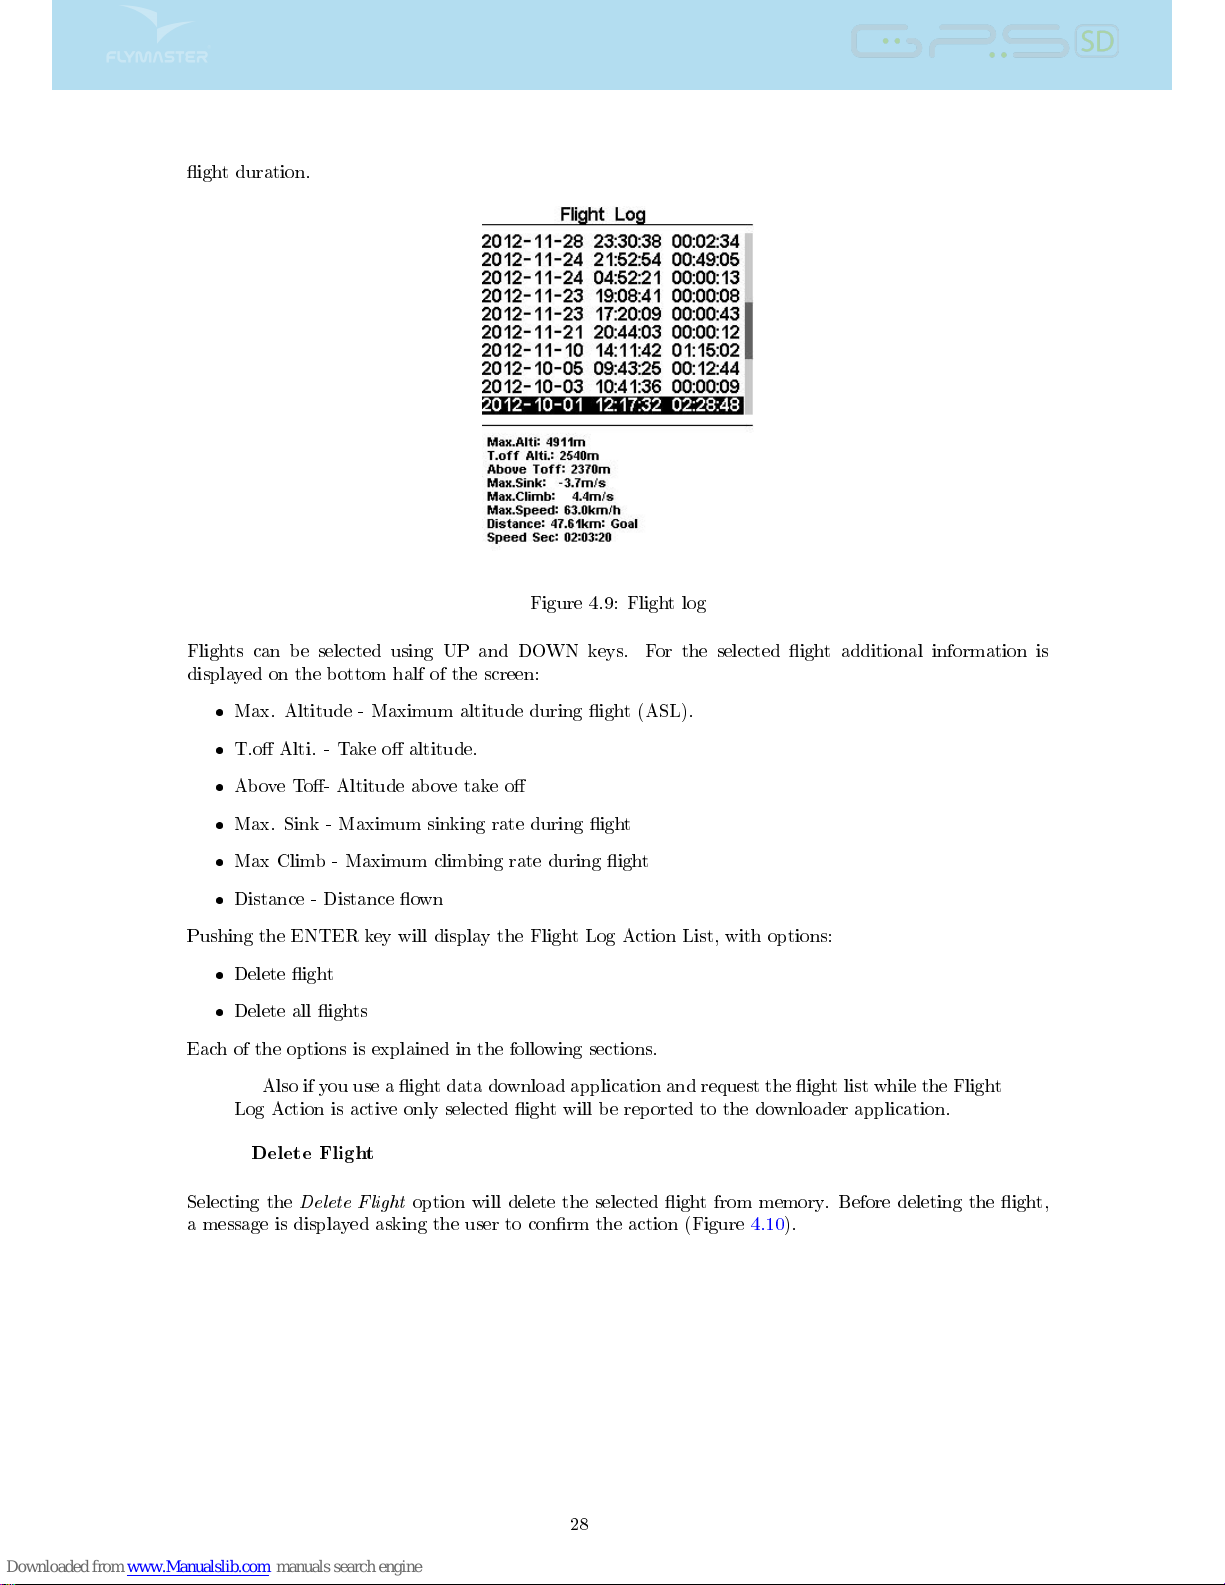
ight duration.
Figure 4.9: Flight log
Flights can be selected using UP and DOWN keys. For the selected ight additional information is
displayed on the bottom half of the screen:
Max. Altitude - Maximum altitude during ight (ASL).
T.o Alti. - Take o altitude.
Above To- Altitude above take o
Max. Sink - Maximum sinking rate during ight
Max Climb - Maximum climbing rate during ight
Distance - Distance own
Pushing the ENTER key will display the Flight Log Action List, with options:
Delete ight
Delete all ights
Each of the options is explained in the following sections.
Also if you use a ight data download application and request the ight list while the Flight
Log Action is active only selected ight will be reported to the downloader application.
Delete Flight
Selecting the
Delete Flight
option will delete the selected ight from memory. Before deleting the ight,
a message is displayed asking the user to conrm the action (Figure 4.10).
28
Page 30
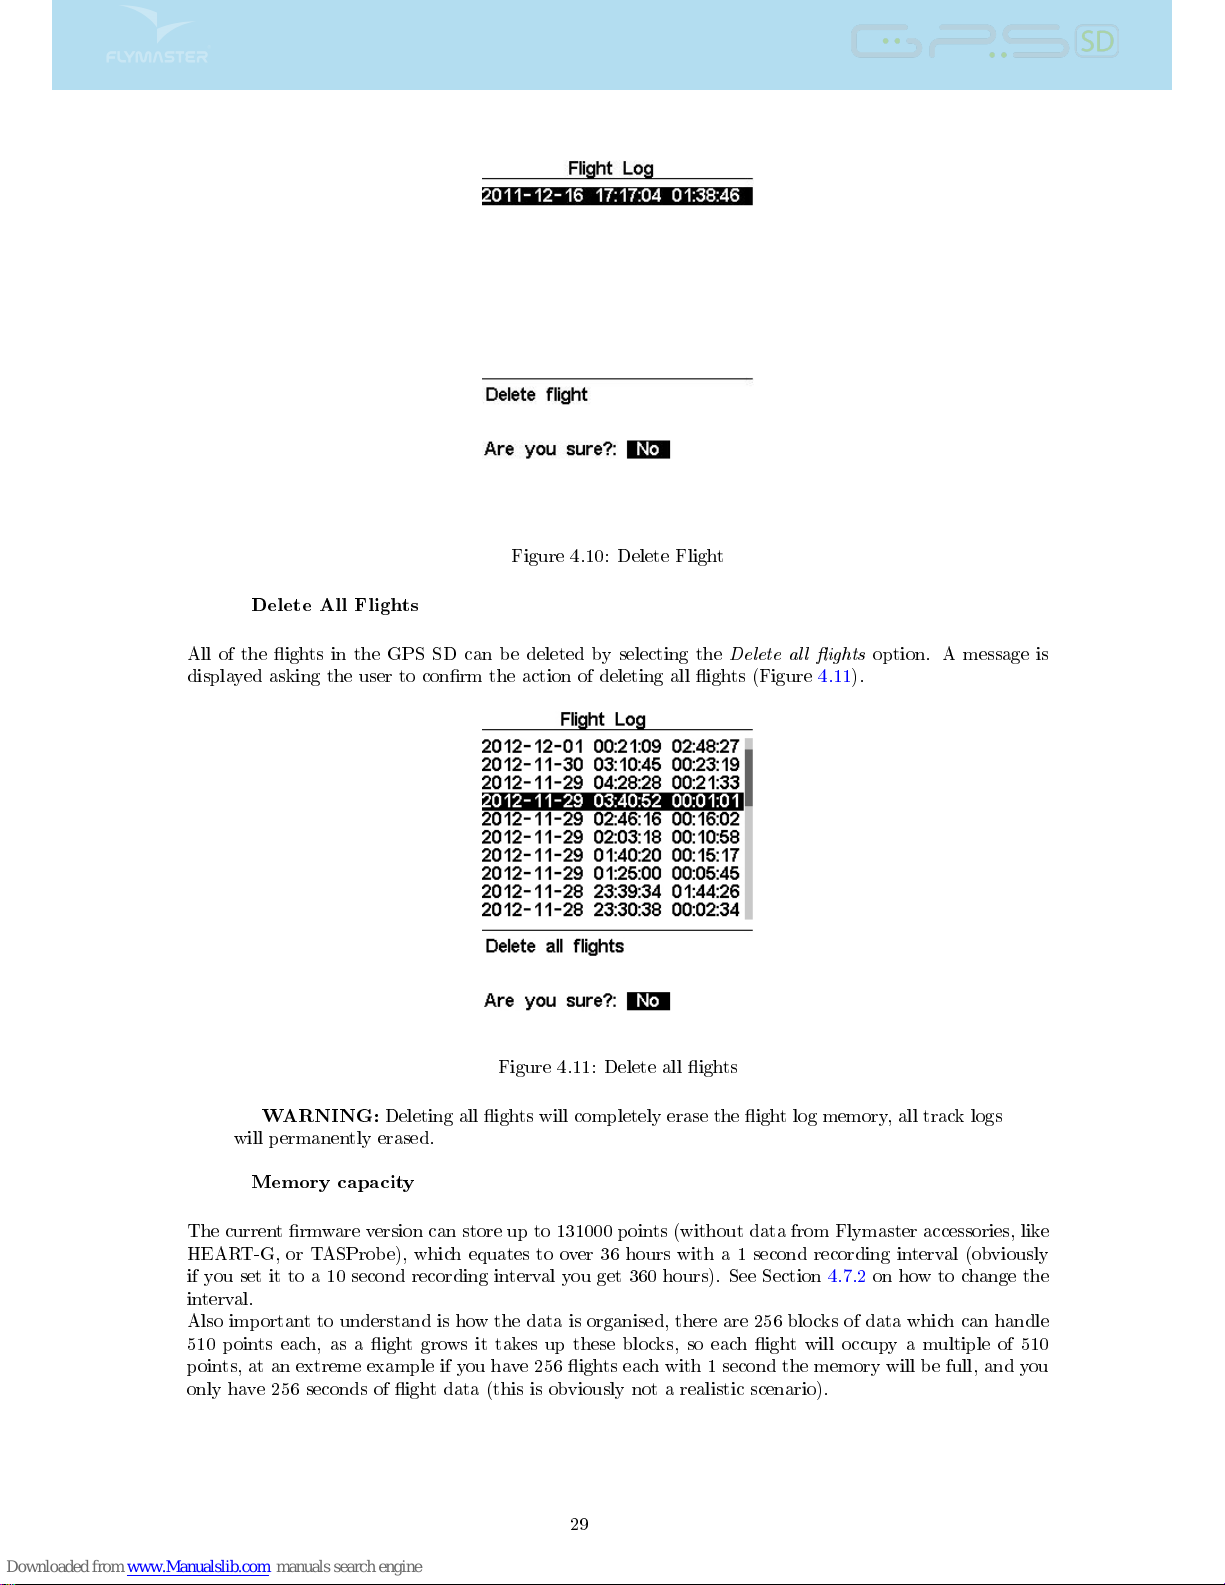
Figure 4.10: Delete Flight
Delete All Flights
All of the ights in the GPS SD can be deleted by selecting the
Delete all ights
option. A message is
displayed asking the user to conrm the action of deleting all ights (Figure 4.11).
Figure 4.11: Delete all ights
WARNING:
Deleting all ights will completely erase the ight log memory, all track logs
will permanently erased.
Memory capacity
The current rmware version can store up to 131000 points (without data from Flymaster accessories, like
HEART-G, or TASProbe), which equates to over 36 hours with a 1 second recording interval (obviously
if you set it to a 10 second recording interval you get 360 hours). See Section 4.7.2 on how to change the
interval.
Also important to understand is how the data is organised, there are 256 blocks of data which can handle
510 points each, as a ight grows it takes up these blocks, so each ight will occupy a multiple of 510
points, at an extreme example if you have 256 ights each with 1 second the memory will be full, and you
only have 256 seconds of ight data (this is obviously not a realistic scenario).
29
Page 31
4.6 Pages
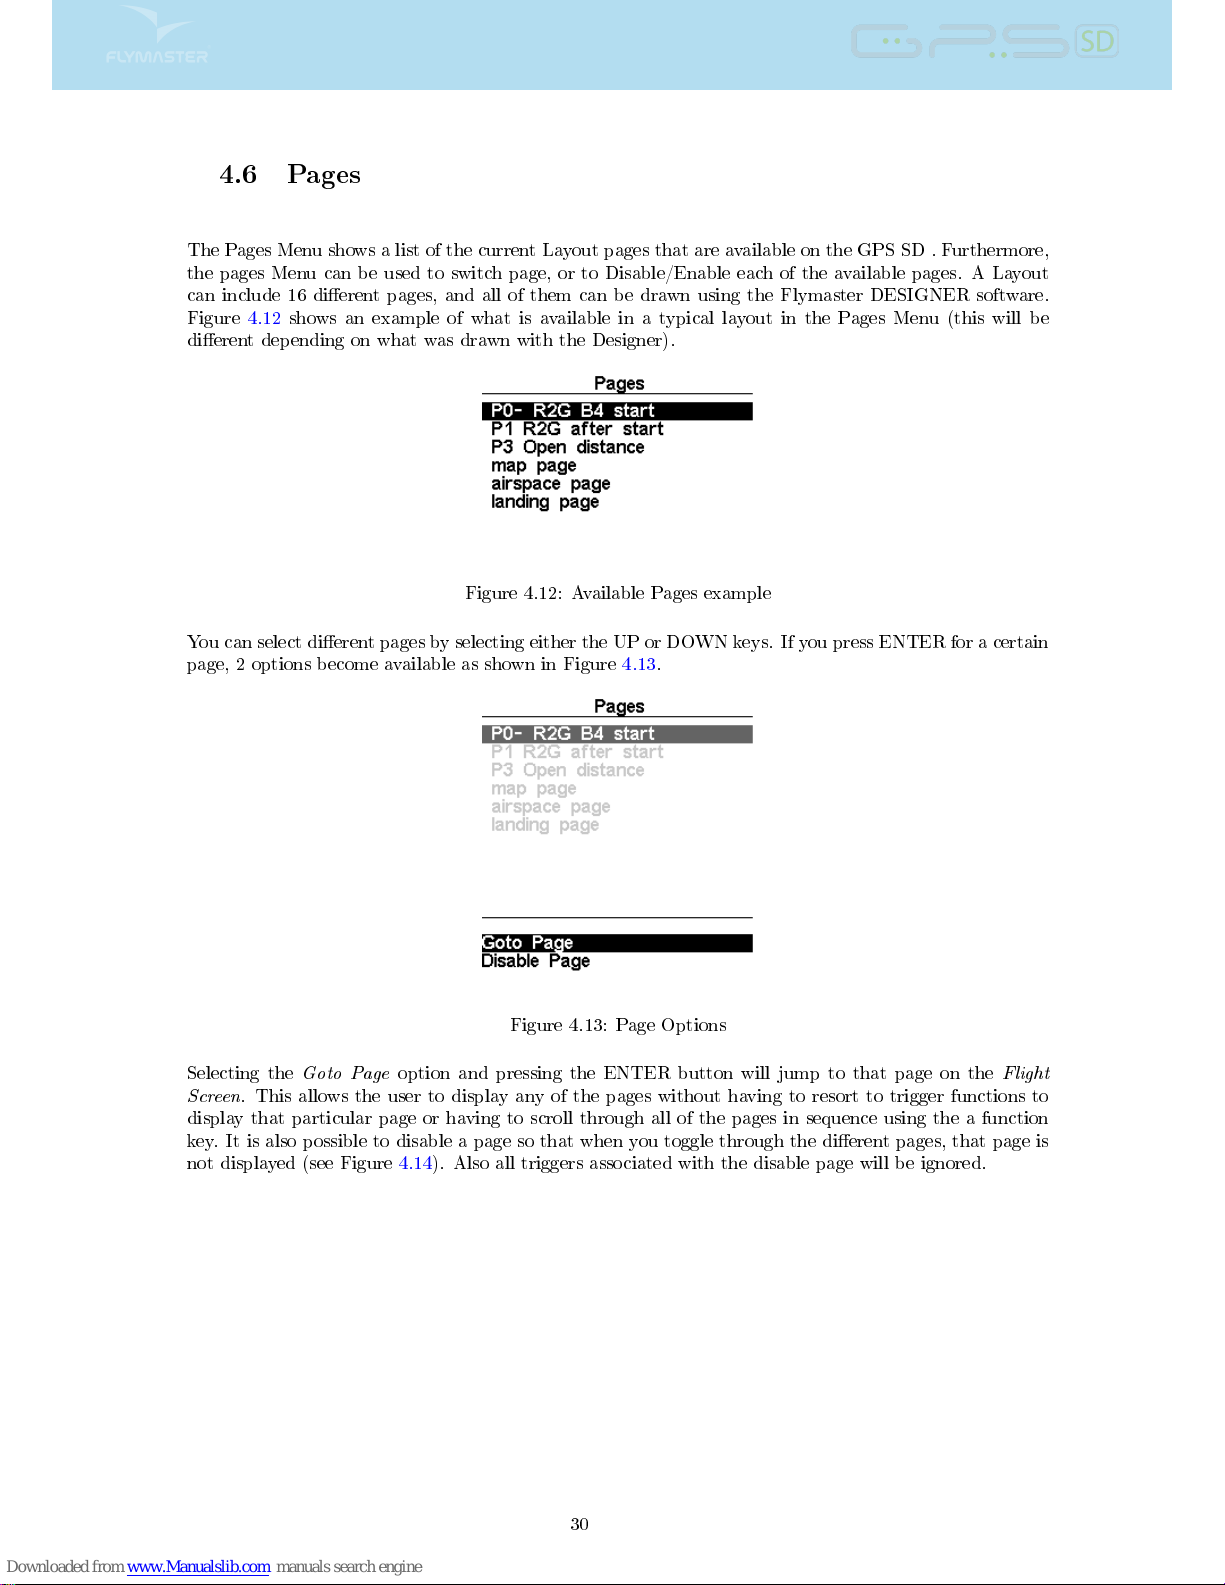
The Pages Menu shows a list of the current Layout pages that are available on the GPS SD . Furthermore,
the pages Menu can be used to switch page, or to Disable/Enable each of the available pages. A Layout
can include 16 dierent pages, and all of them can be drawn using the Flymaster DESIGNER software.
Figure 4.12 shows an example of what is available in a typical layout in the Pages Menu (this will be
dierent depending on what was drawn with the Designer).
Figure 4.12: Available Pages example
You can select dierent pages by selecting either the UP or DOWN keys. If you press ENTER for a certain
page, 2 options become available as shown in Figure 4.13.
Figure 4.13: Page Options
Selecting the
Goto Page
option and pressing the ENTER button will jump to that page on the
Flight
Screen
. This allows the user to display any of the pages without having to resort to trigger functions to
display that particular page or having to scroll through all of the pages in sequence using the a function
key. It is also possible to disable a page so that when you toggle through the dierent pages, that page is
not displayed (see Figure 4.14). Also all triggers associated with the disable page will be ignored.
30
Page 32
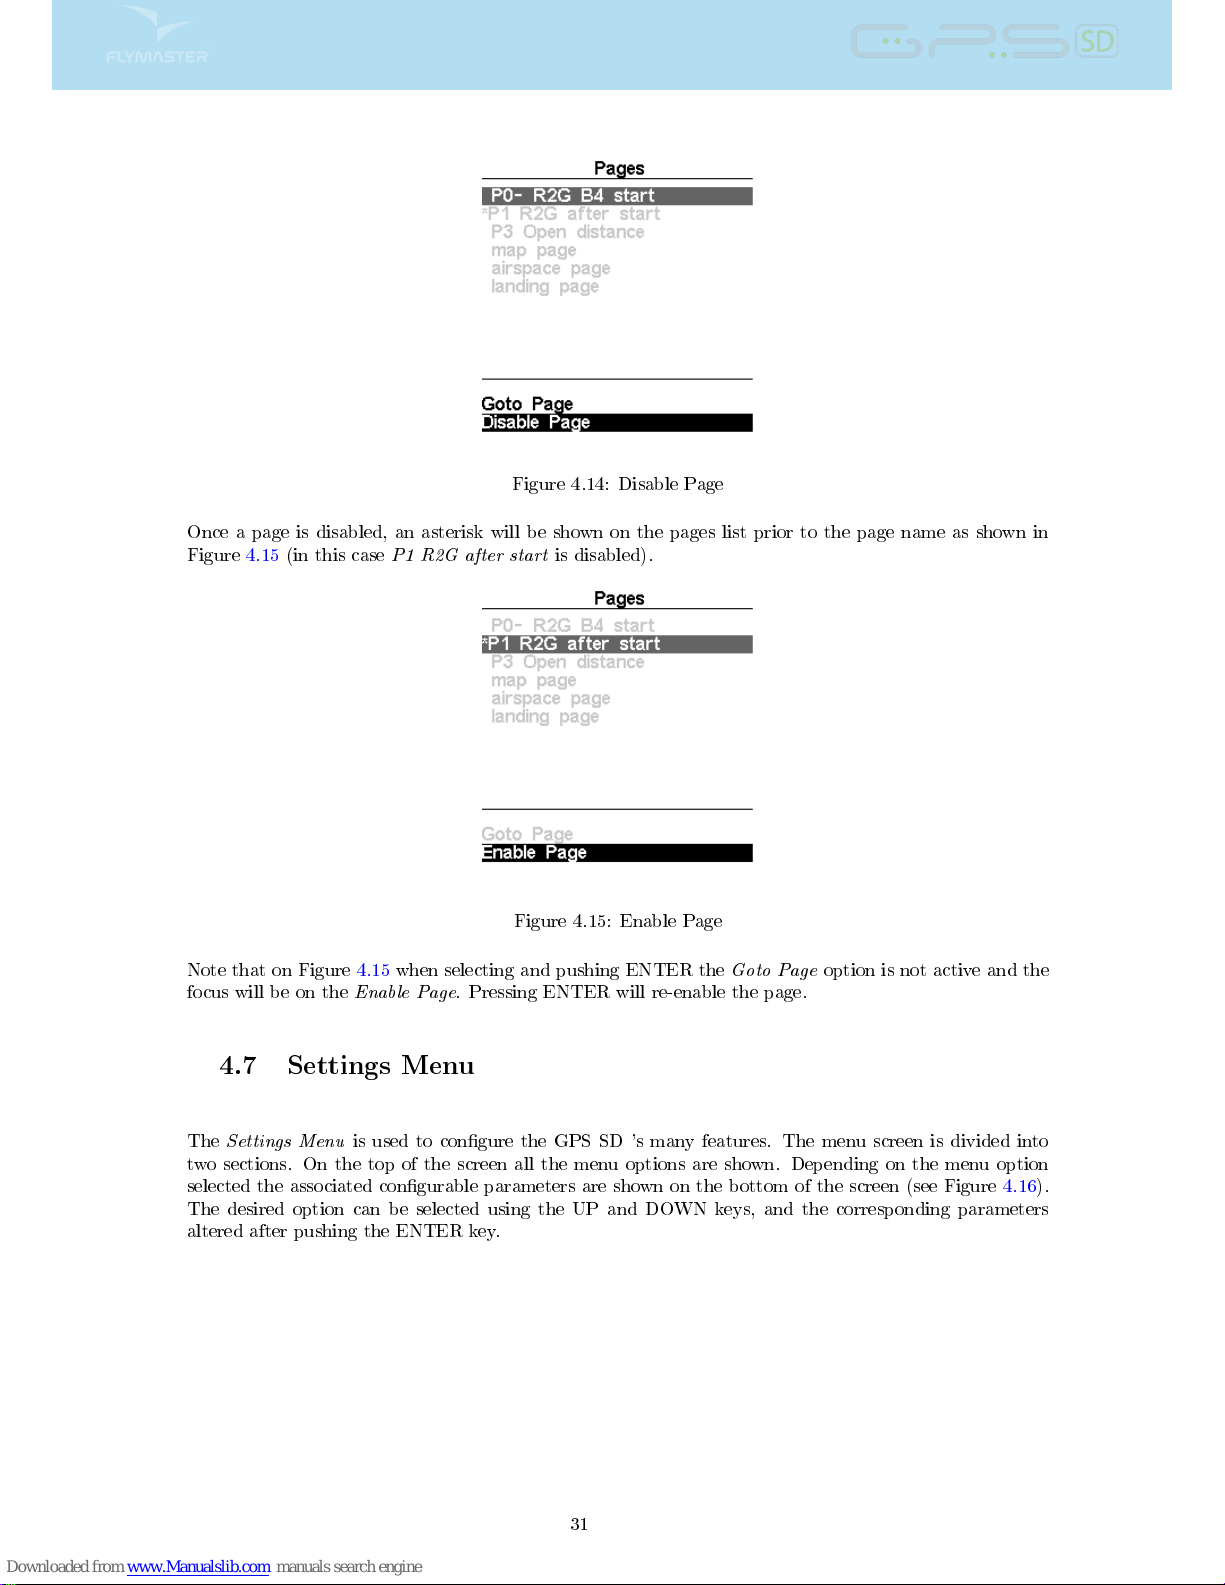
Figure 4.14: Disable Page
Once a page is disabled, an asterisk will be shown on the pages list prior to the page name as shown in
Figure 4.15 (in this case
P1 R2G after start
is disabled).
Figure 4.15: Enable Page
Note that on Figure 4.15 when selecting and pushing ENTER the
Goto Page
option is not active and the
focus will be on the
Enable Page
. Pressing ENTER will re-enable the page.
4.7 Settings Menu
The
Settings Menu
is used to congure the GPS SD 's many features. The menu screen is divided into
two sections. On the top of the screen all the menu options are shown. Depending on the menu option
selected the associated congurable parameters are shown on the bottom of the screen (see Figure 4.16).
The desired option can be selected using the UP and DOWN keys, and the corresponding parameters
altered after pushing the ENTER key.
31
Page 33
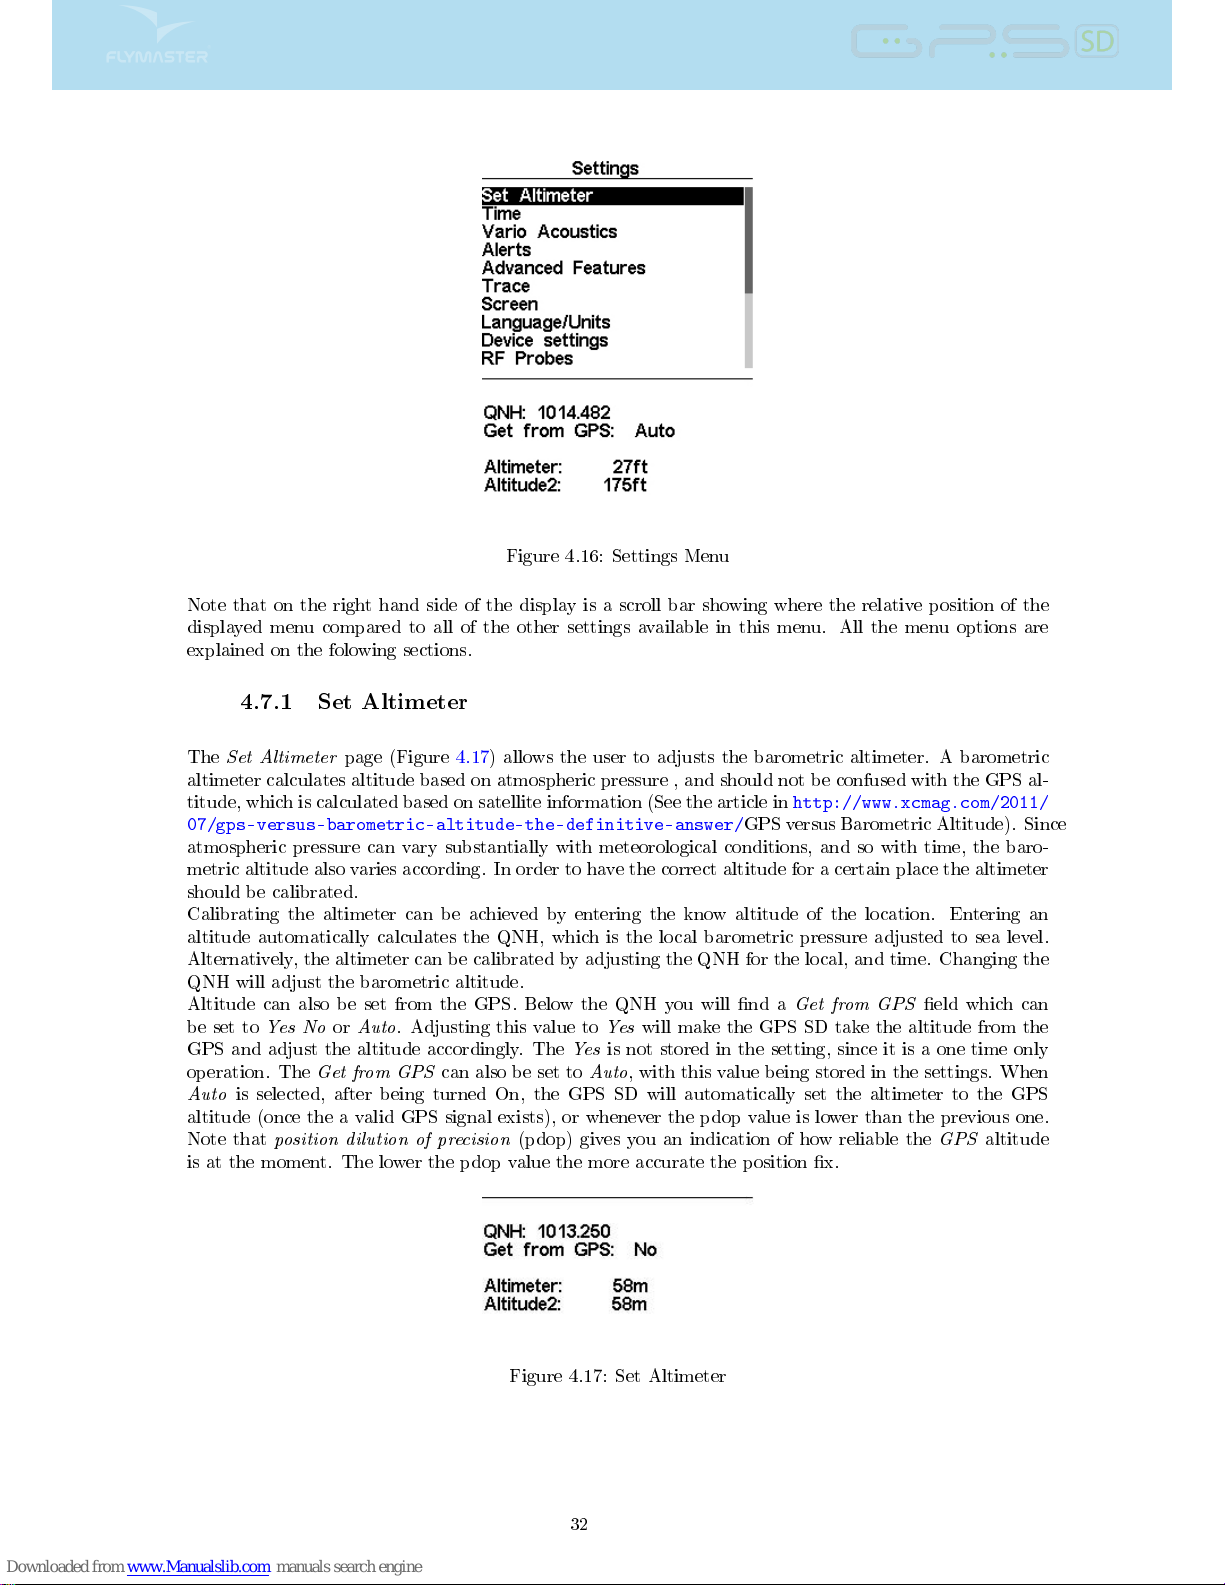
Figure 4.16: Settings Menu
Note that on the right hand side of the display is a scroll bar showing where the relative position of the
displayed menu compared to all of the other settings available in this menu. All the menu options are
explained on the folowing sections.
4.7.1 Set Altimeter
The
Set Altimeter
page (Figure 4.17) allows the user to adjusts the barometric altimeter. A barometric
altimeter calculates altitude based on atmospheric pressure , and should not be confused with the GPS al-
titude, which is calculated based on satellite information (See the article in
http://www.xcmag.com/2011/
07/gps-versus-barometric-altitude-the-definitive-answer/
GPS versus Barometric Altitude). Since
atmospheric pressure can vary substantially with meteorological conditions, and so with time, the baro-
metric altitude also varies according. In order to have the correct altitude for a certain place the altimeter
should be calibrated.
Calibrating the altimeter can be achieved by entering the know altitude of the location. Entering an
altitude automatically calculates the QNH, which is the local barometric pressure adjusted to sea level.
Alternatively, the altimeter can be calibrated by adjusting the QNH for the local, and time. Changing the
QNH will adjust the barometric altitude.
Altitude can also be set from the GPS. Below the QNH you will nd a
Get from GPS
eld which can
be set to
Yes NoorAuto
. Adjusting this value to
Yes
will make the GPS SD take the altitude from the
GPS and adjust the altitude accordingly. The
Yes
is not stored in the setting, since it is a one time only
operation. The
Get from GPS
can also be set to
Auto
, with this value being stored in the settings. When
Auto
is selected, after being turned On, the GPS SD will automatically set the altimeter to the GPS
altitude (once the a valid GPS signal exists), or whenever the pdop value is lower than the previous one.
Note that
position dilution of precision
(pdop) gives you an indication of how reliable the
GPS
altitude
is at the moment. The lower the pdop value the more accurate the position x.
Figure 4.17: Set Altimeter
32
Page 34
4.7.2 Time
The
Time
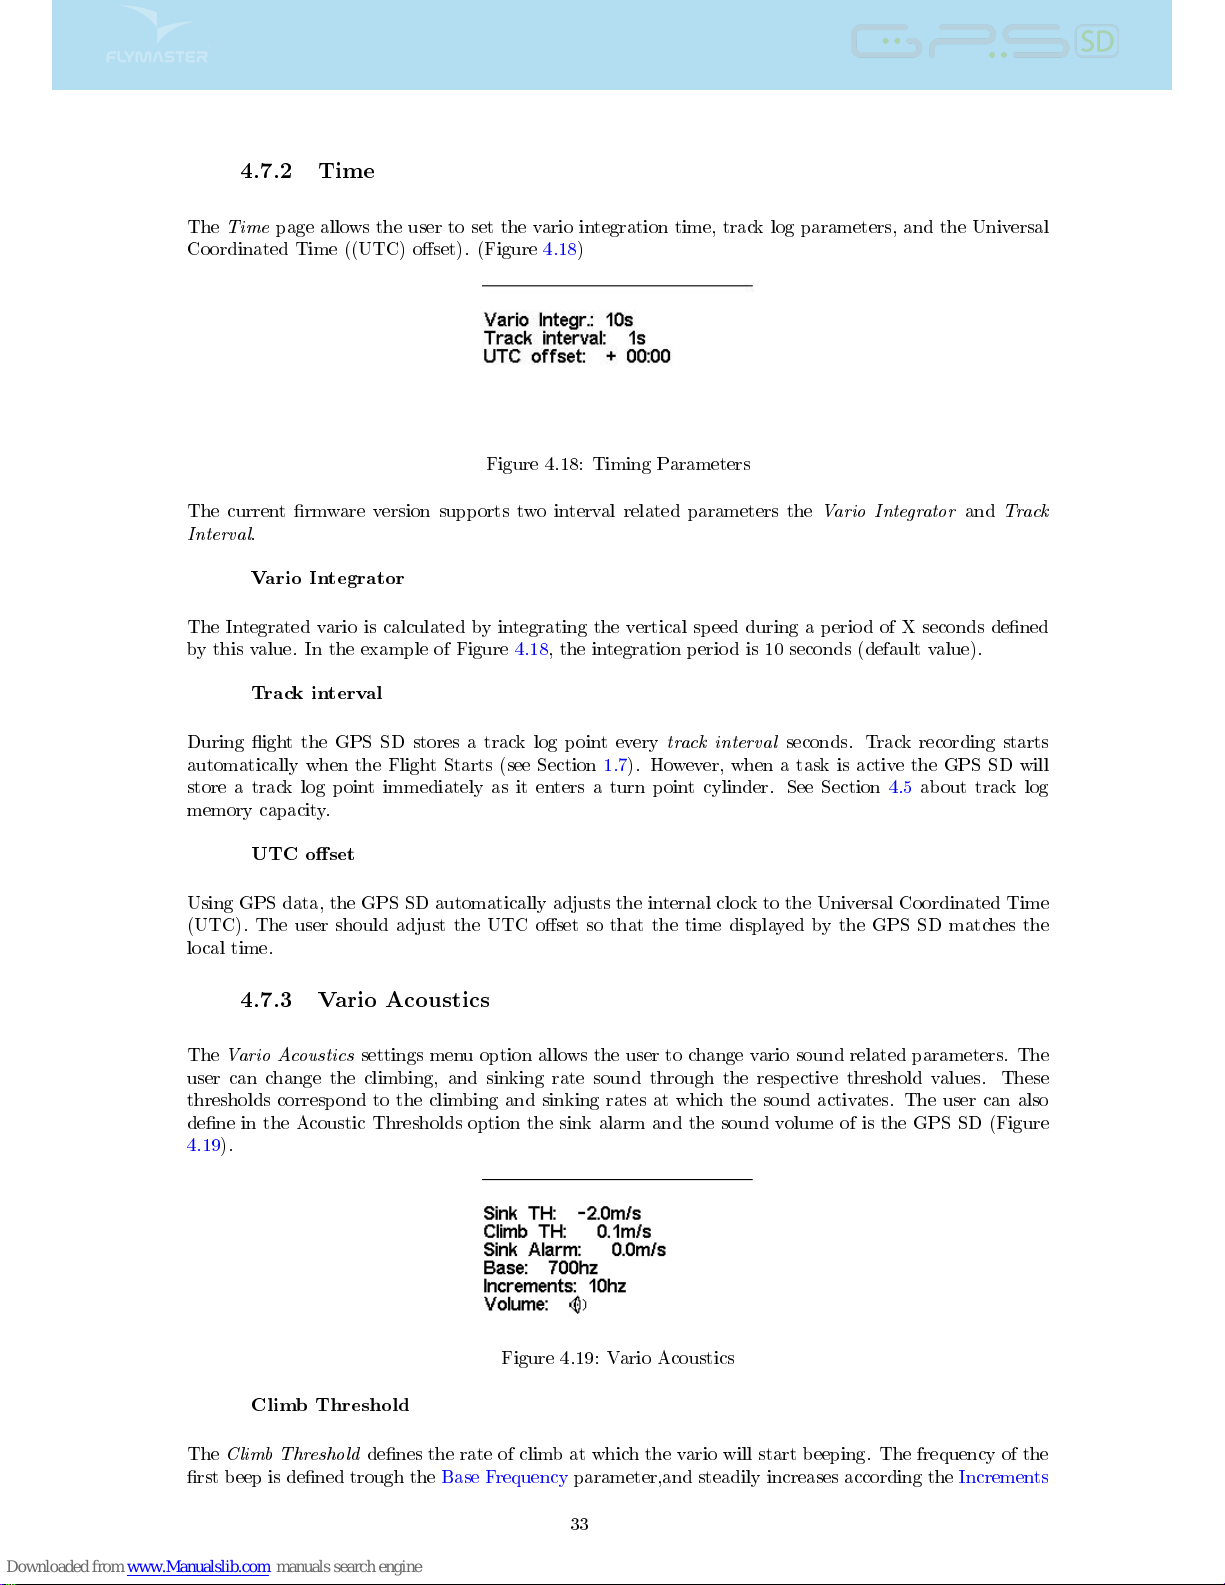
page allows the user to set the vario integration time, track log parameters, and the Universal
Coordinated Time ((UTC) oset). (Figure 4.18)
Figure 4.18: Timing Parameters
The current rmware version supports two interval related parameters the
Vario Integrator
and
Track
Interval
.
Vario Integrator
The Integrated vario is calculated by integrating the vertical speed during a period of X seconds dened
by this value. In the example of Figure 4.18, the integration period is 10 seconds (default value).
Track interval
During ight the GPS SD stores a track log point every
track interval
seconds. Track recording starts
automatically when the Flight Starts (see Section 1.7). However, when a task is active the GPS SD will
store a track log point immediately as it enters a turn point cylinder. See Section 4.5 about track log
memory capacity.
UTC oset
Using GPS data, the GPS SD automatically adjusts the internal clock to the Universal Coordinated Time
(UTC). The user should adjust the UTC oset so that the time displayed by the GPS SD matches the
local time.
4.7.3 Vario Acoustics
The
Vario Acoustics
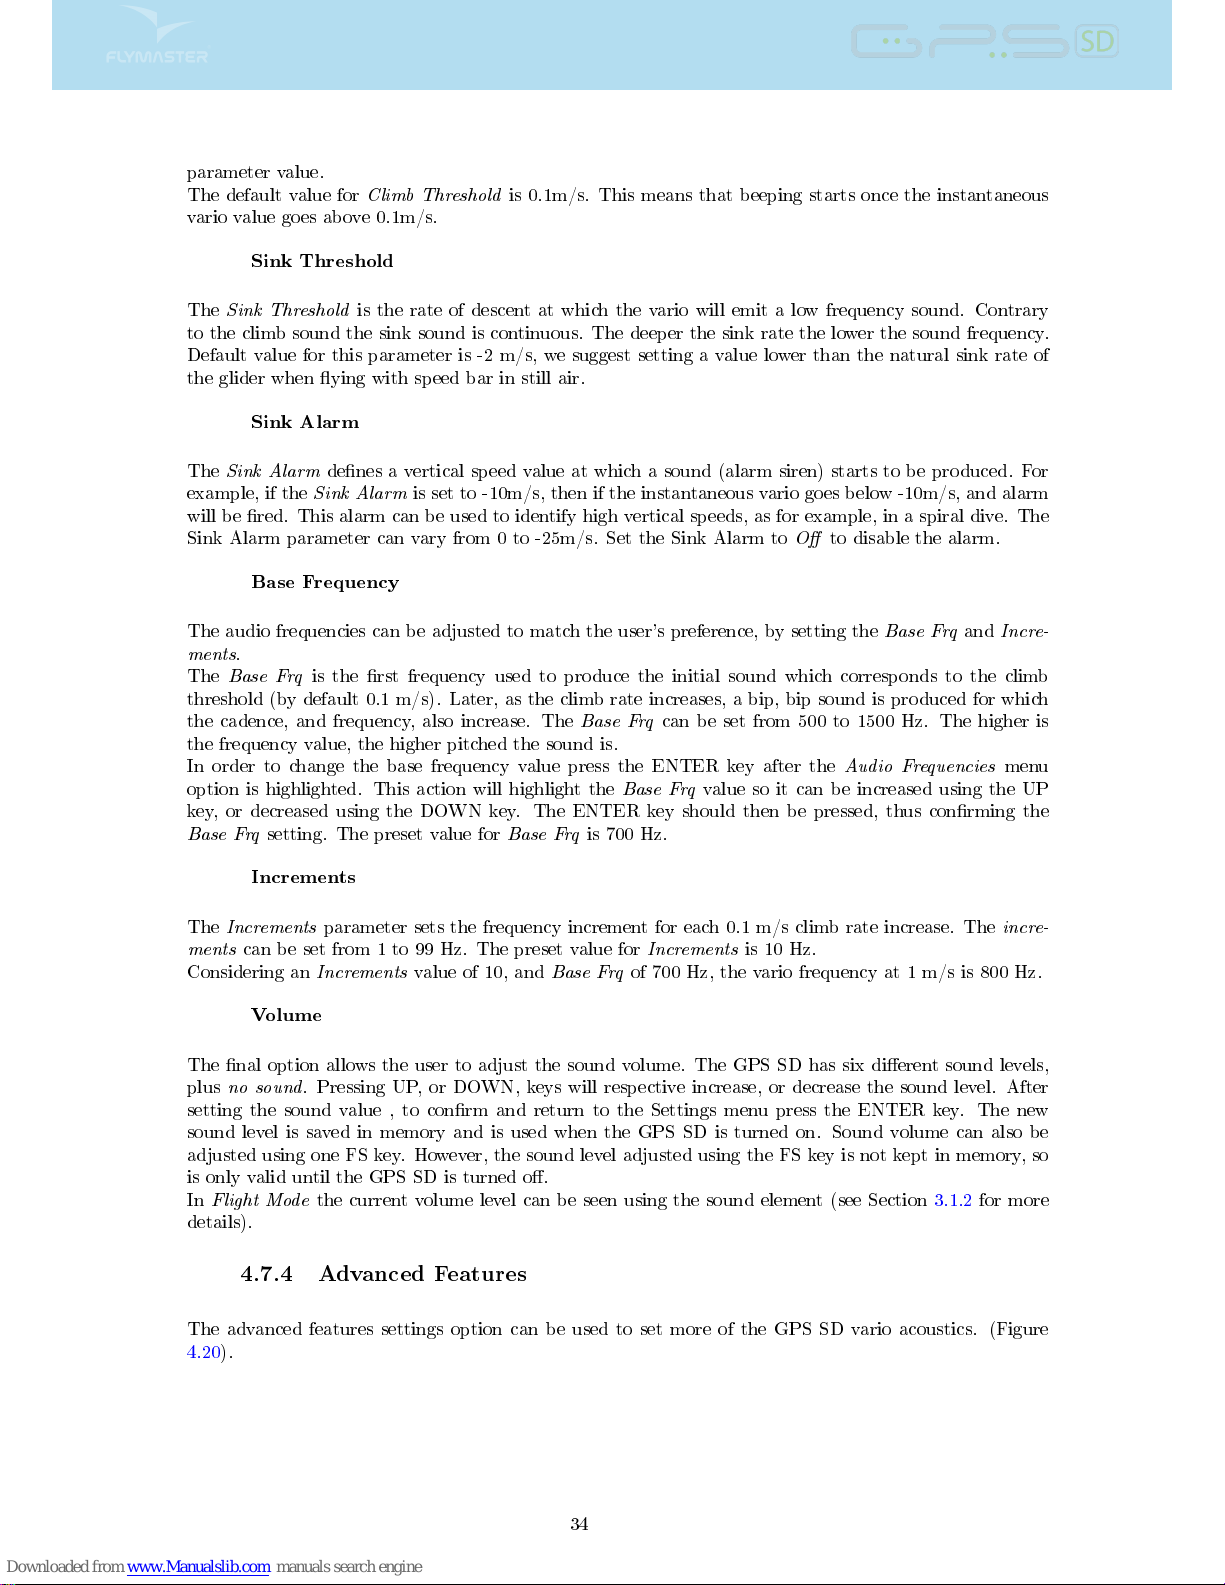
settings menu option allows the user to change vario sound related parameters. The
user can change the climbing, and sinking rate sound through the respective threshold values. These
thresholds correspond to the climbing and sinking rates at which the sound activates. The user can also
dene in the Acoustic Thresholds option the sink alarm and the sound volume of is the GPS SD (Figure
4.19).
Figure 4.19: Vario Acoustics
Climb Threshold
The
Climb Threshold
denes the rate of climb at which the vario will start beeping. The frequency of the
rst beep is dened trough the Base Frequency parameter,and steadily increases according the Increments
33
Page 35
parameter value.
The default value for
Climb Threshold
is 0.1m/s. This means that beeping starts once the instantaneous
vario value goes above 0.1m/s.
Sink Threshold
The
Sink Threshold
is the rate of descent at which the vario will emit a low frequency sound. Contrary
to the climb sound the sink sound is continuous. The deeper the sink rate the lower the sound frequency.
Default value for this parameter is -2 m/s, we suggest setting a value lower than the natural sink rate of
the glider when ying with speed bar in still air.
Sink Alarm
The
Sink Alarm
denes a vertical speed value at which a sound (alarm siren) starts to be produced. For
example, if the
Sink Alarm
is set to -10m/s, then if the instantaneous vario goes below -10m/s, and alarm
will be red. This alarm can be used to identify high vertical speeds, as for example, in a spiral dive. The
Sink Alarm parameter can vary from 0 to -25m/s. Set the Sink Alarm to
O
to disable the alarm.
Base Frequency
The audio frequencies can be adjusted to match the user's preference, by setting the
Base Frq
and
Incre-
ments
.
The
Base Frq
is the rst frequency used to produce the initial sound which corresponds to the climb
threshold (by default 0.1 m/s). Later, as the climb rate increases, a bip, bip sound is produced for which
the cadence, and frequency, also increase. The
Base Frq
can be set from 500 to 1500 Hz. The higher is
the frequency value, the higher pitched the sound is.
In order to change the base frequency value press the ENTER key after the
Audio Frequencies
menu
option is highlighted. This action will highlight the
Base Frq
value so it can be increased using the UP
key, or decreased using the DOWN key. The ENTER key should then be pressed, thus conrming the
Base Frq
setting. The preset value for
Base Frq
is 700 Hz.
Increments
The
Increments
parameter sets the frequency increment for each 0.1 m/s climb rate increase. The
incre-
ments
can be set from 1 to 99 Hz. The preset value for
Increments
is 10 Hz.
Considering an
Increments
value of 10, and
Base Frq
of 700 Hz, the vario frequency at 1 m/s is 800 Hz.
Volume
The nal option allows the user to adjust the sound volume. The GPS SD has six dierent sound levels,
plus
no sound
. Pressing UP, or DOWN, keys will respective increase, or decrease the sound level. After
setting the sound value , to conrm and return to the Settings menu press the ENTER key. The new
sound level is saved in memory and is used when the GPS SD is turned on. Sound volume can also be
adjusted using one FS key. However, the sound level adjusted using the FS key is not kept in memory, so
is only valid until the GPS SD is turned o.
In
Flight Mode
the current volume level can be seen using the sound element (see Section 3.1.2 for more
details).
4.7.4 Advanced Features
The advanced features settings option can be used to set more of the GPS SD vario acoustics. (Figure
4.20).
34
Page 36
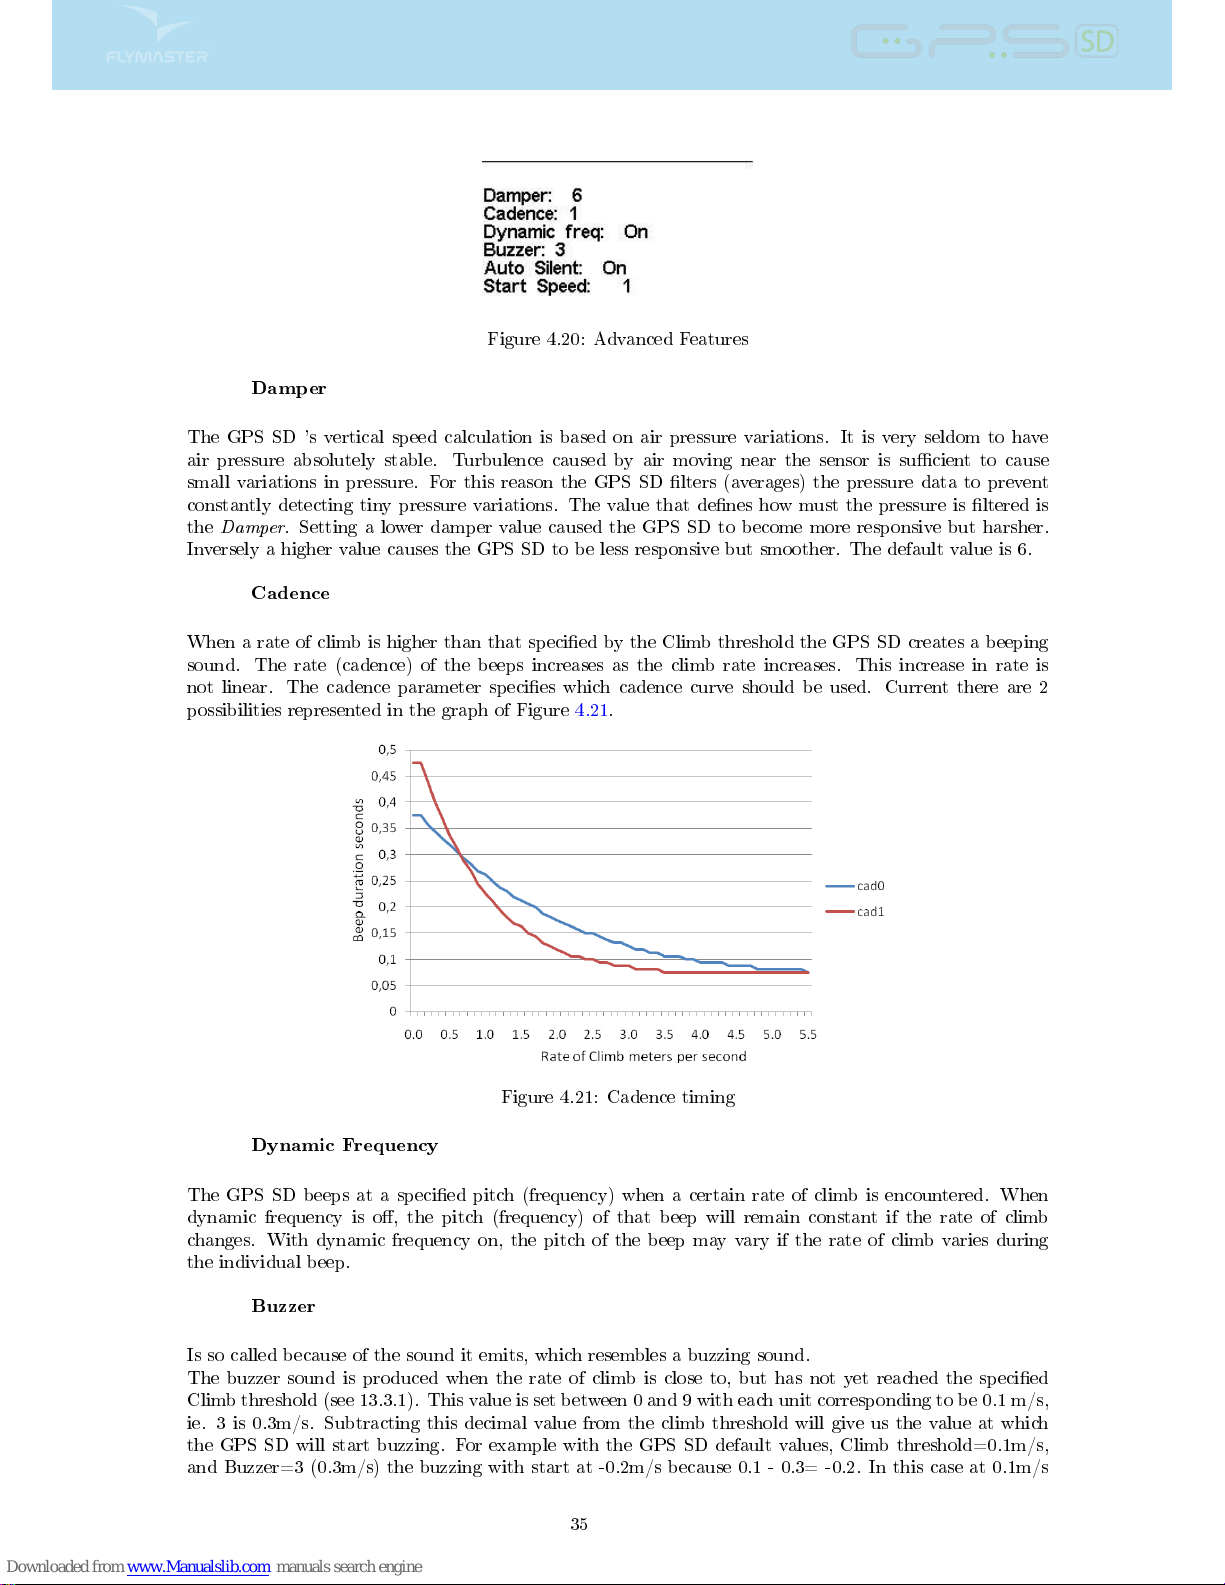
Figure 4.20: Advanced Features
Damper
The GPS SD 's vertical speed calculation is based on air pressure variations. It is very seldom to have
air pressure absolutely stable. Turbulence caused by air moving near the sensor is sucient to cause
small variations in pressure. For this reason the GPS SD lters (averages) the pressure data to prevent
constantly detecting tiny pressure variations. The value that denes how must the pressure is ltered is
the
Damper
. Setting a lower damper value caused the GPS SD to become more responsive but harsher.
Inversely a higher value causes the GPS SD to be less responsive but smoother. The default value is 6.
Cadence
When a rate of climb is higher than that specied by the Climb threshold the GPS SD creates a beeping
sound. The rate (cadence) of the beeps increases as the climb rate increases. This increase in rate is
not linear. The cadence parameter species which cadence curve should be used. Current there are 2
possibilities represented in the graph of Figure 4.21.
Figure 4.21: Cadence timing
Dynamic Frequency
The GPS SD beeps at a specied pitch (frequency) when a certain rate of climb is encountered. When
dynamic frequency is o, the pitch (frequency) of that beep will remain constant if the rate of climb
changes. With dynamic frequency on, the pitch of the beep may vary if the rate of climb varies during
the individual beep.
Buzzer
Is so called because of the sound it emits, which resembles a buzzing sound.
The buzzer sound is produced when the rate of climb is close to, but has not yet reached the specied
Climb threshold (see 13.3.1). This value is set between 0 and 9 with each unit corresponding to be 0.1 m/s,
ie. 3 is 0.3m/s. Subtracting this decimal value from the climb threshold will give us the value at which
the GPS SD will start buzzing. For example with the GPS SD default values, Climb threshold=0.1m/s,
and Buzzer=3 (0.3m/s) the buzzing with start at -0.2m/s because 0.1 - 0.3= -0.2. In this case at 0.1m/s
35
Page 37
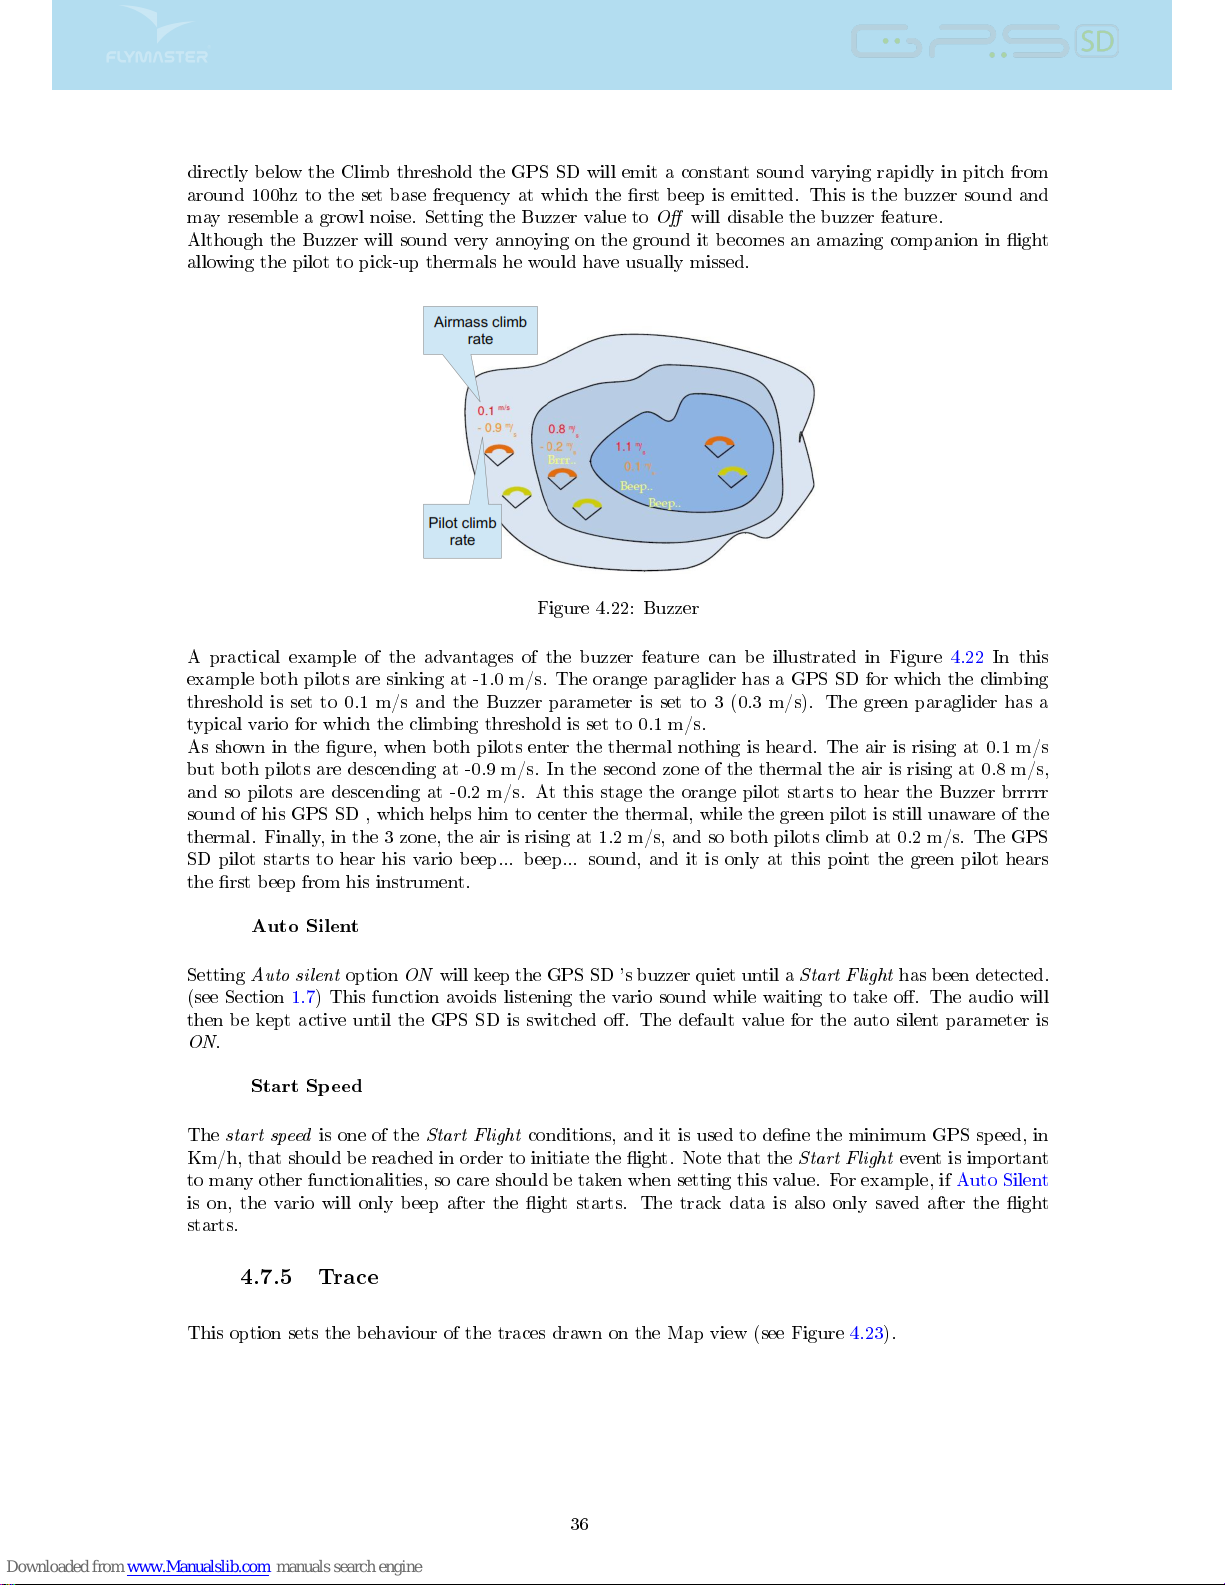
directly below the Climb threshold the GPS SD will emit a constant sound varying rapidly in pitch from
around 100hz to the set base frequency at which the rst beep is emitted. This is the buzzer sound and
may resemble a growl noise. Setting the Buzzer value to
O
will disable the buzzer feature.
Although the Buzzer will sound very annoying on the ground it becomes an amazing companion in ight
allowing the pilot to pick-up thermals he would have usually missed.
Figure 4.22: Buzzer
A practical example of the advantages of the buzzer feature can be illustrated in Figure 4.22 In this
example both pilots are sinking at -1.0 m/s. The orange paraglider has a GPS SD for which the climbing
threshold is set to 0.1 m/s and the Buzzer parameter is set to 3 (0.3 m/s). The green paraglider has a
typical vario for which the climbing threshold is set to 0.1 m/s.
As shown in the gure, when both pilots enter the thermal nothing is heard. The air is rising at 0.1 m/s
but both pilots are descending at -0.9 m/s. In the second zone of the thermal the air is rising at 0.8 m/s,
and so pilots are descending at -0.2 m/s. At this stage the orange pilot starts to hear the Buzzer brrrrr
sound of his GPS SD , which helps him to center the thermal, while the green pilot is still unaware of the
thermal. Finally, in the 3 zone, the air is rising at 1.2 m/s, and so both pilots climb at 0.2 m/s. The GPS
SD pilot starts to hear his vario beep... beep... sound, and it is only at this point the green pilot hears
the rst beep from his instrument.
Auto Silent
Setting
Auto silent
option
ON
will keep the GPS SD 's buzzer quiet until a
Start Flight
has been detected.
(see Section 1.7) This function avoids listening the vario sound while waiting to take o. The audio will
then be kept active until the GPS SD is switched o. The default value for the auto silent parameter is
ON
.
Start Speed
The
start speed
is one of the
Start Flight
conditions, and it is used to dene the minimum GPS speed, in
Km/h, that should be reached in order to initiate the ight. Note that the
Start Flight
event is important
to many other functionalities, so care should be taken when setting this value. For example, if Auto Silent
is on, the vario will only beep after the ight starts. The track data is also only saved after the ight
starts.
4.7.5 Trace
This option sets the behaviour of the traces drawn on the Map view (see Figure 4.23).
36
Page 38
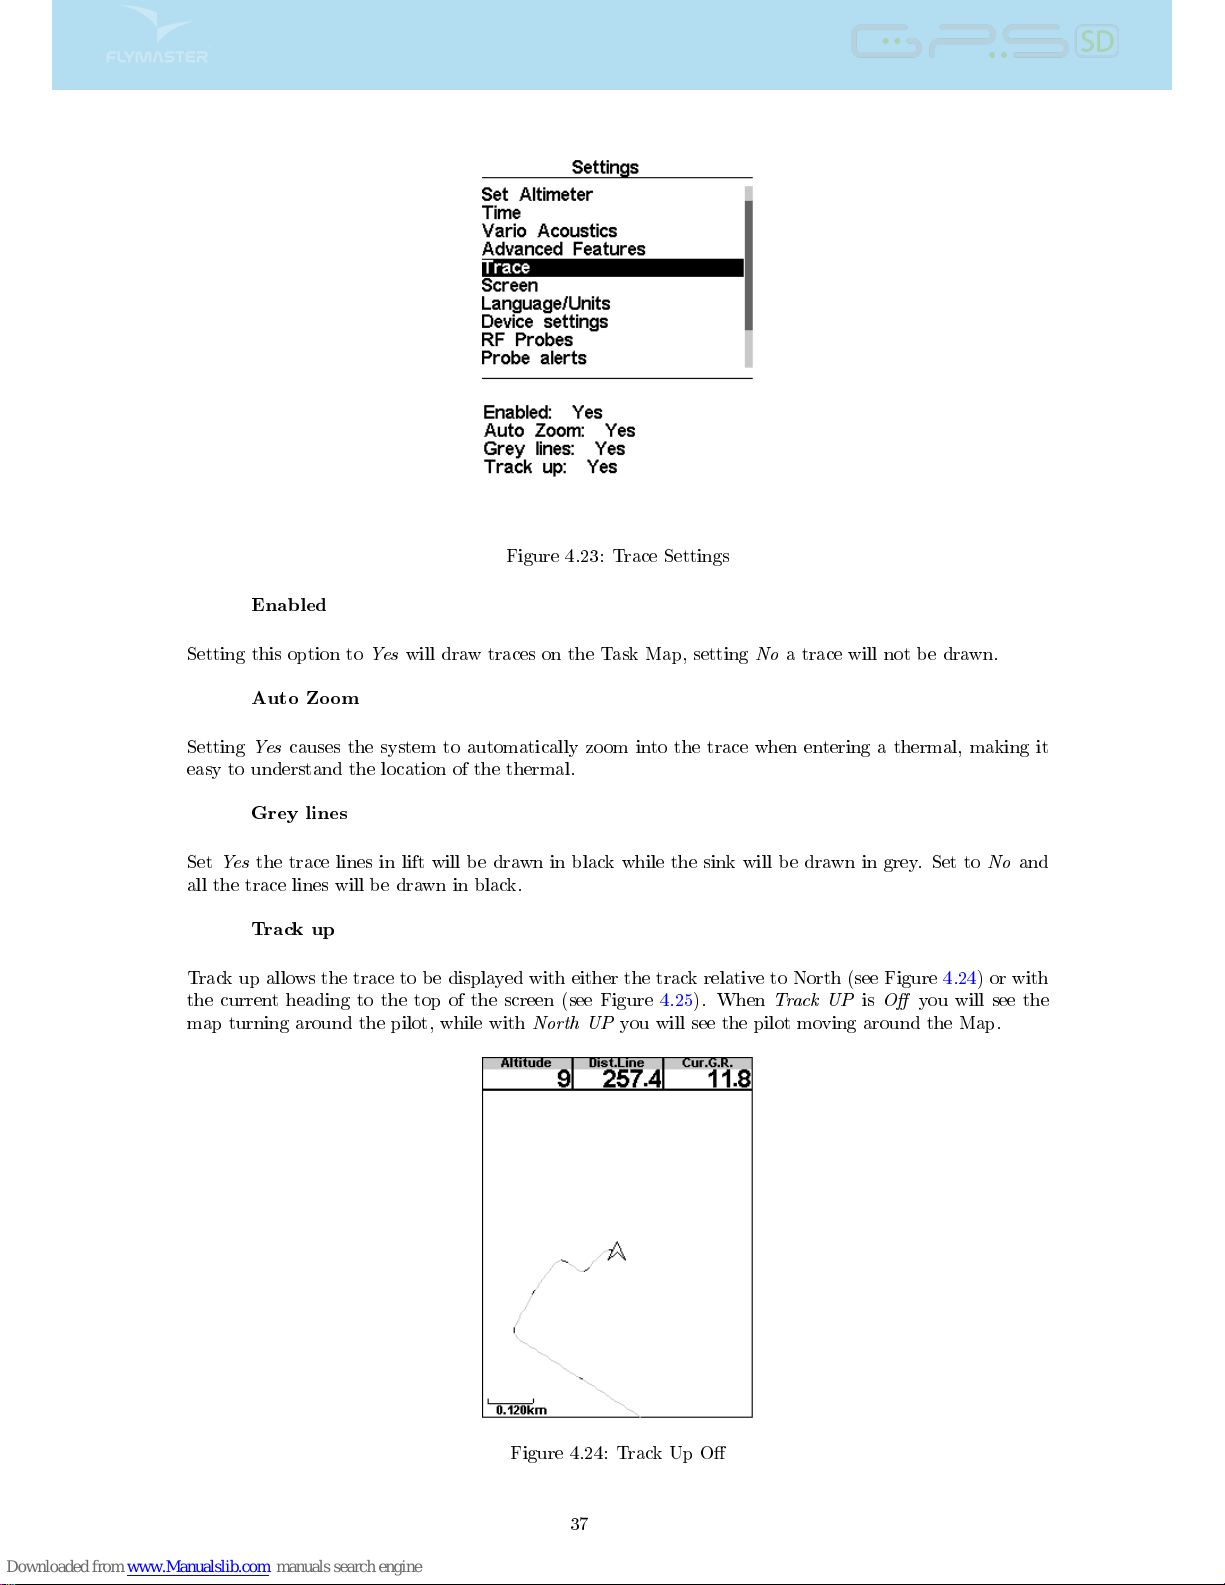
Figure 4.23: Trace Settings
Enabled
Setting this option to
Yes
will draw traces on the Task Map, settingNoa trace will not be drawn.
Auto Zoom
Setting
Yes
causes the system to automatically zoom into the trace when entering a thermal, making it
easy to understand the location of the thermal.
Grey lines
Set
Yes
the trace lines in lift will be drawn in black while the sink will be drawn in grey. Set toNoand
all the trace lines will be drawn in black.
Track up
Track up allows the trace to be displayed with either the track relative to North (see Figure 4.24) or with
the current heading to the top of the screen (see Figure 4.25). When
Track UPisO
you will see the
map turning around the pilot, while with
North UP
you will see the pilot moving around the Map.
Figure 4.24: Track Up O
37
Page 39
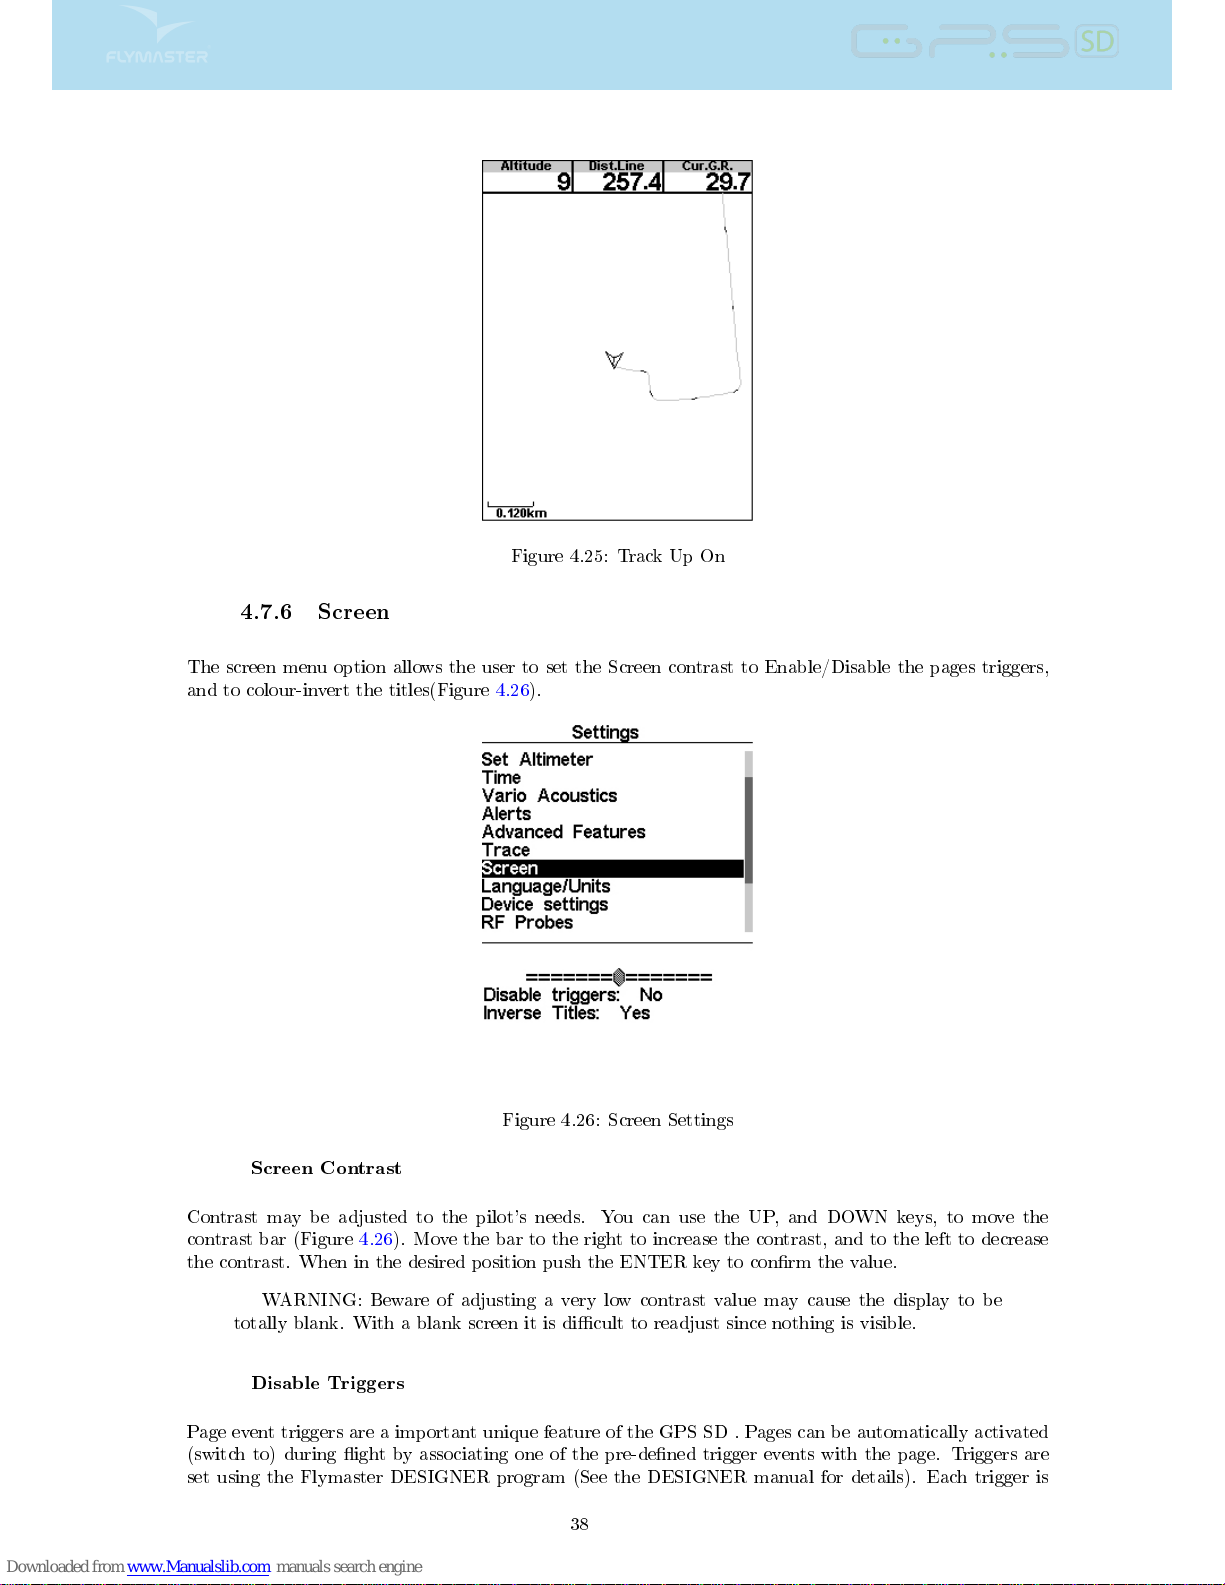
Figure 4.25: Track Up On
4.7.6 Screen
The screen menu option allows the user to set the Screen contrast to Enable/Disable the pages triggers,
and to colour-invert the titles(Figure 4.26).
Figure 4.26: Screen Settings
Screen Contrast
Contrast may be adjusted to the pilot's needs. You can use the UP, and DOWN keys, to move the
contrast bar (Figure 4.26). Move the bar to the right to increase the contrast, and to the left to decrease
the contrast. When in the desired position push the ENTER key to conrm the value.
WARNING: Beware of adjusting a very low contrast value may cause the display to be
totally blank. With a blank screen it is dicult to readjust since nothing is visible.
Disable Triggers
Page event triggers are a important unique feature of the GPS SD . Pages can be automatically activated
(switch to) during ight by associating one of the pre-dened trigger events with the page. Triggers are
set using the Flymaster DESIGNER program (See the DESIGNER manual for details). Each trigger is
38
Page 40
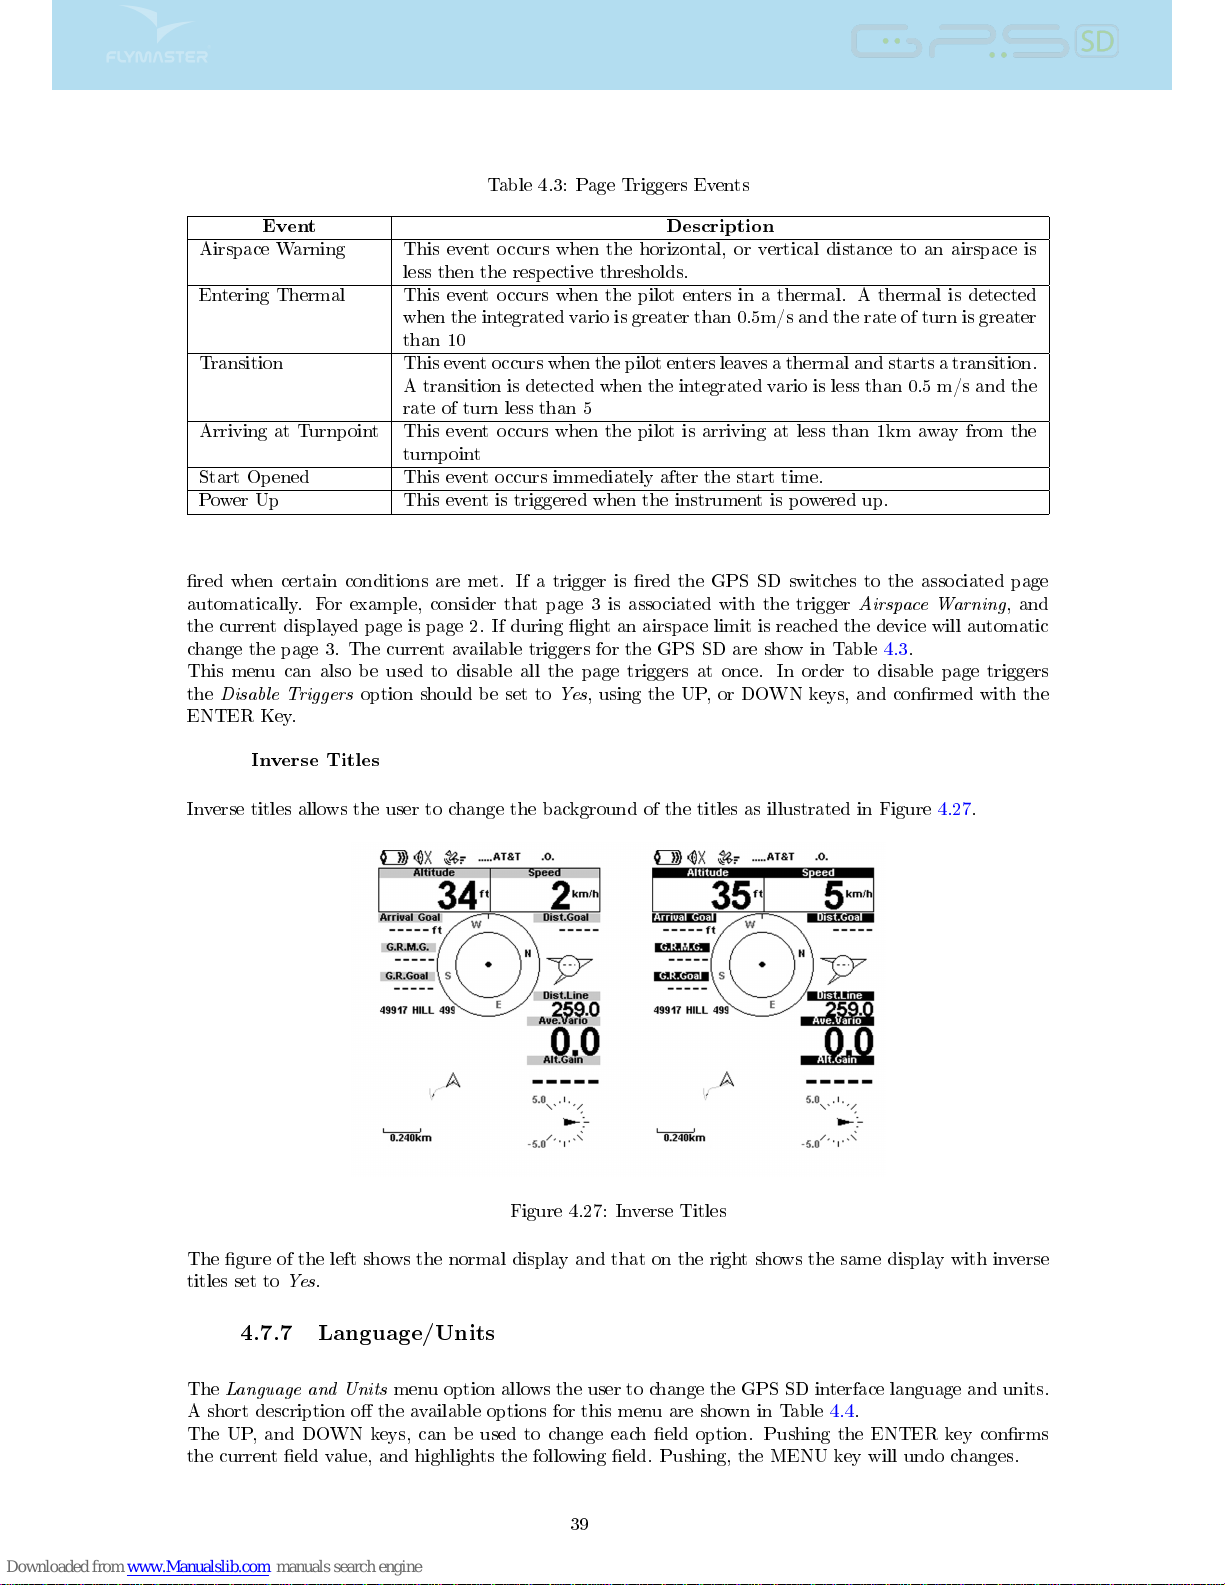
Table 4.3: Page Triggers Events
Event Description
Airspace Warning This event occurs when the horizontal, or vertical distance to an airspace is
less then the respective thresholds.
Entering Thermal This event occurs when the pilot enters in a thermal. A thermal is detected
when the integrated vario is greater than 0.5m/s and the rate of turn is greater
than 10
Transition This event occurs when the pilot enters leaves a thermal and starts a transition.
A transition is detected when the integrated vario is less than 0.5 m/s and the
rate of turn less than 5
Arriving at Turnpoint This event occurs when the pilot is arriving at less than 1km away from the
turnpoint
Start Opened This event occurs immediately after the start time.
Power Up This event is triggered when the instrument is powered up.
red when certain conditions are met. If a trigger is red the GPS SD switches to the associated page
automatically. For example, consider that page 3 is associated with the trigger
Airspace Warning
, and
the current displayed page is page 2. If during ight an airspace limit is reached the device will automatic
change the page 3. The current available triggers for the GPS SD are show in Table 4.3.
This menu can also be used to disable all the page triggers at once. In order to disable page triggers
the
Disable Triggers
option should be set to
Yes
, using the UP, or DOWN keys, and conrmed with the
ENTER Key.
Inverse Titles
Inverse titles allows the user to change the background of the titles as illustrated in Figure 4.27.
Figure 4.27: Inverse Titles
The gure of the left shows the normal display and that on the right shows the same display with inverse
titles set to
Yes
.
4.7.7 Language/Units
The
Language and Units
menu option allows the user to change the GPS SD interface language and units.
A short description o the available options for this menu are shown in Table 4.4.
The UP, and DOWN keys, can be used to change each eld option. Pushing the ENTER key conrms
the current eld value, and highlights the following eld. Pushing, the MENU key will undo changes.
39
Page 41
Table 4.4: Language/Units Menu Options
Function Description
Language Denes the interface language.
Alti. Units Altitude Units. Altitude can be show in Meters, or Feet.
Roc. Units Rate of Climb Units. ROC can be show in m/s, or 10 x Feet/ min
Dist. Units Distance units can be in Km, or Miles.
Speed Units Speed Units can be in Km/h, Miles/h, or Knots.
Temperature Temperature units can be Celsius or Farenheit.
Coords. Coordinates format. These can be either:
DD°
MM'SS?
DD°
MM.mmm'
DD.dddd
UTM
4.7.8 Device Settings
This menu option allows the user to execute some recovery functions. A short description of the available
options is shown in Table 4.5.
Table 4.5: Device Settings
Function Description
Factory Settings Reset all parameters to the default factory values. This will not
change the layout to the factory default layout. Care should be
taken because all changes made by the user are lost.
Reset now Makes a hardware reset to the instrument. The result is the same
as the one presented in Section 1.5.
Auto-o If set to
Yes
the GPS SD turns o if the GPS speed is less than
5 km/h, and integrated vario less than +-1.5 m/s, for more than
30 seconds.
4.7.9 RF Probes
The
RF Probes
menu option allows the user to pair up any of the Flymaster wireless devices including
the M1 and Heart-G to the GPS SD . Pairing is performed automatically. When ENTER is pressed the
GPS SD will look to see what wireless devices are around and it will shows these on the screen (see Figure
4.28). Devices are identied by their name (e.g. M1, TAS) and serial number. Devices can be selected
using the UP, or DOWN keys. For the selected (highlighted) device the pairing state is shown on the
bottom of the screen. To pair a device the state should be changed fromNoto
Yes
. Once paired the GPS
SD will always automatically connect with the wireless device. The GPS SD can be paired with several
devices.
40
Page 42
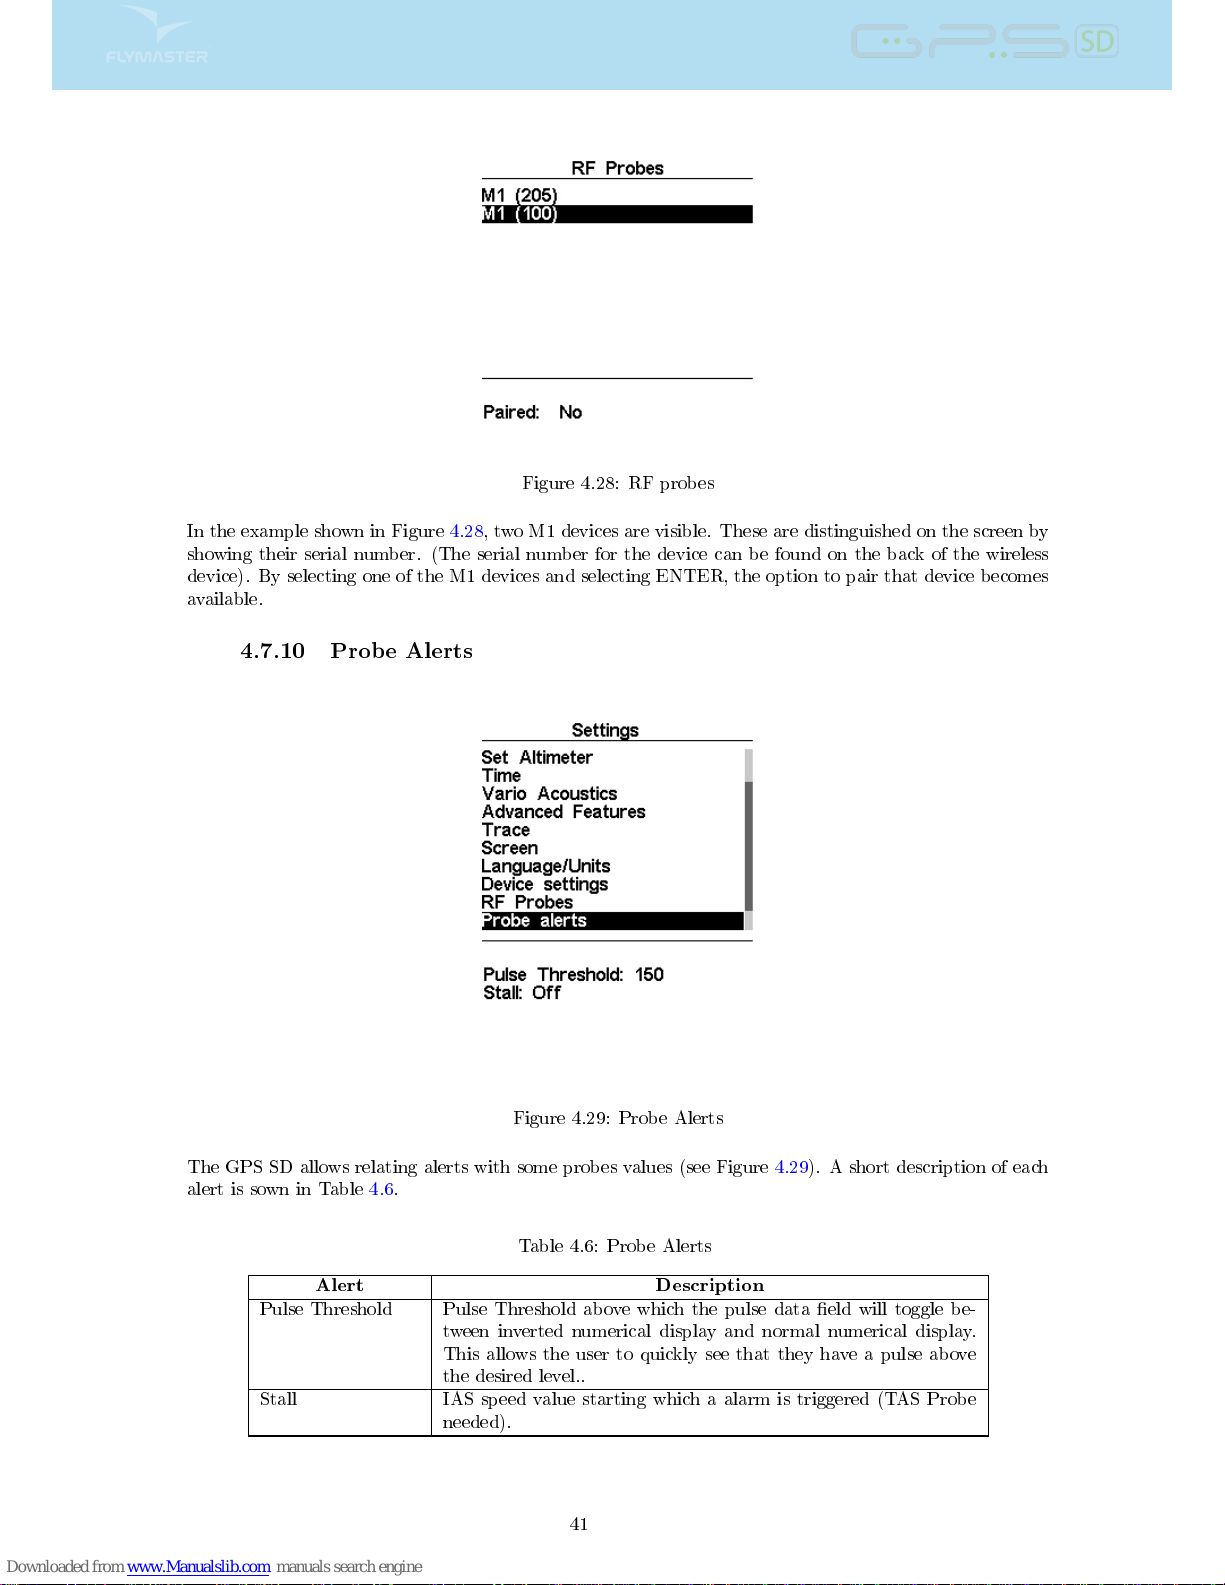
Figure 4.28: RF probes
In the example shown in Figure 4.28, two M1 devices are visible. These are distinguished on the screen by
showing their serial number. (The serial number for the device can be found on the back of the wireless
device). By selecting one of the M1 devices and selecting ENTER, the option to pair that device becomes
available.
4.7.10 Probe Alerts
Figure 4.29: Probe Alerts
The GPS SD allows relating alerts with some probes values (see Figure 4.29). A short description of each
alert is sown in Table 4.6.
Table 4.6: Probe Alerts
Alert Description
Pulse Threshold Pulse Threshold above which the pulse data eld will toggle be-
tween inverted numerical display and normal numerical display.
This allows the user to quickly see that they have a pulse above
the desired level..
Stall IAS speed value starting which a alarm is triggered (TAS Probe
needed).
41
Page 43
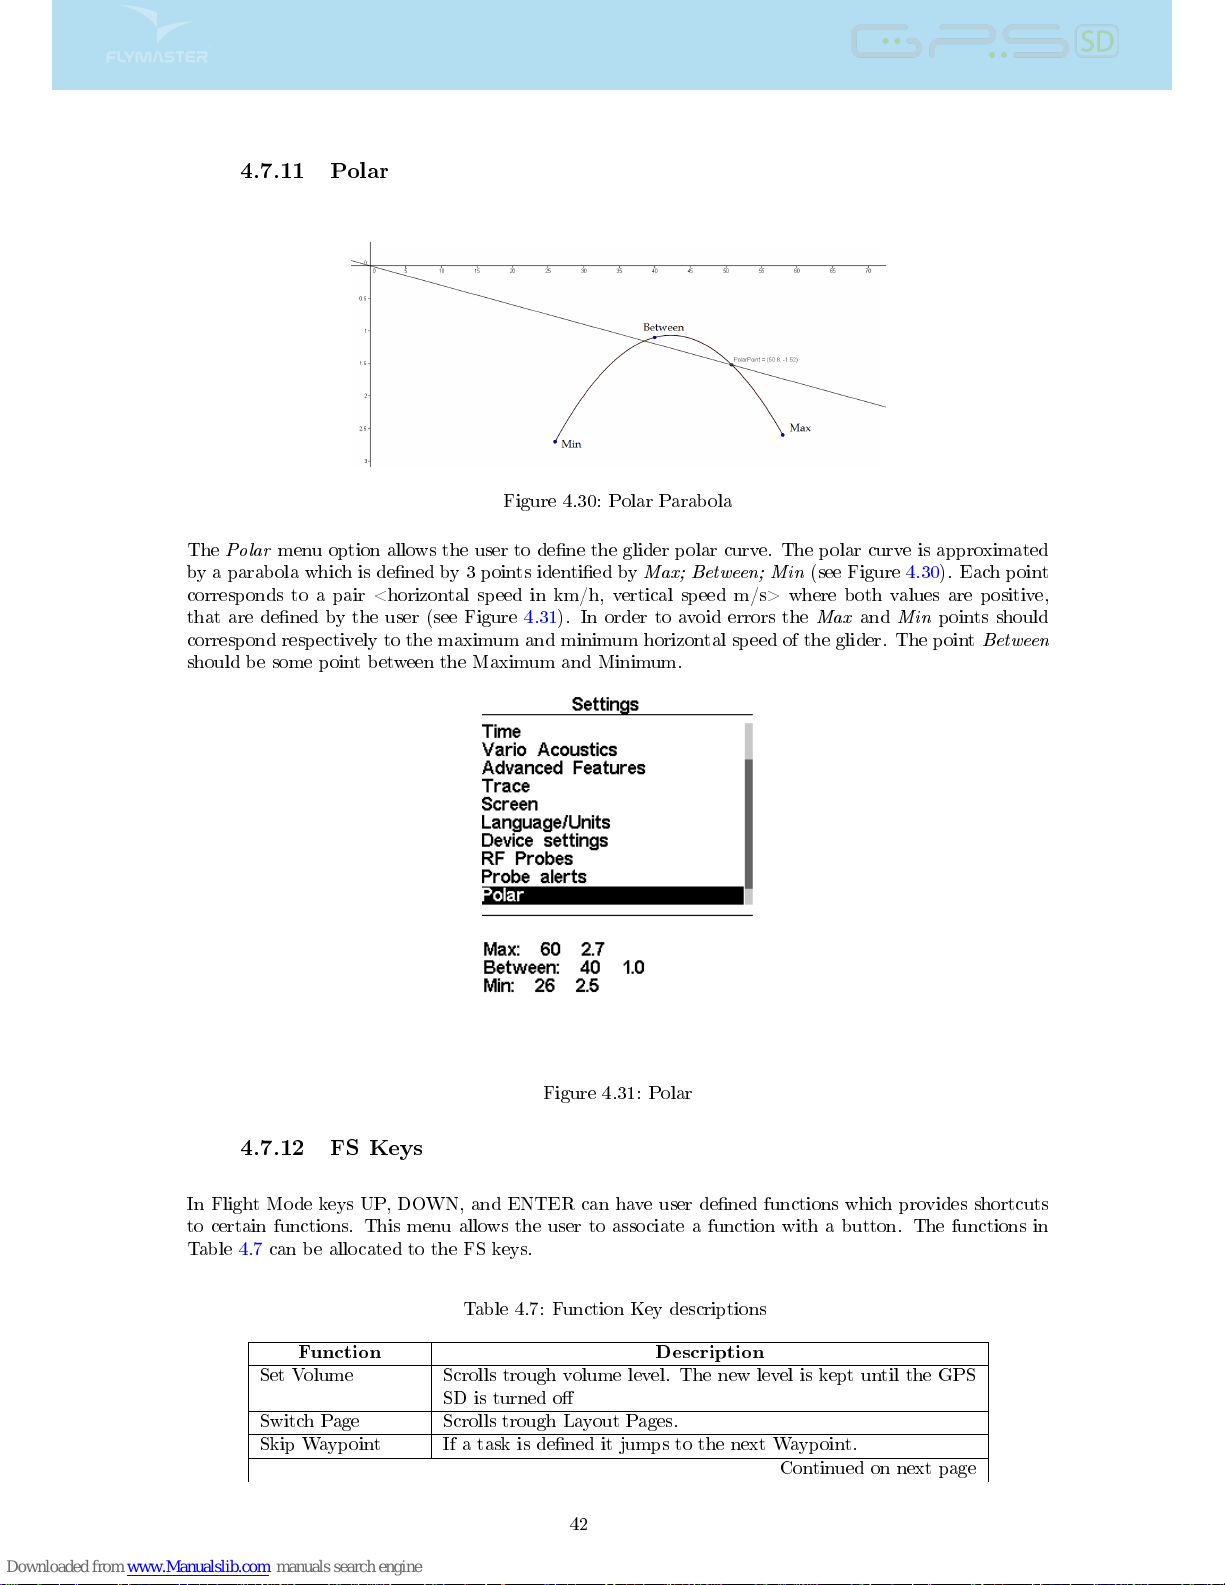
4.7.11 Polar
Figure 4.30: Polar Parabola
The
Polar
menu option allows the user to dene the glider polar curve. The polar curve is approximated
by a parabola which is dened by 3 points identied by
Max; Between; Min
(see Figure 4.30). Each point
corresponds to a pair <horizontal speed in km/h, vertical speed m/s> where both values are positive,
that are dened by the user (see Figure 4.31). In order to avoid errors the
Max
and
Min
points should
correspond respectively to the maximum and minimum horizontal speed of the glider. The point
Between
should be some point between the Maximum and Minimum.
Figure 4.31: Polar
4.7.12 FS Keys
In Flight Mode keys UP, DOWN, and ENTER can have user dened functions which provides shortcuts
to certain functions. This menu allows the user to associate a function with a button. The functions in
Table 4.7 can be allocated to the FS keys.
Table 4.7: Function Key descriptions
Function Description
Set Volume Scrolls trough volume level. The new level is kept until the GPS
SD is turned o
Switch Page Scrolls trough Layout Pages.
Skip Waypoint If a task is dened it jumps to the next Waypoint.
Continued on next page
42
Page 44
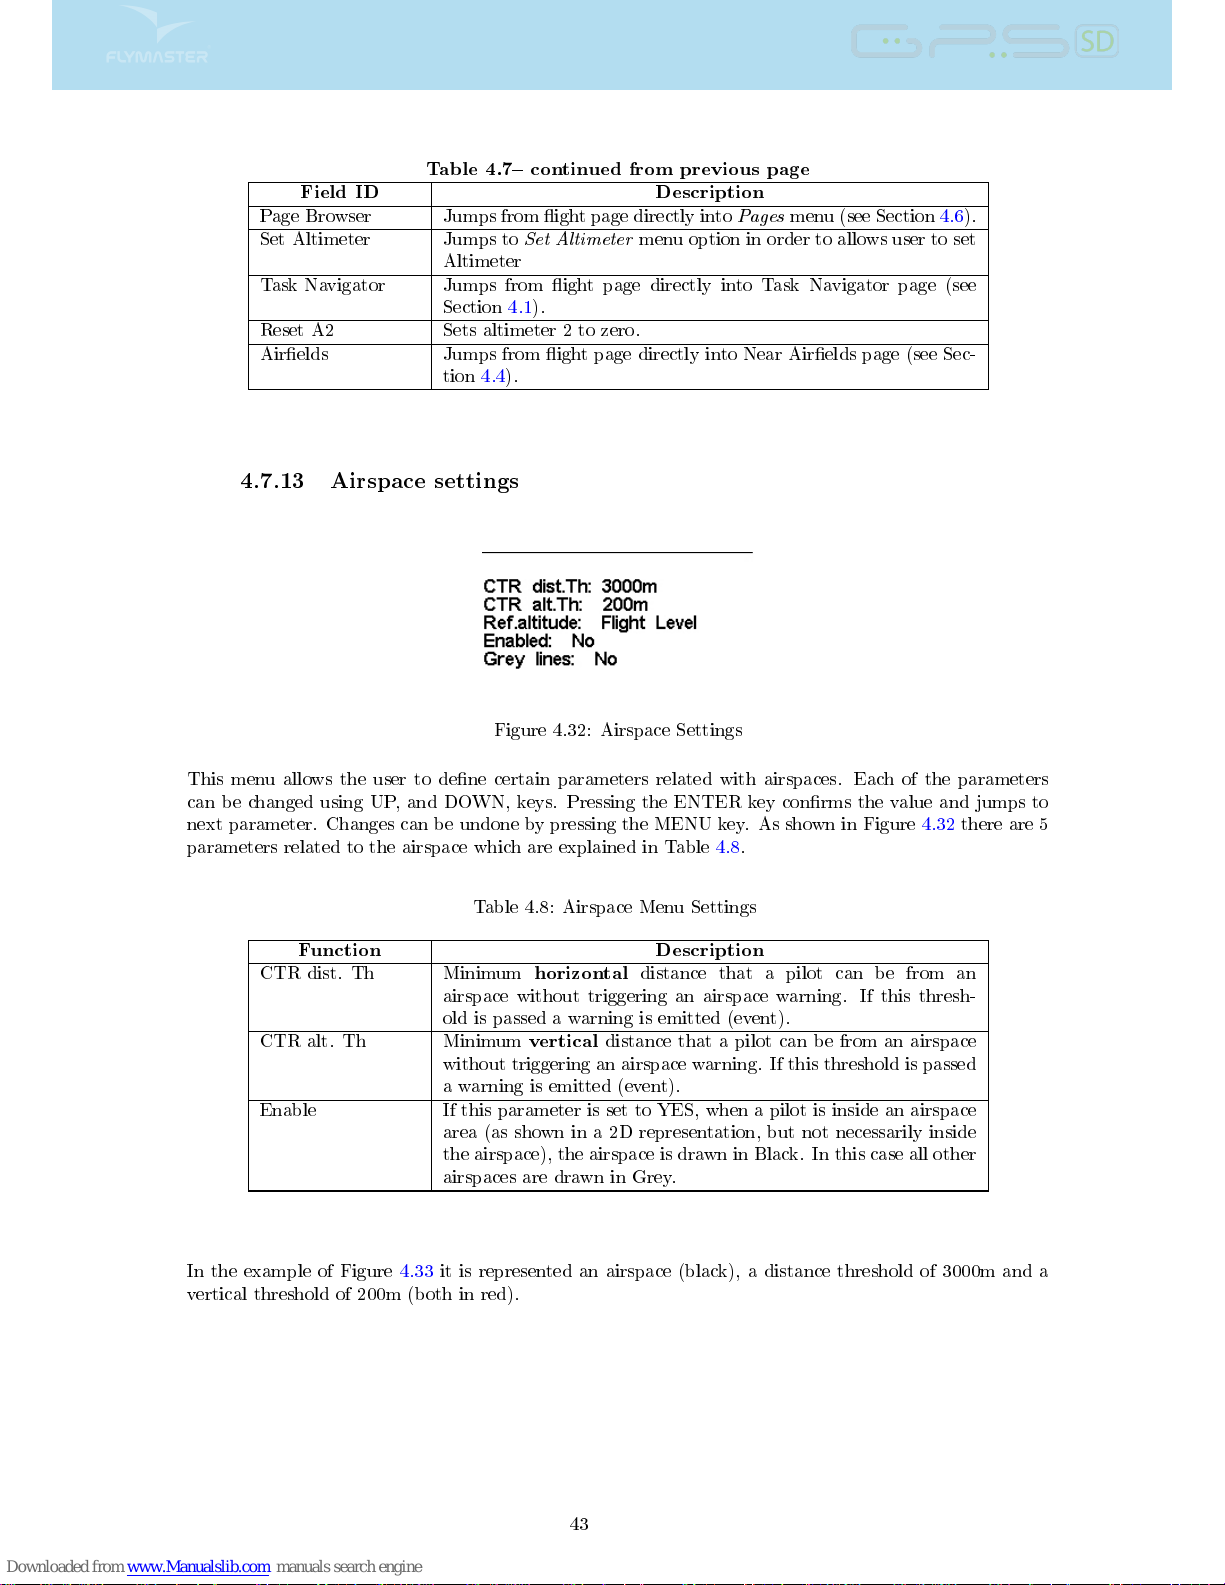
Table 4.7 continued from previous page
Field ID Description
Page Browser Jumps from ight page directly into
Pages
menu (see Section 4.6).
Set Altimeter Jumps to
Set Altimeter
menu option in order to allows user to set
Altimeter
Task Navigator Jumps from ight page directly into Task Navigator page (see
Section 4.1).
Reset A2 Sets altimeter 2 to zero.
Airelds Jumps from ight page directly into Near Airelds page (see Sec-
tion 4.4).
4.7.13 Airspace settings
Figure 4.32: Airspace Settings
This menu allows the user to dene certain parameters related with airspaces. Each of the parameters
can be changed using UP, and DOWN, keys. Pressing the ENTER key conrms the value and jumps to
next parameter. Changes can be undone by pressing the MENU key. As shown in Figure 4.32 there are 5
parameters related to the airspace which are explained in Table 4.8.
Table 4.8: Airspace Menu Settings
Function Description
CTR dist. Th Minimum
horizontal
distance that a pilot can be from an
airspace without triggering an airspace warning. If this thresh-
old is passed a warning is emitted (event).
CTR alt. Th Minimum
vertical
distance that a pilot can be from an airspace
without triggering an airspace warning. If this threshold is passed
a warning is emitted (event).
Enable If this parameter is set to YES, when a pilot is inside an airspace
area (as shown in a 2D representation, but not necessarily inside
the airspace), the airspace is drawn in Black. In this case all other
airspaces are drawn in Grey.
In the example of Figure 4.33 it is represented an airspace (black), a distance threshold of 3000m and a
vertical threshold of 200m (both in red).
43
Page 45
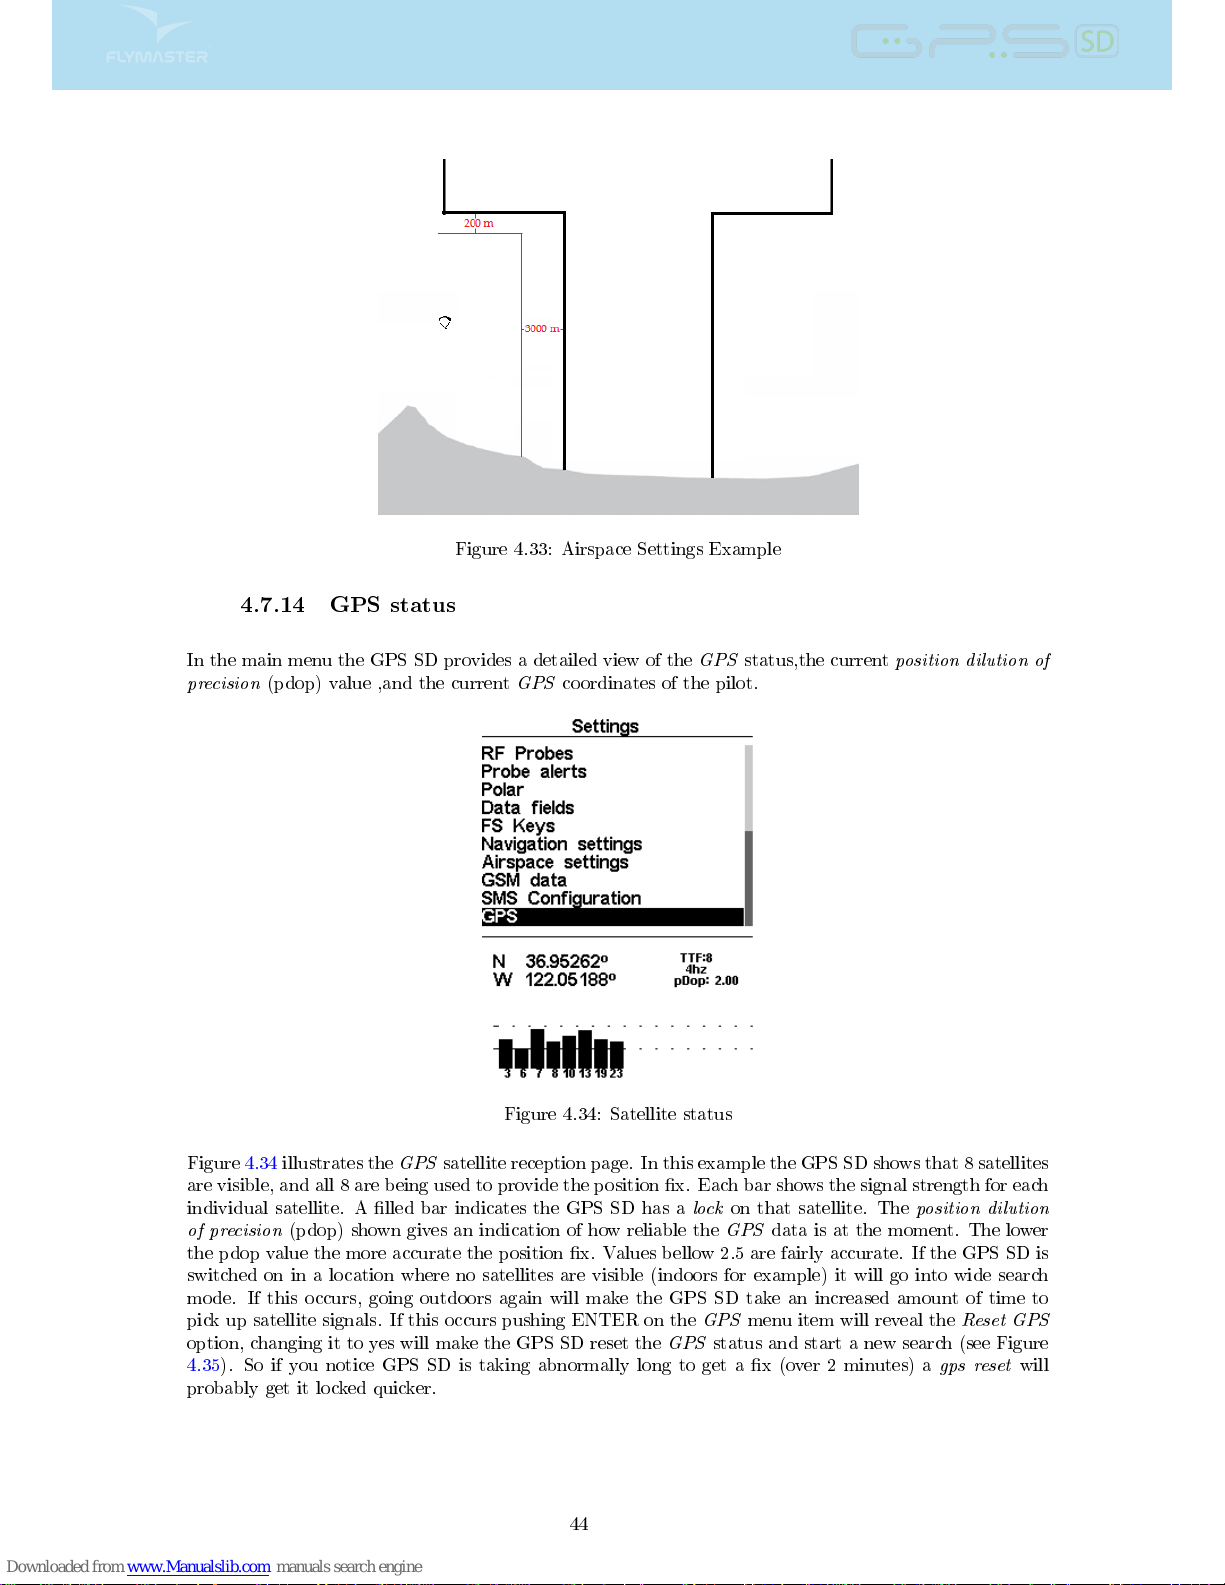
Figure 4.33: Airspace Settings Example
4.7.14 GPS status
In the main menu the GPS SD provides a detailed view of the
GPS
status,the current
position dilution of
precision
(pdop) value ,and the current
GPS
coordinates of the pilot.
Figure 4.34: Satellite status
Figure 4.34 illustrates the
GPS
satellite reception page. In this example the GPS SD shows that 8 satellites
are visible, and all 8 are being used to provide the position x. Each bar shows the signal strength for each
individual satellite. A lled bar indicates the GPS SD has a
lock
on that satellite. The
position dilution
of precision
(pdop) shown gives an indication of how reliable the
GPS
data is at the moment. The lower
the pdop value the more accurate the position x. Values bellow 2.5 are fairly accurate. If the GPS SD is
switched on in a location where no satellites are visible (indoors for example) it will go into wide search
mode. If this occurs, going outdoors again will make the GPS SD take an increased amount of time to
pick up satellite signals. If this occurs pushing ENTER on the
GPS
menu item will reveal the
Reset GPS
option, changing it to yes will make the GPS SD reset the
GPS
status and start a new search (see Figure
4.35). So if you notice GPS SD is taking abnormally long to get a x (over 2 minutes) a
gps reset
will
probably get it locked quicker.
44
Page 46

Figure 4.35: GPS Reset
45
Page 47
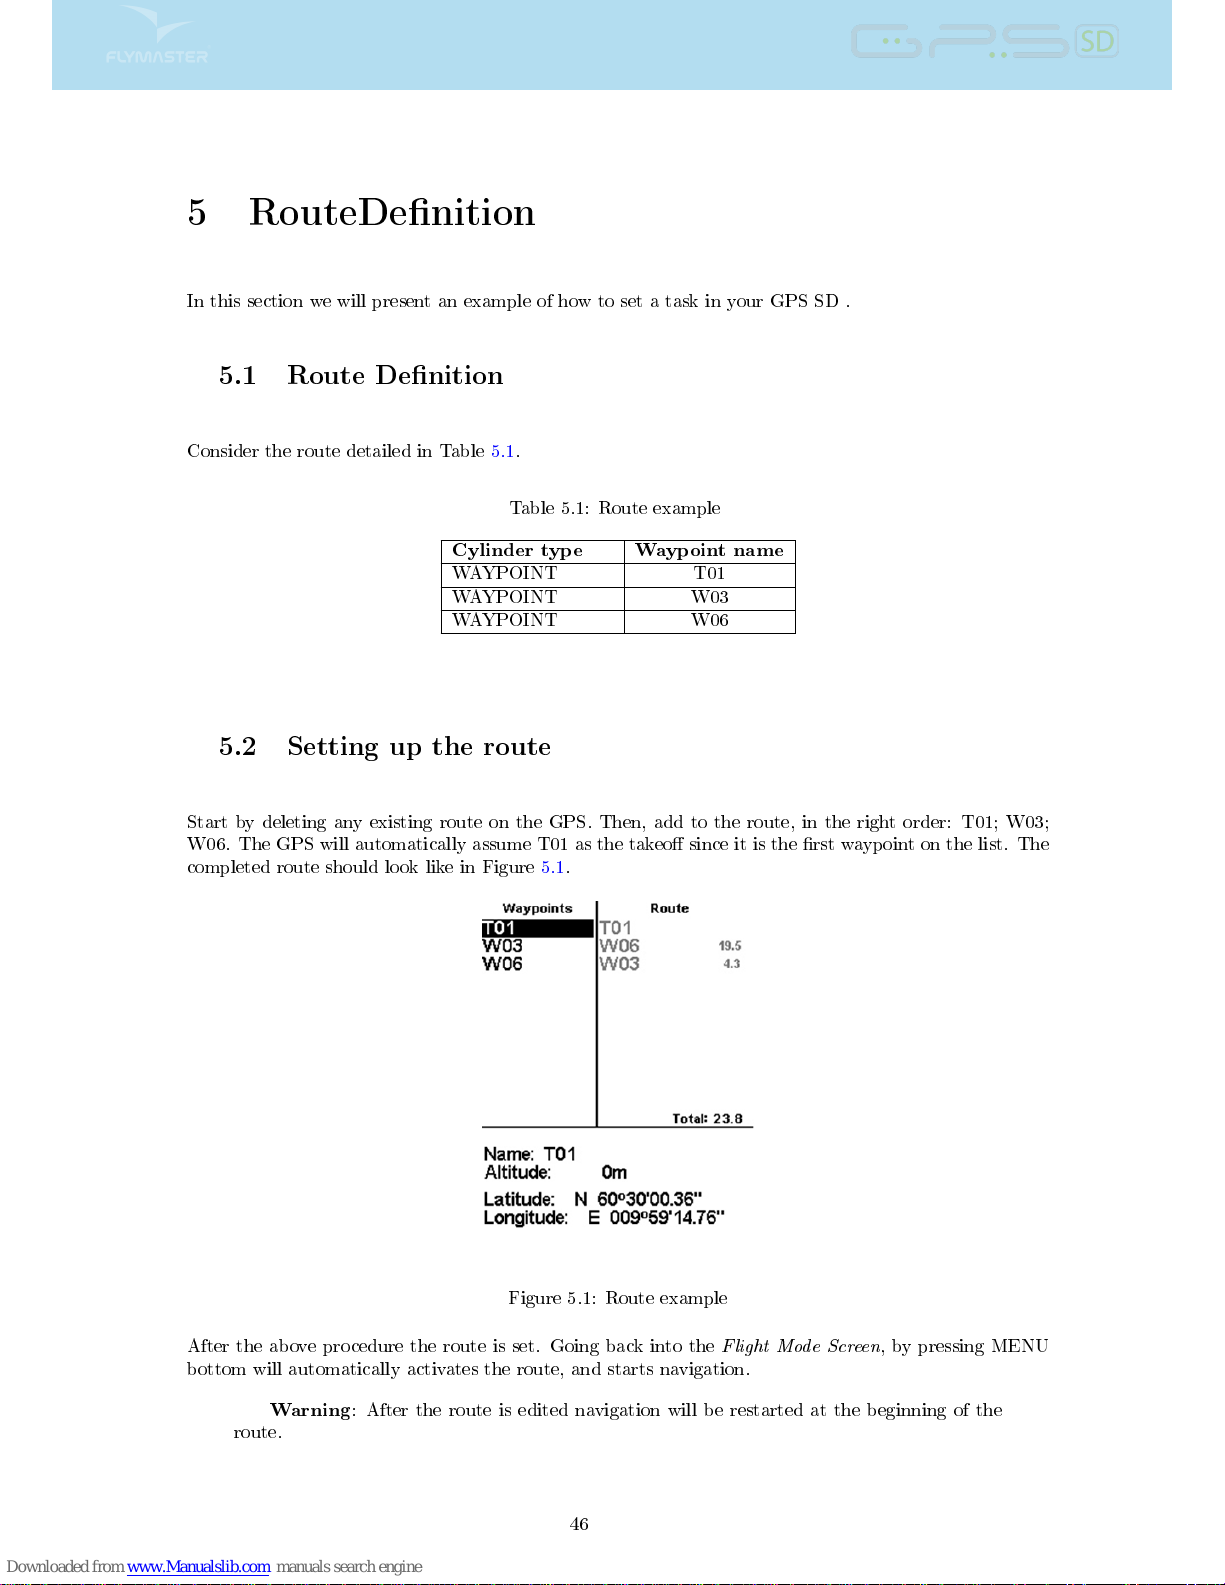
5 RouteDenition
In this section we will present an example of how to set a task in your GPS SD .
5.1 Route Denition
Consider the route detailed in Table 5.1.
Table 5.1: Route example
Cylinder type Waypoint name
WAYPOINT T01
WAYPOINT W03
WAYPOINT W06
5.2 Setting up the route
Start by deleting any existing route on the GPS. Then, add to the route, in the right order: T01; W03;
W06. The GPS will automatically assume T01 as the takeo since it is the rst waypoint on the list. The
completed route should look like in Figure 5.1.
Figure 5.1: Route example
After the above procedure the route is set. Going back into the
Flight Mode Screen
, by pressing MENU
bottom will automatically activates the route, and starts navigation.
Warning
: After the route is edited navigation will be restarted at the beginning of the
route.
46
Page 48
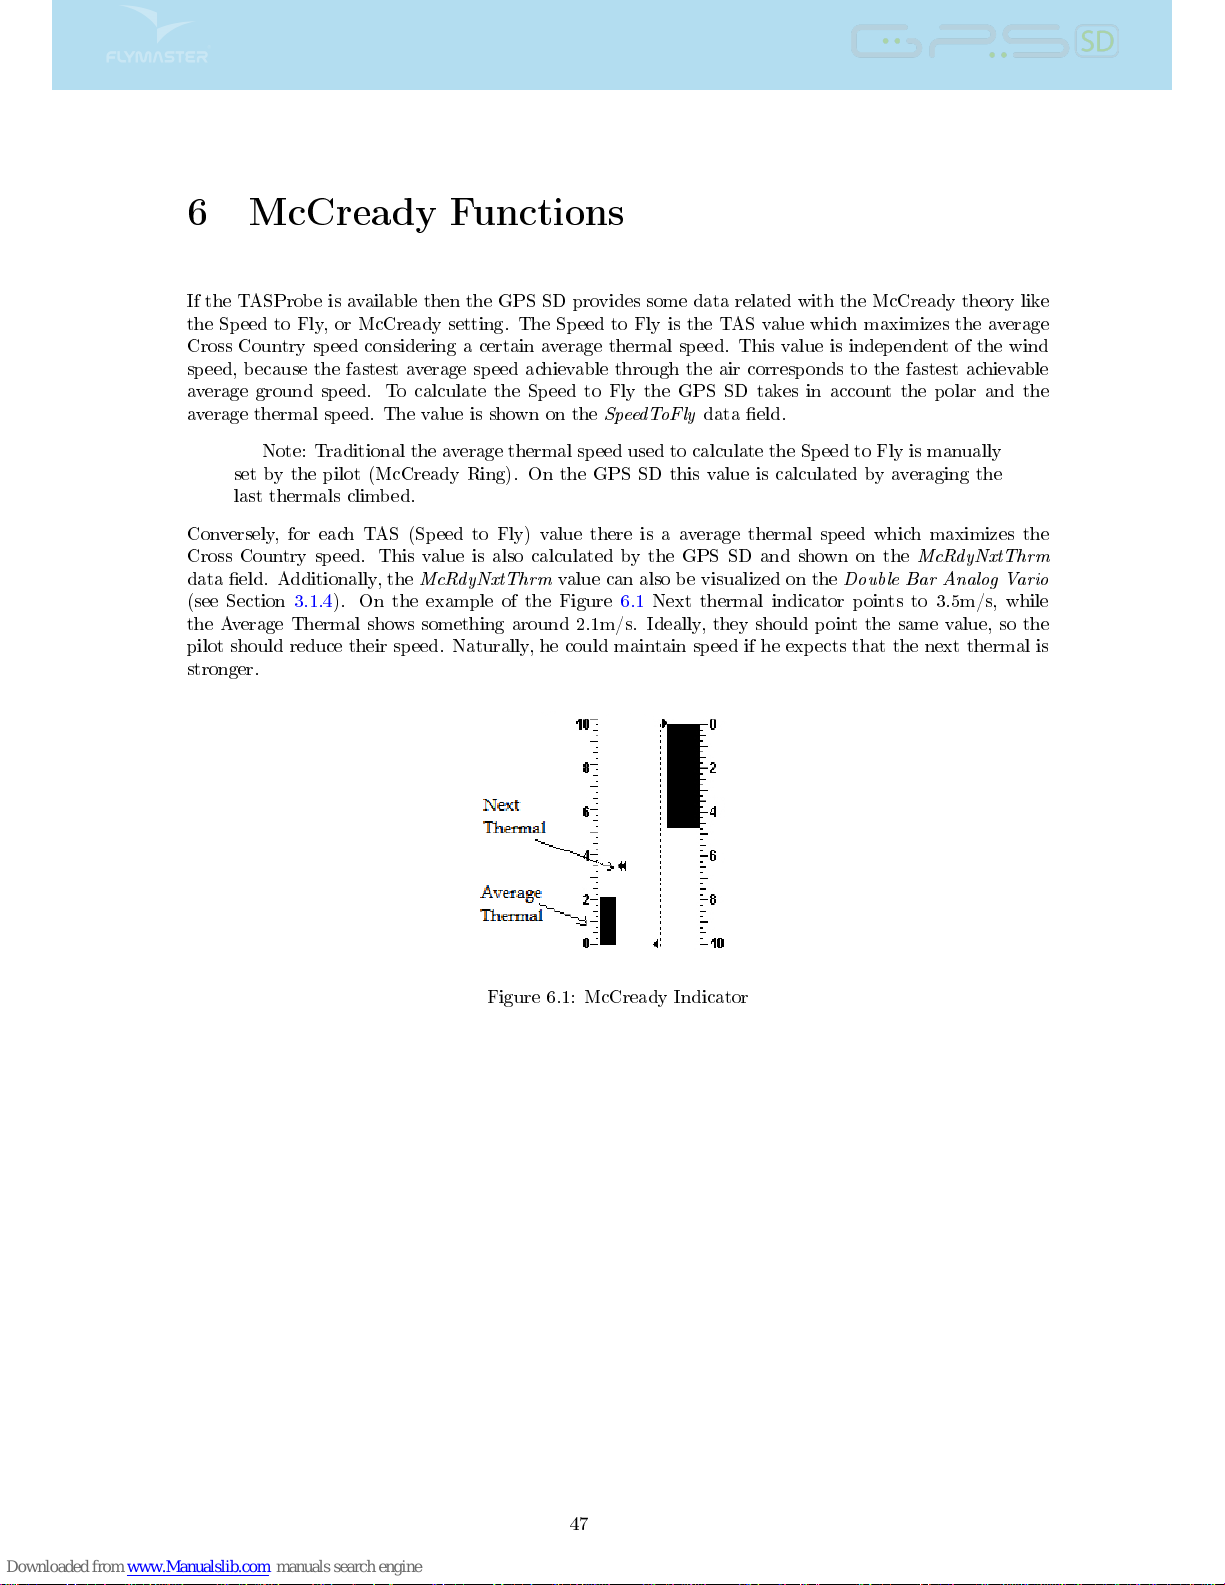
6 McCready Functions
If the TASProbe is available then the GPS SD provides some data related with the McCready theory like
the Speed to Fly, or McCready setting. The Speed to Fly is the TAS value which maximizes the average
Cross Country speed considering a certain average thermal speed. This value is independent of the wind
speed, because the fastest average speed achievable through the air corresponds to the fastest achievable
average ground speed. To calculate the Speed to Fly the GPS SD takes in account the polar and the
average thermal speed. The value is shown on the
SpeedToFly
data eld.
Note: Traditional the average thermal speed used to calculate the Speed to Fly is manually
set by the pilot (McCready Ring). On the GPS SD this value is calculated by averaging the
last thermals climbed.
Conversely, for each TAS (Speed to Fly) value there is a average thermal speed which maximizes the
Cross Country speed. This value is also calculated by the GPS SD and shown on the
McRdyNxtThrm
data eld. Additionally, the
McRdyNxtThrm
value can also be visualized on the
Double Bar Analog Vario
(see Section 3.1.4). On the example of the Figure 6.1 Next thermal indicator points to 3.5m/s, while
the Average Thermal shows something around 2.1m/s. Ideally, they should point the same value, so the
pilot should reduce their speed. Naturally, he could maintain speed if he expects that the next thermal is
stronger.
Figure 6.1: McCready Indicator
47
Page 49
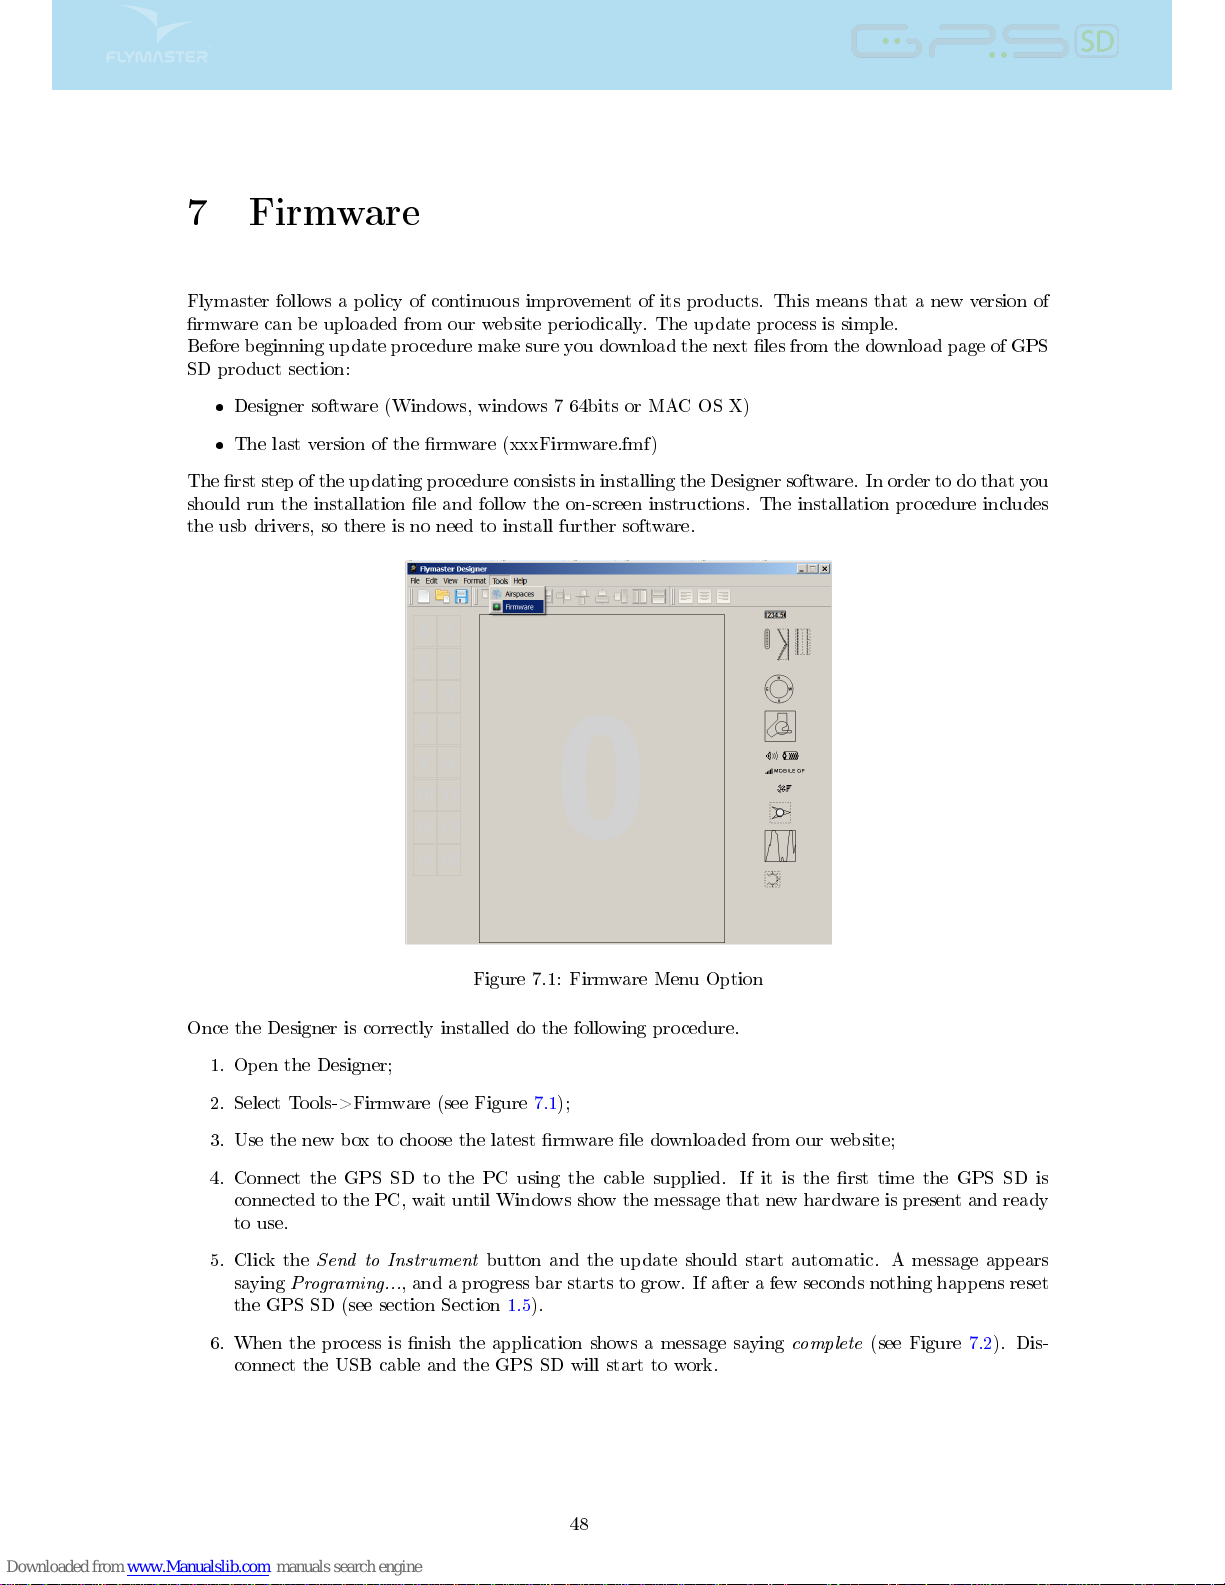
7 Firmware
Flymaster follows a policy of continuous improvement of its products. This means that a new version of
rmware can be uploaded from our website periodically. The update process is simple.
Before beginning update procedure make sure you download the next les from the download page of GPS
SD product section:
Designer software (Windows, windows 7 64bits or MAC OS X)
The last version of the rmware (xxxFirmware.fmf)
The rst step of the updating procedure consists in installing the Designer software. In order to do that you
should run the installation le and follow the on-screen instructions. The installation procedure includes
the usb drivers, so there is no need to install further software.
Figure 7.1: Firmware Menu Option
Once the Designer is correctly installed do the following procedure.
1. Open the Designer;
2. Select Tools->Firmware (see Figure 7.1);
3. Use the new box to choose the latest rmware le downloaded from our website;
4. Connect the GPS SD to the PC using the cable supplied. If it is the rst time the GPS SD is
connected to the PC, wait until Windows show the message that new hardware is present and ready
to use.
5. Click the
Send to Instrument
button and the update should start automatic. A message appears
saying
Programing...
, and a progress bar starts to grow. If after a few seconds nothing happens reset
the GPS SD (see section Section 1.5).
6. When the process is nish the application shows a message saying
complete
(see Figure 7.2). Dis-
connect the USB cable and the GPS SD will start to work.
48
Page 50
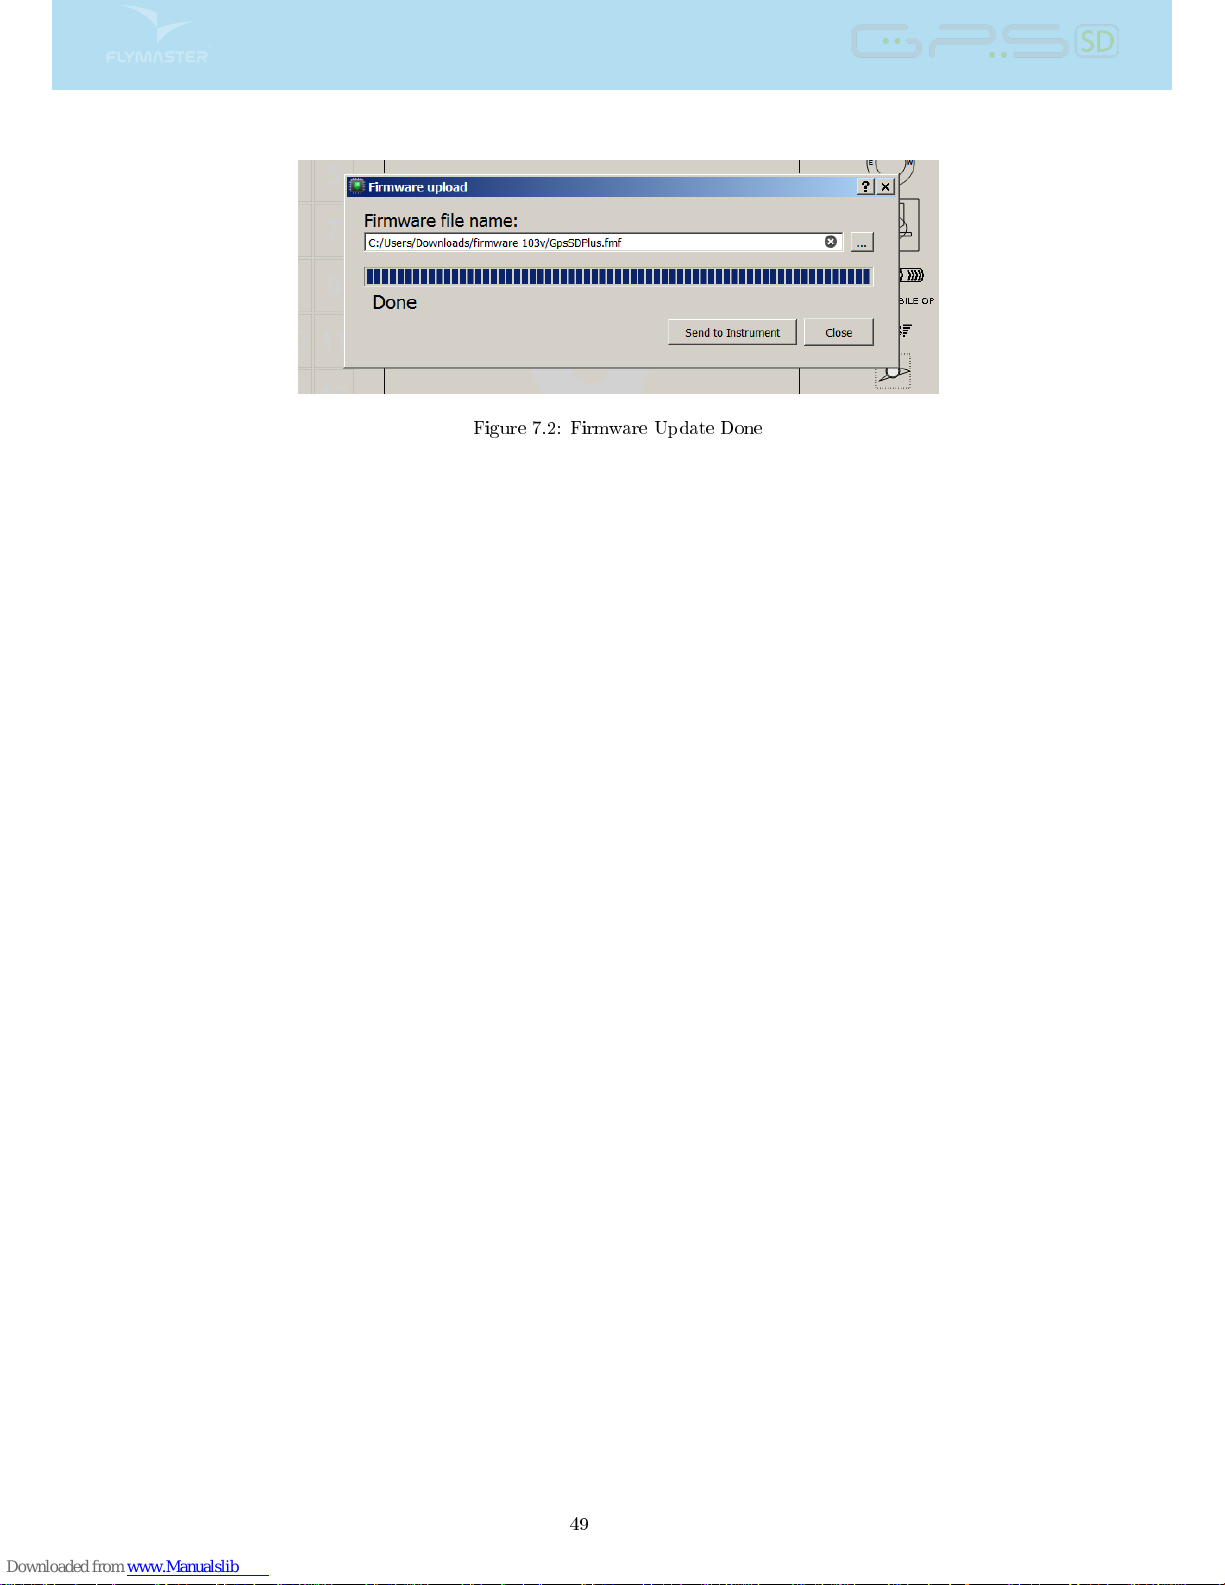
Figure 7.2: Firmware Update Done
49
Page 51
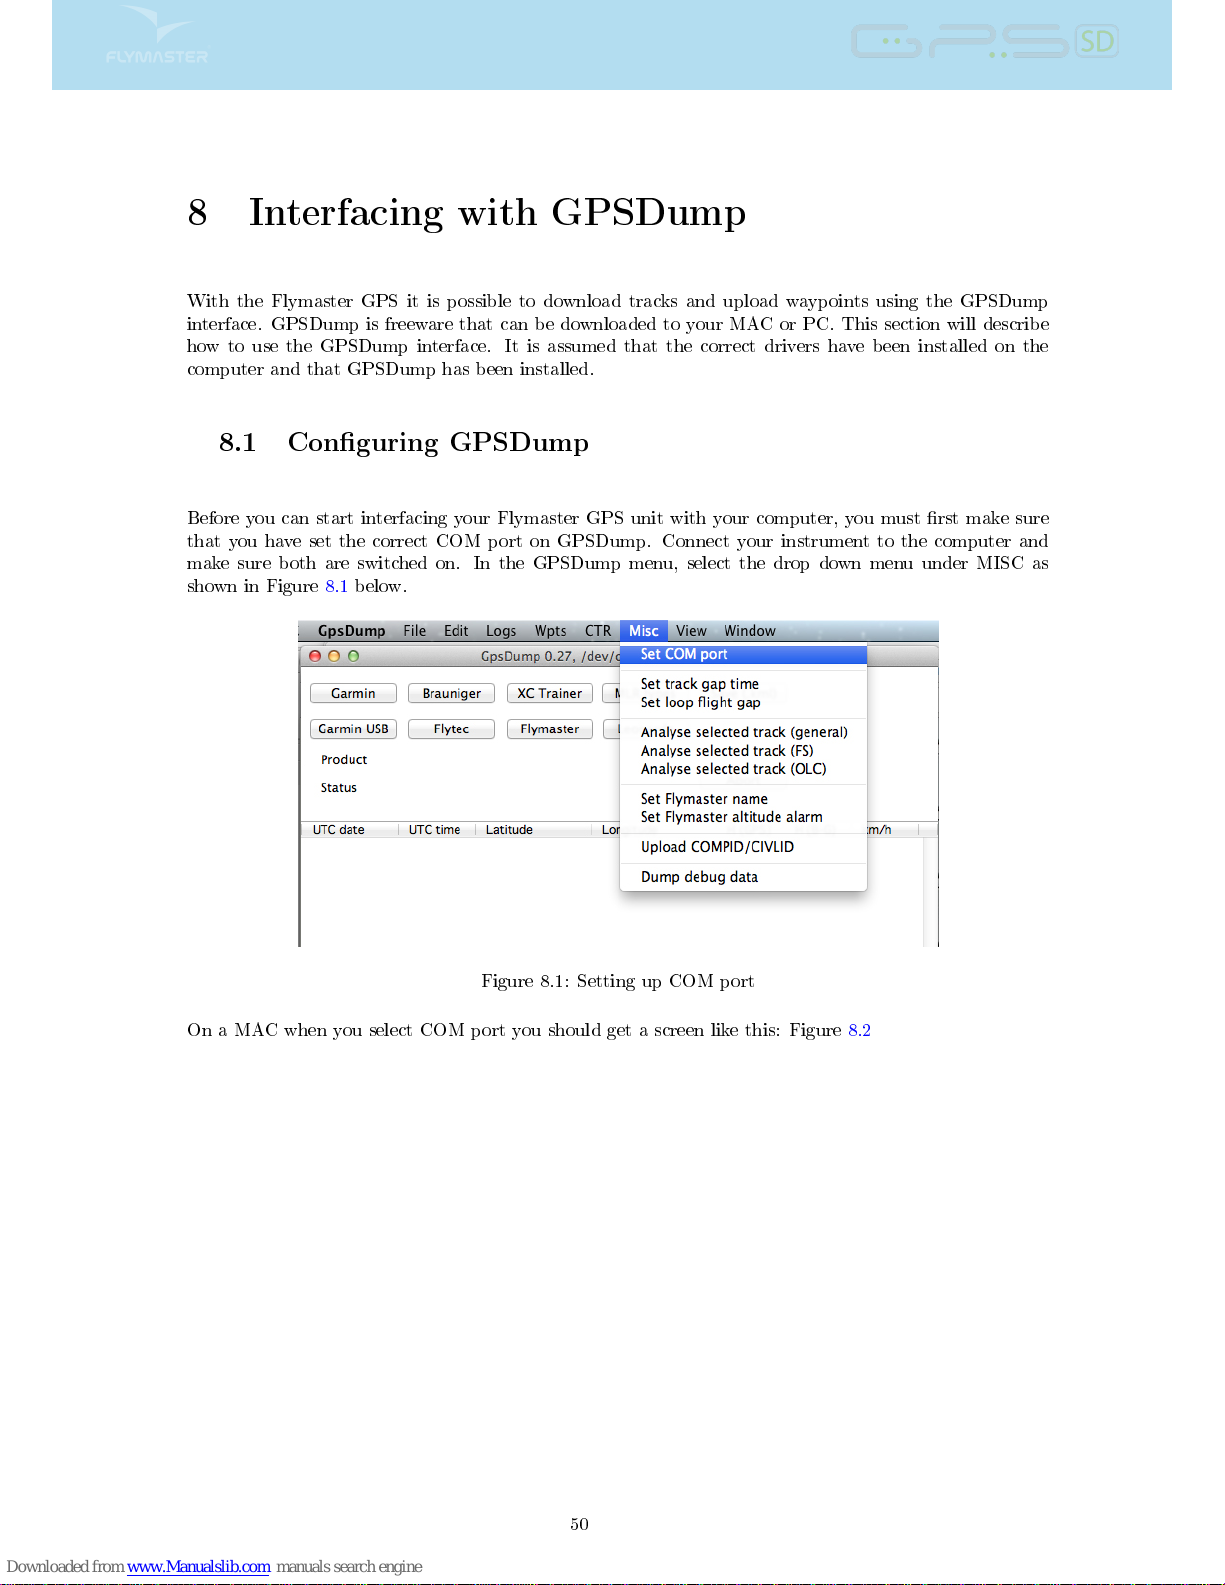
8 Interfacing with GPSDump
With the Flymaster GPS it is possible to download tracks and upload waypoints using the GPSDump
interface. GPSDump is freeware that can be downloaded to your MAC or PC. This section will describe
how to use the GPSDump interface. It is assumed that the correct drivers have been installed on the
computer and that GPSDump has been installed.
8.1 Conguring GPSDump
Before you can start interfacing your Flymaster GPS unit with your computer, you must rst make sure
that you have set the correct COM port on GPSDump. Connect your instrument to the computer and
make sure both are switched on. In the GPSDump menu, select the drop down menu under MISC as
shown in Figure 8.1 below.
Figure 8.1: Setting up COM port
On a MAC when you select COM port you should get a screen like this: Figure 8.2
50
Page 52
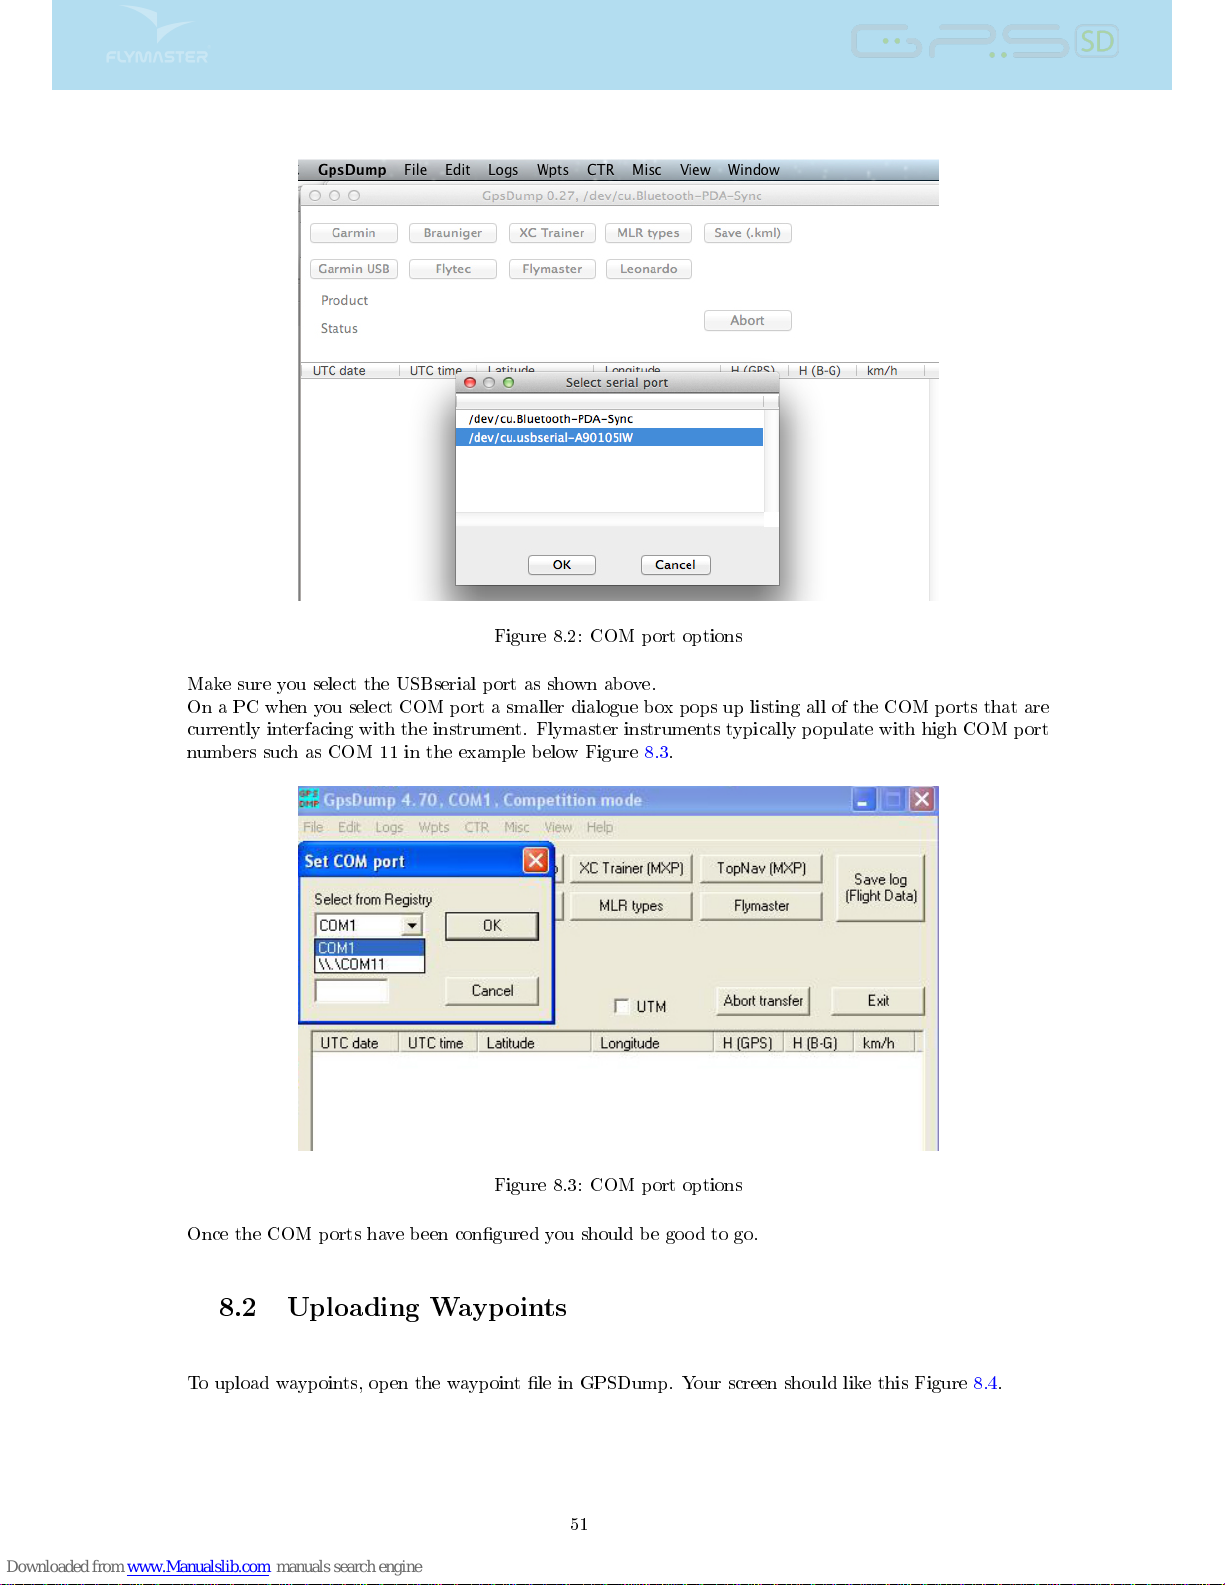
Figure 8.2: COM port options
Make sure you select the USBserial port as shown above.
On a PC when you select COM port a smaller dialogue box pops up listing all of the COM ports that are
currently interfacing with the instrument. Flymaster instruments typically populate with high COM port
numbers such as COM 11 in the example below Figure 8.3.
Figure 8.3: COM port options
Once the COM ports have been congured you should be good to go.
8.2 Uploading Waypoints
To upload waypoints, open the waypoint le in GPSDump. Your screen should like this Figure 8.4.
51
Page 53
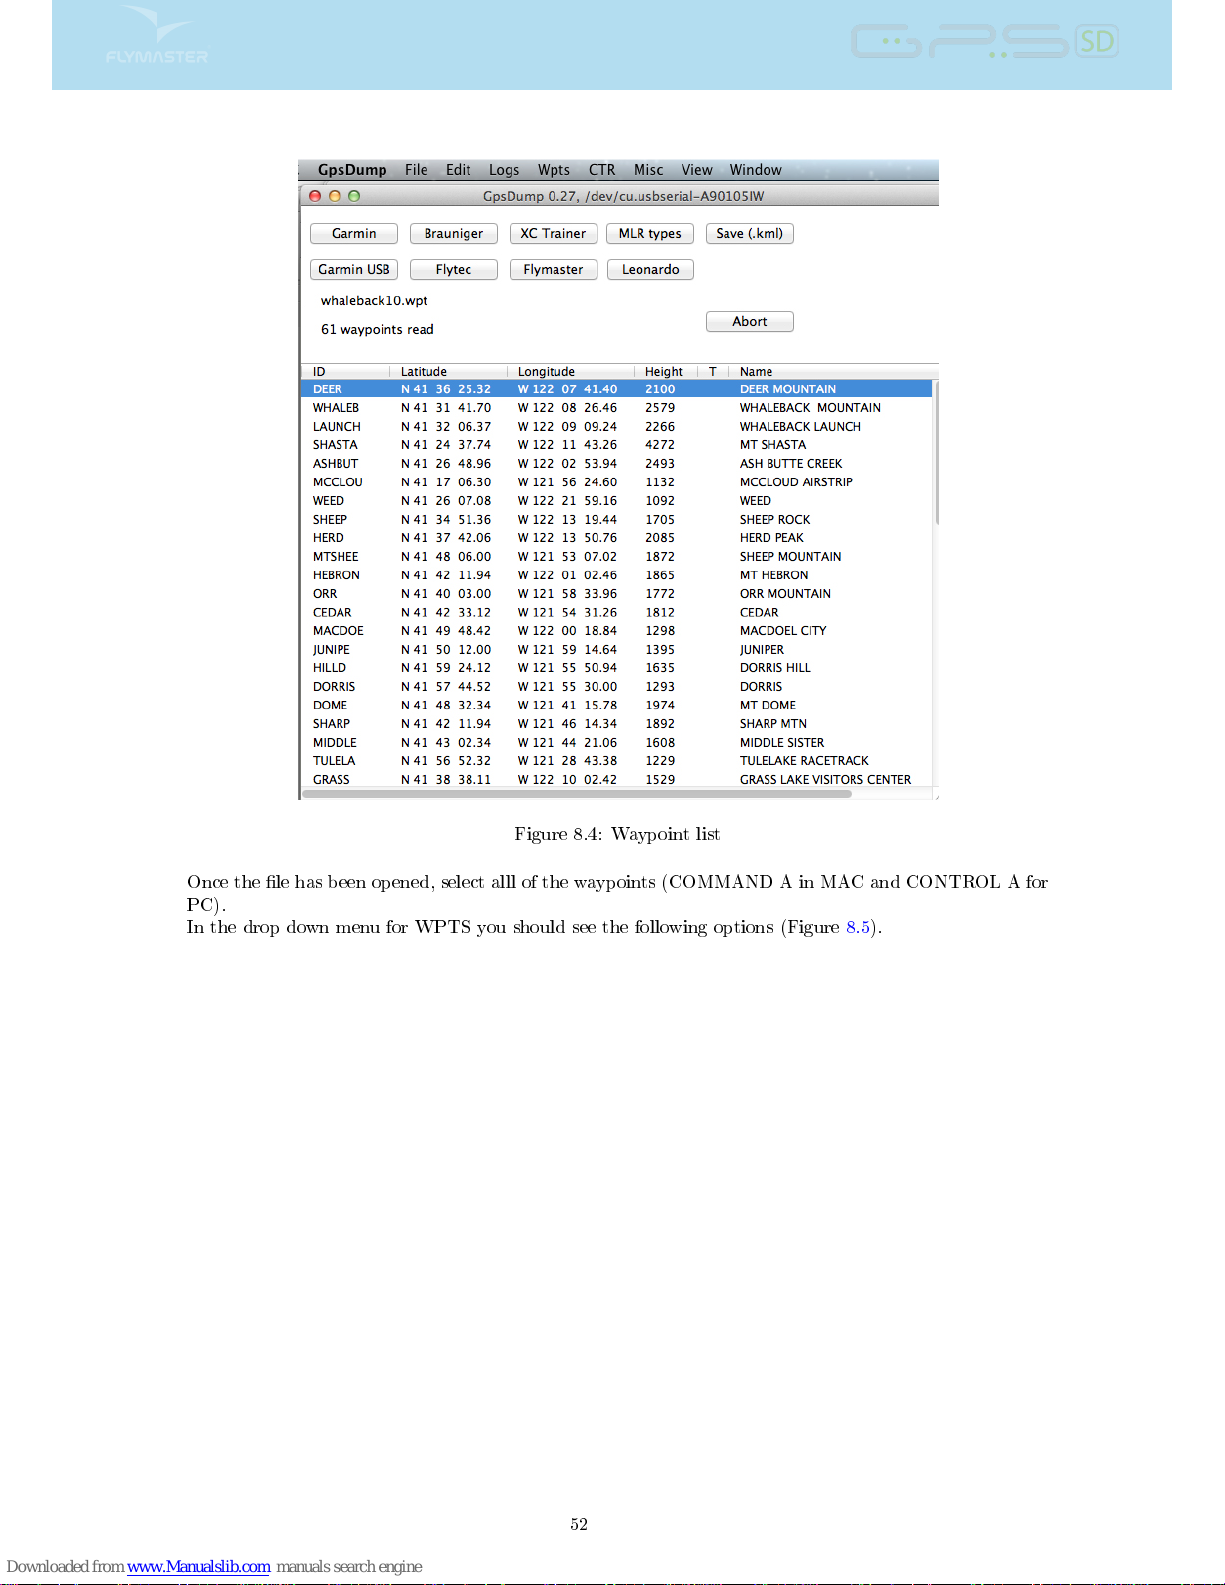
Figure 8.4: Waypoint list
Once the le has been opened, select alll of the waypoints (COMMAND A in MAC and CONTROL A for
PC).
In the drop down menu for WPTS you should see the following options (Figure 8.5).
52
Page 54
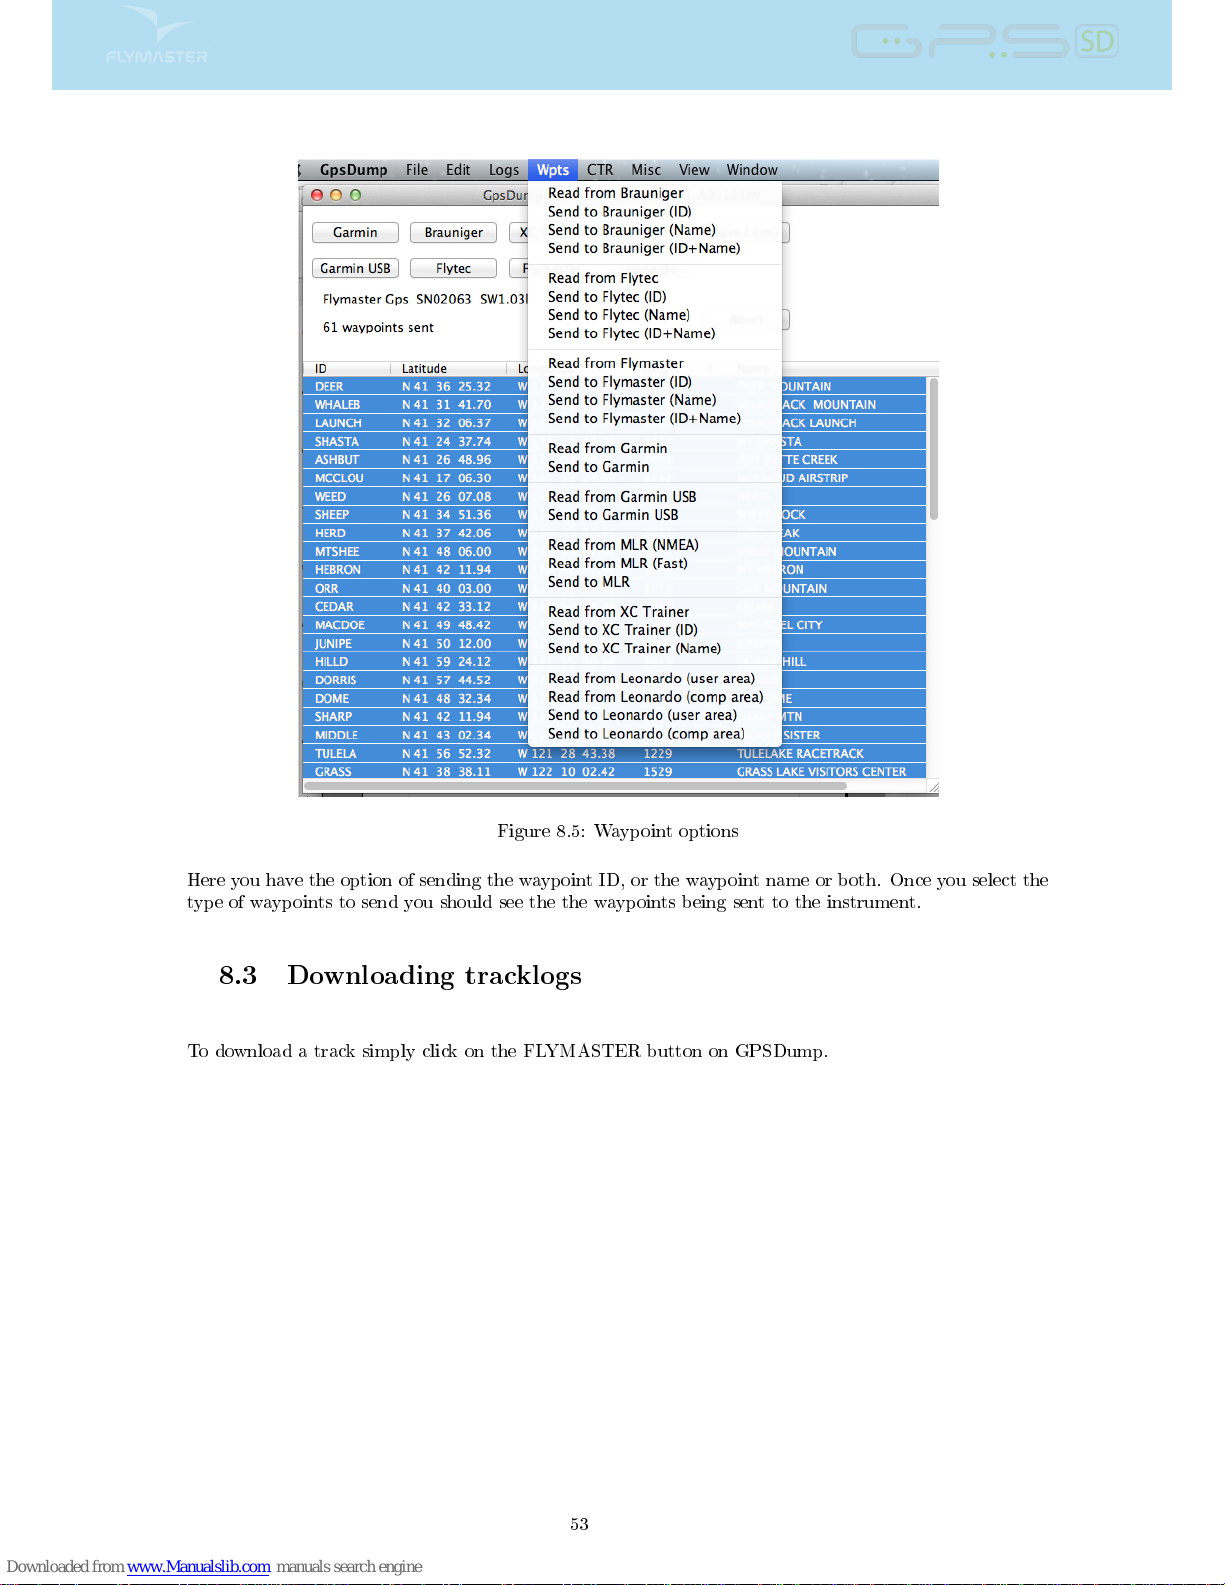
Figure 8.5: Waypoint options
Here you have the option of sending the waypoint ID, or the waypoint name or both. Once you select the
type of waypoints to send you should see the the waypoints being sent to the instrument.
8.3 Downloading tracklogs
To download a track simply click on the FLYMASTER button on GPSDump.
53
Page 55
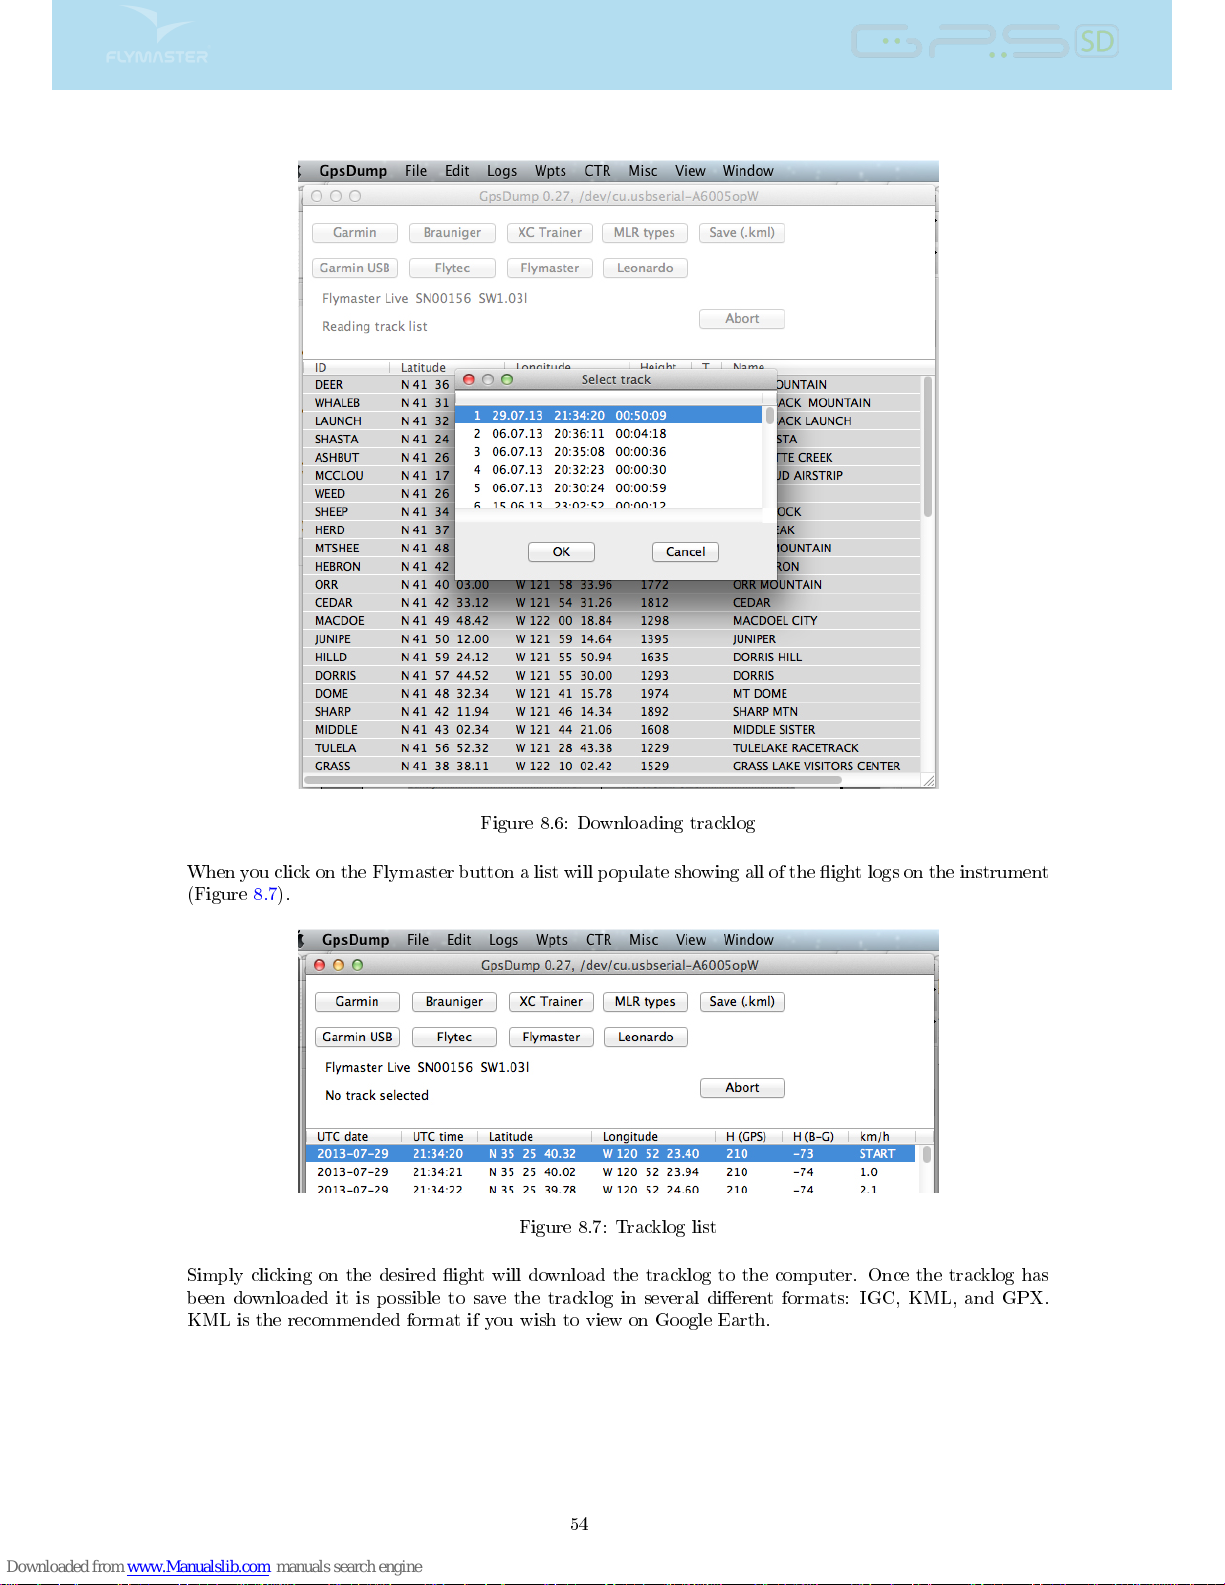
Figure 8.6: Downloading tracklog
When you click on the Flymaster button a list will populate showing all of the ight logs on the instrument
(Figure 8.7).
Figure 8.7: Tracklog list
Simply clicking on the desired ight will download the tracklog to the computer. Once the tracklog has
been downloaded it is possible to save the tracklog in several dierent formats: IGC, KML, and GPX.
KML is the recommended format if you wish to view on Google Earth.
54
Page 56
Index
Airspace Warning, 43
Base Frequency, 34
Climb Threshold, 33
Delete All Flights, 29
Delete Flight, 28
Flight Log, 27
Increments, 34
Memory capacity, 29
Sink Alarm, 34
Sink Threshold, 34
Sound
Volume, 34
Time
Setting, 33
Volume, 34
Wind Arrow, 14
55
 Loading...