

Page 1
Visit us at www.TestEquipmentDepot.com
99 Washington Street
Melrose, MA 02176
Fax 781-665-0780
TestEquipmentDepot.com
EtherScopeTM Series II
Network Assistant
Getting Started Guide
PN 2633787
May 2006, Rev. 1, 9/06
© 2006 Fluke Corporation. All rights reserved. Printed in USA.
All product names are trademarks of their respective companies.
Page 2

LIMITED WARRANTY AND LIMITATION OF LIABILITY
Each Fluke Networks product is warranted to be free from defects in material and workmanship under normal use and service. The warranty period for
the mainframe is one year and begins on the date of purchase. Parts, accessories, product repairs and services are warranted for 90 days, unless otherwise stated. Ni-Cad, Ni-MH and Li-Ion batteries, cables or other peripherals are all considered parts or accessories. The warranty extends only to the
original buyer or end user customer of a Fluke Networks authorized reseller, and does not apply to any product which, in Fluke Networks’ opinion, has
been misused, abused, altered, neglected, contaminated, or damaged by accident or abnormal conditions of operation or handling. Fluke Networks
warrants that software will operate substantially in accordance with its functional specifications for 90 days and that it has been properly recorded on
non-defective media. Fluke Networks does not warrant that software will be error free or operate without interruption.
Fluke Networks authorized resellers shall extend this warranty on new and unused products to end-user customers only but have no authority to extend
a greater or different warranty on behalf of Fluke Networks. Warranty support is available only if product is purchased through a Fluke Networks authorized sales outlet or Buyer has paid the applicable international price. Fluke Networks reserves the right to invoice Buyer for importation costs of
repair/replacement parts when product purchased in one country is submitted for repair in another country.
Fluke Networks warranty obligation is limited, at Fluke Networks option, to refund of the purchase price, free of charge repair, or replacement of a
defective product which is returned to a Fluke Networks authorized service center within the warranty period.
To obtain warranty service, contact your nearest Fluke Networks authorized service center to obtain return authorization information, then send the
product to that service center, with a description of the difficulty, postage and insurance prepaid (FOB destination). Fluke Networks assumes no risk for
damage in transit. Following warranty repair, the product will be returned to Buyer, transportation prepaid (FOB destination). If Fluke Networks determines that failure was caused by neglect, misuse, contamination, alteration, accident or abnormal condition of operation or handling, or normal
wear and tear of mechanical components, Fluke Networks will provide an estimate of repair costs and obtain authorization before commencing the
work. Following repair, the product will be returned to the Buyer transportation prepaid and the Buyer will be billed for the repair and return transportation charges (FOB Shipping point).
THIS WARRANTY IS BUYER’S SOLE AND EXCLUSIVE REMEDY AND IS IN LIEU OF ALL OTHER WARRANTIES, EXPRESS OR IMPLIED, INCLUDING BUT NOT
LIMITED TO ANY IMPLIED WARRANTY OR MERCHANTABILITY OR FITNESS FOR A PARTICULAR PURPOSE. FLUKE NETWORKS SHALL NOT BE LIABLE FOR
ANY SPECIAL, INDIRECT, INCIDENTAL OR CONSEQUENTIAL DAMAGES OR LOSSES, INCLUDING LOSS OF DATA, ARISING FROM ANY CAUSE OR THEORY.
Since some countries or states do not allow limitation of the term of an implied warranty, or exclusion or limitation of incidental or consequential damages, the limitations and exclusions of this warranty may not apply to every buyer. If any provision of this Warranty is held invalid or unenforceable by
a court or other decision-maker of competent jurisdiction, such holding will not affect the validity or enforceability of any other provision.
4/04
Fluke Networks
PO Box 777
Everett, WA 98206-0777
USA
Page 3

End User License Agreement (EULA)
The enclosed software product is furnished subject to the terms and conditions of the agreement. Retention of the software product for
more than thirty days, opening the sealed wrapper surrounding the product, or use of the product in any manner will be considered acceptance of the agreement terms. If these terms are not acceptable, the unused product and any accompanying written material should be
returned promptly to the Fluke Corporation or the place of purchase for a full refund of the license fee paid.
1. GRANT OF LICENSE. Fluke Networks, a division of Fluke Electronics Corporation (Fluke Networks) grants you the right to use the enclosed
software in accordance with the terms of this EULA.
2. TITLE, COPYRIGHT AND TRADEMARK. This software product is owned by Fluke Networks or its suppliers and is protected by United States
copyright laws and international treaty provisions. Therefore, except for the rights granted to you above, you must treat the software product like any other copyrighted material, and copies must include the proper copyright notice.
3. RESTRICTIONS. You may not reverse engineer, decompile, or disassemble the software. If the software product is an update, any transfer
must include the update and all prior versions.
You may use the software only in conjunction with the Fluke Networks products for which it is intended.
You may not export or re-export the software to any country to which such export or re-export is restricted by law or regulation of the
United States, or any other government having jurisdiction, without prior permission from Fluke Networks.
4. TERM. This license is effective upon your acceptance of the above agreement and shall remain in effect until termination by (a) written
notification to Fluke Networks or (b) a failure on your part to comply with the license agreement. Upon termination of the license agreement, you shall return to Fluke Networks or destroy all copies of the software product and associated written materials.
5. OTHER AGREEMENTS. Where terms or conditions of this agreement conflict with the terms or conditions of other agreements, this
agreement supersedes other agreements.
Page 4

End User License Agreement (continued)
6. LIMITED WARRANTY. Fluke Networks warrants that the software product will perform in its intended environment substantially in accordance with the accompanying written materials for a period of 90 days from the date of license acceptance. Fluke Networks further warrants that the original copy of the software has been recorded on non-defective media. Fluke Networks does not warrant that the software
will be error free or operate without interruption.
7. REMEDIES. Fluke Networks’ entire liability and your exclusive remedy shall be Fluke Networks’ option, (a) the return of the price paid for
the product, or (b) repair or replacement of the software product that does not meet the limited warranty. This limited warranty is void if
failure of the product has resulted from accident, abuse, or misapplication. Any replacement software product will be warranted for the
remained of the 90-day original warranty period or 30 days, whichever is longer.
8. NO OTHER WARRANTIES. FLUKE NETWORKS DISCLAIMS ALL OTHER WARRANTIES, EITHER EXPRESS OR IMPLIED BUT NOT LIMITED TO
IMPLIED WARRANTIES OF MERCHANTABILITY AND FITNESS FOR A PARTICULAR PURPOSE, WITH RESPECT TO THE SOFTWARE PRODUCT
AND THE ACCOMPANYING WRITTEN MATERIALS. In no event shall Fluke Networks or its suppliers be liable for any damages whatsoever
(including, without limitations, indirect, consequential, or incidental damages, damages for loss of business profits, business interruption,
loss of business information, or other pecuniary loss) arising out of the use or inability to use this software product, even if Fluke Networks
has been advised of the possibility of such damages.
This agreement and license shall be governed in the Unites States by the laws of the State of Washington, U.S.A., and elsewhere by the laws
of the country within which the agreement is made.
Page 5

Trademark Disclosure
Qtopia™ is a trademark of Trolltech, Inc.
CompactFlash® is a registered trademark of the CompactFlash Association.
CardBus® logo is a registered trademark of PCMCIA/JEiTA.
Linux® is a registered trademark of Linus Torvalds.
All trademarks are acknowledged.
Software Notice
The EtherScope™ Series II Network Assistant is powered in part by the Linux Operating System and other publicly available software. A
machine-readable copy of the corresponding source code is available for the cost of distribution. Please contact the Fluke Networks Technical Assistance Center (1-800-283-5853) and visit the GNU web site (http://www.gnu.org
) for more information.
Contains MatrixSSL™ security software licensed from PeerSec Networks Inc. See http://www.peersec.com for more information on MatrixSSL™ software.
Page 6

Table of Contents
Title Page
About This Guide .......................................................................................................... 1
Introduction .................................................................................................................. 1
Features .................................................................................................................... 2
Available Models...................................................................................................... 2
Available Options..................................................................................................... 3
Package Contents..................................................................................................... 4
Optional Accessories ................................................................................................ 9
Safety and Operational Information....................................................................... 10
Registering Your EtherScope Series IINetwork Assistant ....................................... 12
Care and Maintenance............................................................................................. 13
Contacting Fluke Networks ..................................................................................... 13
Before You Begin.......................................................................................................... 14
Turning the Instrument On and Off........................................................................ 14
Using the Stylus........................................................................................................ 15
Selecting the LAN or WLAN Interface..................................................................... 15
i
Page 7

EtherScope™
Getting Started Guide
Adjusting the Brightness of the Screen.................................................................. 16
Setting the Time and Date...................................................................................... 16
Updating the Instrument’s Software...................................................................... 17
Recalibrating the Screen ......................................................................................... 18
Enabling Software Options..................................................................................... 18
Displaying Hardware and Software Version Information ..................................... 19
The Power Supply .................................................................................................... 19
Operating the Instrument on Battery Power .................................................... 20
Operating the Instrument on AC Power............................................................ 22
EtherScope Network Assistant’s Physical Features................................................. 24
Locating the Network Connections ................................................................... 24
Locating the External Interfaces ........................................................................ 25
Locating the External Power Connection.......................................................... 25
Status LEDs .......................................................................................................... 27
Power LED ........................................................................................................... 29
The User Interface.................................................................................................... 30
Screen Layout...................................................................................................... 30
Navigating the User Interface ............................................................................ 33
Personalizing Your EtherScope Network Assistant................................................ 34
Getting Help ............................................................................................................ 35
Accessing the Documentation Online .................................................................... 35
Monitoring and Troubleshooting a Wired LAN.......................................................... 36
Connecting to a Wired Network............................................................................. 37
Viewing AutoTest Results........................................................................................ 38
Connection Test .................................................................................................. 39
Local Statistics Test.............................................................................................. 47
Device Discovery Test.......................................................................................... 52
Network Discovery Test ...................................................................................... 56
ii
Page 8

Contents
VLAN Discovery Test............................................................................................ 57
Nearest Switch Test ............................................................................................. 59
Switch Scan Test .................................................................................................. 60
Key Devices Test .................................................................................................. 62
Problem Detection .............................................................................................. 64
Deleting a Problem from the Log....................................................................... 66
RFC 2544 Tests .......................................................................................................... 67
The Remote Device.............................................................................................. 67
Configuring the RFC 2544 Tests.......................................................................... 68
Running an RFC 2544 Test................................................................................... 70
Results .................................................................................................................. 70
ITO Tests ................................................................................................................... 71
Traffic Generator................................................................................................. 71
Throughput Test.................................................................................................. 72
Configuring the Instrument for a Wired LAN......................................................... 74
TCP/IP Settings ..................................................................................................... 75
802.1Q/IP TOS Settings ........................................................................................ 76
802.1X Settings.................................................................................................... 78
Connection Log ................................................................................................... 79
Ethernet Settings................................................................................................. 79
Instrument Security Settings............................................................................... 79
General Settings .................................................................................................. 81
Monitoring and Troubleshooting a Fiber LAN............................................................ 82
Installing and Removing an SFP Fiber Adapter ...................................................... 83
Monitoring and Troubleshooting a Wireless LAN....................................................... 85
Installing the WLAN Card ........................................................................................ 85
Viewing AutoTest Results ........................................................................................ 86
Connection Test................................................................................................... 87
(continued)
iii
Page 9

EtherScope™
Getting Started Guide
Channels Test ...................................................................................................... 88
Device Discovery Test.......................................................................................... 91
Network Discovery.............................................................................................. 94
Site Survey ........................................................................................................... 95
Security Scan........................................................................................................ 97
Key Devices Test.................................................................................................. 98
Problem Detection.............................................................................................. 98
Configuring the Instrument for a Wireless LAN..................................................... 98
Wireless TCP/IP Settings ...................................................................................... 99
Wireless Security Settings ................................................................................... 99
Connection Log................................................................................................... 100
Wireless Radio Settings....................................................................................... 100
Wireless Instrument Security Settings................................................................ 101
Wireless General Settings ................................................................................... 102
Wireless Authorization Settings......................................................................... 102
Wireless Problem Settings .................................................................................. 104
Documenting Your Network (LAN and WLAN) .......................................................... 105
Saving a Report........................................................................................................ 105
Managing Reports ................................................................................................... 106
Viewing a Report ................................................................................................ 106
Renaming a Report............................................................................................. 107
Deleting a Report................................................................................................ 107
Performing a Site Survey (WLAN only)................................................................... 107
Running the Diagnostic Tests ...................................................................................... 108
Ping........................................................................................................................... 109
Trace Route.............................................................................................................. 109
Trace Switch Route .................................................................................................. 109
Wireless Throughput ............................................................................................... 110
iv
Test Equipment Depot - 800.517.8431 - 99 Washington Street Melrose, MA 02176
FAX 781.665.0780 - TestEquipmentDepot.com
Page 10

Contents
Locate ....................................................................................................................... 111
Link ........................................................................................................................... 112
Login Diagnosis ........................................................................................................ 112
Signal Strength......................................................................................................... 112
WLAN Statistics......................................................................................................... 112
Tx/Rx Rate ................................................................................................................. 113
Accessing the Instrument Remotely (LAN only) .......................................................... 113
Using the Desktop Tools............................................................................................... 117
Applications Menu................................................................................................... 117
Tools Menu............................................................................................................... 118
Troubleshooting Your Instrument ............................................................................... 119
Specifications................................................................................................................. 123
Index
(continued)
v
Page 11

List of Tables
Table Title Page
1. List of Standard Accessories................................................................................................. 6
2. Optional Accessories ............................................................................................................ 9
3. International Electrical Symbols .......................................................................................... 10
vii
Page 12

List of Figures
Figure Title Page
1. Standard Accessories............................................................................................................ 5
2. Charging and Removing the Battery .................................................................................. 23
3. EtherScope Network Assistant’s Physical Features ............................................................. 26
4. Status LEDs ........................................................................................................................... 27
5. Screen Level-Help................................................................................................................. 35
6. LAN Test Results Screen ....................................................................................................... 38
7. Testing Cables ...................................................................................................................... 40
8. Cable Verification Screen..................................................................................................... 42
9. Signal Verification Screen.................................................................................................... 46
10. Local Statistics Summary ...................................................................................................... 47
11. Utilization History Screen .................................................................................................... 49
12. Device Discovery Screen....................................................................................................... 54
13. Device Details Screen ........................................................................................................... 54
14. VLAN Discovery Screen ........................................................................................................ 58
15. Nearest Switch Summary ..................................................................................................... 59
16. Switch Scan Screen............................................................................................................... 61
17. Key Devices Screen ............................................................................................................... 62
ix
Page 13

EtherScope™
Getting Started Guide
18. Problem Log......................................................................................................................... 65
19. Traffic Generation Screen ................................................................................................... 72
20. Throughput Test Results...................................................................................................... 74
21. Instrument Settings—TCP/IP Screen.................................................................................... 75
22. Instrument Settings–Security Screen- ................................................................................. 80
23. Inserting the Fiber Adapter................................................................................................. 84
24. Wireless LAN Test Results Screen ........................................................................................ 86
25. Channel Test Details Screen ................................................................................................ 89
26. Security Scan ........................................................................................................................ 97
27. Wireless Instrument Settings—TCP/IP Screen..................................................................... 99
28. Wireless Instrument Settings—Instrument Security Screen............................................... 101
29. Wireless Instrument Settings—Authorization Screen........................................................ 103
30. Wireless Instrument Settings—Wireless Problems Screen ................................................. 104
31. Trace Switch Route Screen .................................................................................................. 110
32. Web Server Home Page....................................................................................................... 114
x
Page 14

EtherScope™ Series II Network Assistant
About This Guide
This EtherScope™ Series II Network Assistant Getting
Started Guide introduces you to the features and
functions of your EtherScope™ Series II Network
Assistant and provides basic instructions for setting up
and operating the instrument. The information in this
guide is designed to help you become comfortable using
your new instrument. After reading this guide, you will
find the online help system the best source for answering
questions and helping use the product to maintain your
network and troubleshoot problems as they arise.
Introduction
EtherScope™ Series II Network Assistant (hereafter also
referred to as “the instrument” or “EtherScope Network
Assistant”) is a portable, integrated network test tool
designed to assist you with installing, monitoring, and
troubleshooting wired and/or wireless Local Area
Networks (LANs). EtherScope Network Assistant gives you
instant visibility into your network, providing crucial
information about its health and status so that you can
proactively identify and solve problems before they
impact performance.
1
Page 15

EtherScope™ Series II
Getting Started Guide
Features
EtherScope Network Assistant provides critical
performance metrics about your wired and wireless
LANs. The instrument’s autotest feature quickly verifies
performance at the physical layer, discovers networks
and devices, and identifies configuration and
performance problems. For in-depth analysis, the
instrument also includes a group of diagnostic tools to
enable you to locate devices on your network and verify
inter-connectivity.
The instrument’s user interface, which is presented on a
color, touch-sensitive screen, is straightforward and
intuitive. Simply by tapping a screen button, a navigation
icon, or other on-screen element, you can “drill down”
and obtain more detailed information or perform a
specific operation.
Available Models
EtherScope Network Assistant is available in the
following models:
• Wired LAN model (ES2-LAN): a base model that
supports monitoring and testing of 10/100/1000 IEEE
802.3 (10BaseT, 100BaseTX, and 1000BaseT)
networks through an RJ-45 interface, and the
optional SFP fiber interface that supports
1000BaseSX, 1000BaseLX, and 1000BaseZX fiber.
Discovers devices, networks, and VLANs, enabling
you to view individual configurations, obtain health
and status information, and view network activity,
errors, and protocols used.
2
Page 16

Network Assistant
Introduction
• Wireless LAN model (ES2-WLAN): a base model that
supports monitoring and testing of 802.11 a/b/g
devices connected to a wireless LAN. Automatically
scans all channels to gather and report statistics on
the health and status of the network. Discovers
access points (APs) and client devices, identifies “top
talkers”, locates rogue devices and flags security
problems. Enables you to perform site surveys so that
you can make sure that all areas of your network
have adequate signal coverage. Also performs
security login verification.
• EtherScope Pro (ES2-PRO): a single integrated
wired/wireless analyzer that combines the features
of the wired and wireless models (described earlier).
• EtherScope Pro with the Internet Throughput
Option (ES2-PRO-I): a single, integrated
wired/wireless analyzer that combines the features
of the wired and wireless models (described earlier).
This model includes the Internetwork Throughput
Option (ITO). See the description of the ES-ITO-OPT
option under “Available Options”.
Available Options
You can expand your ability to monitor and troubleshoot
your site’s LANs by adding the following options to a
base-model EtherScope Network Assistant:
• ES2-WLAN OPT: extends the network test capability
of an ES2-LAN to include support for monitoring and
testing of 802.11 a/b/g wireless LAN. See the
description of ES2-WLAN model under “Available
Models”.
• ES2-LAN OPT: extends the network test capability of
an ES2-WLAN to include support for monitoring and
testing of 10/100/1000 IEEE 802.3 (10BaseT,
100BaseTX, and 1000BaseT) networks through an RJ45 interface. See the description of ES2-LAN model
under “Available Models”.
3
Page 17

EtherScope™ Series II
Getting Started Guide
• ES2-ITO-OPT: (Internetwork Throughput Option)
enables you to test the bandwidth available
between two nodes on a network. This option
enables the EtherScope Network Assistant to
generate a background traffic load to test new
systems and configuration or to simulate the impact
of additional users on a network.
• ES2-SX-OPT: enables the SFP fiber interface. Supports
1000BaseSX, 1000BaseLX, or 1000BaseZX fiber.
For information on these options, contact Fluke
Networks.
Package Contents
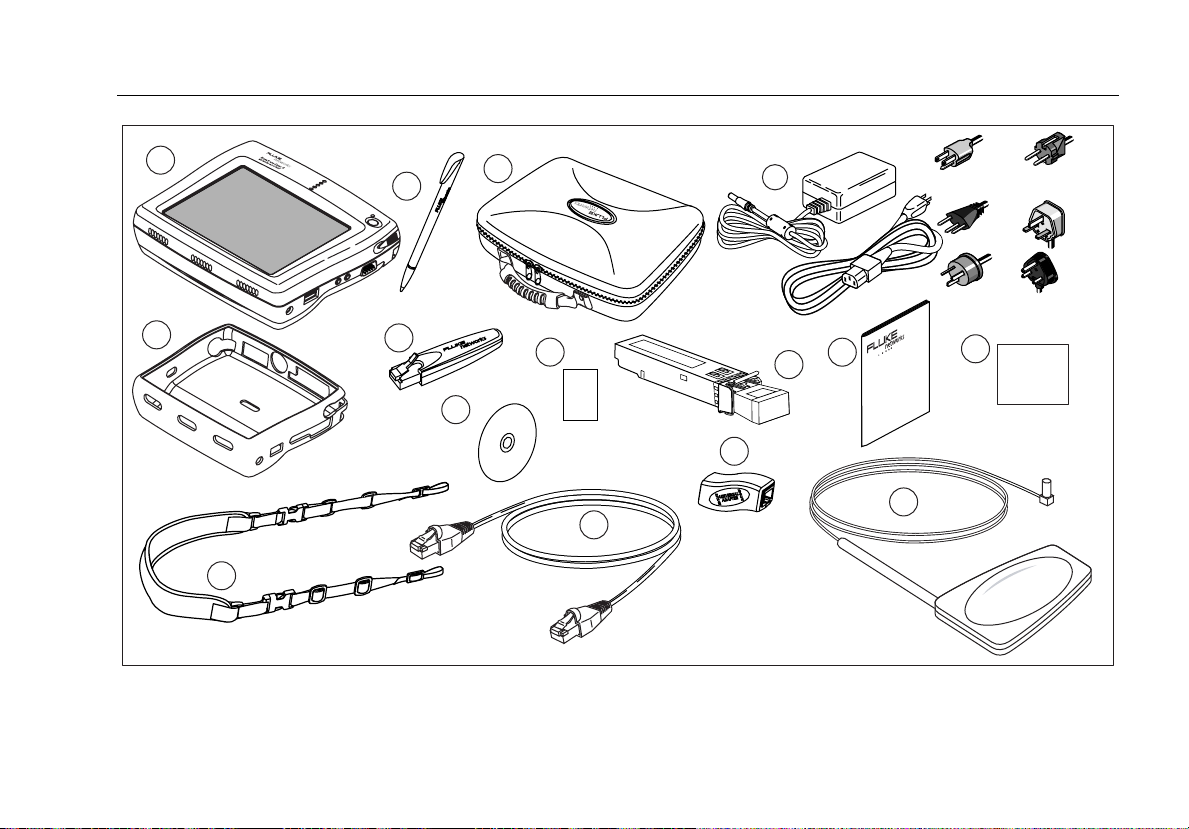
Take a moment to check the shipping container to make
sure that the contents match each numbered standard
accessory that is shown in Figure 1 and the accompanying
list in Table 1.
If any item is damaged, call the carrier at once for
inspection and request an inspection report. Please do
not write the factory until you have notified the carrier,
since this will delay your claim. If this precaution is not
taken, we cannot assist you in recovering the amount of
the claim against the carrier.
After you obtain the carrier's inspection report,
immediately return the instrument along with a copy of
the inspection report to the factory. See “Contacting
Fluke Networks” on page 13 for various ways to contact
us.
4
Test Equipment Depot - 800.517.8431 - 99 Washington Street Melrose, MA 02176
FAX 781.665.0780 - TestEquipmentDepot.com
Page 18
Network Assistant
Introduction
1
LINK
UTILIZATION
COLLISION
ERROR
TRANSMIT
2
3
6
4
8
WLAN
5
10
9
LC-1
North American
LC-5
Swiss
LC-6
Australia
11
CompactFlash
Memory Card
LC-3
Europe
LC-4
UK
LC-7
South Africa
7
14
15
13
12
eih04f.eps
Figure 1. Standard Accessories
5
Page 19

EtherScope™ Series II
Getting Started Guide
Table 1. List of Standard Accessories
Item
Number
A
B
C
D
E
F
Item Description
EtherScope™ Series II Network
Assistant
Holster Removable, form-fitting yellow holster.
Stylus Stylus for use with the instrument’s touch screen display.
Storage Case Case for carrying and storing the instrument.
External AC adapter,
charger, power cord
WireView™ wiremap adapter
(office locator)
EtherScope Series II Network Assistant mainframe.
Input: 90V -264V AC, 50/60Hz; Output: 15V DC, 1.3A (20W); Power
Cord termination varies by country.
Cable termination device with office locator ID #1. Used to perform
the Cable Test wiremap operation and used as an office locator.
6
Page 20

Network Assistant
Introduction
Table 1. List of Standard Accessories (continued)
Item
Number
G
H
I
J
K
L
Item Description
CD-ROM EtherScope Resource CD. Includes On-line Help and Getting Started
Guides.
WLAN card Fluke Networks EtherScope Wireless LAN Adapter IEE 802.11 a/b/g. This is
a standard accessory for the ES2-WLAN, ES2-PRO, and ES2-PRO/I models.
ES2-SX-Pro fiber adapter Fluke Networks EtherScope Fiber LAN Adapter 1000BASE-SX. This is
a fiber accessory for the ES2-SX-PRO, and ES2-SX-PRO/I models. Also
available are the 1000Base-LX and 1000BASE-ZX option.
Getting Started Guide
CompactFlash® memory card CompactFlash® memory card used for saving reports.
Carrying Strap Strap clips to the instrument for easy carrying.
Provides basic operating and introductory troubleshooting information,
lists of accessories, and specifications.
7
Page 21

EtherScope™ Series II
Getting Started Guide
Table 1. List of Standard Accessories (continued)
Item
Number
M
N
O
Not
Shown
Item Description
Network Patch Cord 1 meter patch cord.
Universal adapter RJ-45 Female to female adapter. It is intended to be used to connect a
RJ-45 Ethernet cable from the instrument to a WireView™ wiremap
adapter.
External directional antenna Directional antenna for use with WLAN card to locate WLAN devices
Battery Pack Rechargeable Lithium Ion battery pack installed in the instrument.
8
Page 22

Network Assistant
Introduction
Optional Accessories
Additional accessories available for purchase for your EtherScope Network Assistant are listed in Table 2. Contact Fluke
Networks for buying information (see “Contacting Fluke Networks” on page 13).
Table 2. Optional Accessories
Item Description
EtherScope Extended Test Kit The EtherScope Extended Test Kit includes additional accessories: spare rechargeable
battery, external battery charger, external mini keyboard, wiremap adapters (#2-6)
WireView wiremap adapters Set of five wiremap adapters with office locator IDs #2 through #6
External Keyboard USB mini keyboard
Battery Pack Rechargeable Lithium Ion battery pack
External Battery Charger External battery charging station
9
Page 23

EtherScope™ Series II
Getting Started Guide
Safety and Operational Information
The international electrical symbols used in this document and on the instrument are described in Table 3.
Table 3. International Electrical Symbols
j
W
P
Not for connection to public telephone systems
Please read the manual for safety information
Complies with European Union Directive
X Shock hazard
*
10
Class 1 Laser Product. Do not look into the
laser.
)
w
/
Complies to CSA C22.2 No. 950 Canadian
standards, and UL 1950 (US standards)
Do not dispose of Lithium Ion batteries in
garbage, recycle
Meets Australia EMC requirements
Recycle Lithium Ion batteries
Page 24

Network Assistant
Introduction
Please observe the following safety regulations when
using your EtherScope Network Assistant:
*
Warning Class 1 Laser Product
W
This product contains a Class 1 laser (EtherScope
Fiber Models). Do not look into the laser port
because this may cause eye injury.
XWWarning
To avoid possible electric shock or personal
injury, follow these guidelines:
• Do not use this product if it is damaged.
Before using the product, inspect the case.
Look for cracked or missing plastic.
• Do not operate the product around
explosive gas, vapor, or dust.
• Do not open the case. There are no user-
serviceable parts inside.
• Do not connect a telephone line to this
product.
• If this product is used in a manner not
specified by the manufacturer, the
protection provided by the product may be
impaired.
WCaution
• To avoid possible damage to the
instrument and to the equipment under
test, use the proper terminals and cable
for all connections.
• Use of controls or adjustments or
performance of procedures other than
those specified herein may result in
hazardous radiation exposure
(EtherScope Fiber Models).
11
Page 25

EtherScope™ Series II
Getting Started Guide
Registering Your EtherScope Series IINetwork Assistant
Take the time to register your instrument. The EtherScope
Resource CD contains registration information and
instructions.
You can also register the instrument by going to our
website at www.flukenetworks.com
1. Click support, then click the Registration link to
display a login screen.
2. Do one of the following:
• If you are a returning visitor, follow the login
instructions.
• If need to set up an account, click Create then
follow the new account instructions.
. To register:
3. Click Register your product and fill out the online
registration form.
As a registered user, you are entitled to entrylevel product support. This includes basic access to the
online Knowledge Base library of product operation and
application information and web-based trouble ticketing.
In addition, you will receive Fluke Networks company and
product information updates.
After registering the product, make sure that you have
the latest software installed. See “Updating the
Instrument’s Software” on page 17 for details.
12
Page 26

EtherScope™ Series II
Getting Started Guide
Before You Begin
The information in this section acquaints you with the
basic operations and functions of your instrument so that
you can start using it immediately. You will learn how to:
• Turn on the instrument and configure the interface
type for testing an Ethernet 802.3/802.1x wired or an
802.11 wireless network
• Adjust the brightness of the screen
• Set the date and time
• Update the instrument’s software
• Charge the battery
• Navigate the user interface and understand the
meanings of the LEDs
• Get Help
Turning the Instrument On and Off
To turn the EtherScope Network Assistant on, press the
green On/Off button. This button is located on the right
side of the instrument’s front panel.
The front page Test Results screen is displayed (see Figure
6 or Figure 24).
Note
When you turn on the instrument (wired mode
only), you may hear a series of clicks. These
sounds are a normal part of the boot-up and
cable testing process and do not indicate a
problem with the instrument.
To turn off the instrument, press and hold the On/Off
button until the instrument turns off (approximately two
seconds). The On/Off LED will blink when the instrument
is turned off and connected to the AC adapter charger
indicating that the battery is charging.
14
Test Equipment Depot - 800.517.8431 - 99 Washington Street Melrose, MA 02176
FAX 781.665.0780 - TestEquipmentDepot.com
Page 27
Network Assistant
Before You Begin
Using the Stylus
The stylus, which is used for navigating the user interface,
is stored in the right side panel near the green On/Off
button.
In the same way that you use a mouse to click elements
on your computer screen, you use the stylus to “tap”
elements on the instrument’s touch-sensitive screen.
To select elements and execute commands, simply tap the
item with the point of the stylus. In addition, use the
stylus to drag a slider or move the scroll box on the scroll
bar.
Note
Always use the point of the stylus to tap the
screen. We do not recommend that you use a
pen or pencil or any other sharp object that
might scratch the finish.
Selecting the LAN or WLAN Interface
If your instrument has the capability to test both a wired
LAN (RJ-45 or SFP fiber interfaces) and a wireless LAN, you
need to specify which technology you are testing.
1. On the front page, do the following:
• Tap
interfaces.
OR
• Tap
or SFP fiber interfaces.
2. On the Change Active Port screen, tap
change the interface.
The instrument resets itself and runs autotest on the
selected interface.
The interface type you select remains the same
even after you power off the instrument.
(see Figure 6) to test wireless
(see Figure 24) to test the RJ-45
to
Note
15
Page 28
EtherScope™ Series II
Getting Started Guide
Adjusting the Brightness of the Screen
Note
The degree of brightness is a significant factor in
conserving battery power. Turning the
brightness up causes the instrument to use more
battery power.
To adjust the brightness:
1. Tap
2. Tap the Light & Power icon
3. On the Light and Power screen, you can do the
4. Click
then select Settings.
.
following:
• Select the desired Power saving settings. To do
this, tap (to check) an option. Then, for each
option, specify a time interval.
• Adjust the brightness. To do this, tap and drag
the slider control until the desired level of
brightness is achieved.
to save the settings.
Setting the Time and Date
The current time is displayed in the lower right corner of
the status bar. To change the time and date, do the
following:
1. Tap the current time.
2. Select Set time to display the Date/Time screen.
3. Select date and time settings and formats.
4. Tap
The instrument now displays the new time on the
status bar.
to save your changes.
16
Page 29
Network Assistant
Before You Begin
Updating the Instrument’s Software
To update the instrument’s software, do the following:
1. Insert a CompactFlash memory card into SLOT 2.
2. Tap the EtherScope Network Assistant icon
which is located in the upper-left corner of the screen
3. From the drop-down list, select Instrument Settings.
4. In the preview pane, tap Version.
The Instrument Settings—Version screen displays the
versions of currently installed software and hardware.
5. To check for updates, tap .
The instrument automatically checks to determine
whether a software update is available.
,
6. When prompted, tap
files to the CompactFlash memory card.
All files and reports on the CompactFlash
memory card will be erased.
7. After you are notified that the download is
completed, tap
8. With the CompactFlash card in SLOT 2, restart the
instrument to begin installing the software.
A software update can take up to five minutes.
After installation is completed, the instrument
automatically restarts and you can resume testing.
If you encounter trouble updating the software, contact
our Technical Assistance Center. See “Contacting Fluke
Networks” on page 13 for contact information.
to download the update
Note
.
Note
17
Page 30
EtherScope™ Series II
Getting Started Guide
Recalibrating the Screen
The touch-sensitive screen is calibrated at the factory.
Though unlikely, the instrument may not respond
properly when you tap the stylus on the screen. If this
happens, you may need to recalibrate the screen.
Recalibration aligns the instrument’s internal circuitry
with the screen so that it can correctly detect taps with
the stylus.
To recalibrate your screen:
1. Using the stylus, tap the desktop icon
located in the lower-left corner of the screen. From
the menu, select Settings.
2. On the Settings screen, tap the Recalibrate icon
Follow the prompts to complete the recalibration.
, which is
Enabling Software Options
If you purchased a software option for your EtherScope
Network Assistant, you received a proof-of-purchase code
along with a software option activation instruction card.
Follow the instructions on the card to obtain a key code
from the Fluke Networks website and use that key code
to activate your option.
Note
If you need help obtaining your key code,
contact Fluke Networks for assistance. See
“Contacting Fluke Networks” on page 13 for
information on how to contact us.
.
To enable one or more software options, have your
instrument’s key code handy, and then do the following:
1. Tap
screen).
2. From the drop-down list, select Instrument Settings.
Then, in the preview pane, tap the Options hyperlink.
The Options screen is displayed.
(located in the upper-left corner of each
18
Page 31

Network Assistant
Before You Begin
3. In the Current Key Code box, enter your key code.
Note
You can use a remote keyboard or tap
to
access the virtual keyboard.
4. In the EtherScope Options group, tap (to check) each
software option that you want to activate.
5. Tap
The software options you selected are now enabled.
Displaying Hardware and Software Version Information
1. Tap the EtherScope Network Assistant icon ,
which is located in the upper-left corner of the screen
2. From the drop-down list, select Instrument Settings.
3. In the preview pane, tap Version.
The Instrument Settings—Version screen displays the
versions of currently installed software and hardware.
The Power Supply
You can operate the instrument by using the rechargable
Lithium-Ion battery. Alternatively, you can use the
supplied AC adapter charger (with or without the battery
installed).
Note
Although the instrument can run on the AC
adapter without the battery pack installed, this
method is not recommended. The battery pack
provides stability for the instrument when you
are using the stand.
19
Page 32

EtherScope™ Series II
Getting Started Guide
Operating the Instrument on Battery Power
When the instrument is running on battery power, it is
capable of approximately four full hours of operation in
wired mode and 3.5 hours in wireless mode. The
instrument comes packaged with the battery installed. To
operate on battery power, simply turn the instrument on.
Although the battery is pre-charged at the factory, you
should fully charge it before you begin using the
instrument. This is an important step because if the power
source is interrupted while you are operating the
instrument, you will lose data.
Charging the Battery
Figure 2 shows you how to charge the battery. Note that
you can charge the battery while it is installed or you can
remove it and charge it in an external battery charger.
Note
The On/Off led will blink when the instrument is
turned off and connected to the AC adapter
charger.
You can purchase an extra battery and/or
charger separately or as part of the EtherScope
Network Assistant Extended Kit (see Table 2).
20
Page 33

Network Assistant
Before You Begin
When fully discharged, the battery takes approximately 4
1/2 hours to reach a full charge if the instrument is
powered off. It takes approximately 7 hours to fully
charge the battery if the instrument is powered on.
Checking the Status of the Battery Charge
To find out how much battery power remains, tap the
battery icon
of every screen.
Conserving Battery Power
One way to conserve battery power is to put the
instrument in Suspend mode. This is a low-power usage
mode, in which the instrument is not completely turned
on or off. While in Suspend mode, the instrument cannot
collect data.
• To put the instrument in Suspend mode, tap
select Suspend. Alternatively, press the green
On/Off button for less than one second.
The green LED turns amber and the screen changes
to blank.
which is located in the lower-right corner
,
then
• To take the instrument out of Suspend mode, press
the On/Off button. Release this button as soon as the
LED turns green.
The screen that was displayed prior to your putting
the instrument in Suspend mode is redisplayed.
Note
Another way to save battery power is to use a
lower backlight setting. See “Adjusting the
Brightness of the Screen” on page 16 for details.
21
Page 34

EtherScope™ Series II
Getting Started Guide
Removing and Installing the Battery
The battery is located behind the product stand.
To remove the battery, refer to the diagram in Figure 2
and do the following:
1. Make sure that the instrument is turned off.
2. Remove the yellow holster and pull the stand up.
3. Push the release tab away from the battery.
4. Pull up on the end of the battery that is close to the
release tab to disengage the connections. Then, lift
the battery out of the compartment.
To install the battery, insert it into the battery
compartment. Then, press on the battery near the release
tab until it locks into place. Finally, push the release tab
toward the battery to secure its position.
Operating the Instrument on AC Power
When the instrument is connected to AC power, you can
use the power supply as a continuous power source. In
this way, you can test for long periods of time without
depleting the battery.
To operate the instrument using AC power, refer to
Figure 2 and do the following:
1. Connect the power cord to the external AC adapter
charger.
2. Connect the AC adapter charger to the power jack on
the instrument’s side panel.
3. Turn on the instrument.
22
Page 35

Network Assistant
Before You Begin
LINK
UTILIZATION
COLLISION
ERROR
TRANSMIT
LC-1
North American
LC-3
Europe
LC-4
UK
LC-5
Swiss
LC-6
Australia
LC-7
South Africa
OR
Figure 2. Charging and Removing the Battery
eih30f.eps
23
Page 36

EtherScope™ Series II
Getting Started Guide
EtherScope Network Assistant’s Physical Features
The EtherScope Network Assistant is designed to be used
as a dispatched or desktop network test device. The
instrument is shipped with a removable yellow holster
that provides more protection for dispatched tasks.
The instrument is also packaged with a stand for use on a
desktop. To access the stand, remove the yellow holster.
Then, pull the stand out from the bottom of the
instrument (see Figure 3).
A stylus for navigating the user interface is stored in the
right side panel near the green On/Off button.
Figure 3 illustrates the EtherScope Network Assistant’s
physical features.
Locating the Network Connections
The instrument’s network connections are located on the
top side panel:
• LAN copper: an RJ-45 port that provides direct
connection to IEEE 802.3 10/100/1000 BASE-TX
networks.
• LAN fiber: an SFP port that provides direct connection
to networks through the optional 1000BaseSX,
1000BaseLX, or 1000BaseZX fiber connection.
• SLOT 1: a PCMCIA/CardBus® interface that supports
an 802.11 wireless network. Accepts Fluke Networks
EtherScope Wireless LAN Adapter IEEE 802.11 a/b/g.
24
Test Equipment Depot - 800.517.8431 - 99 Washington Street Melrose, MA 02176
FAX 781.665.0780 - TestEquipmentDepot.com
Page 37

Network Assistant
Before You Begin
Locating the External Interfaces
The following external interfaces are located on the
instrument’s right side panel:
• Serial DB-9: provides a network device connection via
a serial cable
• Headphone: enables quiet operation of the
instrument (for future applications)
• Microphone: (for future applications)
• USB port: connection for an accessory, such as a
keyboard or mouse
SLOT 2 is located on the top side panel. This interface
accepts a CompactFlash® (type 1 and 2) memory card.This
memory card enables you to store test data and
temporarily hold files that are transferred from a PC
during a software update.
Locating the External Power Connection
The DC power jack is located on the instrument’s right
side panel. Plug the supplied AC adapter into this jack to
provide external power to the EtherScope Network
Assistant and to charge the battery.
25
Page 38

EtherScope™ Series II
Getting Started Guide
Strap Attach
DB9 Serial Port
Headphone
Jack
Microphone
Jack
USB Port
Power
Jack
PCMCIA/CardBus SLOT 1
Fan
Compact Flash SLOT 2
Stylus
Removeable
Battery Pack
Figure 3. EtherScope Network Assistant’s Physical Features
Fiber LAN Connector
RJ45 LAN Connector
Kensington
Lock
(left side)
Stand
eih31f.eps
26
Page 39

Network Assistant
Before You Begin
Status LEDs
Five status LEDs are located at the top of the front panel,
as shown in Figure 4:
LINK
UTILIZATION
COLLISION
ERROR
TRANSMIT
avs01f.eps
Figure 4. Status LEDs
These LEDs provide instant, visible feedback on the state
of your network and indicate conditions relative to the
type of of interface (LAN RJ-45 or wireless) you are
testing.
This section describes the LEDs for wired LAN and
wireless LAN interfaces.
LAN (RJ-45 or Fiber) Interface LEDs
LINK LED
• Green (solid): indicates that a link is present for all
speeds.
• Off: indicates that no cable or no link is present.
27
Page 40

EtherScope™ Series II
Getting Started Guide
UTILIZATION LED
Represents the percent bandwidth consumed on the
local network:
• Green (blinking): 0% to 50%.
• Amber (blinking): 51% to 89%.
• Red (blinking): 90% to 100%.
COLLISION LED
Amber (blinking): indicates that collisions have been
detected by the instrument on the local network. The
more collisions detected, the faster the LED blinks.
ERROR LED
Red (blinking): indicates that errors have been detected
on the local network segment. Possible errors include the
following:
• Bad FCS: a packet that has an invalid checksum.
• Undersized packet: a packet that has fewer than 64
bytes.
• Oversized packet: a packet that has more than 1518
bytes.
• Jabber: a packet that has more than 1518 bytes and
also has an invalid checksum.
• Ghost: energy on a cable that appears to be a real
frame but the frame does not have a valid startframe delimiter.
TRANSMIT LED
Green (blinking): indicates the instrument is transmitting
packets. Note that the more transmit activity, the faster
the LED blinks.
28
Page 41

Network Assistant
Before You Begin
Wireless LAN Interface LEDs
LINK LED
• Green: 802.11b link established.
• Amber: 802.11a or 802.11g link established.
• Off: no link is present.
UTILIZATION LED
Represents the percent bandwidth consumed on the
current channel:
• Green: 1.0 % - 30.0 %.
• Amber: 31.0 % - 60.0 %.
• Red: 61 % - 100 %.
COLLISION LED
Amber: indicates that a retry packet was received.
ERROR LED
Red: indicates an FCS error was detected in a received
packet.
TRANSMIT LED
Green: indicates that packets are being transmitted.
Power LED
• Green: instrument turned on (same for both
operating on battery and operating with AC power
adapter connected)
• Flashing Green: instrument turned off with AC
power adapter connected and charging
• Off: instrument turned off; no AC power adapter
connected.
29
Page 42

EtherScope™ Series II
Getting Started Guide
The User Interface
The user interface is presented on a touch-sensitive, color
screen. You navigate the interface by tapping the touchsensitive targets with the supplied stylus.
This section describes the layout of the user interface and
describes the elements that appear on some or all of the
screens. Suggestions are also provided to help you locate
screens and navigate your way around.
Screen Layout
The display screen is divided into two main areas:
• A preview pane (on the left), which provides an
overview or summary of information for the item
that is selected in the right (main) pane. The preview
pane may also have hyperlinks (displayed in blue
text) that link to other screens in the user interface.
• A main pane (on the right), which provides detailed
information, such as test results, graphs, and status
information.
Title Bar
The title bar is the horizontal area at the top of every
screen that shows the name of the screen that is currently
displayed.
In the upper-left corner, the title bar contains the
EtherScope Master Menu icon. This icon displays a menu
that lists all of the “details” screens.
Selection Indicator
When you select an item, it is highlighted in a contrasting
color to let you know that it is selected. When you first
display a screen, the default selection is always
highlighted.
30
Page 43

Network Assistant
Before You Begin
Toolbar
The toolbar is the first row of buttons located at the
bottom of every screen. The toolbar contains buttons and
icons that are used to perform basic tasks.
Note
The toolbar buttons that are available depend
on the test that is selected.
• : (RJ-45 LAN only) reports the actual link
speed and duplex mode of the connection. Two solid
arrows (shown) indicate a full-duplex connection; one
solid and one outlined arrow represent a half-duplex
connection.
• : (Fiber only) reports the link speed, full
duplex (always), and the SFP hardware module
installed (FX, LX, or ZX).
• : (WLAN only) indicates the current channel
being scanned and shows linked status when the
instrument is in a WLAN linked state.
•
the selected test or device.
•
•
copper and fiber.
•
: displays detailed information or results for
: changes the interface type to WLAN.
: changes the interface type to RJ-45
restarts all tests.
:
31
Page 44

EtherScope™ Series II
Getting Started Guide
• (Back): displays the previously displayed screen.
• (Home): displays Test Results, the top-level user
interface screen.
• : displays screen-specific help. See “Error!
Reference source not found.” on page Error!
Bookmark not defined. for details.
: displays a menu of troubleshooting tests and
•
productivity tools.
Status Bar
The status bar is located at the bottom of every screen.
The following icons appear on the far left:
•
Desktop icon. Tap to display a menu containing
the following selections:
Applications: displays a submenu containing
the instrument’s desktop tools (see “Using the
Desktop Tools” on page 117).
Reports: displays a directory that lists all
saved reports.
Settings: displays the Settings menu (see
“Personalizing Your EtherScope Network
Assistant” on page 34).
Suspend: puts the instrument in Suspend
mode (see “Conserving Battery Power” on page
21).
•
Keyboard icon. Tap it to display a virtual
keyboard that you can use to enter numbers and text.
Tap
•
again to put the keyboard away.
EtherScope Network Assistant icon. Tap this icon
from any screen to return to the Test Results screen.
32
Page 45

Network Assistant
Before You Begin
To the far right, the instrument displays the currently set
time. To change the date and time, see “Setting the Time
and Date” on page 16.
Additional icons give you status on the following;
•
Sound: Tap it to view and adjust the volume of
the touch screen’s audible taps.
•
Light & Power: Tap it to view and adjust the
brightness of the screen (see “Adjusting the
Brightness of the Screen” on page 16).
•
Battery level: Tap it to find out how much battery
power remains. If the battery is low on power, see
“Charging the Battery” on page 20 for instructions.
The Clipboard icon
right. Tap it to display a menu with cut, copy, and paste
is also located on the bottom
options. These options come in handy when you are
working on screens requiring you to enter a lot of text.
Navigating the User Interface
Following are some general guidelines for navigating the
user interface:
• All blue text represents a hyperlink. Tap the hyperlink
to go to the desired screen.
• To display the detailed results screen for a specific
test:
Tap
(EtherScope Master Menu icon located
in the upper-left corner of each screen). From
the drop-down list, select the “details” screen
for the selected item.
Tap
to go to the detailed results
screen.
• To expand a group so that you can see individual
items within it, tap
. To collapse a group, tap .
33
Page 46

EtherScope™ Series II
Getting Started Guide
• To sort data in a table, tap the desired column
heading. A directional arrow indicates the column
you are sorting on and the direction (ascending U or
descendingV) of the sort.
• Tap
• Tap
• Tap to close a screen.
(Back) to return to the previously displayed
screen.
(Home) to return to the Test Results screen.
Personalizing Your EtherScope Network Assistant
You can customize your instrument so that it suits your
particular operating style and work preferences.
Tap
screen. On this screen, you can make the following
changes to your instrument:
•
and then tap Settings to display the Settings
Appearance
Changes the style and background color of the
screen and the visual appearance of the buttons.
•
•
•
•
Date/Time
Sets the date and time and changes the date/time
formats.
Language
Changes the default Help language from English to
one of the following: French, German, Japanese,
Portuguese, Simplified Chinese, or Spanish.
Light & Power
Adjusts the brightness of the screen (see “Adjusting
the Brightness of the Screen” on page 16) and
identifies the power source.
Sound
Adjusts the volume of system sounds (taps on the
touch screen and clock alarm).
34
Test Equipment Depot - 800.517.8431 - 99 Washington Street Melrose, MA 02176
FAX 781.665.0780 - TestEquipmentDepot.com
Page 47

Network Assistant
Before You Begin
Getting Help
Screen-level Help is context-sensitive. It provides detailed
“how to” and explanatory information that is related to
the currently displayed screen.
To obtain this type of help, tap (located in the
bottom right corner of the tool bar).
EtherScope Network Assistant Help is displayed, as
shown in Figure 5:
avs55s.bmp
Figure 5. Screen-Level Help
Note that Help for the current screen is displayed in the
main pane. To move through the information, drag the
scroll box. The browser window is resizable so that you
can view test information alongside the context-sensitive
Help text.
The main pane displays a table of contents. When you
tap a topic in this list, you are directed to its Help. To see
a list of entries, tap the Keyword Index link.
Note
The Help file is also available on the EtherScope
Resource CD.
Accessing the Documentation Online
This Getting Started Guide is provided in PDF format on
the EtherScope Resource CD. The guide is available in the
following languages: English, German, French, Spanish,
Portuguese, Japanese, and Chinese.
35
Page 48

EtherScope™ Series II
Getting Started Guide
Monitoring and Troubleshooting a Wired LAN
After you connect the instrument to your network and
power it on, the instrument attempts to become an
active device on the network by obtaining an IP address.
By default, it tries to acquire an address by using DHCP.
Note
If your network policy requires the use of fixed
IP addresses or if you need to change other
network configuration data (such as the default
router), see “Configuring the Instrument for a
Wired LAN” on page 74.
If the instrument acquires a valid IP address, it
automatically runs a series of tests that include verifying
the cable and signal, gathering network utilization and
bandwidth statistics, and actively discovering networks,
services, and devices using the network. It reports its
findings on the Test Results screen.
If the instrument cannot acquire a valid IP address, it can
still analyze traffic for statistics and passively discover
devices. However, without a valid IP address, the
instrument cannot run its active discovery tests. The basic
steps for monitoring and troubleshooting a wired LAN
are given below. Detailed information for a step can be
obtained by going to the referenced section provided at
each step:
1. Power on the instrument (see “Turning the
Instrument On and Off” on page 14) and, if
necessary, configure the interface type (see
“Selecting the LAN or WLAN Interface” on page 15).
36
Page 49

Network Assistant
Monitoring and Troubleshooting a Wired LAN
2. Connect to the network (see “Connecting to a Wired
Network “on page 37).
After you turn on and connect the instrument, it
goes through a complete power-up sequence, which
entails initializing the processor and memory,
performing a self-test, and loading the operating
system and application software. When this process
is completed, the autotest results screen (Figure 6) is
displayed.
3. View autotest results for each test. See “Viewing
AutoTest Results” on page 38.
4. Make any needed configuration changes to match
your testing environment. See “Configuring the
Instrument for a Wired LAN” on page 74”.
Connecting to a Wired Network
To connect to the network, plug one end of an Ethernet
cable into the instrument’s RJ-45 LAN connector and the
other end of the cable into the network segment you are
testing.
If you have purchased the optional Fiber SFP adapter for
1000BaseSX, 1000BaseLX, or 1000BaseZX, connect the
fiber cable from the adapter to the network segment
you are testing.
Note
Make sure you are using the correct fiber cable
type for the installed optional fiber adapter
type, or you may experience no link or bad test
results.
37
Page 50

EtherScope™ Series II
Getting Started Guide
Viewing AutoTest Results
After you power on the EtherScope Network Assistant
and connect to the network, the instrument runs a series
of automated tests and displays its findings on the Test
Results screen, as shown in Figure 6.
Figure 6. LAN Test Results Screen
epi40s.bmp
The Test Results screen gives you at-a-glance visibility
into the state of your network. The main pane on the
right displays the name of each test and reports its status.
Note the status icons that appear along the right. They
give you a visual indication of the progress and status of
each test:
•
Running
• Not running
•
•
Completed and passed
Completed and failed
The preview pane on the left provides a summary of the
results of the selected test.
Note
When autotest finishes, the Connection test (the
default selection) is highlighted.
38
Page 51

Network Assistant
Monitoring and Troubleshooting a Wired LAN
You can get quick idea of the overall health of your
network and see what devices and services are running
by tapping each test in the main pane and then viewing
a summary of its findings in the preview pane. To view
in-depth results for any test, select the test from the list in
the main pane. Then, tap
The individual tests that comprise the autotest are
described in this section.
Connection Test
The Connection test checks your network’s performance
at the physical layer. Results from higher layer tests are
misleading if the equipment or cabling is faulty or
installed incorrectly. Therefore, before you investigate
higher layers of the network as the source of any
problems, you should first identify and eliminate any
problems occurring at the physical or link layer of your
network.
Results from the Connection test can help you isolate the
source of network problems due to malfunctioning
cabling or equipment.
.
Figure 7 illustrates various cabling test configurations.
After you connect and power on the instrument, it
automatically detects the type of connection (for
example, to a patch cable, an Ethernet network, NIC, or a
wiremap adapter) and then determines the appropriate
cable tests to run.
Note
You do not have to disconnect the far end of a
cable for length to be measured. Length can be
measured while a cable is connected to a
wiremap adapter, active hub, switch or NIC, or a
cable that is not terminated.
If no problems are found, a green checkmark
indicates that the Connection test passed. If problems are
detected, a test failed symbol is displayed.
39
Page 52

EtherScope™ Series II
Getting Started Guide
LINK
UTILIZATION
COLLISION
ERROR
TRANSMIT
Network
monitoring
Cable test
live network
Universal
Adapter
MDI
MDI-X
LINK
UTILIZATION
COLLISION
ERROR
TRANSMIT
NIC testing
Cable test
terminated cable
40
LINK
UTILIZATION
COLLISION
ERROR
TRANSMIT
Cable test
WireView
TM
LINK
UTILIZATION
COLLISION
ERROR
TRANSMIT
Cable test
open cable
Adapter
eih32f.eps
Figure 7. Testing Cables
Page 53

Network Assistant
Monitoring and Troubleshooting a Wired LAN
The Connection test consists of two subtests:
Cable Verification: provides cable length and
impedance information and identifies any problems
with the cable.
Signal Verification: verifies that the instrument is
detecting a proper signal at the input.
Note
Cable Verification and Signal Verification do not
apply when testing a fiber connection. For a
fiber connection, the Connection Test displays
the Fiber Loss Test which requires that the
optional Fluke Networks’ Fiber Optic Meter be
attached to the RJ45 port.
Cable Verification
Cable Verification includes tests that check the physical
layer cable and equipment to verify that they are
working properly.
Note
To run these tests, the instrument must
disconnect from the network, which causes
other tests that are running to stop. If you are
operating the EtherScope Network Assistant
remotely, the connection is lost, preventing the
instrument from being able to verify the duplex
of the connection.
In the main pane, tap the
expand the list so that you can see these two tests.
next to Connection to
41
Page 54

EtherScope™ Series II
Getting Started Guide
After you run the autotest, tap Cable Verification to view
initial autotest results for the cable:
• The preview pane displays the length of the cable to
the active device or termination. Individual wires are
numbered and color-coded to identify pairs.
• The main pane displays results of the Cable
Verification test. A
detects a valid cable. A
problem with the cable
indicates that the instrument
indicates that there is a
.
To view detailed results, tap
.
The Cable Verification details screen (Figure 8) displays
results for each wired pair. The main pane displays
breakout of the cable by wired pairs so you can obtain
specific termination and impedance information and
identify problems.
42
Figure 8. Cable Verification Screen
epi60s.bmp
Page 55

Network Assistant
Monitoring and Troubleshooting a Wired LAN
To run the detailed test, tap
To run this test, the instrument must unlink
from the network. Current test results are
discarded.
If you want to trace the cable to a switch, hub, or
patch panel, tap
Cable Toner test.
This test requires a companion probe device
for locating and tracing cable.
Note
to set up and run a
Note
.
To test signal power and loss on a fiber optic cable,
select the Fiber option. Then, set up and run a Fiber
Optic Meter (FOM) test.
Note
This test requires a (separately purchased)
Fiber Optic Test Kit Accessory.
You will need to use the supplied universal
adapter to perform a wiremap (test a patch
cable).
43
Page 56

EtherScope™ Series II
Getting Started Guide
Signal Verification
The Signal Verification test is comprised of a suite of tests
that analyze the quality of the signal and establish
connectivity at the physical layer.
To provide comprehensive link signal information, the
Signal Verification test does a complete auto-negotiation
regardless of the current link configuration. For example,
if the instrument is configured to link at 100 Mbit halfduplex, the Signal Verification test temporarily overrides
that configuration to measure the complete autonegotiation process. When you exit the test, the previous
link configuration settings are restored.
To view initial autotest results, select Signal Verification.
The preview pane shows the type of service on the
connection. In addition, the actual and advertised speed
and duplex of the connection is provided, enabling you
to compare determined values with negotiated values.
By default, the instrument auto-negotiates to the highest
speed and duplex allowed by the link partner.
Note
You can configure the instrument to link at a
specific speed and duplex. See “Configuring the
Instrument for a Wired LAN” on page 74”.
44
Test Equipment Depot - 800.517.8431 - 99 Washington Street Melrose, MA 02176
FAX 781.665.0780 - TestEquipmentDepot.com
Page 57

Network Assistant
Monitoring and Troubleshooting a Wired LAN
To run the full suite of signal verification tests, do the
following;
1. Tap
2. Tap to disconnect the instrument from the
network.
To run these tests, the EtherScope Network
Assistant must disconnect from the network,
which causes other tests that are running to
stop. If you are operating the instrument
remotely, the connection is lost, preventing you
from viewing the test results or regaining
remote control of the instrument until it is
manually reset.
The Solicit for 802.3af Power over Ethernet
check box enables soliciting for PoE voltage
information through a PoE (802.3af standard
only, non-standard is not supported)
connection. Press the Start Test button after
checking this box to initiate this test.
. Then tap .
Notes
The main pane (see Figure 9) displays results from the
four Signal Verification tests. The tests are designed to
provide visibility into possible link quality and
configuration issues that could be contributing to
connectivity or performance problems.
• DC Voltage Scan: cable line voltages are scanned for
DC-level content and over-voltage conditions. In this
section, voltage levels are reported.
Note
The presence of high voltages may indicate
telephone connections, early versions of applied
hard-wired power-over-Ethernet (PoE), or
802.3ae or 802.3af probe voltages.
A green checkmark indicates that either no DC
voltage is being detected or no significant DC
voltage is being detected. If some other DC voltage
is detected (for example, 802.ae), a red check mark is
displayed.
45
Page 58

EtherScope™ Series II
Getting Started Guide
• Signal Levels: No signal, NLP (Normal Link Pulse), FLP
(Fast Link Pulse) and Data signals and their
amplitudes are monitored and displayed.
A green checkmark indicates that signal levels are
acceptable. If signal levels are below the minimum
specification, a red check mark is displayed.
• Link Partner Signaling: these signals indicate the
device-supported signaling capabilities of the cable
source (link partner) before the auto-negation
sequence begins.
The presence or absence of a signal is indicated by a
green box or an empty box, respectively.
• Auto-negotiation Signals: FLP signals from the auto-
negotiation sequence display what the cable
connection source (link partner) advertised and what
the EtherScope Network Assistant advertised.
The presence or absence of a signal is indicated by a
green box or an empty box, respectively.
epi84s.bmp
Figure 9. Signal Verification Screen
46
Page 59

Network Assistant
Monitoring and Troubleshooting a Wired LAN
Local Statistics Test
The Local Statistics test reports local and remote
bandwidth utilization and errors seen on the network.
1. In the main pane, tap Local Statistics.
epi64s.bmp
Figure 10. Local Statistics Summary
The preview pane (Figure 10) presents a profile of
the types of traffic seen on the network. In the top
half of the pane, the types of traffic are classified
(for example, unicast frames and collisions) and the
percentage of bandwidth consumption for each
group is reported. Traffic types are color-coded for
easier viewing.
The graph at the bottom of the pane plots the types
of local traffic seen according to the percentage of
bandwidth utilization (y-axis) over time (x-axis). Tap
the graph to view statistics for a particular time
period.
47
Page 60

EtherScope™ Series II
Getting Started Guide
2. Tap the next to Local Statistics to expand the list
and show its subtests:
•
•
•
3. To view summary results for a particular subtest,
select it from the list:
• Protocol Statistics: identifies the top 12 network
Protocol Statistics
Top Talkers
VLAN Statistics
services, applications, and devices discovered on
the local network segment and provides a
breakout by percent of bandwidth utilization of
all packets.
• Top Talkers: identifies the top 10 devices that
are the highest consumers of bandwidth on the
local network segment and provides a breakout
by percent of all packets sent.
• VLAN Statistics: identifies VLANs (up to 12) that
are most active on the local network segment
and provides a breakout by percent of all
packets detected. The status line shows the total
number of VLANs discovered and the top VLAN
ID with its percentage of total packets.
48
Page 61

Network Assistant
Monitoring and Troubleshooting a Wired LAN
Viewing the Local Statistics Details
If the summary reports indicate problems, check the
detailed results to see if you can determine the source of
a problem.
1. On the Test Results screen, select Local Statistics and
then tap
.
The Utilization History screen (Figure 11) is
displayed:
epi50s.bmp
Figure 11. Utilization History Screen
On this screen, you can:
• Look at the different types of traffic present on the
network segment. This information can help you
determine if the network is experiencing or has
experienced high utilization, excessive collisions, or
unusual error conditions.
• Monitor local utilization (select Utilization Details in
the preview pane) or errors (select Error Details) on
the port that the instrument is connected to.
49
Page 62

EtherScope™ Series II
Getting Started Guide
• Get visibility into remote devices and segments
without directly connecting to them. To do this,
choose a discovered switch and interface source
from the Source selection box. Then monitor the
source’s utilization and errors.
Note
The EtherScope Network Assistant monitors
and trends the source throughout the
session or until you change the source. It
also continues to monitor local utilization
and errors in the background.
• View utilization statistics during a particular period
of time. To do this, tap the graph directly.
A white vertical bar marks the sampling period.
Note
The graph is updated according to the
frequency set in the Update every selection
box. To change the frequency, select a
value from the drop-down list.
Viewing Details for Protocol Statistics, Top Talkers, and
VLAN Statistics
To view details:
1. On the Test Results screen, tap the
Statistics to expand the list and show its subtests:
•
•
•
2. Select the desired subtest.
3. Tap
selected subtest:
• Protocol Statistics: the main pane lists all of the
Protocol Statistics
Top Talkers
VLAN Statistics
to display detailed results for the
network protocols that have been discovered on
the local network segment.
next to Local
50
Page 63

Network Assistant
Monitoring and Troubleshooting a Wired LAN
• Top Talkers: the main pane lists all the
discovered devices that are generating traffic on
the local network segment.
• VLAN Statistics: the main pane lists all VLANs
discovered on the local network segment.
Notes
The number of VLANs discovered by VLAN
Statistics and VLAN Discovery (described
later) frequently differs. VLAN Statistics
monitors the local segment only and
generates a list of VLANs discovered. The
VLAN Discovery test, on the other hand,
uses active SNMP discovery to determine
the number of VLANs on your entire
network.
If the instrument is connected to a port that
is configured with 802.1Q VLAN tagging
and the instrument is not so configured, or
if 802.1Q is enabled on the instrument but
not on the port, DHCP will fail and device
discovery will probably show one device
(This EtherScope). VLAN Statistics, on the
other hand, will show whether any VLAN
tagged packets are on the network
segment. To fix this problem, you should
either disable 802.1Q on the instrument, or
to configure the instrument for the correct
VLAN (try configuring the instrument for
the VLAN with the highest packet count).
See “802.1Q/IP TOS Settings” on page 76
for details.
51
Page 64

EtherScope™ Series II
Getting Started Guide
Device Discovery Test
As soon as the EtherScope Network Assistant is
connected, it performs active SNMP discovery for all
network devices. The instrument examines each device it
discovers to learn more about the device’s capabilities
and to detect possible problems. The Device Discovery
test lets you know what devices the instrument sees on
your network. As devices are discovered, they are added
to the instrument’s discovery database.
Notes
• For best results, the instrument needs to be
configured with the SNMP community strings
being used on your network. See “Instrument
Security Settings” on page 79 to find out how to
enter additional community strings.
• If the instrument does not automatically
discover a device, the device can be manually
added to the discovery database. See “Adding a
Device to the Discovery Database ”on page 55.
To view results:
1. In the main pane, tap Device Discovery.
The preview pane displays an inventory of the
devices the instrument discovered. You can find out
the total number of devices found. In addition, the
devices are categorized into the following groups
and the number of devices within each group is
provided:
Total Devices
Routers
Switches
Servers
Printers
52
Page 65

Network Assistant
Monitoring and Troubleshooting a Wired LAN
Key Devices
SNMP Agents
Hosts
A device that is an SNMP agent may be counted
twice; that is, in the SNMP Agents group and in the
device group to which it belongs. Therefore, the sum
of devices in all categories can be greater than that
reported for Total Devices.
2. To view detailed results, tap
detailed Device Discovery screen.
On this screen, you can find out information about
each discovered device, such as its DNS name, IP
address, and key device status.
to display the
You can also see whether the device is experiencing
any problems.
a. Drag the scroll bar or tap the directional
arrows at the bottom of the main pane to
bring all of the information about a device
into view.
Alternatively, check one of the Show
buttons at the bottom of the preview pane
to move selected information about the
device (for example, switch information)
into view.
b. Rearrange the information on this screen by
choosing a particular column heading as
the basis for the sort. To do this, tap the
heading you want to sort on. A directional
arrow indicates the column you selected
and the direction (ascending U or
descendingV) of the sort.
53
Page 66

EtherScope™ Series II
Getting Started Guide
3. To obtain device-specific information, select the
desired device.
The upper portion of the preview pane (Figure 12)
shows the IP and MAC address information for the
device you selected while the lower portion
graphically shows utilization details (relative
percents of packets, broadcasts, and errors).
Figure 12. Device Discovery Screen
epi43s.bmp
4. Tap
to view obtain detailed information
about the device.
The Device Details screen provides name, address,
domain, and nearest switch information about the
device, as shown in Figure 13:
Figure 13. Device Details Screen
epi68s.bmp
54
Test Equipment Depot - 800.517.8431 - 99 Washington Street Melrose, MA 02176
FAX 781.665.0780 - TestEquipmentDepot.com
Page 67

Network Assistant
Monitoring and Troubleshooting a Wired LAN
From this screen, you can also run specialized tests (such
as Trace Switch Route, Trace Route, or Ping) to
troubleshoot connectivity or performance problems
associated with the device. These tests are started by
tapping the desired hyperlink in the preview pane. See
“Running the Diagnostic Tests” on page 108 for
descriptions of these tests.
Adding a Device to the Discovery Database
If the instrument does not automatically discover a
device, you can manually add the device to its discovery
database. After a device is added to the database, the
instrument keeps track of it and reports its statistics on
the Device Discovery test screens.
To add a device to the discovery database:
(located in the top left corner of the screen)
Tap
1.
and then select Instrument Settings.
2. Tap the General hyperlink to display the Instrument
Settings—General screen.
3. Tap
4. On the User-defined Devices screen, tap
Then use a keyboard to supply the required
information.
If you want to identify the device as a key device,
check the Add to key device list button.
5. Tap
The device you added is now in the discovery
database.
.
.
.
55
Page 68

EtherScope™ Series II
Getting Started Guide
Network Discovery Test
The Network Discovery test scans the local segment,
looking for what networks are present and how they are
configured. This test enables you to see discovered
networks by IP subnets, NetBIOS domains, and IPX
networks.
1. Select Network Discovery.
The preview pane identifies the types of networks
found and reports the number of networks per type.
EtherScope Network Assistant organizes discovered
networks into the following groups.
•
•
•
Within each group, you can also find out the
number of devices discovered.
IP Subnets
NetBIOS Domains
IPX Networks
2. To view detailed results for Network Discovery:
• In the preview pane, tap the desired network
group.
OR
• Tap .
Subnet details include IP address ranges and
subnet masks, while domain details identify
master browsers and domain controllers.
3. If you need to quickly locate a device within your
network environment, use the Find facility. Do the
following:
a. Tap inside the text entry box. Use a remote
keyboard or tap to display the virtual
keyboard and enter a full or partial name,
IP address or MAC address.
b. Tap
to begin the search.
56
Page 69

Network Assistant
Monitoring and Troubleshooting a Wired LAN
VLAN Discovery Test
The VLAN Discovery test identifies all of the VLANS
discovered on the network segment that the instrument
is connected to. The test informs you of VLAN
membership configurations and interface status. You can
also get details on connected hosts and view trending
data.
Note
The VLAN Discovery test differs from the VLAN
Statistics test discussed earlier. VLAN Discovery
queries all switches that the instrument
communicates with and generates a list of
VLANs discovered. The VLAN Statistics test
monitors the frames only on the switch
port/interface that the instrument is connected
to and generates a list of VLANs discovered.
1. Tap VLAN Discovery.
The preview pane (see Figure 14) displays the total
number of discovered VLANs.
The main pane shows inventory of the discovered
VLAN trunks and lists associated switch interfaces.
For each VLAN interface, you can obtain the VLAN
and slot/port numbers and find out how many hosts
belong to the VLAN.
Note
You can sort the information on any of the
VLAN discovery screens. To do this, tap the
heading you want to sort on. A directional
VU
arrow
and the direction (ascending or descending) of
the sort.
indicates the column you selected
57
Page 70

EtherScope™ Series II
Getting Started Guide
2. Tap
to display the VLAN Discovery screen.
Figure 14. VLAN Discovery Screen
epi48s.bmp
3. To see the member switch interfaces within a
particular VLAN, select the desired VLAN. Then tap
to expand the list.
VLANs that have no associated switch interfaces
simply display the switches that reference this VLAN.
4. To get general information for a particular
VLAN/Interface, select it.
The preview pane identifies the IP address of your
selection.
5. To obtain a detailed report on a particular interface,
select it from the list, then tap
.
You can view the port traffic and the devices
configured for that interface.
58
Page 71

Network Assistant
Monitoring and Troubleshooting a Wired LAN
Nearest Switch Test
An integral part of discovery is locating the switches on
the network. The Nearest Switch test uses SNMP to
search for and find the switch that is closest to the port
that the instrument is connected to. After the nearest
switch is discovered, its active ports are monitored for
utilization and errors.
1. To check the status of the nearest switch, tap
Nearest Switch.
epi66s.bmp
Figure 15. Nearest Switch Summary
As shown in Figure 15, the preview pane displays the
IP address of the switch along with its VLAN
identifier and port number. You can also see the
speed of the interface and find out how many hosts
are connected to the ports on the switch.
The graphs update you on bandwidth utilization
and errors found on the busiest port.
2. To see a detailed report on the nearest switch, tap
.
On the Switch Details screen, you can run also one
of the diagnostic tests (for example, Trace Switch
Route or Ping) to troubleshoot connectivity or
performance problems associated with the switch.
59
Page 72

EtherScope™ Series II
Getting Started Guide
3. To set up and run a test, tap the associated hyperlink
in the preview pane. (See “Running the Diagnostic
Tests” on page 108 for descriptions of these tests).
Switch Scan Test
The Switch Scan test continuously monitors the nearest
switch plus a second (user-selected) switch so that you
can determine their health and status.
1. Tap Switch Scan.
The preview pane shows you the name of the switch
that is being monitored and the number of active
ports on the switch. In addition, you can find out
whether bandwidth utilization is excessive and
whether the switch is experiencing any errors.
2. Tap
If no switch is selected, select one from the
Select a device list box.
The Switch Scan details screen (Figure 16) identifies
the slot/port number of the switch and shows a
breakout of utilization statistics by port.
3. Select the type of statistic that you want to view for
the switch by tapping one of these options in the
title bar:
• Utilization
• Packets
• Octets
• Errors
The main pane redisplays switch statistics based on
your selection.
.
Note
60
Page 73

Network Assistant
Monitoring and Troubleshooting a Wired LAN
6. To view details for a particular interface:
a. Select the desired interface.
The top portion of the preview pane shows
the port number, VLAN identifier, speed of
the interface, and number of connected
hosts. The lower portion displays a graph
that lets you see the relative percentage of
packets and bandwidth.
b. If you want to see interface statistics over a
period of time, select the desired interface.
Then tap .
Figure 16. Switch Scan Screen
epi49s.bmp
4. To select an additional switch to scan, select it from
the Select a device box.
5. By default, the nearest switch is monitored. To
prevent this switch from being monitored, tap (to
The Utilization History is displayed. On this
screen, you can specify a time period during
which errors and utilization statistics for the
interface are gathered and reported.
c. Tap
information for the selected interface.
to obtain more detailed
uncheck) the Show box.
61
Page 74

EtherScope™ Series II
Getting Started Guide
Key Devices Test
The Key Devices test checks the availability of critical or
“key” devices on your network. You can use this test to
verify connectivity between certain network devices and
critical network services (for example, print or email
servers).
For the Key Devices test to operate properly, you need to
specify which devices you want EtherScope Network
Assistant to track. Devices you might include in this
category are servers, switches, and routers because these
are the devices that you most likely want to monitor on a
regular basis.
When you define a network device as "key", the
instrument periodically checks its status (up or down) to
determine its availability. An occasional intermittent
non-response is ignored, but if no response is received
from a key device after several consecutive attempts, the
instrument reports its status as Fail
...In addition, the
instrument always generates a message when the status
of a key device changes so that you are always made
aware of any problems it is experiencing.
Defining Key Devices
To define a key device, do the following:
1. On the Test Results screen, select Key Devices.
2. Tap
to display the Key Devices screen:
Note
If EtherScope Network Assistant is operating in
WLAN mode, the screen is slightly different
from the one shown in Figure 17.
Figure 17. Key Devices Screen
epi41s.bmp
62
Page 75

Network Assistant
Monitoring and Troubleshooting a Wired LAN
3. Do one of the following:
• If the instrument discovered the device:
a) Tap the arrow in the drop-down list box at
the top of the screen. Then, select a
category (for example, Hosts to see all of
the devices in that category.
b) Find the desired device in the list and then
tap (to check) the box to mark it as a key
device.
• If the instrument did not discover the device:
a) Tap
b) Tap . Then in the Add Key Device box,
supply the IP address of the device.
.
c) To ensure that the instrument discovers the
device, tap (to check) the Add to device
discovery? box and supply the MAC
address.
d) Tap
As you add devices to the Key Devices group, the
preview pane keeps track of the number of devices
to be tested.
4. To run the Key Devices test, tap
As the test runs, detailed status on each device is
reported in the main pane.
to close.
.
63
Page 76

EtherScope™ Series II
Getting Started Guide
Problem Detection
The Problem Detection test checks each discovered device
to determine if it is experiencing any problems. If a
problem is detected, the instrument enters a problem
report in the Problem Log.
The Problem Log is an extremely useful troubleshooting
and management tool because it lets you know what
types of problems are occurring on your network and
specifically identifies which devices are having problems.
Knowing what types of errors are present and where
they are coming from can help you identify the cause of
network problems.
To check for errors:
1. Select Problem Detection.
The preview pane shows the number of problems
detected in each of the following severity groups:
Errors: indicates that a severe problem exists
•
with the network or the device; the problem is
disrupting or severely impeding normal use.
•
Warnings: indicates that a condition exists
that can possibly cause a problem with the
network or device.
•
Information: indicates that the device or
network is functioning normally, but there is an
event or condition that you need to be aware
of.
•
Resolved: indicates that the problem has been
fixed or that there has a been a change in the
failure state.
The
Deleted category maintains a count of
problems that you delete from the Problem Log (see
“Deleting a Problem from the Log” on page 66).
64
Test Equipment Depot - 800.517.8431 - 99 Washington Street Melrose, MA 02176
FAX 781.665.0780 - TestEquipmentDepot.com
Page 77

Network Assistant
Monitoring and Troubleshooting a Wired LAN
2. If errors are indicated, tap to look at the
Problem Log (Figure 18):
epi41s.bmp
Figure 18. Problem Log
The main pane lists each device that is experiencing
a problem. The Description column provides a brief
description of the nature of the problem along with
its assigned severity level.
Note
You can sort the information in the main pane
by tapping one of the column headings. For
example, to sort on problem severity, tap
. A
directional arrow VU indicates the column you
are sorting on and the direction of the sort.
3. To obtain information on a specific device, select the
device.
The preview pane shows the IP and MAC address of
the problem device along with a description of the
problem. A timestamp indicates when the problem
was detected.
65
Page 78

EtherScope™ Series II
Getting Started Guide
4. Tap to view detailed information about the
device.
The Device Details screen (Figure 13) is displayed. On
this screen, you obtain specific information about
the device.
Follow the Problems link to view a Problem Log that
lists only those problems associated with the selected
device.
You can also tap the Interfaces link to see the I/F
status of the device or you can tap the SNMP System
Group link to view SNMP information for the device.
Deleting a Problem from the Log
To delete a problem from the log:
1. Select the problem.
2. Tap
The deleted problem is moved to the Deleted problems
folder in the main pane, and the number of problems is
incremented in the Deleted category (preview pane).
To cancel the deletion:
1. Tap to expand the Deleted problems folder.
2. Select the desired problem and then tap
The problem is re-entered into the Problem Log, and the
count of Detected problems in the preview pane is
incremented.
.
.
66
Page 79

Network Assistant
Monitoring and Troubleshooting a Wired LAN
RFC 2544 Tests
The RFC 2544 tests enable you to measure the
performance of your network. Each test requires a
second (remote) EtherScope Network Assistant running
Version 3.0 software (or later) to communicate with your
network.
Note
The RFC 2544 tests are a separately purchased
software option. To enable this option, you
need to supply the key code for RFC 2544/ITO
ES_ITO_OPT. For instructions on enabling
software options, go to “Enabling Software
Options” on page 18.
The following tests are in the RFC 2544 test group:
• RFC 2544 Throughput: measures the throughput
speed and efficiency of your network.
• RFC 2544 Latency: measures how much time it takes
for frames to travel through your network.
• RFC 2544 Loss: measures your network’s frame loss
rate.
The Remote Device
The remote device operates as the DUT (Device under
Test). The remote device must be an EtherScope Network
Assistant.
Configuring the Remote Device
The remote device must be enabled to use the RFC 2544
test option (see “Enabling Software Options” on page
18).
In addition, the remote device must be configured with
the same port number and timeout setting as the local
device. To configure these settings, follow the procedure
under “Configuring the Remote Unit” on page 72.
67
Page 80

EtherScope™ Series II
Getting Started Guide
Specifying the IP Address of the Remote Device
You can designate a device for use in all of the RFC 2544
tests or you can designate a particular device for each
individual test.
1. Select RFC 2544 Tests and then tap
2. Do one of the following:
• To specify a device for all RFC 2544 tests, tap RFC
2544.
• To specify a device for a specific test, tap the
name of the test or device.
3. Tap
4. In the Add Device box, select the device from the
drop-down list box or select (User Defined) and
supply the IP address of the device.
.
.
5. Click
Repeat this procedure to add additional devices
for use in the individual tests. The device name
or IP address is added to the list of devices under
the individual test and can be selected when
you run a test.
Configuring the RFC 2544 Tests
You need to configure the test parameters and the
parameters for the remote device participating in the
test. You can set global configuration parameters that
apply to all devices used and all tests in this suite or you
can configure the devices and tests individually.
The following procedures show you how to access the
configuration screens. See the online Help for detailed
descriptions of the RFC 2544 test configuration
parameters.
.
Note
68
Page 81

Network Assistant
Monitoring and Troubleshooting a Wired LAN
Global Configuration Parameters
To set configuration parameters that apply to all RFC
2544 tests and devices:
1. Select RFC 2544 Tests and then tap
2. Tap to display the RFC 2544
Configuration screen.
3. Select the desired RFC 2544 test parameters and then
tap
Individual Test and Device Parameters
Individual settings apply only to the selected test and/or
device. These settings override any global parameters set
under RFC 2544 Tests.
To set parameters for an individual test or device:
1. Select RFC 2544 Tests and then tap
2. Tap
Configuration screen.
to save your changes.
to display the RFC 2544
.
.
3. Tap next to RFC 2544 to display the list of
subtests and devices.
4. Select the desired subtest or device and then tap
to display the configuration screen and set
the desired parameters.
5. Tap
Restoring the Default Configurations
Tap
default settings. Then, tap
to save your changes.
to restore the configuration to factory
to save the changes.
69
Page 82

EtherScope™ Series II
Getting Started Guide
Running an RFC 2544 Test
To run a test:
1. Select the desired test from the RFC 2544
Performance Tests screen.
2. Tap .
Results
The Status column indicates whether results are available
for the selected test.
• To view Throughput test results:
1. Select a device under RFC 2544 Throughput and
then tap
2. Use the radio buttons to select the Display
Mode (FPS (Frames/Sec) or BPS (Bits/sec) and
View Mode (table or graph).
.
• To view Latency test results:
1. Select a device under RFC 2544 Latency and
then tap .
2. Use the radio buttons to select the View Mode
(table or graph).
• To view Loss test results:
1. Select a device under RFC 2544 Loss and then
tap
2. Use the pull-down menu in the Show field to
select the frame sizes to be displayed. Use the
radio buttons to select the View Mode (table or
graph).
.
70
Page 83

Network Assistant
Monitoring and Troubleshooting a Wired LAN
ITO Tests
The EtherScope Network Assistant features two ITO
(Internet Throughput Option) tests:
• Traffic Generator: enables you to generate
background test traffic into the network. This test is
helpful when you are testing new systems and
configurations because it allows you to simulate
diverse mixes of traffic which can help you identify
and isolate network performance issues.
• Throughput: a double-ended test of bandwidth
between two network nodes. This test enables you
to test throughput and evaluate a link’s capacity.
Traffic Generator
To run the Traffic Generator test:
1. In the main pane, tap
the subtests.
2. Tap Traffic Generator. Then tap
configure the parameters for the test (see Figure 19):
• Frame Description: specify the packet type and
size; in addition, provide the destination IP and
MAC address.
• Rate and Duration: specify the transmit rate and
duration.
next to ITO Tests to view
to
71
Page 84

EtherScope™ Series II
Getting Started Guide
Throughput Test
To run the Throughput test, you need two instruments:
one that functions as the local unit and a second that
serves as the remote unit. The remote unit can be any of
the following: a second EtherScope Network Assistant, a
OneTouch™ Network Assistant with the Internet
Throughput Option (ITO) installed, or an OptiView INA
V4.0 analyzer.
During the test, both instruments simultaneously
transmit packets to each other at a user-configurable bit
rate for a specified duration. When the test is completed,
the local instrument displays results for both the local
and remote units (see Figure 20).
Figure 19. Traffic Generation Screen
epi81s.bmp
3. Tap
to begin the test.
The preview pane shows results of the test. You can see
the number of packets the instrument is transmitting and
bandwidth utilization statistics.
72
Configuring the Remote Unit
Note
This procedure assumes that the remote unit is
an EtherScope Network Assistant. If you are
using an OptiView INA analyzer or a OneTouch
Network Assistant as the remote unit, refer to
that instrument’s documentation for
instructions on configuring it as the remote
server.
Page 85

Network Assistant
Monitoring and Troubleshooting a Wired LAN
1. On the remote EtherScope Network Assistant, tap
. Then, select Instrument Settings.
2. In the preview pane, tap the General hyperlink. In
the Remote Throughput Testing section:
a) Tap (to check) Enable as throughput remote.
b) Specify values for the following:
• Port: identifies the port to use for the
throughput protocol. Configure the same
port number on both the local and remote
units. This number can be changed to allow
throughput testing through firewalls that
block some ports.
• Timeout: number of seconds the remote
server should wait for additional
throughput traffic from the local unit
before timing out and terminating packet
transmission.
3. Tap Save Remote Throughput Settings.
Configuring the Local Unit and Starting the Test
On the local unit, complete the following:
1. Tap the
show its subtests.
2. Select Throughput Test.
3. Tap
for the test:
• Frame Description: specify the remote device’s IP
• Rate and Duration: specify the transmit rate (in
next to ITO Tests to expand the list and
to configure the following parameters
address. Select the frame data pattern to be
transmitted, timeout, the frame length, and the
port number.
Note
Both the local and remote devices must be
configured on the same port.
bits per second) and the duration of the test
73
Page 86

EtherScope™ Series II
Getting Started Guide
4. Tap
to begin the test.
As the test progresses, Throughput results are
continuously updated.
The local unit keeps track of the number of frames
sent, the percent received, and the percent loss for
both the local and remote units.
5. To see results displayed graphically (see Figure 20),
tap Graph (located in the title bar).
Figure 20. Throughput Test Results
epi72s.bmp
6. Tap
to end the test.
Configuring the Instrument for a Wired LAN
Although EtherScope Network Assistant is designed to
provide as much automated configuration as possible,
every network is different. For the instrument to provide
you with the best network analysis possible, you may
need to change some of the default configuration
settings.
To access the instrument’s configuration screens, do the
following:
1. Tap the EtherScope Network Assistant icon
,
which is located in the upper-left corner of the
title bar.
2. From the drop-down list, tap Instrument Settings.
The Instrument Settings —TCP/IP screen (Figure 21)
is displayed.
74
Test Equipment Depot - 800.517.8431 - 99 Washington Street Melrose, MA 02176
FAX 781.665.0780 - TestEquipmentDepot.com
Page 87

Network Assistant
Monitoring and Troubleshooting a Wired LAN
On this screen, you configure the instrument’s TCP/IP
settings:
epi86s.bmp
Figure 21. Instrument Settings—TCP/IP Screen
The hyperlinks in the preview pane take you to other
configuration screens, which are described in the sections
that follow.
TCP/IP Settings
If DHCP is available, the Instrument Settings—TCP/IP
screen (Figure 21) displays the address that the
instrument is able to obtain.
If you want to manually configure the IP address or
change the subnet mask, do the following:
Note
When manually assigning an IP address, you can
use an address for an alternate subnet but that
address must be in the same broadcast domain
as the EtherScope Network Assistant.
1. Clear the Automatically configure TCP/IP settings
checkbox to disable auto-configuration of the IP
settings.
75
Page 88

EtherScope™ Series II
Getting Started Guide
2. For the address field that you want to change, do
the following:
• Tap
• Select an address from the drop-down list.
3. Tap
802.1Q/IP TOS Settings
The 802.1Q/IP TOS settings define the VLAN tag in the
header of an Ethernet packet. The instrument uses these
settings during discovery, traffic generation, RFC 2544
tests, and network service tests to make decisions about
routing traffic.
and use the keyboard to type an IP
address.
OR
to save your changes.
In the preview pane, tap 802.1Q/IP TOS to display the
Instrument Settings— 802.1Q/IP TOS screen. This screen
enables you to configure the instrument for tagged
VLAN (802.1Q) and/or IP Type of Service (TOS) operation.
These settings are applied globally to traffic from the
instrument and remain in memory even after you turn
off the instrument.
It is important that you configure these settings correctly.
If you select a VLAN ID that is not configured on the port
that the instrument is connected to, the instrument may
not be able to communicate with the network. DHCP will
fail and active discovery will not work. You can
experience the same failure, if you enable 802.1Q on the
instrument but plug it into a port that is not enabled for
802.1Q. If this happens, you can use the VLAN Statistics
test to identify the VLANS that are active on the port.
Then, try configuring the 802.1Q settings for the VLAN
that has the highest packet count
.
76
Page 89

Network Assistant
Monitoring and Troubleshooting a Wired LAN
1. In the 8021Q Settings section, do the following:
a) Check Enable 802.1Q to select 802.1Q tagging
mode.
This setting denotes a new frame format
whereby every packet that is transmitted by the
instrument contains an extra four bytes in the
header to include fields for the VLAN ID and a
priority level for the frame (see next two items).
On the receive side, the instrument extract and
process this information from incoming packets.
b) Supply the VLAN ID (values range from 1 to
4095)
c) Set Priority: select a value between 0 and 7 (low
to high) to specify a priority level for the frame.
2. In the TOS (Type of Service) section, select one of the
following:
• TOS with IP Precedence then check one of the
type of service parameters (Delay, Throughput,
Reliability, or Cost) and select a priority in the IP
Precedence box.
• TOS with DSCP then supply a value for DSCP
(Differentiated Service Code Point).
3. Tap
restarts its tests with the new configuration.
to save your settings. The instrument
77
Page 90

EtherScope™ Series II
Getting Started Guide
802.1X Settings
The 802.1X standard defines the mechanism for portbased network access control. This provides a means of
authenticating and authorizing devices attached to a
LAN port. This screen allows for the configuration of
the 802.1X security.
The supported authentication types are:
• --None—
• EAP TLS
• EAP GTC
• EAP MD5
• EAP MSCHAPV2
• PEAP GTC
• PEAP MD5
• PEAP MSCHAPV2
• PEAP TLS
• TTLS PAP
• TTLS CHAP
• TTLS MSCHAP
• TTLS MSCHAP-V2
• TTLS EAP-MD5
• TTLS EAP GTC
• TTLS EAP MSCHAP-V2
• TTLS EAP-TLS
The TLS authentication types (also called SmartCard)
allow you to import a User Certificate provided by your IT
administrator and use alternate IDs (in Advanced
Options) in the encryption.
The other encryption types allow you to enter a User
Name and Password. These encryption types are not as
secure as the TLS encryption types.
78
Page 91

Network Assistant
Monitoring and Troubleshooting a Wired LAN
Connection Log
The
Connection Log
authentication and authorization process, and
indicates whether it passed or failed. It also provides
DHCP detail to which servers reply to DHCP requests
and which DHCP offers were ignored by EtherScope.
Ethernet Settings
On Instrument Settings—Ethernet screen, you can
override the instrument’s link auto-negotiation process
and force EtherScope Network Assistant to link at a userselected speed and duplex.
To link at particular duplex setting, tap Use Forced
Setting. Then select one of the settings in the Forced
Setting group.
An asterisk ( *) next to the value on the link
button (located in the lower- left corner of the
task bar) indicates the speed/duplex is a forced
setting.
provides detail about the 802.1X
Note
At the bottom of this screen, a factory assigned MAC
address is shown. You can change this address to enable
testing of switch forwarding tables and ARP caches as
part of the troubleshooting process.
Instrument Security Settings
On the Instrument Settings—Instrument Security screen
(Figure 22), you can provide password-level security for
your EtherScope Network Assistant. This screen enables
you to password-protect access to EtherScope Network
Assistant through the remote user interface, authorize
running of RFC 2544/ITO tests, and prevent unauthorized
users from editing the instrument’s SNMP community
strings or viewing the remote user interface.
79
Page 92

EtherScope™ Series II
Getting Started Guide
Figure 22. Instrument Settings–Security Screen
epi85s.bmp
If a field is password-protected, this symbol denotes that
the field is secure:"*". The fields and controls on the
Security screen are disabled until a user successfully
enters the password and logs in using the Login button.
On the Security screen, you can also configure the
instrument’s SNMP community strings. The default
community strings are “public”, “private”, and
“security”. You can change the default strings to strings
that are used on your network.
Note
The discovery process successively tries the
community strings in the order in which they are
listed. For a quicker discovery, you should list the
strings in order of frequency of use.
80
Page 93

Network Assistant
Monitoring and Troubleshooting a Wired LAN
General Settings
On the Instrument Settings— General screen, you can
change the following settings for your EtherScope
Network Assistant:
• Restore Defaults: resets the instrument to the
factory default settings. These include interface
configurations and address settings. If you restore
the instrument’s default settings, any changes that
you made to the instrument and all current data is
lost.
• Edit user-defined devices: lets you edit or delete
existing user-defined devices, or add a new device
that is either outside of the local broadcast domain
or not being discovered.
• Remote RFC 2544/ITO Throughput Testing:
enables/disables the instrument to serve as the RFC
2544/ITO Throughput remote server and to
interoperate with another EtherScope Network
Assistant serving as the local unit during a remote
throughput test.
• Preferences
Show vendor prefix with MAC address: lets you
control how a device’s MAC address is shown. By
default, it is shown with a vendor prefix. When
the box is unchecked, the MAC address is shown
in raw hexidecimal format.
81
Page 94

EtherScope™ Series II
Getting Started Guide
Enable fast connect mode (applies to wired LAN
only): lets you quickly obtain a network link and
DHCP address.
By default, when EtherScope Network Assistant
is first plugged into a network, it tries to
determine whether it is connected to the same
broadcast domain it was previously connected
to. If it is, it saves the data it previously collected.
Use the Enable fast connect mode setting when
you repeatedly connect EtherScope Network
Assistant to different networks because usage
results in a faster response time. For example,
select fast connect mode when you are verifying
the connectivity of multiple office cubicles in a
new installation. In this mode, the instrument
automatically resets its discovery database when
changing the network connection or when
returning to the Test Results screen from the
Cable or Signal Verification screens.
Edit SNMP System Name: tap
supply a new SNMP system name for the
instrument. Tap
to save.
and then
Monitoring and Troubleshooting a Fiber LAN
The ES-FIBER-OPT option supports 1000BaseSX,
1000BaseLX, and 1000BaseZX fiber. The basic steps for
monitoring a fiber LAN are listed below.
1. Install the SFP fiber adapter (see “Installing and
Removing an SFP Fiber Adapter” on page 83.
2. Power on the instrument (see “Turning the
Instrument On and Off” on page 14).
3. If necessary, change the interface type to LAN (see
“Selecting the LAN or WLAN Interface” on page 15).
82
Page 95

Network Assistant
Monitoring and Troubleshooting a Fiber LAN
All the existing LAN features are supported when
EtherScope is connected to gigabit fiber interface with
the following exceptions:
• The link speed displays 1000MB and the fiber
type (SX, LX, or ZX)
• The Cable Verification and Signal Verification
tests are replaced with the fiber Loss Test
(requires an optional Fiber Optic Meter)
Note
If both the RJ-45 copper and SFP fiber (SX, LX, or
ZX) adapter are connected to the network at
the same time and the instrument is trying to
establish link, the fiber connection has priority
over the copper connection.
Installing and Removing an SFP Fiber Adapter
To install an SFP fiber adapter:
1. With the instrument turned off, remove the
protective cap as shown in Figure 23.
2. Insert the fiber adapter, making sure that it is firmly
seated into the connector.
WWarning
SFP fiber adapters are Class 1 laser lightemitting products. Avoid staring into the SFP
module while the EtherScope Network
Assistant is on; otherwise injury to the eyes
may occur.
83
Page 96

EtherScope™ Series II
Getting Started Guide
To remove the fiber adapter:
1. Make sure the instrument is turned off.
2. Press the release tab located on the back of the
adapter.
W Caution
Do not pull the fiber adapter without pressing
the release tab or damage to the adapter may
occur.
Remove fiber
adapter dust
cover.
Gently insert the
fiber adapter into
the connector.
Lock/Release Tab
Figure 23. Inserting the Fiber Adapter
eih85f.eps
84
Test Equipment Depot - 800.517.8431 - 99 Washington Street Melrose, MA 02176
FAX 781.665.0780 - TestEquipmentDepot.com
Page 97

Network Assistant
Monitoring and Troubleshooting a Wireless LAN
Monitoring and Troubleshooting a Wireless LAN
The basic steps for monitoring a wireless LAN (WLAN) are
listed below. Detailed information for a step can be
obtained by consulting the referenced section.
1. Install the WLAN Card.
2. Power on the instrument (see “Turning the
Instrument On and Off” on page 14).
3. If necessary, change the interface type to WLAN (see
“Selecting the LAN or WLAN Interface” on page 15).
Note
If you are operating EtherScope Network
Assistant for the first time, you should configure
a default SSID to automatically test link and to
use active discovery methods. See “Wireless
Instrument Security Settings” on page 101. If
operating the instrument in passive scan mode,
you do not have to configure security settings.
EtherScope Network Assistant runs a series of passive
scan tests then attempts to establish a link to an AP
that is configured with the default SSID.
4. View autotest results. See “Viewing AutoTest
Results” on page 38.
5. Make any needed configuration changes to match
your wireless network. See “Configuring the
Instrument for a Wireless LAN” on page 98.
Installing the WLAN Card
To install the wireless LAN card, insert it into SLOT 1,
which is located on the top side panel (see Figure 3).
85
Page 98

EtherScope™ Series II
Getting Started Guide
Viewing AutoTest Results
After you power on the instrument, it runs the
automated tests and displays the Test Results screen, as
shown in Figure 24.
epi73s.bmp
Figure 24. Wireless LAN Test Results Screen
The Test Results screen gives you at-a-glance visibility
into the state of your WLAN.
The main pane displays the name of each test and
reports its status. The icons along the right side give you
a visual indication of the progress and status of each test:
•
Running
• Not running
•
•
Completed and passed
Completed and failed
The preview pane provides a summary of the results of
the test that is selected in the main pane.
Note
When autotest finishes, the Connection test (the
default selection) is highlighted.
86
Page 99

Network Assistant
Monitoring and Troubleshooting a Wireless LAN
You can get a quick idea of the overall health of your
network and see what devices and services are running
by tapping each test listed in the main pane and then
viewing its summary results in the preview pane.
The individual autotests are described in this section. To
obtain in-depth results for a test, select it from the main
pane. Then tap .
Connection Test
The Connection test checks the status of the link and
determines whether EtherScope Network Assistant
established an association with a wireless access point.
The instrument first scans the wireless network, and then
attempts to link to an AP that is configured with the
default SSID.
After autotest runs, the Connection test is highlighted.
The Status column reports the results of the attempt to
connect:
• If the attempt to link to the default SSID/AP is
successful, this status icon is displayed:
address that the instrument acquired is identified in
the Status line.
The preview pane shows you information about the
connection, including the SSID, IP address, and
channel.
• If the attempt to link to the default SSID/AP fails, this
status icon is displayed , and the reason for the
failure (for example, no Access Point found) is
reported.
The IP
.
87
Page 100

EtherScope™ Series II
Getting Started Guide
EtherScope Network Assistant runs in active scan mode,
in which it continuously monitors active channels. The
Scan button in the lower left corner updates you on
which channels are being scanned.
To view details about the connection, tap .
The Connection details screen is displayed. This screen
shows you the connection settings (the results of autoconfiguration using DHCP) and configuration options.
You can change the current configurations from this
screen (see “Configuring the Instrument for a Wireless
LAN” on page 98 for assistance).
Channels Test
The Channels Test scans all channels in the 802.11a and
802.11 b/g spectrums to locate active channels, active
APs, active clients, and ad hoc devices. For each active
channel discovered, the test focuses on key metrics that
give you information about a channel’s configuration
and health.
To view results:
1. Tap Channels.
The main panel indicates how many channels are
being scanned. The preview pane shows separate
summaries of results for the 802.11a and 802.11b/g
networks. A small graph, which accompanies each
summary, visually displays the percentage of local
utilization.
88
 Loading...