

Page 1

Hart Scientific
9934 LogW are
User’s Guide
Rev. 592201
Page 2

Fluke Corporation, Hart Scientific Division (Hart) warrants this product to be free
from defects in material and workmanship under normal use and service for a pe
riod as stated in our current product catalog from the date of shipment. This war
-
ranty extends only to the original purchaser and shall not apply to any product
which, in Hart’s sole opinion, has been subject to misuse, alteration, abuse or abnor
mal conditions of operation or handling.
Software is warranted to operate in accordance with its programmed instructions on
appropriate Hart products. It is not warranted to be error free.
Hart’s obligation under this warranty is limited to repair or replacement of a product
which is returned to Hart within the warranty period and is determined, upon exam
ination by Hart, to be defective. If Hart determines that the defect or malfunction
has been caused by misuse, alteration, abuse or abnormal conditions or operation or
handling, Hart will repair the product and bill the purchaser for the reasonable cost
of repair.
To exercise this warranty, the purchaser must forward the product after calling or
writing Hart for authorization. Hart assumes NO risk for in-transit damage.
For service or assistance, please contact the manufacturer.
THE FOREGOING WARRANTY IS PURCHASER’S SOLE AND EXCLUSIVE
REMEDY AND IS IN LIEU OF ALL OTHER WARRANTIES, EXPRESS OR IMPLIED, INCLUDING BUT NOT LIMITED TO ANY IMPLIED WARRANTY OR
MERCHANTABILITY, OR FITNESS FOR ANY PARTICULAR PURPOSE OR
USE. HART SHALL NOT BE LIABLE FOR ANY SPECIAL, INDIRECT, INCIDENTAL, OR CONSEQUENTIAL DAMAGES OR LOSS WHETHER IN CONTRACT, TORT, OR OTHERWISE.
-
-
Rev. 592201
Microsoft, MS-DOS, Windows, Window for Workgroups, and Windows 95, 98,
ME, NT, 2000, and XP are either registered trademarks or trademarks of Microsoft
Corporation.
Fluke Corporation
Hart Scientific Division
799 E. Utah Valley Drive American Fork, UT 84003-9775 USA
Phone: +1.801.763.1600
Telefax: +1.801.763.1010
Email: support@hartscientific.com
www.hartscientific.com
Subject to change without notice. Copyright © 2005 Printed in USA
Page 3

Table of Contents
1 Introduction . . . . . . . . . . . . . . . . . . . . . . . . . . . . 1
1.1 What is LogWa re? . . . . . . . . . . . . . . . . . . . . . . . . . . 1
1.2 License Agreement . . . . . . . . . . . . . . . . . . . . . . . . . . 1
1.3 Features . . . . . . . . . . . . . . . . . . . . . . . . . . . . . . . . 1
1.4 Requirements . . . . . . . . . . . . . . . . . . . . . . . . . . . . . 2
1.4.1 Thermometer readout requirements . . . . . . . . . . . . . . . . . . . . . . . 2
1.4.2 Communications requirements. . . . . . . . . . . . . . . . . . . . . . . . . . 3
1.4.3 Computer hardware requirements . . . . . . . . . . . . . . . . . . . . . . . . 3
1.4.4 Computer software requirements. . . . . . . . . . . . . . . . . . . . . . . . . 3
1.5 Installation . . . . . . . . . . . . . . . . . . . . . . . . . . . . . . 4
1.6 Regional settings . . . . . . . . . . . . . . . . . . . . . . . . . . . 4
1.7 Running LogWare . . . . . . . . . . . . . . . . . . . . . . . . . . 4
1.7.1 Getting started . . . . . . . . . . . . . . . . . . . . . . . . . . . . . . . . . . 5
1.8 LogWa re main display . . . . . . . . . . . . . . . . . . . . . . . . 6
1.9 Toolbar . . . . . . . . . . . . . . . . . . . . . . . . . . . . . . . . 7
1.9.1 File toolbar . . . . . . . . . . . . . . . . . . . . . . . . . . . . . . . . . . . . 7
1.9.2 Datalog toolbar . . . . . . . . . . . . . . . . . . . . . . . . . . . . . . . . . . 8
1.9.3 Graph toolbar . . . . . . . . . . . . . . . . . . . . . . . . . . . . . . . . . . . 8
1.9.4 Tools toolbar . . . . . . . . . . . . . . . . . . . . . . . . . . . . . . . . . . . 8
1.9.5 Help toolbar . . . . . . . . . . . . . . . . . . . . . . . . . . . . . . . . . . . 9
2 How to... . . . . . . . . . . . . . . . . . . . . . . . . . . . . . . 11
2.1 Using an I/R dongle with LogWa re . . . . . . . . . . . . . . . . . 11
2.2 Opening a configuration file automatically on start-up . . . . . . . 13
2.3 Starting a real-time log session unattended (delayed start) . . . . . 15
2.4 Stopping a real-time log session automatically . . . . . . . . . . . 16
2.5 Downloading logged data from the memory of a thermometer . . . 17
2.6 Viewing remaining memory for logging data . . . . . . . . . . . . 17
2.7 Changing thermometer and/or INFO-CON/probe settings . . . . . 18
2.8 Saving thermometer and/or INFO-CON/probe settings to a configura
tion file . . . . . . . . . . . . . . . . . . . . . . . . . . . . . . . . . . . 20
2.9 Synchronizing the thermometer’s clock to the computer . . . . . . 21
2.10 Importing logged data into a spreadsheet . . . . . . . . . . . . . . 22
3 File menu . . . . . . . . . . . . . . . . . . . . . . . . . . . . . 27
3.1 New . . . . . . . . . . . . . . . . . . . . . . . . . . . . . . . . . 27
i
-
Page 4

3.2 Open . . . . . . . . . . . . . . . . . . . . . . . . . . . . . . . . . 27
3.3 Save as. . . . . . . . . . . . . . . . . . . . . . . . . . . . . . . . 28
3.4 Defaults . . . . . . . . . . . . . . . . . . . . . . . . . . . . . . . 28
3.4.1 General . . . . . . . . . . . . . . . . . . . . . . . . . . . . . . . . . . . . . 29
3.4.2 Folders . . . . . . . . . . . . . . . . . . . . . . . . . . . . . . . . . . . . . 30
3.5 Print setup . . . . . . . . . . . . . . . . . . . . . . . . . . . . . . 31
3.6 Print . . . . . . . . . . . . . . . . . . . . . . . . . . . . . . . . . 31
3.6.1 Readings . . . . . . . . . . . . . . . . . . . . . . . . . . . . . . . . . . . . 32
3.6.2 Graph . . . . . . . . . . . . . . . . . . . . . . . . . . . . . . . . . . . . . . 32
3.7 Exit . . . . . . . . . . . . . . . . . . . . . . . . . . . . . . . . . 32
4 Datalog menu . . . . . . . . . . . . . . . . . . . . . . . . . . . 33
4.1 Setup log session . . . . . . . . . . . . . . . . . . . . . . . . . . 33
4.1.1 Thermometer settings . . . . . . . . . . . . . . . . . . . . . . . . . . . . . . 34
4.1.2 Communication settings . . . . . . . . . . . . . . . . . . . . . . . . . . . . 34
4.1.3 Log settings . . . . . . . . . . . . . . . . . . . . . . . . . . . . . . . . . . . 35
4.1.4 Channel settings. . . . . . . . . . . . . . . . . . . . . . . . . . . . . . . . . 36
4.1.5 Open and save as . . . . . . . . . . . . . . . . . . . . . . . . . . . . . . . . 37
4.1.6 Set as default . . . . . . . . . . . . . . . . . . . . . . . . . . . . . . . . . . 37
4.2 Start log session . . . . . . . . . . . . . . . . . . . . . . . . . . . 38
4.3 Stop log session . . . . . . . . . . . . . . . . . . . . . . . . . . . 38
4.4 Close log session . . . . . . . . . . . . . . . . . . . . . . . . . . 39
4.5 Mute all alarms . . . . . . . . . . . . . . . . . . . . . . . . . . . 39
4.6 Alarm settings . . . . . . . . . . . . . . . . . . . . . . . . . . . . 39
4.7 Delayed start date/time . . . . . . . . . . . . . . . . . . . . . . . 42
4.8 Real-time log session . . . . . . . . . . . . . . . . . . . . . . . . 44
5 Download menu. . . . . . . . . . . . . . . . . . . . . . . . . . 49
5.1 Download logged data. . . . . . . . . . . . . . . . . . . . . . . . 49
5.2 Log status . . . . . . . . . . . . . . . . . . . . . . . . . . . . . . 53
5.3 Download Process. . . . . . . . . . . . . . . . . . . . . . . . . . 54
5.4 Binary download discrepancies . . . . . . . . . . . . . . . . . . . 56
6 View menu . . . . . . . . . . . . . . . . . . . . . . . . . . . . 59
6.1 Alarm log . . . . . . . . . . . . . . . . . . . . . . . . . . . . . . 60
6.1.1 Alarms. . . . . . . . . . . . . . . . . . . . . . . . . . . . . . . . . . . . . . 61
6.2 Readings history. . . . . . . . . . . . . . . . . . . . . . . . . . . 62
6.2.1 Statistics. . . . . . . . . . . . . . . . . . . . . . . . . . . . . . . . . . . . . 63
6.3 Open previously logged datafile. . . . . . . . . . . . . . . . . . . 63
7 Graph menu. . . . . . . . . . . . . . . . . . . . . . . . . . . . 67
ii
Page 5

7.1 Graph settings . . . . . . . . . . . . . . . . . . . . . . . . . . . . 68
7.1.1 Titles . . . . . . . . . . . . . . . . . . . . . . . . . . . . . . . . . . . . . . 69
7.1.2 Axis . . . . . . . . . . . . . . . . . . . . . . . . . . . . . . . . . . . . . . . 71
7.1.3 Fonts. . . . . . . . . . . . . . . . . . . . . . . . . . . . . . . . . . . . . . . 74
7.1.4 Trends . . . . . . . . . . . . . . . . . . . . . . . . . . . . . . . . . . . . . . 75
7.1.5 Background . . . . . . . . . . . . . . . . . . . . . . . . . . . . . . . . . . . 78
7.1.6 Legend. . . . . . . . . . . . . . . . . . . . . . . . . . . . . . . . . . . . . . 80
7.1.7 System. . . . . . . . . . . . . . . . . . . . . . . . . . . . . . . . . . . . . . 81
7.2 Restore default settings . . . . . . . . . . . . . . . . . . . . . . . 83
7.3 Trace color. . . . . . . . . . . . . . . . . . . . . . . . . . . . . . 83
7.4 Zoom in . . . . . . . . . . . . . . . . . . . . . . . . . . . . . . . 84
7.5 Restore (zoom out) . . . . . . . . . . . . . . . . . . . . . . . . . 85
7.6 Print graph. . . . . . . . . . . . . . . . . . . . . . . . . . . . . . 85
8 Tools menu . . . . . . . . . . . . . . . . . . . . . . . . . . . . 87
8.1 Synchronize date/time . . . . . . . . . . . . . . . . . . . . . . . . 87
8.2 Write labels . . . . . . . . . . . . . . . . . . . . . . . . . . . . . 88
8.3 INFO-CON/probe settings . . . . . . . . . . . . . . . . . . . . . 89
8.4 Thermometer settings . . . . . . . . . . . . . . . . . . . . . . . . 93
8.5 Select model . . . . . . . . . . . . . . . . . . . . . . . . . . . . . 97
8.6 Enter passcode. . . . . . . . . . . . . . . . . . . . . . . . . . . . 99
8.7 Callendar-Van Dusen coefficients . . . . . . . . . . . . . . . . . 100
8.8 High temperature PRT coefficients . . . . . . . . . . . . . . . . 102
8.9 IPTS-68 coefficients . . . . . . . . . . . . . . . . . . . . . . . . 103
8.10 ITS-90 coefficients . . . . . . . . . . . . . . . . . . . . . . . . . 104
8.11 Thermistor coefficients. . . . . . . . . . . . . . . . . . . . . . . 105
9 Window menu . . . . . . . . . . . . . . . . . . . . . . . . . . 107
10 Help menu . . . . . . . . . . . . . . . . . . . . . . . . . . . . 109
10.1 Technical support . . . . . . . . . . . . . . . . . . . . . . . . . 109
10.2 About. . . . . . . . . . . . . . . . . . . . . . . . . . . . . . . . 111
11 Configuration and other files . . . . . . . . . . . . . . . . . . 113
11.1 Single channel configuration file . . . . . . . . . . . . . . . . . 113
11.2 Alarms configuration file . . . . . . . . . . . . . . . . . . . . . 113
11.3 Thermometer configuration file . . . . . . . . . . . . . . . . . . 114
11.4 Channel configuration file . . . . . . . . . . . . . . . . . . . . . 114
11.5 Conversion configuration files . . . . . . . . . . . . . . . . . . . 114
11.6 Output files. . . . . . . . . . . . . . . . . . . . . . . . . . . . . 115
iii
Page 6

11.7 Download files . . . . . . . . . . . . . . . . . . . . . . . . . . . 116
11.8 Alarm log file . . . . . . . . . . . . . . . . . . . . . . . . . . . 117
iv
Page 7

Figures and Tables
Figure 1 9934 LogWare main display. . . . . . . . . . . . . . . . . . . . . . . . 6
Figure 2 LogWare toolbar. . . . . . . . . . . . . . . . . . . . . . . . . . . . . . 7
Figure 3 File toolbar . . . . . . . . . . . . . . . . . . . . . . . . . . . . . . . . 7
Figure 4 Datalog toolbar . . . . . . . . . . . . . . . . . . . . . . . . . . . . . . 8
Figure 5 Graph toolbar . . . . . . . . . . . . . . . . . . . . . . . . . . . . . . . 8
Figure 6 Tools toolbar. . . . . . . . . . . . . . . . . . . . . . . . . . . . . . . . 8
Figure 7 Help toolbar . . . . . . . . . . . . . . . . . . . . . . . . . . . . . . . . 9
Figure 8 Model 2374 Infrared Dongle . . . . . . . . . . . . . . . . . . . . . . . 12
Figure 9 Text Import Wizard – Step 1 of 3 dialog . . . . . . . . . . . . . . . . . 23
Figure 10 Output file displayed in spreadsheet . . . . . . . . . . . . . . . . . . . 24
Figure 11 Text Import Wizard – Step 2 of 3 dialog . . . . . . . . . . . . . . . . . 24
Figure 12 Chart of output file . . . . . . . . . . . . . . . . . . . . . . . . . . . . 25
Figure 13 File menu. . . . . . . . . . . . . . . . . . . . . . . . . . . . . . . . . 27
Figure 14 Default Settings dialog . . . . . . . . . . . . . . . . . . . . . . . . . . 28
Figure 15 File|Defaults General tab. . . . . . . . . . . . . . . . . . . . . . . . . 29
Figure 16 File|Defaults Folders tab . . . . . . . . . . . . . . . . . . . . . . . . . 30
Figure 17 Datalog menu . . . . . . . . . . . . . . . . . . . . . . . . . . . . . . 33
Figure 18 Log Session settings . . . . . . . . . . . . . . . . . . . . . . . . . . . 33
Figure 19 Log Session Start Time . . . . . . . . . . . . . . . . . . . . . . . . . 37
Figure 20 Alarm Settings dialog . . . . . . . . . . . . . . . . . . . . . . . . . . 40
Figure 21 Delayed Start Date/Time dialog . . . . . . . . . . . . . . . . . . . . . 43
Figure 22 Real-Time Log Session window . . . . . . . . . . . . . . . . . . . . . 44
Figure 23 Download menu . . . . . . . . . . . . . . . . . . . . . . . . . . . . . 49
Figure 24 1522 Download dialog . . . . . . . . . . . . . . . . . . . . . . . . . . 50
Figure 25 1522 Log Status dialog. . . . . . . . . . . . . . . . . . . . . . . . . . 53
Figure 26 Downloaded Files dialog. . . . . . . . . . . . . . . . . . . . . . . . . 55
Figure 27 View menu . . . . . . . . . . . . . . . . . . . . . . . . . . . . . . . . 59
Figure 28 Alarms.log Dialog . . . . . . . . . . . . . . . . . . . . . . . . . . . . 60
Figure 29 Alarms dialog . . . . . . . . . . . . . . . . . . . . . . . . . . . . . . 61
Figure 30 Output file dialog . . . . . . . . . . . . . . . . . . . . . . . . . . . . 62
Figure 31 Statistics dialog. . . . . . . . . . . . . . . . . . . . . . . . . . . . . . 63
Figure 32 Log File dialog . . . . . . . . . . . . . . . . . . . . . . . . . . . . . . 64
Figure 33 Graph menu . . . . . . . . . . . . . . . . . . . . . . . . . . . . . . . 67
Figure 34 Graph Settings dialog . . . . . . . . . . . . . . . . . . . . . . . . . . 68
Figure 35 Graph Settings - Titles tab . . . . . . . . . . . . . . . . . . . . . . . . 69
Figure 36 Graph Settings - Axis tab . . . . . . . . . . . . . . . . . . . . . . . . 71
Figure 37 Graph Settings - Fonts tab . . . . . . . . . . . . . . . . . . . . . . . . 74
Figure 38 Graph Settings - Trends tab . . . . . . . . . . . . . . . . . . . . . . . 75
Figure 39 Graph Settings - Background tab . . . . . . . . . . . . . . . . . . . . 78
Figure 40 Graph Settings - Legend tab . . . . . . . . . . . . . . . . . . . . . . . 80
v
Page 8

Figure 41 Graph Settings - System Tab. . . . . . . . . . . . . . . . . . . . . . . 81
Figure 42 Trace Color dialog . . . . . . . . . . . . . . . . . . . . . . . . . . . . 83
Figure 43 Zoom In . . . . . . . . . . . . . . . . . . . . . . . . . . . . . . . . . 84
Figure 44 Tools menu . . . . . . . . . . . . . . . . . . . . . . . . . . . . . . . . 87
Figure 45 Data Labels dialog . . . . . . . . . . . . . . . . . . . . . . . . . . . . 88
Figure 46 Channel Settings dialog . . . . . . . . . . . . . . . . . . . . . . . . . 90
Figure 47 Calendar . . . . . . . . . . . . . . . . . . . . . . . . . . . . . . . . . 91
Figure 48 Thermometer Settings . . . . . . . . . . . . . . . . . . . . . . . . . . 94
Figure 49 Select Model dialog . . . . . . . . . . . . . . . . . . . . . . . . . . . 97
Figure 50 Enter Passcode dialog. . . . . . . . . . . . . . . . . . . . . . . . . . 100
Figure 51 Callendar-Van Dusen Coefficients dialog . . . . . . . . . . . . . . . 101
Figure 52 High Temp. PRT Coefficients dialog . . . . . . . . . . . . . . . . . . 102
Figure 53 IPTS-68 Coefficients Dialog . . . . . . . . . . . . . . . . . . . . . . 103
Figure 54 ITS-90 Coefficients dialog . . . . . . . . . . . . . . . . . . . . . . . 104
Figure 55 Thermistor Coefficients dialog . . . . . . . . . . . . . . . . . . . . . 106
Figure 56 Window menu . . . . . . . . . . . . . . . . . . . . . . . . . . . . . 107
Figure 57 Help menu . . . . . . . . . . . . . . . . . . . . . . . . . . . . . . . 109
Figure 58 About LogWare dialog . . . . . . . . . . . . . . . . . . . . . . . . . 111
Table 1 Conversion types . . . . . . . . . . . . . . . . . . . . . . . . . . . . 115
Figure 59 Example output file . . . . . . . . . . . . . . . . . . . . . . . . . . . 116
Figure 60 Example alarm log file . . . . . . . . . . . . . . . . . . . . . . . . . 117
Figure 61 Example download file . . . . . . . . . . . . . . . . . . . . . . . . . 117
vi
Page 9

1 Introduction
1 Introduction
What is LogWare?
1.1 What is Log
Hart’s 9934 LogWare is a real-time data logging, storage and analysis software
program designed specifically for use with Hart Scientific digital thermometers.
LogWare automates the logging of data from a single channel or input.
LogWare is designed to work with the following Hart Scientific digital
thermometers:
1502 Thermometer Readout (2 styles)
•
1502A Thermometer Readout
•
1503 Thermometer Readout
•
1504 Thermometer Readout
•
1521 Handheld Thermometer Readout
•
• 1522 LLL Handheld Thermometer Readout and Datalogger
Ware
?
1.2 License Agreement
For information and details regarding the software End User License Agreement (EULA), refer to the online help file’s License Agreement topic
1.3 Features
LogWare provides an easy-to-use Windows® interface to log, store and analyze
data from Hart Scientific digital thermometers. LogWa re also provides a
method to download readings that are stored in the memory of thermometers
that support this feature, such as the model 1522 LLL Handheld Datalogger.
After being logged or downloaded, the readings are written to a file that can be
opened by LogWare , spreadsheet or other analysis software.
LogWare ’s data logging features include:
•
Quick and easy configuration
•
Ability to save and open setup configuration files
•
Selectable sample interval from 1 second to 24 hours
•
Selectable delayed start time/date for off-hours logging
•
Selectable end log options (allows a log session to stop automatically af
ter a specified time or a specified number of readings)
•
Logs readings to ASCII text files that can then be opened, graphed and
printed
•
Graphs readings as they are being logged
•
Maintains statistical data for logged readings
-
1
Page 10

9934 LogWare
User’s Guide
Ability to set High and Low alarms
•
Can play .WAV file or launch any other software package when an alarm
•
trips (such as Pager software)
Many user-customizable graph settings including alarm, statistical and
•
trend lines
LogWare ’s data analysis features include:
Can open both real-time log files and downloaded files
•
Spreadsheet-style grid to view all readings
•
Graph that displays up to 32,767 readings at a time
•
Graph zooming capability
•
Statistical lines and calculations
•
Printing graph and readings
•
Can have multiple windows open simultaneously
•
LogWare also provides utilities which allow access to the following thermometer features (as applicable):
• Download logged data
• View log status
• Change log labels
• Synchronize date/time with computer
• Change thermometer-specific parameters (filter, resolution, units, calibra-
tion dates and constants, etc.)
• Change INFO-CON or probe-specific parameters (conversion type and
coefficients, calibration dates, excitation current, etc.)
Version 1.3
A list of new features and enhancements in this software follows:
•
Branding/Logo change – The logos and graphics displayed in LogWa re
have been updated.
Also, various features have been added to the software to aid in troubleshooting
issues related to downloading logged data
1.4 Requirements
LogWare supports the Hart Scientific digital thermometer models as listed be
low. The communication and computer requirements are also listed.
1.4.1 Thermometer readout requirements
LogWare is designed to work with the following Hart Scientific digital ther
mometer readouts:
2
-
-
Page 11

1502 Thermometer Readout (2 styles)
•
1502A Thermometer Readout
•
1503 Thermometer Readout
•
1504 Thermometer Readout
•
1521 Handheld Thermometer Readout
•
1522 Handheld Thermometer Readout and Datalogger
•
1.4.2 Communications requirements
The instrument being used with LogWare must be connected to a COM
(RS-232 serial) port on a computer using a “null modem” cable. (A “null mo
dem” cable is a cable that effectively replaces two modems. Refer to the ther
mometer’s User Guide for more information on the cable or contact hart
Scientific Customer Service to purchase a “null modem” cable.) The baud rate
can be set from 300 baud to 9600 baud depending on the instrument. However,
the instrument and computer baud rates must match.
1.4.3 Computer hardware requirements
The following minimum computer configuration is required to use LogWare .
• IBM Compatible 486 PC or better with 8MB RAM (Pentium® class pro-
cessor with 16MB RAM or more recommended)
• VGA monitor or better
• CD-ROM drive for installation
• 1 – RS-232 (COM) port)
•
Minimum of about 8MB of disk space (for installation) - The program re
quires additional disk space to store the data as it is acquired.
1 Introduction
Requirements
-
-
-
1.4.4 Computer software requirements
Note: To use LogWare, Windows® login accounts must be granted full ac
cess to the folder to which the software is installed and all subfolders. If
the folder has read-only access, errors will occur when LogWare attempts
to access its configuration files.
LogWare requires one of the following operating systems
•
Windows® 95/98
•
Windows® NT with SP4/2000/XP
Note: LogWare has only been tested on Windows® NT with Service Pack
4 installed.
-
3
Page 12

9934 LogWare
User’s Guide
1.5 Installation
Note: Before installing LogWare, be sure to read the License Agreement
and Warranty.
A backup should always be made of your hard disk drive and registry before in
stalling any software, and all running applications should be closed.
Note: To successfully install LogWare, you must be logged into Windows
as an Administrator.
Installing LogWare
1. Insert the LogWa re CD-ROM into your CD-ROM drive. The Setup pro
gram should run automatically.
2. Follow the on-screen instructions to install LogWare .
3. When prompted, enter the product serial number. The serial number is
provided on a sticker typically located on the CD pouch on the inside
back cover of the LogWare User’s Guide.
4. After all files have been installed, a program group is created with icons
for the software, the Help file, the README.TXT file, and an icon to
uninstall the software. The installation process is complete.
5. The README.TXT file can be displayed by checking the appropriate
check box before the setup program finishes. Read this file for important
information that was not available when the User Guide was printed.
Uninstalling LogWare
To uninstall the software, use the Windows® Add/Remove Programs icon in
the Control Panel. Follow the instructions given. The program files that were
installed to your system are removed. Any files that were created or saved by
users will not be removed from the system. These files, along with the folders
that these files are in, must be manually deleted using Windows® Explorer to
remove them from your system.
-
-
1.6 Regional settings
LogWare recognizes and uses the regional settings such as the date, time and
number formats as set in the Windows® Control Panel’s Regional Settings or
Regional Options icon.
1.7 Running Log
The following sections describe how to get LogWare up and running quickly.
4
Ware
Page 13

1.7.1 Getting started
The following information is intended to provide a brief overview on how to
get LogWare up and running quickly. For more detailed information, please re
fer to the following sections:
Section 1.8, LogWa re Main Display
•
Section 4, Datalog Menu
•
To use this software:
1. Click the Start button, then locate and click the icon created by the setup
process.
2. The software will start with the Log Session Settings dialog displayed on
top of the main display (see Section 4.1). If the Log Session Settings dia
log is not displayed when the software starts, select the Setup option
from the Datalog menu.
Note: In order to make the Log Session Settings dialog appear when the
software starts, check the “Show Log Session Settings dialog on start-up”
check box on the General tab of the Defaults dialog.
To start a log session, fill in the information on the Log Session Settings dialog.
The following information must be entered before a log session can start:
1 Introduction
Running LogWare
-
-
• Select the Model of the thermometer to use. Enter the Serial Number and
select the Readings Scale from the available choices.
• Select the COM port to which the thermometer is connected and choose
the baud rate.
•
Power up the thermometer and make sure it is connected to the specified
COM port. Click the Test Communication button to make sure LogWa re
can communicate with the thermometer.
•
Choose the log interval (time between readings)
•
Choose the appropriate end log option and set the other end log settings
as required.
•
To set a delayed start date/time, click the Delayed Start button and choose
the appropriate date and time for the log session to begin. Otherwise, the
log session will begin when the Start button is clicked.
•
Select the trace color, enter the output filename and set the statistics op
-
tions as desired.
•
To configure alarms, click the Alarm Settings button and set the appropri
ate alarm settings as desired.
These settings can be saved to a configuration file by clicking the Save As but
ton. If this configuration should be opened every time the software runs, click
the Set as Default button.
-
-
5
Page 14
9934 LogWare
User’s Guide
After entering this information, click the Start button to start the log session.
1.8 Log
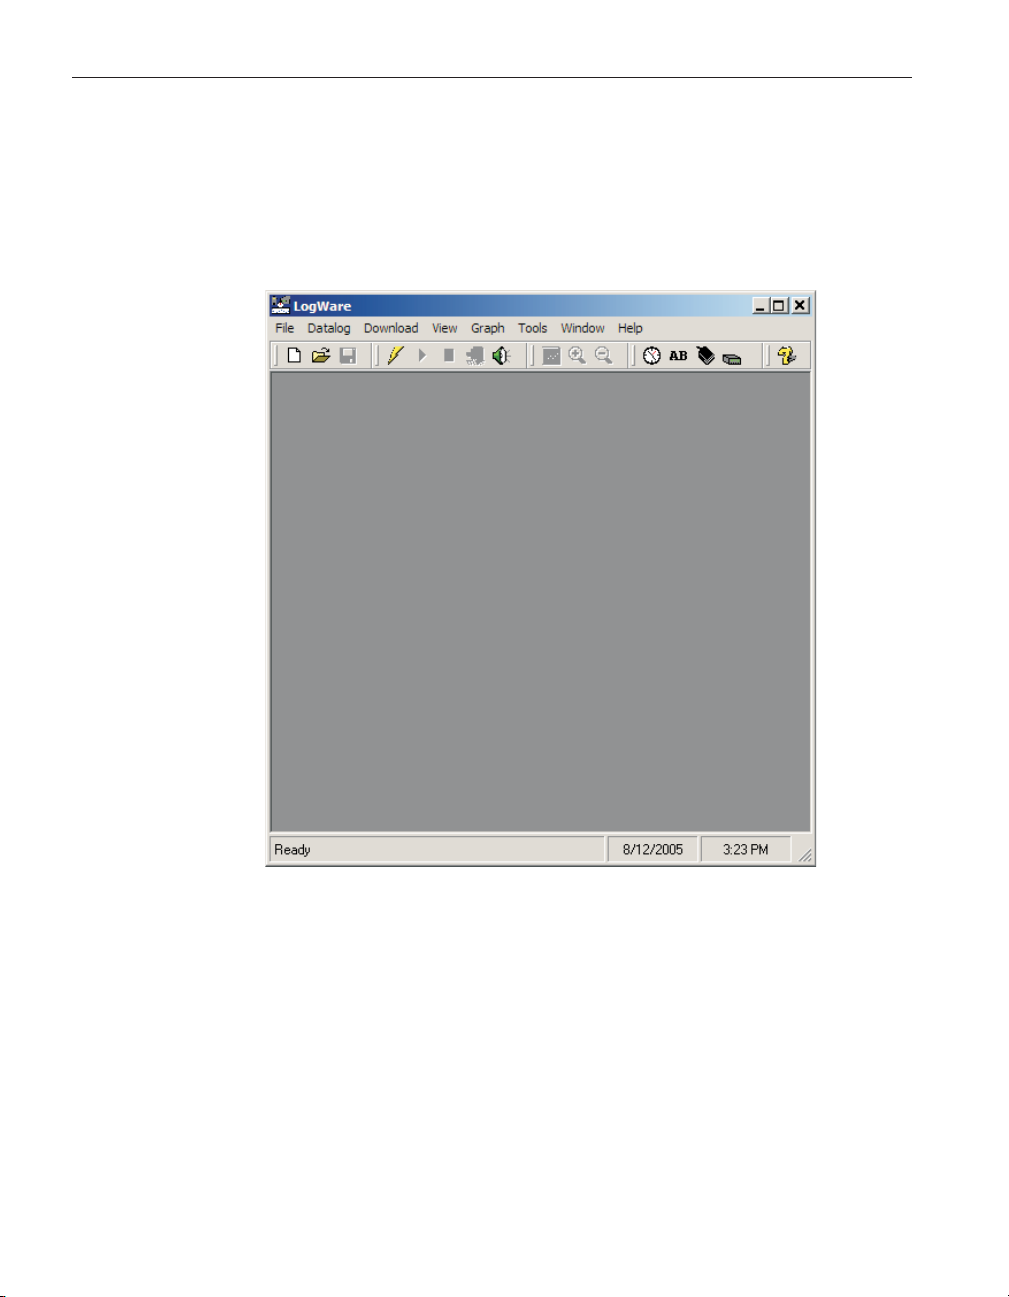
The main display (Figure 1) consists of the menu bar, toolbar, a workspace area
and a status bar.
Ware
main display
Figure 1 9934 LogWare main display
The menu bar allows access to the various features of the software. A general
description of the options in each menu is given below:
•
File – Open and save configuration files, change default settings, printing
options, exit the software
•
Datalog – Setup, Start, Stop and Close real-time log sessions
•
Download – Download logged readings from a thermometer and view log
status
•
View – View alarm log and reading history during real-time log session
and open previously logged data files
6
Page 15
1 Introduction
Toolbar
Graph – Change graph settings, zoom in and out, and print the current
•
graph
Tools – Synchronize thermometer date/time, configure various thermome
•
ter and INFO-CON/probe settings
Window – Rearrange and switch between open windows
•
Help – Display help topics and About dialog
•
The toolbar allows quick access to the most common menu functions. The
toolbar is divided into sections that correspond to related functions. Toolbar
sections may be rearranged as desired by clicking on the vertical bar on the left
side of the section and dragging it to the desired location.
The status bar indicates the function that the software is currently performing
as well as the current system date and time.
-
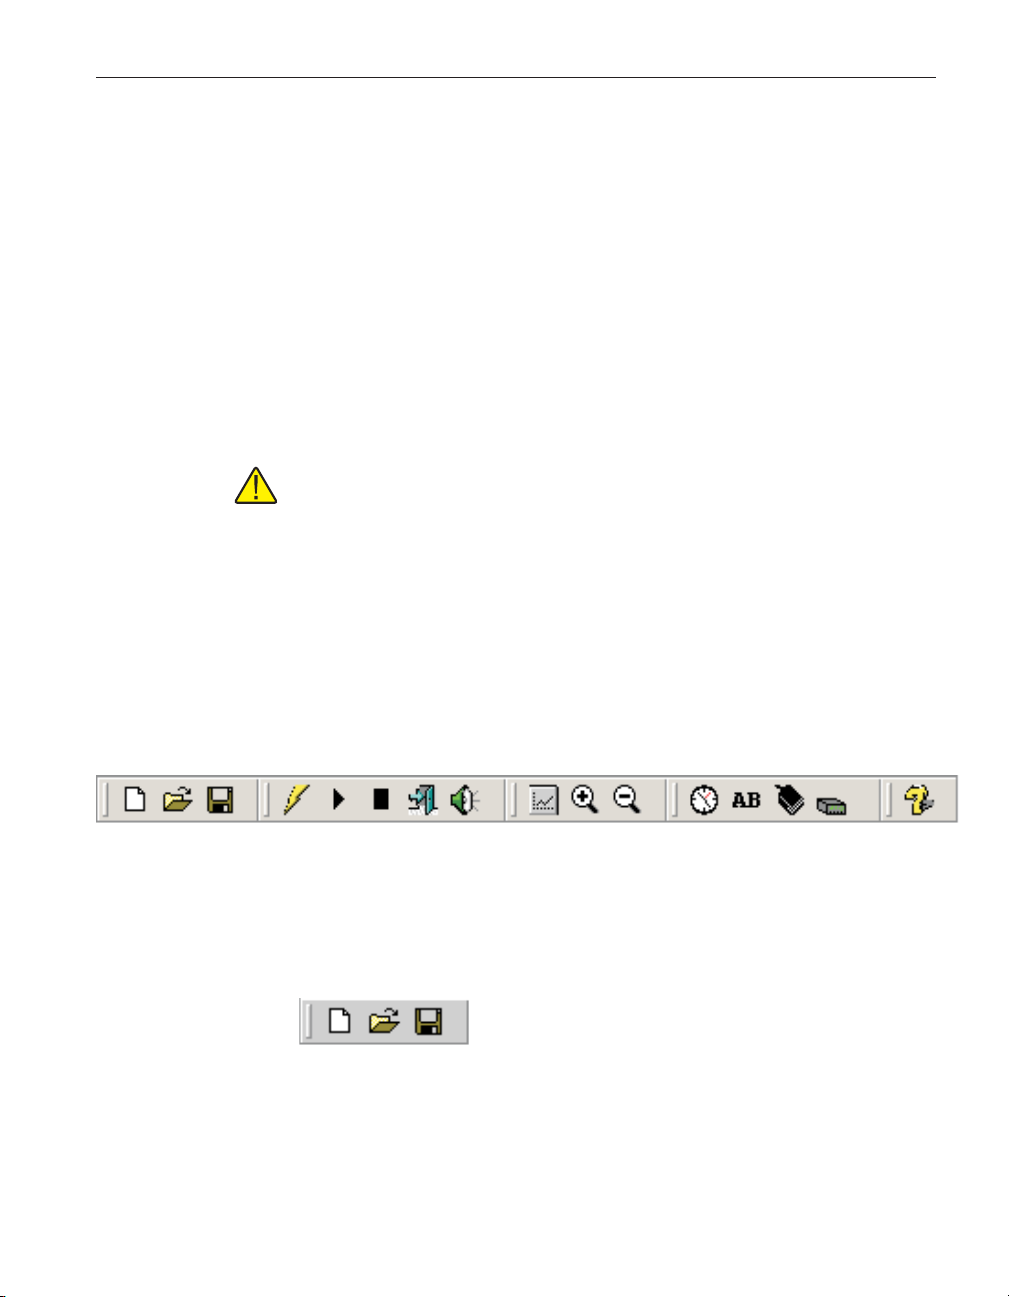
1.9 Toolbar
Figure 2 LogWare toolbar
1.9.1 File toolbar
Note: The date and time displayed are based on the computer’s clock set
tings and can be modified through the Windows® Control Panel. The date
and time formats used can be changed by selecting the Regional Settings
icon in the Control Panel.
The toolbar (Figure 2) provides quick access to many of the most common
functions of the software. The toolbar is divided into sections that correspond
to related menu options. Toolbar sections may be rearranged as desired by
clicking on the vertical bar on the left side of the section and dragging it to the
desired location.
The following toolbars are available:
Figure 3 File toolbar
New – Create a new real-time log session configuration
Open – Open a real-time log session configuration file
Save As – Save the current real-time log session settings to a configuration file
7
Page 16
9934 LogWare
User’s Guide
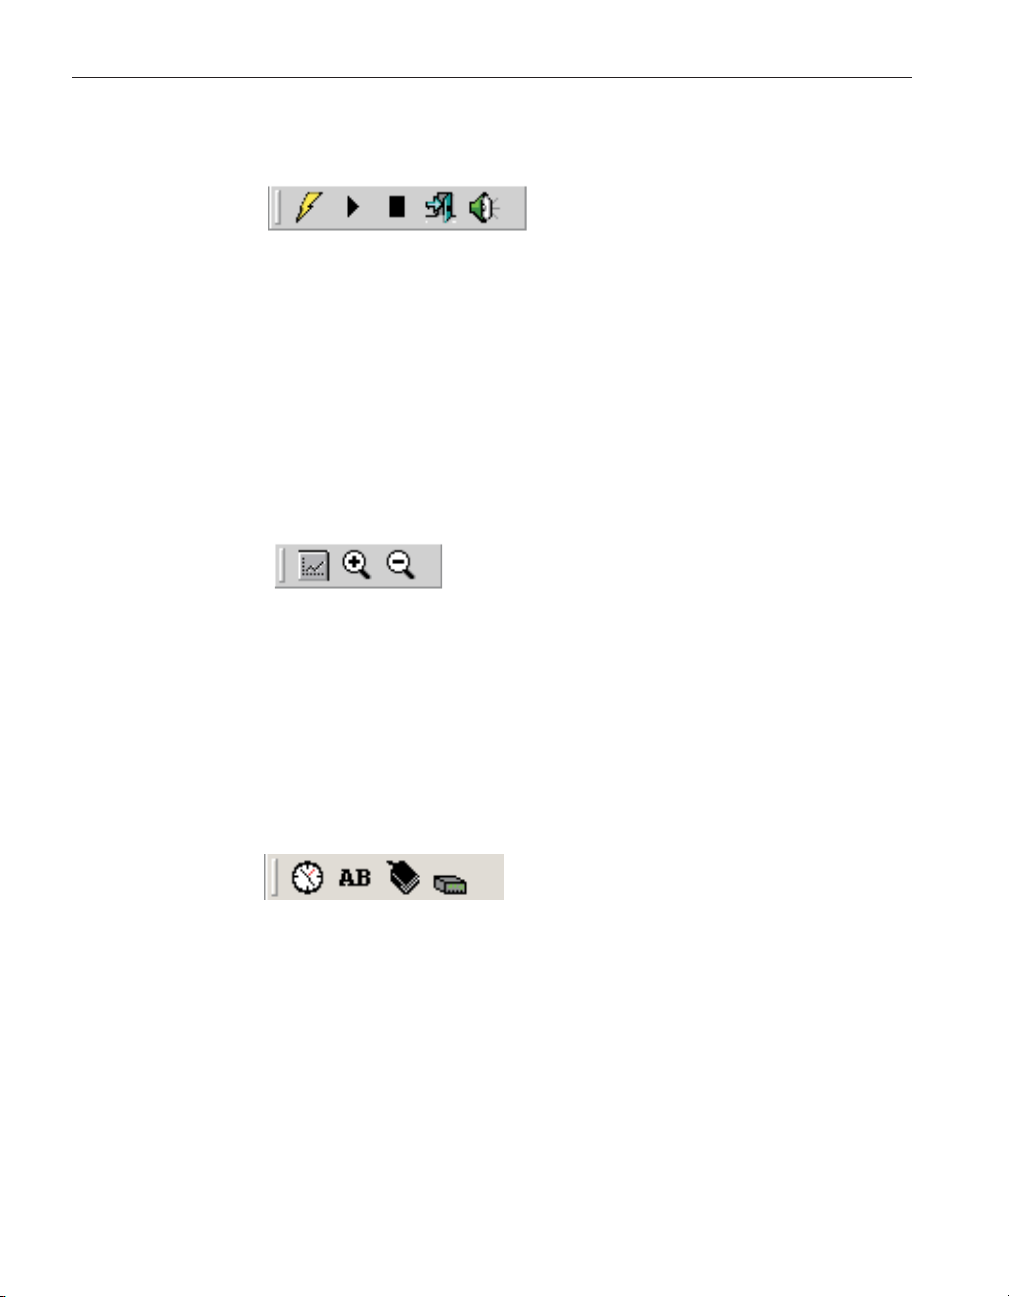
1.9.2 Datalog toolbar
1.9.3 Graph toolbar
Figure 4 Datalog toolbar
Setup – Setup a real-time log session
Start – Start a real-time log session
Stop – Stop a real-time log session
Close – Close a real-time log session
Mute all alarms – Mute/Unmute all real-time log session alarms
Figure 5 Graph toolbar
Graph settings – Change graph settings, add trend lines, alarm lines, titles,
captions, etc.
Zoom in – Zoom in to view a section of the graph
Restore (zoom out) – Zoom out to view entire graph
1.9.4 Tools toolbar
Figure 6 Tools toolbar
Synchronize date/time – Synchronize thermometer’s date/time with computer
Write labels – Change the labels associated with datalogging
INFO-CON/probe settings – Change settings associated with the INFO-CON
connector or probe
Thermometer settings – Change settings associated with the thermometer
8
Page 17

1.9.5 Help toolbar
Figure 7 Help toolbar
Help – Open the help file
1 Introduction
Toolbar
9
Page 18

2 How to...
Using an I/R dongle with LogWare
2 How to...
This section contains some “How to…” step-by-step instructions and other in
formation on how to use LogWa re to perform certain tasks. The following top
ics are included:
Using an I/R dongle with LogWa re (see Section 2.1).
•
Opening a configuration file automatically on start-up (see Section 2.2).
•
Starting a real-time log session unattended (Delayed Start) (see Section
•
2.3).
Stopping a real-time log session automatically (see Section 2.4).
•
Downloading logged data from the memory of a thermometer (see Sec
•
tion 2.5).
Viewing remaining memory for logging data (see Section 2.6).
•
Changing thermometer and/or INFO-CON/probe settings (see Section
•
2.7).
• Saving thermometer and/or INFO-CON/probe settings to a configuration
file (see Section 2.8).
• Synchronizing the thermometer’s clock to the computer (see Section 2.9).
• Importing logged data into a spreadsheet (see Section 2.10).
2.1 Using an I/R dongle with Log
Some Hart Scientific thermometer readouts, such as the 1522, have a built-in
I/R port that can be used to communicate with a computer. I/R ports have many
advantages over standard RS-232 ports which include increased data transfer
rate, greater flexibility and ease of use.
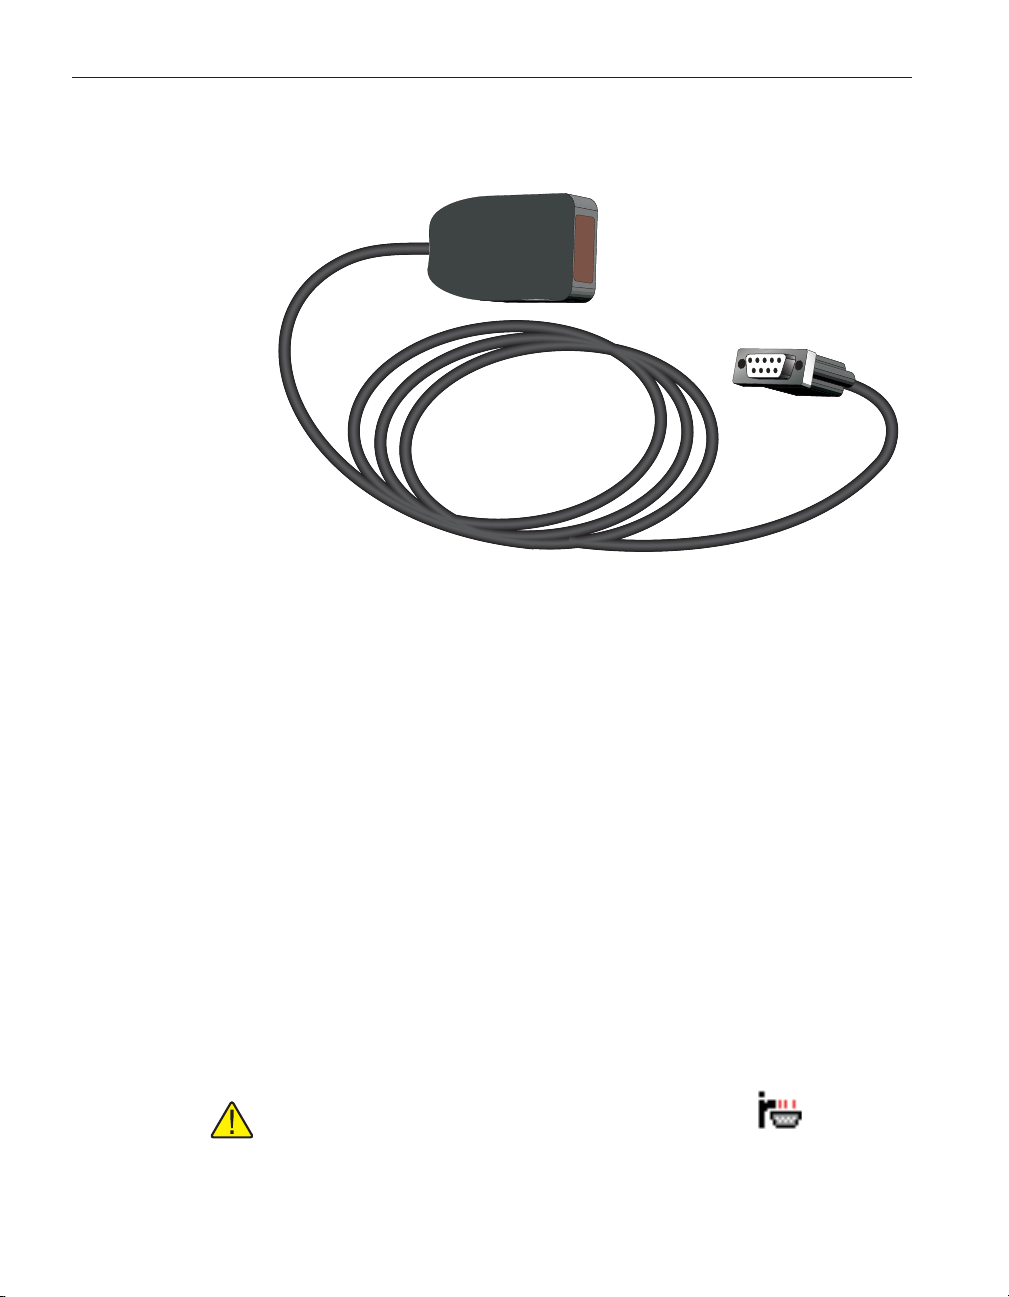
Hart thermometer readoutss with an I/R port use a proprietary protocol for
communication. Because of this proprietary protocol, LogWa re is not able to
use I/R ports that are built into a computer. Instead, LogWar e requires the use
of an I/R dongle (Figure 8) which can be connected to a standard RS-232 port.
No special software or drivers are required to use the dongle. All necessary
-
-
-
Ware
11
Page 19
9934 LogWare
User’s Guide
communication protocols and drivers are built into LogWa re . To purchase an
I/R dongle (model 2374), contact technical support.
Figure 8 Model 2374 Infrared Dongle
LogWare provides support for communicating over an I/R port with these thermometers. However, the support is limited to the following features:
• Downloading logged data from memory
• Checking log status
•
Writing labels associated with logged data
LogWar e does not support using the I/R port for real-time log sessions.
To use an I/R dongle with LogWar e, follow these steps.
1. Locate a 9-pin or 25-pin COM (RS-232) port on the computer. Connect
the I/R dongle to the port. If the COM port is a 25-pin port, use a 9-25
pin adapter to connect the dongle.
2. In the Download menu, select either the Download Logged Data option
or the Log Status option. Or, in the Tools menu, select the Write labels
option. The Select Model dialog is displayed (see Section 8.5).
3. Select the thermometer model to use. Then select the COM port to which
the I/R dongle is connected.
Note: In the COM port drop down list, ports with the symbol rep
-
resent built-in I/R ports and cannot be used!!
12
Page 20

Opening a configuration file automatically on start-up
4. Next, check the Use I/R Dongle check box. When this box is checked,
the Baud Rate setting is ignored since the thermometers are fixed at
115,200 baud when using the I/R port.
5. To ensure the computer can communicate with the thermometer using
the I/R port, place the I/R window of the thermometer in close proximity
to the I/R dongle and make sure the path between the two is not ob
structed (see the thermometer’s User Guide for details on the proximity
requirements). Click the Test Communication button. If LogWa re suc
ceeds in communicating with the thermometer a success message is dis
played. Otherwise, a failure message is displayed. In case of failure,
check the following:
The dongle is connected to the selected COM port
•
The thermometer is powered up and operating
•
The dongle is in range of the I/R port on the thermometer
•
The path between the thermometer and dongle is not obstructed
•
Shut the thermometer’s power off, then back on again
•
When communication succeeds, click the OK button to proceed to the appropriate dialog.
2 How to...
-
-
-
2.2 Opening a configuration file automatically on
start-up
LogWare was designed to be flexible with the thermometers that it can use and
the features it supports. However, most users of LogWar e will probably always
use the same thermometer, scale, communication settings, log interval and
channel and alarm settings to do all or most of their logging.
For this reason, LogWar e allows real-time log session settings to be saved to a
configuration file. Opening the configuration file restores the settings eliminat
ing the need to manually enter most of the information for a new log session.
Configuration files save the following information about a real-time log
session:
•
Thermometer model, serial number and readings scale
•
Communications COM port and baud rate
•
Log interval and End Log settings
•
Channel trace color and filename
•
Alarm and statistics settings
The delayed start date and time information is not saved in the configuration
file. For more information on configuration files, please read Configuration
Files.
-
13
Page 21

9934 LogWare
User’s Guide
In addition to allowing configuration files to be saved and opened, LogWa re
also allows one configuration file to be opened automatically every time
LogWare runs. This configuration file can be specified in one of two ways:
From the Defaults dialog (see Section 3.4.1)
•
From the Log Session Settings dialog (see Section 4.1)
•
Opening configuration file automatically using the Defaults dialog:
Select the Defaults option from the File menu (see Section 3.4.1).
•
Select the General tab.
•
Check the Show Log Session Settings dialog on start-up check box.
•
Check the Load default configuration file automatically check box.
•
Click the “…” (Browse) button to select the configuration file to open or
•
type the path and filename in the Default configuration file box.
Click the OK button to save the changes.
•
Note: The real-time log session settings must already be saved to a config-
uration file in order to accomplish these steps.
Opening configuration file automatically using the Log Session Settings
dialog:
14
• Select the Setup option from the Datalog menu (see Section 4.1).
• Fill in all of the information on this dialog.
• Click the Alarm Settings button and fill in the desired alarm settings.
• Click the Set as Default button.
•
A prompt is displayed to save the settings to a configuration file. Enter the
filename for this configuration file (use a descriptive name).
•
A prompt is displayed to confirm setting this configuration as the default
configuration file. Click Yes.
•
Click the Close button to close the dialog.
Test this feature to make sure it works properly by closing LogWa re and run
ning it again. The Log Session Settings dialog should be displayed with all of
the configuration information filled in. If the configuration file is not being
loaded, check the Defaults dialog as explained above.
To disable opening the configuration file on start-up, uncheck the Load default
configuration file automatically check box on the Defaults dialog.
Page 22

Starting a real-time log session unattended (delayed start)
2.3 Starting a real-time log session unattended
(delayed start)
2 How to...
The main purpose of LogWare is to log data in real-time. Many times, the tech
nician is present when a log session starts. However, sometimes it is necessary
or desirable to start a real-time log session at off-hours when the technician is
out.
LogWare has a feature called the Delayed Start which allows a real-time log
session to start at a predefined date and time. By default, a real-time log session
starts immediately when the Start button on the Log Session Settings dialog is
clickedorwhentheStartoptionintheDatalogmenuisselected.
Setting the delayed start date and time for a real-time log session:
Select the Setup option from the Datalog menu to display the Log Session
•
Settings dialog (see Section 4.1).
Fill in the Thermometer settings and Communication settings informa
•
tion.
• Set the Log interval and choose the appropriate End Log settings.
• Click the Delayed Start button to display the Delayed Start Date/Time di-
alog.
• Choose the date and time that the real-time log session should start. The
start date and time are with respect to the computer’s clock settings. Make
sure the computer’s clock is accurate. Click the OK button to accept the
selected date and time.
Note: To cause the real-time log session to start immediately when click-
ing the Start button after having set a delayed start date and time, click the
Reset button.
-
-
•
Fill in the Channels information to complete the setup process.
•
Click the Start button on the Log Session Settings dialog.
•
LogWa re displays a message indicating the date and time the real-time log
session will start.
•
To cancel the delayed start, click the Cancel button at any time.
After a real-time log session ends, the delayed start time is reset so that the next
real-time log session will start immediately when the Start button on the Log
Session Settings dialog is clicked or when the Start option in the Datalog menu
is selected. To set a new delayed start time for the next real-time log session,
follow the steps above.
15
Page 23

9934 LogWare
User’s Guide
2.4 Stopping a real-time log session automatically
Note: Every effort has been made to make the real-time log session take
its first reading at the selected date and time. However, due to the large
variation in the speed at which different computers operate, the first read
ing may be one or more seconds later than the selected time (commonly
known as “latency”). To compensate for this, try a few tests to determine
the approximate latency in the computer being used and then adjust the
start time accordingly by reducing the start time by the difference between
the selected start time and the actual time of the first reading.
-
The main purpose of LogWare is to log data in real-time. Many times, the tech
nician is present when a log session needs to be stopped. However, sometimes
it is necessary or desirable to stop a real-time log session when the technician is
busy with another task, or at off-hours when the technician is out.
The End Log feature of LogWare provides three methods for stopping a
real-time log session:
• Manually, by the technician
• Automatically, after a specific number of readings
• Automatically, after a specific period of time
The first method, Manually, by the technician, is the default End Log setting.
Stopping the real-time session automatically:
• Select the Setup option from the Datalog menu to display the Log Session
Settings dialog (see Section 4.1).
•
Fill in the Thermometer settings and Communication settings informa
-
tion.
•
Set the Log interval.
•
If needed, select the appropriate delayed start date and time.
•
Using the End Log drop down list, select the method to use to stop the
real-time log session:
By user – Log session stops when the Stop option in the Datalog menu is
selected
-
16
After specified # of readings – Log session stops automatically when number
of readings specified have been logged
After specified time – Log session stops automatically after the specified time
has elapsed
•
Specify the End Log criteria by selecting either the number of readings or
the elapsed time
•
Fill in the Channels information to complete the setup process.
Page 24

thermometer
2.5 Downloading logged data from the memory of a
Downloading logged data from the memory of a
Click the Start button on the Log Session Settings dialog to start the
•
real-time log session.
2 How to...
thermometer
Some thermometers that are supported by LogWare allow readings to be logged
to the memory of the thermometer. LogWa re provides a feature to download the
logged readings from the memory of the thermometer and save them to a text
file (or files) on the computer.
Currently, only the Model 1522 LLL Handheld Datalogger has this capability.
Downloading readings from the memory of a thermometer to a text file (or
files) on the computer:
Select Download Logged Data from the Download menu (see Section
•
5.1).
• The Select Model dialog is displayed (see Section 8.5). Select the ther-
mometer model from which the readings are to be downloaded. Also, select the COM port to which the thermometer is connected and the baud
rate to use. If using the I/R port, check the Use I/R Dongle check box.
Note: The 1522 LLL Handheld Datalogger has an I/R port which can be
used to download readings. Using the I/R port requires an I/R dongle to
be connected to a COM port on the computer. For more information,
please read Section 2.1 Using an I/R dongle with LogWare.
•
Make sure LogWare can communicate with the thermometer by clicking
the Test Communication button.
•
Click the OK button when communication is successful.
•
The Download dialog is displayed. This dialog is specific to the options
and features of the selected thermometer model.
•
Select the appropriate download options and click the Download button to
download the readings.
•
Click the Close button to close the Download dialog when finished.
2.6 Viewing remaining memory for logging data
Some thermometers that are supported by LogWare allow readings to be logged
to the memory of the thermometer. LogWa re provides a feature that indicates
how much of the thermometer’s memory is already used.
Currently, only the Model 1522 LLL Handheld Datalogger has this capability.
Viewing the status of the thermometer’s log(s):
17
Page 25

9934 LogWare
User’s Guide
Select Log Status from the Download menu (see Section 5.2).
•
The Select Model dialog is displayed (see Section 8.5). Select the ther
•
mometer model from which the readings are to be downloaded. Also, se
lect the COM port to which the thermometer is connected and the baud
rate to use. If using the I/R port, check the Use I/R Dongle check box.
Note: The 1522 LLL Handheld Datalogger has an I/R port which can be
used to download readings. Using the I/R port requires an I/R dongle to
be connected to a COM port on the computer. For more information,
please read Section 2.1 Using an I/R dongle with LogWare.
Make sure LogWare can communicate with the thermometer by clicking
•
the Test Communication button.
Click the OK button when communication is successful.
•
The Log Status dialog is displayed indicating how much of the thermome
•
ter’s memory is already used. This dialog is specific to the features of the
selected thermometer model.
• Click the Close button to close the Log Status dialog when finished.
-
-
-
2.7 Changing thermometer and/or INFO-CON/probe
settings
LogWare provides a feature which allows many of the thermometer and
INFO-CON/probe settings to be read in, viewed, modified and written back out
to the thermometer. These settings include:
•
Filter
•
Resolution
•
Thermometer calibration and recalibration dates
•
Thermometer calibration constants
•
Probe serial number
•
Probe wires
•
Probe calibration and recalibration dates
•
Probe conversion type and calibration coefficients
Viewing, modifying and writing the new settings to the thermometer:
•
Select Thermometer Settings from the Tools menu (see Section 8.4).
•
The Select Model dialog is displayed (see Section 8.5). Select the ther
mometer model from which the settings are to be read in. Also, select the
COM port to which the thermometer is connected and the baud rate to
use.
-
18
Page 26
Changing thermometer and/or INFO-CON/probe settings
Make sure LogWare can communicate with the thermometer by clicking
•
the Test Communication button.
Click the OK button when communication is successful.
•
All thermometer and INFO-CON/probe settings are then read in and dis
•
played in the Thermometer Settings dialog.
2 How to...
-
Note: The controls for settings which do not apply to the selected ther
-
mometer are disabled.
Any of the settings can be modified at this time. All passcode protected
•
settings are indicated in RED. These settings can be modified freely but
will not be written back to the thermometer without the correct passcode
being entered when prompted.
To view or modify the INFO-CON/probe settings, select the appropriate
•
channel from the Channels list and click the Channel Settings button to
display the Channel Settings dialog.
• All thermometer and INFO-CON/probe settings can be saved to a configuration file by clicking the Save As button. To read in a configuration file
containing thermometer and INFO-CON/probe settings, click the Open
button. Thermometer configuration files have a .THM extension.
Note: Thermometer configuration files are specific to each thermometer
model. LogWare does not allow a thermometer configuration file for a
1502 to be opened when working with a 1521, etc. Therefore, when saving
thermometer configuration files, include the thermometer model number
in the filename so that the contents of the file are known.
•
To write any changes that have been made back out to the thermometer,
click the OK button. If any of the passcode protected settings were
changed, the Enter Passcode dialog is displayed (see Section 8.6). The
correct passcode MUST be entered in order for the new settings to be
properly written to the thermometer.
Note: LogWare cannot verify that the correct passcode was entered except
on the model 1522 LLL Handheld Datalogger. If an incorrect passcode
was entered, LogWare continues and attempts to write the new settings,
however the thermometer will not accept the new settings.
•
To close the Thermometer Settings dialog without writing the settings
back out to the thermometer, click the Cancel button.
19
Page 27
9934 LogWare
User’s Guide
2.8 Saving thermometer and/or INFO-CON/probe
settings to a configuration file
LogWare provides a feature which allows many of the INFO-CON/probe set
tings to be read in, viewed, modified and written back out to the thermometer.
These settings include:
Probe serial number
•
Probe wires
•
Probe calibration and recalibration dates
•
Probe conversion type and calibration coefficients
•
Viewing, modifying and writing the new settings to the thermometer:
Select INFO-CON/Probe Settings from the Tools menu (see Section 8.3).
•
The Select Model dialog is displayed (see Section 8.5). Select the ther
•
mometer model from which the settings are to be read in. Also, select the
COM port to which the thermometer is connected and the baud rate to
use.
• Make sure LogWare can communicate with the thermometer by clicking
the Test Communication button.
• Click the OK button when communication is successful.
• All INFO-CON/probe settings are then read in and displayed in the Chan-
nel Settings dialog.
Note: The controls for settings which do not apply to the selected ther-
mometer are disabled.
-
-
20
•
Any of the settings can be modified at this time. All passcode protected
settings are indicated in RED. These settings can be modified freely but
will not be written back to the thermometer without the correct passcode
being entered when prompted.
•
All INFO-CON/probe settings can be saved to a channel configuration
file by clicking the Save As button. To read in a channel configuration file
containing INFO-CON/probe settings, click the Open button. Channel
configuration files have a .CHN extension.
Note: Channel configuration files are specific to each thermometer model.
LogWare does not allow a channel configuration file for a 1502 to be
opened when working with a 1521, etc. Therefore, when saving channel
configuration files, include the thermometer model number in the filename
so that the contents of the file are known.
Page 28
Synchronizing the thermometer’s clock to the computer
To write any changes that have been made back out to the thermometer,
•
click the OK button. If any of the passcode protected settings were
changed, the Enter Passcode dialog is displayed (see Section 8.6). The
correct passcode MUST be entered in order for the new settings to be
properly written to the thermometer.
Note: LogWare cannot verify that the correct passcode was entered except
on the model 1522 LLL Handheld Datalogger. If an incorrect passcode
was entered, LogWare continues and attempts to write the new settings,
however the thermometer will not accept the new settings.
To close the Channel Settings dialog without writing the settings back out
•
to the thermometer, click the Cancel button.
2 How to...
2.9 Synchronizing the thermometer’s clock to the
computer
Most of the thermometers supported by LogWare have an internal clock.
LogWare provides a feature to synchronize the thermometer’s clock with the
clock on the computer.
Note: LogWare itself does not use the clock on the thermometer at all. All
dates and times associated with readings logged by LogWare use the current date and time according to the computer’s clock.
Before synchronizing the thermometer’s clock, make sure the computer’s clock
is accurate. Use the Windows® Control Panel to adjust the date and time as
necessary.
Synchronizing the thermometer’s clock with the computer’s clock:
•
Select Synchronize Date/Time from the Tools menu.
•
The Select Model dialog is displayed (see Section 8.5). Select the appro
priate thermometer model. Also, select the COM port to which the ther
mometer is connected and the baud rate to use.
•
Make sure LogWare can communicate with the thermometer by clicking
the Test Communication button.
•
Click the OK button when communication is successful.
Note: If the date and/or time setting on the selected thermometer’s clock
is passcode protected, the Enter Passcode dialog is displayed (see Section
8.6). Enter the passcode and click the OK button to continue. If the
passcode is not known, click the Cancel button to abort setting the ther
mometer’s clock.
-
-
-
21
Page 29

9934 LogWare
User’s Guide
2.10 Importing logged data into a spreadsheet
LogWa re attempts to set the thermometer’s clock to match the clock on
•
the computer.
Note: LogWare cannot verify that the correct passcode was entered except
on the model 1522 LLL Handheld Datalogger. If an incorrect passcode
was entered, LogWare continues and attempts to write the new settings,
however the thermometer will not accept the new settings.
The data logged by LogWare is saved into ASCII text files referred to as output
files. These files can be opened and graphed by LogWar e by selecting the Open
Previously Logged Data File option from the View menu.
However, these files may also be imported into spreadsheet software such as
Microsoft® Excel for graphing or analysis.
Importing an output file into Excel:
Note: This example uses Microsoft® Excel 2002. These steps may not ap-
ply if using a different version of Excel or another spreadsheet software
package.
22
• In Excel, select the Open option from the File menu to display the Open
dialog.
• In the Files of type box at the bottom of the open dialog, select the Text
Files option.
•
Navigate to the folder where the output file is located. Select the output
file to open and click the Open button.
Page 30
Importing logged data into a spreadsheet
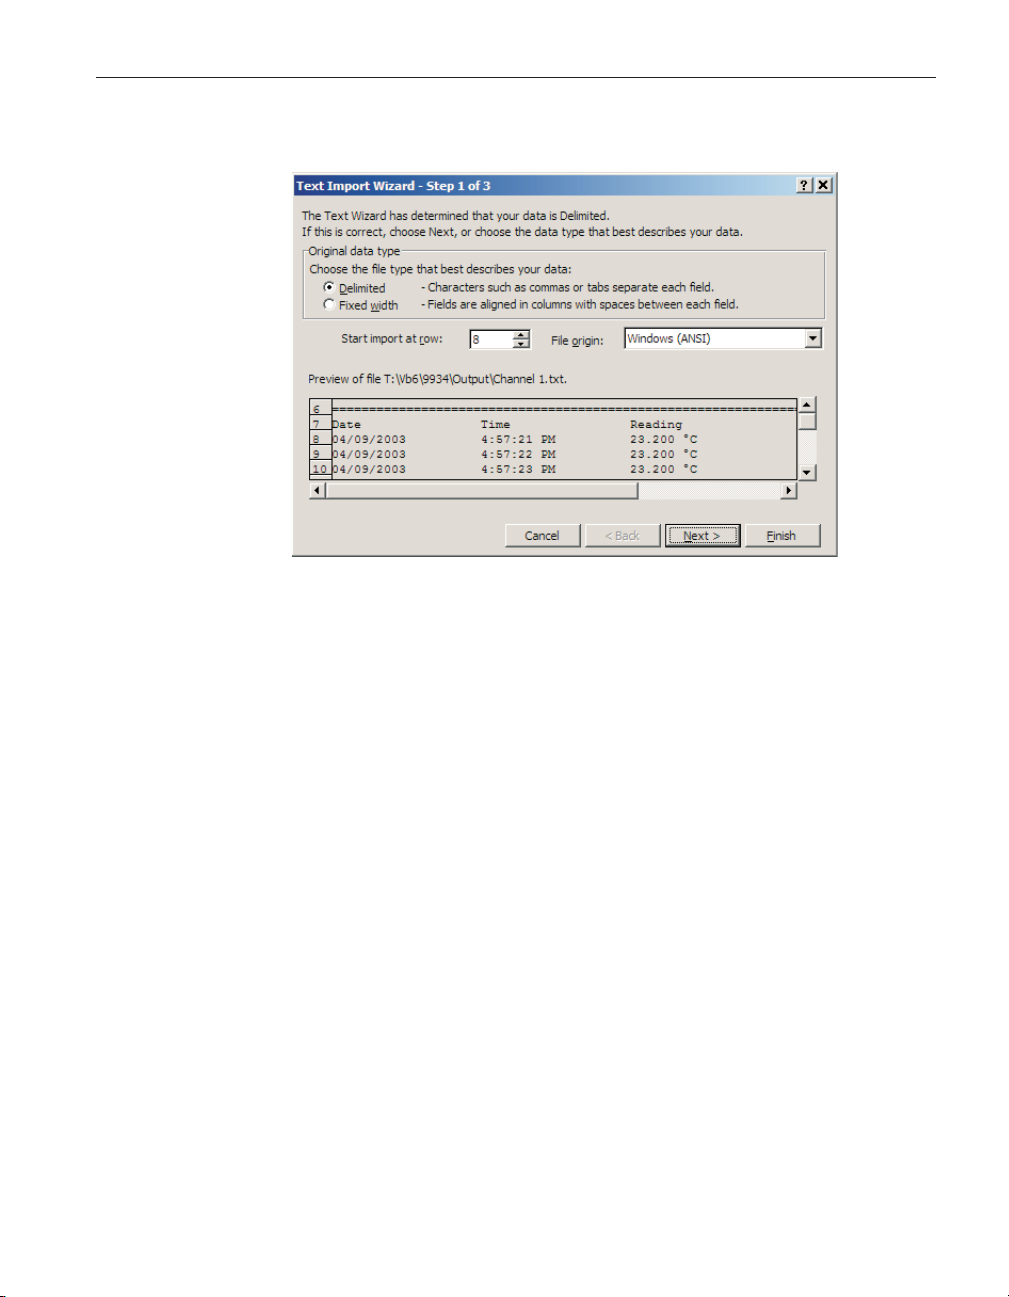
The Text Import Wizard – Step 1 of 3 dialog appears, Figure 9.
•
Figure 9 Text Import Wizard – Step 1 of 3 dialog
2 How to...
• Make sure the Original data type option is set to Delimited. If the thermometer and probe information is not needed, set the Start import at row
option to row 8 or the first row containing the logged readings. Set the
File Origin option to Windows (ANSI) and click the Next > button.
23
Page 31

9934 LogWare
User’s Guide
The Text Import Wizard – Step 2 of 3 dialog appears, Figure 11.
•
Figure 11 Text Import Wizard – Step 2 of 3 dialog
• In the Delimiters box, select the Tab and Space options. Make sure the
Treat consecutive delimiters as one check box is checked and click the
Finish button.
• The output file is displayed in the spreadsheet. Resize the columns so the
contents of each cell are visible.
•
Select the Date, Time, and Reading columns by clicking on the gray col
umn headers labeled A, B, C and D as shown in Figure 10.
Figure 10 Output file displayed in spreadsheet
•
From the Insert menu of Excel, select the Chart option.
•
The Chart Wizard – Step 1 of 4 – Chart Type dialog is displayed.
•
In the Chart type list, select Line and click the Finish button.
-
24
Page 32

Importing logged data into a spreadsheet
The graph should be displayed as shown in Figure 12.
•
Figure 12 Chart of output file
2 How to...
• Format and size the graph as desired.
25
Page 33

3 File menu
The File menu (Figure 13) provides options for creating a new configuration,
opening an existing configuration file, saving a configuration file, setting up
program defaults, setting up the printer, printing, and exiting the program.
Figure 13 File menu
3 File menu
New
3.1
3.2
New
The New menu option should be selected when a new configuration needs to be
created. When this option is selected, the user must confirm resetting all exist
ing configuration settings before starting a new configuration. Resetting the
configuration causes all thermometer, communications, log interval, channel,
alarm and statistics settings to be reset. If the user chooses not to reset all exist
ing settings, this process is aborted and no changes are made.
If the user chooses to reset all existing settings, the Log Session Settings dialog
is displayed and a new configuration can be started.
-
Open
The Open menu option allows a previously saved configuration file containing
test, thermometer, channel, alarm, statistics and conversion settings.
Selecting the Open menu option displays the Open Single Channel Configura
tion File dialog. Select the configuration file that contains the settings that
match the instrument from which you wish to collect data. Then click the Open
button to open the configuration file. The Log Session Settings dialog will be
displayed with the current settings.
-
27
-
Page 34

9934 LogWare
User’s Guide
3.3
Save as
Selecting the Save As menu option displays the Save Single Channel Configu
ration File As dialog. Enter a descriptive, unique filename that identifies the
current configuration being saved to the file. You may want to include the ther
mometer model number and serial number. This filename can be up to 256
characters in length.
3.4 Defaults
The Defaults menu option displays the Default Settings dialog (Figure 14) and
allows the user to set default settings by selecting one of two tabs: General or
Folders. The General tab consists of miscellaneous settings for the software.
The Folders tab consists of the locations of the configuration, output, and
download files. The settings and selections entered on these tabs determine the
behavior of the software.
-
-
28
Figure 14 Default Settings dialog
Click the OK button to accept the current settings and close this dialog.
Click the Cancel button to discard any changes you have made.
Click the Help button to display the appropriate help topic for this dialog.
Page 35

3.4.1 General
The General tab (Figure 15) consists of miscellaneous settings for the software.
3 File menu
Defaults
Figure 15 File|Defaults General tab
The settings on this tab are:
Remember window positions and settings
This option is used to make sure that dialogs and windows always appear in the
same location on the screen every time they are displayed. If checked, dialogs
and windows appear in the same position they were in when last closed. Other
wise, dialogs and windows always appear in the same place on the screen, re
-
gardless of their position when last closed.
Show log session settings dialog on start-up
This option is used to specify whether or not the Log Session Settings dialog is
displayed every time the software runs. If checked, the Log Session Settings di
alog is displayed. Otherwise, this dialog is not displayed.
If this option is selected, the Load default configuration file automatically op
tion is enabled. Checking this option allows a configuration file to be specified
in the Default configuration file box below. If a configuration file is specified, it
will be loaded every time the software runs. Use the “…” (Browse) button to
locate the configuration file to load or type the path and filename into the box.
29
-
-
Page 36

9934 LogWare
User’s Guide
3.4.2 Folders
Enable communication debugging
This option is used to enable debugging features in LogWar e. This option
should remain unchecked unless otherwise directed by a customer service rep
resentative. If enabled, LogWar e creates a file that contains information for all
communications that happen between the software and an instrument. This file
can be evaluated by customer service representatives to troubleshoot and deter
mine the source of possible problems.
Click the OK button to accept the current settings and close this dialog. If the
Load default configuration file automatically check box is checked, a valid con
figuration file must be specified. If this file does not exist, a message is dis
-
played and the dialog will not close. Please select an existing configuration file.
Click the Cancel button to discard any changes you have made.
Click the Help button to display the appropriate help topic for this dialog.
The Folders tab (Figure 16) consists of the locations of the configuration, output, and download files.
-
-
-
30
Figure 16 File|Defaults Folders tab
These folders default to specific subfolders of the folder where the software is
installed. The default subfolder names are as follows:
Page 37

3 File menu
Print setup
Default folder for configuration files
This is the default folder, <Drive>:\<AppFolder>\Config, that is selected
when the Open and Save As dialogs are displayed for opening and saving con
figuration files. For more information on configuration files, see Section 11
Configuration Files.
Default folder for output files
This is the default folder, <Drive>:\<AppFolder>\Output, where the output
files from a real-time log session are written. Output files contain the data that
was collected during a real-time log session. For more information on output
files, see Section 11.6 Output Files.
Default folder for downloads
This is the default folder, <Drive>:\<AppFolder>\Download, that is selected
when downloading data from thermometers that support this capability. Down
loaded files contain data that the thermometer stores in memory. For more in
formation on download files, see Section 11.7 Download Files.
To change the default folder for any of these options, either type the path into
the appropriate box or select the “…” (Browse) button to browse for an existing
folder.
-
-
-
Note: If the folder does not already exist, the path must be typed into the
box provided. If the folder does already exist, use the “…” (Browse) button to select it.
Click the OK button to accept the current settings and close this dialog.
Click the Cancel button to discard any changes you have made.
Click the Help button to display the appropriate help topic for this dialog.
3.5 Print setup
Selecting the Print Setup menu option displays the Windows® Print Setup dia
log. Select the settings you wish to change and click the OK button.
Note: The graph is always printed in a Landscape orientation regardless
of the default orientation setting of the printer.
Select the Cancel button to discard any changes you have made.
3.6 Print
The Print menu option is only enabled when acquiring or analyzing data.
-
31
Page 38

9934 LogWare
User’s Guide
3.6.1 Readings
3.6.2 Graph
Use this option to print readings and graphs.
The Print menu option has a submenu which consists of two options – Read
ings and Graph.
When printing the readings or graph, the information is sent to the current
printer. To change the current printer, use the Print Setup menu option.
The Print | Readings menu option is used to print the data located in the current
output file, which consists of the date and time each reading was taken, the
reading and scale, and some alarm information. This file also contains some in
formation about the thermometer and probe that were used to collect the data
and the alarm settings (if applicable).
When logging real-time data, selecting the Print | Readings menu option prints
all of the readings that have been taken up until the time this option is selected.
When viewing previously logged data, all readings are printed.
The Print | Graph menu option is used to print the current graph. This menu option performs the same task as selecting the Print Graph menu option from the
Graph menu.
-
-
32
3.7 Exit
Select the Exit menu option from the File menu to close the software.
If any changes have been made to the configuration, the user is prompted to
save the settings.
Page 39

4 Datalog menu
The Datalog menu (Figure 17) provides options for setting up a real-time log
session, starting, stopping and closing a real-time log session and muting all
alarm events.
Figure 17 Datalog menu
4.1 Setup log session
4 Datalog menu
Setup log session
The Setup menu option displays the Setup Log Session (Figure 18) dialog. This
dialog allows a real-time log session to be configured.
Figure 18 Log Session settings
33
Page 40

9934 LogWare
User’s Guide
4.1.1 Thermometer settings
4.1.2 Communication settings
To start a real-time log session, the software must know what thermometer it is
logging data from. Select the thermometer’s model number from the Model
drop down list.
Enter the serial number of the thermometer in the Serial Number box. The se
rial number and the model number are both written to the header of the output
file to indicate the instrument that was used to log the data.
Select the scale for the readings for this log session using the Readings Scale
drop down list. The Readings Scale drop down list only displays the scales that
are supported by the selected thermometer. To use the scale that the thermome
ter is currently set to, select the <Keep Existing> option.
-
Select the COM port to which the thermometer is connected. This software ex
pects to communicate with the thermometer via an RS-232 serial connection.
Most laptop and desktop computers have at least one 9-pin or 25-pin COM
port. Refer to your computer’s owner’s manual if you are unable to locate or
identify a COM port on your computer.
Note: All Hart Scientific instruments require a “null modem” cable to in-
terface with a computer. Please refer to the thermometer’s User Guide for
more information on this type of cable.
Each COM port is accompanied by a symbol that reflects the current state of
the COM port as follows:
- COM ports with this symbol are available on this computer
and can be selected.
- COM ports with this symbol are virtual COM ports used to
interface with an I/R port. This software does not support using COM
ports with this associated symbol.
- The COM port with this symbol is currently being used by
this software.
-
34
- COM ports with this symbol are in use by another application
and cannot be used by this software at this time.
Select the baud rate that should be used to communicate with the thermometer.
The available choices are determined by the baud rates supported by the se
-
lected thermometer.
Page 41

Note: The thermometer and this software must both be set to the same
baud rate in order to communicate successfully. Please refer to the ther
mometer’s User Guide for more information on setting the baud rate of
the thermometer.
Once the thermometer and communication settings have been selected, click
the Test Communication button to attempt to establish communication with the
thermometer and verify that the proper thermometer model is selected. If the
software succeeds in communicating, a success message is displayed.
If the software is not able to successfully establish communication with the
thermometer or if the software determines that the selected model does not
match the model of the connected thermometer, a failure message is displayed
indicating the reason for the failure. In case of failure, check to make sure that:
The communication cable is connected to the thermometer and the se
•
lected COM port
• The thermometer is powered up and operating
• The correct type of cable (null modem) is being used
• The thermometer is set to operate at the selected baud rate
4.1.3 Log settings
4 Datalog menu
Setup log session
-
-
LogWare supports logging real-time data at intervals from 1 second to 24
hours. Select the desired interval using the Interval – Once every box.
Note: The maximum sample rate for Hart Scientific thermometer readouts
is one reading per second. Although every attempt is made, selecting a one
second sample interval in this software does not guarantee that one read
ing will be taken every second (because of processing overhead and calcu
-
lations that this software must perform between each reading). Typical
tests have shown that, on average, this software can acquire about 9 read
ings every 10 seconds on a Pentium® class computer. Slower computers
may not be able to log data at this rate.
If the real-time log session should automatically stop after a certain number of
readings or after a specific amount of time, select the appropriate options from
the End Log drop down list and specify the number of readings or time in the
After boxes. If the real-time log session should continue until it is explicitly
stopped, select the By User option in the End Log drop down list.
LogWare is capable of starting a real-time log session at a future date and/or
time for unattended operation. The box to the right of the Delayed Start and
Reset buttons indicate when the log is scheduled to start.
To start the real-time log session at a future date and/or time, click the Delayed
Start button. The Delayed Start Date/Time dialog is displayed. The delayed
35
Page 42

9934 LogWare
User’s Guide
4.1.4 Channel settings
start date and time will be displayed in the box to the right of the Delayed Start
and Reset buttons.
Note: Every effort has been made to make the real-time log session take
its first reading at the selected date and time. However, due to the large
variation in the speed at which different computers operate, the first read
ing may be one or more seconds later than the selected time (commonly
known as “latency”). To compensate for this, try a few tests to determine
the approximate latency in the computer being used and then adjust the
start time accordingly by reducing the start time by the difference between
the selected start time and the actual time of the first reading.
To start a real-time log session immediatelywhentheStartbuttonisclickedon
this dialog, click the Reset button. This will ignore any delayed start date/time
and the log session will start when the Start button is clicked. The box to the
right of the Delayed Start and Reset buttons indicates that the log session will
start immediately.
The Channels list displays an item for every channel on the selected thermometer. Currently, LogWa re only supports thermometers with a single channel. To
specify settings for a channel, click on the appropriate item in the Channels list.
Select the color to use for the trace on the graph using the Trace Color drop
down list.
Enter the name of the output file that the logged data for the selected channel
should be saved to in the Filename box. Choose a descriptive filename that
identifies the data contained in the file. LogWar e automatically appends a .TXT
extension on the end of the filename. The name of the output file is also used as
the channel “label”. The channel label is a descriptive identifier assigned to a
channel to give meaning to the readings being logged on that channel, instead
of using only the channel number. By default, the filename is set to Channel
N.txt (where N is the channel number).
Output files are written to the folder specified on the File | Defaults Folders tab.
To change the folder where the output file will be saved for this log session,
click the “…” (Browse) button on the right side of the Filename box. The Win
dows® Save As dialog is displayed. Navigate to the desired folder and click the
OK button.
Check the Overwrite existing file check box if this output file should overwrite
any existing file with the same name in the selected folder. If this box is not
checked, this software will display a prompt if a file with the same name exists
and allow the filename for this output file to be changed. It is recommended
that this check box NOT be checked to prevent accidentally overwriting output
files.
-
36
Page 43

LogWare supports configuring low and high alarms for each channel. Alarms
can be used to indicate readings that are out of a specified tolerance or to trig
ger an event. To configure alarms for the selected channel, click the Alarm Set
tings button. The Alarm Settings dialog is displayed (see Section 4.6).
To display the statistics for the selected channel, check the Show statistics
check box. Statistical data is maintained for each channel regardless of whether
it is being displayed or not. During a real-time log session, each statistical da
tum can be enabled or disabled independent from the others. See Section 4.8,
Real-time Log Session for more details.
4.1.5 Open and save as
4 Datalog menu
Setup log session
-
-
-
Click the Open button to display the Windows® Open dialog to open a previ
ously saved configuration file which contains test settings information. Click
the Save As button to display the Windows® Save As dialog to save the current
settings you have selected to a configuration file.
Note: For more information on configuration files, see Section 11 Config-
uration Files.
4.1.6 Set as default
The current configuration can be set as the default configuration by clicking the
Set as Default button. The default configuration is loaded automatically on
start-up. The configuration must be saved to a file in order to be set as the default configuration. If the current settings have not been saved, the Windows®
Save As dialog appears. Enter a descriptive filename and click OK to save the
file. This configuration file will then be set to the default. For more default configuration file settings, see Section 3.4.1 General tab.
When all information has been entered, click the Start button to initiate the
real-time log session. If no delayed start date and time were specified, the
real-time log session starts immediately. If a start date and time were set using
the Delayed Start button, the following dialog appears:
-
Figure 19 Log Session Start Time
The log session will begin automatically on the date and time indicated. Click
the Cancel button to abort starting the log session.
37
Page 44

9934 LogWare
User’s Guide
Click the Close button to close the Log Session Settings dialog without starting
a log session to access other features of the software. All settings are remem
bered and the log session can be started at any time by selecting the Start op
tion in the Datalog menu.
Click the Help button to display the appropriate help topic for this dialog.
-
-
4.2
4.3
Start log session
The real-time log session starts immediately when the Start menu option is se
lected if a delayed start date and time were not specified.
If a delayed start date and time were specified, LogWare performs some initial
tasks to prepare to start the log session, then displays the Log Session Start
Time dialog (Figure 19).
The log session will begin automatically on the date and time indicated. Click
the Cancel button to abort starting the log session.
Note: Every effort has been made to make the real-time log session take
its first reading at the selected date and time. However, due to the large
variation in the speed at which different computers operate, the first reading may be one or more seconds later than the selected time (commonly
known as “latency”). To compensate for this, try a few tests to determine
the approximate latency in the computer being used and then adjust the
start time accordingly by reducing the start time by the difference between
the selected start time and the actual time of the first reading.
-
Stop log session
The Stop option in the Datalog menu can be used to stop a real-time log session
at any time, regardless of whether or not the session was configured to stop au
tomatically at a specified time or number of readings.
When the log session is stopped, a message is displayed asking if the
Real-Time Log Session window should be closed or not. Clicking Yes closes
the window so that a new log session can start. Clicking No leaves the current
log session window open.
While the window is still open, the graph, readings history and alarm log files
can be viewed and printed (see View menu and File menu). Also, the graph can
be customized by selecting the Graph Settings option from the Graph menu.
Also, up to 8 previously logged data files can be opened while the real-time log
session window is still open (see Section 6.3 Open Previously Logged Data
File).
-
38
Page 45

4 Datalog menu
Close log session
4.4
4.5
Close log session
Use the Close option in the Datalog menu to close the current Real-Time Log
Session window
Select the Stop option from the Datalog menu to stop the log session before it
can be closed
Only one real-time log session can be open and active at a time
After a real-time log session has been stopped by selecting the Stop option
from the Datalog menu, the log session can be closed. The current real-time log
session MUST be closed before a new real-time log session can start.
To close the current Real-Time Log Session window, select Close from the
Datalog menu.
Mute all alarms
The Mute All Alarms option in the Datalog menu allows the user to prevent
alarm events from occurring while logging real-time data. Alarms can be muted
by selecting Mute All Alarms from the Datalog menu or by selecting the Mute
button on the toolbar. When the alarms are muted, a red X appears through the
alarms icon and the menu option displays a check mark. Otherwise, the alarms
icon appears without the X and no check mark appears next to the menu option.
Muting alarms does not prevent entries from being written to the alarm log file.
It also does not prevent alarm state information from being displayed in the
Channels box on the Real-Time Log Session window while logging real-time
data.
4.6 Alarm settings
The Alarm Settings dialog (Figure 20) is used to configure low and/or high
39
Page 46

9934 LogWare
User’s Guide
alarms for the selected channel. The current Low Alarm or High Alarm settings
can be changed by selecting the appropriate tab.
40
Figure 20 Alarm Settings dialog
When logging real-time data, an alarm log is maintained. Every time a reading
trips either the low alarm or high alarm, an entry is written to the alarm log in
dicating the channel, date, time and reading value that tripped the alarm. An en
try is also written to the alarm log every time an alarm is reset.
Low alarm
The Low Alarm setting allows the user to specify what event should occur if
the readings on the currently selected channel ever drop below the value en
tered in the Value box on the Low Alarm tab. To configure the low alarm, select
the Low Alarm tab and select the appropriate options for this alarm.
High alarm
The High Alarm setting allows the user to specify what event should occur if
the readings on the currently selected channel ever rise above the value entered
-
Page 47

4 Datalog menu
Alarm settings
in the Value box on the High Alarm tab. To configure the high alarm, select the
High Alarm tab and select the appropriate options for this alarm.
Enable alarms for this channel
To enable an alarm, check the ‘Enable alarms for this channel’ check box on
the appropriate tab. The low and high alarms can be enabled/disabled independ
ently of each other. When this check box is unchecked, all other controls on
this dialog are disabled.
Value
Enter the reading value that is needed to trip the alarm. The value is required if
an alarm is set. The readings scale of the value is displayed if the Readings
Scale on the Log Session Settings dialog is not set to ‘<Keep Existing>’. Other
wise, this value will be in the current scale of the thermometer when the
real-time log session begins.
Select the event for this alarm
Select the event that should occur when the alarm trips. The choices are:
• No event
• System Beep
• Display message and stop graphing/acquisition
• Play .WAV file
• Launch .EXE file
If either the Play .WAV file or Launch .EXE file is selected, the Path and Filename box and Browse button are enabled and the user must enter or select a
filename. Select the Browse button to find and select a file. The Test button is
enabled once the Path and Filename box is filled in. Select the Test button to
make sure the software can play or launch the file you have selected.
-
-
Note: The file entered in the Path and Filename box MUST exist! When
the OK button is clicked, this software searches for the file. If it is not
found, a warning message is displayed and the software will not continue.
Be careful when selecting a file that resides on a network resource. The re
source must be available when acquiring data to ensure the event occurs
properly.
The Launch .EXE file option can be used to launch any application on the com
puter such as Pager software which could be configured to dial a phone number
automatically and transmit a fixed message to a pager indicating that an alarm
has tripped.
41
-
Page 48

9934 LogWare
User’s Guide
Note: It is not recommended that the Launch .EXE file option (especially
in conjunction with the After every update option) be used until the user is
familiar with how this feature works. Unless the .EXE file terminates itself
automatically or limited to a single instance, this software will continue to
launch new instances of the .EXE file, possibly causing the computer to
run out of resources and even crash.
When should this event occur?
Select when the specified event should occur. The choices are:
Only once when the alarm value is exceeded
•
After every update
•
If the Only once when the alarm value is exceeded option is selected, the cho
sen event will occur on the first reading that trips the alarm. Subsequent read
-
ings that also exceed the alarm value will not cause the event to occur again
until one or more readings are taken that are back within the alarm value (alarm
reset).
If the After every update option is selected, every reading that is taken that exceeds the alarm value causes the event to happen again.
Open and save as
Select the Open button to display the Windows® Open dialog to open a previously saved configuration file which contains alarm information. Select the
Save As button to display the Windows® Save As dialog to save the settings
you have selected to a configuration file.
42
Note: For more information on configuration files, see Section 11 Config
uration Files.
Select the OK button to accept the current settings and close this dialog.
Select the Cancel button to discard any changes you have made.
Select the Help button to display the appropriate help topic for this dialog.
4.7 Delayed start date/time
The Delayed Start Date/Time dialog (Figure 21) allows the delayed start date
and time for the real-time log session to be selected. When this dialog is dis
-
-
Page 49

4 Datalog menu
Delayed start date/time
played, the delayed start date/time is set to the current date and time according
to the computer’s clock.
Figure 21 Delayed Start Date/Time dialog
Start log session on this date
Select the date that the real-time log session should start using the calendar. To
change months, click the left and right arrow buttons on the far left and right
sides. To change the year, click on the displayed year at the top of the calendar
and the up/down buttons will appear immediately to the right of the year. Use
the up and down buttons to change the year. To select the day, simply click on
the appropriate number on the calendar. The selected date is displayed above
the calendar.
At this time
Select the hours, minutes, and seconds that the real-time log session should
start using the At this time box. Click on the hours, minutes or seconds portion
in the box and either type or use the up/down buttons on the right side of the
box to change the value.
Current date and time
The Current Date and Time box displays the current date and time according to
the computer’s clock. If these settings are incorrect, adjust your computer’s
clock using the Windows® Control Panel.
After you have selected the appropriate date and time, select the OK button. If
the date and time you have selected have already passed, a prompt is displayed
and a future date and time must be selected.
43
Page 50

9934 LogWare
User’s Guide
Note: Every effort has been made to make the real-time log session take
its first reading at the selected date and time. However, due to the large
variation in the speed at which different computers operate, the first read
ing may be one or more seconds later than the selected time (commonly
known as “latency”). To compensate for this, try a few tests to determine
the approximate latency in the computer being used and then adjust the
start time accordingly by reducing the start time by the difference between
the selected start time and the actual time of the first reading.
Click the Cancel button to discard any changes and close this dialog.
Click the Help button to display the appropriate help topic for this dialog.
-
4.8
Real-time log session
The Real-Time Log Session window (Figure 22) is displayed when a real-time
log session starts by selecting the Start option from the Datalog menu or by
clicking the Start button on the Log Session Settings dialog.
44
Figure 22 Real-Time Log Session window
LogWare was designed to communicate with only one thermometer at a time.
Therefore, only one real-time log session can be running at a time.
Page 51

4 Datalog menu
Real-time log session
In order to optimize the logging of readings, many menu options are disabled
during a real-time log session. Of course, once a real-time log session is run
ning, none of the settings can be changed, including the readings scale, alarm
settings and events, and communication settings. Also, the Download menu op
tions and Tools menu options are disabled, as well as the Open Previously
Logged Data File option in the View menu.
If LogWare was configured to automatically stop logging data after a specific
number of readings of after a specified amount of time, data will continue to be
logged at the specified log interval until that condition is met. The Statistics
box in the upper right corner of the Real-Time Log Session window displays
the number of readings taken thus far and the elapsed time since logging
started.
The real-time log session can be stopped manually at any time regardless of
whether or not the log was configured to stop automatically by selecting the
Stop option from the Datalog menu or by clicking the Stop icon on the toolbar.
Once the real-time log session has been stopped, the output file which contains
all of the logged readings can be opened by selecting the Open Previously
Logged Data File option from the View menu.
Note: Be aware that selecting any menu option while a real-time log ses-
sion is running may cause the measurement process to halt temporarily
until the menu is closed or the dialog that is displayed is closed! Also,
running other applications on the computer while logging real-time data,
especially those that require a lot of processing time or that access the
disk frequently, may cause the measurement process to halt temporarily
while the other application is busy. It is recommended that, once a
real-time log session is started, the software and the computer be left
alone to log the data without interruption.
-
Note: The maximum sample rate for Hart Scientific thermometer readouts
is one reading per second. Although every attempt is made, selecting a one
second sample interval in this software does not guarantee that one read
ing will be taken every second (because of processing overhead and calcu
-
lations that this software must perform between each reading). Typical
tests have shown that, on average, this software can acquire about 9 read
ings every 10 seconds on a Pentium® class computer. Slower computers
may not be able to log data at this rate.
The readings that have been logged can be viewed by selecting the Readings
History option from the View menu or by right-clicking the Channels grid and
selecting the View Readings History option from the popup menu.
The logged readings can be printed by selecting the Print | Readings option
from the File menu. However, only the readings that have been logged so far
will be printed.
45
Page 52

9934 LogWare
User’s Guide
Alarms
The current alarm state is determined by comparing the most recent reading to
the alarm settings. If the Low Alarm and/or High Alarm have been configured,
the reading is compared to the low alarm and high alarm values. If the reading
is less than the low alarm value and the low alarm is enabled, the Alarm box in
the Channel information grid flashes Low to indicate the low alarm has “trip
ped”. If the reading is greater than the high alarm value and the high alarm is
enabled, the Alarm box in the Channel information grid flashes High to indi
cate the high alarm has “tripped”. If the reading falls between the low and high
alarm values or if the alarms are not enabled, the Alarms box remains blank
(alarm reset).
Every time an alarm is tripped, a single entry is written to the alarm log file.
This file is named “alarm.log” and is located in the default output folder or the
folder that the output file is saved in.
The alarm log file can be viewed by selecting the Alarm Log from the View
menu or by right-clicking on the Channels grid and selecting the View Alarm
Log option from the popup menu.
Statistics
The Statistics section on the Real-Time Log Session window displays statistical
information for the readings that have been logged. Each of the statistics can be
enabled or disabled by simply checking or unchecking the appropriate check
box. When a statistic is disabled, the box is left blank.
Clicking the Clear button resets all statistics, including the Count and Elapsed
Time, and begins calculating the statistical data again from the next reading.
46
Readings Graph
As readings are logged, a trace is drawn on the graph to give a visual represen
tation of the readings.
The Y-axis of the graph is always in the reading scale (units) selected on the
Log Session Settings dialog. The Y-axis is automatically scaled to keep the en
tire visible portion of the trace within the graph bounds.
The X-axis of the graph displays elapsed time since the log session started. As
the trace reaches the right side of the graph, the trace shifts to the left and the
left-most part of the trace is pushed off the graph. The graph is set to display
600 readings at a time. This setting is fixed and cannot be changed. Therefore,
the graph displays anywhere from 10 minutes (at a 1 second sample interval)
up to 600 days (at a 24 hour sample interval) of readings.
Note: The elapsed time shown on the graph is only an approximate time!
Anytime a menu option is selected or a dialog is displayed, data logging
may be temporarily halted until the menu or dialog is closed. This causes
the elapsed time to become inaccurate. The true elapsed time is displayed
in the Statistics in the upper right corner of the window.
-
-
Page 53

4 Datalog menu
Real-time log session
There are many customizable settings for the graph such as titles, a legend, col
ors, grid lines and trend lines. All of these features can be accessed by selecting
the Graph Settings menu option in the Graph menu or by right-clicking on the
graph and selecting the Graph Settings option from the popup menu. The de
fault graph settings can be restored by selecting the Restore Default Settings
option from the Graph menu.
The trace color for the readings can be changed by selecting the Trace Color
option from the Graph menu or by right-clicking on the Channels grid or graph
and selecting the Trace Color option from the popup menu.
Note: If the trace does not appear on the graph, make sure the trace and
background colors of the graph are not set to the same color.
The graph may be printed at any time by selecting the Print | Graph option from
the File menu or by selecting the Print Graph option in the Graph menu.
-
47
Page 54

5 Download menu
The Download menu (Figure 23) provides options for downloading logged
readings from a thermometer and checking the log status.
Figure 23 Download menu
5.1 Download logged data
The Download Logged Data menu option allows readings that are stored in the
memory of the thermometer to be downloaded and written to a file. When this
menu option is selected, the Select Model dialog is displayed (see Section 8.5).
Select the thermometer model and communication settings to use and click the
OK button.
5 Download menu
Download logged data
Note: Currently, only the Model 1522 LLL Handheld Datalogger supports
this feature.
49
Page 55

9934 LogWare
User’s Guide
After the thermometer is selected, the 1522 Download dialog (Figure 24) is dis
played.
Figure 24 1522 Download dialog
-
50
The 1522 Download dialog allows the user to select the settings for downloading Autolog or Demand log data.
Select log
Select the type of logged data to download. Refer to the thermometer’s User
Guide for an explanation on the differences between the autolog and demand
log data.
Download options
Select the download mode to use when downloading the data. When using the
I/R dongle, the data can be downloaded in either binary mode or ASCII mode.
When using the RS-232 serial cable, the Binary mode option is disabled.
Obviously, it would be preferable to download the logged data as fast as possi
ble. However, the user must be aware that there are some trade-offs when using
the Binary mode instead of ASCII mode to download the data. Please read the
following to understand these trade-offs:
-
Page 56

ASCII Downloading Binary Downloading
Speed Disadvantage: Downloading data in ASCII mode is in
herently much slower than Binary mode because more
information (bytes) must be sent for each reading.
Typically, ASCII mode requires that 40 bytes be sent
(which includes the date, time, value, scale and label)
for each reading. Therefore, to download 10,000 read
ings in ASCII mode requires the thermometer to send
400,000 bytes (approximately 390KB) of information to
the software.
5 Download menu
Download logged data
Advantage: Downloading data in Binary mode is much
faster than ASCII mode because the information can
be compacted into fewer bytes for each reading.
Typically, Binary mode requires that only 10 bytes be
sent (which also includes the date, time, value, scale
and label) for each reading, plus a few bytes for over
head information. Therefore, to download 10,000 read
ings in Binary mode requires the thermometer to send
approximately 100,000 bytes (approximately 98KB) of
information to the software, which is only 25% as
much information than in ASCII mode making the sig
nificantly faster! (see table below)
-
-
-
Transmission Error
Detection
Rounding and
Truncation Errors
Disadvantage: In ASCII mode, the software has diffi
culty knowing whether or not all readings have been
received. The software attempts to determine if any
readings are missing by comparing the total readings
received to the number of readings the thermometer
says were sent. If there is a difference, an error mes
sage is displayed alerting the user to download the
data again. This technique does not catch all types of
errors, however.
Advantage: In ASCII mode, the thermometer sends
the actual digits of each reading including the date,
time, value, scale and label number. No translation is
required. The readings are simply written to the download file as received.
Advantage: In Binary mode, the 1522 first sends out a
header packet which is basically some information
about how many readings are to be sent. Then the
readings themselves are sent. Following the readings,
another packet of information is sent which contains a
checksum. This checksum is compared to a checksum
which is calculated by the software to determine if all
readings were received properly, without error. If an
error is detected, an error message is displayed alerting the user to download the data again. This is a very
good error checking technique which eliminates nearly
all transmission related errors.
Disadvantage: In Binary mode, the thermometer sends
a binary representation of each reading including the
date, time, value, scale and label number to the software. The software must then translate each reading
into the actual date, time, value, scale and label number before writing it to the download file. This technique tends to introduce minor errors because of
rounding and truncation errors in floating point num
bers. Typically, these errors are on the order of 1mK
which is well out of the specification of the 1522 LLL
Handheld Datalogger. These errors do not occur on
the date, time, scale and label number, only the value
of the reading.
For complete information on the extent of the error in
troduced by these discrepancies, please see Section
5.4 Binary Download Discrepancies.
The following table gives some approximate download times for ASCII and bi
nary modes using the serial and I/R ports:
-
-
-
Download Mode and Interface Approx. Download Time for
10,000 Readings
I/R – Binary mode 90 seconds
I/R – ASCII mode 22 minutes
RS-232 – Binary mode Not Applicable
RS-232 – ASCII mode 22 minutes
51
Page 57

9934 LogWare
User’s Guide
File options
The File Options allow the user to determine how to write the downloaded data
to download files.
Write all readings to a single file – All downloaded readings can be written to
the same file by selecting this option. Selecting this option creates one down
load file with the name OUTPUT.TXT and saves the file in the folder specified
below. All downloaded readings, regardless of the assigned label, are written to
this one file. It is highly recommended that this option be selected when down
-
loading Demand Log data.
Write readings to separate files – Downloaded readings can be written to
multiple files by selecting this option. As readings are downloaded, one file is
created for each unique label that has been assigned to a reading. All readings
that were assigned a given label are written to the same file regardless of
whether the readings are contiguous (all together) or spread throughout the log.
The filenames of the download files in this case consist of the label followed by
a .TXT extension. All files are saved in the folder specified below.
Note: Be careful using this option if no label was assigned to some or all
readings. If no label is assigned to a reading, the reading is given a numerical label indicating the reading number. When writing readings to
separate files based on the label, one file will be created for each reading!
If 100 readings were downloaded, the software may attempt to create 100
separate files with one reading in each file!
52
The other file options allow the user to decide how to handle overwriting existing files in the selected folder.
Prompt to enter all filenames – Checking this option causes the Windows®
Save As dialog to appear before each download file is created to allow the user
to either change the filename or folder to which the file will be written. When
writing readings to separate files, checking this option could become very
time-consuming if many files need to be created. If this option is checked, the
Prompt before overwriting existing files option is disabled.
Prompt before overwriting existing files – This option is only enabled if the
Prompt to enter all filenames option is not selected. Checking this option
causes the Windows® Save As dialog to appear ONLY when the software at
tempts to create a download file that has the same name as an existing file in
the selected folder. The user can either select a different folder or change the
name of the file to avoid overwriting the existing file. Leaving this option un
checked will automatically overwrite any existing files that have the same name
as the download files. It is recommended that this option always be checked.
The Write files to box allows the user to select or enter the folder to which the
download files should be written. This folder defaults to the download folder
that is selected on the File | Defaults Folders tab. If the folder to which the
download files should be written already exists, use the ‘…’ (Browse) button to
Page 58

select the folder. If the folder does not exist, enter the folder name directly into
the box provided. This folder will be created automatically.
Click the Download button to begin the download process.
Click the Close button to close the Download dialog after downloading is
complete.
Click the Help button to display the appropriate help topic for this dialog.
5.2 Log status
The Log Status menu option displays the status of the thermometer log(s).
When this menu option is selected, the Select Model dialog is displayed (see
Section 8.5). Select the thermometer model and communication settings to use
and click the OK button.
Note: Currently, only the Model 1522 LLL Handheld Datalogger supports
this feature.
After the thermometer is selected, the 1522 Log Status dialog (Figure 25) is
displayed.
5 Download menu
Log status
Figure 25 1522 Log Status dialog
The 1522 Log Status dialog displays information about the logs in the 1522
LLL Handheld Datalogger. The 1522 LLL Handheld Datalogger contains two
logs: Demand log and Autolog. For more information on these logs, refer to the
1522 LLL Handheld Datalogger User Guide.
53
Page 59

9934 LogWare
User’s Guide
Demand log status
The Demand Log Status section indicates the current status of the demand log.
The demand log is capable of storing up to 100 readings which consist of the
value, units, date, time, and a label. The progress bar indicates how many read
ings are already stored in the demand log.
These readings can be downloaded by selecting the Download Logged Data op
tion from the Download menu (see Section 5.1).
The labels that can be assigned to each reading in the demand log can be
viewed and changed by selecting the Write Labels option from the Tools menu.
To clear the demand log, click the Clear Log button. All readings stored in the
demand log will be lost.
Autolog status
The Autolog Status section indicates the current status of the autolog. The
autolog is capable of storing up to 10,000 readings which consist of the value,
units, date, time, and a label. The progress bar indicates how many readings are
already stored in the autolog.
These readings can be downloaded by selecting the Download Logged Data option from the Download menu.
The labels that can be assigned to each reading in the autolog can be viewed
and changed by selecting the Write Labels option from the Tools menu.
To clear the autolog, click the Clear Log button. All readings stored in the
autolog will be lost.
-
-
54
Refresh
Click the Refresh button to update the log status indicators.
Click the Close button to close this dialog.
Click the Help button to display the help topic for this dialog.
5.3 Download Process
The download process consists of the following steps:
•
Check communication – Before any downloading begins, the software
checks to make sure it can communicate with the thermometer. If commu
nication succeeds, the download process continues. Otherwise, an error
message is displayed and the download process is aborted.
•
Read data labels – The current data labels are read in from the thermom
eter. When downloading readings, the data label number is downloaded as
opposed to the label itself to improve the total download time. As read
ings are parsed, the label number is replace with the appropriate label.
•
Download readings – Next, the software begins to download the actual
readings including the date, time, value, scale and label index. Depending
-
-
-
Page 60

5 Download menu
Download Process
on how many readings are being downloaded and the selected download
options, this process could take anywhere from 2 seconds to over 20 min
utes.
Note: For binary downloads, please read Section 5.4 Binary Download
Discrepancies.
Parse readings – After all readings have been downloaded, the software
•
parses the data. This process includes translating binary data into ASCII
text (if the readings were downloaded in Binary mode) and breaking up
the date, time, value, scale and label into separate entities in preparation to
write the readings to the download file(s). This process also includes re
placing the label number associated with each reading with the actual la
bel text.
Write readings to file(s) – The last step of this process is writing the
•
readings to the download file(s) based on the selected file options.
If an error was detected during the download process, an error message will be
displayed and the download process will be aborted. The user may also abort
the download process by clicking the Cancel button on the progress indicator
that is displayed during the various operations.
-
-
Note: Anytime the download process is aborted, it is recommended that
the thermometer be powered off then back on again. This is the only way
to force the thermometer to abort the download process.
If the download process completes successfully, the Downloaded Files dialog
(Figure 26) is displayed.
Figure 26 Downloaded Files dialog
55
Page 61

9934 LogWare
User’s Guide
5.4 Binary download discrepancies
This dialog shows a list of all files that were created by the download process
including the location of each file. Any of the files listed can be opened in the
Windows® default text editor by double-clicking on the appropriate entry in
the list.
Click the OK button to close this dialog.
The Model 1522 LLL Handheld Datalogger has built-in RS-232 and I/R ports.
LogWare supports both interfaces for downloading logged readings from the
memory of the 1522. Using the RS-232 serial interface, the readings can only
be downloaded in ASCII mode (all readings are downloaded as text). However,
when using the I/R interface, the readings can be downloaded in either ASCII
mode (text) or in binary mode. Binary mode has many advantages over ASCII
mode, but also has some disadvantages.
Binary mode advantages
The major advantage of using binary mode to download readings is speed,
which translates into time. The 1522 is capable of logging up to 10,000 readings in its autolog. Downloading these readings (which consist of the date,
time, value, units and label index) in ASCII mode can take up to 20 minutes or
more at the fixed baud rate of 2400 baud. Binary mode both reduces the number of bytes that need to be sent per reading and uses a higher baud rate
(115,200 baud) to significantly reduce the download time. See the table below
for details:
56
Download Mode and Interface Approx. Download Time for
I/R – Binary mode 90 seconds
I/R – ASCII mode 22 minutes
RS-232 – Binary mode Not Applicable
RS-232 – ASCII mode 22 minutes
10,000 Readings
Also, binary mode adds some error detection to ensure that readings are prop
erly transmitted.
Binary mode disadvantages
The major disadvantage of using binary mode is that it introduces small dis
crepancies into the readings due to rounding and truncation errors. The read
-
ings that are transmitted to the PC in binary format are “encoded” and must be
“decoded” once they are received. This decoding sometimes introduces small
errors into the readings. Typically, these errors are on the order of 1mK which
is well within the specification of the 1522 LLL Handheld Datalogger. These
errors do not occur on the date, time, units or label index, only the value of the
reading. The following table indicates maximum observed errors at various
resistances and conversion settings:
-
Page 62

Binary download discrepancies
5 Download menu
Reference Resistor
(Ohms)
23.2 PRT ±0.0001 ±0.025 0.4
100 PRT ±0.00005 ±0.025 0.2
249 PRT ±0.001 ±0.05 2.0
1.0K Thermistor ±0.00005 ±0.01 0.5
10.0K Thermistor ±0.00005 ±0.005 1.0
1522 Conversion
Setting
Maximum Observed
Error (Kelvin)
1522 Uncertainty
Specification (Kelvin)
Because the maximum observed error is at most 2.0% of the uncertainty of the
instrument, the error introduced by rounding and truncation is considered
insignificant.
Error Percentage of
Uncertainty (%)
57
Page 63

6 View menu
The View menu (Figure 27) provides options for customizing LogWa re’s main
window, viewing information about a real-time log session and opening previ
ously logged data files.
Figure 27 View menu
6 View menu
-
The toolbar and status bar can be displayed by checking the Toolbar and Status
Bar menu options respectively. To hide the toolbar or status bar, uncheck the
appropriate menu option.
During a real-time log session, the Alarm Log and Readings History options
are enabled. Selecting the Alarm Log menu option displays the alarm log file
for the current real-time log session. Selecting the Readings History menu op
tion displays all of the readings in the output file for the current real-time log
session.
Selecting the Open Previously Logged Data File menu option displays the Win
dows® Open dialog and allows output files or download files to be opened.
When the file is opened, the readings, statistics and graph of the readings are
displayed in a Log File window.
The filename list at the bottom of the View menu lists up to 8 of the most re
cently opened files. To open one of these files, simply click on the appropriate
filename in the list. The file is opened and displayed in a Log File window.
-
-
-
59
Page 64

9934 LogWare
User’s Guide
6.1 Alarm log
The Alarms.log dialog (Figure 28) displays the alarms that have occurred since
the data acquisition session started.
Figure 28 Alarms.log Dialog
60
Grid
The alarm log grid displays the date, time, label, alarm type, and the value of
the reading for every time an alarm tripped (reading exceeded alarm setting) or
reset (reading returned to within alarm setting).
Refresh
This dialog only displays the entries that have been written to the alarm log file
at the time the window was displayed. If more entries have been written to the
alarm log file, click the Refresh button to read in the alarm log file again.
Print
To print the alarm log file to the default printer, click the Print button. To select
the default printer, select the Print Setup menu option from the File menu.
Alarms
To view the current alarm settings, click the Alarms button to display the
Alarms dialog.
Click the Close button to close this dialog.
Page 65

6.1.1 Alarms
The Alarms dialog (Figure 29) shows the current settings for the low and high
alarms. The alarms must be set before starting a real-time log session by click
ing the Alarm Settings button on the Log Session Settings dialog. Once a
real-time log session starts, the alarm settings cannot be changed.
Figure 29 Alarms dialog
Low alarm
The Low Alarm box is read-only and indicates the current low alarm setting.
6 View menu
Alarm log
-
High alarm
The High Alarm box is read-only and indicates the current high alarm setting.
Click the Close button to close this dialog.
61
Page 66

9934 LogWare
User’s Guide
6.2 Readings history
Use the Readings History menu option to view the data that has been logged
during the current real-time log session (Figure 30).
Figure 30 Output file dialog
Grid
The grid displays all of the readings from the output file for the selected channel. When this dialog is displayed, the grid is positioned at the very bottom to
display the most recent readings. Use the scroll bar to scroll through the
readings.
Refresh
The real-time log session continues even when this dialog is displayed. This di
alog only shows the entries that have been written to the output file at the time
the dialog was displayed. If more entries have been written to the output file,
click the Refresh button to read in the output file again. Statistical data is recal
culated to include any new readings.
Print
To print the output file to the default printer, click the Print button. To select the
default printer, select the Print Setup menu option from the File menu.
Statistics
When the output file is read in, statistical information is calculated. Click the
Statistics button to view the Statistics dialog.
-
-
62
Page 67

Click the Close button to close this dialog.
6.2.1 Statistics
The Statistics dialog (Figure 31) displays the statistics for the readings in the
output file for the selected channel at the time the output file was read in.
Figure 31 Statistics dialog
Open previously logged datafile
6 View menu
6.3
Click the Close button to close this dialog.
Open previously logged datafile
Selecting the Open Previously Logged Data File menu option displays the Win
dows® Open dialog box. Select the output file or download file to open. Then
click the Open button to open the file. The Log File window (Figure 32) is dis
played with the readings, statistical information and a graph.
Note: The graph is only capable of displaying up to 32,767 readings at a
time. If the selected file contains more readings, a message is displayed
alerting the user and only the first 32,767 readings are read in.
Note: The Open Previously Logged Data File menu option is intended to
open ONLY output files and download files that were created by this soft
ware (see Section 11)! Attempting to open a file that was not created by
this software will most likely fail and may cause unpredictable results.
Up to 8 previously logged data files can be opened at once. Each file is opened
-
-
-
63
Page 68

9934 LogWare
User’s Guide
in its own window. Use the Window menu to see a list of the open windows or
to arrange the windows.
64
Figure 32 Log File dialog
Readings
The Readings section displays each reading including the date and time, read
ing value and alarm information in a grid. Use the scroll bar to scroll through
all of the readings.
Note: If a download file was opened, the alarms column does not appear
in the readings grid.
Statistics
The Statistics section displays statistics for all of the readings in the file that
was opened. The Elapsed Time box displays the time difference between the
first reading and the last reading in the file.
Readings graph
After the selected file has been read in, a trace is drawn on the graph to give a
visual representation of the readings.
-
Page 69

Open previously logged datafile
6 View menu
The Y-axis of the graph is always in the reading scale (units) in which the read
ings were written to the file. The Y-axis is automatically scaled to keep the en
-
tire trace within the graph bounds.
The X-axis of the graph displays an approximate time scale. As the readings
are read from the file, the software calculates the time interval between each
reading. After the entire file has been read in, the software uses the average in
terval between all readings as the interval between each point. For this reason,
if all of the readings in the file are not separated by the same time interval, the
graph will not be 100% accurate.
Note: The readings graph is only capable of displaying up to 32,767 read
ings at a time. If the selected file contains more readings, a message is dis
-
-
played alerting the user and only the first 32,767 readings are read in.
There are many customizable settings for the graph such as titles, a legend, col
ors, grid lines and trend lines. All of these features can be accessed by selecting
the Graph Settings menu option in the Graph menu or by right-clicking on the
graph and selecting the Graph Settings option from the popup menu. The default graph settings can be restored by selecting the Restore Default Settings
option from the Graph menu.
The trace color for the readings can be changed by selecting the Trace Color
option from the Graph menu or by right-clicking on the graph and selecting the
Trace Color option from the popup menu.
The graph may be printed at any time by selecting the Print | Graph option from
the File menu or by selecting the Print Graph option in the Graph menu.
To zoom in to view a section of the graph more closely, select the Zoom In option from the Graph menu or select the Zoom In toolbar button. To restore the
graph to its normal, unzoomed state, select either the Restore option or the
Zoom In option from the Graph menu, or click either the Restore toolbar button
or the Zoom In toolbar button to exit “zoom mode”.
To close a log file window, activate the window to close by clicking on it with
the mouse, then click the X box in the upper right corner of the log file
window.
-
-
-
65
Page 70

7 Graph menu
7 Graph menu
The Graph menu (Figure 33) provides options for configuring the graph set
tings, restoring the default graph settings, changing the trace color, zooming,
and printing the graph.
Figure 33 Graph menu
-
67
Page 71

9934 LogWare
User’s Guide
7.1
Graph settings
The Graph Settings dialog (Figure 34) allows the user to change the way the
graph is displayed.
68
Figure 34 Graph Settings dialog
The following features can be changed:
Titles – Enter or change the graph, bottom, left, right titles. Set the orientation
of the left and right titles horizontally, up or down
Axis – Change the axis color, position, scale and range. Select whether or not
to show the tick marks and a grid
Fonts – Change the typeface and size of the graph titles, labels and legend
Trends – Select to display statistical lines (mean, min/max, standard deviation,
best fit, curve fit) and limit (alarm) lines
Page 72

Background – Select the style and background color for the titles, legend, and
graph
Legend – Enter the legend text, the size and position of the legend
System – Print the graph, export the graph to a graphics file or save the current
graph settings to a template file
Click the OK button to save the settings you have selected and to close the
Graph Settings dialog.
Click the Cancel button to discard any changes and close the Graph Settings
dialog.
Click the Apply Now button to apply the settings you have selected to the
graph without closing the Graph Settings dialog. This button is useful when
you want to try different features for the Graph Settings dialog.
Click the Help button to display the appropriate help topic for this dialog.
7.1.1 Titles
The Titles tab (Figure 35) allows the user to enter the titles to appear on the top,
bottom, left and right sides of the graph.
7 Graph menu
Graph settings
Figure 35 Graph Settings - Titles tab
When you enter text for a title, the Graph control adjusts the rest of the graph
ing window to provide space—either redrawing the graph and associated ob
-
-
69
Page 73

9934 LogWare
User’s Guide
jects at a smaller size or decreasing the space between objects. When you clear
the text box for a title, you disable it and provide more space for the rest of the
graph.
If you enter a title that’s too long to appear in a single line, the Graph control
automatically word-wraps it. If a title doesn’t display at all, it’s because the
Graph control can’t make the font small enough to fit all the text in the space
provided. Increase the size of the graphing window to make the title appear.
Note: To restore the titles to their default settings, select the Restore De
-
fault Settings option from the Graph menu.
Graph title
Enter the top title for the graph. The graph title can contain up to 80 characters.
This title appears centered at the top of the graph. By default, the graph title is
blank.
Bottom title
Enter the bottom title for the graph. The bottom title can contain up to 80 characters. This title appears centered at the bottom of the graph and is generally
used to denote the scale of the X-axis. By default, this title is set to “Time”.
Left title
Enter the left title for the graph. The left title can contain up to 80 characters.
This title appears centered vertically on the left side of the graph and is generally used to denote the scale of the Y-axis. The title can be displayed horizontally or vertically running up or down. By default, this title is set to the
Readings Scale with the Up orientation option selected.
Right title
Enter the right title for the graph. The right title can contain up to 80 characters.
This title appears centered vertically on the right side of the graph and is gener
ally used to denote the scale of a secondary Y-axis. The title can be displayed
horizontally or vertically running up or down. By default, the right title is
blank.
-
70
Page 74

7.1.2 Axis
The Axis tab (Figure 36) can be used to customize the graph’s X- and Y-axis
settings, colors, ticks and gridlines.
7 Graph menu
Graph settings
Figure 36 Graph Settings - Axis tab
Note: To restore the axes to their default settings, select the Restore De
-
fault Settings option from the Graph menu.
Apply to axis
Select the axis for which changes are to be made. The other controls on this tab
change to reflect the current settings of the selected axis. By default, the Y
Overlay and Z axes options do not apply to the graph and are not enabled.
Color of axes
Select the color for the X-and Y-axes by selecting a color bar from the
drop-down list. This setting applies to both axes and is therefore independent of
the current Apply to Axis setting. By default, this option is set to black.
Position
The Position options allow the X-axis to be positioned on either the top or bot
tom of the graph and the Y-axis to be positioned on either the left or right side
71
-
Page 75

9934 LogWare
User’s Guide
of the graph. Selecting the Variable option allows the graph itself to determine
whether to position the axes on the top, bottom, left or right side.
By default, the X-axis is set to Bottom and the Y-axis is set to Left.
Scale
The Scale options allow the user to determine the minimum and maximum val
ues for an axis. Each option is described below:
Zero origin – This option draws the selected axis including the origin (zero)
and extending far enough in the positive and negative directions to include all
of the graph’s values
Variable origin – Select this option to have the axis “zoom in” on the range of
the graph’s actual values, whether or not that range includes zero.
User-defined – This option allows the user to set values for the minimum,
maximum, and number of ticks for the axis. When this option is selected, the
settings in the Range group are enabled
By default, the X-axis and Y-axis are both set to Variable Origin.
Note: Changing the Scale settings (especially for the X-axis) while ac-
quiring real-time data could possibly cause graphing problems to occur.
Therefore, it is recommended that these settings NOT be changed by the
user when acquiring real-time data.
-
72
Range
The Range options are only enabled if the User-Defined option is selected in
the Scale options for the selected axis. Enter the Maximum and Minimum val
-
ues for the selected axis. The selected axis is rescaled to the settings entered.
The Ticks option allows the user to determine how many major tick marks
should be displayed between the minimum and maximum values on the se
lected axis. Each major tick mark is labeled with the appropriate value. The tick
marks themselves are only displayed if the Show check box in the Tick Marks
controls is checked.
By default, these settings are not used by the software because of the default
Scale settings.
Tick marks
The Tick Marks options allow the user to specify whether or not to show tick
marks on the selected axis. To show tick marks, check the Show check box. If
this check box is not checked, the tick marks are not shown on the selected
axis. Valid settings are between 1 and 1000.
The Every option is only enabled for the X-axis. This option determines how
often major tick marks appear on the X-axis. When acquiring real-time data,
the graph displays the most recent 600 readings acquired. The Every option is
Page 76

7 Graph menu
Graph settings
set to 150 meaning that a major tick mark appears every 150 readings, or 600
divided by 150 = 4 major tick marks appear on the X-axis. When analyzing
previously acquired data, the Every option is calculated by the software de
pending on the number of readings being displayed. The X-axis must end with
a tick mark. If you set an Every value that doesn’t include the last value on the
axis, the graph will extend the X-axis so that it ends on a tick mark.
The Minor option allows the user to determine how many minor tick marks ap
pear between each major tick mark. By default, the X-axis and Y-axis are set to
display 5 minor tick marks between major tick marks. Valid settings are be
-
tween 0 and 100.
The Through Axes, Inside Axes and Outside Axes options allow the user to
specify how the tick marks should be drawn on the axis. By default, both the
X-axis and Y-axis are set to Through Axes.
Grids
The Grids options allow the user to specify whether or not to display grid lines
on the graph. To show the grid lines for the selected axis, check the Show
check box. Select the list Style and Color for the grid lines. Both axes are set to
the same style and color, but each axis can be set to show or hide grid lines independent of the other.
By default, grid lines are not shown on the graph.
-
73
Page 77

9934 LogWare
User’s Guide
7.1.3 Fonts
The Fonts tab (Figure 37) can be used to change the typefaces and sizes of
fonts used on the graph.
74
Figure 37 Graph Settings - Fonts tab
Note: To restore the fonts to their default settings, select the Restore De
-
fault Settings option from the Graph menu.
Apply to
Select the title, label or legend option to which the font settings are to be ap
plied. The Typeface and Size controls display the current settings for the se
-
-
lected option.
Typeface
Select the font name from the drop-down list and choose the styles to apply to
the selected title, label or legend.
Size
Select the font size to apply to the selected title, label or legend by clicking on
the scroll bar or dragging the scroll bar’s thumb. Selecting the Smart Scale op
tion allows the graph to automatically reduce the size of the selected font if the
dimensions of the graph become too small to display the title, label or legend in
Page 78

the selected font size. Click the Reset button to restore the size to its default
setting.
7.1.4 Trends
The Trends tab (Figure 38) can be used to superimpose trend lines (Min, Max,
Average, etc.), curve fit and limit (alarm) lines on the graph.
7 Graph menu
Graph settings
Figure 38 Graph Settings - Trends tab
Note: To restore the trend settings to their default settings, select the Re
-
store Default Settings option from the Graph menu.
Statistical lines
These options allow the user to specify which statistical lines should be dis
-
played on the graph.
Check the All Sets option to apply the statistical lines settings to all of the sets
(traces) on the graph. When this check box is checked, the Set Number controls
are disabled.
The Set Number box allows the user to select which set (trace) to which to ap
ply the statistical lines settings. This setting can only be changed if the All Sets
check box is not checked.
75
Page 79

9934 LogWare
User’s Guide
Note: This software only has one set of data. When acquiring real-time
data, this set is the data being acquired. When analyzing previously ac
-
quired data, this set is the data which was previously acquired.
Check the Mean check box to enable a mean line, which is drawn horizontally
through the average value of all data points in the selected set.
Check the Min/Max check box to enable min and max lines, which are drawn
horizontally through the lowest and highest data points in the selected set.
Check the Std Dev check box to enable a pair of standard-deviation lines,
which are drawn horizontally through the standard deviation from the mean (in
both the positive and negative directions) for the selected set.
Check the Best Fit check box to enable a best-fit line, which is a straight line
indicating the trend of data points (a first-order polynomial curve) for the se
-
lected set.
Check the Curve Fit check box if you want to fit a curve through your data
points for the selected set. You can choose the type, order and granularity of the
curve in the Curve Fit options below. These settings will apply to all curve fit
lines drawn on the graph.
By default, no trend lines are enabled.
Curve fit
Select the curve fit options for the curve fit statistical line. The following options are available:
Curve Type
Variable-Order Polynomial
Logarithmic y = a + b * log(x)
Exponential 1 y = a * exp(b * x)
Exponential 2 y = a * x * exp(–b * x)
Power y = a * (x ^ b)
Inverse1 y=a+b/x
Inverse 2 y = a / (b + x)
Inverse 3 y = 1 / (a + b * x)
Inverse 4 y = x / (a * x + b)
Inverse 5 y = 1 / (a + b * x) ^ 2
Spline Spline fit through all points
Moving Average Mid Moving average plotted at midpoint of
Moving Average End Moving average plotted at end point of
Description/Formula
Polynomial Curve of Variable Order
averaged group
averaged group
76
Page 80

7 Graph menu
Graph settings
The Order option applies only to three curve types:
For variable-order polynomial curves, Order is the order of the polynomial
used in curve fitting. A setting of 1 produces a straight line (the same as a
best-fit line); a setting one less than the number of points produces a curve that
passes through every point
For moving-average mid and moving-average end curves, Order is the range
of data points over which moving averages are averaged, beginning with the
first point
The Granularity scroll bar sets the granularity of all curve types except mov
ing-average. The granularity is the number of “steps,” or straight line segments,
making up the curve. Higher values create smoother curves, but require more
drawing time. The default Granularity setting is 50 curve steps, which generally
creates a smooth-looking curve at a high drawing speed. Each click to the left
decreases the number of steps by 2 (to a minimum of 10), and each click to the
right increases the number of steps by 2 (to a maximum of 1000). With spline
curves, you generally need higher granularities than normal—up to 10 times
the number of points in the graph.
Color
Select the colors for each of the statistical lines to display on the graph. The selected color for each statistical line applies to that statistical line for all sets of
data.
Limit lines
Select the limit (alarm) lines options to display on the graph. To display the
high alarm line, check the High check box. To display the low alarm line, check
the Low check box.
By default, the low and high limit values are set to the low and high alarm val
ues entered on the Alarm Settings dialog. The limit lines, however, are not dis
-
-
played by default.
Note: Changing the low and high limit line settings on this dialog DOES
NOT change the low and high alarm settings entered on the Alarm Set
tings dialog and therefore does not affect the alarm events options. These
settings are only used to display the alarm lines on the graph. Only
change these settings if absolutely necessary.
Select the line style for the limit (alarm) lines using the Line drop-down list. A
fill pattern can also be selected using the Fill drop-down list. Select the color of
the limit (alarm) lines and the fill pattern using the Color drop-down list.
Select the Fill Opposite check box to fill the area between the High and Low
limit (alarm) lines with the selected pattern. If this option is not checked, the ar
eas above the High limit value and below the Low limit value are filled in with
the selected pattern.
77
-
Page 81

9934 LogWare
User’s Guide
7.1.5 Background
Enter the text to appear as a label on the High and Low limit (alarm) lines in
the High Label and Low Label boxes. By default, these labels are set to “High
Alarm” and “Low Alarm” respectively.
Note: Unlike statistical lines, the graph can only display one set of limit
(alarm) lines for all sets of data (traces).
The Background tab (Figure 39) can be used to set the background colors of ti
tles, the legend and the graph itself.
Figure 39 Graph Settings - Background tab
-
78
Note: To restore the background settings to their default settings, select
the Restore Default Settings option from the Graph menu.
Apply to
Select the title, legend or graph option to which the background settings are to
be applied. The other controls on this tab change to show the current settings
for the selected item.
Page 82

7 Graph menu
Graph settings
Style
Select the background style options to apply to the selected title, legend or
graph. Select the text and background color for the selected item using the
drop-down lists provided.
Graph window
Select the background options for the graph window. Use the Background
Color drop-down list to select the background color for the plotting area of the
graph.
The Backdrop option can be used to display a graphic (.BMP or .WMF) file
such as a company logo or texture pattern behind the graph. If any other option
except “None” is selected, the File and Browse button controls are enabled. En
ter the name of the file or browse for the filename using the Browse button.
Palette
Select the color palette to use. Using this drop-down list, choose a 16-color or
128-color palette for the screen. All of the Color drop-down lists for the graph
settings use this palette to determine the available choices.
16-color palettes consist of 16 differentiated colors—default, pastel, or
grayscale
-
128-color palettes always consist of the 16 colors from the default palette, followed by 96 colors that vary according to the palette you select. The graph reserves 16 additional colors for special graphic needs. These colors cannot be
selected
By default, the “16 Default” palette is selected.
Note: Selecting any other palette will invalidate the Trace Color option on
the Log Session Settings dialog. The Palette option should NOT be
changed.
79
Page 83

9934 LogWare
User’s Guide
7.1.6 Legend
The Legend tab (Figure 40) can be used to add a legend to the graph.
80
Figure 40 Graph Settings - Legend tab
Note: To restore the legend settings to their default settings, select the Re-
store Default Settings option from the Graph menu.
Legend text
Click the Text button to enter the labels for each set (trace) of data on the
graph. By entering text into the boxes provided, the legend will automatically
appear on the graph. To hide the legend, remove the text from all of the boxes.
By default, all of the legend text boxes are empty causing the legend to be
hidden.
Position
Select the position with respect to the graph to place the legend.
Size
Select the size of the legend. To change the font or style that the legend uses,
see the Fonts tab. To set the legend colors, see the Background tab.
Page 84

7.1.7 System
The System tab (Figure 41) can be used to print and export the graph and to
save the current graph settings to a template file.
7 Graph menu
Graph settings
Figure 41 Graph Settings - System Tab
Printing
The graph can be printed to the currently selected printer by selecting the Print
button.
The graph can be printed with or without a border by selecting the Border
check box.
The Mono and Color options determine how the trace is printed. If the Mono
option is selected, every point on the trace has a predetermined marker. This is
to be able to distinguish one trace from another when printing graphs on mono
chrome (black & white) printers. Selecting the Color option removes the mark
ers from the trace, producing a more readable graph, but makes it more difficult
to distinguish between two traces.
To print the graph in a landscape orientation, select the Landscape check box.
If this check box is not selected, the graph will be printed in the portrait
orientation.
81
-
-
Page 85

9934 LogWare
User’s Guide
Portrait Landscape
To force the graph to fill an entire page, select the Full page check box. If this
check box is not checked, the graph will be printed as close to its actual size as
possible.
The graph can also be printed by selecting the Print | Graph option from the
File menu or by selecting the Print Graph option from the Graph menu. The de
fault printer can be set by selecting the Print Setup option from the File menu.
Export Image
The graph can be exported to a graphics file or the clipboard. Select the type of
file to export it to in the Format group:
Select the WMF option if you want to create a metafile of the graph.
•
• Select the BMP option if you want to create a bitmap of the graph.
• Select the JPEG option if you want to save an image of the graph in JPEG
format.
• Select the PNG option if you want to save an image of the graph in PNG
format.
To export the graph to a file, select the File option in the Target group and enter
the filename or click the browse button to select the filename and location.
Click the Copy button to save the graph image to the selected file.
To copy the graph to the clipboard, select the Clipboard option in the Target
group and click the Copy button. A copy of the graph is sent to the clipboard
and can now be pasted into other applications.
-
82
Export Map File
An image of the graph can also be exported to a map file.
Select a format for an image map using the Format drop-down list. Then, set
the name attribute for a client-side image map by entering the name in the Tag
box. Click the Ref. Strings button to enter an array of URLs for use in the im
age map. Enter the filename for the image map file by entering it into the File
box or click the Browse button to select the filename and location. For a cli
ent-side image map, this file should be the file name and extension of the
HTML document. For a server-side image map, use the same base filename for
both the image and the map. Often the map file’s extension is .MAP, though
other extensions are usually acceptable.
Graph Template
The current graph settings can also be saved to a template file. If the user has
customized the graph and the custom settings need to be used over and over
Page 86

7 Graph menu
Restore default settings
again, the custom settings can be saved to a template file. The template file can
then be loaded to restore the custom settings.
To save the data along with the graph settings, check the Save Data check box.
If this check box is not checked, the data will not be saved in the template file.
To save the current graph settings to a template file, enter the filename in the
File box or use the browse button to select the filename. The default extension
for template files is .GSP. Multiple templates can be saved to the same template
file. Assign this template a name by entering the name in the Name box pro
vided. Click the Save button to save the graph settings to the template file.
To load a saved template, enter the filename in the File box or use the browse
button to select the filename. Use the Name drop-down list to select the name
of the template to load and click the Load button.
Note: Although this feature works for the most part, some inconsistencies
have been observed. If a template file is loaded when viewing previously
logged data, the data gets corrupted and is lost. If a template file is loaded
when logging real-time data, the graph will display corrupted data (although any data that has already been logged is saved to an output file
and does not get corrupted) until the graph scrolls completely to the left.
-
7.2 Restore default settings
The Restore Default Settings menu option can be used to quickly restore the
graph to its default settings and undoing any user customization.
To customize a graph’s settings, select the Graph Settings option from the
Graph menu.
7.3 Trace color
The Trace Color dialog (Figure 42) allows a new color to be selected for the
graph trace. The current trace color is selected when the dialog is displayed.
Select the new color using the Trace Color drop-down list.
Figure 42 Trace Color dialog
83
Page 87

9934 LogWare
User’s Guide
Click the OK button to save the settings you have selected and to close the
dialog.
Click the Cancel button to discard any changes and close the dialog.
Click the Help button to display the appropriate help topic for this dialog.
7.4
Zoom in
The Zoom In menu option or toolbar button allows the user to magnify and
view a small portion of the entire graph (Figure 43). This feature is not avail
able when logging real-time data. The menu option and toolbar button are only
enabled when viewing previously logged data.
Figure 43 Zoom In
To zoom in to a portion of the graph, select the Zoom In option from the Graph
menu or click the Zoom In toolbar button. The toolbar button remains de
pressed and a check mark appears next to the Zoom In menu option indicating
that the mouse is now in “zoom mode”. When the mouse pointer is placed over
the graph, the cross-hair cursor appears instead of the default arrow cursor.
Use the mouse to select the portion of the graph to zoom in to by clicking the
left mouse button and holding it down while dragging the mouse to draw a rect
angular box around the desired area. Releasing the mouse button causes the
graph to zoom in to the selected area. The Readings grid is also repositioned to
show the left-most point on the graph in the top row in the grid. Repeat this
process to zoom in closer and closer.
To restore the graph to its normal, unzoomed state, select either the Restore op
tion or the Zoom In option from the Graph menu, or click either the Restore
toolbar button or the Zoom In toolbar button to exit “zoom mode”. The check
mark is then removed from the Zoom In menu option and the Zoom In toolbar
button no longer appears depressed.
-
-
-
-
84
Page 88

7 Graph menu
Restore (zoom out)
7.5
Restore (zoom out)
Selecting the Restore option from the Graph menu exits “zoom mode” and re
stores the graph to displaying the entire trace. When “zoom mode” is exited,
the mouse pointer no longer appears as a cross-hair when over the graph. The
check mark is removed from the Zoom In menu option and the Zoom In toolbar
button no longer appears depressed.
7.6 Print graph
Selecting the Print Graph menu option prints the graph to the default printer.
The graph can also be printed by selecting the Print | Graph option in the File
menu or from the System tab of the Graph Settings dialog.
To select the current printer, use the Print Setup option in the File menu.
By default, the graph is printed with the following options (as found on the
System tab of the Graph Settings dialog):
• Border is ON
• Orientation is set to the default printer’s orientation
• Full Page is ON
To print a graph using other than these default settings, use the System tab on
the Graph Settings dialog.
-
85
Page 89

8 Tools menu
The Tools menu (Figure 44) provides utilities for setting various thermometer
and probe parameters.
Figure 44 Tools menu
The Synchronize Date/Time menu option synchronizes the thermometer’s clock
to the computer’s clock.
The Write Labels menu option can be used to change the labels associated with
the logging features of selected thermometers.
The INFO-CON/Probe Settings menu option runs a utility that allows many
probe-specific settings of the thermometer to be viewed and changed.
The Thermometer Settings menu option runs a utility that allows many thermometer parameters to be viewed and changed.
8 Tools menu
Synchronize date/time
8.1
Synchronize date/time
The Synchronize Date/Time menu option synchronizes the thermometer’s clock
to the computer’s clock. When this menu option is selected, the Select Model
dialog is displayed (see Section 8.5). Select the thermometer model and com
munication settings to use and click the OK button.
If the selected thermometer requires the passcode to change the date and/or
time, the Enter Passcode dialog is displayed (see Section 8.6). Enter the
passcode for the thermometer and click the OK button.
Note: Entering an incorrect passcode will cause this function to fail to up
date the date and/or time properly.
The software then updates the date and/or time in the thermometer.
-
-
87
Page 90

9934 LogWare
User’s Guide
8.2
Write labels
The Write Labels menu option can be used to change the labels associated with
the logging features of selected thermometers. When this menu option is se
lected, the Select Model dialog is displayed (see Section 8.5). Select the ther
mometer model and communication settings to use and click the OK button.
Note: Currently, only the Model 1522 LLL Handheld Datalogger supports
this feature.
After the thermometer is selected, the labels are read from the selected ther
mometer and displayed on the 1522 Data Labels dialog (Figure 45).
Figure 45 Data Labels dialog
-
-
-
88
Current labels
The Current Labels list displays all of the labels currently in the thermometer.
Use the scroll bar to scroll through the list.
New label
To change the value of a label, click on the label to change. Enter the new value
for the label in the New Label box. Each label can be up to 8 characters in
length and can consist of any combination of alpha-numeric characters (A-Z
and 0-9), the underscore (“_”), and dash (“-”) characters.
Apply
Clicking the Apply button changes the selected label to the value in the New
Label box. The change is reflected in the Current Labels list.
Page 91

INFO-CON/probe settings
Reset all
To reset all labels to their default settings, click the Reset All button. The de
fault setting for each label is “LABELN”whereN is the label number between
1 and the maximum number of labels.
8 Tools menu
-
8.3
Note: If there are any logged readings stored in the thermometer, it is rec
ommended that the readings be downloaded BEFORE changing the la
bels!! When logging data, only the label number (or index) is stored with
each reading, not the actual label value. Therefore, changing a label be
fore downloading any logged readings also changes the labels associated
with the readings.
Click the OK button to write the new label settings back to the thermometer.
Click the Cancel button to discard any changes you have made. The labels will
NOT be written back to the thermometer.
Click the Help button to display the help topic for this dialog.
-
-
-
INFO-CON/probe settings
The INFO-CON/Probe Settings menu option runs a utility that allows many
probe-specific settings of the thermometer to be viewed and changed. When
this menu option is selected, the Select Model dialog is displayed (see Section
8.5). Select the thermometer model and communication settings to use and
click the OK button.
After the thermometer is selected, the thermometer and channel-specific set-
89
Page 92

9934 LogWare
User’s Guide
tings are read from the selected thermometer and displayed on the Channel Set
tings dialog (Figure 46).
Figure 46 Channel Settings dialog
-
90
The available channel settings vary from one thermometer to another. Only settings that are applicable to the selected thermometer are enabled.
Note: All items marked in RED require a valid passcode to be entered be
fore they can be written to the thermometer. If a valid passcode is not en
-
-
tered, these settings will NOT be written to the thermometer.
Please refer to the User Guide that came with the thermometer for more
details on each of these settings.
Excitation current
The excitation current drop down list allows the excitation current used by the
thermometer to be changed. The list contains only settings applicable to the se
lected thermometer.
INFO-CON settings
For thermometers that use Hart’s INFO-CON connectors, this utility allows the
settings stored in the INFO-CON connector to be changed. When written back
to the thermometer, the changes are written to the INFO-CON connector.
-
Page 93

INFO-CON/probe settings
8 Tools menu
Probe serial number
The Probe Serial Number box indicates the value stored in the INFO-CON con
nector as the serial number of the attached probe.
The Probe Serial Number can be up to 10 characters long (more characters are
ignored) and can consist of any combination of the following characters:
“0” to “9”
“a” to “z”
“A” t o “Z”
“-“ (dash), “/” (slash) and “.” (period)
Probe wires
The Probe Wires drop down list allows the user to select how the probe wires
are connected to the INFO-CON connector or thermometer. The list contains
only settings applicable to the selected thermometer.
Probe calibration
The Probe Calibration section allows the parameters specific to the calibration
of the attached probe to be changed.
-
Calibration date
The Calibration Date indicates the date on which the attached probe was last
calibrated. When a probe goes out of calibration (the Due Date passes), the
probe should be recalibrated and the new calibration date, due date, and conversion coefficients should be entered.
To set the calibration date, click the down arrow on the right side of the box. A
calendar is displayed (Figure 47) with the current calibration date highlighted.
Figure 47 Calendar
91
Page 94

9934 LogWare
User’s Guide
Select the calibration date using the calendar. To change months, click the left
and right arrow buttons on the far left and right sides. To change the year, click
on the displayed year at the top of the calendar and the up/down buttons will
appear immediately to the right of the year. Use the up and down buttons to
change the year. To select the day, simply click on the appropriate number on
the calendar. The selected date is then displayed in the Calibration Date box.
Due date
The Due Date indicates the date on which the calibration for the attached probe
expires. When the probe is recalibrated, the new calibration date, due date, and
conversion coefficients should be entered.
To set the due date, click the down arrow on the right side of the box. A calen
dar is displayed with the current due date highlighted. Follow the instructions
above to select the new due date.
-
Note: The Due Date must always be after the Calibration Date. Other
wise, the software will not allow the dates to be written to the thermometer.
Conversion type
The Conversion Type drop down list indicates the currently selected conversion
type for the attached probe. When a probe is calibrated, a Report of Calibration
is created which indicates the type of conversion and the conversion coefficients that should be programmed into the thermometer.
Determine the conversion type required for the attached probe and select the
appropriate item from the drop down list. Only conversion types that are applicable to the selected thermometer are displayed in the list.
Note: If the conversion type required by the probe does not appear in the
list, the probe may need to be recalibrated using one of the available con
-
version types.
Conversion settings
Many conversion types require coefficients to be entered. If the selected con
version type does require coefficients to be entered, the Conversion Settings
button is enabled. To enter probe coefficients, click the Conversion Settings
button.
The appropriate conversion settings dialog is displayed. Enter the coefficients
found on the probe’s Report of Calibration and click the OK button on the con
version settings dialog to return.
This software supports the following types of conversions:
-
92
•
ITS-90 (see ITS-90 Coefficients )
Page 95

IPTS-68 (see IPTS-68 Coefficients )
•
Callendar-Van Dusen (see Callendar-Van Dusen Coefficients )
•
High Temp. PRT (see High Temp. PRT Coefficients )
•
Thermistor (see Thermistor Coefficients )
•
YSI-400 (see YSI-400 Coefficients )
•
IEC-751 (see IEC-751 Coefficients )
•
Open and save as
8 Tools menu
Thermometer settings
8.4
Click the Open button to display the Windows® Open dialog to open a previ
ously saved configuration file which contains channel information. Click the
Save As button to display the Windows® Save As dialog to save the current
settings you have selected to a configuration file.
Note: For more information on configuration files, see Section 11 Config
uration Files.
Click the OK button to accept the current settings and close this dialog. The
new settings will be written to the thermometer. If the selected thermometer requires the passcode to change any of the channel settings, the Enter Passcode
dialog is displayed (see Section 8.6). Enter the passcode for the thermometer
and click the OK button.
Note: Entering an incorrect passcode will cause this function to fail to up-
date the channel settings properly.
Click the Cancel button to discard any changes you have made.
Click the Help button to display the appropriate help topic for this dialog.
-
-
Thermometer settings
The Thermometer Settings menu option runs a utility that allows many ther
mometer-specific settings of to be viewed and changed. When this menu option
is selected, the Select Model dialog is displayed (see Section 8.5). Select the
thermometer model and communication settings to use and click the OK
button.
After the thermometer is selected, the thermometer settings are read from the
-
93
Page 96

9934 LogWare
User’s Guide
selected thermometer and displayed on the Thermometer Settings dialog (Fig
ure 48). The channel-specific settings are also read in.
-
94
Figure 48 Thermometer Settings
The available thermometer settings vary from one thermometer to another.
Only settings that are applicable to the selected thermometer are enabled.
Note: All items marked in RED require a valid passcode to be entered be
fore they can be written to the thermometer. If a valid passcode is not en
-
-
tered, these settings will NOT be written to the thermometer.
Please refer to the User Guide that came with the thermometer for more
details on each of these settings.
Model
The Model box indicates the currently selected thermometer model number.
This setting cannot be changed.
Page 97

8 Tools menu
Thermometer settings
Serial number
The Serial Number box indicates the serial number of the currently selected
thermometer. This setting cannot be changed. If the serial number could not be
read from the thermometer, this box displays “<unknown>”.
Firmware
The Firmware box contains information about the firmware installed in the cur
rently selected thermometer. This setting cannot be changed. If the firmware in
formation could not be read from the thermometer, this box displays
“<unknown>”.
Units
The Units drop down list indicates the currently selected units and allows the
units to be changed. The available units varies from one thermometer to
another.
Filter
The Filter box indicates the current filter setting in the thermometer. The filter
value can be changed either by typing the new value into the box or by using
the up/down buttons on the right side of the box. The allowable range of the filter setting varies from one thermometer to another.
-
-
Resolution
The Resolution drop down list indicates the current resolution setting in the
thermometer. To change the resolution, choose a new setting from the drop
down list. Only settings that are applicable to the selected thermometer appear
in the list.
Thermometer calibration
The Thermometer Calibration section allows the parameters specific to the cali
bration of the thermometer to be changed.
Calibration constants
The Calibration Constants indicate the current settings of the calibration con
stants of the thermometer. These constants are only set when the thermometer
is calibrated and should not be changed until the thermometer itself is cali
brated again. When a thermometer is calibrated, a Report of Calibration is cre
ated which indicates the values of these constants.
Calibration date
The Calibration Date indicates the date on which the thermometer was last cali
brated. When a thermometer goes out of calibration (the Due Date passes), the
thermometer should be recalibrated and the new calibration date, due date, and
calibration constants should be entered.
-
-
-
95
Page 98

9934 LogWare
User’s Guide
To set the calibration date, click the down arrow on the right side of the box. A
calendar (Figure 47) is displayed with the current calibration date highlighted.
Select the calibration date using the calendar. To change months, click the left
and right arrow buttons on the far left and right sides. To change the year, click
on the displayed year at the top of the calendar and the up/down buttons will
appear immediately to the right of the year. Use the up and down buttons to
change the year. To select the day, simply click on the appropriate number on
the calendar. The selected date is then displayed in the Calibration Date box.
Due date
The Due Date indicates the date on which the calibration for the thermometer
expires. When the thermometer is recalibrated, the new calibration date, due
date, and calibration constants should be entered.
To set the due date, click the down arrow on the right side of the box. A calen
dar is displayed with the current due date highlighted. Follow the instructions
above to select the new due date.
Note: The Due Date must always be after the Calibration Date. Other-
wise, the software will not allow the dates to be written to the thermometer.
-
Channel settings
The Channel Settings section displays a list of all channels on the selected thermometer. Currently, this software only supports single-channel thermometers.
Channels
The Channels list shows an entry for each channel on the selected thermometer
numbered 1) to N)whereN is the total number of channels on the thermometer.
Channel settings
To change the channel settings, select a channel from the Channels list and
click the Channel Settings button. The Channel Settings dialog is displayed.
For more information on the channel settings, see Section 8.3, the
INFO-CON/Probe Settings.
Open and save as
Click the Open button to display the Windows® Open dialog to open a previ
-
ously saved configuration file which contains thermometer information, includ
ing the settings for all channels. Click the Save As button to display the
Windows® Save As dialog to save the current settings you have selected to a
configuration file.
-
96
Page 99

8 Tools menu
Select model
Note: For more information on configuration files, see Section 11 Config
uration Files.
Click the OK button to accept the current settings and close this dialog. The
new settings will be written to the thermometer. If the selected thermometer re
quires the passcode to change any of the thermometer or channel settings, the
Enter Passcode dialog is displayed (see Section 8.6). Enter the passcode for the
thermometer and click the OK button.
Note: Entering an incorrect passcode will cause this function to fail to up
date the thermometer and channel settings properly.
Click the Cancel button to discard any changes you have made.
Click the Help button to display the appropriate help topic for this dialog.
8.5 Select model
The Select Model dialog (Figure 49) allows the thermometer model and communication settings to be selected.
-
-
-
Figure 49 Select Model dialog
Model
Select the model of the thermometer to use. Only thermometers that support the
feature to be accessed are listed in the drop down list.
COM port
Select the COM port to which the thermometer is connected. This software ex
pects to communicate with the thermometer via an RS-232 serial connection.
Most laptop and desktop computers have at least one 9-pin or 25-pin COM
port. Refer to your computer’s owners manual if you are unable to locate or
identify a COM port on your computer.
97
-
Page 100

9934 LogWare
User’s Guide
Note: All Hart instruments require a “null modem” cable to interface
with a computer. Please refer to the thermometer’s User Guide for more
information on this type of cable.
Each COM port is accompanied by a symbol that reflects the current state of
the COM port as follows:
- COM ports with this symbol are available on this computer
and can be selected.
- COM ports with this symbol are virtual COM ports used to
interface with an I/R port. This software does not support using COM
ports with this associated symbol.
- The COM port with this symbol is currently being used by this
software.
- COM ports with this symbol are in use by another application and
cannot be used by this software at this time.
Baud rate
Select the baud rate that should be used to communicate with the thermometer.
The available choices are determined by the baud rates supported by the selected thermometer.
Note: The thermometer and this software must both be set to the same
baud rate in order to communicate successfully. Please refer to the ther
mometer’s User Guide for more information on setting the baud rate of
the thermometer.
Use I/R dongle
If the Use I/R Dongle check box appears, the selected feature allows the use of
an I/R dongle for communication. Using an I/R dongle can greatly increase the
speed of communication, therefore reducing the amount of time to send and re
ceive data to and from the thermometer. Check this option if an I/R dongle is
being used. When this box is checked, the baud rate setting explained above is
ignored.
For more information on using the I/R dongle, see Using an I/R dongle with
LogWare .
-
98
 Loading...