

Application examples28
28.3 Oxidized socket
28.3.1 General
Depending on the type of socket and the environment in which the socket is installed, oxides may occur on the socket's contact surfaces. These oxides can lead to locally increased resistance when the socket is loaded, which can be seen in an infrared image
as local temperature increase.
A socket’s construction may differ dramatically from one manufacturer to another. For
this reason, different faults in a socket can lead to the same typical appearance in an infrared image.
Local temperature increase can also result from improper contact between a wire and
socket, or from difference in load.
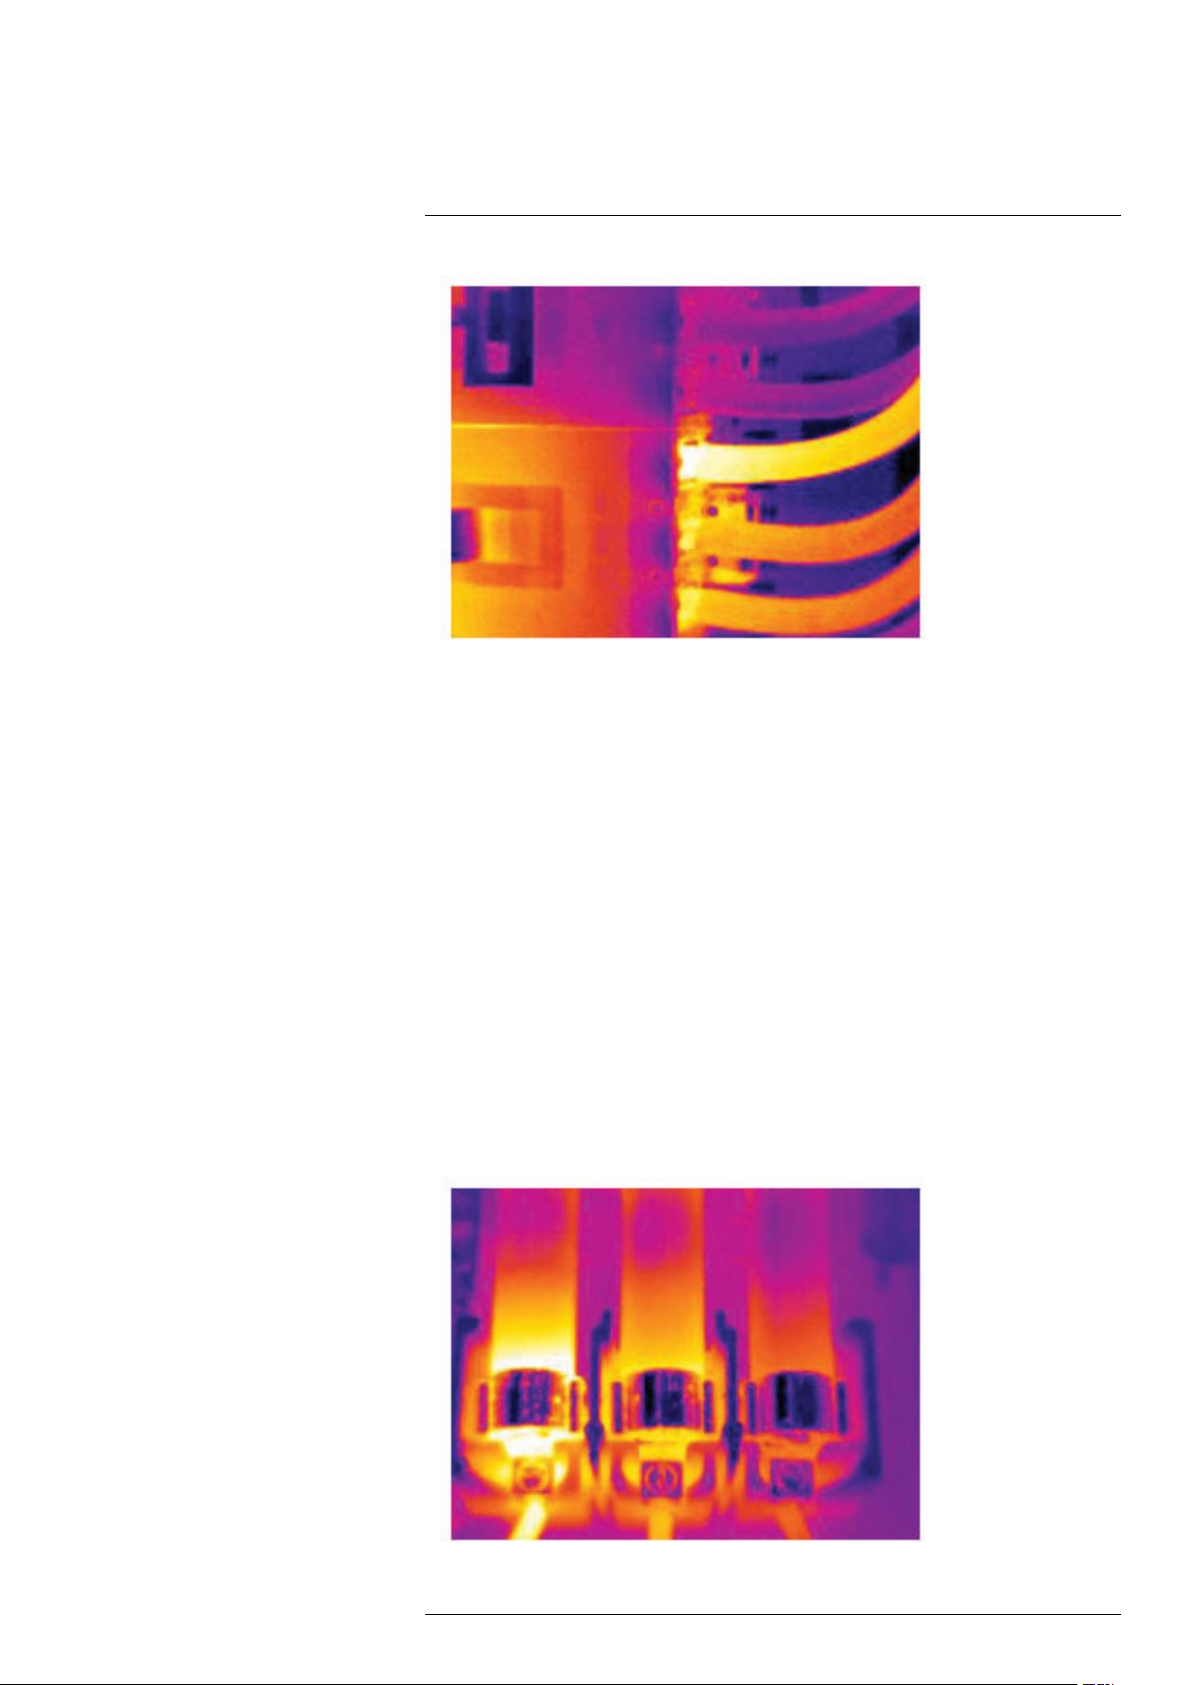
28.3.2 Figure
The image below shows a series of fuses where one fuse has a raised temperature on
the contact surfaces against the fuse holder. Because of the fuse holder’s blank metal,
the temperature increase is not visible there, while it is visible on the fuse’s ceramic
material.
#T559880; r. AL/45866/46124; en-US
459
Application examples28
28.4 Insulation deficiencies
28.4.1 General
Insulation deficiencies may result from insulation losing volume over the course of time
and thereby not entirely filling the cavity in a frame wall.
An infrared camera allows you to see these insulation deficiencies because they either
have a different heat conduction property than sections with correctly installed insulation,
and/or show the area where air is penetrating the frame of the building.
When you are inspecting a building, the temperature difference between the inside and
outside should be at least 10°C (18°F). Studs, water pipes, concrete columns, and similar components may resemble an insulation deficiency in an infrared image. Minor differences may also occur naturally.
28.4.2 Figure
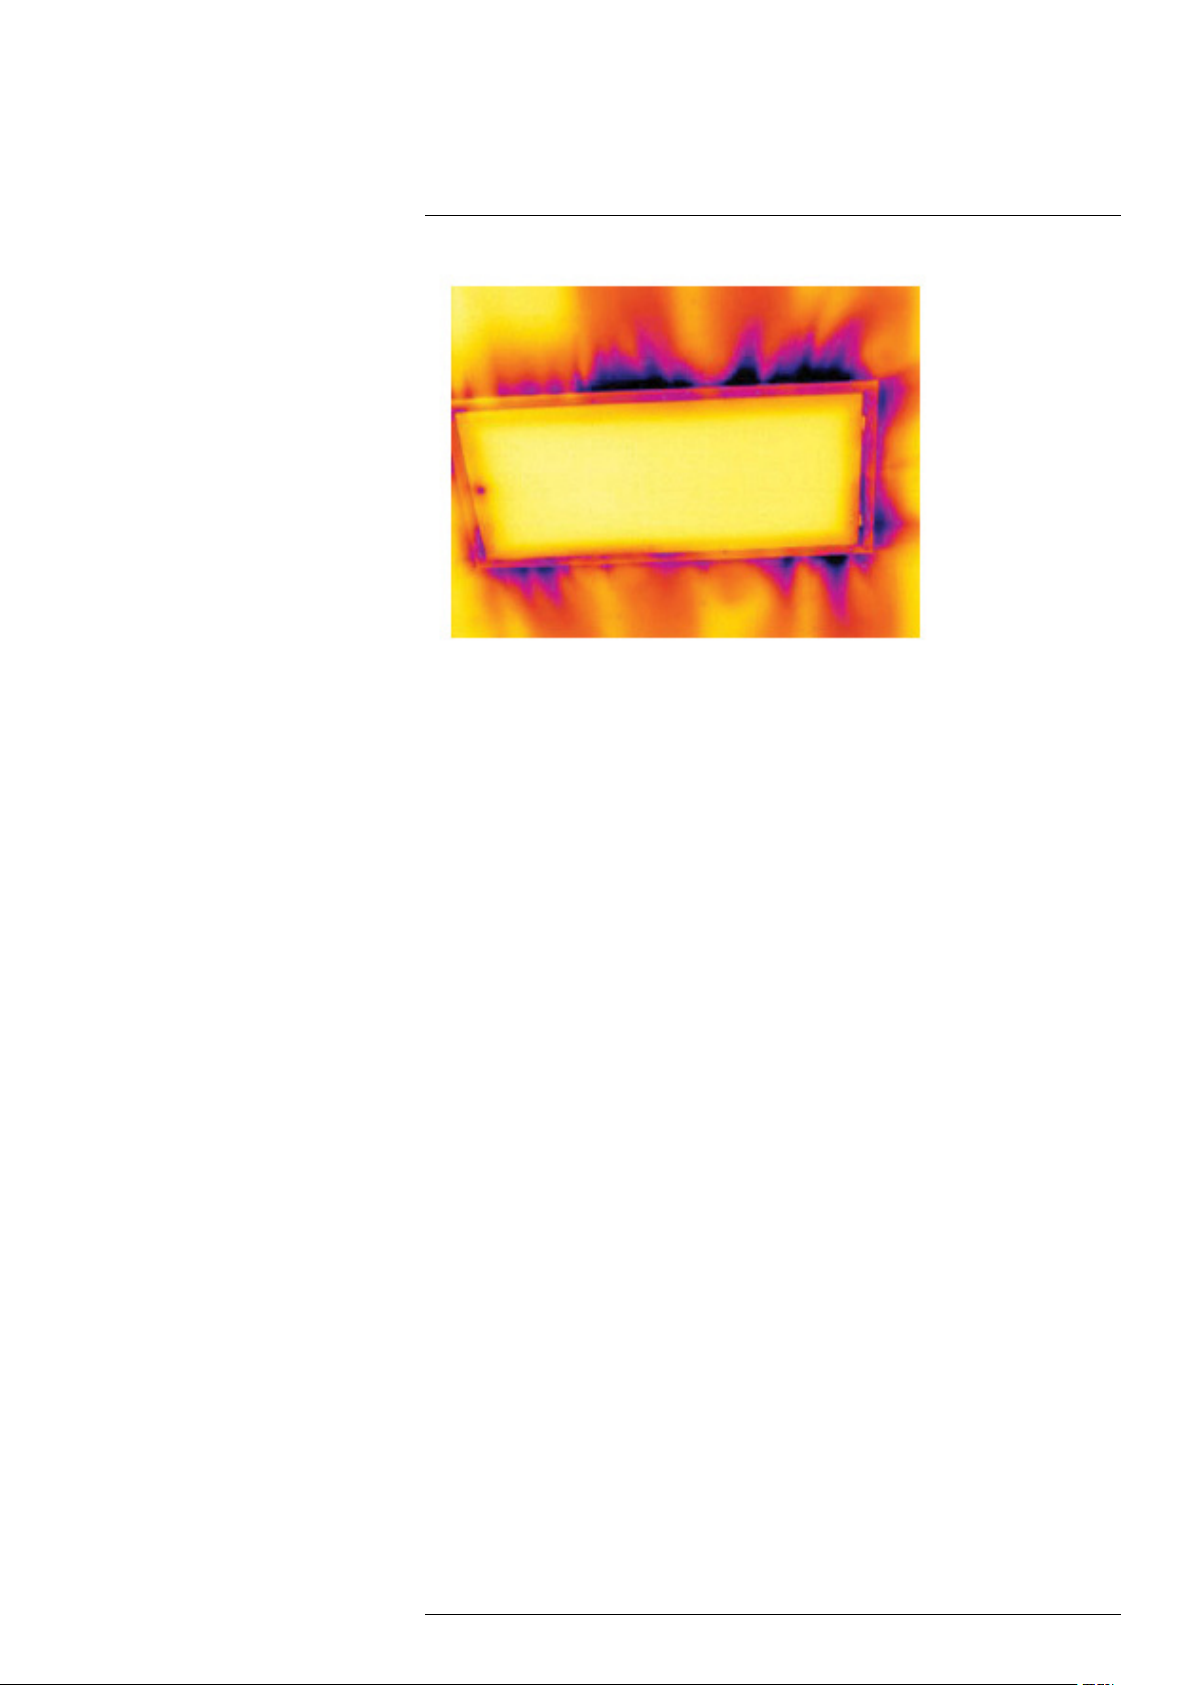
In the image below, insulation in the roof framing is lacking. Due to the absence of insulation, air has forced its way into the roof structure, which thus takes on a different characteristic appearance in the infrared image.
28.5 Draft
28.5.1 General
Draft can be found under baseboards, around door and window casings, and above ceiling trim. This type of draft is often possible to see with an infrared camera, as a cooler
airstream cools down the surrounding surface.
When you are investigating draft in a house, there should be sub-atmospheric pressure
in the house. Close all doors, windows, and ventilation ducts, and allow the kitchen fan
to run for a while before you take the infrared images.
An infrared image of draft often shows a typical stream pattern. You can see this stream
pattern clearly in the picture below.
Also keep in mind that drafts can be concealed by heat from floor heating circuits.
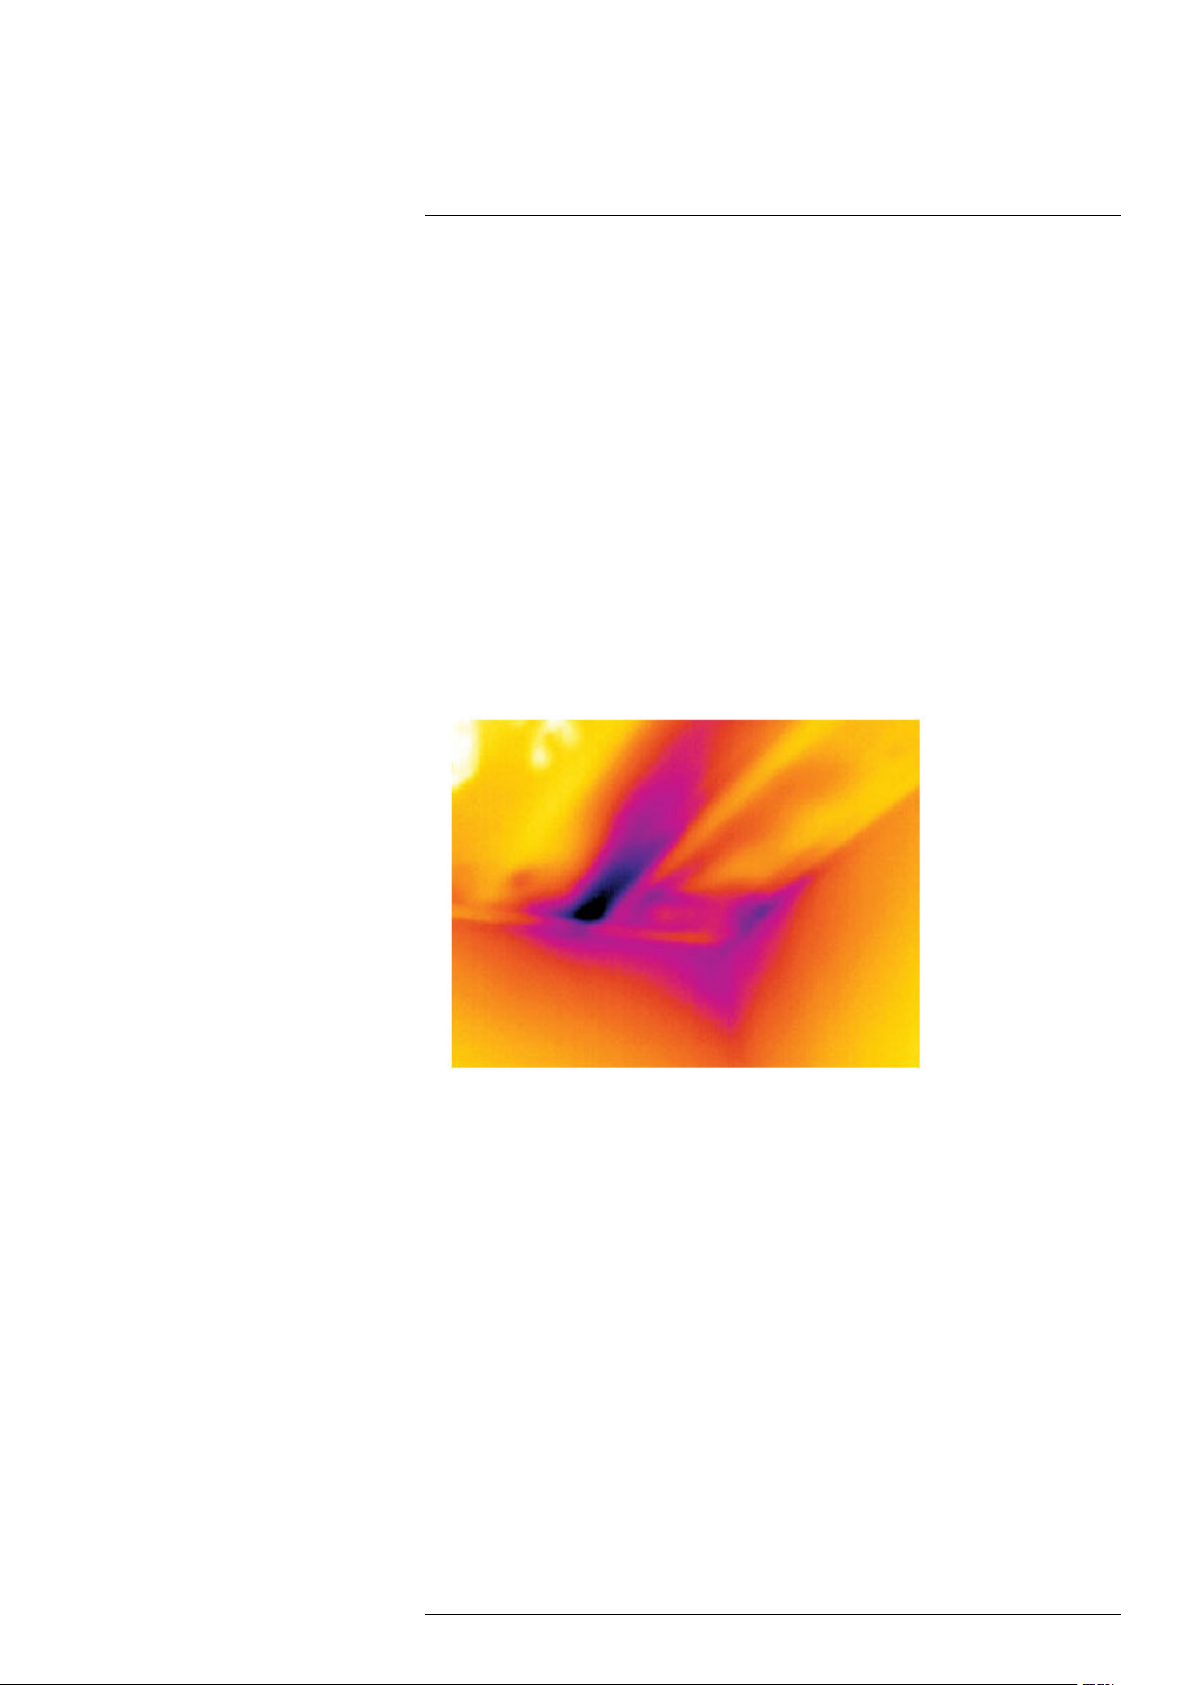
28.5.2 Figure
The image below shows a ceiling hatch where faulty installation has resulted in a strong
draft.
#T559880; r. AL/45866/46124; en-US
460
Application examples28
#T559880; r. AL/45866/46124; en-US
461

29
About FLIR Systems
FLIR Systems was established in 1978 to pioneer the development of high-performance
infrared imaging systems, and is the world leader in the design, manufacture, and marketing of thermal imaging systems for a wide variety of commercial, industrial, and government applications. Today, FLIR Systems embraces five major companies with
outstanding achievements in infrared technology since 1958—the Swedish AGEMA Infrared Systems (formerly AGA Infrared Systems), the three United States companies Indigo Systems, FSI, and Inframetrics, and the French company Cedip.
Since 2007, FLIR Systems has acquired several companies with world-leading expertise
in sensor technologies:
• Extech Instruments (2007)
• Ifara Tecnologías (2008)
• Salvador Imaging (2009)
• OmniTech Partners (2009)
• Directed Perception (2009)
• Raymarine (2010)
• ICx Technologies (2010)
• TackTick Marine Digital Instruments (2011)
• Aerius Photonics (2011)
• Lorex Technology (2012)
• Traficon (2012)
• MARSS (2013)
• DigitalOptics micro-optics business (2013)
• DVTEL (2015)
• Point Grey Research (2016)
• Prox Dynamics (2016)
Figure 29.1 Patent documents from the early 1960s
FLIR Systems has three manufacturing plants in the United States (Portland, OR, Boston,
MA, Santa Barbara, CA) and one in Sweden (Stockholm). Since 2007 there is also a
manufacturing plant in Tallinn, Estonia. Direct sales offices in Belgium, Brazil, China,
France, Germany, Great Britain, Hong Kong, Italy, Japan, Korea, Sweden, and the USA
—together with a worldwide network of agents and distributors—support our international customer base.
#T559880; r. AL/45866/46124; en-US
462
29
About FLIR Systems
FLIR Systems is at the forefront of innovation in the infrared camera industry. We anticipate market demand by constantly improving our existing cameras and developing new
ones. The company has set milestones in product design and development such as the
introduction of the first battery-operated portable camera for industrial inspections, and
the first uncooled infrared camera, to mention just two innovations.
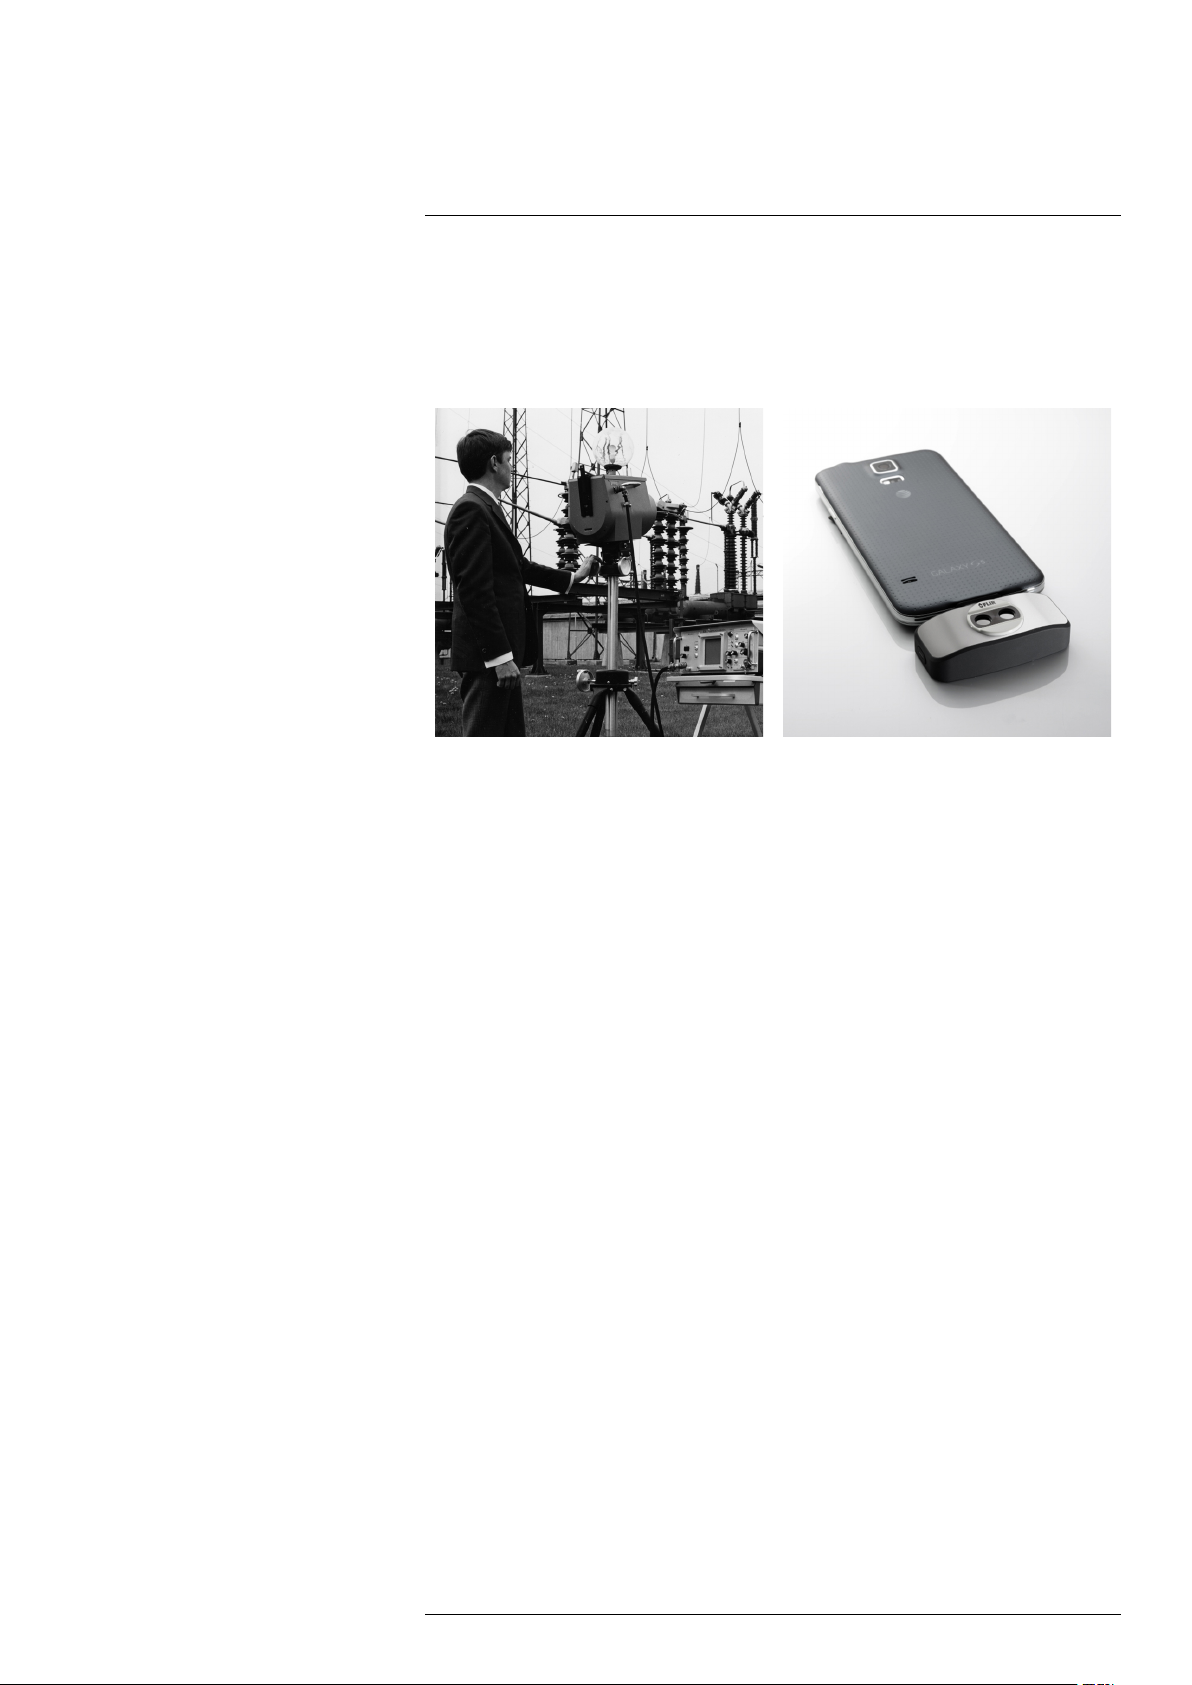
Figure 29.2 1969: Thermovision Model 661. The
camera weighed approximately 25 kg (55 lb.), the
oscilloscope 20 kg (44 lb.), and the tripod 15 kg
(33 lb.). The operator also needed a 220 VAC
generator set, and a 10 L (2.6 US gallon) jar with
liquid nitrogen. To the left of the oscilloscope the
Polaroid attachment (6 kg (13 lb.)) can be seen.
Figure 29.3 2015: FLIR One, an accessory to
iPhone and Android mobile phones. Weight: 90 g
(3.2 oz.).
FLIR Systems manufactures all vital mechanical and electronic components of the camera systems itself. From detector design and manufacturing, to lenses and system electronics, to final testing and calibration, all production steps are carried out and
supervised by our own engineers. The in-depth expertise of these infrared specialists ensures the accuracy and reliability of all vital components that are assembled into your infrared camera.
29.1 More than just an infrared camera
At FLIR Systems we recognize that our job is to go beyond just producing the best infrared camera systems. We are committed to enabling all users of our infrared camera systems to work more productively by providing them with the most powerful camera–
software combination. Especially tailored software for predictive maintenance, R & D,
and process monitoring is developed in-house. Most software is available in a wide variety of languages.
We support all our infrared cameras with a wide variety of accessories to adapt your
equipment to the most demanding infrared applications.
29.2 Sharing our knowledge
Although our cameras are designed to be very user-friendly, there is a lot more to thermography than just knowing how to handle a camera. Therefore, FLIR Systems has
founded the Infrared Training Center (ITC), a separate business unit, that provides certified training courses. Attending one of the ITC courses will give you a truly hands-on
learning experience.
The staff of the ITC are also there to provide you with any application support you may
need in putting infrared theory into practice.
#T559880; r. AL/45866/46124; en-US
463

29
About FLIR Systems
29.3 Supporting our customers
FLIR Systems operates a worldwide service network to keep your camera running at all
times. If you discover a problem with your camera, local service centers have all the
equipment and expertise to solve it within the shortest possible time. Therefore, there is
no need to send your camera to the other side of the world or to talk to someone who
does not speak your language.
#T559880; r. AL/45866/46124; en-US
464

30
Terms, laws, and definitions
Term Definition
Absorption and emission
Apparent temperature uncompensated reading from an infrared instrument, con-
Color palette assigns different colors to indicate specific levels of apparent
Conduction direct transfer of thermal energy from molecule to molecule,
Convection heat transfer mode where a fluid is brought into motion, ei-
Diagnostics examination of symptoms and syndromes to determine the
Direction of heat transfer
Emissivity ratio of the power radiated by real bodies to the power that is
Energy conservation
Exitant radiation radiation that leaves the surface of an object, regardless of
Heat thermal energy that is transferred between two objects (sys-
Heat transfer rate
Incident radiation radiation that strikes an object from its surroundings
IR thermography process of acquisition and analysis of thermal information
Isotherm replaces certain colors in the scale with a contrasting color. It
Qualitative thermography thermography that relies on the analysis of thermal patterns
Quantitative thermography thermography that uses temperature measurement to deter-
2
The capacity or ability of an object to absorb incident radiated energy is always the same as the capacity to emit its
own energy as radiation
taining all radiation incident on the instrument, regardless of
its sources
3
temperature. Palettes can provide high or low contrast, depending on the colors used in them
caused by collisions between the molecules
ther by gravity or another force, thereby transferring heat
from one place to another
nature of faults or failures
5
Heat will spontaneously flow from hotter to colder, thereby
transferring thermal energy from one place to another
radiated by a blackbody at the same temperature and at the
same wavelength
8
The sum of the total energy contents in a closed system is
4
6
7
constant
its original sources
tems) due to their difference in temperature
9
The heat transfer rate under steady state conditions is directly proportional to the thermal conductivity of the object,
the cross-sectional area of the object through which the heat
flows, and the temperature difference between the two ends
of the object. It is inversely proportional to the length, or
thickness, of the object
10
from non-contact thermal imaging devices
marks an interval of equal apparent temperature
to reveal the existence of and to locate the position of
anomalies
mine the seriousness of an anomaly, in order to establish repair priorities
12
12
11
2. Kirchhoff’s law of thermal radiation.
3. Based on ISO 18434-1:2008 (en).
4. Based on ISO 13372:2004 (en).
5. 2nd law of thermodynamics.
6. This is a consequence of the 2nd law of thermodynamics, the law itself is more complicated.
7. Based on ISO 16714-3:2016 (en).
8. 1st law of thermodynamics.
9. Fourier’s law.
10.This is the one-dimensional form of Fourier’s law, valid for steady-state conditions.
11.Based on ISO 18434-1:2008 (en)
12.Based on ISO 10878-2013 (en).
#T559880; r. AL/45866/46124; en-US
465

30
Terms, laws, and definitions
Term Definition
Radiative heat transfer Heat transfer by the emission and absorption of thermal
Reflected apparent temperature apparent temperature of the environment that is reflected by
Spatial resolution ability of an IR camera to resolve small objects or details
Temperature measure of the average kinetic energy of the molecules and
Thermal energy total kinetic energy of the molecules that make up the
Thermal gradient gradual change in temperature over distance
Thermal tuning process of putting the colors of the image on the object of
radiation
the target into the IR camera
13
atoms that make up the substance
14
object
analysis, in order to maximize contrast
13
13.Based on ISO 16714-3:2016 (en).
14.Thermal energy is part of the internal energy of an object.
#T559880; r. AL/45866/46124; en-US
466

31
Thermographic measurement techniques
31.1 Introduction
An infrared camera measures and images the emitted infrared radiation from an object.
The fact that radiation is a function of object surface temperature makes it possible for
the camera to calculate and display this temperature.
However, the radiation measured by the camera does not only depend on the temperature of the object but is also a function of the emissivity. Radiation also originates from
the surroundings and is reflected in the object. The radiation from the object and the reflected radiation will also be influenced by the absorption of the atmosphere.
To measure temperature accurately, it is therefore necessary to compensate for the effects of a number of different radiation sources. This is done on-line automatically by the
camera. The following object parameters must, however, be supplied for the camera:
• The emissivity of the object
• The reflected apparent temperature
• The distance between the object and the camera
• The relative humidity
• Temperature of the atmosphere
31.2 Emissivity
The most important object parameter to set correctly is the emissivity which, in short, is a
measure of how much radiation is emitted from the object, compared to that from a perfect blackbody of the same temperature.
Normally, object materials and surface treatments exhibit emissivity ranging from approximately 0.1 to 0.95. A highly polished (mirror) surface falls below 0.1, while an oxidized
or painted surface has a higher emissivity. Oil-based paint, regardless of color in the visible spectrum, has an emissivity over 0.9 in the infrared. Human skin exhibits an emissivity 0.97 to 0.98.
Non-oxidized metals represent an extreme case of perfect opacity and high reflexivity,
which does not vary greatly with wavelength. Consequently, the emissivity of metals is
low – only increasing with temperature. For non-metals, emissivity tends to be high, and
decreases with temperature.
31.2.1 Finding the emissivity of a sample
31.2.1.1 Step 1: Determining reflected apparent temperature
Use one of the following two methods to determine reflected apparent temperature:
#T559880; r. AL/45866/46124; en-US
467
Thermographic measurement techniques31
31.2.1.1.1 Method 1: Direct method
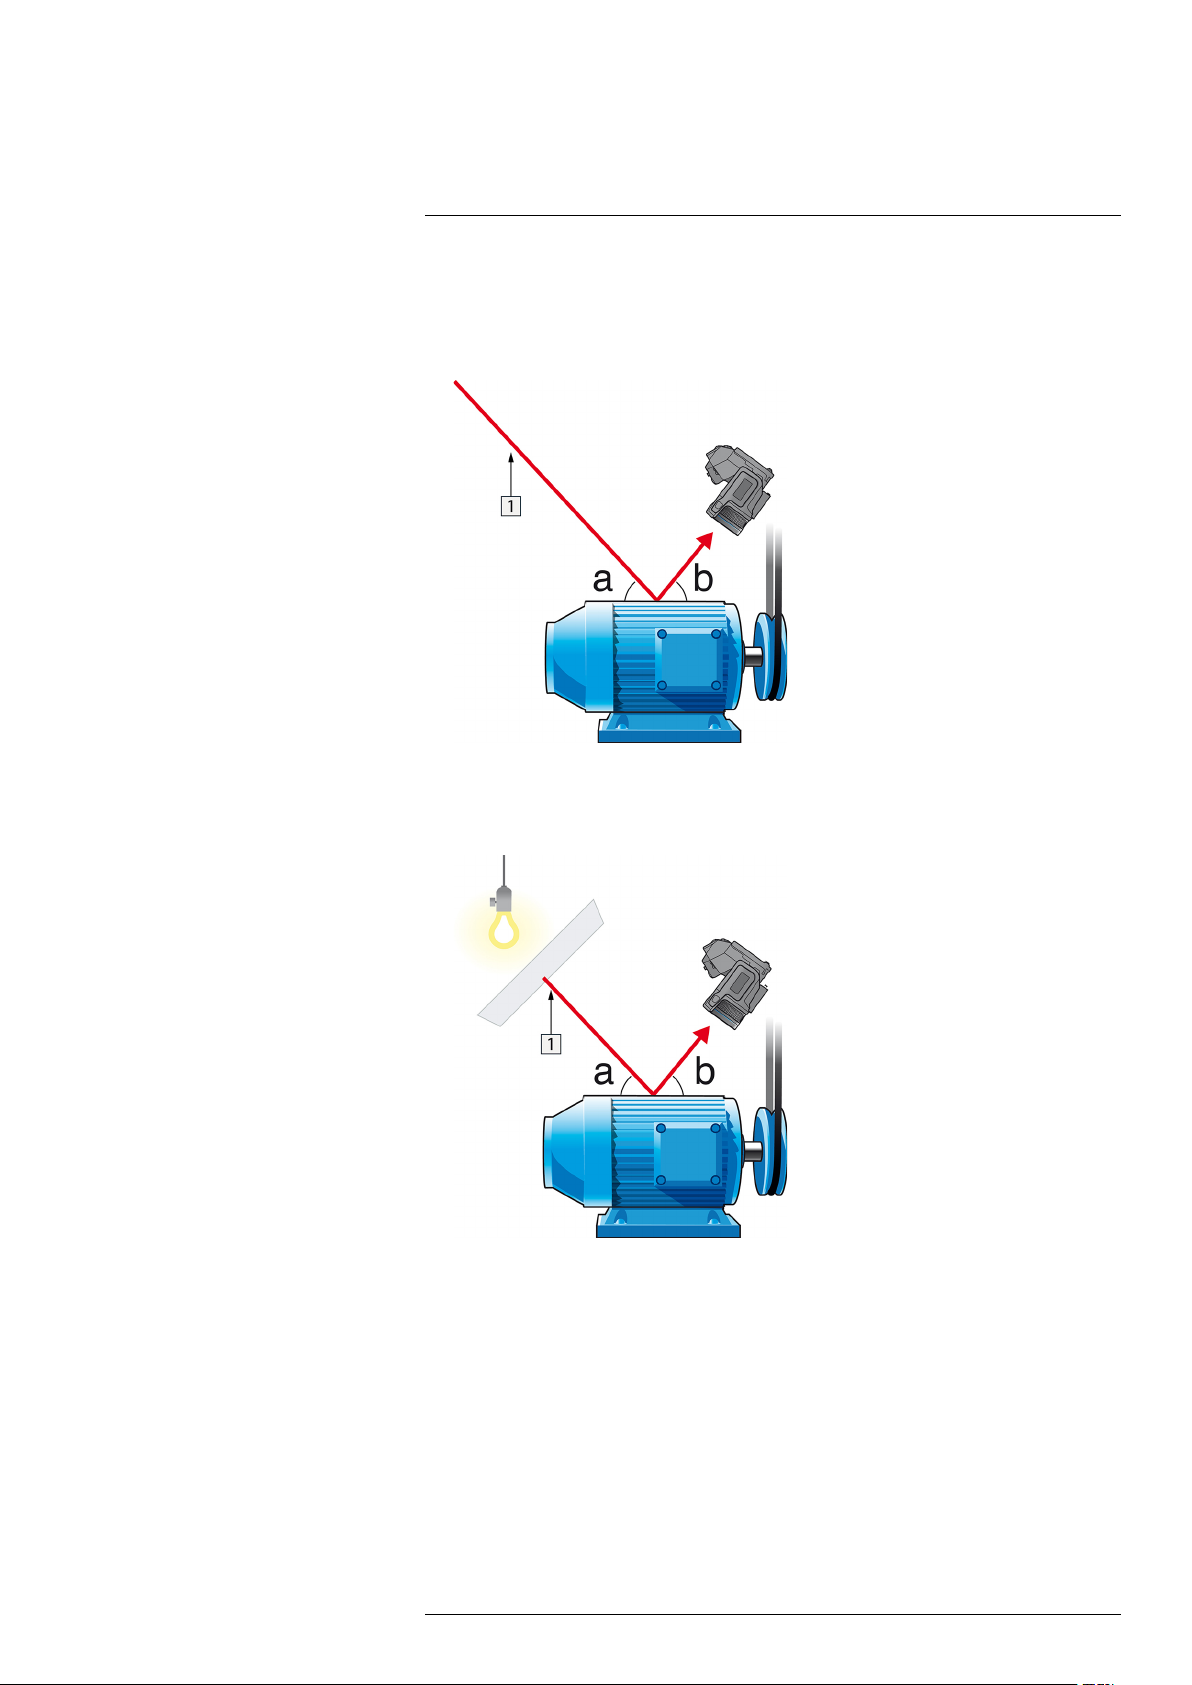
Follow this procedure:
1. Look for possible reflection sources, considering that the incident angle = reflection
angle (a = b).
Figure 31.1 1 = Reflection source
2. If the reflection source is a spot source, modify the source by obstructing it using a
piece if cardboard.
Figure 31.2 1 = Reflection source
#T559880; r. AL/45866/46124; en-US
468
Thermographic measurement techniques31
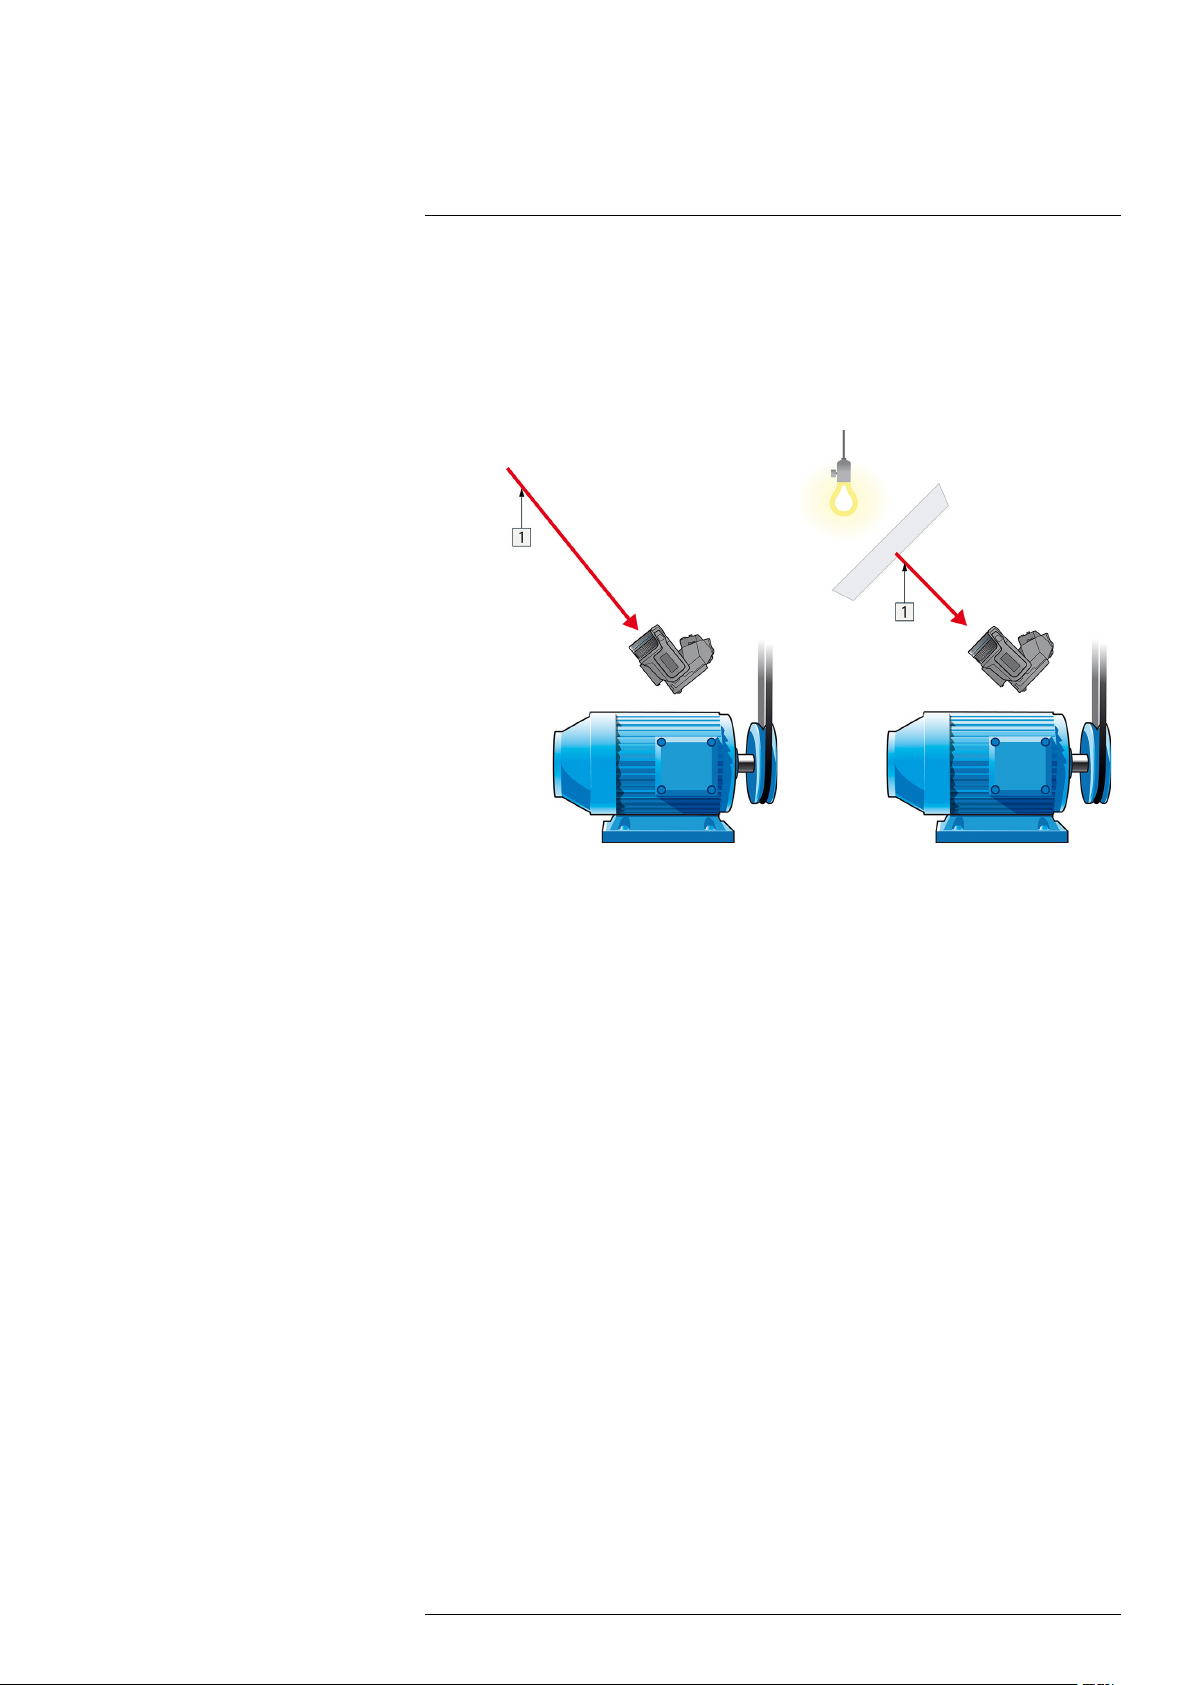
3. Measure the radiation intensity (= apparent temperature) from the reflection source
using the following settings:
• Emissivity: 1.0
• D
: 0
obj
You can measure the radiation intensity using one of the following two methods:
Figure 31.3 1 = Reflection source Figure 31.4 1 = Reflection source
You can not use a thermocouple to measure reflected apparent temperature, because a
thermocouple measures temperature, but apparent temperatrure is radiation intensity.
31.2.1.1.2 Method 2: Reflector method
Follow this procedure:
1. Crumble up a large piece of aluminum foil.
2. Uncrumble the aluminum foil and attach it to a piece of cardboard of the same size.
3. Put the piece of cardboard in front of the object you want to measure. Make sure that
the side with aluminum foil points to the camera.
4. Set the emissivity to 1.0.
#T559880; r. AL/45866/46124; en-US
469

Thermographic measurement techniques31
5. Measure the apparent temperature of the aluminum foil and write it down. The foil is
considered a perfect reflector, so its apparent temperature equals the reflected apparent temperature from the surroundings.
Figure 31.5 Measuring the apparent temperature of the aluminum foil.
31.2.1.2 Step 2: Determining the emissivity
Follow this procedure:
1. Select a place to put the sample.
2. Determine and set reflected apparent temperature according to the previous
procedure.
3. Put a piece of electrical tape with known high emissivity on the sample.
4. Heat the sample at least 20 K above room temperature. Heating must be reasonably
even.
5. Focus and auto-adjust the camera, and freeze the image.
6. Adjust Level and Span for best image brightness and contrast.
7. Set emissivity to that of the tape (usually 0.97).
8. Measure the temperature of the tape using one of the following measurement
functions:
• Isotherm (helps you to determine both the temperature and how evenly you have
heated the sample)
• Spot (simpler)
• Box Avg (good for surfaces with varying emissivity).
9. Write down the temperature.
10. Move your measurement function to the sample surface.
11. Change the emissivity setting until you read the same temperature as your previous
measurement.
12. Write down the emissivity.
Note
• Avoid forced convection
• Look for a thermally stable surrounding that will not generate spot reflections
• Use high quality tape that you know is not transparent, and has a high emissivity you
are certain of
• This method assumes that the temperature of your tape and the sample surface are
the same. If they are not, your emissivity measurement will be wrong.
#T559880; r. AL/45866/46124; en-US
470

Thermographic measurement techniques31
31.3 Reflected apparent temperature
This parameter is used to compensate for the radiation reflected in the object. If the
emissivity is low and the object temperature relatively far from that of the reflected it will
be important to set and compensate for the reflected apparent temperature correctly.
31.4 Distance
The distance is the distance between the object and the front lens of the camera. This
parameter is used to compensate for the following two facts:
• That radiation from the target is absorbed by the atmosphere between the object and
the camera.
• That radiation from the atmosphere itself is detected by the camera.
31.5 Relative humidity
The camera can also compensate for the fact that the transmittance is also dependent
on the relative humidity of the atmosphere. To do this set the relative humidity to the correct value. For short distances and normal humidity the relative humidity can normally be
left at a default value of 50%.
31.6 Other parameters
In addition, some cameras and analysis programs from FLIR Systems allow you to compensate for the following parameters:
• Atmospheric temperature – i.e. the temperature of the atmosphere between the cam-
era and the target
• External optics temperature – i.e. the temperature of any external lenses or windows
used in front of the camera
• External optics transmittance – i.e. the transmission of any external lenses or windows
used in front of the camera
#T559880; r. AL/45866/46124; en-US
471

32
History of infrared technology
Before the year 1800, the existence of the infrared portion of the electromagnetic spectrum wasn't even suspected. The original significance of the infrared spectrum, or simply
‘the infrared’ as it is often called, as a form of heat radiation is perhaps less obvious today than it was at the time of its discovery by Herschel in 1800.
Figure 32.1 Sir William Herschel (1738–1822)
The discovery was made accidentally during the search for a new optical material. Sir
William Herschel – Royal Astronomer to King George III of England, and already famous
for his discovery of the planet Uranus – was searching for an optical filter material to reduce the brightness of the sun’s image in telescopes during solar observations. While
testing different samples of colored glass which gave similar reductions in brightness he
was intrigued to find that some of the samples passed very little of the sun’s heat, while
others passed so much heat that he risked eye damage after only a few seconds’
observation.
Herschel was soon convinced of the necessity of setting up a systematic experiment,
with the objective of finding a single material that would give the desired reduction in
brightness as well as the maximum reduction in heat. He began the experiment by actually repeating Newton’s prism experiment, but looking for the heating effect rather than
the visual distribution of intensity in the spectrum. He first blackened the bulb of a sensitive mercury-in-glass thermometer with ink, and with this as his radiation detector he proceeded to test the heating effect of the various colors of the spectrum formed on the top
of a table by passing sunlight through a glass prism. Other thermometers, placed outside
the sun’s rays, served as controls.
As the blackened thermometer was moved slowly along the colors of the spectrum, the
temperature readings showed a steady increase from the violet end to the red end. This
was not entirely unexpected, since the Italian researcher, Landriani, in a similar experiment in 1777 had observed much the same effect. It was Herschel, however, who was
the first to recognize that there must be a point where the heating effect reaches a maximum, and that measurements confined to the visible portion of the spectrum failed to locate this point.
Figure 32.2 Marsilio Landriani (1746–1815)
Moving the thermometer into the dark region beyond the red end of the spectrum, Herschel confirmed that the heating continued to increase. The maximum point, when he
found it, lay well beyond the red end – in what is known today as the ‘infrared
wavelengths’.
#T559880; r. AL/45866/46124; en-US
472

32
History of infrared technology
When Herschel revealed his discovery, he referred to this new portion of the electromagnetic spectrum as the ‘thermometrical spectrum’. The radiation itself he sometimes referred to as ‘dark heat’, or simply ‘the invisible rays’. Ironically, and contrary to popular
opinion, it wasn't Herschel who originated the term ‘infrared’. The word only began to appear in print around 75 years later, and it is still unclear who should receive credit as the
originator.
Herschel’s use of glass in the prism of his original experiment led to some early controversies with his contemporaries about the actual existence of the infrared wavelengths.
Different investigators, in attempting to confirm his work, used various types of glass indiscriminately, having different transparencies in the infrared. Through his later experiments, Herschel was aware of the limited transparency of glass to the newly-discovered
thermal radiation, and he was forced to conclude that optics for the infrared would probably be doomed to the use of reflective elements exclusively (i.e. plane and curved mirrors). Fortunately, this proved to be true only until 1830, when the Italian investigator,
Melloni, made his great discovery that naturally occurring rock salt (NaCl) – which was
available in large enough natural crystals to be made into lenses and prisms – is remarkably transparent to the infrared. The result was that rock salt became the principal infrared optical material, and remained so for the next hundred years, until the art of synthetic
crystal growing was mastered in the 1930’s.
Figure 32.3 Macedonio Melloni (1798–1854)
Thermometers, as radiation detectors, remained unchallenged until 1829, the year Nobili
invented the thermocouple. (Herschel’s own thermometer could be read to 0.2 °C
(0.036 °F), and later models were able to be read to 0.05 °C (0.09 °F)). Then a breakthrough occurred; Melloni connected a number of thermocouples in series to form the
first thermopile. The new device was at least 40 times as sensitive as the best thermometer of the day for detecting heat radiation – capable of detecting the heat from a person
standing three meters away.
The first so-called ‘heat-picture’ became possible in 1840, the result of work by Sir John
Herschel, son of the discoverer of the infrared and a famous astronomer in his own right.
Based upon the differential evaporation of a thin film of oil when exposed to a heat pattern focused upon it, the thermal image could be seen by reflected light where the interference effects of the oil film made the image visible to the eye. Sir John also managed
to obtain a primitive record of the thermal image on paper, which he called a
‘thermograph’.
#T559880; r. AL/45866/46124; en-US
473

32
History of infrared technology
Figure 32.4 Samuel P. Langley (1834–1906)
The improvement of infrared-detector sensitivity progressed slowly. Another major breakthrough, made by Langley in 1880, was the invention of the bolometer. This consisted of
a thin blackened strip of platinum connected in one arm of a Wheatstone bridge circuit
upon which the infrared radiation was focused and to which a sensitive galvanometer responded. This instrument is said to have been able to detect the heat from a cow at a
distance of 400 meters.
An English scientist, Sir James Dewar, first introduced the use of liquefied gases as cooling agents (such as liquid nitrogen with a temperature of –196°C (–320.8°F)) in low temperature research. In 1892 he invented a unique vacuum insulating container in which it
is possible to store liquefied gases for entire days. The common ‘thermos bottle’, used
for storing hot and cold drinks, is based upon his invention.
Between the years 1900 and 1920, the inventors of the world ‘discovered’ the infrared.
Many patents were issued for devices to detect personnel, artillery, aircraft, ships – and
even icebergs. The first operating systems, in the modern sense, began to be developed
during the 1914–18 war, when both sides had research programs devoted to the military
exploitation of the infrared. These programs included experimental systems for enemy
intrusion/detection, remote temperature sensing, secure communications, and ‘flying torpedo’ guidance. An infrared search system tested during this period was able to detect
an approaching airplane at a distance of 1.5 km (0.94 miles), or a person more than 300
meters (984 ft.) away.
The most sensitive systems up to this time were all based upon variations of the bolometer idea, but the period between the two wars saw the development of two revolutionary
new infrared detectors: the image converter and the photon detector. At first, the image
converter received the greatest attention by the military, because it enabled an observer
for the first time in history to literally ‘see in the dark’. However, the sensitivity of the image converter was limited to the near infrared wavelengths, and the most interesting military targets (i.e. enemy soldiers) had to be illuminated by infrared search beams. Since
this involved the risk of giving away the observer’s position to a similarly-equipped enemy
observer, it is understandable that military interest in the image converter eventually
faded.
The tactical military disadvantages of so-called 'active’ (i.e. search beam-equipped) thermal imaging systems provided impetus following the 1939–45 war for extensive secret
military infrared-research programs into the possibilities of developing ‘passive’ (no
search beam) systems around the extremely sensitive photon detector. During this period, military secrecy regulations completely prevented disclosure of the status of infraredimaging technology. This secrecy only began to be lifted in the middle of the 1950’s, and
from that time adequate thermal-imaging devices finally began to be available to civilian
science and industry.
#T559880; r. AL/45866/46124; en-US
474

33
Theory of thermography
33.1 Introduction
The subjects of infrared radiation and the related technique of thermography are still new
to many who will use an infrared camera. In this section the theory behind thermography
will be given.
33.2 The electromagnetic spectrum
The electromagnetic spectrum is divided arbitrarily into a number of wavelength regions,
called bands, distinguished by the methods used to produce and detect the radiation.
There is no fundamental difference between radiation in the different bands of the electromagnetic spectrum. They are all governed by the same laws and the only differences
are those due to differences in wavelength.
Figure 33.1 The electromagnetic spectrum. 1: X-ray; 2: UV; 3: Visible; 4: IR; 5: Microwaves; 6:
Radiowaves.
Thermography makes use of the infrared spectral band. At the short-wavelength end the
boundary lies at the limit of visual perception, in the deep red. At the long-wavelength
end it merges with the microwave radio wavelengths, in the millimeter range.
The infrared band is often further subdivided into four smaller bands, the boundaries of
which are also arbitrarily chosen. They include: the near infrared (0.75–3 μm), the middle
infrared (3–6 μm), the far infrared (6–15 μm) and the extreme infrared (15–100 μm).
Although the wavelengths are given in μm (micrometers), other units are often still used
to measure wavelength in this spectral region, e.g. nanometer (nm) and Ångström (Å).
The relationships between the different wavelength measurements is:
33.3 Blackbody radiation
A blackbody is defined as an object which absorbs all radiation that impinges on it at any
wavelength. The apparent misnomer black relating to an object emitting radiation is explained by Kirchhoff’s Law (after Gustav Robert Kirchhoff, 1824–1887), which states that
a body capable of absorbing all radiation at any wavelength is equally capable in the
emission of radiation.
#T559880; r. AL/45866/46124; en-US
475

33
Theory of thermography
Figure 33.2 Gustav Robert Kirchhoff (1824–1887)
The construction of a blackbody source is, in principle, very simple. The radiation characteristics of an aperture in an isotherm cavity made of an opaque absorbing material represents almost exactly the properties of a blackbody. A practical application of the
principle to the construction of a perfect absorber of radiation consists of a box that is
light tight except for an aperture in one of the sides. Any radiation which then enters the
hole is scattered and absorbed by repeated reflections so only an infinitesimal fraction
can possibly escape. The blackness which is obtained at the aperture is nearly equal to
a blackbody and almost perfect for all wavelengths.
By providing such an isothermal cavity with a suitable heater it becomes what is termed
a cavity radiator. An isothermal cavity heated to a uniform temperature generates blackbody radiation, the characteristics of which are determined solely by the temperature of
the cavity. Such cavity radiators are commonly used as sources of radiation in temperature reference standards in the laboratory for calibrating thermographic instruments,
such as a FLIR Systems camera for example.
If the temperature of blackbody radiation increases to more than 525°C (977°F), the
source begins to be visible so that it appears to the eye no longer black. This is the incipient red heat temperature of the radiator, which then becomes orange or yellow as the
temperature increases further. In fact, the definition of the so-called color temperature of
an object is the temperature to which a blackbody would have to be heated to have the
same appearance.
Now consider three expressions that describe the radiation emitted from a blackbody.
33.3.1 Planck’s law
Figure 33.3 Max Planck (1858–1947)
Max Planck (1858–1947) was able to describe the spectral distribution of the radiation
from a blackbody by means of the following formula:
#T559880; r. AL/45866/46124; en-US
476

33
Theory of thermography
where:
W
λb
c
h Planck’s constant = 6.6 × 10
k
T Absolute temperature (K) of a blackbody.
λ Wavelength (μm).
Blackbody spectral radiant emittance at wavelength λ.
Velocity of light = 3 × 10
Boltzmann’s constant = 1.4 × 10
8
m/s
-34
Joule sec.
-23
Joule/K.
Note The factor 10-6is used since spectral emittance in the curves is expressed in
2
Watt/m
, μm.
Planck’s formula, when plotted graphically for various temperatures, produces a family of
curves. Following any particular Planck curve, the spectral emittance is zero at λ = 0,
then increases rapidly to a maximum at a wavelength λ
and after passing it ap-
max
proaches zero again at very long wavelengths. The higher the temperature, the shorter
the wavelength at which maximum occurs.
Figure 33.4 Blackbody spectral radiant emittance according to Planck’s law, plotted for various absolute
temperatures. 1: Spectral radiant emittance (W/cm
2
× 103(μm)); 2: Wavelength (μm)
33.3.2 Wien’s displacement law
By differentiating Planck’s formula with respect to λ, and finding the maximum, we have:
This is Wien’s formula (after Wilhelm Wien, 1864–1928), which expresses mathematically the common observation that colors vary from red to orange or yellow as the temperature of a thermal radiator increases. The wavelength of the color is the same as the
wavelength calculated for λ
. A good approximation of the value of λ
max
for a given
max
blackbody temperature is obtained by applying the rule-of-thumb 3 000/T μm. Thus, a
very hot star such as Sirius (11 000 K), emitting bluish-white light, radiates with the peak
of spectral radiant emittance occurring within the invisible ultraviolet spectrum, at wavelength 0.27 μm.
#T559880; r. AL/45866/46124; en-US
477

33
Theory of thermography
Figure 33.5 Wilhelm Wien (1864–1928)
The sun (approx. 6 000 K) emits yellow light, peaking at about 0.5 μm in the middle of
the visible light spectrum.
At room temperature (300 K) the peak of radiant emittance lies at 9.7 μm, in the far infrared, while at the temperature of liquid nitrogen (77 K) the maximum of the almost insignificant amount of radiant emittance occurs at 38 μm, in the extreme infrared wavelengths.
Figure 33.6 Planckian curves plotted on semi-log scales from 100 K to 1000 K. The dotted line represents
the locus of maximum radiant emittance at each temperature as described by Wien's displacement law. 1:
Spectral radiant emittance (W/cm
2
(μm)); 2: Wavelength (μm).
33.3.3 Stefan-Boltzmann's law
By integrating Planck’s formula from λ = 0 to λ = ∞, we obtain the total radiant emittance
(W
) of a blackbody:
b
This is the Stefan-Boltzmann formula (after Josef Stefan, 1835–1893, and Ludwig Boltz-
mann, 1844–1906), which states that the total emissive power of a blackbody is proportional to the fourth power of its absolute temperature. Graphically, W
represents the
b
area below the Planck curve for a particular temperature. It can be shown that the radiant
emittance in the interval λ = 0 to λ
is only 25% of the total, which represents about the
max
amount of the sun’s radiation which lies inside the visible light spectrum.
#T559880; r. AL/45866/46124; en-US
478

33
Theory of thermography
Figure 33.7 Josef Stefan (1835–1893), and Ludwig Boltzmann (1844–1906)
Using the Stefan-Boltzmann formula to calculate the power radiated by the human body,
at a temperature of 300 K and an external surface area of approx. 2 m
2
, we obtain 1 kW.
This power loss could not be sustained if it were not for the compensating absorption of
radiation from surrounding surfaces, at room temperatures which do not vary too drastically from the temperature of the body – or, of course, the addition of clothing.
33.3.4 Non-blackbody emitters
So far, only blackbody radiators and blackbody radiation have been discussed. However,
real objects almost never comply with these laws over an extended wavelength region –
although they may approach the blackbody behavior in certain spectral intervals. For example, a certain type of white paint may appear perfectly white in the visible light spectrum, but becomes distinctly gray at about 2 μm, and beyond 3 μm it is almost black.
There are three processes which can occur that prevent a real object from acting like a
blackbody: a fraction of the incident radiation α may be absorbed, a fraction ρ may be reflected, and a fraction τ may be transmitted. Since all of these factors are more or less
wavelength dependent, the subscript λ is used to imply the spectral dependence of their
definitions. Thus:
• The spectral absorptance α
= the ratio of the spectral radiant power absorbed by an
λ
object to that incident upon it.
• The spectral reflectance ρ
= the ratio of the spectral radiant power reflected by an ob-
λ
ject to that incident upon it.
• The spectral transmittance τ
= the ratio of the spectral radiant power transmitted
λ
through an object to that incident upon it.
The sum of these three factors must always add up to the whole at any wavelength, so
we have the relation:
For opaque materials τλ= 0 and the relation simplifies to:
Another factor, called the emissivity, is required to describe the fraction ε of the radiant
emittance of a blackbody produced by an object at a specific temperature. Thus, we
have the definition:
The spectral emissivity ε
= the ratio of the spectral radiant power from an object to that
λ
from a blackbody at the same temperature and wavelength.
Expressed mathematically, this can be written as the ratio of the spectral emittance of
the object to that of a blackbody as follows:
Generally speaking, there are three types of radiation source, distinguished by the ways
in which the spectral emittance of each varies with wavelength.
• A blackbody, for which ε
• A graybody, for which ε
#T559880; r. AL/45866/46124; en-US
= ε = 1
λ
= ε = constant less than 1
λ
479

33
Theory of thermography
• A selective radiator, for which ε varies with wavelength
According to Kirchhoff’s law, for any material the spectral emissivity and spectral absorp-
tance of a body are equal at any specified temperature and wavelength. That is:
From this we obtain, for an opaque material (since αλ+ ρλ= 1):
For highly polished materials ελapproaches zero, so that for a perfectly reflecting material (i.e. a perfect mirror) we have:
For a graybody radiator, the Stefan-Boltzmann formula becomes:
This states that the total emissive power of a graybody is the same as a blackbody at the
same temperature reduced in proportion to the value of ε from the graybody.
Figure 33.8 Spectral radiant emittance of three types of radiators. 1: Spectral radiant emittance; 2: Wavelength; 3: Blackbody; 4: Selective radiator; 5: Graybody.
Figure 33.9 Spectral emissivity of three types of radiators. 1: Spectral emissivity; 2: Wavelength; 3: Blackbody; 4: Graybody; 5: Selective radiator.
#T559880; r. AL/45866/46124; en-US
480

33
Theory of thermography
33.4 Infrared semi-transparent materials
Consider now a non-metallic, semi-transparent body – let us say, in the form of a thick flat
plate of plastic material. When the plate is heated, radiation generated within its volume
must work its way toward the surfaces through the material in which it is partially absorbed. Moreover, when it arrives at the surface, some of it is reflected back into the interior. The back-reflected radiation is again partially absorbed, but some of it arrives at the
other surface, through which most of it escapes; part of it is reflected back again.
Although the progressive reflections become weaker and weaker they must all be added
up when the total emittance of the plate is sought. When the resulting geometrical series
is summed, the effective emissivity of a semi-transparent plate is obtained as:
When the plate becomes opaque this formula is reduced to the single formula:
This last relation is a particularly convenient one, because it is often easier to measure
reflectance than to measure emissivity directly.
#T559880; r. AL/45866/46124; en-US
481

34
The measurement formula
As already mentioned, when viewing an object, the camera receives radiation not only
from the object itself. It also collects radiation from the surroundings reflected via the object surface. Both these radiation contributions become attenuated to some extent by the
atmosphere in the measurement path. To this comes a third radiation contribution from
the atmosphere itself.
This description of the measurement situation, as illustrated in the figure below, is so far
a fairly true description of the real conditions. What has been neglected could for instance be sun light scattering in the atmosphere or stray radiation from intense radiation
sources outside the field of view. Such disturbances are difficult to quantify, however, in
most cases they are fortunately small enough to be neglected. In case they are not negligible, the measurement configuration is likely to be such that the risk for disturbance is
obvious, at least to a trained operator. It is then his responsibility to modify the measurement situation to avoid the disturbance e.g. by changing the viewing direction, shielding
off intense radiation sources etc.
Accepting the description above, we can use the figure below to derive a formula for the
calculation of the object temperature from the calibrated camera output.
Figure 34.1 A schematic representation of the general thermographic measurement situation.1: Surroundings; 2: Object; 3: Atmosphere; 4: Camera
Assume that the received radiation power W from a blackbody source of temperature
T
on short distance generates a camera output signal U
source
the power input (power linear camera). We can then write (Equation 1):
or, with simplified notation:
where C is a constant.
Should the source be a graybody with emittance ε, the received radiation would conse-
quently be εW
We are now ready to write the three collected radiation power terms:
1. Emission from the object = ετW
transmittance of the atmosphere. The object temperature is T
source
.
, where ε is the emittance of the object and τ is the
obj
that is proportional to
source
.
obj
#T559880; r. AL/45866/46124; en-US
482

34
The measurement formula
2. Reflected emission from ambient sources = (1 – ε)τW
tance of the object. The ambient sources have the temperature T
It has here been assumed that the temperature T
, where (1 – ε) is the reflec-
refl
.
refl
is the same for all emitting surfa-
refl
ces within the halfsphere seen from a point on the object surface. This is of course
sometimes a simplification of the true situation. It is, however, a necessary simplification in order to derive a workable formula, and T
can – at least theoretically – be giv-
refl
en a value that represents an efficient temperature of a complex surrounding.
Note also that we have assumed that the emittance for the surroundings = 1. This is
correct in accordance with Kirchhoff’s law: All radiation impinging on the surrounding
surfaces will eventually be absorbed by the same surfaces. Thus the emittance = 1.
(Note though that the latest discussion requires the complete sphere around the object to be considered.)
3. Emission from the atmosphere = (1 – τ)τW
mosphere. The temperature of the atmosphere is T
, where (1 – τ) is the emittance of the at-
atm
atm
.
The total received radiation power can now be written (Equation 2):
We multiply each term by the constant C of Equation 1 and replace the CW products by
the corresponding U according to the same equation, and get (Equation 3):
Solve Equation 3 for U
(Equation 4):
obj
This is the general measurement formula used in all the FLIR Systems thermographic
equipment. The voltages of the formula are:
Table 34.1 Voltages
U
obj
U
tot
U
refl
U
atm
Calculated camera output voltage for a blackbody of temperature
i.e. a voltage that can be directly converted into true requested
T
obj
object temperature.
Measured camera output voltage for the actual case.
Theoretical camera output voltage for a blackbody of temperature
T
according to the calibration.
refl
Theoretical camera output voltage for a blackbody of temperature
according to the calibration.
T
atm
The operator has to supply a number of parameter values for the calculation:
• the object emittance ε,
• the relative humidity,
• T
atm
• object distance (D
obj
)
• the (effective) temperature of the object surroundings, or the reflected ambient tem-
perature T
• the temperature of the atmosphere T
refl
, and
atm
This task could sometimes be a heavy burden for the operator since there are normally
no easy ways to find accurate values of emittance and atmospheric transmittance for the
actual case. The two temperatures are normally less of a problem provided the surroundings do not contain large and intense radiation sources.
A natural question in this connection is: How important is it to know the right values of
these parameters? It could though be of interest to get a feeling for this problem already
here by looking into some different measurement cases and compare the relative
#T559880; r. AL/45866/46124; en-US
483

34
The measurement formula
magnitudes of the three radiation terms. This will give indications about when it is important to use correct values of which parameters.
The figures below illustrates the relative magnitudes of the three radiation contributions
for three different object temperatures, two emittances, and two spectral ranges: SW and
LW. Remaining parameters have the following fixed values:
• τ = 0.88
• T
= +20°C (+68°F)
refl
• T
= +20°C (+68°F)
atm
It is obvious that measurement of low object temperatures are more critical than measuring high temperatures since the ‘disturbing’ radiation sources are relatively much stronger in the first case. Should also the object emittance be low, the situation would be still
more difficult.
We have finally to answer a question about the importance of being allowed to use the
calibration curve above the highest calibration point, what we call extrapolation. Imagine
that we in a certain case measure U
= 4.5 volts. The highest calibration point for the
tot
camera was in the order of 4.1 volts, a value unknown to the operator. Thus, even if the
object happened to be a blackbody, i.e. U
obj
= U
, we are actually performing extrapola-
tot
tion of the calibration curve when converting 4.5 volts into temperature.
Let us now assume that the object is not black, it has an emittance of 0.75, and the trans-
mittance is 0.92. We also assume that the two second terms of Equation 4 amount to 0.5
volts together. Computation of U
by means of Equation 4 then results in U
obj
obj
= 4.5 /
0.75 / 0.92 – 0.5 = 6.0. This is a rather extreme extrapolation, particularly when considering that the video amplifier might limit the output to 5 volts! Note, though, that the application of the calibration curve is a theoretical procedure where no electronic or other
limitations exist. We trust that if there had been no signal limitations in the camera, and if
it had been calibrated far beyond 5 volts, the resulting curve would have been very much
the same as our real curve extrapolated beyond 4.1 volts, provided the calibration algorithm is based on radiation physics, like the FLIR Systems algorithm. Of course there
must be a limit to such extrapolations.
Figure 34.2 Relative magnitudes of radiation sources under varying measurement conditions (SW camera). 1: Object temperature; 2: Emittance; Obj: Object radiation; Refl: Reflected radiation; Atm: atmosphere radiation. Fixed parameters: τ = 0.88; T
#T559880; r. AL/45866/46124; en-US
= 20°C (+68°F); T
refl
= 20°C (+68°F).
atm
484

34
The measurement formula
Figure 34.3 Relative magnitudes of radiation sources under varying measurement conditions (LW cam-
era). 1: Object temperature; 2: Emittance; Obj: Object radiation; Refl: Reflected radiation; Atm: atmosphere radiation. Fixed parameters: τ = 0.88; T
= 20°C (+68°F); T
refl
= 20°C (+68°F).
atm
#T559880; r. AL/45866/46124; en-US
485

35
Emissivity tables
This section presents a compilation of emissivity data from the infrared literature and
measurements made by FLIR Systems.
35.1 References
1. Mikaél A. Bramson: Infrared Radiation, A Handbook for Applications, Plenum press,
N.Y.
2. William L. Wolfe, George J. Zissis: The Infrared Handbook, Office of Naval Research,
Department of Navy, Washington, D.C.
3. Madding, R. P.: Thermographic Instruments and systems. Madison, Wisconsin: Uni-
versity of Wisconsin – Extension, Department of Engineering and Applied Science.
4. William L. Wolfe: Handbook of Military Infrared Technology, Office of Naval Research,
Department of Navy, Washington, D.C.
5. Jones, Smith, Probert: External thermography of buildings..., Proc. of the Society of
Photo-Optical Instrumentation Engineers, vol.110, Industrial and Civil Applications of
Infrared Technology, June 1977 London.
6. Paljak, Pettersson: Thermography of Buildings, Swedish Building Research Institute,
Stockholm 1972.
7. Vlcek, J: Determination of emissivity with imaging radiometers and some emissivities
at λ = 5 µm. Photogrammetric Engineering and Remote Sensing.
8. Kern: Evaluation of infrared emission of clouds and ground as measured by weather
satellites, Defence Documentation Center, AD 617 417.
9. Öhman, Claes: Emittansmätningar med AGEMA E-Box. Teknisk rapport, AGEMA
1999. (Emittance measurements using AGEMA E-Box. Technical report, AGEMA
1999.)
10. Matteï, S., Tang-Kwor, E: Emissivity measurements for Nextel Velvet coating 811-21
between –36°C AND 82°C.
11. Lohrengel & Todtenhaupt (1996)
12. ITC Technical publication 32.
13. ITC Technical publication 29.
14. Schuster, Norbert and Kolobrodov, Valentin G. Infrarotthermographie. Berlin: Wiley-
VCH, 2000.
Note The emissivity values in the table below are recorded using a shortwave (SW)
camera. The values should be regarded as recommendations only and used with
caution.
35.2 Tables
Table 35.1 T: Total spectrum; SW: 2–5 µm; LW: 8–14 µm, LLW: 6.5–20 µm; 1: Material; 2: Specification;
3:Temperature in °C; 4: Spectrum; 5: Emissivity: 6:Reference
1 2 3 4 5 6
3M type 35 Vinyl electrical
3M type 88 Black vinyl electri-
3M type 88 Black vinyl electri-
3M type Super 33
+
Aluminum anodized sheet 100 T 0.55 2
Aluminum anodized, black,
Aluminum anodized, black,
#T559880; r. AL/45866/46124; en-US
tape (several
colors)
cal tape
cal tape
Black vinyl electrical tape
dull
dull
< 80 LW ≈ 0.96 13
< 105 LW ≈ 0.96 13
< 105 MW < 0.96 13
< 80 LW ≈ 0.96 13
70
70 LW 0.95 9
SW
0.67 9
486

Emissivity tables35
Table 35.1 T: Total spectrum; SW: 2–5 µm; LW: 8–14 µm, LLW: 6.5–20 µm; 1: Material; 2: Specification;
3:Temperature in °C; 4: Spectrum; 5: Emissivity: 6:Reference (continued)
1 2 3 4 5 6
Aluminum anodized, light
70
SW
gray, dull
Aluminum anodized, light
70 LW 0.97 9
gray, dull
Aluminum as received, plate 100 T 0.09 4
Aluminum as received,
100 T 0.09 2
sheet
Aluminum cast, blast
70
SW
cleaned
Aluminum cast, blast
70 LW 0.46 9
cleaned
Aluminum dipped in HNO
100 T 0.05 4
,
3
plate
Aluminum foil
Aluminum foil
27 10 µm 0.04 3
27 3 µm 0.09 3
Aluminum oxidized, strongly 50–500 T 0.2–0.3 1
Aluminum polished 50–100 T 0.04–0.06 1
Aluminum polished plate 100 T 0.05 4
Aluminum polished, sheet 100 T 0.05 2
Aluminum rough surface
20–50 T 0.06–0.07 1
Aluminum roughened 27 10 µm 0.18 3
Aluminum roughened 27 3 µm 0.28 3
Aluminum sheet, 4 samples
70
SW
differently
scratched
Aluminum sheet, 4 samples
70 LW 0.03–0.06 9
differently
scratched
Aluminum
vacuum
20 T 0.04 2
deposited
Aluminum weathered,
17
SW
heavily
Aluminum bronze 20 T 0.60 1
Aluminum
powder T 0.28 1
hydroxide
Aluminum oxide activated, powder T 0.46 1
Aluminum oxide pure, powder
T 0.16 1
(alumina)
Asbestos board 20 T 0.96 1
Asbestos fabric T 0.78 1
Asbestos floor tile
Asbestos
paper 40–400 T 0.93–0.95 1
35
SW
Asbestos powder T 0.40–0.60 1
Asbestos slate 20 T 0.96 1
Asphalt paving 4 LLW 0.967 8
Brass dull, tarnished 20–350 T 0.22 1
Brass oxidized 100 T 0.61 2
Brass oxidized 70
SW
0.61 9
0.47 9
0.05–0.08 9
0.83–0.94 5
0.94 7
0.04–0.09 9
#T559880; r. AL/45866/46124; en-US
487

Emissivity tables35
Table 35.1 T: Total spectrum; SW: 2–5 µm; LW: 8–14 µm, LLW: 6.5–20 µm; 1: Material; 2: Specification;
3:Temperature in °C; 4: Spectrum; 5: Emissivity: 6:Reference (continued)
1 2 3 4 5 6
Brass oxidized 70 LW 0.03–0.07 9
Brass oxidized at 600°C
Brass polished 200 T 0.03 1
Brass polished, highly 100 T 0.03 2
Brass rubbed with 80-
grit emery
Brass sheet, rolled 20 T 0.06 1
Brass sheet, worked
with emery
Brick alumina 17
Brick
common 17
Brick Dinas silica,
glazed, rough
Brick Dinas silica,
refractory
Brick Dinas silica, un-
glazed, rough
Brick firebrick
Brick fireclay
Brick fireclay
Brick fireclay
Brick
Brick
masonry 35
masonry,
plastered
Brick red, common 20 T 0.93 2
Brick red, rough 20 T 0.88–0.93 1
Brick refractory,
corundum
Brick refractory,
magnesite
Brick refractory,
strongly radiating
Brick refractory, weakly
radiating
Brick
silica, 95% SiO
Brick sillimanite, 33%
SiO
, 64% Al2O
2
Brick waterproof
Bronze phosphor bronze 70
Bronze phosphor bronze 70 LW 0.06 9
Bronze polished 50 T 0.1 1
Bronze porous, rough 50–150 T 0.55 1
Bronze powder T 0.76–0.80 1
Carbon candle soot 20 T 0.95 2
Carbon charcoal powder T 0.96 1
Carbon
graphite powder T 0.97 1
200–600 T 0.59–0.61 1
20 T 0.20 2
20 T 0.2 1
SW
SW
0.68 5
0.86–0.81 5
1100 T 0.85 1
1000 T 0.66 1
1000 T 0.80 1
17
SW
0.68 5
1000 T 0.75 1
1200 T 0.59 1
20 T 0.85 1
SW
0.94 7
20 T 0.94 1
1000 T 0.46 1
1000–1300 T 0.38 1
500–1000 T 0.8–0.9 1
500–1000 T 0.65–0.75 1
1230 T 0.66 1
2
1500 T 0.29 1
3
17
SW
SW
0.87 5
0.08 9
#T559880; r. AL/45866/46124; en-US
488

Emissivity tables35
Table 35.1 T: Total spectrum; SW: 2–5 µm; LW: 8–14 µm, LLW: 6.5–20 µm; 1: Material; 2: Specification;
3:Temperature in °C; 4: Spectrum; 5: Emissivity: 6:Reference (continued)
1 2 3 4 5 6
Carbon graphite, filed
Carbon
Chipboard untreated 20 SW
Chromium polished 50 T 0.10 1
Chromium
Clay fired
Cloth
Concrete
Concrete dry 36 SW
Concrete
Concrete
Copper commercial,
Copper
Copper electrolytic,
Copper
Copper
Copper
Copper oxidized, black 27 T 0.78 4
Copper oxidized, heavily 20 T 0.78 2
Copper polished 50–100 T 0.02 1
Copper polished 100 T 0.03 2
Copper polished,
Copper
Copper pure, carefully
Copper
Copper dioxide
Copper oxide
Ebonite T 0.89 1
Emery
Enamel 20 T 0.9 1
Enamel lacquer 20 T 0.85–0.95 1
Fiber board hard, untreated 20
Fiber board masonite 70
Fiber board masonite 70 LW 0.88 9
Fiber board particle board 70
Fiber board particle board 70 LW 0.89 9
Fiber board porous, untreated 20
surface
lampblack 20–400 T 0.95–0.97 1
polished 500–1000 T 0.28–0.38 1
black 20 T 0.98 1
rough 17
walkway
burnished
electrolytic, care-
fully polished
polished
molten 1100–1300 T 0.13–0.15 1
oxidized 50 T 0.6–0.7 1
oxidized to
blackness
commercial
polished,
mechanical
prepared surface
scraped 27 T 0.07 4
powder T 0.84 1
red, powder T 0.70 1
coarse 80 T 0.85 1
20 T 0.98 2
0.90 6
70 T 0.91 1
20 T 0.92 2
0.95 7
SW
5
20 T 0.07 1
80 T 0.018 1
–34 T 0.006 4
27 T 0.03 4
22 T 0.015 4
22 T 0.008 4
LLW 0.974 8
T 0.88 1
SW
SW
SW
SW
0.97 5
0.85 6
0.75 9
0.77 9
0.85 6
#T559880; r. AL/45866/46124; en-US
489

Emissivity tables35
Table 35.1 T: Total spectrum; SW: 2–5 µm; LW: 8–14 µm, LLW: 6.5–20 µm; 1: Material; 2: Specification;
3:Temperature in °C; 4: Spectrum; 5: Emissivity: 6:Reference (continued)
1 2 3 4 5 6
Glass pane (float
glass)
Gold
Gold polished, carefully
Gold
Granite polished 20 LLW 0.849 8
Granite
Granite rough, 4 different
Granite rough, 4 different
Gypsum
Ice: See Water
Iron and steel cold rolled 70
Iron and steel cold rolled 70 LW 0.09 9
Iron and steel covered with red
Iron and steel electrolytic 100 T 0.05 4
Iron and steel electrolytic 22 T 0.05 4
Iron and steel electrolytic 260 T 0.07 4
Iron and steel electrolytic, care-
Iron and steel freshly worked
Iron and steel ground sheet 950–1100 T 0.55–0.61 1
Iron and steel heavily rusted
Iron and steel hot rolled 130 T 0.60 1
Iron and steel hot rolled 20 T 0.77 1
Iron and steel oxidized 100 T 0.74 4
Iron and steel oxidized 100 T 0.74 1
Iron and steel oxidized 1227 T 0.89 4
Iron and steel oxidized 125–525 T 0.78–0.82 1
Iron and steel oxidized 200 T 0.79 2
Iron and steel oxidized 200–600 T 0.80 1
Iron and steel oxidized strongly 50 T 0.88 1
Iron and steel oxidized strongly 500 T 0.98 1
Iron and steel polished 100 T 0.07 2
Iron and steel polished 400–1000 T 0.14–0.38 1
Iron and steel polished sheet 750–1050 T 0.52–0.56 1
Iron and steel rolled sheet 50 T 0.56 1
Iron and steel rolled, freshly
Iron and steel rough, plane
Iron and steel rusted red, sheet 22 T 0.69 4
Iron and steel rusted, heavily 17
non-coated 20 LW 0.97 14
polished 130 T 0.018 1
200–600 T 0.02–0.03 1
polished, highly 100 T 0.02 2
rough 21 LLW 0.879 8
samples
samples
rust
fully polished
with emery
sheet
surface
70
70 LW 0.77–0.87 9
20 T 0.8–0.9 1
20 T 0.61–0.85 1
175–225 T 0.05–0.06 1
20 T 0.24 1
20 T 0.69 2
20 T 0.24 1
50 T 0.95–0.98 1
SW
SW
SW
0.95–0.97 9
0.20 9
0.96 5
#T559880; r. AL/45866/46124; en-US
490

Emissivity tables35
Table 35.1 T: Total spectrum; SW: 2–5 µm; LW: 8–14 µm, LLW: 6.5–20 µm; 1: Material; 2: Specification;
3:Temperature in °C; 4: Spectrum; 5: Emissivity: 6:Reference (continued)
1 2 3 4 5 6
Iron and steel rusty, red 20 T 0.69 1
Iron and steel shiny oxide layer,
Iron and steel shiny, etched 150 T 0.16 1
Iron and steel wrought, carefully
Iron galvanized heavily oxidized 70
Iron galvanized heavily oxidized 70 LW 0.85 9
Iron galvanized sheet 92 T 0.07 4
Iron galvanized sheet, burnished 30 T 0.23 1
Iron galvanized sheet, oxidized 20 T 0.28 1
Iron tinned sheet 24 T 0.064 4
Iron, cast casting 50 T 0.81 1
Iron, cast ingots 1000 T 0.95 1
Iron, cast liquid 1300 T 0.28 1
Iron, cast machined 800–1000 T 0.60–0.70 1
Iron, cast oxidized 100 T 0.64 2
Iron, cast oxidized 260 T 0.66 4
Iron, cast oxidized 38 T 0.63 4
Iron, cast oxidized 538 T 0.76 4
Iron, cast oxidized at 600°C
Iron, cast polished 200 T 0.21 1
Iron, cast polished 38 T 0.21 4
Iron, cast polished 40 T 0.21 2
Iron, cast unworked 900–1100 T 0.87–0.95 1
Krylon Ultra-flat
black 1602
Krylon Ultra-flat
black 1602
Lacquer 3 colors sprayed
Lacquer 3 colors sprayed
Lacquer Aluminum on
Lacquer bakelite 80 T 0.83 1
Lacquer black, dull 40–100 T 0.96–0.98 1
Lacquer black, matte 100 T 0.97 2
Lacquer black, shiny,
Lacquer heat–resistant 100 T 0.92 1
Lacquer white 100 T 0.92 2
Lacquer white 40–100 T 0.8–0.95 1
Lead oxidized at 200°C
Lead oxidized, gray 20 T 0.28 1
sheet,
polished
Flat black Room tempera-
Flat black Room tempera-
on Aluminum
on Aluminum
rough surface
sprayed on iron
20 T 0.82 1
40–250 T 0.28 1
SW
200–600 T 0.64–0.78 1
ture up to 175
ture up to 175
70
70 LW 0.92–0.94 9
20 T 0.4 1
20 T 0.87 1
200 T 0.63 1
LW ≈ 0.96 12
MW ≈ 0.97 12
SW
0.64 9
0.50–0.53 9
#T559880; r. AL/45866/46124; en-US
491

Emissivity tables35
Table 35.1 T: Total spectrum; SW: 2–5 µm; LW: 8–14 µm, LLW: 6.5–20 µm; 1: Material; 2: Specification;
3:Temperature in °C; 4: Spectrum; 5: Emissivity: 6:Reference (continued)
1 2 3 4 5 6
Lead oxidized, gray 22 T 0.28 4
Lead shiny 250 T 0.08 1
Lead unoxidized,
Lead red 100 T 0.93 4
Lead red, powder 100 T 0.93 1
Leather tanned T 0.75–0.80 1
Lime T 0.3–0.4 1
Magnesium 22 T 0.07 4
Magnesium 260 T 0.13 4
Magnesium 538 T 0.18 4
Magnesium polished 20 T 0.07 2
Magnesium
powder
Molybdenum 1500–2200 T 0.19–0.26 1
Molybdenum 600–1000 T 0.08–0.13 1
Molybdenum filament
Mortar 17
Mortar dry 36
Nextel Velvet
811-21 Black
Nichrome rolled 700 T 0.25 1
Nichrome sandblasted 700 T 0.70 1
Nichrome wire, clean 50 T 0.65 1
Nichrome wire, clean 500–1000 T 0.71–0.79 1
Nichrome wire, oxidized 50–500 T 0.95–0.98 1
Nickel bright matte 122 T 0.041 4
Nickel commercially
Nickel commercially
Nickel electrolytic 22 T 0.04 4
Nickel electrolytic 260 T 0.07 4
Nickel electrolytic 38 T 0.06 4
Nickel electrolytic 538 T 0.10 4
Nickel electroplated on
Nickel electroplated on
Nickel electroplated on
Nickel electroplated,
Nickel oxidized 1227 T 0.85 4
Nickel oxidized 200 T 0.37 2
Nickel oxidized 227 T 0.37 4
polished
Flat black –60–150 LW > 0.97 10 and
pure, polished
pure, polished
iron, polished
iron, unpolished
iron, unpolished
polished
100 T 0.05 4
T 0.86 1
700–2500 T 0.1–0.3 1
SW
SW
100 T 0.045 1
200–400 T 0.07–0.09 1
22 T 0.045 4
20 T 0.11–0.40 1
22 T 0.11 4
20 T 0.05 2
0.87 5
0.94 7
11
#T559880; r. AL/45866/46124; en-US
492

Emissivity tables35
Table 35.1 T: Total spectrum; SW: 2–5 µm; LW: 8–14 µm, LLW: 6.5–20 µm; 1: Material; 2: Specification;
3:Temperature in °C; 4: Spectrum; 5: Emissivity: 6:Reference (continued)
1 2 3 4 5 6
Nickel
Nickel polished 122 T 0.045 4
Nickel wire 200–1000 T 0.1–0.2 1
Nickel oxide 1000–1250 T 0.75–0.86 1
Nickel oxide 500–650 T 0.52–0.59 1
Oil, lubricating 0.025 mm film
Oil, lubricating 0.050 mm film
Oil, lubricating 0.125 mm film
Oil, lubricating film on Ni base:
Oil, lubricating thick coating 20 T 0.82 2
Paint 8 different colors
Paint 8 different colors
Paint Aluminum, vari-
Paint cadmium yellow T 0.28–0.33 1
Paint chrome green T 0.65–0.70 1
Paint cobalt blue T 0.7–0.8 1
Paint oil 17
Paint oil based, aver-
Paint oil, black flat
Paint oil, black gloss 20
Paint oil, gray flat
Paint oil, gray gloss 20
Paint oil, various colors 100 T 0.92–0.96 1
Paint plastic, black 20
Paint plastic, white 20
Paper 4 different colors
Paper 4 different colors
Paper black T 0.90 1
Paper black, dull T 0.94 1
Paper black, dull 70
Paper black, dull 70 LW 0.89 9
Paper blue, dark T 0.84 1
Paper coated with black
Paper
Paper red T 0.76 1
Paper white 20 T 0.7–0.9 1
Paper white bond 20 T 0.93 2
Paper white, 3 different
oxidized at 600°C
Ni base only
and qualities
and qualities
ous ages
age of 16 colors
lacquer
green
glosses
200–600 T 0.37–0.48 1
20 T 0.27 2
20 T 0.46 2
20 T 0.72 2
20 T 0.05 2
70
70 LW 0.92–0.94 9
50–100 T 0.27–0.67 1
100 T 0.94 2
20
20
70
70 LW 0.92–0.94 9
70
SW
SW
SW
SW
SW
SW
SW
SW
SW
SW
T 0.93 1
T 0.85 1
SW
0.88–0.96 9
0.87 5
0.94 6
0.92 6
0.97 6
0.96 6
0.95 6
0.84 6
0.68–0.74 9
0.86 9
0.76–0.78 9
#T559880; r. AL/45866/46124; en-US
493

Emissivity tables35
Table 35.1 T: Total spectrum; SW: 2–5 µm; LW: 8–14 µm, LLW: 6.5–20 µm; 1: Material; 2: Specification;
3:Temperature in °C; 4: Spectrum; 5: Emissivity: 6:Reference (continued)
1 2 3 4 5 6
Paper white, 3 different
Paper yellow T 0.72 1
Plaster 17
Plaster plasterboard,
Plaster rough coat 20 T 0.91 2
Plastic glass fibre lami-
Plastic glass fibre lami-
Plastic polyurethane iso-
Plastic polyurethane iso-
Plastic
Plastic
Platinum 100 T 0.05 4
Platinum 1000–1500 T 0.14–0.18 1
Platinum 1094 T 0.18 4
Platinum 17 T 0.016 4
Platinum 22 T 0.03 4
Platinum 260 T 0.06 4
Platinum 538 T 0.10 4
Platinum pure, polished 200–600 T 0.05–0.10 1
Platinum ribbon 900–1100 T 0.12–0.17 1
Platinum wire 1400 T 0.18 1
Platinum wire 500–1000 T 0.10–0.16 1
Platinum wire 50–200 T 0.06–0.07 1
Porcelain glazed 20 T 0.92 1
Porcelain white, shiny T 0.70–0.75 1
Rubber hard 20 T 0.95 1
Rubber soft, gray, rough
Sand T 0.60 1
Sand
Sandstone
Sandstone rough 19 LLW 0.935 8
Silver polished 100 T 0.03 2
Silver
Skin human 32 T 0.98 2
Slag boiler 0–100 T 0.97–0.93 1
Slag boiler 1400–1800 T 0.69–0.67 1
Slag
glosses
untreated
nate (printed circ.
board)
nate (printed circ.
board)
lation board
lation board
PVC, plastic floor,
dull, structured
PVC, plastic floor,
dull, structured
polished 19 LLW 0.909 8
pure, polished 200–600 T 0.02–0.03 1
boiler 200–500 T 0.89–0.78 1
70 LW 0.88–0.90 9
SW
20
70
70 LW 0.91 9
70 LW 0.55 9
70
70
70 LW 0.93 9
20 T 0.95 1
20 T 0.90 2
SW
SW
SW
SW
0.86 5
0.90 6
0.94 9
0.29 9
0.94 9
#T559880; r. AL/45866/46124; en-US
494

Emissivity tables35
Table 35.1 T: Total spectrum; SW: 2–5 µm; LW: 8–14 µm, LLW: 6.5–20 µm; 1: Material; 2: Specification;
3:Temperature in °C; 4: Spectrum; 5: Emissivity: 6:Reference (continued)
1 2 3 4 5 6
Slag
Snow: See Water
Soil
Soil saturated with
Stainless steel
Stainless steel rolled 700 T 0.45 1
Stainless steel
Stainless steel
Stainless steel sheet, polished 70 LW 0.14 9
Stainless steel
Stainless steel sheet, untreated,
Stainless steel type 18-8, buffed
Stainless steel
Stucco
Styrofoam
Tar T 0.79–0.84 1
Tar
Tile glazed 17
Tin burnished 20–50 T 0.04–0.06 1
Tin tin–plated sheet
Titanium
Titanium oxidized at 540°C
Titanium
Titanium polished 1000 T 0.36 1
Titanium polished 200 T 0.15 1
Titanium polished 500 T 0.20 1
Tungsten 1500–2200 T 0.24–0.31 1
Tungsten 200 T 0.05 1
Tungsten 600–1000 T 0.1–0.16 1
Tungsten filament
Varnish flat
Varnish on oak parquet
Varnish on oak parquet
Wallpaper slight pattern,
Wallpaper slight pattern, red 20
Water distilled 20 T 0.96 2
boiler 600–1200 T 0.76–0.70 1
dry 20 T 0.92 2
water
alloy, 8% Ni, 18%
Cr
sandblasted 700 T 0.70 1
sheet, polished 70
sheet, untreated,
somewhat
scratched
somewhat
scratched
type 18-8, oxidized at 800°C
rough, lime 10–90 T 0.91 1
insulation 37
paper 20 T 0.91–0.93 1
iron
oxidized at 540°C
oxidized at 540°C
floor
floor
light gray
20 T 0.95 2
500 T 0.35 1
SW
70
70 LW 0.28 9
20 T 0.16 2
60 T 0.85 2
100 T 0.07 2
1000 T 0.60 1
200 T 0.40 1
500 T 0.50 1
3300 T 0.39 1
20
70
70 LW 0.90–0.93 9
20
SW
SW
SW
SW
SW
SW
SW
0.18 9
0.30 9
0.60 7
0.94 5
0.93 6
0.90 9
0.85 6
0.90 6
#T559880; r. AL/45866/46124; en-US
495

Emissivity tables35
Table 35.1 T: Total spectrum; SW: 2–5 µm; LW: 8–14 µm, LLW: 6.5–20 µm; 1: Material; 2: Specification;
3:Temperature in °C; 4: Spectrum; 5: Emissivity: 6:Reference (continued)
1 2 3 4 5 6
Water frost crystals
Water ice, covered with
Water ice, smooth 0 T 0.97 1
Water ice, smooth –10 T 0.96 2
Water layer >0.1 mm
Water
Water
Wood 17
Wood 19 LLW 0.962 8
Wood ground T 0.5–0.7 1
Wood pine, 4 different
Wood pine, 4 different
Wood planed 20 T 0.8–0.9 1
Wood planed oak 20 T 0.90 2
Wood planed oak 70
Wood planed oak 70 LW 0.88 9
Wood plywood, smooth,
Wood plywood,
Wood white, damp 20 T 0.7–0.8 1
Zinc
Zinc oxidized surface
Zinc polished 200–300 T 0.04–0.05 1
Zinc sheet 50 T 0.20 1
heavy frost
thick
snow
snow –10 T 0.85 2
samples
samples
dry
untreated
oxidized at 400°C
–10 T 0.98 2
0 T 0.98 1
0–100 T 0.95–0.98 1
T 0.8 1
SW
70
70 LW 0.81–0.89 9
36
20
400 T 0.11 1
1000–1200 T 0.50–0.60 1
SW
SW
SW
SW
0.98 5
0.67–0.75 9
0.77 9
0.82 7
0.83 6
#T559880; r. AL/45866/46124; en-US
496

#T559880; r. AL/45866/46124; en-US
497

A note on the technical production of this publication
This publication was produced using XML — the eXtensible Markup Language. For more information
about XML, please visit http://www.w3.org/XML/
A note on the typeface used in this publication
This publication was typeset using Linotype Helvetica™ World. Helvetica™ was designed by Max
Miedinger (1910–1980)
LOEF (List Of Effective Files)
T501011.xml; en-US; AL; 45866; 2017-10-18
T505552.xml; en-US; 9599; 2013-11-05
T505469.xml; en-US; 39689; 2017-01-25
T505013.xml; en-US; 39689; 2017-01-25
T505652.xml; en-US; 39869; 2017-01-31
T505192.xml; en-US; 39872; 2017-01-31
T505193.xml; en-US; 39571; 2017-01-20
T505194.xml; en-US; 39872; 2017-01-31
T505653.xml; en-US; 39869; 2017-01-31
T505422.xml; en-US; 39571; 2017-01-20
T505654.xml; en-US; 39571; 2017-01-20
T505664.xml; en-US; 39571; 2017-01-20
T505655.xml; en-US; 39872; 2017-01-31
T505656.xml; en-US; 39869; 2017-01-31
T505657.xml; en-US; 39867; 2017-01-31
T505658.xml; en-US; 41842; 2017-04-03
T505411.xml; en-US; 39571; 2017-01-20
T505659.xml; en-US; 39867; 2017-01-31
T505660.xml; en-US; 39571; 2017-01-20
T505661.xml; en-US; 39867; 2017-01-31
T505662.xml; en-US; 39867; 2017-01-31
T505765.xml; en-US; 39867; 2017-01-31
T505663.xml; en-US; 39869; 2017-01-31
T505789.xml; en-US; 39871; 2017-01-31
T505476.xml; en-US; 39581; 2017-01-20
T505012.xml; en-US; 41563; 2017-03-23
T505007.xml; en-US; 42810; 2017-05-23
T506125.xml; en-US; 40753; 2017-03-02
T505000.xml; en-US; 39687; 2017-01-25
T505005.xml; en-US; 43349; 2017-06-14
T505001.xml; en-US; 41563; 2017-03-23
T505006.xml; en-US; 41563; 2017-03-23
T505002.xml; en-US; 39512; 2017-01-18
#T559880; r. AL/45866/46124; en-US
498


Website
last page
http://www.flir.com
Customer support
http://support.flir.com
Copyright
© 2017, FLIR Systems, Inc. All rights reserved worldwide.
Disclaimer
Specifications subject to change without further notice. Models and accessories subject to regional market considerations. License procedures may apply.
Products described herein may be subject to US Export Regulations. Please refer to exportquestions@flir.com with any questions.
Publ. No.: T559880
Release: AL
Commit:
Head: 46124
Language: en-US
Modified: 2017-10-18
Formatted: 2017-10-31
45866
 Loading...