

Page 1
User’s manual – Benutzerhandbuch – Manual del usuario – Manuel de l’utilisateur – Manuale dell’utente – Manual do utilizador – Felhas-
ználói kézikönyv – Käyttäjän opas –
Betjeningsvejledning – Brukerveiledning – Instrukcja obsługi – Bruksanvisning – Kullanım
Kılavuzu – Uživatelská příručka –
Gebruikershandleiding
User’s manual
FLIR i5
FLIR i7
T559382Publ. No.
a358Revision
English (EN)Language
June 23, 2009Issue date
Page 2

Page 3

User’s manual
Publ. No. T559382 Rev. a358 – ENGLISH (EN) – June 23, 2009
Page 4

Legal disclaimer
All products manufactured by FLIR Systemsarewarranted against defectivematerialsandworkmanship for aperiodof one(1)year from the
delivery date of the original purchase, provided such products have been under normal storage, use and service, and in accordance with
FLIR Systems instruction.
All products not manufactured by FLIR Systems included in systemsdelivered by FLIRSystems to the original purchaser carrythe warranty,
if any, of the particular supplier only and FLIR Systems has no responsibilitywhatsoever for such products.
The warranty extends only to the original purchaser and is not transferable. It is not applicable to any product which has been subjected to
misuse, neglect, accident or abnormal conditions of operation. Expendable parts are excluded from the warranty.
In the case of adefect inaproduct coveredbythis warrantytheproduct must notbe furtherusedin order toprevent additional damage.The
purchaser shall promptly report any defect to FLIR Systems or this warranty will not apply.
FLIR Systems will, at its option, repair or replace any such defective product free of charge if, upon inspection, it proves to be defective in
material or workmanship and provided that it is returned to FLIR Systems within the said one-year period.
FLIR Systems has no other obligation or liability for defects than those set forth above.
No other warranty is expressed or implied. FLIR Systems specifically disclaims the implied warranties of merchantability and fitness for a
particular purpose.
FLIR Systems shall not be liable for any direct, indirect, special, incidentalor consequential loss or damage, whether basedon contract, tort
or any other legal theory.
Copyright
© FLIR Systems,2009. All rights reservedworldwide. No parts ofthesoftware including source codemaybe reproduced, transmitted, transcribed
or translated into any language or computer language in any form or by any means, electronic, magnetic, optical, manual or otherwise,
without the prior written permission of FLIR Systems.
This manual must not, in whole or part, be copied, photocopied, reproduced,translated ortransmitted to any electronic medium or machine
readable form without prior consent, in writing, from FLIR Systems.
Names and marks appearing on the products herein are eitherregistered trademarksor trademarksof FLIR Systems and/or its subsidiaries.
All othertrademarks,trade names or companynames referenced herein areusedfor identification only andarethe property of theirrespective
owners.
Quality assurance
The Quality Management System under which these products are developed and manufactured has been certified in accordance with the
ISO 9001 standard.
FLIR Systems is committed to a policy of continuous development; therefore we reserve the right to make changes and improvements on
any of the products described in this manual without prior notice.
Patents
One or several of the following patents or design patents apply to the products and/or features described in this manual:
0002258-2; 000279476-0001;000439161;000499579-0001; 000653423; 000726344; 000859020;0101577-5; 0102150-0; 0200629-4; 0300911-
5; 0302837-0; 1144833;1182246;1182620; 1188086; 1263438; 1285345; 1287138; 1299699;1325808;1336775;1678485;200530018812.0;
2106017; 235308; 3006596; 3006597; 466540; 483782; 484155; 518836; 60004227.8; 60122153.2; 602004011681.5-08; 6707044; 68657;
7034300; 7110035; 7154093; 7157705; 7237946; 7312822; 7332716; 7336823; 75530; D540838; D549758; DI6702302-9; DI6703574-4;
DM/057692; DM/061609;ZL00809178.1;ZL01823221.3; ZL01823226.4; ZL02331553.9; ZL02331554.7;ZL200530120994.2; ZL200630130114.4;
ZL200730151141.4.
EULA Terms
You have acquired a device (“INFRARED CAMERA”) that includes software licensed by FLIR Systems AB from Microsoft Licensing, GP
■
or its affiliates (“MS”). Those installed software products of MS origin, as well as associated media, printed materials, and “online” or
electronic documentation(“SOFTWARE”)are protected by internationalintellectualproperty laws and treaties.TheSOFTWARE is licensed,
not sold. All rights reserved.
IF YOU DO NOTAGREE TO THISENDUSER LICENSE AGREEMENT(“EULA”), DO NOTUSETHE DEVICE ORCOPYTHESOFTWARE.
■
INSTEAD, PROMPTLY CONTACT FLIR Systems AB FOR INSTRUCTIONS ON RETURN OF THE UNUSED DEVICE(S) FOR A REFUND.
ANY USE OF THE SOFTWARE, INCLUDING BUT NOT LIMITED TO USE ON THE DEVICE, WILL CONSTITUTE YOUR AGREEMENT
TO THIS EULA (OR RATIFICATION OF ANY PREVIOUS CONSENT).
GRANT OF SOFTWARE LICENSE. This EULA grants you the following license:
■
You may use the SOFTWARE only on the DEVICE.
■
NOT FAULT TOLERANT. THE SOFTWARE IS NOT FAULT TOLERANT. FLIR Systems AB HAS INDEPENDENTLY DETERMINED
■
HOW TOUSE THE SOFTWAREIN THE DEVICE,AND MS HASRELIED UPON FLIRSystems AB TOCONDUCT SUFFICIENT TESTING
TO DETERMINE THAT THE SOFTWARE IS SUITABLE FOR SUCH USE.
iv Publ. No. T559382 Rev. a358 – ENGLISH (EN) – June 23, 2009
Page 5

NO WARRANTIES FOR THE SOFTWARE. THE SOFTWARE is provided “AS IS” and with all faults. THE ENTIRE RISK AS TO SAT-
■
ISFACTORY QUALITY, PERFORMANCE, ACCURACY, AND EFFORT (INCLUDING LACK OF NEGLIGENCE) IS WITH YOU. ALSO,
THERE ISNO WARRANTY AGAINSTINTERFERENCE WITH YOURENJOYMENT OF THESOFTWAREOR AGAINST INFRINGEMENT.
IF YOU HAVE RECEIVED ANY WARRANTIES REGARDING THE DEVICE OR THE SOFTWARE, THOSE WARRANTIES DO NOT
ORIGINATE FROM, AND ARE NOT BINDING ON, MS.
No Liability for Certain Damages. EXCEPT AS PROHIBITED BY LAW, MS SHALL HAVE NO LIABILITY FOR ANY INDIRECT,
■
SPECIAL, CONSEQUENTIAL OR INCIDENTAL DAMAGES ARISING FROM OR IN CONNECTION WITH THE USE OR PERFORMANCE OF THE SOFTWARE. THIS LIMITATION SHALL APPLY EVEN IF ANY REMEDY FAILS OF ITS ESSENTIAL PURPOSE.
IN NO EVENT SHALL MS BE LIABLE FOR ANY AMOUNT IN EXCESS OF U.S. TWO HUNDRED FIFTY DOLLARS (U.S.$250.00).
Limitations on Reverse Engineering, Decompilation, and Disassembly. Youmay not reverse engineer, decompile, ordisassemble
■
the SOFTWARE, exceptand only to the extentthat such activity isexpresslypermitted by applicable lawnotwithstandingthis limitation.
SOFTWARE TRANSFER ALLOWED BUT WITH RESTRICTIONS. Youmaypermanentlytransferrights under this EULA only aspart
■
of a permanent sale or transfer of the Device, and only if the recipient agrees to this EULA. If the SOFTWARE is an upgrade, any
transfer must also include all prior versions of the SOFTWARE.
EXPORT RESTRICTIONS. You acknowledge that SOFTWARE is subject to U.S. export jurisdiction. You agree to comply with all
■
applicable international andnationallawsthatapplytotheSOFTWARE, includingthe U.S. Export Administration Regulations,aswell
as end-user, end-use and destination restrictions issued by U.S. and other governments. For additional information see
http://www.microsoft.com/exporting/.
Publ. No. T559382 Rev. a358 – ENGLISH (EN) – June 23, 2009
Page 6

vi Publ. No. T559382 Rev. a358 – ENGLISH (EN) – June 23, 2009
Page 7

Table of contents
11 Warnings & Cautions .....................................................................................................................
32 Notice to user ..................................................................................................................................
43 Customer help ................................................................................................................................
54 Documentation updates .................................................................................................................
65 Important note about this manual .................................................................................................
76 Quick Start Guide ...........................................................................................................................
97 Packing list ......................................................................................................................................
108 Camera parts ..................................................................................................................................
139 Screen elements ............................................................................................................................
1510 Connectors and storage media ....................................................................................................
1611 Using the camera ............................................................................................................................
1611.1 Installing the battery .............................................................................................................
1711.2 Charging the battery .............................................................................................................
1911.3 Saving an image ...................................................................................................................
2011.4 Recalling an image ...............................................................................................................
2111.5 Opening the image archive ..................................................................................................
2211.6 Deleting an image .................................................................................................................
2311.7 Deleting all images ...............................................................................................................
2411.8 Measuring a temperature using a spotmeter .......................................................................
2511.9 Measuring a temperature using an area ..............................................................................
2611.10 Marking all areas above or below a set temperature level ..................................................
2711.11 Changing the color palette ...................................................................................................
2811.12 Changing the settings ..........................................................................................................
2911.13 Changing the image mode ...................................................................................................
3011.14 Setting the surface properties ..............................................................................................
3111.15 Changing the emissivity .......................................................................................................
3211.16 Changing the reflected apparent temperature ....................................................................
3311.17 Resetting the camera ............................................................................................................
3411.18 Finding the serial number of the camera .............................................................................
3512 Cleaning the camera ......................................................................................................................
3512.1 Camera housing, cables, and other items ...........................................................................
3612.2 Infrared lens ..........................................................................................................................
3713 Technical data .................................................................................................................................
3713.1 Camera data .........................................................................................................................
4013.2 Additional data ......................................................................................................................
4213.3 Accessories data ..................................................................................................................
4314 Dimensions ......................................................................................................................................
4314.1 Camera (front) ......................................................................................................................
4414.2 Camera (side) .......................................................................................................................
Publ. No. T559382 Rev. a358 – ENGLISH (EN) – June 23, 2009 vii
Page 8

16.2.1.2 Guidelines for moisture detection, mold detection & detection of
water damages ..................................................................................
16.3.8 Excerpt from Technical Note ‘Assessing thermal bridging and insulation
continuity’ (UK example) ......................................................................................
4515 Application examples .....................................................................................................................
4515.1 Moisture & water damage ....................................................................................................
4615.2 Faulty contact in socket ........................................................................................................
4715.3 Oxidized socket ....................................................................................................................
4815.4 Insulation deficiencies ..........................................................................................................
4915.5 Draft ......................................................................................................................................
5016 Introduction to building thermography ........................................................................................
5016.1 Important note ......................................................................................................................
5016.2 Typical field investigations ....................................................................................................
5016.2.1 Guidelines .............................................................................................................
5016.2.1.1 General guidelines ............................................................................
51
5116.2.1.3 Guidelines for detection of air infiltration & insulation deficiencies ...
5216.2.2 About moisture detection .....................................................................................
5216.2.3 Moisture detection (1): Low-slope commercial roofs ..........................................
5216.2.3.1 General information ...........................................................................
5316.2.3.2 Safety precautions ............................................................................
5416.2.3.3 Commented building structures .......................................................
5516.2.3.4 Commented infrared images ............................................................
5716.2.4 Moisture detection (2): Commercial & residential façades ..................................
5716.2.4.1 General information ...........................................................................
5716.2.4.2 Commented building structures .......................................................
5916.2.4.3 Commented infrared images ............................................................
5916.2.5 Moisture detection (3): Decks & balconies ..........................................................
5916.2.5.1 General information ...........................................................................
6016.2.5.2 Commented building structures .......................................................
6216.2.5.3 Commented infrared images ............................................................
6216.2.6 Moisture detection (4): Plumbing breaks & leaks ................................................
6216.2.6.1 General information ...........................................................................
6316.2.6.2 Commented infrared images ............................................................
6516.2.7 Air infiltration .........................................................................................................
6516.2.7.1 General information ...........................................................................
6516.2.7.2 Commented building structures .......................................................
6716.2.7.3 Commented infrared images ............................................................
6816.2.8 Insulation deficiencies ..........................................................................................
6816.2.8.1 General information ...........................................................................
6816.2.8.2 Commented building structures .......................................................
7016.2.8.3 Commented infrared images ............................................................
7216.3 Theory of building science ...................................................................................................
7216.3.1 General information ..............................................................................................
7316.3.2 The effects of testing and checking .....................................................................
7416.3.3 Sources of disruption in thermography ................................................................
7616.3.4 Surface temperature and air leaks .......................................................................
7616.3.4.1 Pressure conditions in a building .....................................................
8216.3.5 Measuring conditions & measuring season .........................................................
8216.3.6 Interpretation of infrared images ..........................................................................
8416.3.7 Humidity & dew point ...........................................................................................
8416.3.7.1 Relative & absolute humidity ............................................................
8516.3.7.2 Definition of dew point ......................................................................
85
viii Publ. No. T559382 Rev. a358 – ENGLISH (EN) – June 23, 2009
Page 9

8516.3.8.1 Credits ...............................................................................................
8616.3.8.2 Introduction .......................................................................................
8616.3.8.3 Background information ...................................................................
8716.3.8.4 Quantitative appraisal of thermal anomalies ....................................
9016.3.8.5 Conditions and equipment ...............................................................
9116.3.8.6 Survey and analysis ..........................................................................
9216.3.8.7 Reporting ...........................................................................................
9416.4 Disclaimer .............................................................................................................................
9416.4.1 Copyright notice ...................................................................................................
9416.4.2 Training & certification ..........................................................................................
9416.4.3 National or regional building codes .....................................................................
9517 Introduction to thermographic inspections of electrical installations ......................................
9517.1 Important note ......................................................................................................................
9517.2 General information ..............................................................................................................
9517.2.1 Introduction ...........................................................................................................
9617.2.2 General equipment data .......................................................................................
9717.2.3 Inspection .............................................................................................................
9717.2.4 Classification & reporting ......................................................................................
9817.2.5 Priority ...................................................................................................................
9817.2.6 Repair ....................................................................................................................
9917.2.7 Control ..................................................................................................................
10017.3 Measurement technique for thermographic inspection of electrical installations ...............
10017.3.1 How to correctly set the equipment .....................................................................
10017.3.2 Temperature measurement ...................................................................................
10217.3.3 Comparative measurement ..................................................................................
10317.3.4 Normal operating temperature .............................................................................
10417.3.5 Classification of faults ...........................................................................................
10617.4 Reporting ..............................................................................................................................
10817.5 Different types of hot spots in electrical installations ...........................................................
10817.5.1 Reflections ............................................................................................................
10817.5.2 Solar heating .........................................................................................................
10917.5.3 Inductive heating ...................................................................................................
10917.5.4 Load variations ......................................................................................................
11017.5.5 Varying cooling conditions ...................................................................................
11117.5.6 Resistance variations ............................................................................................
11117.5.7 Overheating in one part as a result of a fault in another ......................................
11317.6 Disturbance factors at thermographic inspection of electrical installations ........................
11317.6.1 Wind ......................................................................................................................
11317.6.2 Rain and snow ......................................................................................................
11417.6.3 Distance to object .................................................................................................
11517.6.4 Object size ............................................................................................................
11717.7 Practical advice for the thermographer ................................................................................
11717.7.1 From cold to hot ...................................................................................................
11717.7.2 Rain showers ........................................................................................................
11717.7.3 Emissivity ..............................................................................................................
11817.7.4 Reflected apparent temperature ...........................................................................
11817.7.5 Object too far away ...............................................................................................
11918 About FLIR Systems .......................................................................................................................
12018.1 More than just an infrared camera .......................................................................................
12018.2 Sharing our knowledge ........................................................................................................
12018.3 Supporting our customers ...................................................................................................
12118.4 A few images from our facilities ...........................................................................................
Publ. No. T559382 Rev. a358 – ENGLISH (EN) – June 23, 2009 ix
Page 10

12319 Glossary ...........................................................................................................................................
12720 Thermographic measurement techniques ...................................................................................
12720.1 Introduction ..........................................................................................................................
12720.2 Emissivity ..............................................................................................................................
12820.2.1 Finding the emissivity of a sample .......................................................................
12820.2.1.1 Step 1: Determining reflected apparent temperature .......................
13020.2.1.2 Step 2: Determining the emissivity ...................................................
13120.3 Reflected apparent temperature ..........................................................................................
13120.4 Distance ................................................................................................................................
13120.5 Relative humidity ..................................................................................................................
13120.6 Other parameters ..................................................................................................................
13221 History of infrared technology ......................................................................................................
13622 Theory of thermography ................................................................................................................
13622.1 Introduction ...........................................................................................................................
13622.2 The electromagnetic spectrum ............................................................................................
13722.3 Blackbody radiation ..............................................................................................................
13822.3.1 Planck’s law ..........................................................................................................
13922.3.2 Wien’s displacement law ......................................................................................
14122.3.3 Stefan-Boltzmann's law .........................................................................................
14222.3.4 Non-blackbody emitters .......................................................................................
14422.4 Infrared semi-transparent materials .....................................................................................
14623 The measurement formula .............................................................................................................
15224 Emissivity tables .............................................................................................................................
15224.1 References ............................................................................................................................
15224.2 Important note about the emissivity tables ..........................................................................
15324.3 Tables ....................................................................................................................................
x Publ. No. T559382 Rev. a358 – ENGLISH (EN) – June 23, 2009
Page 11

1 Warnings & Cautions
This equipment generates, uses, and can radiate radio frequency energy and if
WARNING
■
not installed and used in accordance with the instruction manual, may cause interference to radio communications. It has been tested and found to comply with
the limits for a Class A computing device pursuant to Subpart J of Part 15 of FCC
Rules, which are designedto providereasonable protection againstsuch interference when operated in a commercial environment. Operation of this equipment
in a residential area is likely to cause interference in which case the user at his
own expense will be required to take whatever measures may be required to
correct the interference.
(Applies only to cameras with laser pointer:) Do not look directly into the laser
■
beam. The laser beam can cause eye irritation.
Applies only to cameras with battery:
■
Do not disassemble or do a modification to the battery. The battery contains
■
safety and protection devices which, if they become damaged, can cause the
battery to become hot, or cause an explosion or an ignition.
If there is a leak from the battery and the fluid gets into your eyes, do not rub
■
your eyes.Flush well withwater and immediatelyget medical care. Thebattery
fluid can cause injury to your eyes if you do not do this.
Do not continue to charge the battery if it does not become charged in the
■
specified charging time. If you continue to charge the battery, it can become
hot and cause an explosion or ignition.
Only use the correct equipment to discharge the battery. If you do not use the
■
correct equipment, you can decrease the performance or the life cycle of the
battery. If you do not use the correct equipment, an incorrect flow of current
to the battery can occur. This can cause the battery to become hot, or cause
an explosion and injury to persons.
Make sure that you read all applicable MSDS (Material Safety Data Sheets) and
■
warning labelson containersbeforeyou usea liquid: theliquids can bedangerous.
Do not point theinfrared camera (withor without the lens cover)at intensive energy
CAUTION
■
sources, for example devices that emit laser radiation, or the sun. This can have
an unwanted effect on the accuracy of the camera. It can also cause damage to
the detector in the camera.
Do not use the camera in a temperature higher than +50°C (+122°F), unless
■
specified otherwise in the technical data section. High temperatures can cause
damage to the camera.
(Applies only to cameras with laser pointer:) Protect the laser pointer with the
■
protective cap when you do not operate the laser pointer.
Applies only to cameras with battery:
■
Do not attach the batteries directly to a car’s cigarette lighter socket, unless a
■
specific adapter for connecting the batteries to a cigarette lighter socket is
provided by FLIR Systems.
Do not connect the positive terminal and the negative terminal of the battery
■
to each other with a metal object (such as wire).
Do not get water or salt water on the battery, or permit the battery to get wet.
■
Publ. No. T559382 Rev. a358 – ENGLISH (EN) – June 23, 2009 1
Page 12

1 – Warnings & Cautions
■
■
■
Do not make holes in the battery with objects. Do not hit the battery with a
■
hammer. Do not step on the battery, or apply strong impacts or shocks to it.
Do not put thebatteries inor near a fire, orinto direct sunlight. When thebattery
■
becomes hot, the built-in safety equipment becomes energized and can stop
the battery charging process. If the battery becomes hot, damage can occur
to the safety equipment and this can cause more heat, damage or ignition of
the battery.
Do not put the battery on a fire or increase the temperature of the battery with
■
heat.
Do not put the battery on or near fires, stoves, or other high-temperature loca-
■
tions.
Do not solder directly onto the battery.
■
Do not use the battery if, when you use, charge, or store the battery, there is
■
an unusual smell fromthe battery,the battery feelshot, changes color, changes
shape, or is in an unusual condition. Contact your sales office if one or more
of these problems occurs.
Only use a specified battery charger when you charge the battery.
■
The temperature range through which you can charge the battery is ±0°C to
■
+45°C (+32°F to +113°F). If you charge the battery at temperatures outof this
range, it can cause thebattery to become hot or to break. It can also decrease
the performance or the life cycle of the battery.
The temperature range through which you can dischargethe battery is −15°C
■
to +50°C (+5°F to +122°F). Use of the battery out of this temperature range
can decrease the performance or the life cycle of the battery.
When the battery is worn, apply insulation to the terminals with adhesive tape
■
or similar materials before you discard it.
Do not apply solvents or similar liquids to the camera, the cables, or other items.
This can cause damage.
Be careful when you cleanthe infraredlens. The lens has a delicate anti-reflective
coating.
Do not clean the infrared lens too vigorously. This can damage the anti-reflective
coating.
2 Publ. No. T559382 Rev. a358 – ENGLISH (EN) – June 23, 2009
Page 13
2 Notice to user
Typographical
conventions
User-to-user
forums
Calibration
Accuracy
Disposal of
electronic waste
This manual uses the following typographical conventions:
Semibold is used for menu names, menu commands and labels, and buttons in
■
dialog boxes.
Italic is used for important information.
■
Monospace is used for code samples.
■
UPPER CASE is used for names on keys and buttons.
■
Exchange ideas,problems, and infraredsolutions with fellowthermographers around
the world in our user-to-user forums. To go to the forums, visit:
http://www.infraredtraining.com/community/boards/
(This notice only applies to cameras with measurement capabilities.)
We recommend that you send in the camera for calibration once a year. Contact
your local sales office for instructions on where to send the camera.
(This notice only applies to cameras with measurement capabilities.)
For very accurate results, we recommend that you wait 5 minutes after you have
started the camera before measuring a temperature.
For cameras where the detector is cooled by a mechanical cooler, this time period
excludes the time it takes to cool down the detector (usually 5–7 minutes).
10742803;a1
As with most electronic products, this equipment must be disposed of in an environmentally friendlyway, and inaccordance with existingregulations for electronicwaste.
Please contact your FLIR Systems representative for more details.
Training
To read about infrared training, visit:
http://www.infraredtraining.com
Publ. No. T559382 Rev. a358 – ENGLISH (EN) – June 23, 2009 3
Page 14

3 Customer help
General
Submitting a
question
Downloads
For customer help, visit:
http://flir.custhelp.com
To submit a question to the customer help team, you must be a registered user. It
only takes a fewminutes to registeronline. If you only wantto search the knowledgebase for existing questions and answers, you do not need to be a registered user.
When you want to submit a question, makesure thatyou have the following information to hand:
The camera model
■
The camera serial number
■
The communication protocol, or method, between the camera and your PC (for
■
example, HDMI, Ethernet, USB™, or FireWire™)
Operating system on your PC
■
Microsoft®Office version
■
Full name, publication number, and revision number of the manual
■
On the customer help site you can also download the following:
Firmware updates for your infrared camera
■
Program updates for your PC software
■
User documentation
■
Application stories
■
Technical publications
■
4 Publ. No. T559382 Rev. a358 – ENGLISH (EN) – June 23, 2009
Page 15

4 Documentation updates
General
Our manuals are updated several times per year, and we also issue product-critical
notifications of changes on a regular basis.
To access the latest manuals and notifications, go to the Download tab at:
http://flir.custhelp.com
It only takes a few minutes to register online. In the download area you will also find
the latest releases of manuals for our other products, as well as manuals for our
historical and obsolete products.
Publ. No. T559382 Rev. a358 – ENGLISH (EN) – June 23, 2009 5
Page 16

5 Important note about this manual
General
NOTE
FLIR Systems issues generic manuals that cover several cameras within a model
line.
This means that this manual may contain descriptions and explanations that do not
apply to your particular camera model.
FLIR Systemsreserves therightto discontinuemodels,software, parts oraccessories,
and other items, or to change specifications and/or functionality at any time without
prior notice.
6 Publ. No. T559382 Rev. a358 – ENGLISH (EN) – June 23, 2009
Page 17
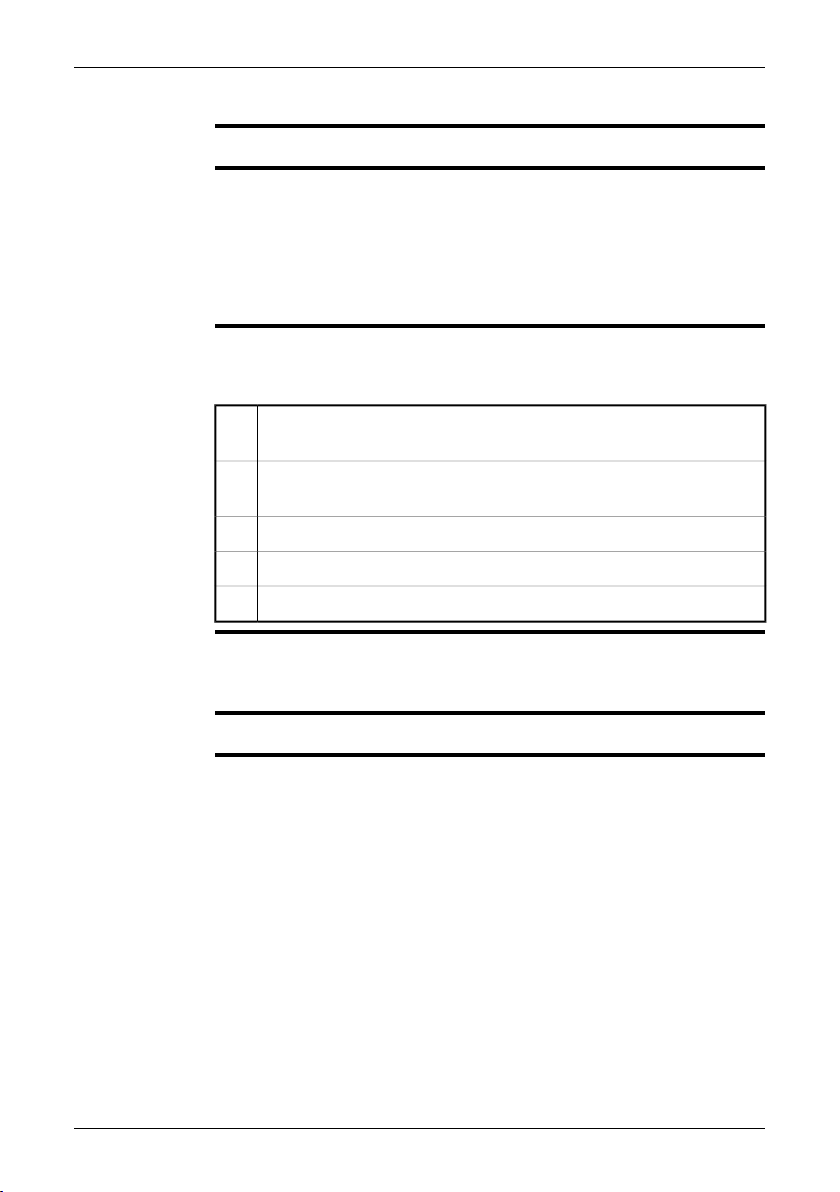
6 Quick Start Guide
Procedure
Follow this procedure to get started right away:
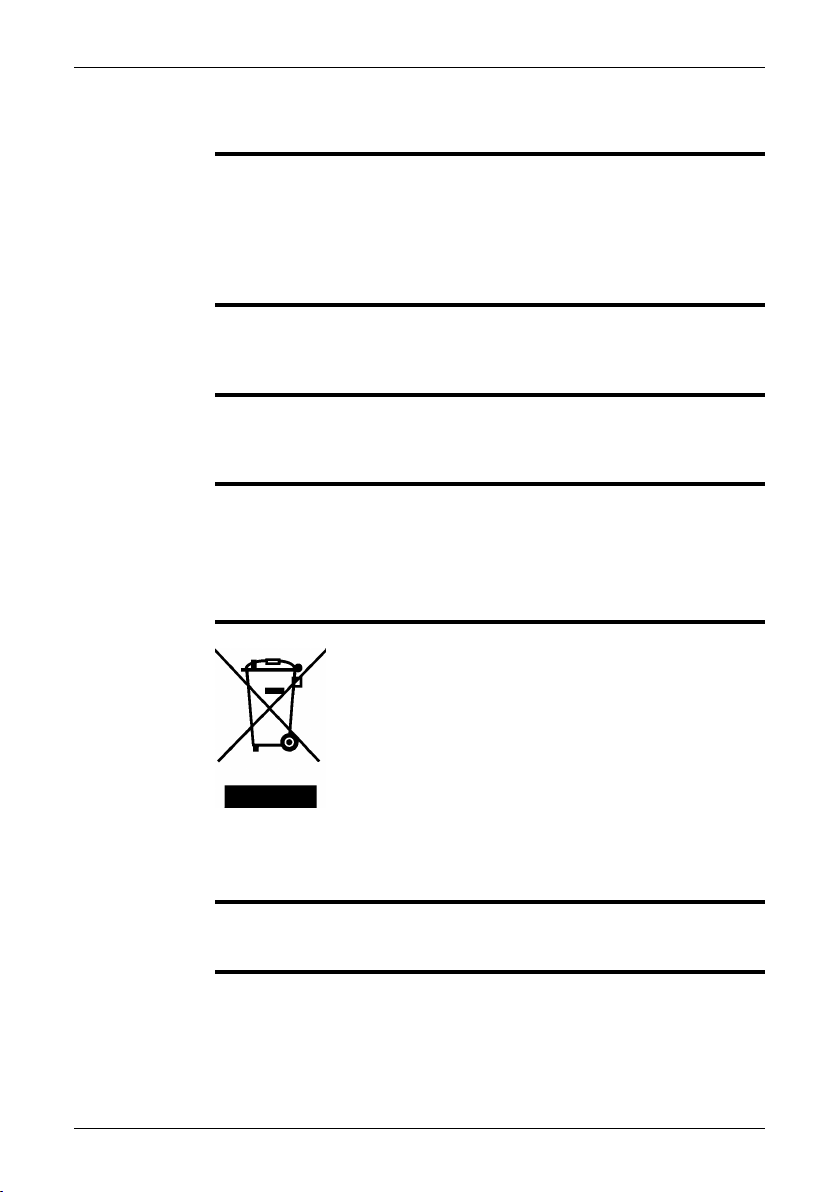
Remove the protective film from the LCD.1
You must charge the battery inside the camera for four full hours (or until
2
the battery charging indicator displays a green light) before you use the
camera for the first time.
Charge thebatteryby connecting thepowersupply to the powerconnector
on the camera. Make sure that you use the correct AC plug.
Note: The first time you charge a factory-new battery you must turn on and
then turn off the camera after you have connected the power supply to the
power connector on the camera.
T630175;a1
1 Battery charging indicator
2 Power supply cable
Insert a miniSD™ memory card into the card slot.
3
T630176;a1
Publ. No. T559382 Rev. a358 – ENGLISH (EN) – June 23, 2009 7
Page 18
6 – Quick Start Guide
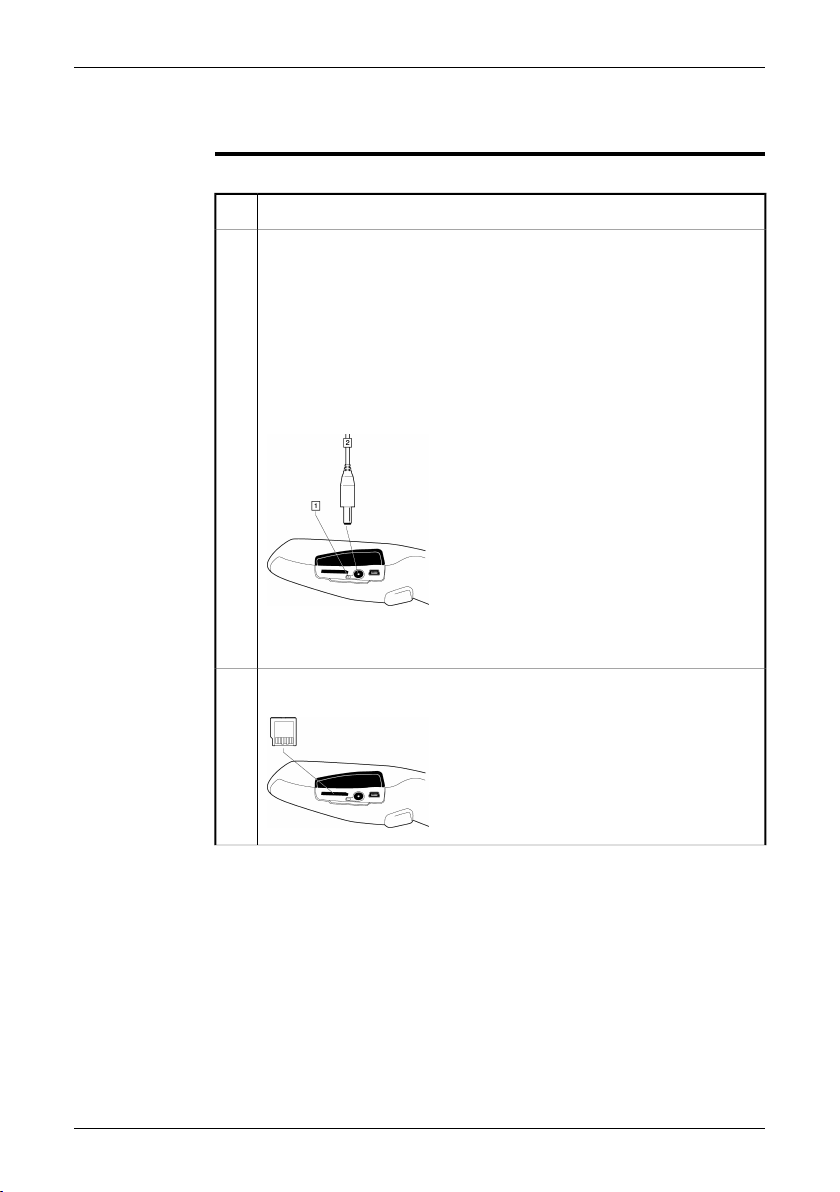
Push the On/Off button to turn on the camera.
4
Note: If the camera does not start after you have charged thebattery, push
the reset button with a non-conductive tool. The reset button is located
beside the battery connector, inside the battery compartment. Then press
the On/Off button again.
The reset button:
T630179;a1
Open the lens cap by pushing the lens cap lever.
5
T630177;a1
Aim the camera toward your target of interest.6
Pull the Save trigger to save the image.7
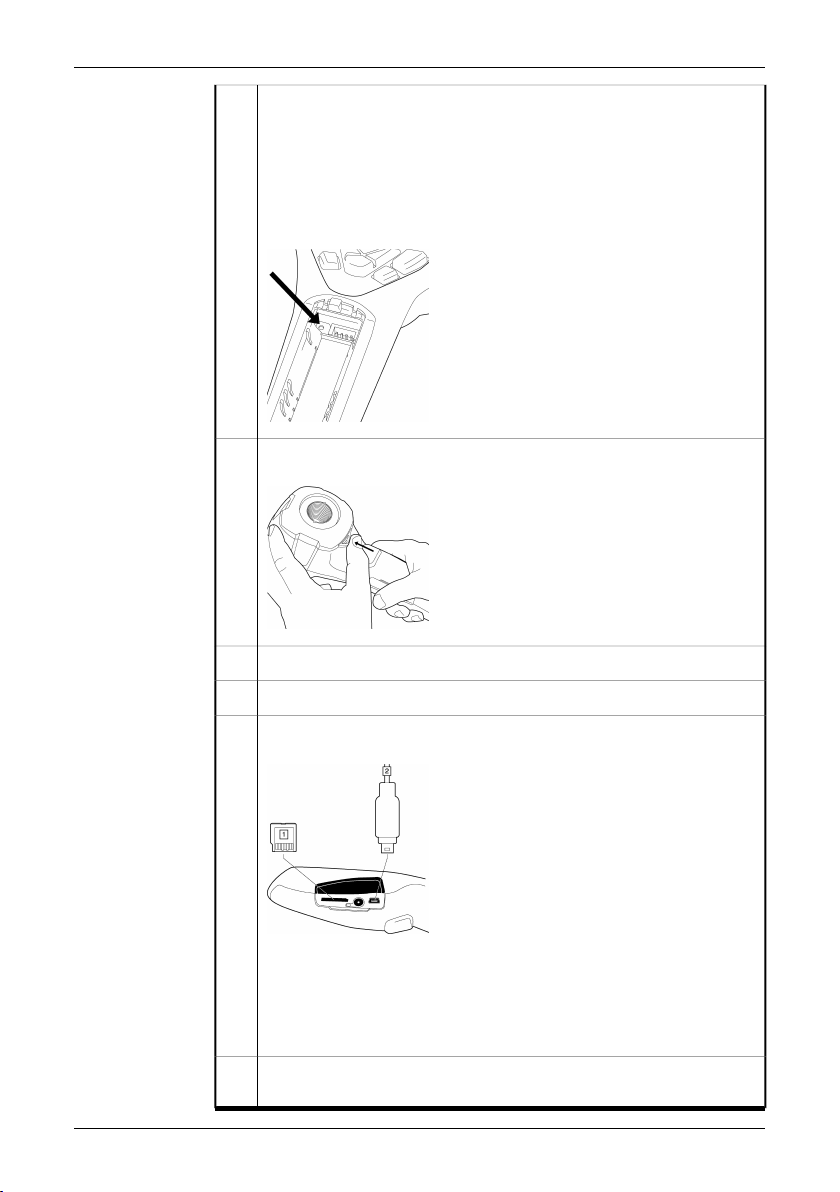
To move the image to a computer, do one of the following:
8
T630178;a1
(Fig. 1 above) Remove the miniSD™ memory card and insert it into a
■
card readerconnected to a computer. A miniSD™ cardadapter is included with your camera.
(Fig. 2 above) Connect a computer to the camera using a USB™ Mini-
■
B cable.
In Windows®Explorer, move the image from the card or camera using a
9
drag-and-drop operation.
8 Publ. No. T559382 Rev. a358 – ENGLISH (EN) – June 23, 2009
Page 19

7 Packing list
Battery (inside camera)
Contents
NOTE
■
Calibration certificate
■
FLIR QuickReport CD
■
Hand strap
■
Infrared camera
■
miniSD card (512 MB), with SD adapter
■
Power supply/charger with EU, UK, US and Australian plugs
■
Printed Getting Started Guide
■
USB cable
■
User documentation CD-ROM
■
Contact your local sales office if any item is damaged or missing. You can find
■
the addresses and telephone numbers of local sales offices on the back cover of
this manual.
FLIR Systems reserves the rightto discontinue models, parts or accessories, and
■
other items, or to change specifications at any time without prior notice.
Publ. No. T559382 Rev. a358 – ENGLISH (EN) – June 23, 2009 9
Page 20
8 Camera parts
Figure
10780903;a1
Explanation
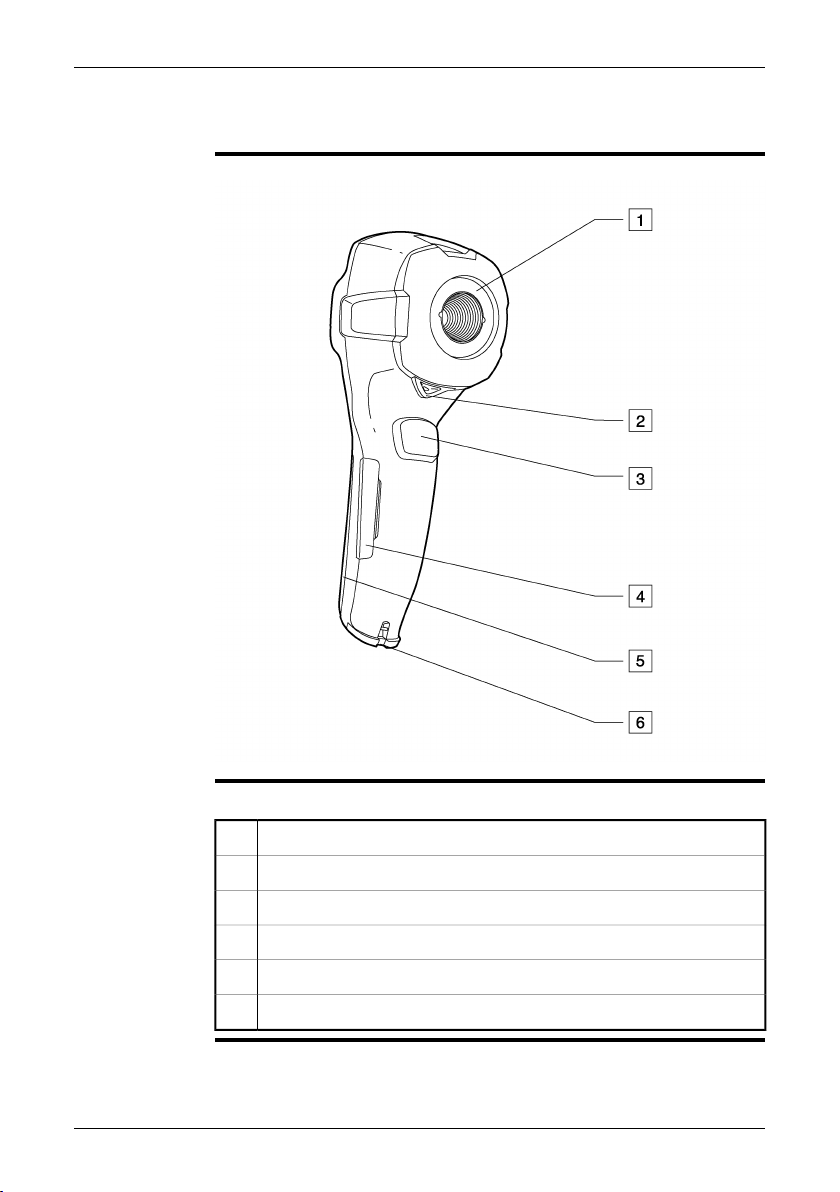
This table explains the figure above:
Infrared lens1
Lever to open and close the lens cap2
Trigger to save images3
Cover to connectors and the miniSD™ memory card slot4
Cover to the battery compartment5
Attachment point for the hand strap6
10 Publ. No. T559382 Rev. a358 – ENGLISH (EN) – June 23, 2009
Page 21
8 – Camera parts
Figure
Explanation
10781003;a1
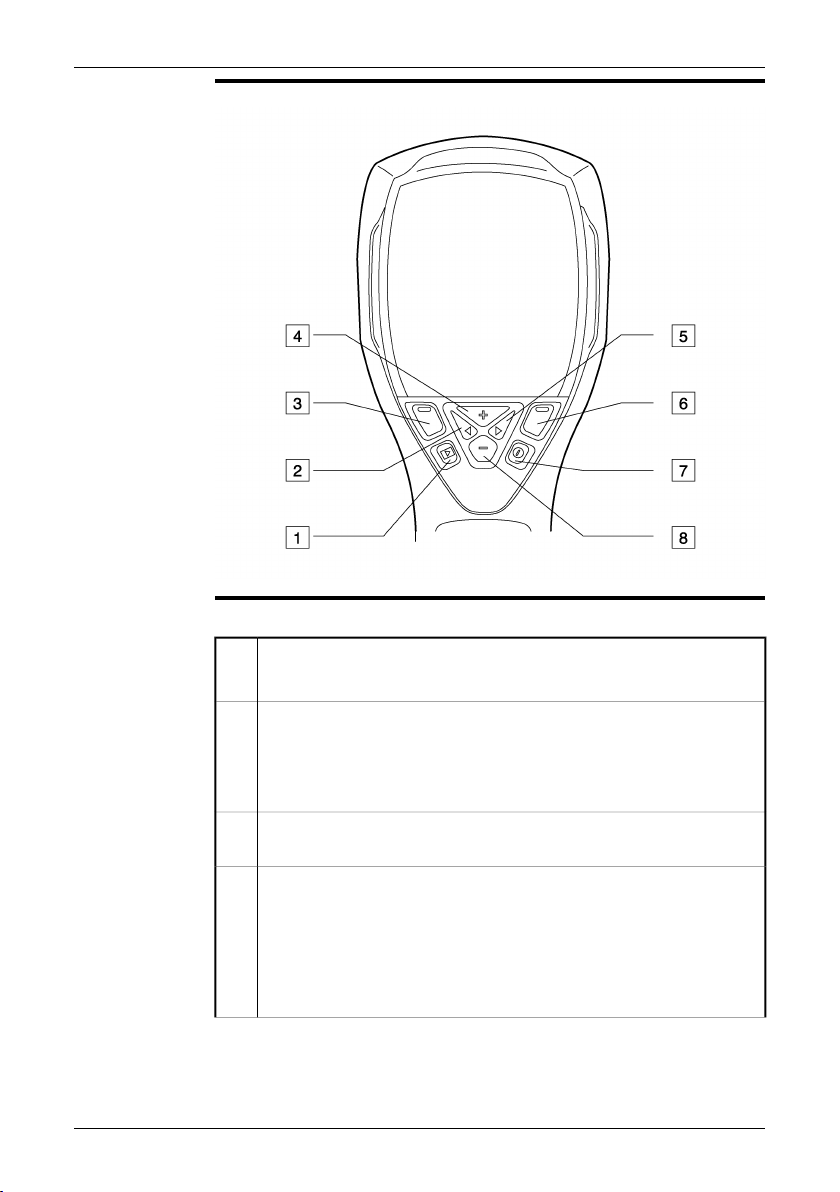
This table explains the figure above:
Archive button
1
Function: Push to open the image archive.
Left arrow button (on the navigation pad)
2
Function:
Push to go left in menus, submenus, and dialog boxes
■
Push to navigate in the image archive
■
Left selection button. This button is context-sensitive, and the current
3
function is displayed above the button on the screen.
+ button (on the navigation pad)
4
Function:
Push to go up in menus, submenus, and dialog boxes.
■
Push to display the image archive (after having pushed the Archive
■
button).
Push to increase/change the value.
■
Publ. No. T559382 Rev. a358 – ENGLISH (EN) – June 23, 2009 11
Page 22
8 – Camera parts
Right arrow button (on the navigation pad)
5
Function:
Push to go right in menus, submenus, and dialog boxes.
■
Push to navigate in the image archive.
■
Right selection button. This button is context-sensitive, and the current
6
function is displayed above the button on the screen.
On/Off button
7
Function:
Push to turn on the camera.
■
Push and hold down for more than one second to turn off the camera.
■
– button (on navigation pad)
8
Function:
Push to go down in menus, submenus, and dialog boxes.
■
Push to decrease/change the value.
■
12 Publ. No. T559382 Rev. a358 – ENGLISH (EN) – June 23, 2009
Page 23
9 Screen elements
Figure
Explanation
10781203;a2
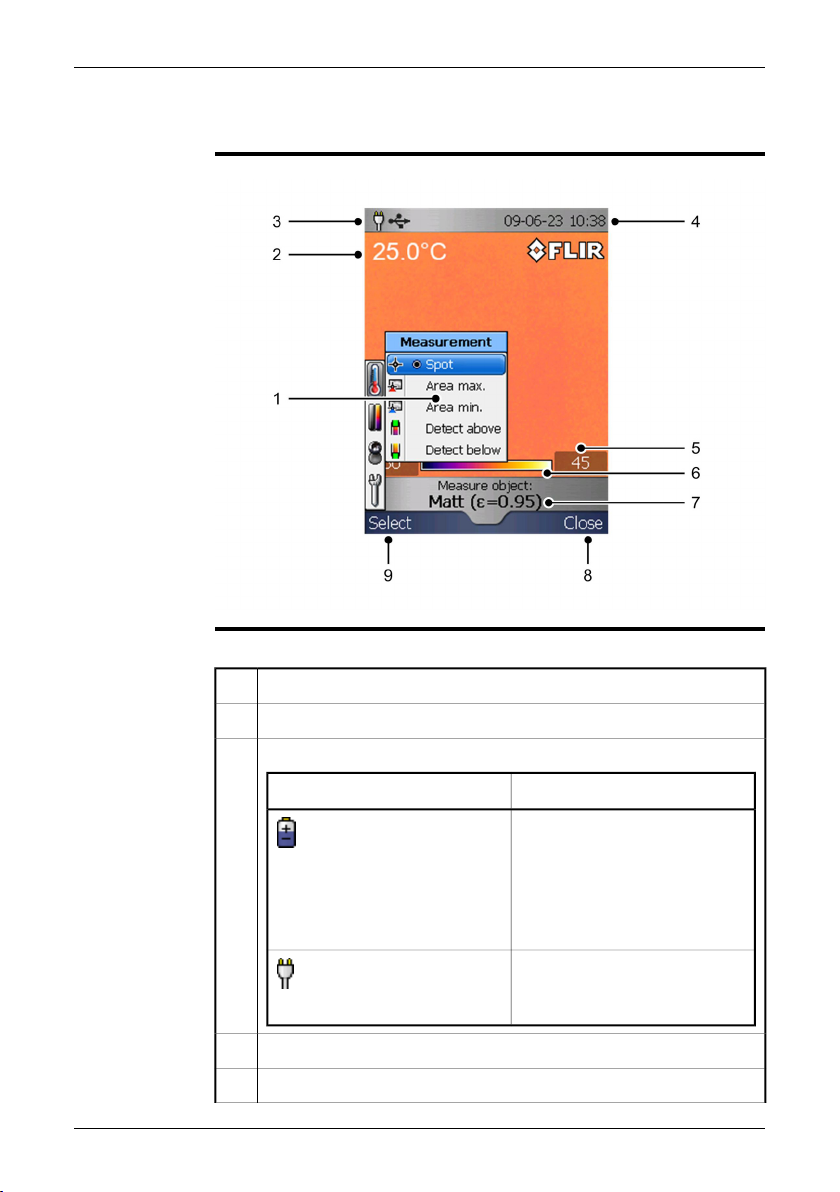
This table explains the figure above:
Menu system1
Measurement result2
Power indicator
3
MeaningIcon
One of the following:
The camera is powered using
■
the battery.
The battery is being charged
■
(indicated by a refilling battery
animation).
The battery is fullycharged and the
camera is powered using the
power supply.
Date and time4
Limit value for the temperature scale5
Publ. No. T559382 Rev. a358 – ENGLISH (EN) – June 23, 2009 13
Page 24

9 – Screen elements
Temperature scale6
Currently set emissivity value or material properties7
Current function for the right selection button8
Current function for the left selection button9
14 Publ. No. T559382 Rev. a358 – ENGLISH (EN) – June 23, 2009
Page 25
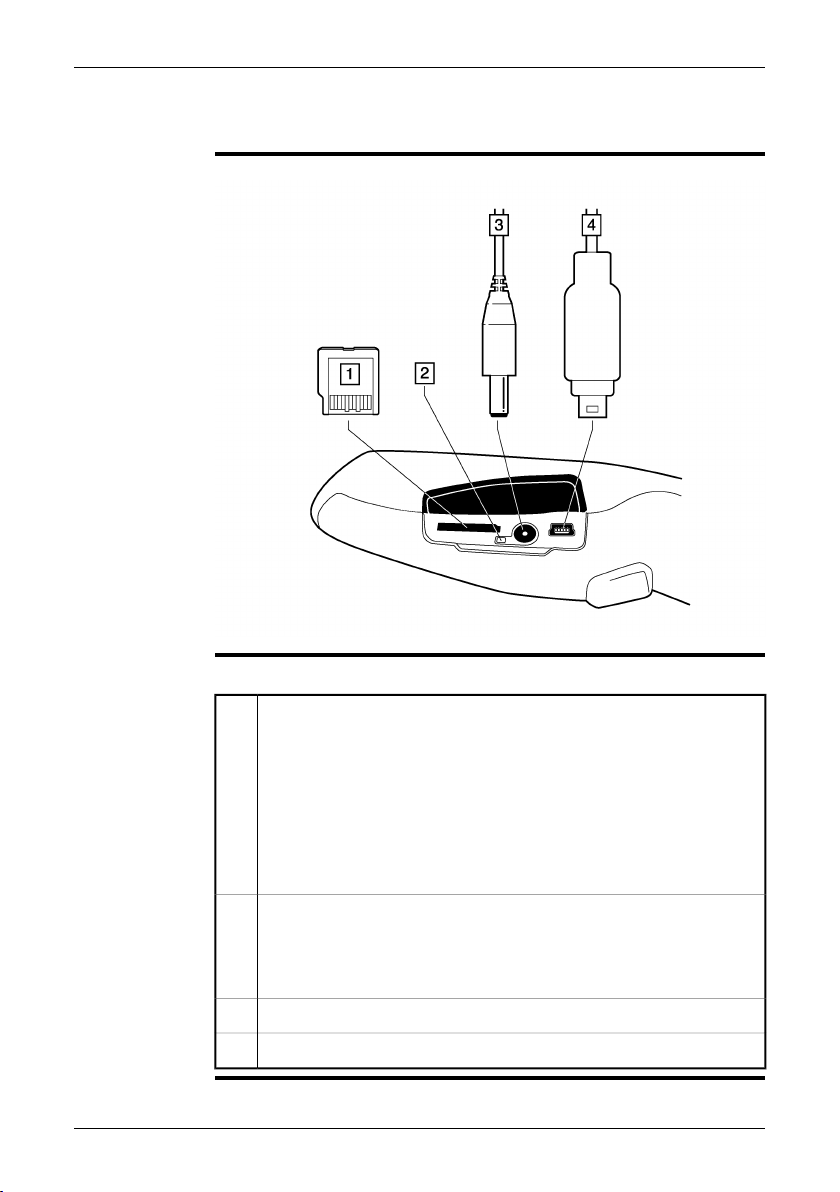
10 Connectors and storage media
Figure
Explanation
10780803;a1
This table explains the figure above:
miniSD™ memory card
1
We recommend that you do not save more than 5,000 images on the miniSD™ memory card.
Although a memory card may have a higher capacity than 5,000 images,
saving more than that number ofimages severelyslows down file management on the miniSD™ memory card.
Note: There is no upper limit to the memory size of the miniSD™ memory
card.
Battery charging indicator:
2
No light: The power supply is not connected.
■
Orange light: The battery is being charged.
■
Green light: The charging of the battery is completed.
■
Power supply cable3
USB cable with USB Mini-B connector4
Publ. No. T559382 Rev. a358 – ENGLISH (EN) – June 23, 2009 15
Page 26
11 Using the camera
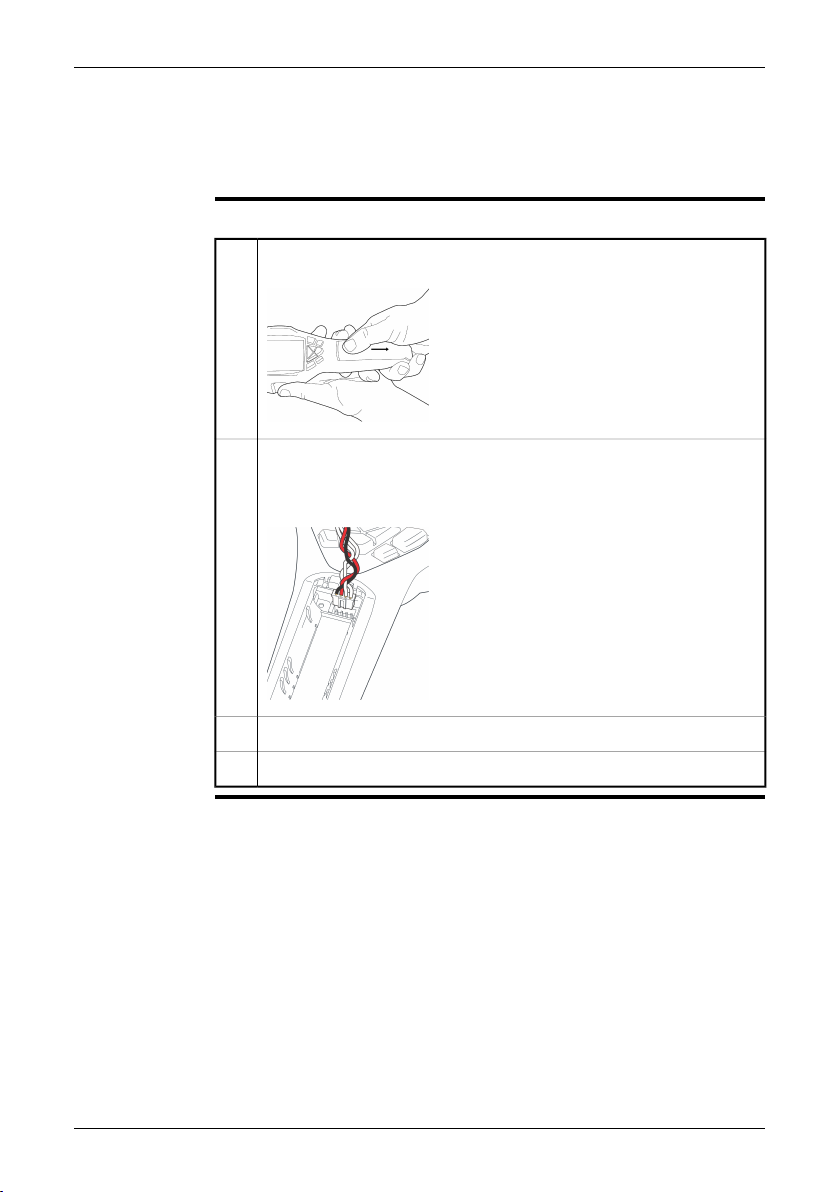
11.1 Installing the battery
Procedure
Follow this procedure to install the battery:
Remove the battery compartment cover.
1
T630174;a1
Connect the cable that is attached to the battery to the connector inside
2
the battery compartment. Note: Do not use conductive tools when doing
this.
T630173;a2
Push the battery into place.3
Replace the cover to close the battery compartment.4
16 Publ. No. T559382 Rev. a358 – ENGLISH (EN) – June 23, 2009
Page 27
11.2 Charging the battery
You must charge the battery inside the camera for four full hours (or until the
NOTE
■
battery indicator displays a green light) before you use the camera for the first
time.
The first time you charge a factory-new battery you must turn on and then turn off
■
the camera after you have connected the power supply to the power connector
on the camera.
If the camera does not start after you have charged the battery, push the reset
■
button with a non-conductive tool. The reset button is located beside the battery
connector, inside the battery compartment. Then press the On/Off button again.
The reset button:
T630179;a1
Do not replace the battery on a frequent basis. Only replace the battery when it
■
is worn out.
11 – Using the camera
About the battery
charging indicator
Procedure
The battery charging indicator is an LED beside the power connector. It displays the
following signals:
No light: The power supply is not connected.
■
Orange light: The battery is being charged.
■
Green light: The charging of the battery is completed.
■
Follow this procedure to charge the battery:
Connect the power supply to the power connector on the camera.
1
T630175;a1
1 Battery charging indicator
2 Power supply cable
Publ. No. T559382 Rev. a358 – ENGLISH (EN) – June 23, 2009 17
Page 28

11 – Using the camera
Connect the power supply mains-electricity plug to a mains socket. Make
2
sure that you use the correct AC plug.
Disconnect thepower supply cableplug when thebattery charging indicator
3
displays a green light.
18 Publ. No. T559382 Rev. a358 – ENGLISH (EN) – June 23, 2009
Page 29
11.3 Saving an image
11 – Using the camera
General
Image capacity
Formatting
memory cards
Naming
convention
You can save multiple images to the miniSD™ memory card.
We recommend that you do not save more than 5,000 images on the miniSD™
memory card.
Although amemory card mayhave a highercapacity than 5,000images, saving more
than that number of images severely slows down file management on the memory
card.
Note: There is no upper limit to the memory size of the miniSD™ memory card.
For best performance, memory cards should be formatted to the FAT (FAT16) file
system. Using FAT32-formatted memory cards may result in inferior performance.
To format a memory card to FAT (FAT16), follow this procedure:
Insert the memory card into a card reader that is connected to your com-
1
puter.
In Windows®Explorer, select My Computer and right-click the memory
2
card.
Select Format.3
Under File system, select FAT.4
Click Start.5
The naming convention for images is IR_xxxx.jpg, where xxxx is a unique counter.
When you select Restore, the cameraresets the counterand assigns thenext highest
free file name for the new file.
Procedure
Publ. No. T559382 Rev. a358 – ENGLISH (EN) – June 23, 2009 19
To save an image, pull the Save trigger.
Page 30
11 – Using the camera
11.4 Recalling an image
General
Procedure
When you save an image, it is stored on the removable miniSD™ memory card. To
display the image again, you can recall it from the miniSD™ memory card.
Follow this procedure to recall an image:
Push the Archive button.1
Do one of the following:
2
Push the navigation pad left/right to select the image you want to view.
■
Push the + button, use the navigation pad to selectthe image you want
■
to see, then push the right selection button (Open).
To return to live mode, do one of the following:
3
Push the Archive button.
■
Push the right selection button (Close).
■
20 Publ. No. T559382 Rev. a358 – ENGLISH (EN) – June 23, 2009
Page 31

11.5 Opening the image archive
11 – Using the camera
General
Procedure
The image archive is a thumbnail gallery of all the images on the miniSD™ memory
card.
Follow this procedure to open the image archive:
Push the Archive button.1
Push the + button on the navigation pad.
2
This will display the image archive. You can now use the navigation pad to
navigate in the archive.
To open a selected image, push the right selection button (Open).3
Publ. No. T559382 Rev. a358 – ENGLISH (EN) – June 23, 2009 21
Page 32

11 – Using the camera
11.6 Deleting an image
General
Alternative 1
Alternative 2
You can delete one or more images from the miniSD™ memory card.
Follow this procedure to delete an image:
Push the Archive button.1
Push the + button. This will display the image archive.2
Select the image you want to delete by using the navigation pad.3
Push the left selection button (Options).4
Use the navigation pad to select Delete image.5
Push the left selection button (Select).6
Push the right selection button to confirm (Delete).7
To return to live mode, do one of the following:
8
Push the Archive button.
■
Push the right selection button (Close).
■
Follow this procedure to delete an image:
Push the Archive button.1
Select the image you want to delete by using the navigation pad.2
Push the left selection button (Delete).3
Push the right selection button to confirm (Delete).4
To return to live mode, do one of the following:
5
Push the Archive button.
■
Push the right selection button (Close).
■
22 Publ. No. T559382 Rev. a358 – ENGLISH (EN) – June 23, 2009
Page 33

11.7 Deleting all images
11 – Using the camera
General
Procedure
You can delete all images from the miniSD™ memory card.
Follow this procedure to delete all images:
Push the Archive button.1
Push the + button. This will display the image archive2
Push the left selection button (Options).3
Use the navigation pad to select Delete all images.4
Push the left selection button (Select).5
Push the right selection button to confirm (Delete).6
Publ. No. T559382 Rev. a358 – ENGLISH (EN) – June 23, 2009 23
Page 34

11 – Using the camera
11.8 Measuring a temperature using a spotmeter
General
Procedure
You can measure a temperature using a spotmeter. This will display the temperature
at the position of the spotmeter on the screen.
Follow this procedure:
Push the left selection button (Menu).1
Use the navigation pad to select Measurement.2
Push the left selection button (Select).3
Use the navigation pad to select Spot.4
Push the left selection button (Select).
5
The temperature at the position of the spotmeter will now displayed in the
top left corner of the screen.
24 Publ. No. T559382 Rev. a358 – ENGLISH (EN) – June 23, 2009
Page 35

11.9 Measuring a temperature using an area
11 – Using the camera
General
Procedure
You can continuouslyindicate the highestor lowest temperature within anarea, using
a continuously moving cursor.
Follow this procedure:
Push the left selection button (Menu).1
Use the navigation pad to select Measurement.2
Push the left selection button (Select).3
Use the navigation pad to select one of the following:
4
Area max.
■
Area min.
■
Push the left selection button (Select).
5
The highest or lowest temperature within the area will now be indicated by
a continuously moving cursor.
The temperature will also be displayed in the top left corner of the screen.
Publ. No. T559382 Rev. a358 – ENGLISH (EN) – June 23, 2009 25
Page 36

11 – Using the camera
11.10 Marking all areas above or below a set temperature level
General
Procedure
You can mark all areas above or below a set temperature level.
Follow this procedure:
Push the left selection button (Menu).1
Use the navigation pad to select Measurement.2
Push the left selection button (Select).3
Use the navigation pad to select one of the following:
4
Detect above
■
Detect below
■
Push the left selection button (Select).5
To change the temperature level above or below which you want to mark
6
the areas, use the navigation pad.
26 Publ. No. T559382 Rev. a358 – ENGLISH (EN) – June 23, 2009
Page 37

11.11 Changing the color palette
11 – Using the camera
General
Procedure
You can change the color palette that the camera uses to display different temperatures. A different palette can make it easier to analyze an image.
Follow this procedure to change the color palette:
Push the left selection button (Menu).1
Use the navigation pad to go to Color palette.2
Push the left selection button (Select). This will display the Color palette
3
submenu.
Use the navigation pad to select the new color palette.4
Push the left selection button (Select) to confirm the choice and leave the
5
submenu.
Publ. No. T559382 Rev. a358 – ENGLISH (EN) – June 23, 2009 27
Page 38

11 – Using the camera
11.12 Changing the settings
General
Procedure
You can change a variety of settings for the camera. These include the following:
Auto shutdown
■
Display intensity
■
Language
■
Unit
■
Time format
■
Set time
■
Time stamp
■
Firmware (to download program updates for your camera. See http://flir.cus-
■
thelp.com for more information.)
Restore
■
Follow this procedure to change a setting:
Push the left selection button (Menu).1
Use the navigation pad to go to Settings.2
Push the left selection button (Select). This will display the Settings sub-
3
menu.
Use the navigation pad to select the setting you want to change.4
Push the left selectionbutton (Select), then usethe navigationpad to select
5
a new setting.
Push the left selection button (Select) to confirm the choice and leave the
6
submenu, or push the right selection button (Close) to leave the menu.
28 Publ. No. T559382 Rev. a358 – ENGLISH (EN) – June 23, 2009
Page 39

11.13 Changing the image mode
11 – Using the camera
General
When to use
Locked mode
Procedure
The camera can operate in two different image modes:
ExplanationIconImage mode
[None]Auto
Locked
A typical situation when you would want to use Locked mode is when looking for
temperature anomalies in two items of similar design or construction.
For example, if you are looking at two cables, where you suspect one is overheated,
working inLocked mode willclearly show that oneis overheated. Thehighertemperature in that cable would create a lighter color for the higher temperature.
If you use Auto mode instead, the color for the two items will appear the same.
To switch between Auto mode and Locked mode, push the right selection button
(Auto/Locked). A padlock icon ( ) indicates the Locked mode.
In Auto mode, the camera is continuously autoadjusted for best image
brightness and contrast.
In Locked mode, the
camera locksthe temperature span and the temperature level.
Publ. No. T559382 Rev. a358 – ENGLISH (EN) – June 23, 2009 29
Page 40

11 – Using the camera
11.14 Setting the surface properties
General
Procedure
SEE ALSO
To measure temperatures accurately, the camera must know what kind of surface
you are measuring.
The easiest way to do this is to set the surface property on the Measure menu. You
can choose between the following surface properties:
Matt
■
Semi-matt
■
Semi-glossy
■
Glossy
■
Follow this procedure to set the surface property:
Push the left selection button (Menu).1
Use the navigation pad to go to Measure.2
Push the left selection button (Select). This will display the Measure sub-
3
menu.
On the Measure menu, use thenavigation pad to select asurface property.4
Push the left selection button (Select) to confirm the choice and leave the
5
menu.
For more precise measurements, see the following sections:
Section 11.15 – Changing the emissivity on page 31
■
Section 11.16 – Changing the reflected apparent temperature on page 32
■
30 Publ. No. T559382 Rev. a358 – ENGLISH (EN) – June 23, 2009
Page 41

11.15 Changing the emissivity
11 – Using the camera
General
Procedure
For very precise measurements, you may need to set the emissivity, instead of selecting a surface property. You also need to understand how emissivity and reflectivity affect measurements, rather than just simply selecting a surface property.
Emissivity is a property that indicates how much radiation originates from an object
as opposed to being reflected by it. A lower value indicates that a larger proportion
is beingreflected, while ahigh value indicates thata lower proportionis being reflected.
Polished stainless steel, for example, has an emissivity of 0.14, while a structured
PVC floor typically has an emissivity of 0.93.
Follow this procedure to set the emissivity:
Push the left selection button (Menu).1
Use the navigation pad to go to Measure.2
Push the left selection button (Select). This will display the Measure sub-
3
menu.
Use the navigation pad to select Advanced.4
Push the left selection button (Select). This will display the Advanced sub-
5
menu.
Use the navigation pad to do either of the following:
6
Set a value for emissivity
■
Select a material in the list of materials
■
Push the left selection button (Select) to confirm the choice and leave the
7
menu.
SEE ALSO
To read more about emissivity, see section 20 – Thermographic measurement techniques on page 127.
Publ. No. T559382 Rev. a358 – ENGLISH (EN) – June 23, 2009 31
Page 42

11 – Using the camera
11.16 Changing the reflected apparent temperature
General
Procedure
SEE ALSO
This parameter is used to compensate for the radiation reflected by the object. If the
emissivity is low and the object temperature relatively far from that of the reflected
temperature it will be important to set and compensate for the reflected apparent
temperature correctly.
Follow this procedure to set the reflected apparent temperature:
Push the left selection button (Menu).1
Use the navigation pad to go to Measure.2
Push the left selection button (Select). This will display the Measure sub-
3
menu.
Use the navigation pad to select Advanced.4
Push the left selection button (Select). This will display the Advanced sub-
5
menu.
Use the navigation pad to set the reflected apparent temperature.6
Push the left selection button (Select) to confirm the choice and leave the
7
menu.
To read more about the reflected apparent temperature, see section 20 – Thermographic measurement techniques on page 127.
32 Publ. No. T559382 Rev. a358 – ENGLISH (EN) – June 23, 2009
Page 43

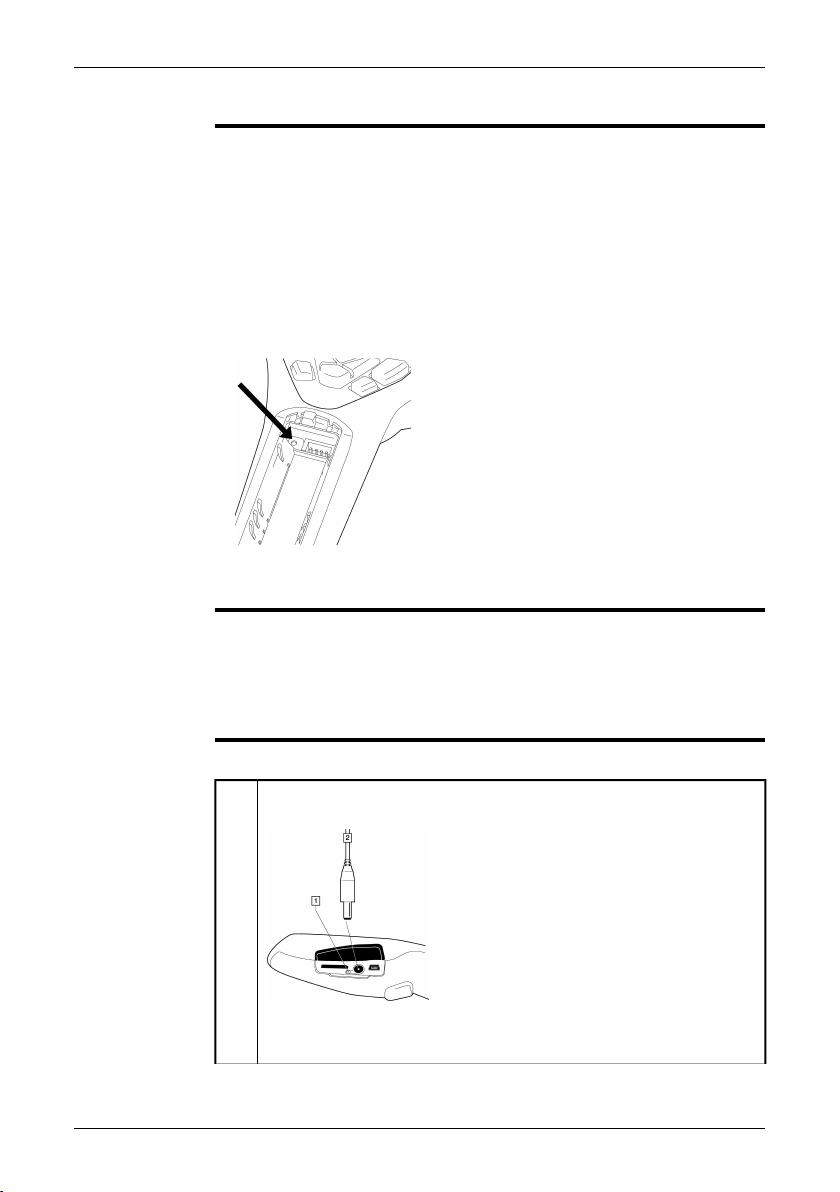
11.17 Resetting the camera
11 – Using the camera
General
NOTE
Procedure
If you need toreset the camera,there is areset buttoninside the batterycompartment.
Do not use a metal or other conductive tool to reset the camera.
Follow this procedure to reset the camera:
Open the battery compartment cover.1
To locate the reset button, see the figure below.
2
T630179;a1
Use a non-conductive tool to push reset button. The camera will now be
3
reset.
Publ. No. T559382 Rev. a358 – ENGLISH (EN) – June 23, 2009 33
Page 44

11 – Using the camera
11.18 Finding the serial number of the camera
General
When you communicate with our service departments, you may need to state the
serial number of the camera.
The serial number is printed on a label inside the battery compartment, behind the
battery.
34 Publ. No. T559382 Rev. a358 – ENGLISH (EN) – June 23, 2009
Page 45

12 Cleaning the camera
12.1 Camera housing, cables, and other items
Liquids
Equipment
Procedure
CAUTION
Use one of these liquids:
Warm water
■
A weak detergent solution
■
A soft cloth
Follow this procedure:
Soak the cloth in the liquid.1
Twist the cloth to remove excess liquid.2
Clean the part with the cloth.3
Do not apply solvents or similar liquids to the camera, the cables, or other items.
This can cause damage.
Publ. No. T559382 Rev. a358 – ENGLISH (EN) – June 23, 2009 35
Page 46

12 – Cleaning the camera
12.2 Infrared lens
Liquids
Equipment
Procedure
WARNING
CAUTION
Use one of these liquids:
96% isopropyl alcohol.
■
A commercial lens cleaning liquid with more than 30% isopropyl alcohol.
■
Cotton wool
Follow this procedure:
Soak the cotton wool in the liquid.1
Twist the cotton wool to remove excess liquid.2
Clean the lens one time only and discard the cotton wool.3
Make sure that you read all applicable MSDS (Material Safety Data Sheets) and
warning labels on containers before you use a liquid: the liquids can be dangerous.
Be careful when you cleanthe infraredlens. The lens has a delicate anti-reflective
■
coating.
Do not clean the infrared lens too vigorously. This can damage the anti-reflective
■
coating.
36 Publ. No. T559382 Rev. a358 – ENGLISH (EN) – June 23, 2009
Page 47

13 Technical data
13.1 Camera data
Imaging and
optical data
Detector data
Image
presentation
Measurement
Field of view (FOV) Dependent on the camera:
17° × 17° (FLIR i5 (2009 model))
■
25° × 25° (FLIR i7)
■
0.6 m (2 ft.)Minimum focus distance
3.71 mradSpatial resolution (IFOV)
< 0.1°C (0.18°F)Thermal sensitivity/NETD
9 HzImage frequency
Focus freeFocus
Detector type Focal plane array (FPA), uncooled microbolometer
7.5–13 µmSpectral range
IR resolution
Display 2.8 in. color LCD
Object temperature
range
Dependent on the camera:
80 × 80 pixels (FLIR i5 (2009 model))
■
120 × 120 pixels (FLIR i7)
■
Automatic adjust/lock imageImage adjustment
0°C to +250°C (+32° to +482°F)
Accuracy
Measurement
analysis
Publ. No. T559382 Rev. a358 – ENGLISH (EN) – June 23, 2009 37
Spotmeter Center spot
Area
Isotherm
±2°C (±3.6°F)or ±2% ofreading, for ambienttemperature 10°C to 35°C (+50°F to 95°F)
Dependent on the camera:
Not applicable (FLIR i5 (2009 model))
■
Box with max./min. (FLIR i7)
■
Dependent on the camera:
Not applicable (FLIR i5 (2009 model))
■
Above/below (FLIR i7)
■
Variable from 0.1 to 1.0Emissivity correction
Page 48

13 – Technical data
Emissivity table of predefined materialsEmissivity table
Automatic, based on input of reflected temperatureReflected apparent tem-
perature correction
Set-up
Storage of images
Data
communication
interfaces
Power system
Environmental
data
Color palettes Black and white, iron and rainbow
Set-up commands
Local adaptation of units, language, date and time
formats
Image storage type miniSD card
Standard JPEG, 14-bit measurement data includedFile formats
Interfaces USB Mini-B: Data transfer to and from PC
Battery type Rechargeable Li Ion battery
3.6 VBattery voltage
Battery operating time
Approx. 5 hours at +25°C (+77°F) ambient temperature and typical use
Battery is charged inside the camera.Charging system
3 h to 90% capacityCharging time
Automatic shut-downPower management
AC adapter, 90–260 VAC input, 5 V output to cameraAC operation
Operating temperature
0°C to +50°C (+32°F to +122°F)
range
–40°C to +70°C (–40°F to +158°F)Storage temperature
range
IEC 60068-2-30/24 h 95% relative humidityHumidity (operating and
storage)
EMC
EN 61000-6-2:2005 (Immunity)
■
EN 61000-6-3:2007 (Emission)
■
FCC 47 CFR Part 15 Class B (Emission)
■
Camera housing and lens: IP 43 (IEC 60529)Encapsulation
25 g (IEC 60068-2-29)Bump
2 g (IEC 60068-2-6)Vibration
38 Publ. No. T559382 Rev. a358 – ENGLISH (EN) – June 23, 2009
Page 49

13 – Technical data
Physical data
Certifications
Scope of delivery
Camera weight, incl. bat-
0.34 kg (0.75 lb.)
tery
223 × 79 × 83 mm (8.8 × 3.1 × 3.3 in.)Camera size(L× W × H)
Material
Polycarbonate + acrylonitrile butadiene styrene (PCABS)
Thixomold magnesium
Thermoplastic elastomer (TPE)
Blue and grayColor
Certification UL, CSA, CE, PSE and CCC
Packaging, type Hard case
Packaging, contents
FLIR QuickReport CD
■
Printed Getting Started Guide
■
User documentation CD-ROM
■
Calibration certificate
■
Hand strap
■
Battery (inside camera)
■
Power supply/charger with EU, UK, US and Aus-
■
tralian plugs
USB cable
■
miniSD card (512 MB), with SD card adapter
■
Publ. No. T559382 Rev. a358 – ENGLISH (EN) – June 23, 2009 39
Page 50

13 – Technical data
13.2 Additional data
Field of view &
distance (FLIR i5)
10780503;a1
Figure 13.1 Relationship between the fieldof viewand distance. 1: Distance to target;
2: VFOV =vertical field ofview; 3: HFOV =horizontal field of view, 4: IFOV = instan-
taneous field of view (size of one detector element).
This table gives examples ofthe field of view for different target distances. Note: The
table does not take into account the minimum focus distance.
10781103;a1
40 Publ. No. T559382 Rev. a358 – ENGLISH (EN) – June 23, 2009
Page 51

Field of view &
distance (FLIR i7)
13 – Technical data
10780503;a1
Figure 13.2 Relationship between the fieldof viewand distance. 1: Distance to target;
2: VFOV =vertical field ofview; 3: HFOV =horizontal field of view, 4: IFOV = instan-
taneous field of view (size of one detector element).
This table gives examples ofthe field of view for different target distances. Note: The
table does not take into account the minimum focus distance.
T638201;a1
Publ. No. T559382 Rev. a358 – ENGLISH (EN) – June 23, 2009 41
Page 52

13 – Technical data
13.3 Accessories data
USB cable Std A
↔ Mini B, 2 m/6.6
ft.
Battery
Power
supply/charger
with EU, UK, US
and AU plugs
Memory card, 512
MB miniSD
Cable length 2.0 m (6.6 ft.)
Standard USB-A to USB Mini-BConnector
Battery type Rechargeable Li Ion battery
3.6 VBattery voltage
Approximate lithium content: 0.7 gBattery note
Battery is charged inside the cameraCharging system
AC operation 100–240 V, 50/60 Hz output 5.0 VAC, 1.2 A
6 WPower
69.2 × 43.3 × 29.8 mm (2.7 × 1.7 × 1.2 in.)Size (L × W × H)
1.8 m (5.9 ft.)Cable length
Packaging, contents
Power supply/Battery charger
■
EU, UK, US and Australian plugs
■
512 MBMemory card, size
21.5 × 20 × 1.4 mm (0.85 × 0.79 × 0.06 in.)Size (L × W × H)
Packaging, contents
miniSD card
■
Adapter from miniSD Card to SD Memory Card
■
42 Publ. No. T559382 Rev. a358 – ENGLISH (EN) – June 23, 2009
Page 53

14 Dimensions
14.1 Camera (front)
Figure
10780603;a1
Publ. No. T559382 Rev. a358 – ENGLISH (EN) – June 23, 2009 43
Page 54

14 – Dimensions
14.2 Camera (side)
Figure
10780703;a1
44 Publ. No. T559382 Rev. a358 – ENGLISH (EN) – June 23, 2009
Page 55

15 Application examples
15.1 Moisture & water damage
General
NOTE
Figure
It is often possible to detect moisture and water damage in a house by using an infrared camera. This ispartly becausethe damaged area has adifferent heat conduction property and partly because it has a differentthermal capacity to storeheat than
the surrounding material.
Many factors can come into play as to how moisture or water damage will appear in
an infrared image.
For example,heating and coolingof these parts takes placeat different ratesdepending on the material and the time of day. For this reason, it is important that other
methods are used as well to check for moisture or water damage.
The imagebelow shows extensive waterdamage on anexternalwall where thewater
has penetrated the outer facing because of an incorrectly installed window ledge.
10739503;a1
Publ. No. T559382 Rev. a358 – ENGLISH (EN) – June 23, 2009 45
Page 56

15 – Application examples
15.2 Faulty contact in socket
General
NOTE
Figure
Depending on the type of connection a socket has, an improperly connected wire
can result in local temperature increase. This temperature increase is caused by the
reduced contact area between the connection point of the incoming wire and the
socket , and can result in an electrical fire.
A socket’s construction may differ dramatically from one manufacturer to another.
For this reason, different faults in a socket can lead to the same typical appearance
in an infrared image.
Local temperature increase can also result from improper contact between wire and
socket, or from difference in load.
The image below shows aconnection ofa cable to a socket where improper contact
in the connection has resulted in local temperature increase.
10739603;a1
46 Publ. No. T559382 Rev. a358 – ENGLISH (EN) – June 23, 2009
Page 57

15.3 Oxidized socket
15 – Application examples
General
NOTE
Figure
Depending on the typeof socket andthe environment in which thesocket is installed,
oxides may occur on the socket's contact surfaces. These oxides can lead to locally
increased resistance when the socket is loaded, which can be seen in an infrared
image as local temperature increase.
A socket’s construction may differ dramatically from one manufacturer to another.
For this reason, different faults in a socket can lead to the same typical appearance
in an infrared image.
Local temperature increase can also result from improper contact between a wire
and socket, or from difference in load.
The image below shows a series of fuses where one fuse has a raised temperature
on the contact surfaces against the fuse holder. Because of the fuse holder’s blank
metal, the temperature increase is not visible there, while it is visible on the fuse’s
ceramic material.
10739703;a1
Publ. No. T559382 Rev. a358 – ENGLISH (EN) – June 23, 2009 47
Page 58

15 – Application examples
15.4 Insulation deficiencies
General
NOTE
Figure
Insulation deficiencies may result from insulation losing volume over the course of
time and thereby not entirely filling the cavity in a frame wall.
An infraredcamera allowsyou to seethese insulation deficienciesbecause they either
have a different heat conduction property than sections with correctly installed insulation, and/or show the area where air is penetrating the frame of the building.
When you are inspecting a building, the temperature difference between the inside
and outside should be at least 10°C (18°F). Studs, water pipes, concrete columns,
and similar components may resemble an insulation deficiency in an infrared image.
Minor differences may also occur naturally.
In the image below, insulation in the roof framing is lacking.. Due to the absence of
insulation, air has forcedits way into the roof structure, whichthus takes on a different
characteristic appearance in the infrared image.
10739803;a1
48 Publ. No. T559382 Rev. a358 – ENGLISH (EN) – June 23, 2009
Page 59

15.5 Draft
15 – Application examples
General
NOTE
Figure
Draft can be found under baseboards, around door and window casings, and above
ceiling trim. This type of draft is often possible to see with an infrared camera, as a
cooler airstream cools down the surrounding surface.
When youare investigating draftin a house,there should besub-atmosphericpressure
in the house. Close all doors, windows, and ventilation ducts, and allow the kitchen
fan to run for a while before you take the infrared images.
An infrared image of draft often shows a typical stream pattern. You can see this
stream pattern clearly in the picture below.
Also keep in mind that drafts can be concealed by heat from floor heating circuits.
The image below shows a ceiling hatch where faulty installation has resulted in a
strong draft.
10739903;a1
Publ. No. T559382 Rev. a358 – ENGLISH (EN) – June 23, 2009 49
Page 60

16 Introduction to building
thermography
16.1 Important note
All camera functions and features that are described in this section may not be supported by your particular camera configuration.
16.2 Typical field investigations
16.2.1 Guidelines
As will be noted in subsequent sections there are a number of general guidelines the
user should take heed of when carrying out building thermography inspection. This
section gives a summary of these guidelines.
16.2.1.1 General guidelines
■ The emissivity of the majority of building materials fall between 0.85 and 0.95.
Setting the emissivity value in the camera to 0.90 can be regarded as a good
starting point.
■ An infrared inspection alone should never be used as a decision point for further
actions. Always verify suspicions and findings using other methods, such as construction drawings, moisture meters, humidity & temperature datalogging, tracer
gas testing etc.
■ Change level and span to thermally tune the infrared image and reveal more details.
The figurebelow shows the difference between a thermally untuned and a thermally
tuned infrared image.
10552103;a2
Figure 16.1 LEFT: A thermally untuned infrared image; RIGHT: A thermally tuned infrared image, after
having changed level and span.
50 Publ. No. T559382 Rev. a358 – ENGLISH (EN) – June 23, 2009
Page 61

16 – Introduction to building thermography
16.2.1.2 Guidelines for moisture detection, mold detection & detection of water damages
■ Building defects related to moisture and water damages may only show up when
heat has been applied to the surface, e.g. from the sun.
■ The presence of water changes the thermal conductivity and the thermal mass of
the building material. It may also change the surfacetemperature of building material due to evaporative cooling. Thermal conductivity is a material’s abilityto conduct
heat, while thermal mass is its ability to store heat.
■ Infrared inspection does not directly detect the presence of mold, rather it may be
used to find moisture where mold may develop or has already developed. Mold
requires temperatures between +4°C to +38°C (+40°F to +100°F), nutrients and
moisture to grow. Humidity levels above 50% can provide sufficient moisture to
enable mold to grow.
10556003;a1
Figure 16.2 Microscopic view of mold spore
16.2.1.3 Guidelines for detection of air infiltration & insulation deficiencies
■ For very accurate camera measurements, take measurements of the temperature
and enter this value in the camera.
■ It is recommended that there is a difference in pressure between the outside and
the inside of the building structure. This facilitates theanalysis of the infrared images
and reveals deficiencies that would not be visible otherwise. Although a negative
pressure of between 10 and 50 Pa is recommended, carrying out the inspection
at a lower negative pressure may be acceptable. To do this, close all windows,
doors and ventilation ducts and then run the kitchen exhaust fan for some time to
reach a negative pressure of 5–10 Pa (applies to residential houses only).
Publ. No. T559382 Rev. a358 – ENGLISH (EN) – June 23, 2009 51
Page 62

16 – Introduction to building thermography
■ A differencein temperaturebetween the inside and the outside of 10–15°C (18–27°F)
is recommended.Inspections can be carried out at a lower temperature difference,
but will make the analysis of the infrared images somewhat more difficult.
■ Avoid direct sunlight on a part of a building structure—e.g. a façade—that is to be
inspected from the inside. The sunlight will heat the façade which will equalize the
temperature differenceson theinside and mask deficiencies in the building structure.
Spring seasons with low nighttime temperatures (±0°C (+32°F)) and high daytime
temperatures (+14°C (+57°F)) are especially risky.
16.2.2 About moisture detection
Moisture in a building structure can originate from several different sources, e.g.:
■ External leaks, such as floods, leaking fire hydrants etc.
■ Internal leaks, such as freshwater piping, waste water piping etc.
■ Condensation, which is humidityin the air falling out as liquid water due to conden-
sation on cold surfaces.
■ Building moisture, which is any moisture in the building material prior to erecting
the building structure.
■ Water remaining from firefighting.
As a non-destructive detection method, using an infrared camera has a number of
advantages over other methods, and a few disadvantages:
DisadvantageAdvantage
The method is quick.
■
The methodis a non-intrusivemeansof investi-
■
gation.
The method does not require relocation of the
■
occupants.
The method features an illustrative visual pre-
■
sentation of findings.
The method confirms failure points and mois-
■
ture migration paths.
The method only detects surface temperature
■
differentials and can not see through walls.
The methodcan not detectsubsurfacedamage,
■
i.e. mold or structural damage.
16.2.3 Moisture detection (1): Low-slope commercial roofs
16.2.3.1 General information
Low-slope commercial roofing is one of the most common roof types for industrial
building, such as warehouses, industrial plants, machinery shops etc. Its major advantages over a pitched roof is the lower cost in material and building. However, due
to its design where snow and ice will not fall off by itself—as is the case for the majority of pitched roofs—it must be strongly built to support the accumulated weight of
both roof structure and any snow, ice and rain.
52 Publ. No. T559382 Rev. a358 – ENGLISH (EN) – June 23, 2009
Page 63

16 – Introduction to building thermography
Although a basic understanding of the construction of low-slope commercial roofs is
desirable whencarrying outa roof thermography inspection, expert knowledge is not
necessary. There is a large number of different design principles for low-slope commercial roofs—bothwhen itcomes tomaterial anddesign—and itwould beimpossible
for the infrared inspection person to know them all. If additional information about a
certain roof is needed, the architect or contractor of the building can usually supply
the relevant information.
Common causesof rooffailure areoutlined in the table below (from SPIE Thermosense
Proceedings Vol. 371 (1982), p. 177).
%Cause
47.6Poor workmanship
2.6Roof traffic
16.7Poor design
7.8Trapped moisture
8.0Materials
8.4Age & weathering
Potential leak locations include the following:
■ Flashing
■ Drains
■ Penetrations
■ Seams
■ Blisters
16.2.3.2 Safety precautions
■ Recommend a minimum of two people on a roof, preferably three or more.
■ Inspect the underside of the roof for structural integrity prior to walking on it.
■ Avoid stepping on blisters that are common on built up bitumen and gravel roofs.
■ Have a cell phone or radio available in case of emergency.
■ Inform local police and plant security prior to doing nighttime roof survey.
Publ. No. T559382 Rev. a358 – ENGLISH (EN) – June 23, 2009 53
Page 64

16 – Introduction to building thermography
16.2.3.3 Commented building structures
This section includes a few typical examples of moisture problems on low-slope
commercial roofs.
CommentStructural drawing
10553603;a2
Inadequate sealing of roof membrane around
conduit and ventilation ducts leading to local
leakage around the conduit or duct.
10553703;a2
Roof membrane inadequately sealed around roof
access hatch.
54 Publ. No. T559382 Rev. a358 – ENGLISH (EN) – June 23, 2009
Page 65

10553803;a2
16 – Introduction to building thermography
CommentStructural drawing
Drainage channels located too high and with too
low an inclination. Some water will remain in the
drainage channelafter rain, whichmay lead tolocal
leakage around the channel.
10553903;a2
Inadequate sealing between roof membrane and
roof outlet leading tolocal leakage aroundthe roof
outlet.
16.2.3.4 Commented infrared images
How do you find wet insulation below the surface of the roof? When the surface itself
is dry, including any gravel or ballast, a sunny day will warm the entire roof. Early in
the evening, if the sky is clear, the roof will begin to cool down by radiation. Because
of its higher thermal capacity the wet insulation will stay warmer longer than the dry
and will be visible in the infrared camera (see photos below). The technique is particularly effective on roofs having absorbent insulation—such as wood fiber, fiberglass,
and perlite—where thermal patterns correlate almost perfectly with moisture.
Publ. No. T559382 Rev. a358 – ENGLISH (EN) – June 23, 2009 55
Page 66

16 – Introduction to building thermography
Infrared inspections of roofs with nonabsorbent insulations, common in many singleply systems, are more difficult to diagnose because patterns are more diffuse.
This section includes a few typical infrared images of moisture problems on low-slope
commercial roofs:
CommentInfrared image
10554003;a1
Moisture detection on a roof, recorded during the
evening.
Since the building material affected by moisture
has ahigher thermal mass,itstemperature decreases slower than surrounding areas.
10554103;a1
10554203;a1
Water-damaged roofing components and insulation identified from infrared scan from the underside of the built-up roof on a structural concrete
tee deck.
Affected areas are cooler than the surrounding
sound areas, due to conductive and/or thermal
capacitive effect.
Daytime survey of built-up low-slope commercial
roof.
Affected areas are coolerthan the surroundingdry
areas, dueto conductiveand/orthermal capacitive
effect.
56 Publ. No. T559382 Rev. a358 – ENGLISH (EN) – June 23, 2009
Page 67

16 – Introduction to building thermography
16.2.4 Moisture detection (2): Commercial & residential façades
16.2.4.1 General information
Thermography has proven to be invaluable in the assessment of moisture infiltration
into commercial and residential façades. Being able to provide a physical illustration
of the moisture migration paths is more conclusive than extrapolating moisture meter
probe locations and more cost-effective than large intrusive test cuts.
16.2.4.2 Commented building structures
This section includes a few typical examples of moisture problems on commercial
and residential façades.
CommentStructural drawing
10554303;a2
Pelting rain penetrates the façade due to badly
executed bed joints. Moisture builds up in the
masonry above the window.
10554403;a2
Publ. No. T559382 Rev. a358 – ENGLISH (EN) – June 23, 2009 57
Pelting rain hits the window at an angle. Most of
the rain runs off the window edge flashing but
some finds its way into the masonry where the
plaster meets the underside of the flashing.
Page 68

16 – Introduction to building thermography
10554503;a2
CommentStructural drawing
Rain hits the façade at an angle and penetrates
the plaster through cracks. The water then follows
the inside of the plasterand leadsto frost erosion.
10554603;a2
Rain splashes on the façade and penetrates the
plaster andmasonryby absorption, whicheventually leads to frost erosion.
58 Publ. No. T559382 Rev. a358 – ENGLISH (EN) – June 23, 2009
Page 69

16 – Introduction to building thermography
16.2.4.3 Commented infrared images
This sectionincludes afew typical infrared imagesof moisture problems on commercial
& residential façades.
CommentInfrared image
10554703;a1
Improperly terminatedand sealed stone veneer to
window frame and missing flashings has resulted
in moisture infiltration into the wall cavity and interior living space.
10554803;a1
Moisture migration into drywallfrom capillary drive
and interior finish components from inadequate
clearance and slope of grade from vinyl siding
façade on an apartment complex.
16.2.5 Moisture detection (3): Decks & balconies
16.2.5.1 General information
Although there are differences in design, materials and construction, decks—plaza
decks, courtyard decks etc—suffer from the same moisture and leaking problems as
low-slope commercial roofs. Improper flashing, inadequately sealed membranes,
and insufficient drainage may lead to substantial damage in the building structures
below.
Balconies, although smaller in size, require the same care in design, choice of material, and workmanship as any other building structure. Since balconies are usually
supported on one side only, moisture leading to corrosion of struts and concrete reinforcement can cause problems and lead to hazardous situations.
Publ. No. T559382 Rev. a358 – ENGLISH (EN) – June 23, 2009 59
Page 70

16 – Introduction to building thermography
16.2.5.2 Commented building structures
This section includes a few typical examples of moisture problems on decks and
balconies.
CommentStructural drawing
10555203;a2
Improper sealing of paving and membrane to roof
outlet, leading to leakage during rain.
10555103;a2
No flashing at deck-to-wall connection, leading to
rain penetrating the concrete and insulation.
60 Publ. No. T559382 Rev. a358 – ENGLISH (EN) – June 23, 2009
Page 71

10555003;a2
16 – Introduction to building thermography
CommentStructural drawing
Water has penetrated the concrete due to inadequately sized drop apron and has led to concrete
disintegration and corrosion of reinforcement.
SECURITY RISK!
10554903;a2
Water has penetrated the plaster and underlying
masonry atthe pointwhere the handrailis fastened
to the wall.
SECURITY RISK!
Publ. No. T559382 Rev. a358 – ENGLISH (EN) – June 23, 2009 61
Page 72

16 – Introduction to building thermography
16.2.5.3 Commented infrared images
This section includes a few typical infrared images of moisture problems on decks
and balconies.
CommentInfrared image
10555303;a1
Improper flashing at balcony-to-wall connections
and missing perimeter drainage system resulted
in moistureintrusion into thewood framingsupport
structure of the exterior walkway balcony of a loft
complex.
10555403;a1
A missing composite drainage plane or medium
on a below-grade parking garage plaza deck
structure resulted in standing water between the
structural concrete deck and the plaza wearing
surface.
16.2.6 Moisture detection (4): Plumbing breaks & leaks
16.2.6.1 General information
Water from plumbing leaks can often lead to severe damage on a building structure.
Small leaks may be difficult to detect, but can—over the years—penetrate structural
walls and foundations to a degree where the building structure is beyond repair.
Using building thermography at an early stage when plumbing breaks and leaks are
suspected can lead to substantial savings on material and labor.
62 Publ. No. T559382 Rev. a358 – ENGLISH (EN) – June 23, 2009
Page 73

16 – Introduction to building thermography
16.2.6.2 Commented infrared images
This section includes a few typical infrared images of plumbing breaks & leaks.
CommentInfrared image
10555503;a1
Moisture migration tracking alongsteel joistchannels inside ceiling of a single family home where
a plumbing line had ruptured.
10555603;a1
Water from plumbing leak was found to have migrated farther than originally anticipated by the
contractor duringremediation techniques ofcutting
back carpet and installing dehumidifiers.
Publ. No. T559382 Rev. a358 – ENGLISH (EN) – June 23, 2009 63
Page 74

16 – Introduction to building thermography
10555703;a1
CommentInfrared image
The infrared image of this vinyl-sided 3-floor
apartment house clearly shows the path of a serious leak from awashing machine onthe third floor,
which is completely hidden within the wall.
10555803;a1
Water leak due to improper sealing between floor
drain and tiles.
64 Publ. No. T559382 Rev. a358 – ENGLISH (EN) – June 23, 2009
Page 75

16 – Introduction to building thermography
16.2.7 Air infiltration
16.2.7.1 General information
Due to the wind pressure on a building, temperature differences between the inside
and the outside of the building, and the fact that mostbuildings useexhaust air terminal
devices to extract used air from the building, a negative pressure of 2–5 Pa can be
expected. When this negative pressure leads to cold air entering the building structure
due to deficiencies in building insulation and/or building sealing, we have what is
called air infiltration. Air infiltration can be expected at joints and seams in the building
structure.
Due to the fact that air infiltration creates an air flow of cool air into e.g. a room, it can
lead to substantial deterioration of the indoor climate. Air flows as small as 0.15 m/s
(0.49 ft./s) are usually noticed by inhabitants, although these air flows may be difficult
to detect using ordinary measurement devices.
On an infrared image air infiltration can be identified by its typical ray pattern, which
emanates from the point of exit in the building structure—e.g. from behind a skirting
strip. Furthermore, areas of air infiltration typically have a lower detected temperature
than areas where there is only an insulation deficiency. This is due to the chill factor
of the air flow.
16.2.7.2 Commented building structures
This section includes a few typical examples of details of building structures where
air infiltration may occur.
CommentStructural drawing
10552503;a2
Publ. No. T559382 Rev. a358 – ENGLISH (EN) – June 23, 2009 65
Insulation deficiencies at the eaves of a brickwall
house due to improperly installed fiberglass insulation batts.
The air infiltration entersthe roomfrom behind the
cornice.
Page 76

16 – Introduction to building thermography
10552303;a2
CommentStructural drawing
Insulation deficiencies in an intermediate flow due
to improperly installed fiberglass insulation batts.
The air infiltration entersthe roomfrom behind the
cornice.
10552603;a2
Air infiltration in a concrete floor-over-crawl-space
due to cracks in the brick wall façade.
The air infiltration enters the room beneath the
skirting strip.
66 Publ. No. T559382 Rev. a358 – ENGLISH (EN) – June 23, 2009
Page 77

16 – Introduction to building thermography
16.2.7.3 Commented infrared images
This section includes a few typical infrared images of details of building structures
where air infiltration has occurred.
CommentInfrared image
10552703;a1
Air infiltration from behind a skirtingstrip. Note the
typical ray pattern.
10552803;a1
10552903;a1
Air infiltration from behind a skirtingstrip. Note the
typical ray pattern.
The white area to the left is a radiator.
Air infiltration from behind a skirtingstrip. Note the
typical ray pattern.
Publ. No. T559382 Rev. a358 – ENGLISH (EN) – June 23, 2009 67
Page 78

16 – Introduction to building thermography
16.2.8 Insulation deficiencies
16.2.8.1 General information
Insulation deficiencies do not necessarily lead to air infiltration. If fiberglass insulation
batts are improperly installed air pockets will form in the building structure. Since
these air pockets have a different thermal conductivity than areas wherethe insulation
batts are properly installed, the air pockets can be detected during a building thermography inspection.
As a rule of thumb, areas with insulation deficiencies typically have higher temperatures
than where there is only an air infiltration.
When carrying out building thermography inspections aimed at detecting insulation
deficiencies, be aware of the following parts in a building structure, which may look
like insulation deficiencies on the infrared image:
■ Wooden joists, studs, rafter, beams
■ Steel girders and steel beams
■ Water piping inside walls, ceilings, floors
■ Electrical installations inside walls, ceilings, floors—such as trunking, piping etc.
■ Concrete columns inside timber framed walls
■ Ventilation ducts & air ducts
16.2.8.2 Commented building structures
This section includes a few typical examples of details of building structures with insulation deficiencies:
CommentStructural drawing
10553203;a2
Insulation deficiencies (and air infiltration) due to
improper installation of insulation batts around an
electrical mains supply.
This kind of insulation deficiency will show up as
dark areas on an infrared image.
68 Publ. No. T559382 Rev. a358 – ENGLISH (EN) – June 23, 2009
Page 79

10553103;a2
16 – Introduction to building thermography
CommentStructural drawing
Insulation deficienciesdue toimproper installation
of insulation batts aroundan attic floor beam. Cool
air infiltrates the structure and cools down the inside of the ceiling.
This kind of insulation deficiency will show up as
dark areas on an infrared image.
10553003;a2
Insulation deficienciesdue toimproper installation
of insulation batts creating an air pocket on the
outside of an inclined ceiling.
This kind of insulation deficiency will show up as
dark areas on an infrared image.
Publ. No. T559382 Rev. a358 – ENGLISH (EN) – June 23, 2009 69
Page 80

16 – Introduction to building thermography
16.2.8.3 Commented infrared images
This section includes a few typical infrared images of insulation deficiencies.
CommentInfrared image
10553303;a1
Insulation deficiencies in an intermediate floor
structure. The deficiency may be due to either
missing insulation batts or improperly installed insulations batts (air pockets).
10553403;a1
Improperly installed fiberglass batts in a suspended ceiling.
70 Publ. No. T559382 Rev. a358 – ENGLISH (EN) – June 23, 2009
Page 81

10553503;a1
16 – Introduction to building thermography
CommentInfrared image
Insulation deficiencies in an intermediate floor
structure. The deficiency may be due to either
missing insulation batts or improperly installed insulations batts (air pockets).
Publ. No. T559382 Rev. a358 – ENGLISH (EN) – June 23, 2009 71
Page 82

16 – Introduction to building thermography
16.3 Theory of building science
16.3.1 General information
The demand for energy-efficient constructions has increased significantly in recent
times. Developments in the field of energy, together with the demand for pleasant
indoor environments,have resulted in ever-greater significance having to be attached
to both the function of a building’s thermal insulation and airtightnessand theefficiency
of its heating and ventilation systems.
Defective insulation and tightness in highly insulated and airtight structures can have
a great impact on energy losses. Defects in a building’s thermal insulation and airtightness do not merely entail risk of excessive heating and maintenance costs, they also
create the conditions for a poor indoor climate.
A building’s degree of insulation is often stated in the form of a thermal resistance or
a coefficient of thermal transmittance (U value) for the various parts of the building.
However, the stated thermal resistance values rarely provide a measure of the actual
energy losses in a building. Air leakage from joints and connectionsthat are not airtight
and insufficiently filled with insulation often gives rise to considerable deviations from
the designed and expected values.
Verification that individual materials and building elements have the promised properties is provided by means of laboratory tests. Completed buildings have to be
checked andinspected in order to ensure that their intended insulation and airtightness
functions are actually achieved.
In its structural engineering application, thermography is used to study temperature
variations over the surfaces of a structure. Variations in the structure’s thermal resistance can, under certain conditions, produce temperature variations on its surfaces.
Leakage of cold (or warm) air through the structurealso affects the variation in surface
temperature. This means that insulation defects, thermal bridges and air leaks in a
building’s enclosing structural components can be located and surveyed.
Thermography itself does not directly show the structure’s thermal resistance or airtightness. Where quantification of thermal resistance or airtightness is required, additional measurementshave also to be taken. Thermographic analysis of buildings relies
on certain prerequisites in terms of temperature and pressure conditions across the
structure.
Details, shapesand contrasts in the thermal image can vary quite clearly withchanges
in any of these parameters. The in-depth analysis and interpretation of thermal images
therefore requires thorough knowledge of such aspects as material and structural
properties, the effects of climate and the latest measuring techniques. For assessing
72 Publ. No. T559382 Rev. a358 – ENGLISH (EN) – June 23, 2009
Page 83

16 – Introduction to building thermography
the results of measurements, there are special requirements in terms of the skills and
experience of those taking the measurements, e.g. by means of authorization by a
national or regional standardization body.
16.3.2 The effects of testing and checking
It can be difficult to anticipate how well the thermal insulation and airtightness of a
completed building will work. There are certain factors involved in assembling the
various components and building elements that can have a considerable impact on
the final result. The effects of transport, handling and storage at the site and the way
the work is done cannot be calculated in advance. To ensure that the intended function
is actually achieved, verification by testing and checking the completed building is
required.
Modern insulation technology has reduced the theoretical heat requirement. This
does mean, however, that defects that are relatively minor, but at important locations,
e.g. leaking joints or incorrectly installed insulation, can have considerable consequences in terms both of heat and comfort. Verification tests, e.g. by means of thermography, have proved their value, from the point of view both of the designer and
the contractor and of the developer, the property manager and the user.
■ For the designer, the important thing is to find out about the function of various
types of structures, so that they can be designed to take into account both working
methods and functional requirements. The designer must also know how different
materials and combinations of materials function in practice. Effective testing and
checking, as well as experiential feedback, can be used to achieve the required
development in this area.
■ The contractor is keen on more testing and inspection in order to ensure that the
structures keep to an expected function that corresponds to established requirements in the regulations issued by authorities and in contractual documents. The
contractor wants to know at an early stage of construction about any changes that
may benecessary sothat systematic defects can be prevented. During construction,
a check should therefore be carried out on the first apartments completed in a
mass production project. Similar checking then follows as production continues.
In this way systematic defects can be prevented and unnecessary costs and future
problems can be avoided. This check is of benefit both to manufacturers and to
users.
■ For the developer and the propertymanager itis essentialthat buildings are checked
with reference to heat economy, maintenance (damage from moisture or moisture
infiltration) and comfort for the occupants (e.g. cooled surfacesand airmovements
in occupied zones).
Publ. No. T559382 Rev. a358 – ENGLISH (EN) – June 23, 2009 73
Page 84

16 – Introduction to building thermography
■ For the user the important thing is that the finished product fulfills the promised
requirements in terms of the building’s thermal insulation and airtightness. For the
individual, buying a house involves a considerable financial commitment, and the
purchaser therefore wants to know that any defects in the construction will not involve serious financial consequences or hygiene problems.
The effects of testing and checking a building’s insulation and airtightness are partly
physiological and partly financial.
The physiological experience of an indoor climatic environment is very subjective,
varying according to the particular human body’s heat balance and the way the individual experiencestemperature. Theexperience ofclimate dependson boththe indoor
air temperature and that of the surrounding surfaces. The speed of movement and
moisture content of indoor air are also of some significance. Physiologically, a draft
produces the sensation of local cooling of the body’s surface caused by
■ excessive air movements in the occupied zone with normal air temperature;
■ normal air movements in the occupied zone but a room temperature that is too
low;
■ substantial radiated heat exchange with a cold surface.
It is difficult to assess the quantitative effects of testing and checking a building’s
thermal insulation.
Investigations haveshown that defects found in the thermal insulation and airtightness
of buildings cause heat losses that are about 20–30% more than was expected.
Monitoring energyconsumption before and after remedial measures in relatively large
complexes of small houses and in multi-dwelling blocks has also demonstrated this.
The figures quoted are probably not representative of buildings in general, since the
investigation data cannot be said to be significant for the entire building stock. A
cautious assessment however would be that effectively testing and checking a
building’s thermal insulation and airtightness can result in a reduction in energy
consumption of about 10%.
Research hasalso shown that increased energy consumption associated with defects
is often caused by occupants increasing the indoor temperature by one or a few degrees abovenormal to compensate for the effect of annoying thermal radiation towards
cooled surfaces or a sensation of disturbing air movements in a room.
16.3.3 Sources of disruption in thermography
During a thermographic survey, the risk of confusing temperature variations caused
by insulation defects with those associated with the natural variation in U values along
warm surfaces of a structure is considered slight under normal conditions.
74 Publ. No. T559382 Rev. a358 – ENGLISH (EN) – June 23, 2009
Page 85

16 – Introduction to building thermography
The temperature changes associated with variations in the U value are generally
gradual and symmetrically distributed across the surface. Variations of this kind do
of course occur at the angles formed by roofs and floors and at the corners of walls.
Temperature changes associated with air leaks or insulation defects are in most
cases more evident with characteristically shaped sharp contours. The temperature
pattern is usually asymmetrical.
During thermography and when interpreting an infrared image, comparison infrared
images can provide valuable information for assessment.
The sources of disruption in thermography that occur most commonly in practice are
■ the effect of the sun on the surface being thermographed (sunlight shining in
through a window);
■ hot radiators with pipes;
■ lights directed at, or placed near, the surface being measured;
■ air flows (e.g. from air intakes) directed at the surface;
■ the effect of moisture deposits on the surface.
Surfaces on which the sun is shining should not be subjected to thermography. If
there is a risk of an effect by sunlight, windows shouldbe covered up (closing Venetian
blinds). However, be aware that there are building defects or problems (typically
moisture problems) that only show up when heat has been applied to the surface,
e.g. from the sun.
For more information about moisture detection, see section 16.2.2 – About moisture
detection on page 52.
A hot radiator appears as a bright light surface in an infrared image. The surface
temperature of a wall next to a radiator is raised, which may conceal any defects
present.
For maximum prevention of disruptive effects from hot radiators, these may be shut
off a short while before the measurement is taken. However, depending on the construction of the building (low or high mass), these may need to be shut off several
hours before a thermographic survey. The room air temperature must not fall so much
as to affect the surface temperature distribution on the structure’s surfaces. There is
little timelag with electric radiators, so they cool down relatively quickly once they
have been switched off (20–30 minutes).
Lights placed against walls should be switched off when the infrared image is taken.
During a thermographic survey there should not be any disruptive airflows (e.g.open
windows, open valves, fans directed at the surface being measured) that could affect
the surfaces being thermographed.
Publ. No. T559382 Rev. a358 – ENGLISH (EN) – June 23, 2009 75
Page 86

16 – Introduction to building thermography
Any wet surfaces, e.g. as a result of surface condensation, have a definite effect on
heat transfer at the surface and the surface temperature. Where there is moisture on
a surface, there is usually some evaporation which draws off heat, thus lowering the
temperature of the surface by several degrees. There is risk of surface condensation
at major thermal bridges and insulation defects.
Significant disruptions of the kind described here can normally be detected and
eliminated before measuring.
If during thermography it is not possible to shield surfaces being measured from
disruptive factors,these mustbe takeninto accountwhen interpretingand evaluating
the results. The conditions in which the thermography was carried out should be
recorded in detail when each measurement is taken.
16.3.4 Surface temperature and air leaks
Defects in building airtightness due to small gaps in the structure can be detected
by measuring the surface temperature. If there is a negative pressure in the building
under investigation, air flows into the space through leaks in the building. Cold air
flowing in through small gaps in a wall usually lowers the temperature in adjacent
areas of the wall. The result is that a cooled surface area with a characteristic shape
develops on the inside surface of the wall. Thermography can be used to detect
cooled surface areas. Air movements at the wall surface can be measured using an
air velocity indicator. If there is a positive pressure inside the building being investigated, warm room air will leak out through gaps in the wall, resulting in locally warm
surface areas around the locations of the leaks.
The amountof leakagedepends partly on gaps and partly on the differential pressure
across the structure.
16.3.4.1 Pressure conditions in a building
The most important causes of differential pressure across a structural element in a
building are
■ wind conditions around the building;
■ the effects of the ventilation system;
■ temperature differences between air inside and outside (thermal differential pres-
sure).
The actualpressure conditions inside a building are usually caused by a combination
of these factors.
The resultantpressure gradientacross the various structural elements can be illustrated
by the figure on page 78. The irregular effects of wind on a building means that in
practice the pressure conditions may be relatively variable and complicated.
76 Publ. No. T559382 Rev. a358 – ENGLISH (EN) – June 23, 2009
Page 87

In a steady wind flow, Bernoulli’s Law applies:
where:
16 – Introduction to building thermography
ρ
Air density in kg/m
Wind velocity in m/sv
Static pressure in Pap
3
and where:
denotes the dynamic pressure and p the static pressure. The total of these pressures
gives the total pressure.
Wind load against a surface makes the dynamic pressure become a static pressure
against the surface. The magnitude of this static pressure is determined by, amongst
other things, the shape of the surface and its angle to the wind direction.
The portion of the dynamic pressure that becomes a static pressure on the surface
(p
) is determined by what is known as a stress concentration factor:
stat
If ρ is 1.23 kg/m3(density of air at +15°C (+59°F)), this gives the following local
pressures in the wind flow:
Publ. No. T559382 Rev. a358 – ENGLISH (EN) – June 23, 2009 77
Page 88

16 – Introduction to building thermography
10551803;a1
Figure 16.3 Distribution of resultant pressureson a building’senclosing surfaces dependingonwind effects,
ventilation and internal/external temperature difference. 1: Wind direction;Tu: Thermodynamic air temperature outdoors in K; Ti: Thermodynamic air temperature indoors in K.
If the whole of the dynamic pressure becomes static pressure, then C = 1. Examples
of stress concentration factor distributions for a building with various wind directions
are shown in the figure on page 79.
The wind therefore causes an internal negative pressure on the windward side and
an internal positive pressure on the leeward side. The air pressure indoors depends
on the wind conditions, leaks in the building and how these are distributed in relation
to the wind direction. If the leaks in the building are evenly distributed, the internal
pressure may vary by ±0.2 p
. If most of the leaks are on the windward side, the
stat
internal pressure increases somewhat. In the opposite case, with most of the leaks
on the leeward side, the internal pressure falls.
78 Publ. No. T559382 Rev. a358 – ENGLISH (EN) – June 23, 2009
Page 89

10551903;a1
16 – Introduction to building thermography
Figure 16.4 Stress concentration factor (C) distributions for various wind directions and wind velocities
(v) relative to a building.
Wind conditions can vary substantially over time and between relatively closely situated locations. In thermography, such variations can have a clear effect on the measurement results.
It has been demonstrated experimentally that the differential pressure on a façade
exposed to an average wind force of about 5 m/s (16.3 ft/s) will be about 10 Pa.
Mechanical ventilation results in a constant internal negative or positive pressure
(depending onthe direction of the ventilation). Research has showed that the negative
pressure caused by mechanical extraction (kitchen fans) in small houses is usually
between 5 and 10 Pa. Where there is mechanical extraction of ventilation air, e.g. in
multi-dwelling blocks, the negative pressure is somewhat greater, 10–50 Pa. Where
there is so-called balanced ventilation (mechanically controlled supply and extract
air), this is normally adjusted to produce a slight negative pressure inside (3–5 Pa).
The differential pressure caused by temperature differences, the so-called chimney
effect (airtightness differences of air at different temperatures) means that there is a
negative pressure in the building’s lower part and a positive pressure in the upper
Publ. No. T559382 Rev. a358 – ENGLISH (EN) – June 23, 2009 79
Page 90

16 – Introduction to building thermography
part. At a certain height there is a neutral zone where the pressures on the inside and
outside are the same, see the figure on page 81. This differential pressure may be
described by the relationship:
Air pressure differential within the structure in PaΔp
2
g
ρ
u
u
i
9.81 m/s
Air density in kg/m
Thermodynamic air temperature outdoors in KT
Thermodynamic air temperature indoors in KT
Distance from the neutral zone in metersh
3
If ρu= 1.29 kg/m3(density of air at a temperature of 273 K and ≈100 kPa), this produces:
With a difference of +25°C (+77°F) between the ambient internal and external temperatures, the result is a differential pressure difference within the structure of about
1 Pa/m difference in height (= 3.28 Pa/ft.).
80 Publ. No. T559382 Rev. a358 – ENGLISH (EN) – June 23, 2009
Page 91

10552003;a1
16 – Introduction to building thermography
Figure 16.5 Distribution of pressures on a building withtwo openingsand wherethe external temperature
is lower than the internal temperature. 1: Neutral zone; 2: Positive pressure; 3: Negative pressure;
h: Distance from the neutral zone in meters.
The position of the neutral zone may vary, depending on any leaks in the building. If
the leaks are evenly distributed vertically, this zone will be about halfway up the
building. If more of the leaks are in the lower part of the building, the neutral zone will
move downwards. If more of the leaks are in the upper part, it will move upwards.
Where a chimney opens above the roof, this has a considerable effect on the position
of the neutral zone, and the result may be a negativepressure throughoutthe building.
This situation most commonly occurs in small buildings.
In a larger building, such as a tall industrial building, with leaks at doors and any
windows in the lower part of the building, the neutral zone is about one-third of the
way up the building.
Publ. No. T559382 Rev. a358 – ENGLISH (EN) – June 23, 2009 81
Page 92

16 – Introduction to building thermography
16.3.5 Measuring conditions & measuring season
The foregoing may be summarized as follows as to the requirements with regard to
measuring conditions when carrying out thermographic imaging of buildings.
Thermographic imaging is done in such a way that the disruptive influence from external climatic factors is as slight as possible. The imaging process is therefore carried
out indoors, i.e. where a building is heated, the structure’s warm surfaces are examined.
Outdoor thermography is only used to obtain reference measurements of larger
façade surfaces. In certain cases, e.g. where the thermal insulation is very bad or
where there is an internal positive pressure, outdoor measurements may be useful.
Even when investigating the effects of installations located within the building’sclimatic
envelope, there may be justification for thermographic imaging from outside the
building.
The following conditions are recommended:
■ The air temperature difference within the relevant part of the building must be at
least +10°C (+18°F) for a number of hours before thermographic imaging and for
as long as the procedure takes. For the same period, the ambient temperature
difference must not vary by more than ±30% of the difference when the thermographic imaging starts. During the thermographic imaging, the indoor ambient
temperature should not change by more than ±2°C (±3.6°F).
■ For a number of hours prior before thermographic imaging and as long as it con-
tinues, no influencing sunlight may fall upon the relevant part of the building.
■ Negative pressure within the structure ≈ 10–50 Pa.
■ When conducting thermographic imaging in order to locate only air leaks in the
building’s enclosing sections, the requirements in terms of measuring conditions
may be lower. A difference of 5°C (9°F) between the inside and outside ambient
temperatures ought to be sufficient for detecting such defects. To be able to detect
air leaks, certain requirements must however be made with regard to the differential
pressure; about 10 Pa should be sufficient.
16.3.6 Interpretation of infrared images
The main purpose of thermography is to locate faults and defects in thermal insulation
in exterior walls and floor structures and to determine their nature and extent. The
measuring taskcan also be formulated in such a way that the aim of thethermography
is to confirm whether or not the wall examined has the promised insulation and airtightness characteristics. The ‘promised thermal insulation characteristics’ for the wall
according to the design can be converted into an expected surface temperature distribution for the surface under investigation if the measuring conditions at the time
when the measurements are taken are known.
82 Publ. No. T559382 Rev. a358 – ENGLISH (EN) – June 23, 2009
Page 93

16 – Introduction to building thermography
In practice the method involves the following:
Laboratory or field tests are used to produce an expected temperature distribution in
the form of typical or comparative infrared images for common wall structures, comprising both defect-free structures and structures with in-built defects.
Examples of typical infrared images are shown in section 16.2 – Typical field investigations on page 50.
If infrared images of structural sections taken during field measurements are intended
for use as comparison infrared images, then the structure’s composition, the way it
was built, and the measurement conditions at the time the infrared image was taken
must be known in detail and documented.
In order, during thermography, to be able to comment on the causes of deviations
from the expected results, the physical, metrological and structural engineering prerequisites must be known.
The interpretation of infrared images taken during field measurements may be described in brief as follows:
A comparison infrared image for a defect-free structure is selected on the basis of
the wall structure under investigation and the conditions under which the field measurement was taken. An infrared image of the building element under investigation
is then compared with the selected infrared image. Any deviation that cannot be explained by the design of the structure or the measurement conditions is noted as a
suspected insulationdefect. Thenature and extent of the defect is normally determined
using comparison infrared images showing various defects.
If no suitable comparison infrared image is available, evaluation and assessment are
done on the basis of experience. This requires more precise reasoning during the
analysis.
When assessing an infrared image, the following should be looked at:
■ Uniformity of brightness in infrared images of surface areas where there are no
thermal bridges
■ Regularity and occurrence of cooled surface areas, e.g. at studding and corners
■ Contours and characteristic shapes in the cooled surface area
■ Measured temperature differences between the structure’s normal surface temper-
ature and the selected cooled surface area
■ Continuity and uniformity of the isotherm curve on the surface of the structure. In
the camera software the isotherm function is called Isotherm or Color alarm, depending on camera model.
Publ. No. T559382 Rev. a358 – ENGLISH (EN) – June 23, 2009 83
Page 94

16 – Introduction to building thermography
Deviations and irregularities in the appearance of the infrared image often indicate
insulation defects. There may obviouslybe considerable variations in theappearance
of infrared images of structures with insulation defects. Certain types of insulation
defects have a characteristic shape on the infrared image.
Section 16.2 – Typical field investigations on page 50 shows examples of interpretations of infrared images.
When taking infrared images of the same building, the infrared images from different
areas should be taken with the same settings on the infrared camera, as this makes
comparison of the various surface areas easier.
16.3.7 Humidity & dew point
16.3.7.1 Relative & absolute humidity
Humidity can be expressed in two different ways—either as relative humidity or as
absolute humidity. Relative humidity is expressed in percent of how much water a
certain volume of air can hold at a certain temperature, while absolute humidity is
expressed in percent water by weight of material. The latter way to express humidity
is common when measuring humidity in wood and other building materials.
The higher the temperature of air, the larger the amount of water this certain volume
of air can hold. The following table specifies the maximum amounts of water in air at
different temperatures.
Figure 16.6 A: Temperature in degrees Celsius; B: Maximum amount of water expressed in g/m3(at sea
level)
BABABABA
4.860.09.4210.017.3320.030.4430.0
4.49-1.08.849.016.3419.028.8329.0
4.15-2.08.298.015.4018.027.2928.0
3.83-3.07.777.014.5117.025.8327.0
3.53-4.07.286.013.6616.024.4326.0
3.26-5.06.815.012.8615.023.1025.0
3.00-6.06.384.012.0914.021.8324.0
2.76-7.05.963.011.3713.020.6223.0
2.54-8.05.572.010.6912.019.4722.0
2.34-9.05.211.010.0411.018.3821.0
84 Publ. No. T559382 Rev. a358 – ENGLISH (EN) – June 23, 2009
Page 95

16 – Introduction to building thermography
Figure 16.7 A: Temperature in degrees Fahrenheit; B: Maximum amount of water in gr/ft3(at sea level)
BABABABA
2.1232.04.1250.07.5868.013.3086.0
1.9630.23.8648.27.1466.212.6084.2
1.8128.43.6246.46.7364.411.9382.4
1.6726.63.4044.66.3462.611.2980.6
1.5424.83.1842.85.9760.810.6878.8
1.4223.0.2.9841.05.6259.010.1077.0
1.3121.22.7939.25.2957.29.5475.2
1.2119.42.6137.44.9755.49.0173.4
1.1117.62.4435.64.6753.68.5171.6
1.0215.82.2833.84.3951.88.0369.8
Example:
The relative humidity of a certain volume of air at a temperature of +30°C (+86°F) is
40 % RH. Amount of water in 1 m3(35.31 ft3) of air at +30°C = 30.44 × Rel Humidity
= 30.44 × 0.40 = 12.18 g (187.96 gr).
16.3.7.2 Definition of dew point
Dew point is the temperature at which the humidity in a certain volume of air will
condense as liquid water.
Example:
The relative humidity of a certain volume of air at a temperature of +30°C (+86°F) is
40 % RH. Amount of water in 1 m3(35.31 ft3) of air at +30°C = 30.44 × Rel Humidity
= 30.44 × 0.40 = 12.18 g (187.96 gr). In the table above, look up the temperature
for which the amount of water in air is closest to 12.18 g. This would be +14.0°C
(+57.2°F), which is the approximate dew point.
16.3.8 Excerpt from Technical Note ‘Assessing thermal bridging and insulation continuity’ (UK example)
16.3.8.1 Credits
This Technical Note was produced by a working group including expert thermographers, and research consultants. Additional consultation with other persons and organisations results in this document being widely accepted by all sides of industries.
The contents of this Technical Note is reproduced with kind permission from, and
fully copyrighted to, United Kingdom Thermography Association (UKTA).
Publ. No. T559382 Rev. a358 – ENGLISH (EN) – June 23, 2009 85
Page 96

16 – Introduction to building thermography
UK Thermography Association
c/o British Institute of Nondestructive Testing
1 Spencer Parade
Northampton NN1 5AA
United Kingdom
Tel: +44 (0)1604 630124
Fax: +44 (0)1604 231489
16.3.8.2 Introduction
Over the last few years the equipment, applications, software, and understanding
connected with thermography have all developed at an astonishing rate. As the
technology hasgradually becomeintegrated intomainstream practises,a corresponding demand for application guides, standards and thermography training has arisen.
The UKTA ispublishing this technical note in order to establish a consistent approach
to quantifying the results for a ‘Continuity of Thermal Insulation’ examination. It is intended that specifiers should refer to this document as a guide to satisfying the requirement in the Building Regulations, therefore enabling the qualified thermographer
to issue a pass or fail report.
16.3.8.3 Background information
Thermography can detect surface temperature variations as small as 0.1 K and
graphic images can be produced that visibly illustrate the distribution of temperature
on building surfaces.
Variations in the thermal properties of building structures, such as poorly fitted or
missing sections of insulation, cause variations in surface temperature on both sides
of the structure. They are therefore visible to the thermographer. However, many
other factors such as local heat sources, reflections and air leakage can also cause
surface temperature variations.
The professional judgement of the thermographer is usually required to differentiate
between real faults and other sources of temperature variation. Increasingly, thermographers are asked to justify their assessment of building structures and, in the absence of adequate guidance, it can be difficult to set definite levels for acceptable or
unacceptable variation in temperature.
The current Standard for thermal iamging of building fabric in the UK is BS EN
13187:1999 (BS EN 13187:1999, Thermal Performance of Buildings—Qualitative detection of thermal properties in building envelopes—Infrared method (ISO 6781:1983
modified). However, this leaves interpretation ofthe thermal image to the professional
expertise of of the thermographer and provides little guidance on the demarcation
between acceptable and unacceptable variations. Guidance on the appearance of a
86 Publ. No. T559382 Rev. a358 – ENGLISH (EN) – June 23, 2009
Page 97

16 – Introduction to building thermography
range ofthermal anomaliescan be found in BINDT Guides to thermal imaging (Infrared
Thermography Handbook; Volume 1, Principles and Practise, Norman Walker, ISBN
0903132338, Volume 2, Applications, A. N. Nowicki, ISBN 090313232X, BINDT, 2005).
16.3.8.3.1 Requirements
A thermographic survey to demonstrate continuity of insulation, areas of thermal
bridging and compliance with Building Regulations should include the following:
■ Thermal anomalies.
■ Differentiate between real thermal anomalies, where temperature differences are
caused by deficiencies in thermal insulation, and those that occur through confounding factors such as localised differences in air movement, reflection and
emissivity.
■ Quantify affected areas in relation to the total insulated areas.
■ State whether the anomalies and the building thermal insulation as a whole are
acceptable.
16.3.8.4 Quantitative appraisal of thermal anomalies
A thermographicsurvey willshow differencesin apparent temperature of areas within
the field of view. To be useful, however, it must systematically detect all the apparent
defects; assess them against a predetermined set of criteria; reliably discount those
anomalies that are not real defects; evaluate those that are real defects, and report
the results to the client.
16.3.8.4.1 Selection of critical temperature parameter
The BRE information Paper IP17/01 (Information Paper IP17/01, Assessing the Effects
of Thermal Bridging at Junctions and Around Openings. Tim Ward, BRE, 2001) provides useful guidance on minimum acceptable internal surface temperatures and
appropriate values of Critical Surface Temperature Factor, f
. The use of a surface
CRsi
temperature factor allows surveys under any thermal conditions to show areas that
are at risk of condensation or mould growth under design conditions.
The actual surface temperature will depend greatly on the temperatures inside and
outside at the time of the survey, but a ‘Surface Temperature Factor’ (f
) has been
Rsi
devised that is independent of the absolute conditions. It is a ratio of temperature
drop across the building fabric to the total temperature drop between inside and
outside air.
For internal surveys: f
= (Tsi– Te)/(Ti– Te)
Rsi
Tsi= internal surface temperature
Ti= internal air temperature
Te= external air temperature
Publ. No. T559382 Rev. a358 – ENGLISH (EN) – June 23, 2009 87
Page 98

16 – Introduction to building thermography
A value for f
of 0.75 is considered appropriate across new building as the upper
CRsi
end usage is not a factor considered in testingfor ‘Continuity of Insulation’, or ‘Thermal
Bridging’. However, when considering refurbished or extended buildings, for example
swimming pools, internal surveys may need to account for unusal circumstances.
16.3.8.4.2 Alternative method using only surface temperatures
There arestrong argumentsfor basingthermographic surveys on surface temperatures
alone, with no need to measure air temperature.
■ Stratification inside the building makes reference to air internal temperatures very
difficult. Is it mean air temperature, low level, high level or temperature at the level
of the anomaly and how far from the wall should it be measured?
■ Radiation effects, such as radiation to the night sky, make use of of external air
temperature difficult. It is not unusual for the outside surface of building fabric to
be below air temperature because of radiation to the sky which may be as low as
–50℃ (–58℉). This can be seen with the naked eye by the fact that dew and frost
often appear on building surfaces even when the air temperature does not drop
below the dewpoint.
■ It should be noted that the concept of U values is based on ‘environmental temper-
atures’ on each side of the structure. This is neglected by many inexperienced
analysts.
■ The two temperatures that are firmly related to the transfer of heat through building
fabric (and any solid) are the surface temperatures on each side.
■ Therefore, by referring to surface temperatures the survey is more repeatable.
■ The surface temperatures used are the averages of surface temperatures on the
same material in an area near the anomaly on the inside and the outside of the
fabric. Together with the temperature of the anomaly, a threshold level can be set
dependent on these temperatures using the critical surface temperature factor.
■ These arguments do not obviate the need for the thermographer to beware of re-
flections of objects at unusual temperatures in the background facing the building
fabric surfaces.
■ The thermographer should also use a comparison between external faces facing
different directions to determine whether there is residual heat from solar gain affecting the external surfaces.
■ External surveys should not be conducted on a surface where T
– Tsoon the face
si
is more than 10% greater than Tsi– Tsoon the north or nearest to north face.
■ For a defect that causes a failure under the 0.75 condition of IP17/01 the critical
surface factors are 0.78 on the inside surface and 0.93 on the outside surface.
The table below shows the internal and external surface temperatures at an anomaly
which would lead to failure under IP17/01. It also shows the deterioration in thermal
insulation that is necessary to cause this.
88 Publ. No. T559382 Rev. a358 – ENGLISH (EN) – June 23, 2009
Page 99

16 – Introduction to building thermography
Failing areaGood areaExample for lightweight built-up cladding with defective
insulation
00Outside temperature in ℃
15.019.1Inside surface temperature in ℃
1.50.3Outside surface temperature in ℃
0.750.95Surface factor from IP17/01
0.92Critical external surface temperature factor, after IP17/01
5.180Insulation thickness to give this level of performance, mm
1.920.35Local U value W/m2K
0.78UKTA TN1 surface factor
0.93UKTA TN1 surface factor outside
Notes to the table
1 Values of surface resistances taken from ADL2 2001, are:
■ Inside surface 0.13 m
■ Outside surface 0.04 m
2
K/W
2
K/W
These originatefrom BS EN ISO 6946 (BN EN ISO 6946:1997 Building components
and building elements - Thermal resistance and thermal transmittance - Calculation
method).
2 Thermal insulation used here is assumed to have a conductivity of 0.03 W/m K.
3 The difference in temperature between an anomaly and the good areas is 1.2 de-
grees on the outside and 4.1 degrees on the inside.
4 The UKTA TN1 surface temperature factor for internal surveys is:
Fsi= (T
– Tso)/(Tsi– Tso)
sia
where:
T
= internal surface temperature at anomaly
sia
Tso= external surface temperature (good area)
Tsi= internal surface temperature (good area)
5 The UKTA TN1 surface temperature factor for external surveys is:
Fso= (T
where T
– Tsi)/(Tso– Tsi)
soa
= external surface temperature at anomaly
soa
16.3.8.4.3 Selecting maximum acceptable defect area
The allowable area of defect is a quality control issue. It can be argued that there
should be no area on which condensation, mould growth or defective insulation will
occur andany suchanomalies shouldbe includedin the report. However, a commonly
Publ. No. T559382 Rev. a358 – ENGLISH (EN) – June 23, 2009 89
Page 100

16 – Introduction to building thermography
used value of 0.1% of the building exposed surface area is generally accepted as the
maximum combined defect area allowable to comply with the Building Regulations.
This represents one square metre in every thousand.
16.3.8.4.4 Measuring surface temperature
Measurement of surface temperature is the function of the infrared imaging system.
The trained thermographer will recognise, account for and report on the variation of
emissivity and reflectivity of the surfaces under consideration.
16.3.8.4.5 Measuring area of the defects
Measurement of defect area can be performed by pixel counting in the thermal analysis software or most spreadhseet packages provided that:
■ the distance from camera to object is accurately measured probably using a laser
measurement system,
■ the target distance should take into account the IFOV of the imaging system,
■ any angular change between the camera and the object surface from the perpen-
dicular is accounted for.
Buildings consist of numerous construction features that are not conducive to quantitative surveys including windows, roof lights, luminaries, heat emitters, cooling
equipment, service pipes and electrical conductors. However, the joints and connections between these objects and the building envelope should be considered as part
of the survey.
16.3.8.5 Conditions and equipment
To achieve best results from a thermal insulation survey it is important to consider
the environmentalconditions andto usethe mostappropriate thermographictechnique
for the task.
Thermal anomalies will only present themselves to the thermographer where temperature differences exist and environmental phenomena are accounted for. As a minimum, the following conditions should be complied with:
■ Temperature differences across the building fabric to be greater than 10℃ (18℉).
■ Internal air to ambient air temperature difference to be greater than 5℃ (9℉) for
the last twentyfour hours before survey.
■ External air temperature to be within ±3℃ (±5.4℉) for duration of survey and for
the previous hour.
■ External air temperature to be within ±10℃ (±18℉) for the preceding twentyfour
hours.
In addition, external surveys should also comply with the following:
90 Publ. No. T559382 Rev. a358 – ENGLISH (EN) – June 23, 2009
 Loading...