

Page 1
ThermoVision™ Sentinel
Operator’s manual
1 557 544Publ. No.
a121Revision
English (EN)Language
October 6, 2005Issue date
Page 2

Page 3

ThermoVision™
Sentinel
Operator’s manual
Publ. No. 1 557 544 Rev. a121 – ENGLISH (EN) – October 6, 2005
Page 4

Legal disclaimer
All products manufactured by FLIR Systemsarewarranted against defectivematerialsandworkmanship for aperiodof one(1)year from the
delivery date of the original purchase, provided such products have been under normal storage, use and service, and in accordance with
FLIR Systems instruction.
All products not manufactured by FLIR Systems included in systemsdelivered by FLIRSystems to theoriginal purchaser carrythe warranty,
if any, of the particular supplier only and FLIR Systems has no responsibilitywhatsoever for such products.
The warranty extends only to the original purchaser and is not transferable. It is not applicable to any product which has been subjected to
misuse, neglect, accident or abnormal conditions of operation. Expendable parts are excluded from the warranty.
In the case of adefect inaproduct coveredbythis warrantytheproduct must notbe furtherusedin order toprevent additional damage.The
purchaser shall promptly report any defect to FLIR Systems or this warranty will not apply.
FLIR Systems will, at its option, repair or replace any such defective product free of charge if, upon inspection, it proves to be defective in
material or workmanship and provided that it is returned to FLIR Systems within the said one-year period.
FLIR Systems has no other obligation or liability for defects than those set forth above.
No other warranty is expressed or implied. FLIR Systems specifically disclaims the implied warranties of merchantability and fitness for a
particular purpose.
FLIR Systems shall not be liable for any direct, indirect, special, incidentalor consequential loss or damage, whether basedon contract, tort
or any other legal theory.
Copyright
© FLIR Systems,2005. All rights reservedworldwide. No parts ofthesoftware including source codemaybe reproduced, transmitted, transcribed
or translated into any language or computer language in any form or by any means, electronic, magnetic, optical, manual or otherwise,
without the prior written permission of FLIR Systems.
This manual must not, in whole or part, be copied, photocopied, reproduced,translated ortransmitted to any electronic mediumor machine
readable form without prior consent, in writing, from FLIR Systems.
Names and marks appearing on the products herein are eitherregistered trademarksor trademarksof FLIR Systems and/or its subsidiaries.
All othertrademarks,trade names or companynames referenced herein areusedfor identification only andarethe property of theirrespective
owners.
Quality assurance
The Quality Management System under which these products are developed and manufactured has been certified in accordance with the
ISO 9001 standard.
FLIR Systems is committed to a policy of continuous development; therefore we reserve the right to make changes and improvements on
any of the products described in this manual without prior notice.
Patents
This product is protected by patents, design patents, patents pending, or design patents pending.
Contact details
FLIR Systems AB Imaging Sweden ■ P. O. Box 3 ■ SE-182 11 Danderyd ■ SwedenPostal address
+46 (0)8 753 25 00Telephone
+46 (0)8 731 05 30Telefax
www.flir.com/imagingWeb site
imagingsweden.sales@flir.seE-mail
➲ For contact details for regional offices, see the back cover of this manual.
iv Publ. No. 1 557 544 Rev. a121 – ENGLISH (EN) – October 6, 2005
Page 5

Table of contents
11 System description .........................................................................................................................
22 Packing list ......................................................................................................................................
33 Connecting system components ..................................................................................................
33.1 Important notes ....................................................................................................................
43.2 Connection overviews ..........................................................................................................
43.2.1 Imager ...................................................................................................................
63.2.2 Power Box (PB) .....................................................................................................
84 Typical system overview ................................................................................................................
95 Mechanical installation ..................................................................................................................
106 Remote Control (RC) ......................................................................................................................
117 Display symbology .........................................................................................................................
117.1 General information ..............................................................................................................
127.2 System display & symbols ...................................................................................................
127.2.1 System display ......................................................................................................
137.2.2 In-depth explanations of symbols ........................................................................
137.2.2.1 NFOV (narrow field-of-view) reticle ...................................................
137.2.2.2 Crosshair reticle ................................................................................
137.2.2.3 Image polarity ....................................................................................
137.2.2.4 System date ......................................................................................
137.2.2.5 System time .......................................................................................
137.2.2.6 Focus position indicator ....................................................................
137.2.2.7 Active channel indicator ....................................................................
137.2.2.8 Additional indicators not shown in the illustration ............................
147.2.2.9 Declutter function ..............................................................................
158 Operation .........................................................................................................................................
158.1 Checking the system by using the Remote Control (RC) ....................................................
158.2 On-screen menus .................................................................................................................
158.2.1 General information ..............................................................................................
168.2.2 Autofocus ..............................................................................................................
178.2.3 Image menu ..........................................................................................................
178.2.3.1 When IR is selected ...........................................................................
188.2.3.2 When TV is selected ..........................................................................
198.2.4 Setup menu ...........................................................................................................
208.2.4.1 Image ................................................................................................
218.2.4.2 Symbology ........................................................................................
238.2.4.3 Local adapt ........................................................................................
248.2.4.4 Date & Time .......................................................................................
258.2.4.5 Maintenance ......................................................................................
278.2.4.6 System info ........................................................................................
289 Adverse weather conditions ..........................................................................................................
289.1 Built-in heaters ......................................................................................................................
289.2 Precautions under cold weather conditions ........................................................................
Publ. No. 1 557 544 Rev. a121 – ENGLISH (EN) – October 6, 2005 v
Page 6

2910 Maintenance & cleaning ................................................................................................................
2910.1 Camera body, cables & accessories ....................................................................................
2910.2 Lenses ...................................................................................................................................
3011 Technical support ...........................................................................................................................
3112 Technical specifications .................................................................................................................
3112.1 System specifications ...........................................................................................................
3212.2 Thermal imager specifications .............................................................................................
3312.3 Video camera specifications ................................................................................................
3412.4 List of relevant documents ...................................................................................................
3512.5 Diagnostic tools ....................................................................................................................
3512.5.1 General ..................................................................................................................
3612.6 Troubleshooting guide .........................................................................................................
3712.7 Overview & location of connectors ......................................................................................
3712.7.1 Connectors on Power Box (PB) ............................................................................
3812.7.2 Connectors on imager unit ...................................................................................
3912.8 Pin configuration ...................................................................................................................
3912.8.1 Connectors on Power Box (PB) ............................................................................
3912.8.1.1 J4 – 23-pin connector .......................................................................
4012.8.1.2 J5 – Connector for host computer & remote control ........................
4012.8.1.3 J6 – BNC connector ..........................................................................
4012.8.1.4 J7 – BNC connector ..........................................................................
4012.8.2 Connectors on imager unit ...................................................................................
4012.8.2.1 J1 – 23-pin connector .......................................................................
4212.8.2.2 J3 – Internal service connector .........................................................
4312.9 Basic dimensions – Imager; view from above .....................................................................
4412.10 Basic dimensions – Imager; rear view .................................................................................
4512.11 Basic dimensions – Imager; front view ................................................................................
4612.12 Basic dimensions – Imager; side view .................................................................................
4712.13 Basic dimensions – Imager; view from below ......................................................................
4812.14 Basic dimensions – Remote Control (RC) ...........................................................................
4912.15 Basic dimensions – Power Box (PB) ....................................................................................
5012.16 Basic dimensions – Power Box (PB) ....................................................................................
5113 History of infrared technology ......................................................................................................
5614 Theory of thermal imaging ............................................................................................................
5614.1 Introduction ...........................................................................................................................
5614.2 The electromagnetic spectrum ............................................................................................
5714.3 Blackbody radiation ..............................................................................................................
5814.3.1 Planck’s law ..........................................................................................................
5914.3.2 Wien’s displacement law ......................................................................................
6114.3.3 Stefan-Boltzmann's law .........................................................................................
6114.3.4 Non-blackbody emitters .......................................................................................
6414.4 Infrared semi-transparent materials .....................................................................................
65Index ................................................................................................................................................
vi Publ. No. 1 557 544 Rev. a121 – ENGLISH (EN) – October 6, 2005
Page 7

1 System description
The ThermoVision™ Sentinel from FLIR Systems is a high performance thermal
imaging system that incorporates the latest in uncooled detector technology. The
ThermoVision™ Sentinel contains a 320 × 240 uncooled microbolometer focal plane
detector array.
The ThermoVision™ Sentinel features a dual field-of-view (WFOV = 20° × 15°, NFOV
= 5° × 3.75°) for wide area surveillance, and close-up inspections. Electronic zoom
as well as autofocus are included for enhanced target recognition, along with freeze
frame capabilities, and various image enhancement functions.
The systemalso features a side-mounted 1/4" color CCD video camera with autofocus
and 12x electronic zoom / 18x optical zoom, allowing the operator to toggle between
IR imaging and video imaging.
The ThermoVision™ Sentinel can be configured for stand-alone operation, or it can
be fully configured into a comprehensive surface surveillance network. This makes
it an ideal solution for a wide variety of applications including perimeter surveillance,
border surveillance, and force protection.
Publ. No. 1 557 544 Rev. a121 – ENGLISH (EN) – October 6, 2005 1
Page 8

2 Packing list
The ThermoVision™ Sentinel and its accessories are normally delivered in a hard
transport case which typically contains the items below.
On receipt, inspect all items and check them against the delivery note. Any damaged
items must be reported to the local FLIR Systems representative immediately.
Qty.Part NumberDescription
1614004898ThermoVision™ Sentinel
11 557 544Operator’s manual
■ System cable, 15 m / 50 ft. or
■ System cable, 61 m / 200 ft.
1■ 194 796 (15 m / 50 ft.)
■ 194 797 (61 m / 200 ft.)
11 195 413Power Box (PB)
11 195 367Remote Control (RC)
1908 929Video cable
11 909 824Transport Case
1PP_614004898ATR ThermoVision™ Sentinel
1Certificate of Conformity
2 Publ. No. 1 557 544 Rev. a121 – ENGLISH (EN) – October 6, 2005
Page 9

3 Connecting system components
3.1 Important notes
Please note the following:
■ Always disconnect the system fromthe mainssupply before connecting or discon-
necting any cables.
■ The connectors should be sealed with the protective caps when not in use.
Publ. No. 1 557 544 Rev. a121 – ENGLISH (EN) – October 6, 2005 3
Page 10
3.2 – Connection overviews
3.2 Connection overviews
3.2.1 Imager
10597403;a1
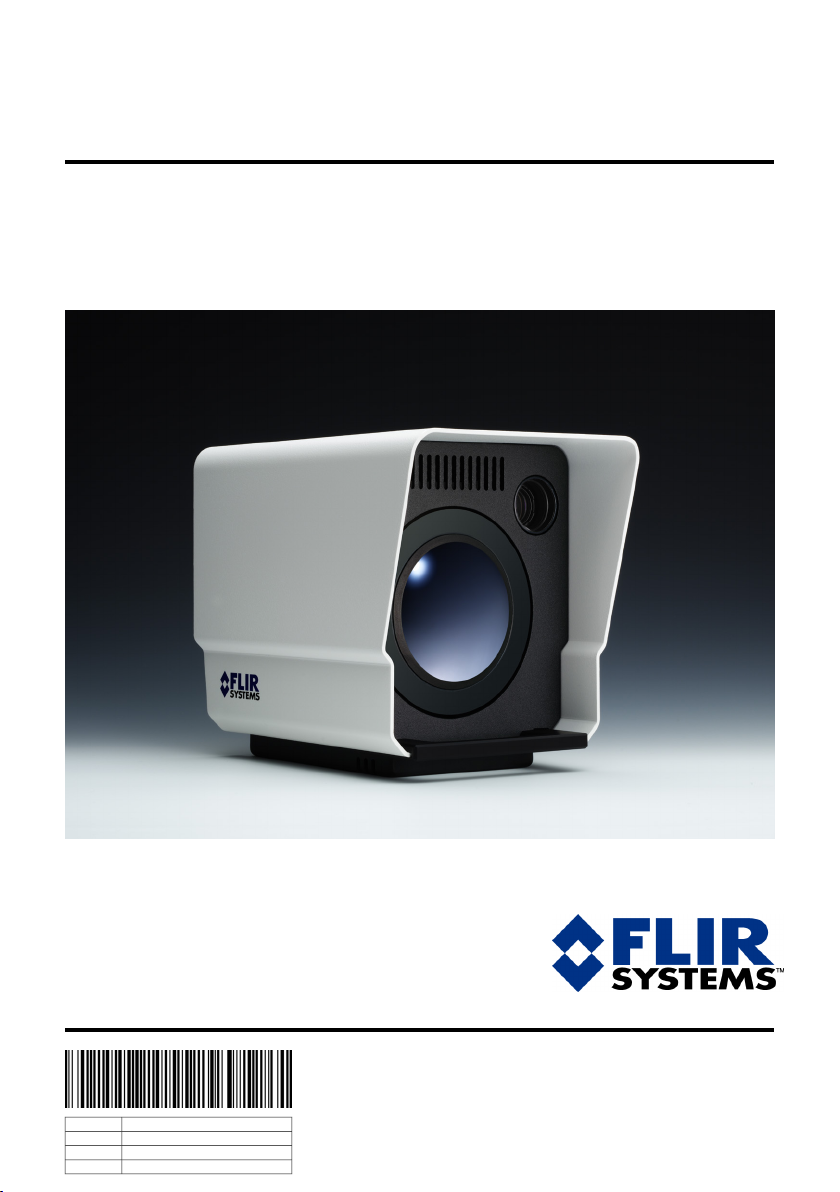
Figure 3.1 Main system connector
Figure 3.2 Explanations of callouts
ExplanationCallout
1
■ Cable designation: System cable
■ Part Number: 194 796 (15 m / 49 ft.) or 194 797 (61 m / 200 ft.)
■ Function: Connecting from Power Box (PB) to J1 connector on imager
■ Pin configuration on receptacle connector: See section 12.8.2.1 – J1 – 23-
pin connector on page 40
SEE ALSO: For an example in a typical system overview, see section 4 – Typical
system overview on page 8
4 Publ. No. 1 557 544 Rev. a121 – ENGLISH (EN) – October 6, 2005
Page 11
3.2 – Connection overviews
10597503;a1
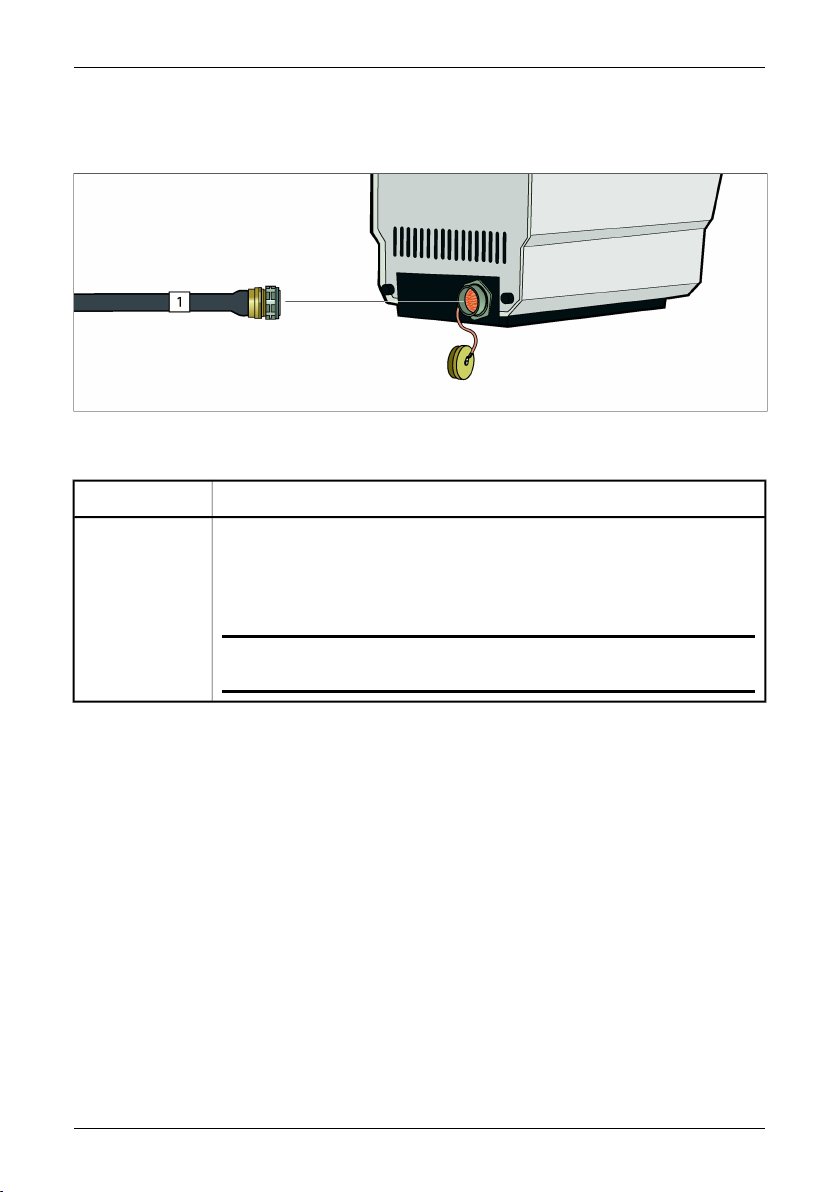
Figure 3.3 J3 internal service connector. Note that the outer housing must be removed to access the J3
internal service connector.
Figure 3.4 Explanations of callouts
ExplanationCallout
1
■ Cable designation: RS-232 cable(local supplier),orRemote Control (RC)cable
■ Part Number: 1 195 367 (applies only to cable including Remote Control (RC))
■ Function: Either connecting a desktop orlaptop computer tothe J3 connector,
or connecting a Remote Control (RC) to the J3 connector
■ Pin configuration on receptacle connector: See section 12.8.2.2– J3 –Internal
service connector on page 42
SEE ALSO: For an example in a typical system overview, see section 4 – Typical
system overview on page 8
Publ. No. 1 557 544 Rev. a121 – ENGLISH (EN) – October 6, 2005 5
Page 12

3.2 – Connection overviews
3.2.2 Power Box (PB)
10597603;a1
Figure 3.5 Connecting cables to Power Box (PB)
Figure 3.6 Explanations of callouts
ExplanationCallout
1
■ Cable designation: Video cable
■ Part Number: 908 929
■ Function: Connecting from external video monitor to the J7 connector on the
Power Box (PB)
SEE ALSO: For an example in a typical system overview, see section 4 – Typical
system overview on page 8
2
■ Cable designation: Video cable
■ Part Number: 908 929
■ Function: Connecting from external video monitor to the J6 connector on the
Power Box (PB)
SEE ALSO: For an example in a typical system overview, see section 4 – Typical
system overview on page 8
6 Publ. No. 1 557 544 Rev. a121 – ENGLISH (EN) – October 6, 2005
Page 13

3.2 – Connection overviews
ExplanationCallout
3
■ Cable designation: RS-232 cable(local supplier),orRemote Control (RC)cable
■ Part Number: 1 195 367 (applies only to cable including Remote Control (RC))
■ Function: Either connecting a desktop or laptop computer to the J5 connector
on thePower Box (PB),orconnecting a RemoteControl (RC) tothe J5 connector
on the Power Box (PB)
■ Pin configuration on receptacle connector: See section 12.8.1.2 – J5 –
Connector for host computer & remote control on page 40
SEE ALSO: For an example in a typical system overview, see section 4 – Typical
system overview on page 8
4
■ Cable designation: System cable
■ Part Number: 194 796 (15 m / 49 ft.) or 194 797 (61 m / 200 ft.)
■ Function: Connecting from imager to J4 connector on Power Box (PB)
■ Pin configuration on receptacle connector: See section 12.8.1.1 – J4 – 23-
pin connector on page 39
SEE ALSO: For an example in a typical system overview, see section 4 – Typical
system overview on page 8
5
■ Cable designation: Mains cable
■ Part Number: N/A
■ Function: Connecting from amains supply tothe unmarked power in connector
on the Power Box (PB)
SEE ALSO: For an example in a typical system overview, see section 4 – Typical
system overview on page 8
Publ. No. 1 557 544 Rev. a121 – ENGLISH (EN) – October 6, 2005 7
Page 14
4 Typical system overview
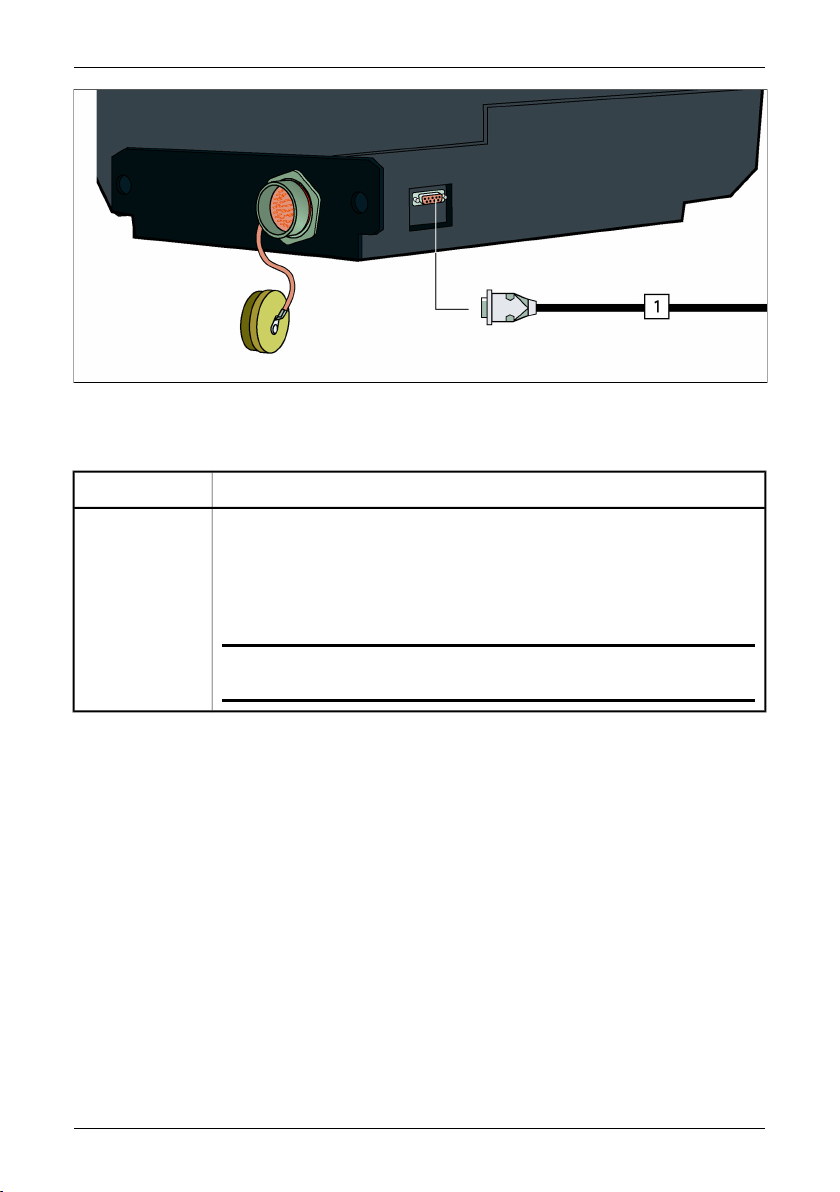
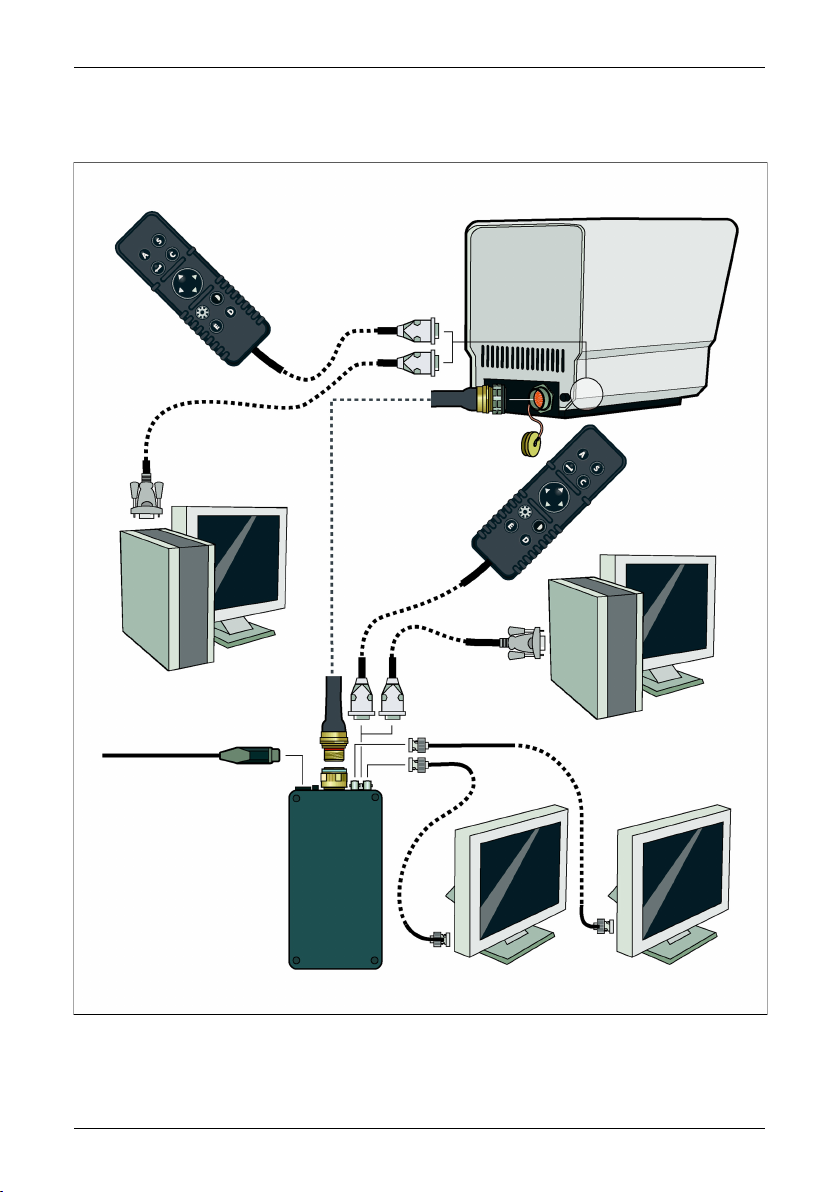
10597303;a1
Figure 4.1 Typical system overview
8 Publ. No. 1 557 544 Rev. a121 – ENGLISH (EN) – October 6, 2005
Page 15

5 Mechanical installation
Different applications call for different ways of mechanically installing the imager unit
and thereforespecific information regarding the installation can not be given. However,
the imager unit has a mounting plate (with one 3/8"-16 UNC and two 1/4"-20 UNC
threaded holes) on the bottom side of the housing designed to match an existing
platform.
Mounting plates with a different hole layout can be made by custom order at FLIR
Systems AB Imaging Sweden.
SEE ALSO: For more information about mounting plates, see section 12.13 – Basic dimensions – Imager;
view from below on page 47.
Publ. No. 1 557 544 Rev. a121 – ENGLISH (EN) – October 6, 2005 9
Page 16
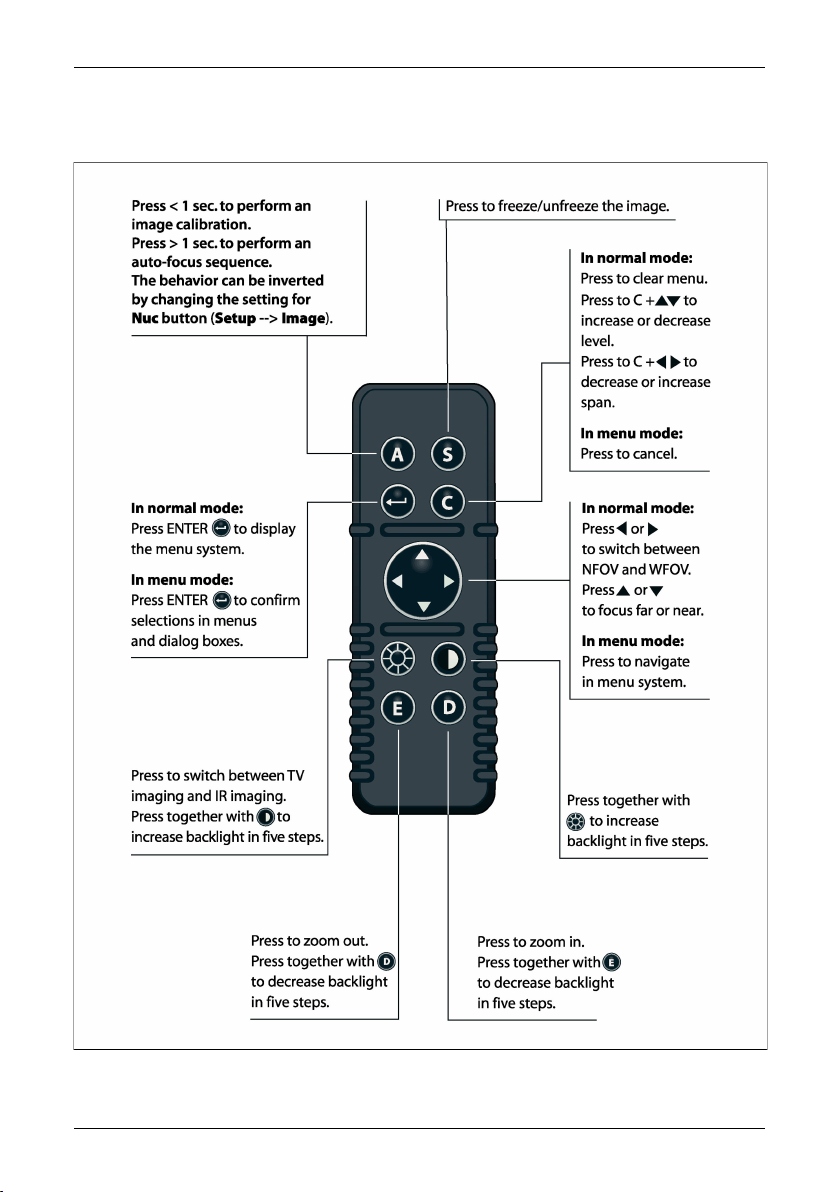
6 Remote Control (RC)
10597003;a2
Figure 6.1 Remote Control (RC)
10 Publ. No. 1 557 544 Rev. a121 – ENGLISH (EN) – October 6, 2005
Page 17

7 Display symbology
7.1 General information
The ThermoVision™ Sentinel system operates in a number of modes. Each mode is
a combination of settings and functions designed to assist the operator in performing
a particular task. In addition to the operating modes, there are also a number of
controls that can be used to optimize the system’s performance, or enhance system
operation.
The ThermoVision™ Sentinel system takes the thermal video of the area within the
field-of-view and displays it on the video display unit (-s). Symbology is also overlaid
on the imagery and provides system time/date, focus indicator, NFOV brackets,
crosshair, and polarity (White hot or Black hot) indicator.
Publ. No. 1 557 544 Rev. a121 – ENGLISH (EN) – October 6, 2005 11
Page 18
7.2 – System display & symbols
7.2 System display & symbols
7.2.1 System display
10700103;a1
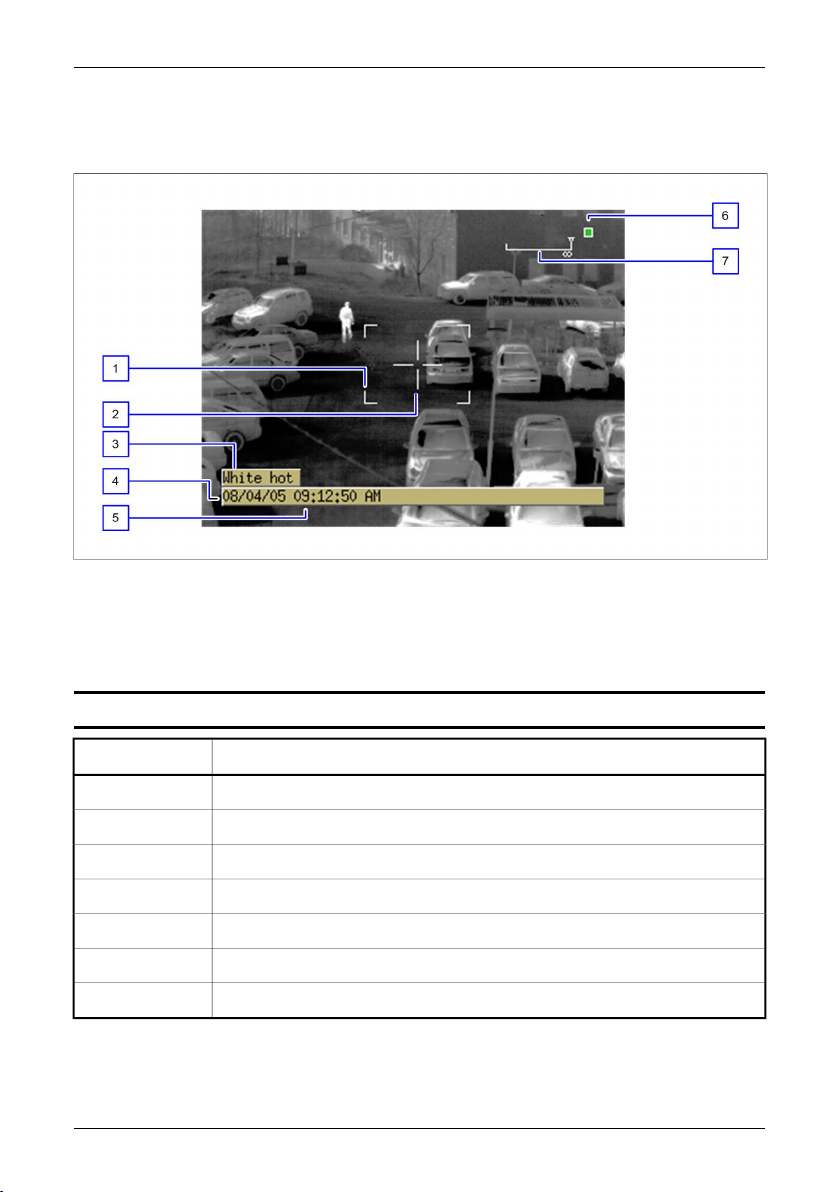
Figure 7.1 System display
The symbology actually displayed is mode and function dependent, and can be removed from the display by using the Declutter feature if desired.The display is shown
with all of the symbology activated (DECLUTTER mode is not active).
NOTE: The DECLUTTER mode is only active until the operator presses the ENTER key.
DescriptionCallout
NFOV reticule1
Crosshair reticle2
Image polarity3
System date4
System time5
Active channel6
Focus position indicator7
12 Publ. No. 1 557 544 Rev. a121 – ENGLISH (EN) – October 6, 2005
Page 19

7.2 – System display & symbols
7.2.2 In-depth explanations of symbols
7.2.2.1 NFOV (narrow field-of-view) reticle
The NFOV reticle is displayed when the system is in the WFOV (wide field-of-view),
and provides an indication of the area viewed when the NFOV is selected.
7.2.2.2 Crosshair reticle
The crosshair reticle shows the center of the current field-of-view.
7.2.2.3 Image polarity
The image polarity shows if white is set to represent hot or black is set to represent
hot.
7.2.2.4 System date
The system date is located at the bottom left of the display, and is shown in either
YY-MM-DD, MM/DD/YY or DD/MM/YY format. The system date is set from the Setup
menu (the date format is set from the Local adaptions dialog box, while the actual
date is set from the Date & time dialog box).
7.2.2.5 System time
The system time is located at the bottom of the display and is displayed in either 12
or 24 hour format. The system time is set from the Setup menu (the time format is set
from the Local adaptions dialog box while the actual system time is set fromthe Date
& time dialog box).
7.2.2.6 Focus position indicator
The focus position indicator is located at the upper right corner of the display, and
provides an indication of the focus travel from near (left) to distant (right).
7.2.2.7 Active channel indicator
The active channel indicator is shown on the screen to indicate which channel – i.e.
TV or IR – is active.
7.2.2.8 Additional indicators not shown in the illustration
7.2.2.8.1 Level & span (gain) indicators
The level & span (gain) indicators, are located at the bottom left of the screen (over
the system date and time) when Manual level & span is first selected. They provide
the operator with an indication of the current system level & span settings.
7.2.2.8.2 Other indicators
One or several of the following text strings and / or icons will be displayed when the
functions they represent are triggered:
Publ. No. 1 557 544 Rev. a121 – ENGLISH (EN) – October 6, 2005 13
Page 20

7.2 – System display & symbols
■ Zooming in
■ Zooming out
■ Focus far
■ Focus near
■ Frozen
■ Zoom box
■ Adjusting
7.2.2.9 Declutter function
At times the operator may want to remove all the symbology from the image. The
system is capable of two levels of symbology display: Declutter none (all symbology
is displayed normally as defined from the Setup → Symbology menu), and the DECLUTTER mode where all of the symbology is removed.
NOTE: The DECLUTTER mode is only active until the operator presses the ENTER key.
14 Publ. No. 1 557 544 Rev. a121 – ENGLISH (EN) – October 6, 2005
Page 21

8 Operation
8.1 Checking the system by using the Remote Control (RC)
The ThermoVision™ Sentinel is usually controlled from a host computer. However, it
can also be controlled locally – at the imager unit site or ina training center – by using
a remote control.
NOTE: The remote control cable should be connected to the J5 connector on the Power Box
The imager unit is controlled by pressing the direct access buttons and/or using the
navigation pad on the remote control. All buttons on the remote control are backlit.
By pressing the E and D buttons simultaneously the intensity of the backlight for all
buttons on the remote control will decrease in five steps.
By pressing the and buttons simultaneously the intensity of the backlight for all buttons on the
remote control will increase in five steps.
8.2 On-screen menus
8.2.1 General information
NOTE: All commands inthis section canbe initiated usingthe remote controlor imager unitcontrol software.
The system’s software menus provide the operator with a simple interface to define
system features and enter system constants. Access to the MENU mode is made by
pressing the ENTER button located on the remote control. The two main menus are
shown in the menu bar found at the top of the screen with the currently selected
menu/feature highlighted. Features are presented directly as a command (Freeze or
Change palette for example), while selections that do not directly perform an action,
but open a dialog box allowing further selections to be made, are identifiedby a feature
title followed by three periods (Image... or Date & time... for example). Features that
are not currently available for selection will be shaded in the menu.
The left/right arrow buttons on the remote control are used to move between the different menus, and the up/down arrow buttons are used to move between the menu
features or in dialog boxes. When a menu item is highlighted, pressing the ENTER
button will either activate the feature and exit the menu mode, or open the sub-menu
for further selection. To exit a menu (or the menu mode) press the ENTER button to
accept anychanges, oruse the C button to back out of the menu mode without altering
any of the current settings.
Publ. No. 1 557 544 Rev. a121 – ENGLISH (EN) – October 6, 2005 15
Page 22

8.2 – On-screen menus
NOTE: The action to be performed is the one that is displayed in the menu. For example, if the feature
Narrow FOV is listed, the system is currently using the WFOV and the selection will zoom in on the target.
If the system is already using NFOV, the feature would be listed as Wide FOV. Selecting this would return
the system to normal display.
8.2.2 Autofocus
The A button performs an image calibration to correct for image non-uniformities that
arise due to the slightly different gain characteristics that occur from detector to detector within the array.
In IR mode, pressing the A button < 1 second will perform an image calibration. In
both IR and TV mode, pressing the A button > 1 second will perform an auto-focus
sequence. This is the default behavior. The behavior can be inverted by changing
the setting for Nuc button (Setup → Image).
To make it possible for the imager unit to autofocus properly, there are a few things
that the user should think about.
To think about when autofocusing
The area that the imager uses when autofocusing is a 64 × 64 pixel box, centered vertically and horizontally on the screen.
The imager will havedifficulties autofocusing whenthe image haslow contrastsbetween different areas.
To make it possible for theimager to autofocus properly, it isimportant that there are nomoving objects
inside the 64 × 64 pixel box during the autofocus adjustment.
Horizontal or vertical lines in the image should not be parallel to the pixel lines on the screen.
The imager will experience difficulties autofocusing if it is completely out of focus when beginning the
autofocus sequence.
When auto-focusing in NFOV (narrow field-of-view) the distance to target must be more than 15 m
/ 49.2 ft.
When auto-focusing in WFOV (wide field-of-view) the distance to target must be more than 2 m / 6.6 ft.
16 Publ. No. 1 557 544 Rev. a121 – ENGLISH (EN) – October 6, 2005
Page 23

8.2 – On-screen menus
8.2.3 Image menu
8.2.3.1 When IR is selected
10342903;a1
Figure 8.1 Image menu when IR is selected
The Image menu is used to define appearance of the system video display. The
up/down arrow buttons are used to move between the different menu features;
pressing the ENTER button will activate the currently highlighted feature, and then
exit the MENU mode. To exit the Image menu without making any changes, press
the C (cancel) button.
8.2.3.1.1 Declutter
The Declutter feature allows the operator to temporarily remove all of the displayed
symbology fromthe systemdisplay. The symbology will return the next time the ENTER
button is pressed.
8.2.3.1.2 Invert palette
Highlighting and pressing enter inverts the palette currently in use, and then exits the
MENU mode.
■ Gray (white hot) to Inv gray (black hot), or back;
■ Rainbow to Inv rainbow, or back;
■ Iron to Inv Iron, or back.
8.2.3.1.3 Change palette
Highlighting andpressing ENTERchanges thepalette currentlyin use,and thenexits
the MENU mode. The palettes will ‘rotate’ from Gray to Rainbow to Iron, and then
back to Gray and start over again. If the palette currently in use is inverted, the newly
selected palette will also be inverted.
8.2.3.1.4 Freeze/Live
Changes the display from live image to frozen image, or back. A frozen image is
identified by the text Frozen in the display.
Publ. No. 1 557 544 Rev. a121 – ENGLISH (EN) – October 6, 2005 17
Page 24

8.2 – On-screen menus
8.2.3.1.5 Narrow FoV/Wide FoV
Changes the current field-of-view in use from Wide FoV (normal) to Narrow FoV
(zoomed), or back.
8.2.3.1.6 Man. level/span
When selected, level & span values are locked, and a dialog box is shown at the
bottom left of the display. The left/right arrow buttons are used to select either the
level or span for adjustment, while the up/down arrow buttons adjusts the setting.
Pressing ENTER accepts these setting for the image and removes the control bar.
Pressing the C button will reset the level & span to the previous values. Man. Lev-
el/span can be selected again to continue the adjustments.
NOTE: The system will remain in manual level/span mode until Auto level/span is selected.
8.2.3.1.7 Auto level/span
When selected, the system will automatically select an image enhancement method
for best overall image contrast. The method selected depends on the settings in the
Setup – Image dialog box.
8.2.3.1.8 Power off/Power off
This function switches off the power to the detector module. A test image will be displayed.
8.2.3.1.9 Slave mode on/Slave mode off
When Slave mode on is selected, and the operator switches to TV mode, the same
field of view as in IR mode will be used and the camera will carry out an autofocus
sequence.
8.2.3.2 When TV is selected
10597103;a1
Figure 8.2 Image menu when TV is selected
8.2.3.2.1 Declutter
This is the same function as when IR is selected.
18 Publ. No. 1 557 544 Rev. a121 – ENGLISH (EN) – October 6, 2005
Page 25

8.2 – On-screen menus
SEE: For information, see section 8.2.3.1.1 – Declutter on page 17.
8.2.3.2.2 Auto focus
Choosing this function executes a momentary auto-focus adjustment. Due to the risk
of mechanical wear, continuous auto-focus is not provided.
8.2.3.2.3 Change FoV
This is the same function as when IR is selected.
8.2.3.2.4 Freeze/Live
This is the same function as when IR is selected.
SEE: For information, see section 8.2.3.1.4 – Freeze/Live on page 17.
8.2.3.2.5 Backlight on/Backlight off
This function offers a backlight compensation. If an object appears in front of a very
light background – or if the object is very dark – selecting this function increases the
image quality. There are two choices – Backlight on and Backlight off.
8.2.3.2.6 Power off/Power on
This function switches the TV camera off, which will turn the image black. When the
TV is switched off, all menu items except Power On in the Image menu are gray and
can not be selected.
8.2.3.2.7 Slave mode on/Slave mode off
When Slave mode on is selected, and the operator switches to IR mode, 5° field of
view will be used for IR mode if the current TV field of view is less than 15°. If not, 20°
field of view for IR mode will be used.
The camera will also carry out an autofocus sequence.
8.2.4 Setup menu
10343103;a1
Figure 8.3 Setup menu
The Setup menu is used to define system constants and symbology. The up/down
arrow buttons are used to move between the different dialog box selections, and the
Publ. No. 1 557 544 Rev. a121 – ENGLISH (EN) – October 6, 2005 19
Page 26

8.2 – On-screen menus
ENTER button is used to open a dialog box. Within the dialog boxes, the up/down
arrow buttons are used to move between the features while the left/right arrowbuttons
are used to adjust system settings or values.
Pressing the ENTER button will accept any changes made and then exit the MENU
mode, or press C to exit without making any changes to the current settings
8.2.4.1 Image
8.2.4.1.1 When IR is selected
The Setup – Image dialog box is used to define the appearance of the system display
and symbology.
10057003;a3
Figure 8.4 Setup – Image dialog box
ExplanationLabel
Color scale
The Color scale feature allows the operator to select the palette that the display is shown in.
Options include:
■ Gray
■ Gray inv (inverted)
■ Rainbow
■ Rainbow inv (inverted)
■ Iron
■ Iron inv (inverted)
Level/Span
The Level/span feature determines howthesystem
will process the thermalinformation in the generation of the displayed image.
Options include:
■ Manual
■ Auto (linear)
■ Auto (full) = histogram equalization
■ DDE L = Low filtering. Improves details inhigh
contrast images
■ DDE H = High filtering. Improves details in low
contrast images
20 Publ. No. 1 557 544 Rev. a121 – ENGLISH (EN) – October 6, 2005
Page 27

8.2 – On-screen menus
ExplanationLabel
Nuc button
8.2.4.1.2 When TV is selected
10059003;a1
Figure 8.5 Setup – Image dialog box
Back light comp
Image effect
■ NUC / AF = When pressing the NUC button for
less than 1 second, the camera performs an
image calibration. When pressing and holding
the NUC button for more than 1 second, the
camera performsan auto-focus sequence.This
is the default detting.
■ AF / NUC = When pressing the NUC button for
less than 1 second, the camera performs an
auto-focus sequence. When pressing and
holding theNUC button formore than 1second,
the camera performs an image calibration.
ExplanationLabel
SEE: See section 8.2.3.2.5– Backlight on/Backlight
off on page 19.
The Image effect feature allows the operator to
select between:
■ Off
■ B/W
Selecting Off puts the TV imager in color mode,
while selecting B/W puts it in black & white mode.
Near IR sensitive
This functionoffers increased sensitivity to IRradiation by removing abuilt-in cut-off IRradiation filter.
The feature is especially valuable under twilight
conditions.
NOTE: The normal position of the cut-off filter is
in the raypath of the TV imager.
8.2.4.2 Symbology
From the Setup – Symbology dialog box the operator defines how the overlaid symbology is displayed.
Publ. No. 1 557 544 Rev. a121 – ENGLISH (EN) – October 6, 2005 21
Page 28

8.2 – On-screen menus
8.2.4.2.1 When IR is selected
10700003;a1
Figure 8.6 Setup – Symbology dialog box
ExplanationLabel
Data field
Data background
Status background
Focus indicator
Crosshair retic
The Data field option affects the two lines of information presented at the bottom of the display.
Three choices are available:
■ Normal (both lines are shown)
■ Reduced (only the bottom line is shown, i.e.
date, time, and digital azimuth/elevation)
■ None (both lines are disabled)
The Data background feature can be used to put
a solid background behind thelines ofsymbology,
making them more visible.
The Status background feature can be used to
put a solid background behind the status symbology (Frozen, Autoscan, Near focus etc.), making
it more visible.
Focus indicators affects the presentation of the
analog focus indicator.
Three options are available:
■ On (the indicators are always shown)
■ Off (the indicators are disabled)
■ When changed (the indicator is only shown
during a change of focus).
The Crosshair retic selection controls the presentation of the crosshair indicator.
Two options are available:
■ On (the indicator is always shown)
■ Off (the indicator is disabled)
22 Publ. No. 1 557 544 Rev. a121 – ENGLISH (EN) – October 6, 2005
Page 29

8.2 – On-screen menus
ExplanationLabel
NFOV brackets
The NFOVbrackets selection controls the presentation of the NFOV reticule that is displayed when
the system is in the WFOV (and is used to provide
an indication of the area viewed when the NFOV
is selected).
Two options are available:
■ On (the indicator is always shown)
■ Off (the indicator is disabled)
8.2.4.2.2 When TV is selected
This is the same dialog box as when IR is selected.
8.2.4.3 Local adapt
10055903;a1
Figure 8.7 Setup – Local adaption dialog box
The Setup – Local adaption dialog box is used to adjust the format that system date,
time, and the language that the symbology is displayed in. Use the up/down arrow
buttons to move the highlight bar between the menu selections, and the left/right arrow
buttons to adjust values/settings. Pressing the ENTER button will accept any changes
made and then exit the MENU mode, or press C to exit without making any changes
to the current settings.
ExplanationLabel
English + optional languagesLanguage
Date format
Time format
Publ. No. 1 557 544 Rev. a121 – ENGLISH (EN) – October 6, 2005 23
■ MM/DD/YY
■ DD/MM/YY
■ YY-MM-DD
■ HH:MM:SS (24 hour format)
■ HH.MM.SS (24 hour format)
■ HH:MM:SS PM (12 hour format)
Page 30

8.2 – On-screen menus
8.2.4.4 Date & Time
10056003;a1
Figure 8.8 Setup – Date & Time dialog box
The system time and date is set from within the Setup – Date & Time dialog box. The
format that the information is presented in depends onthe settings made in the Local
Adaptions dialog box. For example, if the 12 hour (a.m./p.m.) format has been selected, the time setting can be adjusted from 12 p.m. through12 a.m. If the 24 hour format
is active 1 through 24 can be set. Use the up/down arrow buttons to move the highlighted bar through the selections, and the left/right arrow buttons to adjust values/settings. Pressing the ENTER button will accept any changes made and then exit the
MENU mode, or press C to exit without making any changes to the current settings.
ExplanationLabel
1981--2038Year
1 through 12Month
1 through 31Day
Hour
■ 12 a.m. through 12 p.m.
■ 1 through 24 (format dependent)
00 through 59Minute
24 Publ. No. 1 557 544 Rev. a121 – ENGLISH (EN) – October 6, 2005
Page 31

8.2 – On-screen menus
8.2.4.5 Maintenance
10058803;a2
Figure 8.9 Setup – Maintenance dialog box
The Setup – Maintenance dialog boxis used to define system constants such as the
system password (if used), and the protocol.
ExplanationLabel
Yes or NoRun diag tool
Baudrate
■ 1200 bps
■ 2400 bps
■ 4800 bps
■ 9600 bps
■ 19200 bps
If the Baudrate is changed, it will be necessary to
restart the system before the change will take effect.
NOTE: For best performance, 9600 bps or 19200
bps should be selected.
NOTE: When using the Remote Control (RC),
19200 bps is required.
1 through 31Device ID
Publ. No. 1 557 544 Rev. a121 – ENGLISH (EN) – October 6, 2005 25
Page 32

8.2 – On-screen menus
ExplanationLabel
Protocol
Change password
■ 5X0
■ TASS
■ PELCO D (NOTE: By default,a ThermoVision™
Sentinel system is shipped without PELCO D
protocol. The customer must specifically request PELCO D protocol.)
Protocol is selectable to 5X0, TASS or PELCO D.
The 5X0protocol is alsoused in theThermaCAM™
500 seriescamerasand is an ASCIIprotocolusing
‘xon/xoff handshaking’.If the protocolis changed,
it will be necessaryto restartthe system beforethe
change will take effect.
Optional protocols are available upon request.
NOTE: The 5X0 protocol is a point-to-point
protocol. No Device ID can be selected.
NOTE: When using the Remote Control (RC), 5X0
protocol is required.
Yes or No
When the maintenance menu is entered, a pass-
word dialog box will appear (ifthe passwordis the
default system value 0000, the password dialog
box will not be displayed).
To change a value,use the up/downarrowbuttons.
To select another digit, use the left/right arrow
buttons. Whenthe right passwordis present, press
the ENTER button. If the wrong password is entered a warning will appear. When the correct
password is entered the maintenance menu will
appear.
To change the password, set the Change pass-
word selection to Yes, and press the ENTER button. A dialog boxwill appear allowingthe operator
to enter the new password.
26 Publ. No. 1 557 544 Rev. a121 – ENGLISH (EN) – October 6, 2005
Page 33

8.2 – On-screen menus
ExplanationLabel
IR/TV video swap
Default settings
8.2.4.6 System info
10056203;a1
Yes or No
If Yes is selected the active video signal is
swapped between the two video outputs on the
pan/tilt head when the operator toggles between
IR and TV.
If two monitors are used (one for IR and one for
TV) this means that the images move between the
monitors, instead of only moving the indicator for
active channel between the monitors.
SEE: See section 7.2.2.7– Active channelindicator
on page 13.
Yes or No
NOTE: Selecting Yes resets all parameters to
factory settings.
Figure 8.10 System information dialog box
The System information dialog box contains information about the system, such as:
ExplanationLabel
NTSC or PALVideo mode
Hours and minutesRuntime
Configuration numberSystem check ID
Hardware and firmware information is also available.
Publ. No. 1 557 544 Rev. a121 – ENGLISH (EN) – October 6, 2005 27
Page 34

9 Adverse weather conditions
9.1 Built-in heaters
ThermoVision™ Sentinel is designed and manufactured to meet strict specifications
and can be used under the most demanding weather conditions that may occur in
field situations. Apart from the protection by design – such as sealings and encapsulation — a number of built-in heaters automatically turn on at start-up in cold temperatures to protect the electronics and to defrost the lens. The heating of the camera
may take up to 30 minutes and is indicated by the HEATER ON indicator lamp on the
Power Box (see Figure 3.5 on page 6).
NOTE: The system does not start until it is heated to the factory preset temperature level.
9.2 Precautions under cold weather conditions
Despite the steps that have been taken to secure the operation of the imager under
cold weather conditions – such as heavy snowfall or freezing rain – situations may
arise where the imager unit is exposed to ice and snow build-up. In such situations
it is strongly advised that the operator checks the imager unit on a regular basis.
■ Clear the imager housing from ice and snow. Make sure the ventilation slots on
the rear side of the housing are not obstructed.
■ Clear the area in front of the lens from ice and snow. If the lens needs cleaning,
follow the instructions in the section 10 – Maintenance & cleaning on page 29
■ Check all connectors and make sure the locking rings are secured. Clear the con-
nectors from ice and snow.
■ Check all cables and clear the cables from ice and snow.
28 Publ. No. 1 557 544 Rev. a121 – ENGLISH (EN) – October 6, 2005
Page 35

10 Maintenance & cleaning
10.1 Camera body, cables & accessories
The camerabody,cables and accessories may be cleaned by wiping with a soft cloth.
To remove stains, wipe with a soft cloth moistened with a mild detergent solution and
wrung dry, then wipe with a dry soft cloth.
NOTE: Do not use benzene, thinner, or any other chemical product on the camera, the cables or the
accessories, as this may cause deterioration.
10.2 Lenses
In order to make the system withstand severe field conditions, all lenses are coated
with a hard carbon thin film coating.
To clean the lenses, any consumer-grade glass cleaner can be used.
Publ. No. 1 557 544 Rev. a121 – ENGLISH (EN) – October 6, 2005 29
Page 36

11 Technical support
For technical support, service inquiries, or comments & questions about the documentation, please contact FLIR Systems Imaging using one of the following two email addresses:
■ imagingboston.support@flir.com (US / North American customers only)
■ imagingsweden.support@flir.se
For telephone numbers to FLIR Systems Imaging offices, see the back cover of this
manual.
30 Publ. No. 1 557 544 Rev. a121 – ENGLISH (EN) – October 6, 2005
Page 37

12 Technical specifications
12.1 System specifications
254 × 220 × 320 mm (10 × 8.7 × 12.6")Dimensions (H x W x D)
6.7 kg / 14.76 lb.Weight
18–32 VDCPower
Peak current
Power consumption
Vibration
During Operation
Bump
During Operation
See also Doc. No. PM501707
■ 2 A, <0.5 sec, without heaters
■ 5.5 A, with heaters
■ 12 W typical, without heaters
■ 150 W, at 28 VDC, with heaters
RS-232 (all functions)Remote control
< 45 sec.Start-up time
IP 65Environmental protection
-32 °C to +55 °C (-26 °F to +131 °F)Operating temperature
-40 °C to +70 °C (-40 °F to + 158 °F)Storage temperature
Standard IEC 68-2-6 Test F
■ 5–500 Hz
■ ± 0.5 mm / 2 g
■ 1 octave / minute
■ 1 double sweep along each of three mutually
perpendicular axes.
Standard IEC 68-2-29
■ 25 g, 4–6 ms
■ 1000 bumps in one of two attitudes in each of
three mutually perpendicular axes, making a
total of three attitudes and 3000 bumps.
Publ. No. 1 557 544 Rev. a121 – ENGLISH (EN) – October 6, 2005 31
Page 38

12.2 – Thermal imager specifications
12.2 Thermal imager specifications
Detector type
Spectral range
See also Doc. No. PM501708
Focal Plane Array (FPA), uncooled microbolometer,
320 × 240 pixels.
20° × 15°Field of view, WFOV
5° × 3.75°Field of view, NFOV
7.5–13 μm, built-in atmospheric filter with cut-on
@ 7.5 μm.
1× to 4×Electronic zoom
< 0.8 secondsField of view switch time
14-bitDigital image resolution
Auto or manualGain/span (level) adjustment
Linear, histogram equalization, DDEImage processing
Black/white, rainbow, iron (+ inverted)Palettes
32 Publ. No. 1 557 544 Rev. a121 – ENGLISH (EN) – October 6, 2005
Page 39

12.3 Video camera specifications
1/4" color CCDImage sensor
768 (H) × 494 (V)Picture elements, NTSC
752 (H) × 582 (V)Picture elements, PAL
48° to 2.7°, continuousField of view, FOV
12 times, continuousElectronic zoom
0.7 lx (f/1.4)Minimum sensitivity
> 470 TVLHorizontal resolution, NTSC
> 460 TVLHorizontal resolution, PAL
18x, continuousOptical zoom
< 0.5 m (1.6 ft.)Close focus; wide (48°)
< 0.8 m (2.6 ft.)Close focus, narrow (2.7°)
Serial RS-232 (all functions)Remote control
RS-170 EIA, NTSC or PALVideo format
IP65Environmental protection
12.3 – Video camera specifications
Publ. No. 1 557 544 Rev. a121 – ENGLISH (EN) – October 6, 2005 33
Page 40

12.4 – List of relevant documents
12.4 List of relevant documents
NameDoc. No.
Outer Dimensions,ThermoVision™ Integrator 5/20MD_614004452
PM501708
PE_614004898
PP_614004898
Technical specification ThermoVision™ Integrator
5/20
Technical specification ThermoVision™ SentinelPM501705
Factory Acceptance Procedure ThermoVision™
Sentinel
Factory Acceptance Record ThermoVision™ Sentinel
Outer dimensions ThermoVision™ Sentinel1 121 716
34 Publ. No. 1 557 544 Rev. a121 – ENGLISH (EN) – October 6, 2005
Page 41

12.5 – Diagnostic tools
12.5 Diagnostic tools
NOTE: Subject to change without further notice.
12.5.1 General
The processing unit in the ThermoVision™ Sentinel comprises a built-in system of
tests that the operator can initiate. The dialog boxes below show the tests that can
be performed and an example of a result.
10712403;a1
Figure 12.1 Setup – Diag tools: Press the navigation pad left/right for each test to include or exclude it
from the diagnostic test.
10712303;a1
Figure 12.2 Setup – Diag tools: Example of a result
Publ. No. 1 557 544 Rev. a121 – ENGLISH (EN) – October 6, 2005 35
Page 42

12.6 – Troubleshooting guide
12.6 Troubleshooting guide
The following table is a guide for actions taken to correct simple operational faults
that may occur during normal use of the ThermoVision™ Sentinel.
ActionSymptom
No image appears on the screen at power on, or
the picture is distorted or continually scrolling.
The imager starts normallyand the screen display
appears but no IR image.
The systemstarts up properlyand gives anacceptable image but the imager does not react on
commands from the remote control unit
No video graphics overlay appear on the screen.
Check the video cable connecting the imager to
the video monitor.
The image could be totally out of focus. Adjust focus.
■ Check the cable connecting the imager to the
remote control unit
■ Check that the baud rate is set to 19200 bps
■ Check that the protocol is set to 5X0
Declutter is chosen. Press the Enter button and
check in the Symbology dialog box.
Change the Autoadjust setting.The image is totally black or white.
Press the NUC button.The image is of bad quality.
36 Publ. No. 1 557 544 Rev. a121 – ENGLISH (EN) – October 6, 2005
Page 43

12.7 – Overview & location of connectors
12.7 Overview & location of connectors
12.7.1 Connectors on Power Box (PB)
10370703;a1
Figure 12.3 Connectors on Power Box (PB)
Figure 12.4 Connectors on Power Box (PB) – explanations
LocationFunctionTypeName
Power Box (PB)Main system connector23-pin MIL C 38999J4
9-pin D-SUBJ5
computer or remote
control
Publ. No. 1 557 544 Rev. a121 – ENGLISH (EN) – October 6, 2005 37
Power Box (PB)Connector for host
Power Box (PB)Video out (1)Standard BNCJ6
Power Box (PB)Video out (2)Standard BNCJ7
Page 44

12.7 – Overview & location of connectors
12.7.2 Connectors on imager unit
10371003;a1
Figure 12.5 Location of connectors (enclosureremoved): J1 mainsystem connector andJ3 internal service
connector
Figure 12.6 Connectors on imager unit – explanations
LocationFunctionTypeName
23-pin MIL C 38999J1
9-pin D-SUBJ3
Main systemcable connector
Internal serviceconnector forhost computer or
remote control
Back panel on imager
unit
Inside protectiveimager
housing.
38 Publ. No. 1 557 544 Rev. a121 – ENGLISH (EN) – October 6, 2005
Page 45

12.8 Pin configuration
12.8.1 Connectors on Power Box (PB)
12.8.1.1 J4 – 23-pin connector
NOTE: Pin designations are printed on connector.
RESERVEDR
RESERVEDP
RESERVEDE
12.8 – Pin configuration
Wire typeSignal namePin
AWG 20GNDW
AWG 20+28 VZ
AWG 26HEATER ONV
AWG 26 twisted pairRS485CONSTX_BJ
AWG 26 twisted pairRS485CONSTX_AH
AWG 26 twisted pairRS485CONSRX_BG
AWG 26 twisted pairRS485CONSRX_AF
RESERVEDU
AWG 26SIGNAL GROUNDT
Coax 75 ΩVIDEO POSITIVES
Coax 75 ΩTV VIDEO POSITIVE/GROUNDX
Coax 75 ΩTV VIDEO POSITIVED
Coax 75 ΩVIDEO GROUNDC
VIDEO GROUNDY
RESERVEDA
RESERVEDB
RESERVEDK
RESERVEDL
RESERVEDM
RESERVEDN
Publ. No. 1 557 544 Rev. a121 – ENGLISH (EN) – October 6, 2005 39
Page 46

12.8 – Pin configuration
12.8.1.2 J5 – Connector for host computer & remote control
10342503;a1
Figure 12.7 J5 pin configuration.
NOTE: Pin designations are printed on connector.
Wire typeSignal namePin
1
AWG26RS-232 Host in (from camera)2
AWG26RS-232 Host out (to camera)3
4
AWG24RS-232 Ground5
AWG24+12 VDC6
7
AWG26HEATER_ON8
9
NOTE: HEATER_ON is positive when the heaters are activated and negative when they are not activated.
12.8.1.3 J6 – BNC connector
Standard configuration.
12.8.1.4 J7 – BNC connector
Standard configuration.
12.8.2 Connectors on imager unit
12.8.2.1 J1 – 23-pin connector
NOTE: Pin designations are printed on connector.
■ Cable connector: MIL C 38999: D38999/26WE99SN
■ Shell size: 17
■ Configuration: 99
40 Publ. No. 1 557 544 Rev. a121 – ENGLISH (EN) – October 6, 2005
Page 47

12.8 – Pin configuration
Wire typeSignal namePin
AWG 20GNDW
AWG 20+28 VZ
AWG 26HEATER ONV
AWG 26 twisted pairRS485CONSTX_BJ
AWG 26 twisted pairRS485CONSTX_AH
AWG 26 twisted pairRS485CONSRX_BG
AWG 26 twisted pairRS485CONSRX_AF
RS485TX_EN_BR
RS485TX_EN_AP
TERMINATOR DISABLEE
REMOTE PRESENTU
AWG 26SIGNAL GROUNDT
Coax 75 ΩVIDEO POSITIVES
Coax 75 ΩTV VIDEO POSITIVE/GROUNDX
Coax 75 ΩTV VIDEO POSITIVED
Coax 75 ΩGROUNDC
VIDEO GROUNDY
RS232 TxD (from imager)A
RS232 RxD (to imager)B
RESERVEDK
RESERVEDL
RESERVEDM
RESERVEDN
Publ. No. 1 557 544 Rev. a121 – ENGLISH (EN) – October 6, 2005 41
Page 48

12.8 – Pin configuration
12.8.2.2 J3 – Internal service connector
10342503;a1
Figure 12.8 J3 pin configuration.
NOTE: The outer housing must be removed to access the J3 internal service connector.
NOTE: This connector is normallynot used bytheoperator, butreserved for uploadingsoftware upgrades,
patches, bug fixes etc.
NOTE: Pin designations are printed on connector.
Wire typeSignal namePin
1
AWG26RS-232 Test in (from camera)2
AWG26RS-232 Test out (to camera)3
4
AWG24RS-232 Test ground5
+12 VDC6
7
8
9
NOTE: The +12 VDC wire has a thermal current limiter (PTC resistor). If the limiter triggers, it needs to
cool down before normal operation can be resumed.
NOTE: The communictation parameters are 19200 Bd, 5X0, 8, 1, N, XON/XOFF.
42 Publ. No. 1 557 544 Rev. a121 – ENGLISH (EN) – October 6, 2005
Page 49

12.9 – Basic dimensions – Imager; view from above
12.9 Basic dimensions – Imager; view from above
10343703;a1
Publ. No. 1 557 544 Rev. a121 – ENGLISH (EN) – October 6, 2005 43
Page 50

12.10 – Basic dimensions – Imager; rear view
12.10 Basic dimensions – Imager; rear view
10371103;a1
44 Publ. No. 1 557 544 Rev. a121 – ENGLISH (EN) – October 6, 2005
Page 51

12.11 – Basic dimensions – Imager; front view
12.11 Basic dimensions – Imager; front view
10343803;a1
Publ. No. 1 557 544 Rev. a121 – ENGLISH (EN) – October 6, 2005 45
Page 52

12.12 – Basic dimensions – Imager; side view
12.12 Basic dimensions – Imager; side view
10343903;a1
46 Publ. No. 1 557 544 Rev. a121 – ENGLISH (EN) – October 6, 2005
Page 53

12.13 – Basic dimensions – Imager; view from below
12.13 Basic dimensions – Imager; view from below
10371203;a1
Publ. No. 1 557 544 Rev. a121 – ENGLISH (EN) – October 6, 2005 47
Page 54

12.14 – Basic dimensions – Remote Control (RC)
12.14 Basic dimensions – Remote Control (RC)
10051103;a1
48 Publ. No. 1 557 544 Rev. a121 – ENGLISH (EN) – October 6, 2005
Page 55

12.15 – Basic dimensions – Power Box (PB)
12.15 Basic dimensions – Power Box (PB)
10370803;a1
Publ. No. 1 557 544 Rev. a121 – ENGLISH (EN) – October 6, 2005 49
Page 56

12.16 – Basic dimensions – Power Box (PB)
12.16 Basic dimensions – Power Box (PB)
10370903;a1
50 Publ. No. 1 557 544 Rev. a121 – ENGLISH (EN) – October 6, 2005
Page 57

13 History of infrared technology
Less than 200 years ago the existence of the infrared portion of the electromagnetic
spectrum wasn't even suspected. The original significance of the infrared spectrum,
or simply ‘the infrared’ as it is often called, as a form of heat radiation is perhaps less
obvious today than it was at the time of its discovery by Herschel in 1800.
10398703;a1
Figure 13.1 Sir William Herschel (1738–1822)
The discovery was made accidentally during the search for a new optical material.
Sir William Herschel – Royal Astronomer to King George III of England, and already
famous for his discovery of the planet Uranus – was searching for an optical filter
material to reduce the brightness of the sun’s image in telescopes during solar observations. While testing different samples of colored glass which gave similar reductions
in brightness he was intrigued to find that some of the samples passed very little of
the sun’s heat, while others passed so much heat that he risked eye damage after
only a few seconds’ observation.
Herschel was soon convinced of the necessity of setting up a systematic experiment,
with the objective of finding a single material that would give the desired reduction in
brightness as well as the maximum reduction in heat. He began the experiment by
actually repeatingNewton’s prism experiment, but looking for the heating effect rather
than the visual distribution of intensity in the spectrum. He first blackened the bulb of
a sensitive mercury-in-glass thermometer with ink, and with this as his radiation detector he proceeded to test the heating effect of the various colors of the spectrum
formed on the top of a table by passing sunlight through a glass prism. Other thermometers, placed outside the sun’s rays, served as controls.
As the blackened thermometer was moved slowly along the colors of the spectrum,
the temperature readings showed a steady increase from the violet end to the red
end. This was not entirely unexpected, since the Italian researcher, Landriani, in a
similar experiment in 1777 had observed much the same effect. It was Herschel,
however, who was the first to recognize that there must be a point where the heating
Publ. No. 1 557 544 Rev. a121 – ENGLISH (EN) – October 6, 2005 51
Page 58

effect reaches a maximum, and that measurements confined to the visible portion of
the spectrum failed to locate this point.
10398903;a1
Figure 13.2 Marsilio Landriani (1746–1815)
Moving the thermometer into the dark region beyond the red end of the spectrum,
Herschel confirmedthat the heating continued to increase. The maximum point, when
he found it, lay well beyond the red end – in what is known today as the ‘infrared
wavelengths’.
When Herschel revealed his discovery, he referred to this new portion of the electromagnetic spectrumas the‘thermometrical spectrum’.The radiationitself hesometimes
referred to as ‘dark heat’, or simply ‘the invisible rays’. Ironically, and contrary to
popular opinion, it wasn't Herschel who originated the term ‘infrared’. The word only
began to appear in print around 75 years later, and it is still unclear who should receive
credit as the originator.
Herschel’s use of glass in the prism of his original experiment led to some early
controversies with his contemporaries about the actual existence of the infrared
wavelengths. Different investigators, in attempting to confirm his work, used various
types of glass indiscriminately, havingdifferent transparenciesin the infrared. Through
his later experiments, Herschel was aware of the limited transparency of glass to the
newly-discovered thermal radiation, and he was forced to conclude that optics for
the infrared would probably be doomed to the use of reflective elements exclusively
(i.e. plane and curved mirrors). Fortunately, this proved to be true only until 1830,
when the Italian investigator, Melloni, made his great discoverythat naturally occurring
rock salt (NaCl) – which was available in large enough natural crystals to be made
into lenses and prisms – is remarkably transparent to the infrared. The result was that
rock salt became the principal infrared optical material, and remained so for the next
hundred years, until the art of synthetic crystal growing was mastered in the 1930’s.
52 Publ. No. 1 557 544 Rev. a121 – ENGLISH (EN) – October 6, 2005
Page 59

10399103;a1
Figure 13.3 Macedonio Melloni (1798–1854)
Thermometers, as radiation detectors, remained unchallenged until 1829, the year
Nobili invented the thermocouple. (Herschel’s own thermometer could be read to
0.2 °C (0.036 °F), and later models were able to be read to 0.05 °C (0.09 °F)). Then
a breakthrough occurred; Melloni connected a number of thermocouples in series
to form the first thermopile. The new device was at least 40 times as sensitive as the
best thermometer of the day for detecting heat radiation – capable of detecting the
heat from a person standing three meters away.
The first so-called ‘heat-picture’ became possible in 1840, the result of work by Sir
John Herschel, son of the discoverer of the infrared and a famous astronomer in his
own right. Based upon the differential evaporation of a thin film of oil when exposed
to a heat pattern focused upon it, the thermal image could be seen by reflected light
where the interference effects of the oil film made the image visible to the eye. Sir
John also managed to obtain a primitive record of the thermal image on paper, which
he called a ‘thermograph’.
Publ. No. 1 557 544 Rev. a121 – ENGLISH (EN) – October 6, 2005 53
Page 60

10399003;a2
Figure 13.4 Samuel P. Langley (1834–1906)
The improvement of infrared-detector sensitivity progressed slowly. Another major
breakthrough, made by Langley in 1880, was the invention of the bolometer. This
consisted ofa thinblackened strip of platinumconnected in one arm of a Wheatstone
bridge circuit upon which the infrared radiation was focused and to which a sensitive
galvanometer responded. This instrument is said to have been able to detect the heat
from a cow at a distance of 400 meters.
An English scientist, Sir James Dewar, first introduced the use of liquefied gases as
cooling agents (such as liquid nitrogen with a temperature of -196 °C (-320.8 °F)) in
low temperature research. In 1892 he invented a unique vacuum insulating container
in which it is possible to store liquefied gases for entire days. The common ‘thermos
bottle’, used for storing hot and cold drinks, is based upon his invention.
Between the years 1900 and 1920, the inventors of the world‘discovered’ the infrared.
Many patents were issued for devices to detect personnel, artillery, aircraft, ships –
and even icebergs. The first operating systems, in the modern sense, began to be
developed duringthe 1914–18war, when both sides had research programs devoted
to the military exploitation of the infrared. These programs included experimental
systems for enemy intrusion/detection, remote temperature sensing, secure communications, and ‘flying torpedo’ guidance. An infrared search system tested during this
period was able to detect an approaching airplane at a distanceof 1.5 km (0.94 miles),
or a person more than 300 meters (984 ft.) away.
The most sensitive systems up to this time were all based upon variations of the
bolometer idea, but the period between the two wars saw the development of two
revolutionary new infrared detectors: the image converter and the photon detector.
At first, the image converter received the greatest attention by the military, because
it enabled an observer for the first time in history to literally ‘see in the dark’. However,
the sensitivity of the image converter was limited to the near infrared wavelengths,
and the most interesting military targets (i.e. enemy soldiers) had to be illuminated
54 Publ. No. 1 557 544 Rev. a121 – ENGLISH (EN) – October 6, 2005
Page 61

by infrared search beams. Since this involved the risk of giving away the observer’s
position to a similarly-equipped enemy observer, it is understandable that military
interest in the image converter eventually faded.
The tactical military disadvantages of so-called 'active’ (i.e. search beam-equipped)
thermal imaging systems provided impetus following the 1939–45 war for extensive
secret military infrared-research programs into the possibilities of developing ‘passive’
(no search beam) systems around the extremely sensitive photon detector. During
this period, military secrecy regulations completely prevented disclosure of the status
of infrared-imaging technology. This secrecy only began to be lifted in the middle of
the 1950’s, and from that time adequate thermal-imaging devices finally began to be
available to civilian science and industry.
Publ. No. 1 557 544 Rev. a121 – ENGLISH (EN) – October 6, 2005 55
Page 62

14 Theory of thermal imaging
14.1 Introduction
The subjects of infrared radiation is still new to many who will use an infrared camera.
In this section the theory behind thermal imaging will be given.
14.2 The electromagnetic spectrum
The electromagnetic spectrum is divided arbitrarily into a number of wavelength regions, called bands, distinguished by the methods used to produce and detect the
radiation. Thereis no fundamental difference between radiation in the different bands
of the electromagnetic spectrum. They are all governed by the same laws and the
only differences are those due to differences in wavelength.
10067803;a1
Figure 14.1 The electromagnetic spectrum. 1: X-ray; 2: UV; 3: Visible; 4: IR; 5: Microwaves; 6: Radiowaves.
Thermal imaging makes use of the infrared spectral band. At the short-wavelength
end the boundary lies at the limit of visual perception, in the deep red. At the longwavelength end it merges with the microwave radio wavelengths, in the millimeter
range.
The infrared band is often further subdivided into four smaller bands, the boundaries
of which are also arbitrarily chosen. They include: the near infrared (0.75–3 μm), the
56 Publ. No. 1 557 544 Rev. a121 – ENGLISH (EN) – October 6, 2005
Page 63

14.3 – Blackbody radiation
middle infrared (3–6 μm), the far infrared (6–15 μm) and the extreme infrared (15–100
μm). Although the wavelengths are given in μm (micrometers), other units are often
still used to measure wavelength in this spectral region, e.g. nanometer (nm) and
Ångström (Å).
The relationships between the different wavelength measurements is:
14.3 Blackbody radiation
A blackbody is defined as an object which absorbs all radiation that impinges on it
at any wavelength. The apparentmisnomer black relating to an object emitting radiation isexplained by Kirchhoff’s Law (after Gustav Robert Kirchhoff, 1824–1887), which
states that a body capable of absorbing all radiation at any wavelength is equally
capable in the emission of radiation.
10398803;a1
Figure 14.2 Gustav Robert Kirchhoff (1824–1887)
The construction of a blackbody source is, in principle, very simple. The radiation
characteristics of an aperture in an isotherm cavity made of an opaque absorbing
material representsalmost exactlythe properties of a blackbody. A practical application
of the principle to the construction of a perfect absorber of radiation consists of a box
that is light tight except for an aperture in one of the sides. Any radiation which then
enters the hole is scattered and absorbed by repeatedreflections so only an infinitesimal fraction can possibly escape. The blackness which is obtained at the aperture
is nearly equal to a blackbody and almost perfect for all wavelengths.
By providing such an isothermal cavity with a suitable heater it becomes what is
termed a cavity radiator. An isothermal cavity heated to a uniform temperature generates blackbody radiation, the characteristics of which are determined solely by the
temperature of the cavity.
Publ. No. 1 557 544 Rev. a121 – ENGLISH (EN) – October 6, 2005 57
Page 64

14.3 – Blackbody radiation
If the temperature of blackbody radiation increases to more than 525 °C (977 °F), the
source begins to be visible so that it appears to the eye no longer black. This is the
incipient red heat temperature of the radiator, which then becomes orange or yellow
as the temperature increases further. In fact, the definition of the so-called color
temperature of an object is the temperature to which a blackbody would have to be
heated to have the same appearance.
Now consider three expressions that describe the radiation emitted from a blackbody.
14.3.1 Planck’s law
10399203;a1
Figure 14.3 Max Planck (1858–1947)
Max Planck (1858–1947) wasable todescribe the spectral distribution of the radiation
from a blackbody by means of the following formula:
where:
λb
NOTE: The factor 10-6is used since spectral emittance in the curves is expressed in Watt/m2m. If the
factor is excluded, the dimension will be Watt/m2μm.
Blackbody spectral radiant emittance at wavelength λ.W
Velocity of light = 3 × 10⁸m/sc
Planck’s constant = 6.6 × 10
Boltzmann’s constant = 1.4 × 10
Absolute temperature (K) of a blackbody.T
Wavelength (μm).λ
-34
Joule sec.h
-23
Joule/K.k
58 Publ. No. 1 557 544 Rev. a121 – ENGLISH (EN) – October 6, 2005
Page 65

14.3 – Blackbody radiation
Planck’s formula, when plotted graphically for various temperatures, produces a
family of curves. Following any particular Planck curve, the spectral emittance is zero
at λ = 0, then increases rapidly to amaximum at a wavelength λ
and after passing
max
it approaches zero again at very long wavelengths. The higher the temperature, the
shorter the wavelength at which maximum occurs.
10327103;a3
Figure 14.4 Blackbody spectral radiant emittance according to Planck’s law, plotted for various absolute
temperatures. 1: Spectral radiant emittance (W/cm2× 103(μm)); 2: Wavelength (μm)
14.3.2 Wien’s displacement law
By differentiating Planck’s formula with respect to λ, and finding the maximum, we
have:
This is Wien’s formula (after Wilhelm Wien, 1864–1928), which expresses mathematically the common observation that colors vary from red to orange or yellow as the
temperature of a thermal radiator increases. The wavelength of the color is the same
as the wavelength calculated for λ
. A good approximation of the value of λ
max
max
for
a given blackbody temperature is obtained by applying the rule-of-thumb 3 000/T
μm. Thus, a very hot star such as Sirius (11 000 K), emitting bluish-white light, radiates
with the peak of spectral radiant emittance occurring within the invisible ultraviolet
spectrum, at wavelength 0.27 μm.
Publ. No. 1 557 544 Rev. a121 – ENGLISH (EN) – October 6, 2005 59
Page 66

14.3 – Blackbody radiation
10399403;a1
Figure 14.5 Wilhelm Wien (1864–1928)
The sun (approx. 6 000 K) emits yellow light, peaking at about 0.5 μm in the middle
of the visible light spectrum.
At room temperature (300 K) the peak of radiant emittance lies at 9.7 μm, in the far
infrared, while at the temperature of liquid nitrogen (77 K) the maximum of the almost
insignificant amount of radiant emittance occurs at 38 μm, in the extreme infrared
wavelengths.
10327203;a3
Figure 14.6 Planckian curves plottedon semi-log scales from 100 K to1000 K. The dotted line represents
the locus of maximum radiant emittance at each temperature as described by Wien's displacement law.
1: Spectral radiant emittance (W/cm2(μm)); 2: Wavelength (μm).
60 Publ. No. 1 557 544 Rev. a121 – ENGLISH (EN) – October 6, 2005
Page 67

14.3 – Blackbody radiation
14.3.3 Stefan-Boltzmann's law
By integrating Planck’s formula from λ = 0 to λ = ∞, we obtain the total radiant
emittance (Wb) of a blackbody:
This is the Stefan-Boltzmann formula (after Josef Stefan, 1835–1893, and Ludwig
Boltzmann, 1844–1906), which states that the total emissive power of a blackbody is
proportional tothe fourth power of its absolute temperature. Graphically, Wbrepresents
the area below the Planck curve for a particular temperature. It can be shown that the
radiant emittancein the interval λ = 0 to λ
is only 25 % of the total, which represents
max
about the amount of the sun’s radiation which lies inside the visible light spectrum.
10399303;a1
Figure 14.7 Josef Stefan (1835–1893), and Ludwig Boltzmann (1844–1906)
Using the Stefan-Boltzmann formula to calculate the power radiated by the human
body, at a temperature of 300 K and an external surface area of approx. 2 m2, we
obtain 1 kW.This power loss could not be sustained if it were notfor the compensating
absorption of radiation from surrounding surfaces, at room temperatures which do
not vary too drastically from the temperature of the body – or, of course, the addition
of clothing.
14.3.4 Non-blackbody emitters
So far, only blackbody radiators and blackbody radiation have been discussed.
However, real objects almost never comply with these laws over an extended wavelength region – although they may approach the blackbody behavior in certain
spectral intervals. For example, a certain type of white paint may appear perfectly
white in the visible light spectrum, but becomes distinctly gray at about 2 μm, and
beyond 3 μm it is almost black.
There are three processes which can occur that prevent a real object from acting like
a blackbody: a fraction of the incident radiation α may be absorbed, a fraction ρ may
be reflected, and a fraction τ may be transmitted. Since all of these factors are more
Publ. No. 1 557 544 Rev. a121 – ENGLISH (EN) – October 6, 2005 61
Page 68

14.3 – Blackbody radiation
or less wavelength dependent, the subscript λ is used to imply the spectral dependence of their definitions. Thus:
■ The spectral absorptance α
= the ratio of the spectral radiant power absorbed by
λ
an object to that incident upon it.
■ The spectral reflectance ρ
= the ratio of the spectral radiant power reflected by
λ
an object to that incident upon it.
■ The spectral transmittance τ
= the ratio of the spectral radiant power transmitted
λ
through an object to that incident upon it.
The sum of these three factors must always add up to the whole at any wavelength,
so we have the relation:
For opaque materials τλ= 0 and the relation simplifies to:
Another factor, called the emissivity, is required to describe the fraction ε of the radiant
emittance of a blackbody produced by an object at a specific temperature. Thus, we
have the definition:
The spectral emissivity ελ= the ratio of the spectral radiant power from an object to
that from a blackbody at the same temperature and wavelength.
Expressed mathematically, this can be written as the ratio of the spectral emittance
of the object to that of a blackbody as follows:
Generally speaking, there are three types of radiation source, distinguished by the
ways in which the spectral emittance of each varies with wavelength.
■ A blackbody, for which ε
■ A graybody, for which ε
■ A selective radiator, for which ε varies with wavelength
= ε = 1
λ
= ε = constant less than 1
λ
According to Kirchhoff’s law, for any material the spectral emissivity and spectral absorptance of a body are equal at any specified temperature and wavelength. That is:
From this we obtain, for an opaque material (since αλ+ ρλ= 1):
62 Publ. No. 1 557 544 Rev. a121 – ENGLISH (EN) – October 6, 2005
Page 69

14.3 – Blackbody radiation
For highly polished materials ελapproaches zero, so that for a perfectly reflecting
material (i.e. a perfect mirror) we have:
For a graybody radiator, the Stefan-Boltzmann formula becomes:
This states that the total emissive power of a graybody is the same as a blackbody
at the same temperature reduced in proportion to the value of ε from the graybody.
10401203;a1
Figure 14.8 Spectral radiant emittance of three types of radiators. 1: Spectral radiant emittance; 2:
Wavelength; 3: Blackbody; 4: Selective radiator; 5: Graybody.
Publ. No. 1 557 544 Rev. a121 – ENGLISH (EN) – October 6, 2005 63
Page 70

14.4 – Infrared semi-transparent materials
10327303;a3
Figure 14.9 Spectral emissivity of three types of radiators. 1: Spectral emissivity; 2: Wavelength; 3:
Blackbody; 4: Graybody; 5: Selective radiator.
14.4 Infrared semi-transparent materials
Consider nowa non-metallic,semi-transparent body – let us say, in the form of a thick
flat plate of plastic material. When the plate is heated, radiation generated within its
volume must work its way toward the surfaces through the material in which it is
partially absorbed. Moreover, when it arrives at the surface, some of it is reflected
back into the interior. The back-reflected radiation is again partially absorbed, but
some of it arrives at the other surface, through which most of it escapes; part of it is
reflected back again. Although the progressive reflections become weaker and
weaker they must all be added up when the total emittance of the plate is sought.
When the resulting geometrical series is summed, the effective emissivity of a semitransparent plate is obtained as:
When the plate becomes opaque this formula is reduced to the single formula:
This last relation is a particularly convenient one, becauseit is often easier to measure
reflectance than to measure emissivity directly.
64 Publ. No. 1 557 544 Rev. a121 – ENGLISH (EN) – October 6, 2005
Page 71

Index
1
1 195 367: 2
1 195 413: 2
1 557 544: 2
1 909 824: 2
194 796: 2
194 797: 2
6
614004898: 2
9
908 929: 2
A
A
button: 16
accessories
cleaning: 29
active channel
symbol: 12, 13
address: iv
ATR ThermoVision™ Sentinel
packing list: 2
Autofocus
command: 19
Auto level/span
command: 18
B
Back light comp
label: 21
Backlight on
command: 19
bands
extreme infrared: 56
far infrared: 56
middle infrared: 56
near infrared: 56
Baudrate
label: 25
BIT: 35
blackbody
construction: 57
explanation: 57
practical application: 57
built-in tests: 35
Index – 1
buttons
A: 16
C
cables
cleaning: 29
camera body
cleaning: 29
cavity radiator
applications: 57
explanation: 57
Certificate of Conformity
packing list: 2
Change FoV
command: 19
Change palette
command: 17
Change password
label: 26
cleaning
accessories: 29
cables: 29
camera body: 29
Color scale
label: 20
commands
Autofocus: 19
Auto level/span: 18
Backlight on: 19
Change FoV: 19
Change palette: 17
Date & Time: 24
Declutter: 14, 17, 18
Freeze: 17, 19
Image: 20
Invert palette: 17
Live: 17, 19
Local adapt: 23
Maintenance: 25
Man. level/span: 18
Narrow FoV: 18
Power off: 18, 19
Slave mode on: 18, 19
Symbology: 21
System info: 27
Wide FoV: 18
contact details: iv
copyright: iv
Publ. No. 1 557 544 Rev. a121 – ENGLISH (EN) – October 6, 2005 65
Page 72

Index – D
Crosshair retic
label: 22
crosshair reticle
symbol: 12, 13
D
Data background
label: 22
Data field
label: 22
Data format
label: 23
Date & Time
command: 24
Day
label: 24
Declutter
command: 14, 17, 18
DECLUTTER
mode: 14
Default settings
label: 27
Device ID
label: 25
Dewar, James: 54
diagnostic tools: 35
dialog boxes
Setup – Date & Time: 24
Setup – Image: 21
Setup – Local adaption: 23
Setup – Maintenance: 25
Setup – Symbology: 23
System information: 27
display symbology: 11
E
electromagnetic spectrum: 56
e-mail: iv
extreme infrared band: 56
F
far infrared band: 56
FLIR Systems
contact details: iv
copyright: iv
e-mail: iv
ISO 9001: iv
legal disclaimer: iv
patents: iv
patents pending: iv
postal address: iv
product warranty: iv
quality assurance: iv
quality management system: iv
telefax number: iv
telephone number: iv
trademarks: iv
warranty: iv
website: iv
Focus indicator
label: 22
focus position indicator
symbol: 12, 13
formulas
Planck's law: 58
Stefan Boltzmann's formula: 61
Wien's displacement law: 59
Freeze
command: 17, 19
G
graybody: 62
Gustav Robert Kirchhoff: 57
H
heat picture: 53
Herschel, William: 51
history
infrared technology: 51
Hour
label: 24
I
Image
command: 20
menu: 17
Image effect
label: 21
image polarity
symbol: 12, 13
indicators
active channel: 13
crosshair reticle: 13
focus position: 12, 13
image polarity: 13
level & span (gain): 13
NFOV reticle: 13
system date: 13
system time: 13
infrared semi-transparent body: 64
infrared technology
history: 51
Invert palette
command: 17
66 Publ. No. 1 557 544 Rev. a121 – ENGLISH (EN) – October 6, 2005
Page 73

Index – J
IR/TV video swap
label: 27
ISO 9001: iv
J
James Dewar: 54
Josef Stefan: 61
K
keys
A: 16
Kirchhoff, Gustav Robert: 57
L
labels
Back light comp: 21
Baudrate: 25
Change password: 26
Color scale: 20
Crosshair retic: 22
Data background: 22
Data field: 22
Data format: 23
Day: 24
Default settings: 27
Device ID: 25
Focus indicator: 22
Hour: 24
Image effect: 21
IR/TV video swap: 27
Language: 23
Level/Span: 20
Minute: 24
Month: 24
Near IR sensitive: 21
NFOV brackets: 23
Nuc button: 21
Protocol: 26
Run diag tool: 25
Runtime: 27
Status background: 22
System check ID: 27
Time format: 23
Video mode: 27
Year: 24
Landriani, Marsilio: 51
Langley, Samuel P.: 54
Language
label: 23
laws
Planck's law: 58
Stefan-Boltzmann's formula: 61
Wien's displacement law: 59
legal disclaimer: iv
Leopoldo Nobili: 53
Level/Span
label: 20
level & span (gain) indicator
symbol: 13
Live
command: 17, 19
Local adapt
command: 23
Ludwig Boltzmann: 61
M
Macedonio Melloni: 52
Maintenance
command: 25
Man. level/span
command: 18
Marsilio Landriani: 51
Max Planck: 58
Melloni, Macedonio: 52
menus
Image: 17
Setup: 19
middle infrared band: 56
Minute
label: 24
modes
DECLUTTER: 14
Month
label: 24
N
Narrow FoV
command: 18
near infrared band: 56
Near IR sensitive
labels: 21
NFOV brackets
label: 23
NFOV reticule
symbol: 12, 13
Nobili, Leopoldo : 53
non-blackbody emitters: 61
Nuc button
label: 21
O
operator’s manual
packing list: 2
Publ. No. 1 557 544 Rev. a121 – ENGLISH (EN) – October 6, 2005 67
Page 74

Index – P
P
packing list: 2
ATR ThermoVision™ Sentinel: 2
Certificate of Conformity: 2
operator’s manual: 2
Power Box (PB): 2
Remote Control (RC): 2
system cable, 15 m / 50 ft.: 2
ThermoVision™ Sentinel: 2
transport case: 2
video cable: 2
part numbers
1 195 367: 2
1 195 413: 2
1 557 544: 2
1 909 824: 2
194 796: 2
194 797: 2
908 929: 2
614004898: 2
PP_614004898: 2
patents: iv
patents pending: iv
Planck, Max: 58
postal address: iv
Power Box (PB)
packing list: 2
Power off
command: 18, 19
PP_614004898: 2
product warranty: iv
Protocol
label: 26
Q
quality assurance: iv
quality management system: iv
R
radiators
cavity radiator: 57
graybody radiators: 62
selective radiators: 62
Remote Control (RC)
packing list: 2
Run diag tool
label: 25
Runtime
label: 27
S
Samuel P. Langley: 54
screen objects
active channel: 12, 13
crosshair reticle: 12, 13
focus position indicator: 12, 13
image polarity: 12, 13
level & span (gain) indicator: 13
NFOV reticule: 12, 13
system date: 12, 13
system time: 12, 13
semi-transparent body: 64
Setup
menu: 19
Setup – Date & Time
dialog box: 24
Setup – Image
dialog box: 21
Setup – Local adaption
dialog box: 23
Setup – Maintenance
dialog box: 25
Setup – Symbology
dialog box: 23
Sir James Dewar: 54
Sir William Herschel: 51
Slave mode on
command: 18, 19
specifications
video camera: 33
spectrum
thermometrical: 52
Status background
label: 22
Stefan, Josef: 61
support
technical: 30
symbology: 11
Symbology
command: 21
symbols
active channel: 12, 13
crosshair reticle: 12, 13
focus position indicator: 12, 13
image polarity: 12, 13
level & span (gain) indicator: 13
NFOV reticule: 12, 13
system date: 12, 13
system time: 12, 13
system cable, 15 m / 50 ft.
packing list: 2
System check ID
label: 27
system date
symbol: 12, 13
68 Publ. No. 1 557 544 Rev. a121 – ENGLISH (EN) – October 6, 2005
Page 75

System info
command: 27
System information
dialog box: 27
system time
symbol: 12, 13
T
technical support: 30
telefax number: iv
telephone number: iv
tests
built-in: 35
theory of thermography: 56
thermograph: 53
thermographic theory: 56
thermometrical spectrum: 52
thermos bottle: 54
ThermoVision™ Sentinel
packing list: 2
Time format
label: 23
tools
diagnostic: 35
trademarks: iv
transport case
packing list: 2
Index – T
U
unpacking: 2
V
video cable
packing list: 2
video camera
specifications: 33
Video mode: 27
W
warranty: iv
website: iv
Wide FoV
command: 18
Wien, Wilhelm: 59
Wilhelm Wien: 59
William Herschel: 51
Y
Year
label: 24
Publ. No. 1 557 544 Rev. a121 – ENGLISH (EN) – October 6, 2005 69
Page 76

A note on the production of this manual
This manual was produced using XML – Extensible Markup Language. For more information about XML, point your browser to:
http://www.w3.org/XML/
Customers interested in the history & theory of markup languages may also want to visit the following sites:
▪ http://www.gla.ac.uk/staff/strategy/information/socarcpj/
▪ http://www.renater.fr/Video/2002ATHENS/P/DC/History/plan.htm
The following software was used for the production of this manual:
URLSupplierSoftwareDescription
http://www.excosoft.se/eweb/site/excoconf_pd.htmlExcosoftExcoConfVersion control
http://www.excosoft.se/eweb/site/exc_pd.htmlExcosoftXML ClientEditing environment
http://www.excosoft.se/eweb/site/home.htmlExcosoftExcoFormPreformatting
http://xml.apache.org/xerces-jApacheXercesXML parser
http://xml.apache.org/xalan-jApacheXalanXSLT processor
http://www.renderx.net/Content/index.htmlRenderXXEPXSL-FO rendering engine
The following file identities and versions were used in this manual:
20236703.xml a30
20238503.xml a4
20246703.xml a2
20246803.xml a2
20247003.xml a2
20247103.xml a2
20253603.xml a9
20253803.xml a10
20254003.xml a6
20254303.xml a1
20254403.xml a2
20254903.xml a19
20264203.xml a2
20266103.xml a1
20266303.xml a2
20266403.xml a1
20266503.xml a1
20266603.xml a1
20269003.xml a2
R0082.rcp a1
config.xml a1
70 Publ. No. 1 557 544 Rev. a121 – ENGLISH (EN) – October 6, 2005
Page 77

Page 78

UNITED KINGDOMSANTA BARBARA USACORPORATE HQ USA
FLIR Systems Ltd.FLIR Systems, Inc.FLIR Systems, Inc.
2 Kings Hill AvenueIndigo Operations27700A SW Parkway Avenue
West Malling, Kent ME19 4AQ70 Castilian Dr.WILSONVILLE, OR 97070
UNITED KINGDOMGoleta, CA 93117-3027USA
PH: +44 1732.220011USAPhone: +1 503 498 3547
Fax: +1 805 685 2711
BOSTON USA
FLIR Systems, Inc. FLIR Systems, Inc.
16 Esquire Road
North Billerica, MA 01862
E-mail: sales@indigosystems.com
Web: www.corebyindigo.com
SWEDEN
FLIR Systems AB Imaging SwedenUSA P.O. Box 35021
Rinkebyvägen 19PH: +1 978.901.8000 Dubai
P.O. Box 3PH: +1 800.GO.INFRA UNITED ARAB EMIRATES
SE-182 11 DanderydFX: +1 978.901.8885 PH: +971.4.2822339
SWEDEN FX: +971.4.2822527
PH: +46 8 753 25 00
FX: +46 8 731 05 30
FX: +44 1732.220014Phone: +1 805 964 9797Web: www.flirthermography.com
MIDDLE EAST
Middle East Office
UB Building, Suite 108
 Loading...