

Page 1
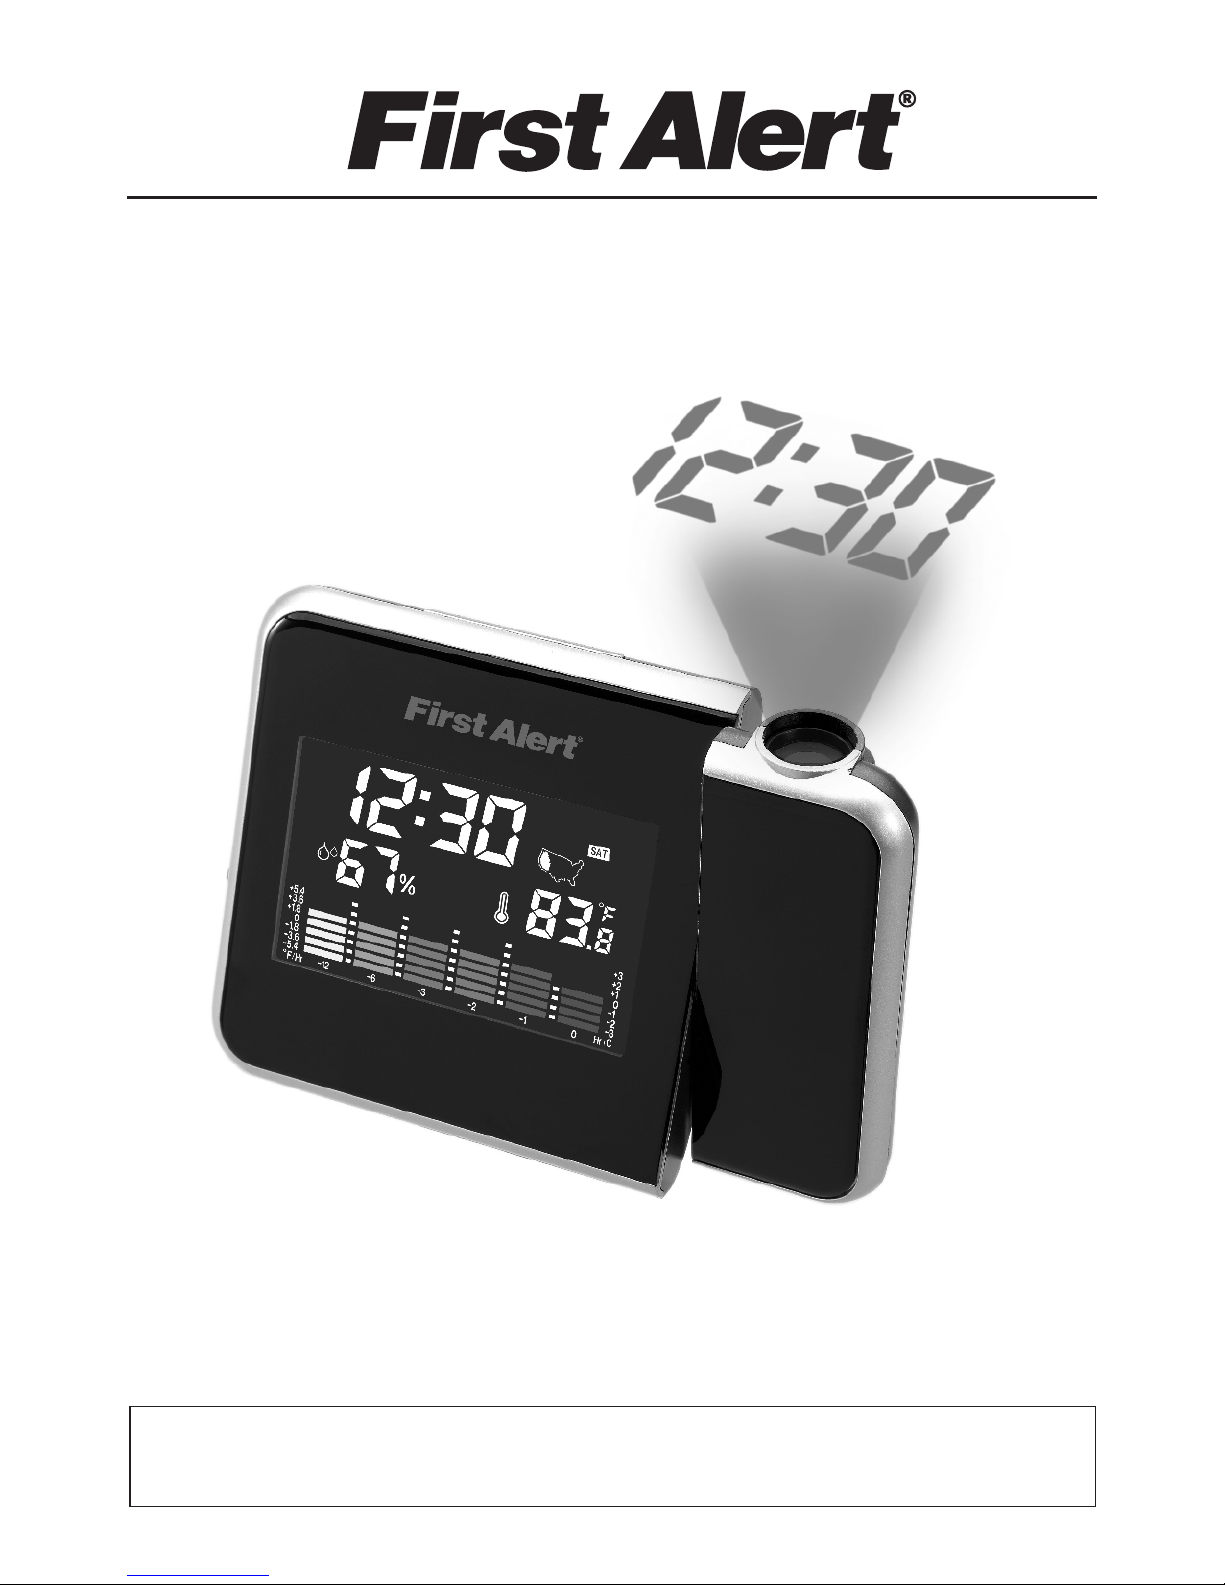
INDOOR WEATHER STATION
WITH PROJECTION CLOCK
USER MANUAL
SFA2200
PLEASE READ THIS USER MANUAL COMPLETELY BEFORE
OPERATING THIS UNIT AND RETAIN IT FOR FUTURE REFERENCE
Page 2

-1-
IMPORTANT SAFETY INSTRUCTIONS
When used in the directed manner, this u nit has been designed and manufactured to ensure your perso nal
safety. However, imp roper use can result in potential ele ctrical shock or fire hazards. Please read all safety
and operating instructions care fully before installation and use, and keep these instruc tions handy for
future reference. Take special note of all warnings liste d in these instructions and on the unit.
1. Read these instructions – All the safety and operating instructions should be read before the ap pliance is
operated.
2. Keep these instructions – The safety and operating ins tructions should be kept for future reference.
3. Heed all warnings – All warni ngs on the appliance and in the operati ng instructions should be adhered to.
4. Follow all instructions – All opera tion and use instructions should be followed.
5. Do not use this apparatus near water – The appliance shoul d not be used near water; for example, near a
bath tub, washbowl, kitchen sink, laundry tub, in a wet basem ent, or near a swimming pool.
6. Clean only with dry cloth – The appliance should be cleane d only as recommended by the manufacturer.
7. Do not install near any heat sources s uch as radiators, heat registers, stoves, or other appara tus
(including amplifiers) that produce heat.
8. Only use attachments / accessories specified by the manuf acturer.
9. Refer all servicing to qualified se rvice personnel. Servicing is required when the apparat us has been
damaged in any way, suc h as power-supply cord or plug is damag ed, liquid has been spilled or objects
have fallen into the apparatus, the apparatus has been exposed to rain or moisture, does not opera te
normally, or has been d ropped.
10. This appliance shall not be exposed to dripping or spla shing water and that no object filled with liquids
such as vases shall be placed on the apparatus.
11. Power Sources – The appliance should be connected to a power supply only of the ty pe described in the
operating instructions or as marked on the appliance. Do no t overload wall outlet.
12. Danger of explosion if battery is incorrectly replaced. Replace only with the same or equiva lent type.
13. Do not attempt to dismantle, open or repair this product yo urself. If a fault occurs, seek advice from your
local qualified service technici an or contact the distri butor via the telephone number at the b ack of this
instruction manual.
14. Caution marking and nameplate a re located on back of product.
COMPLIANCE WITH FCC REGULATIONS
This device complies with Part 15 of the FCC Rules. Operation i s subject to the following two condit ions:
(1) this device may not cause harmful interference, and
(2) this device must accept any interference received, in cluding interference that may cau se undesired
operation.
NOTE: This equipme nt has been tested and found to comply wi th the limits for a Class B di gital device,
pursuant to Part 15 of the FCC Rules. These limits are design ed to provide reasonable protection against
harmful interference in a residen tial installation. This equipment generat es, uses and can radiate radio
frequency energy and, if not installed and used in accordance with the instructions, may cause h armful
interference to radio communica tions. However, there is no guarantee that interference wi ll not occur in a
particular installation. If this equipment does cause harmful interference to radio or tel evision reception,
which can be determined by turning th e equipment off and on , the user is encouraged to try to correct the
interference by one or more of the following measures:
- Reorient or relocate the receivin g antenna.
- Increase the separation between t he equipment and receiver.
- Connect the equipment into an outle t on a circuit differe nt from that to which the re ceiver is connected.
- Consult the dealer or an experience d radio/TV technician for help.
CAUTION: Changes or mo difications not expre ssly approved by the par ty responsi ble for
compliance could voi d the user’s au thority t o operate the e quipment.
SPECIAL NOTE
This model is equipped with non-ski d rubber 'feet' to prevent the product from moving when you ope rate the
controls. These 'f eet' are made from non-migrating ru bber material specially formulated to avoid leaving
any marks or stains on your furniture. However certain type s of oil based furniture polishes, wo od
preservatives, or cleaning spra ys may cause the rubber 'feet' to soften, and leave marks or a rubber residue
on the furniture. To pre vent any damage to your furniture we st rongly recommend that you purchase small
self-adhesive felt pads, availa ble at hardware stores and home improvement centers every where, and
apply these pads to the bottom of the rubber 'feet' before you pl ace the product on fine wooden furnitu re.
Page 3
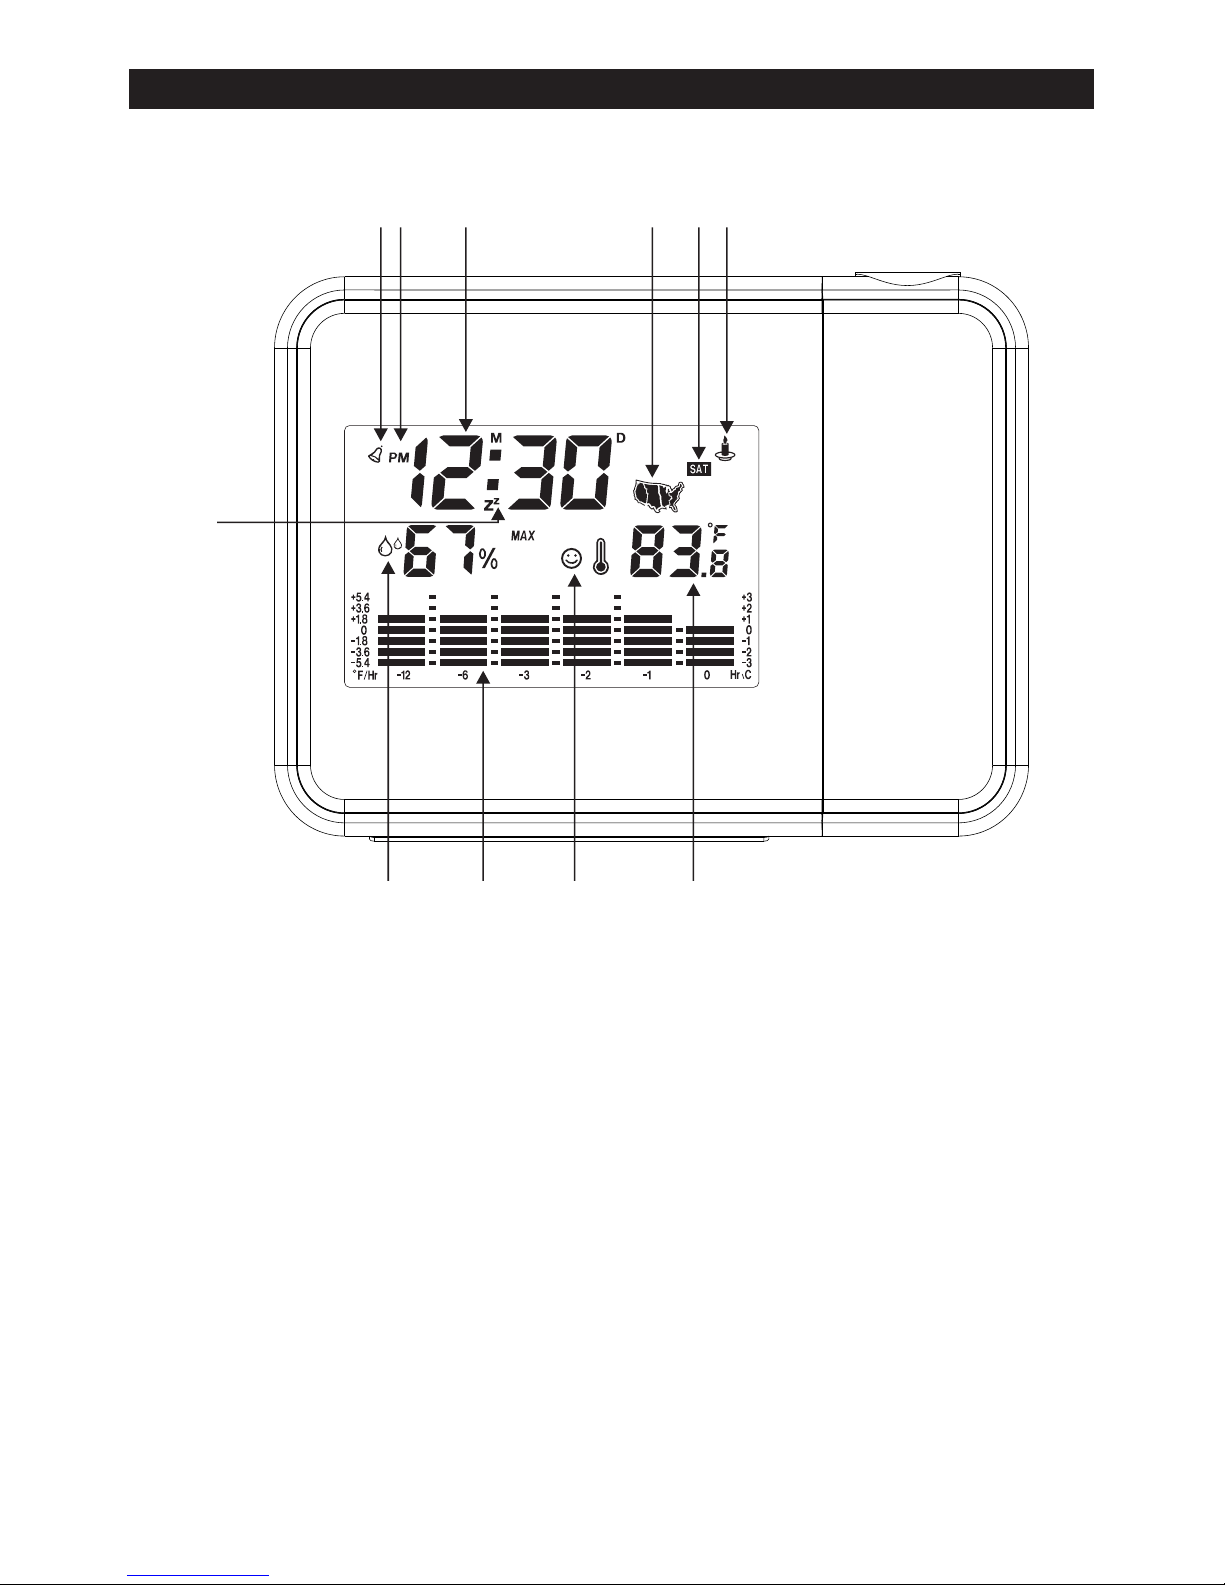
LOCATION OF CONTROLS
-2-
1 2
3
4
5
6
78910
11
1. Alarm ON/OFF Indicator
2. PM Time Indicator
3. Multi-Function Display
4. Time Zone Map
5. Day of the Week Indicator
6. Special Day Reminder
7. Temperature Reading
8. Comfort Level Indicator
9. Past 12 hour Temperature Trend Indicator
10. Humidity Reading
11. Snooze Indicator
Page 4
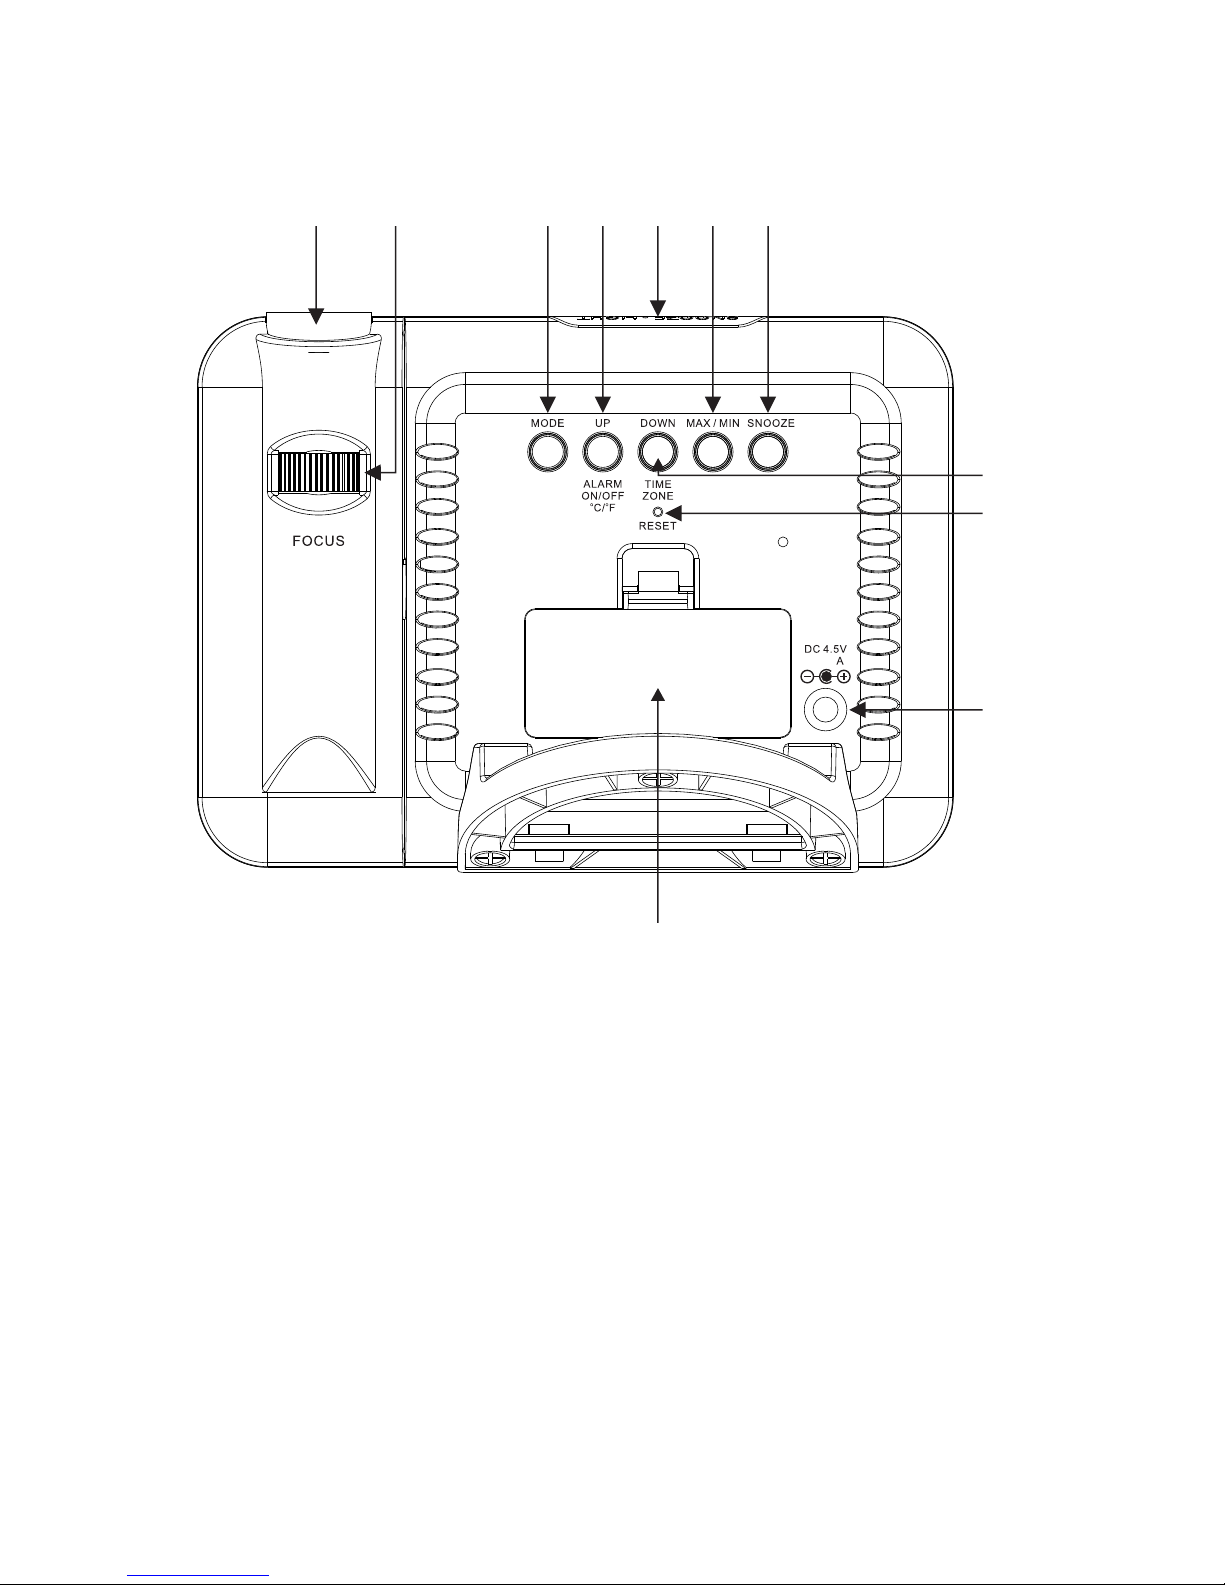
200 m
12
13
14
15 16
17
19
20
21
22
18
12. Projector
13. Projector Focus Adjust Knob
14. MODE Button
15. Adjust UP; ALARM ON/OFF; °C /°F Button
16. SNOOZE/LIGHT Button
17. Maximum/Minimum Temperature/Humidity Button
18. SNOOZE Button
19. Adjust DOWN/TIME ZONE button
20. RESET Button
21. DC-IN Jack
22. Battery Door
-3-
Page 5
P M CE
-4-
!
POWER SOURCE
This unit operates using the includ ed AC-DC Adaptor or on 2 X AAA batteri es (not included)
AC POWER OPER ATION
An AC-DC Adaptor with the outpu t 4.5V DC 200mA (included) is required f or operating the main unit in AC
power mode.
1.) To connect the AC-DC Adaptor to the unit, firmly and securely insert the DC plug of the a daptor into the
DC Jack located on the left hand side of the back of the unit.
2.) Plug the AC-DC Adaptor plug into a hous ehold AC outlet that supplie s 120V AC ~ 60Hz. Connecting this
system to any other power source may cause damage to the system .
NOTE: When the AC-DC adaptor is connec ted to the DC Jack, the batt eries are automatically disconn ected.
BATTERY OPERATION
1. Open the Battery Door on the back of the main unit.
2. Following the polarity (+ and -) dia grams shown inside the battery compartment, insert 2 ‘AAA ' (UM-4)
batteries (not included).
Note: For optimum performance, alkaline-type batter ies are recommended.
3. Replace the Battery Door.
IMPORTANT: Be sure that t he batteries are installed correctly. Wrong polarity may damage the unit.
BATTERY NOTE AND C ARE
- Danger of explosion if the battery is replaced incorrectly. Replace only with the same or equivalent type.
- Do not mix old and new batteries.
- Do not mix alkaline, standard (carb on-zinc) or rechargeable (nickel-cadmium) batteri es.
- If the unit is not to be used for an extended period of time, remove th e battery. Any old or lea king battery
can cause damage to the unit and may void the warranty.
- Do not dispose of batteries in fire, batteries may explode or le ak.
- Do not try to recharge batteries not intended to be recharged ; they can overheat, rupture
and leak(Follow battery manufacturer’s directions).
- Only an adult should replace the batt eries
CLOCK SETTING
When the unit is in clock display mode:
Setting the Time Zon e
The unit default is Pacific time (P). Tap the TIM E ZONE button on the back repeatedly to select another time
zone if necessary. The time zone will change in the following order when you press t he TIME ZONE button.
Pacific Time (P)→Mo untain Time (M)→Central Time ( C )→Eastern Time (E)
12/24 Hour fo rmat
1. The unit default is 12 hour format. Press and hold the MODE bu tton for 3 seconds; 12 hou r format (H 12)
will appear on display and flash.
2. Tap the UP/DOWN butto n to change clock setting display to 24 h our format (H 24) if neces sary.
Setting the C lock
3. Tap the MODE button to co nfirm, the hour digits will flash to prompt for input.
4. Tap the Adjust UP/DOWN b utton repeatedly to set the hour.
Note: Make sure the hour is set so that the P M indicator is display ed correctly.
5. Tap the MODE button aft er the hour is set, the Minute digits flash to prompting for input .
6. Tap the Adjust UP/DOWN b utton repeatedly to set the minute va lue. Press and hold the buttons to speed
up the forward or reverse scanning of the digits.
7. Tap the MODE button aga in to finish clock setting.
Note: If the unit was reset, you need to set the clock again.
CALENDAR SETTING
When the unit is in clock display mode:
1. Tap the MODE button onc e to enter the calendar setting mode. Month and Date digit shows on display.
2. When the Month and Date show on the disp lay, press and hold the M ODE button for 3 seconds, the Year
digits will flash to prompt for input.
3. Tap the Adjust UP/DOWN b utton repeatedly to set the year.
4. Tap the MODE button aft er the year is set, the Month digits flash to prompt for input.
5. Tap the Adjust UP/DOWN b utton repeatedly to set the month.
6. Tap the MODE button aft er the month is set, the Date digits flash to prompt for input.
Page 6

-5-
7. Tap the Adjust UP/DOWN b utton repeatedly to set the date. Press and hold the buttons to s peed up the
forward or reverse scanning of the digits.
8. Tap the MODE button to fin ish the setting. Tap the MODE button 3 times or wait for fe w seconds to exit
calendar setting mode.
ALARM SETTING
Setting the Alar m Time
1. In clock display mode, tap the MODE button twice to enter the Ala rm setting mode, the alarm indicator
and time 12:00 appear on the display.
2. Press and hold the MODE button for 3 seconds, the Hour digits wi ll flash.
3. Tap the Adjust UP/DOWN b utton repeatedly to set the hour valu e. Press and hold the buttons to speed up
the forward or reverse scanning of the digits.
Note: Make sure the hour is set so that the P M indicator is display ed correctly.
4. Tap the MODE button aft er the hour is set, the Minute digits flash to prompt for input.
5. Tap the Adjust UP/DOWN b utton repeatedly to set the minute va lue. Press and hold the button to speed
up the forward or reverse scanning of the digits.
6. Tap the MODE button aft er minute is set, Alarm melody type “00” flashing to prompt for inp ut. There are
total 13 kinds of alarm melody (00-12) available for select ion.
7. Tap the Adjust UP/DOWN b utton repeatedly to select the alar m melody you desired.
8. Tap the MODE button to fin ish the setting. Tap the MODE button twice again or wai t for few seconds to
exit alarm setting mode.
9. Alarm will sound for 2 minutes when set time comes. Tap the MODE bu tton once to turn off the alarm until
next day.
Note: The Display will blink when the a larm is sounding.
Turning the Ala rm ON/OFF
In clock display mode,
- Tap the ALARM ON/OFF button repeatedly in alarm OFF mo de until the alarm icon appears on display
to turn on the alarm.
- Tap the ALARM ON/OFF button repeatedly in alarm ON mod e until the alarm icon disappear from
display to turn off th e alarm.
SNOOZE
- When the alarm sounds, it can be temporarily stopped by pressing the SNOOZE/LIGHT button on top
Z
panel or SNOOZE button on back. Snooze indicator Z appears in display and flashing with Alarm
indicator together.
- The alarm will be delayed for 8 minutes and then come again.
- This manual snooze operation can be repeated again and ag ain while alarm sounding.
SPECIAL DAY REMINDER SETTING
1. In clock display mode, tap the MODE button three times to ente r the special day reminder setting mode.
The Month and Date of re minder indicator will appear in dis play.
Note: Make sure you are in special day setting mode, and not in cal endar mode.
2. Press and hold the MODE button for 3 seconds, the reminder mon th digit flashes. Tap the Adjust UP/
DOWN button repeatedly to set your reminder month.
3. Tap the MODE button to co nfirm, the date digit flash. Tap the Adjust UP/ DOWN button repeatedly to set
your reminder date.
4. Tap the MODE button to co nfirm, the hour digits flash. Tap the Adjust UP/ DOWN butt on repeatedly to set
the hour.
Note: Make sure the hour is set so that the P M indicator is display ed correctly.
5. Tap the MODE button to co nfirm, the minute digits flash. Tap the Adjust UP/ DOWN bu tton repeatedly to
set the minute.
6. Tap the MODE button to fin ish the setting. Special Day remind er indicator will show on the display.
7. The Special Day melody will play for 2 m inutes when set date comes if not interrupted, the reminder
indicator will be flashing on the display.
8. Press any button to stop the melody immediately. It will sound again next year on the s ame day set.
Note: The Snooze has n o effect on the specia l day reminder.
9. To cancel the special day reminder, tap the ALARM ON/OFF repea tedly until the special day reminder
indicator goes off o n the display.
INDOOR TEMPERATURE OPERATION
INDOOR WEATHER MEAS UREMENT
NOTE: 1.) The main uni t display backlight will remain lit w hen using the AC power adaptor.
2.) When using battery power, the backlight will turn off automatically to save ba ttery power. Press
the LIGHT/SNOOZE but ton once, and the backlight will turn on for 7 seconds.
Page 7
Pressing other butto ns on the back panel will not turn on the bac klight.
3.) When a power outage occurs, the unit will switch to battery p ower automatically. The display
backlight will be off, and will only light when you press the LIGHT/SNOOZE button t o check clock
and temperature.
Viewing the Time Z one
In clock display mode, tap the TIME ZONE button repeatedly to view the time in different time zones.
Changing th e Temper ature Displ ay format
In clock display mode, press and hold t he °C /°F button on back pan el of the main unit to change the
temperature display degrees for mat from Celsius (°C) to F ahrenheit (°F) mode.
Indoor Weather Mea surement
The indoor temperature and humidi ty is displayed in the Temperature Window on the main u nit display.
Checking & De leting the Max/Min Temperature Record
1. Tap the MAX/MIN butto n on back panel once to check the maximum temperature and humidity record. Tap
it twice to check the minimum record. Tap it again to exit.
2. Maximum and minimum temperature and humidity records will be deleted automatically at 12: 00 AM
everyday.
Comfortab le level Indicators
The three comfortable weather icons below represent the current comfort levels (Dry, Comfort and Wet) of
the room the SFA2200 is placed in.
1. No matter what the temperature is, when the humidity is unde r 40%, the display will show the DRY icon.
2. When temperature is between 68°F (20°C) and 77°F (25°C), a nd when humidity is between 40% and
70%, the display will show the COMFORT ico n.
3. No matter what the temperature is, when the humidity is high er than 70%, the display will show the WE T
icon.
DRY COMFORT WET
NOTE: When temperature is between 68°F (20°C) and 77°F (25° C), and the humidity is
between 40% and 70%, no icon will be displayed.
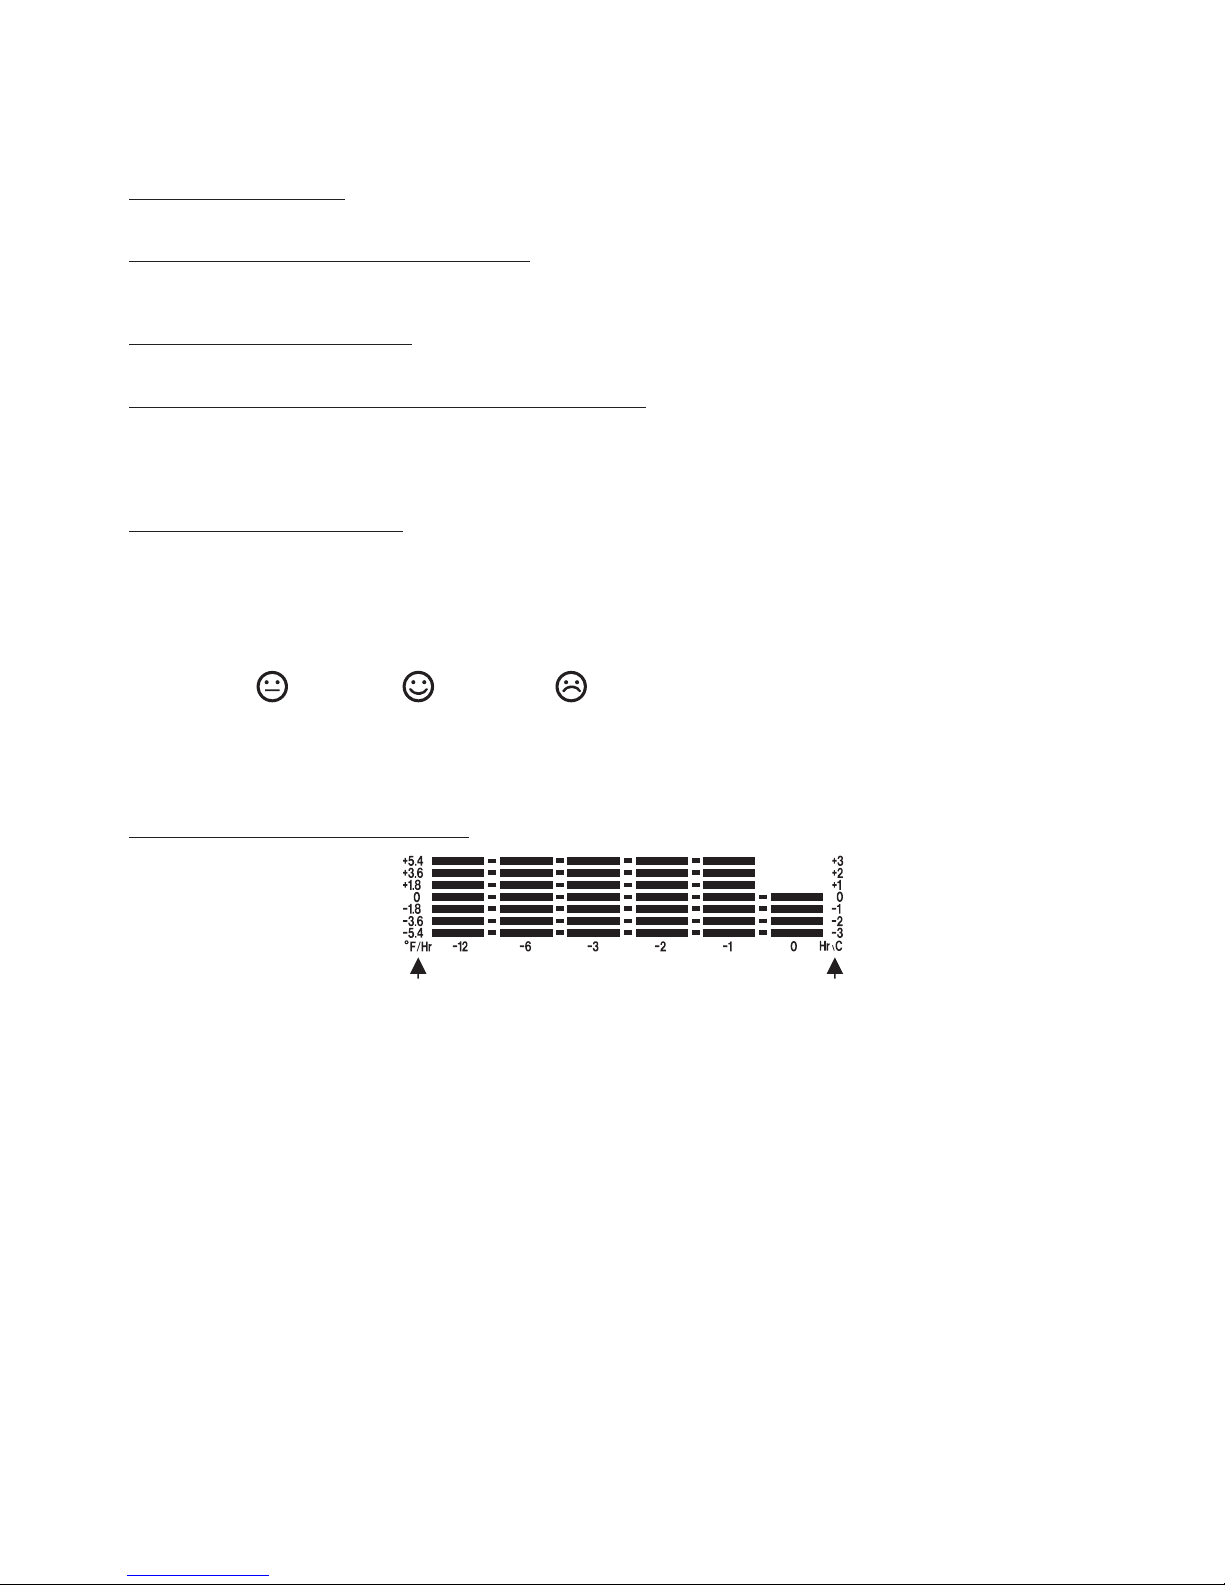
Temperat ure Trend of p ast 12 hours
Dynamic BAR graph trend of indoor tem perature for the past 12 hours
This unit is equipped with a dynamic te mperature trend feature for the past 12 hours. It moves from right to
left to indicate the temperature changes by comparing the p ast hour temperature to the current
temperature. Maximum range is up to +/- 5.4 °F (+/- 3 °C) at past 1, 2, 3 , 6 and 12 hours.
How to read tem perature trend
1. Horizontal scale of 0, -1, -2, -3. -6 & -12 mean current time (0), p ast 1, 2, 3, 6 & 12 hour respectively.
2. Vertical Scale of +/- 5.4, 3.6, 1.8, 0 degree °F (+/- 3, 2, 1, 0 degree ° C) mean temperature changes
compared to current temperature.
3. The unit will detect temperature trends automatica lly and needs at least one hour before it can start
displaying the temperature changes. It’s recommen ded to begin reading the trend after the unit is on and
working for 12 hours or longer.
4. As time passes, the display will show the temperature rising or falling trend by turning the bars ON /OFF
automatically based on past 12 hour temperature readings.
Note: 1.) One lighting bar scale = 1.8 °F (1°C).
2.) If the temperature c hange exceeds +/-3°C, a full BAR grap h or 1 BAR graph will be displayed.
3.) The temperatur e trend is calculated by changes in the temperature and is indi cative only. The
calculation can be affected by many things including where the unit is placed.
4.) The unit is for indo or use only. There are no guarantees for the accuracy when using this unit f or
forecasting outdoor weather conditions.
Degree Fahrenheit/Past hour Degree Celsius/Past hour
-6-
Page 8
RESET
BUTTON
FS
200 m
-7-
USING THE PROJECTOR
Rotate the projector to project the time onto a dark wall or ceil ing within 2.3 – 6.6 feet (0.7 - 2 meters) away
from the projector, the projected time will be displayed on the wall or ceiling in the following form at.
1. The projector sta ys on when the main unit is powered by the AC ad aptor.
2. The projector will be off when the main unit is powered by batteries. Pressing t he SNOOZE/LIGHT
button will momentarily turn on the display back light and th e projection for 7 seconds.
3. Rotate the Projector angle to adju st where the time is projected.
4. Adjust the FOCUS control knob of projector to sharpen the pro jected time.
NOTE: The projecto r can be rotated ±90º.
CARE AND MAINTENANCE
1. Do not subject the unit to excessive force, shock, dust or ext reme temperature.
2. Do not tamper the internal components of the unit.
3. Clean your unit with a damp (never wet ) cloth. Solvent or detergent should never be used.
4. Avoid leaving your unit in direct sunlight or in hot, humid o r dusty places.
5. Keep your unit away from heating app liances and sources of electrical noise such as fluorescen t lamps or
motors.
CAUTION: Never allow any water or other liquids to get inside the unit while cleaning.
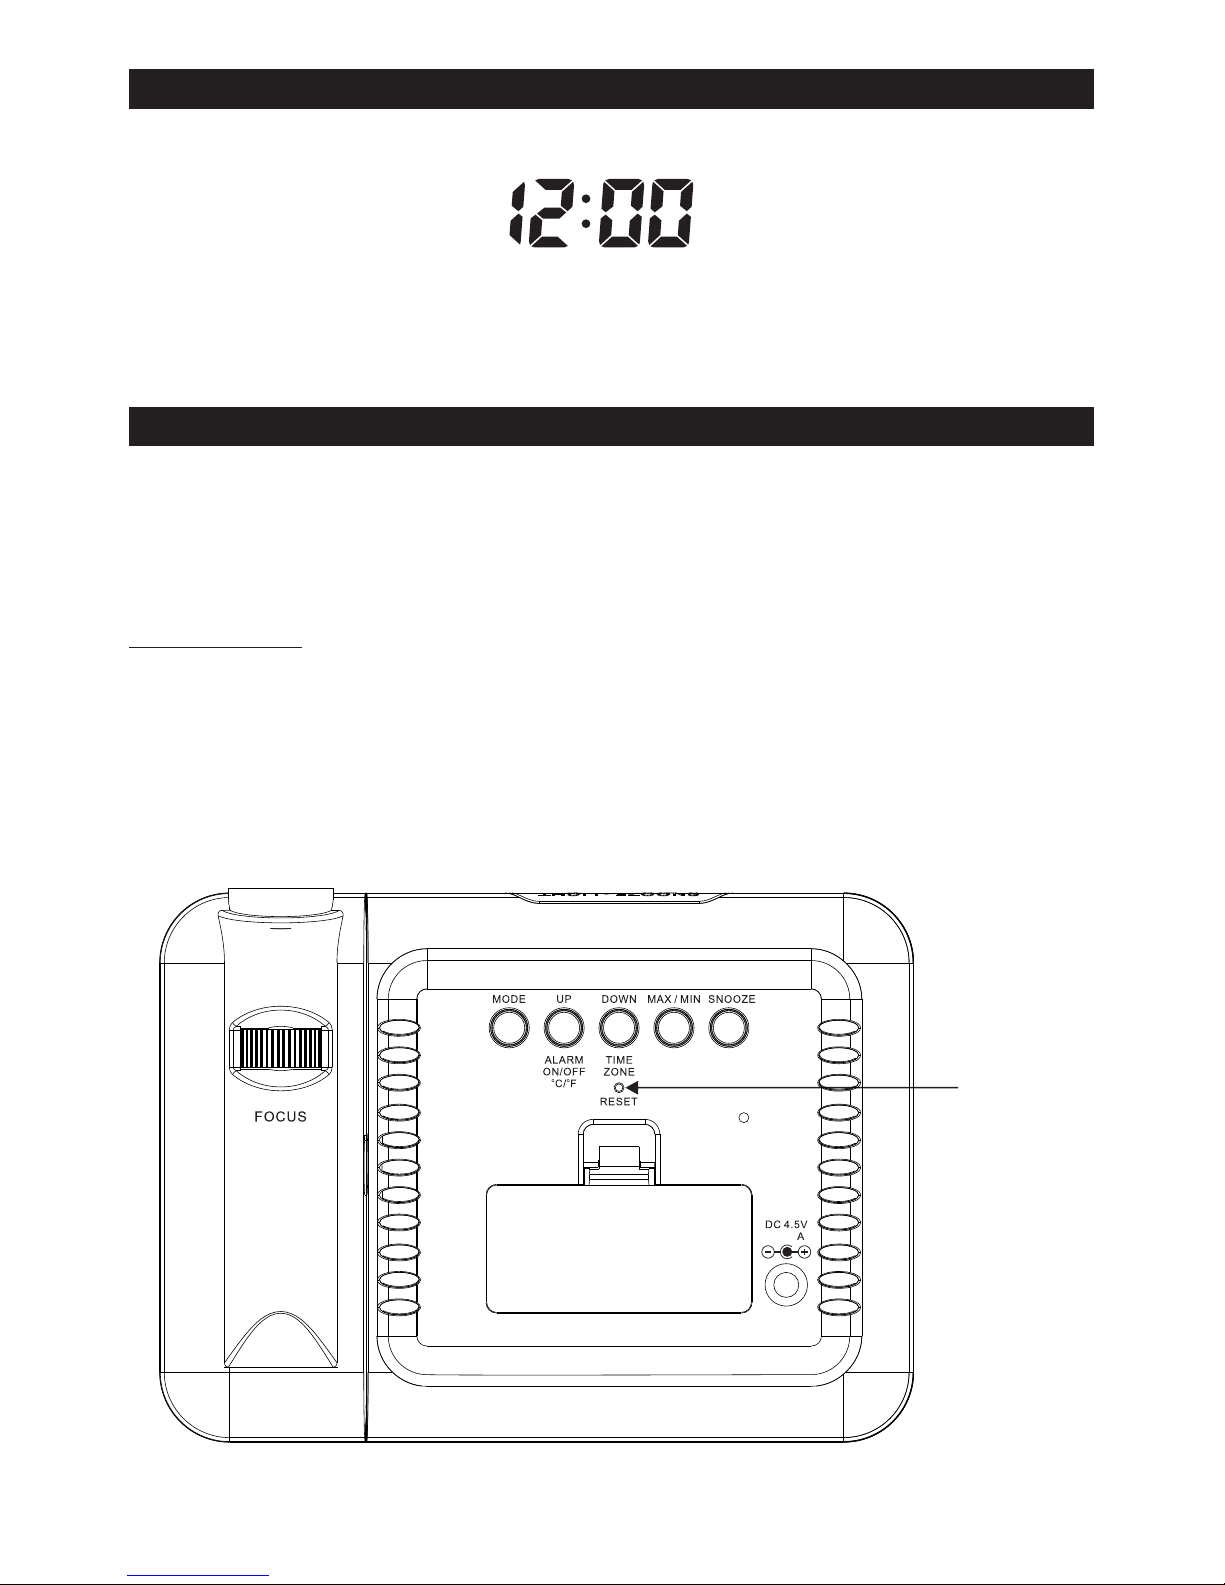
Resetting t he Unit
If the unit experiences a power surge o r electric shock, it is po ssible that the internal
micro-controller may lock up and th e unit will not respond to any commands from the back panel contr ols. In
this event, use a straightened pape r clip, toothpick or similar objects to press the RESET button located on
the back of the unit (see the below figure ). The reset operati on clears the system mem ory and all of your
previous settings will be erased.
CAUTION: DO NOT USE A SHARP OR POINTED OBJECT TO PRESS THE RESET
BUTTON. IT MAY DAMAGE THE RESET SWITCH INSIDE THE U NIT.
Page 9
-8-
TROUBLESHOOTING GUIDE
If you experience problems using th is unit, please check the following or call 1-800-777-533 1 for Customer
Service.
SPECIFICATION
Power requi rement:
DC Input: 2 X AAA (UM-4) Batteries or
DC 4.5V, 200mA
Range
o o
Temperature 32 - 122 F (0-5 0 C)
Humidity 20% - 95%
©2014 BRK Brands Inc. All rights reserved. First Alert® is a regi stered trademark of the First Alert Trust.
At Spectra , environmental and social respon sibility is a core value of our
business. We are dedicated to continuous implementation of res ponsible
initiatives with an aim to conserve and mainta in the
environment through responsible recycl ing.
Please visit us at http://www.spectr aintl.com /green. htm for more information on Spectra’s green
initiatives or to find a recycler in your area.
Symptom
The unit does not
respond (no power).
Possible Ca use
Solution
No batteries installed or install ed
batteries are exhausted.
AC power source no function or
DC cable is not plugged into the
DC jack on the back of the unit.
Wall outlet is not functioning.
Install 2 x “AAA” batteries or replace
the exhausted batteries.
Plug the AC adaptor into a wall outlet.
Plug another device into the same
outlet to confirm the outlet is working.
Page 10

1 YEAR LIMITED WARRANTY AND SERVICE
VALID IN THE U.S.A ONLY
This product is manufactured, distributed or sold by SPEC TRA MERCHANDISING INTERNATIONAL, INC.,
official licensee for this product. All right, title and i nterest to use the “Firs t Alert” logo trademarks and the
“First Alert” trade dress are exclusively licensed by BRK Br ands, Inc. and are used under license f rom BRK
Brands, Inc.. Please contact SPECTRA’s Service Department for questions/comments, warran ty, support,
or service related to this product.
SPECTRA MERCHANDISING IN TERNATIONAL, INC. warrants that this prod uct 1) is free from defects in
materials and workmanship and 2) co nforms to its specifications for a period of 1 year from the date of
original customer purchase and pr ovided the product is utilized within the U.S.A. This warranty is not
assignable or transferable. Our obligation under this warranty is the repair or replacemen t of the defective
unit or any part thereof, except batteries, when it is return ed to the SPECTRA Service Department,
accompanied by proof of the date of ori ginal consumer purchase, such as a duplicated copy of a sales
receipt.
You must pay all ship ping charges required to ship the product to SPECTRA for warra nty service. If the
product is repaired or replaced und er warranty, the retu rn charges will be at SPECTRA’s expense. There
are no other express warranties oth er than those stated herein.
This warranty is valid only in accord ance with the conditions set forth below:
1. The warranty applies to the SPECTRA product onl y while:
a. It remains in the possession of the original purchaser and proof of purchase is demonstrated
b. It has not been subjected to accident, misuse, abuse, impr oper service, usage outside the des criptions
and warnings covered within the own er ’s manual or non-SPECTRA approved mo difications
c. Claims are made within the warrant y period
2. This warranty doe s not cover damage or equipment failu re caused by electrical wiring not
in compliance with electrical codes or SPECTRA owner’s manual specificat ions, or failure to
provide reasonable care and neces sary maintenance as outlined in the owner ’s manual.
3. Warranty of all SPECTRA products appli es to residential use only and is void wh en products are used in a
nonresidential environment or i nstalled outside the United States.
This warranty gives you specific leg al rights, and you may also have other rights which vary from sta te to
state. TO OBTAIN SERVI CE please remove all batteries (if any) and pack the unit caref ully and send it
prepaid by insured parcel post or UPS t o SPECTRA at the address shown below. IF THE UNIT IS
RETURNED WITHIN TH E WARRANTY PERIOD shown above, please include a proof of purchase (dated
cash register receipt) so that we may establish your eligibility for warranty service and repa ir of the unit
without cost. Also include a note with a d escription explaining how the unit is defective. A customer s ervice
representative may need to contac t you regarding the status of your repair, so include your name, a ddress,
phone number and e-mail address to sp eed the process.
IF THE UNIT IS OUTSIDE THE WARRANTY PERIOD, please include a chec k for $8.00 to cover the cost of
repair, handling and return postag e. All out of warranty returns must be sent prepaid.
It is recommended that you contact SPECTRA first at 1-800-777-5331 or by e-mail at
[email protected] for updated informatio n on the unit requiring service. In som e cases the model
you have may be discontinued and SPEC TRA reserves the right to offer alternative options for repair or
replacement.
SPECTRA MERCHANDISING IN TERNATIONAL, INC.
4230 North Normandy Avenue,
Chicago, IL60634, USA.
1-800-777-5331
To register your product, visit the link below on the website to enter your information.
http://www.spectraintl.com/wform.htm
0614 Printed in China
-9-
 Loading...