

Page 1

User Guide
Version 6.0
Page 2

Copyright © 2002–2010 by Fidelis Security Systems, Inc.
All rights reserved worldwide.
Fidelis XPS™, version 6.0
User Guide, version 6.0
Revised March 2010
Users are granted permission to copy and/or distribute this document in its original electronic form and print
copies for personal use. This document cannot be modified or converted to any other electronic or
machine-readable form in whole or in part without prior written approval of Fidelis Security Systems, Inc.
While we have done our best to ensure that the material found in this document is accurate, Fidelis
Security Systems, Inc. makes no guarantee that the information contained herein is error free.
Fidelis XPS includes GeoLite data created by MaxMind, available from http://www.maxmind.com/
Fidelis Security Systems
4416 East West Highway, Suite 310
Bethesda, MD 20814
.
Page 3

Table of Contents
Preface............................................................................................................................................. 1
Intended Audience....................................................................................................................... 1
Technical Support........................................................................................................................ 2
Available Guides.......................................................................................................................... 2
Fidelis XPS™ Overview.................................................................................................................. 3
Fidelis XPS Modules.................................................................................................................... 3
CommandPost ........................................................................................................................ 4
Direct....................................................................................................................................... 4
Internal.................................................................................................................................... 4
Proxy....................................................................................................................................... 4
Mail.......................................................................................................................................... 5
Web Walker............................................................................................................................. 5
Connect................................................................................................................................... 5
Fidelis XPS Policies..................................................................................................................... 5
Prebuilt Policies....................................................................................................................... 5
Custom Policies ...................................................................................................................... 6
Chapter 1 Getting Started.............................................................................................................. 7
Access CommandPost................................................................................................................. 7
Change your Account .................................................................................................................. 7
Access the Guides....................................................................................................................... 8
Lock Icon ..................................................................................................................................... 8
CommandPost Navigation........................................................................................................... 8
System Status.............................................................................................................................. 8
Logout.........................................................................................................................................10
Using Non-ASCII Characters in Fidelis XPS...............................................................................10
Chapter 2 The Dashboard.............................................................................................................11
The Radar Page .........................................................................................................................11
What is an event? ..................................................................................................................11
What is an alert? ....................................................................................................................11
What is alert radar?................................................................................................................11
Uses of Alert Radar................................................................................................................12
Current Status Frame.............................................................................................................13
Information Flow Map™ Page ....................................................................................................14
The Information Flow Map......................................................................................................15
Controls in the Left Panel.......................................................................................................17
Fidelis XPS User Guide Version 6.0 Table of Contents iii
Page 4

Filtering and Sorting Criteria...................................................................................................19
Chapter 3 Understand and Manage Alert Workflows .................................................................22
Access to Alerts and Quarantined E-Mails..................................................................................22
Handle Alerts..............................................................................................................................22
The Alert Workflow Log...............................................................................................................23
Manage a Single Alert.................................................................................................................23
Change Status .......................................................................................................................23
Change Alert Group ...............................................................................................................24
Manage Multiple Alerts ...............................................................................................................24
Chapter 4 Understand and Manage Alerts ..................................................................................25
Alert Report.................................................................................................................................26
Alert Quick Summary .............................................................................................................26
Filter Alerts.............................................................................................................................27
Navigate Alert Pages..................................................................................................................27
Alert Actions................................................................................................................................28
Alert Labels............................................................................................................................28
Export Alerts to Excel.............................................................................................................28
Purge Alerts ...........................................................................................................................29
Alert Report Page Controls.........................................................................................................29
System Reports for Alerts ......................................................................................................30
Search for Alerts ....................................................................................................................30
Duration..................................................................................................................................35
Include or Exclude Incoming Alerts........................................................................................35
Customize Alert Report...............................................................................................................36
Group.....................................................................................................................................36
Group Details.........................................................................................................................38
Create PDF Reports for Alerts....................................................................................................38
Trending......................................................................................................................................39
Alert Details ................................................................................................................................41
Alert Highlighting....................................................................................................................43
Scroll through Alert Details.....................................................................................................44
Download Text File.................................................................................................................44
Find Similar Alerts..................................................................................................................44
Manage Label ........................................................................................................................45
Purge this Alert.......................................................................................................................45
Alert Compression..................................................................................................................45
Decoding Path and Channel Attributes ..................................................................................45
Forensic Data.........................................................................................................................47
Recorded TCP Session..........................................................................................................47
Tune Rules from an Alert............................................................................................................49
Fidelis XPS User Guide Version 6.0 Table of Contents iv
Page 5

Chapter 5 Understand and Manage Quarantined E-Mails..........................................................52
Understand Fidelis XPS Mail Quarantine....................................................................................52
The Quarantine Report...............................................................................................................53
Take Actions on Quarantined E-Mails.........................................................................................54
Deliver or Discard Quarantined E-Mail........................................................................................54
Search Quarantined E-Mails.......................................................................................................54
Search Quarantined E-Mails using Duration...............................................................................56
Advanced Search for Quarantined E-Mails.................................................................................57
Quarantine Details......................................................................................................................58
Chapter 6 Manage Reports ...........................................................................................................59
Create Custom Reports..............................................................................................................60
Search ....................................................................................................................................60
Filters .....................................................................................................................................62
Duration..................................................................................................................................63
Columns.................................................................................................................................64
Group By................................................................................................................................66
Custom Report Controls.........................................................................................................66
Run Custom Reports ..................................................................................................................67
Edit Custom Reports...................................................................................................................67
Copy Custom Reports.................................................................................................................67
Save and Schedule Reports.......................................................................................................68
Save.......................................................................................................................................68
Save and Schedule................................................................................................................68
Delete Reports............................................................................................................................69
Chapter 7 Create and Use Quick Reports....................................................................................70
Define Quick Reports..................................................................................................................70
Create Quick Reports .................................................................................................................73
Create PDFs for Quick Reports..................................................................................................74
Schedule Quick Reports.............................................................................................................74
Chapter 8 Network Reports ..........................................................................................................75
TCP Resets ................................................................................................................................77
Application Protocols ..................................................................................................................78
IP Defragmenter .........................................................................................................................79
Inline Module ..............................................................................................................................80
Network Statistics .......................................................................................................................81
TCP Processor ...........................................................................................................................82
Proxy...........................................................................................................................................83
Mail.............................................................................................................................................84
Connect ......................................................................................................................................85
Web Walker................................................................................................................................85
Fidelis XPS User Guide Version 6.0 Table of Contents v
Page 6

Chapter 9 Manage Users, Roles, and Groups.............................................................................86
Access Control in CommandPost...............................................................................................87
Small Security Teams.................................................................................................................88
Define User Profiles....................................................................................................................88
Add or Edit a Local User.............................................................................................................89
Delete a User..............................................................................................................................91
Define Alert Management Groups ..............................................................................................92
Add or Edit an Alert Management Group ...............................................................................92
Delete an Alert Management Group.......................................................................................93
Define User Roles.......................................................................................................................93
Access Roles .........................................................................................................................94
Add or Edit a Custom Role.....................................................................................................95
Delete a Custom Role............................................................................................................96
Chapter 10 Configure Fidelis XPS Components.........................................................................97
The Component Page.................................................................................................................97
Component Information ..............................................................................................................97
Status Lights ..........................................................................................................................97
Details....................................................................................................................................97
License Messages..................................................................................................................98
Component Buttons................................................................................................................98
Add a Sensor..............................................................................................................................99
Edit a Sensor..............................................................................................................................99
License ...................................................................................................................................99
Expiration.............................................................................................................................100
System Monitor....................................................................................................................100
Logs .....................................................................................................................................102
Configure CommandPost..........................................................................................................103
User Authentication..............................................................................................................103
Email Configuration..............................................................................................................107
User Notification...................................................................................................................108
LDAP Configuration..............................................................................................................109
LDAP Reports ......................................................................................................................111
Alert Storage ........................................................................................................................112
CommandPost Language Configuration ..............................................................................113
Diagnostics...........................................................................................................................114
Archive.................................................................................................................................115
Configure Sensors....................................................................................................................116
Sensor Run Time Information ..............................................................................................116
Sensor Config Page.............................................................................................................116
Direct and Internal................................................................................................................117
Fidelis XPS User Guide Version 6.0 Table of Contents vi
Page 7

Proxy....................................................................................................................................122
Mail.......................................................................................................................................123
Web Walker..........................................................................................................................125
Connect................................................................................................................................127
EMail Relayhost ...................................................................................................................129
Sensor Language Configuration...........................................................................................129
Chapter 11 Version Control ........................................................................................................131
Fidelis Release Naming Conventions.......................................................................................131
Update Fidelis XPS...................................................................................................................132
Prepare to Update................................................................................................................132
Run Update..........................................................................................................................132
Update Progress..................................................................................................................133
Schedule Update ......................................................................................................................134
Cancel Scheduled Jobs............................................................................................................135
Chapter 12 Configure Exports....................................................................................................136
Export Methods.........................................................................................................................136
Fidelis Archive......................................................................................................................136
EMail and Syslog .................................................................................................................136
SNMP Trap and ArcSight.....................................................................................................138
Verdasys Digital Guardian....................................................................................................138
IBM SiteProtector.................................................................................................................138
Define Exports..........................................................................................................................139
Available Export Buttons......................................................................................................140
Testing Export Communication ............................................................................................140
Delete Exports ..........................................................................................................................140
Chapter 13 Audit..........................................................................................................................141
Access Audit.............................................................................................................................141
Search for Audit Entries............................................................................................................142
Search Terms.......................................................................................................................142
Notes about Search Options................................................................................................143
Time Periods........................................................................................................................143
Chapter 14 Backup and Restore.................................................................................................144
Accessing the Command Line Interface ...................................................................................144
Backup and Restore CommandPost.........................................................................................144
Backup CommandPost.........................................................................................................144
Restore CommandPost........................................................................................................145
Backup and Restore a Sensor..................................................................................................146
Chapter 15 Archive......................................................................................................................147
Export Archive Data .............................................................................................................147
Import Archive Data..............................................................................................................147
Fidelis XPS User Guide Version 6.0 Table of Contents vii
Page 8

Index.............................................................................................................................................149
List of Tables
Table 1. Critical conditions................................................................................................................ 9
Table 2. High severity conditions...................................................................................................... 9
Table 3. Controls .............................................................................................................................16
Table 4. Filter Lists ..........................................................................................................................20
Table 5. Actions list options.............................................................................................................24
Table 6. System Reports.................................................................................................................30
Table 7. Alert search fields..............................................................................................................32
Table 8. Sections in Alert Details.....................................................................................................42
Table 9. Decoding paths..................................................................................................................46
Table 10. Quarantined E-mail: search fields....................................................................................55
Table 11. Quarantined E-mail: advanced search fields ...................................................................57
Table 12. Search Fields...................................................................................................................60
Table 13. Filters...............................................................................................................................62
Table 14. System report columns....................................................................................................64
Table 15. Quick reports ...................................................................................................................71
Table 16. Determine user access....................................................................................................90
Table 17. User access levels...........................................................................................................94
Table 18. General parameters.......................................................................................................119
Table 19. Advanced parameters....................................................................................................120
Table 20. Proxy parameters ..........................................................................................................122
Table 21. Mail parameters.............................................................................................................124
Table 22. Web Walker parameters................................................................................................125
Table 23. Connect: General parameters........................................................................................127
Table 24. Alert Export keywords....................................................................................................137
Table 25. Audit Log columns .........................................................................................................142
Fidelis XPS User Guide Version 6.0 Table of Contents viii
Page 9

Preface
This guide describes how to use the Fidelis XPS™CommandPost™ console to monitor and
manage security alerts, to configure sensors, and to create and maintain CommandPost users
This guide contains the following chapters:
The Overview
moudules. This section also briefly describes prebuilt and custom policies.
Chapter 1 Getting Started
information, and access more information.
Chapter 2 describes the and how to use alert radar
Chapter 3 describes how to manage alert workflows
Chapter 4 describes the alert report and how to use alert features
Chapter 5 describes the quarantine management
Chapter 6 describes how to manage Custom Reports
Chapter 7 describes how to create and use Quick Reports
Chapter 8 describes how to use network reports
Chapter 9 describes how to create and modify user information.
Chapter 10 describes how to configure CommandPost
Chapter 11 descries how to update and manage Fidelis XPS versions.
Chapter 12 describes how to configure exports
Chapter 13 describes the Audit
Chapter 14 describes how to backup and restore
Chapter 15 describes how to Archive
describes Fidelis XPS: the CommandPost Management Console and other
describes how to access and navigate CommandPost, change account
and Information Flow Map.
.
.
list and how to manage quarantined e-mails.
.
.
.
and Fidelis XPS sensors.
.
feature and how to run it from the CommandPost GUI.
CommandPost and sensors.
alert and session data on the CommandPost.
Intended Audience
This information is intended for network system administrators familiar with networking, computer
security, and with the security requirements and practices of their enterprises. This help system
and related guides are intended for users that fit into at least one of the following major categories:
• The alert and quarantine managers are frequent users of the system, likely to visit the
CommandPost GUI several times each day. Both roles are usually filled by system
administrators responsible for reviewing alerts (or quarantined e-mails) and managin g any
action required within the enterprise. Alert and quarantine management require high level
data analysis and the ability to delve into the details of any single violation.
• The network IT manager will be the first to touch the CommandPost, but is expected to rarely
use Fidelis XPS after initial installation. The IT manager might need to adjust sensor network
settings and CommandPost to sensor communications, manage CommandPost users and
their credentials, and monitor network statistics to verify connectivity.
Fidelis XPS User Guide Version 6.0 Preface 1
Page 10

Technical Support
For all technical support related to this product, check with your site administrator to determine
support contract details. Contact your reseller or if you have a direct support contract, contact the
Fidelis Security support team at:
Phone: +1 301.652.7190*
Toll-free in the US: 1.800.652.4020*
*Use the customer support option.
E-mail: support@fidelissecurity.com
Web: https://portal.fidelissecurity.com
Available Guides
The following guides are available:
The Guide to Creating Policies describes how to define policies and the rule s and fingerprints that
policies contain.
The Guide to Prebuilt Policies describes policies that ship with Fidelis XPS and the rules and
fingerprints that these policies contain. This guide also indicates which rules and fingerprints might
need to be configured for your enterprise.
The Enterprise Setup and Configuration Guide describes how to set up and configure Fidelis XPS
hardware.
Release Notes are updated with each release to provide information about new features, major
changes, and bugs corrected.
Fidelis XPS User Guide Version 6.0 Preface 2
Page 11
Fidelis XPS™ Overview
Since 2002, organizations have chosen the Fidelis Extrusion Prevention System®, Fidelis XPS™,
to solve their biggest data leakage challenges—safeguarding intellectual propert y and identity
information, complying with government and industry privacy regulations, a nd enabling visibility and
control of their networks. Built on a patented deep session inspection™ platform, Fidelis XPS is the
industry's only next-generation data leakage prevention sol ution with the power to deliver
comprehensive prevention over all 65,535 ports and all channels, complete visibi lity and control,
and the lowest total cost-of-ownership to stop network data leakage on gigabit-speed networks.
Simply deployed as a context-aware network appliance, Fidelis XPS gives global enterprises
unequalled accuracy, security, and performance.
Enterprises use Fidelis XPS to protect against leakage of sensitive information and to enforce
corporate network usage policies. Sensitive information examples include trade secrets, budgets,
contracts, merger and acquisition activity, consumer information, research, and many other forms.
Enforcement of network usage policies includes usage of corporate resources for personal
activities, proper handling of sensitive data, and proper usage of network security measures in
place for web proxies, e-mail gateways, and more.
The Fidelis Extrusion Prevention System product family includes multiple Fidelis XPS sensors—
each designed to address the most demanding network environments—and the CommandPost™
management console. Refer to Fidelis XPS Modules
DLP or extrusion prevention is also done through the use of policies that map Fidelis XPS
technology to laws and regulations so that business infrastructure requirements are met. Refer to
Fidelis XPS Policies.
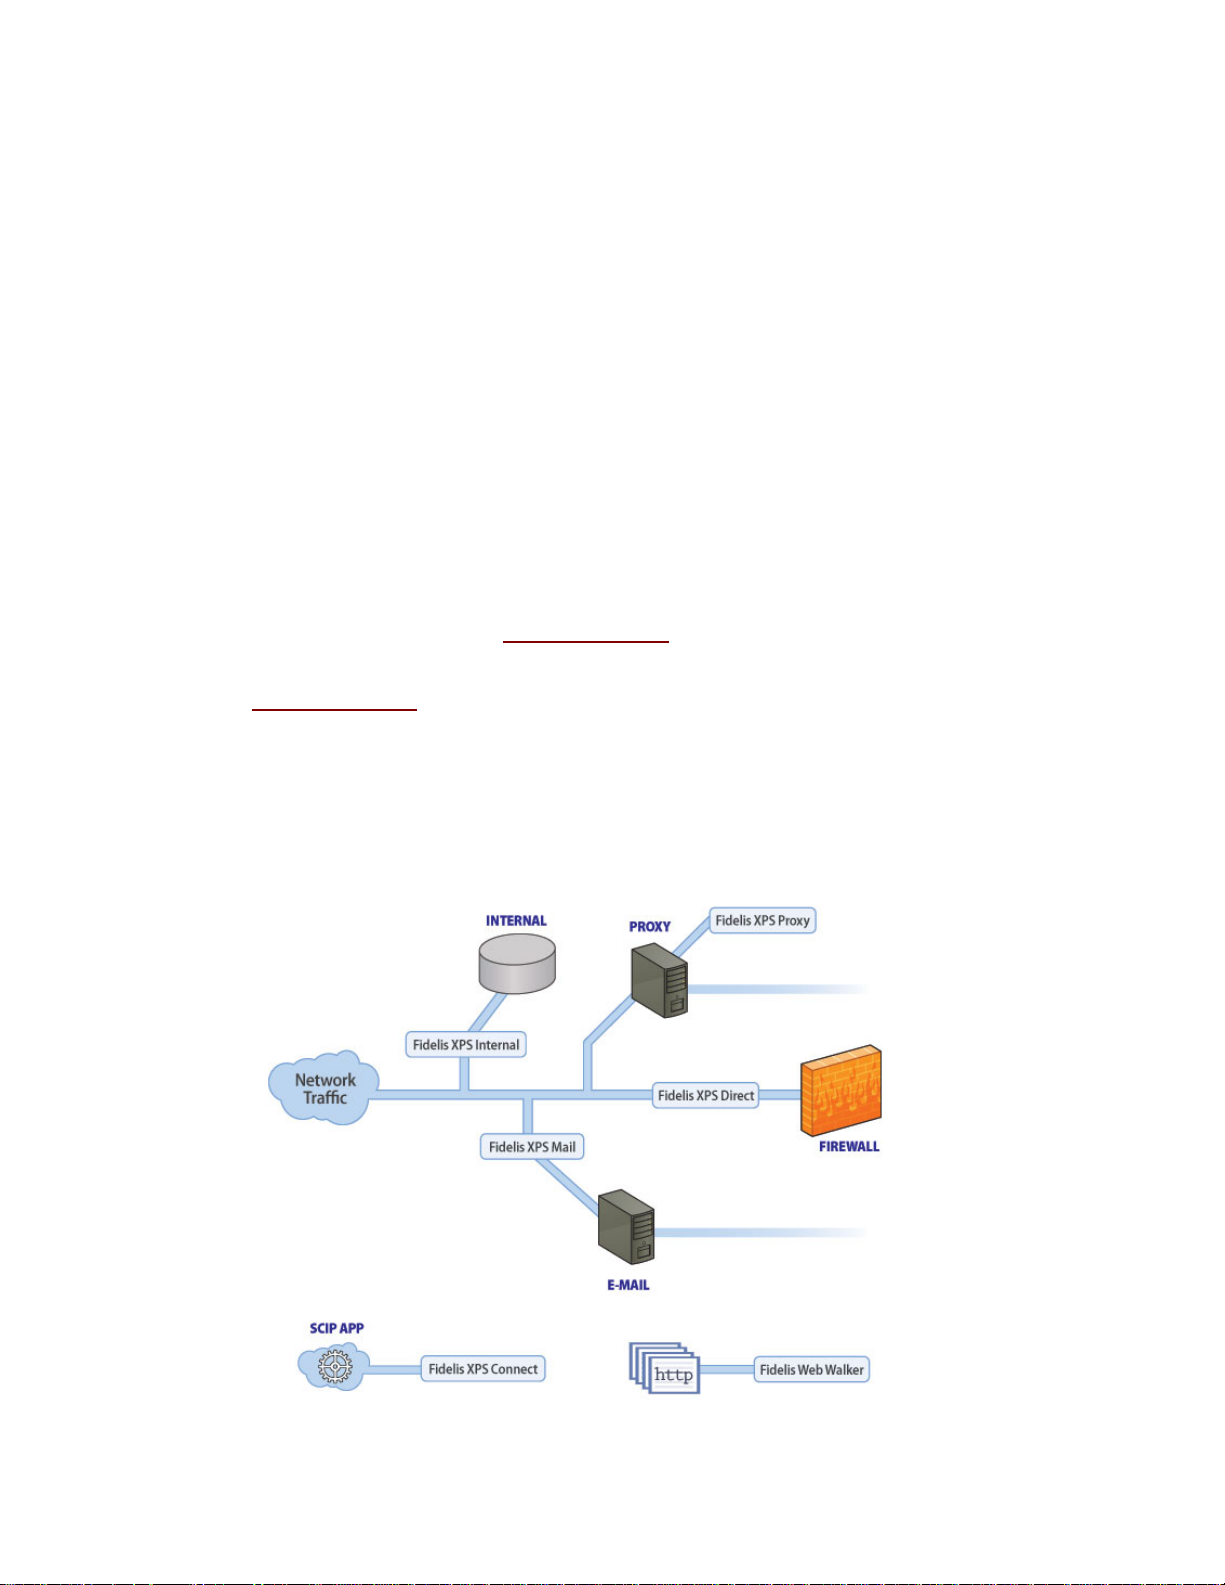
Fidelis XPS Modules
Fidelis XPS modules and the appliances on which they reside include several types of sensors
placed within your network and a management console. The sensors can be depl oyed to specific
areas of the network to provide control and visibility as needed. This section describes how an
enterprise might deploy Fidelis XPS modules and provides an overvie w of all av ailable sensors and
the CommandPost console.
.
Figure 1. Fidelis XPS Modules
Fidelis XPS User Guide Version 6.0 Overview 3
Page 12

CommandPost
The CommandPost module is the management console and offers web-based enterprise
administration and strong third-party product integration. CommandPost collects, aggregates, and
stores data from multiple sensors.
You can access the web-based, CommandPost GUI from anywhere on your network to:
• Visually monitor and analyze network alerts and other data in real time.
• Enable, disable, or customize policies and rules as required.
• Add, configure, and manage sensors and the console itself.
• Create CommandPost users using the granular access control capabilities in several user
authentication mechanisms including integration with a user director y server.
• Export information to a third party network alert aggregation system.
• Use the built-in reports or customize reports to your requirements. Reports can be scheduled
for automatic delivery or run in real time with click-through drill down capabilit y.
For information about setting up CommandPost, refer to chapters 2 and 4 in the Enterprise Setup
and Configuration Guide. To get started using CommandPost, refer to Getting Started
information about CommandPost's configuration features, refer to Configure CommandPost
. For more
.
Direct
The Direct module is used to monitor direct-to-Internet traffic and provides prevention on all ports
and all application protocols. Products with the Direct module are typically deployed at the network
perimeter, inline or out-of-band to monitor applications and protocols at multi-gigabit speed.
Fidelis offers products with the Direct module ranging from 25 Mb/s to 2.5Gb/s.
For more details, refer to Direct and Internal
Direct, refer to chapter 5 in the Enterprise Setup and Configuration Guide.
. For information about setting up and configuring
Internal
The Internal module addresses internal traffic to ensure protection for your enterprise's databases,
file shares, and user directories. Products with Internal capability are typically deployed in the
network core to provide visibility and control of information leaving data centers or transmitted
between divisions. The Internal provides prevention on all ports and all pro tocols.
Fidelis XPS offers products with Internal modules ranging from 25 Mb/s to 2.5 Gb/s.
For more details, refer to Direct and Internal.
sensor, refer to chapter 5 in the Enterprise Setup and Configuration Guide.
For information about setting up and configuring this
Proxy
The Proxy module offers an interface to a third party HTTP proxy using the Internet Content
Adaptation Protocol (ICAP). ICAP is a lightweight and extensible point-to-point protocol used for
requesting services for content inspection.
The Proxy module offers the following advantages for HTTP traffic:
• Prevention can be accomplished by redirecting the user to a customizable web page that
states their violation and other applicable information.
• When combined with an ICAP-enabled SSL proxy, the Proxy module can access unencry pted
data destined to secure web sites.
Refer to Proxy
the Enterprise Setup and Configuration Guide.
. For information about setting up and configuring this sensor, refer to chapter 6 in
Fidelis XPS User Guide Version 6.0 Overview 4
Page 13

The Mail module provides graceful control of your enterprise's e-mail traffic. The Mail module
supports monitoring and prevention similar to the Direct module, but also offers the ability to
quarantine and to redirect messages to secure e-mail gateways. You can deploy product s with the
Mail module in an SMTP path in MTA mode or with a Milter-enabled e-mail gateway.
For more details, refer to Mail
chapter 7 in the Enterprise Setup and Configuration Guide.
. For information about setting up and configuring this sensor, refer to
Web Walker
The Web Walker module is used to scan all content on one or more internal web sites and analyze
the data against your extrusion policies. Deploying products with the Web Walker mod ule in your
environment will notify you if sensitive material is available on your web site.
For more details, refer to Web Walker
refer to chapter 8 in the Enterprise Setup and Configuration Guide.
Connect
The Connect module provides content inspection services to any application that provid es a Simple
Content Inspection Protocol (SCIP) interface. SCIP is a TCP-based, client-server communication
protocol that provides the ability to submit information for content analysis and retrieve results.
For more details, refer to Connect
refer to chapter 9 in the Enterprise Setup and Configuration Guide.
Fidelis XPS Policies
A policy is a set of rules that guide business practices within an enterprise. Some examples include
determining acceptable use of network resources, preventing transmission of sensitive information,
and ensuring compliance with privacy laws.
Fidelis XPS provides policy-based enforcement that maps rules to your ent erprise' s content
disclosure or network use policies.
. For information about setting up and configuring this sensor,
. For information about setting up and configuring this sensor,
Prebuilt Policies
Fidelis XPS ships with multiple policies that are grouped into one of the following categories:
• Compliance.
• Protection of digital assets and sensitive information.
• Managing insider use of the Internet.
All prebuilt policies will require some level of configuration, as described in the Guide to Prebuilt
Policies.
Compliance
Fidelis XPS can be used to enforce policies to comply with federal and state privacy laws and
industrial security standards. Such laws and standards include HIPAA, GLBA, PCI and many
others. The following policies use rules that can prevent inappropriate transmission of this
information:
• Identity Leakage
• HIPAA
• PCI
• Financial Information
Fidelis XPS User Guide Version 6.0 Overview 5
Page 14

Protection of Digital Assets and Sensitive Information
Fidelis XPS can be used to enforce policies pertaining to corporate sensitive information. These
policies are:
• Digital Asset Protection (DAP) provides the capability to detect and prevent sensitive
materials being leaked through the network.
• U.S. Federal Government provides enforcement of Department of Defense Directive 5200.1
Managing Insider Use of the Internet
Fidelis XPS can be used to enforce corporate policy pertaining to the acceptabl e use of Internet
resources. The policies in this category are:
• Application Management (AM) allows enforcement of unauthorized applications, such as
peer-to-peer file sharing, instant messenger, access to web-based e-mail systems, and many
others.
• Unauthorized Traffic (UT) is the detection and prevention of users who circumvent corporate
security measures by using unauthorized proxies, defeating firewall rules, and using
unauthorized encryption methods
• Inappropriate Content enforces policies regarding offensive material or langu age on the
corporate network.
In addition, the File Transfer Management policy can apply to each major category. Usi ng this
policy and customizing it appropriately enables you to manage the types of files transferred over
the network.
For more detailed information about each policy, refer to the Guide to Prebuilt Policies.
Custom Policies
In addition to the prebuilt policies, it is possible to use the rich policy creation engi ne to define any
network security policy required within your enterprise. Policies are a collection of rules, which are
based on some definition of network traffic. The definition can be one or more of the following
methods of identifying network traffic:
• Content refers to the textual content of an e-mail message, an IM chat, a file, or any other
container of information. Fidelis XPS offers eleven methods to describe sensitive information,
which include methods to register and methods to profile the information. Registration refers
to the process of locating the sensitive information in its original format, sending it to
CommandPost, and registering the content. Profiling refers to methods to describe sensitive
information without the need to locate it.
• Location refers to the sender or the recipient of the information.
• Channel refers to all other aspects of network communication including the application
protocol, attributes (such as URL, FTP user name, and social networking application modes
of operation), the time of day and day of the week, the length of the communication, and
many other parameters.
Using the combination of configured prebuilt and custom policies, an administrator is able use
Fidelis XPS to enforce all corporate policies for network usage and confidentiality.
For information about editing or creating policies and rules for your enterprise, refer to the Guide to
Creating Policies.
Fidelis XPS User Guide Version 6.0 Overview 6
Page 15

Chapter 1 Getting Started
Fidelis XPS is a real-time, extrusion prevention system that detects and prevents net work abuse
and extrusions. It reassembles and analyzes traffic on your computer network. Fidelis XPS
accomplishes this though its sensors and the CommandPost management console. CommandPost
enables you to manage and configure the sensors that detect net work abuse and extrus ions.
This chapter provides information on how to get started using CommandPost including: accessing
and navigating CommandPost, changing your account information, and where to find more
information.
Access CommandPost
You can access CommandPost from anywhere on your network, by using a web browser that
supports SSL. Communications between the sensors and CommandPost and between
CommandPost and the web-based GUI are encrypted SSL communications.
CommandPost has been verified with Microsoft Internet Explorer versions 6, 7 and 8 and with
Mozilla Firefox versions 1, 2, and 3.
For CommandPost to work properly, your client workstation must have the following installed:
• Adobe Flash Player – obtain a recent version of Adobe Flash Player free of charge from the
Adobe web site at www.adobe.com.
• WinSCP – available free of charge from the WinSCP web site at www.winscp.net. WinSCP
transfers files to CommandPost for policy creation and verification. All other aspects of
CommandPost function properly without WinSCP.
• Allow pop-up windows from the CommandPost server.
• Enable Javascript execution in your browser.
Change your Account
From your browser, navigate to the IP address of the console device and log in with the user name
and password that Technical Support
Change the password for this account immediately after your first log in.
Note: Access to account information is determined based on the CommandPost
configuration for user authentication. Questions should be addressed to your
CommandPost system administrator.
To do this:
1. Click the Account link at the top right corner. The Change Account dialog box displays.
Figure 2. Change Account Information
2. Enter your old password and then enter your new password.
3. Re-enter your new password.
4. You can change the full name and the e-mail address associated with this account.
provides. The CommandPost Radar page displays.
Fidelis XPS User Guide Version 6.0 Getting Started 7
Page 16

5. Click Change. CommandPost saves the new password, name, and e-mail address. If you
changed the password, the system will log you out.
6. Log in with your new password.
7. Add a new user for each CommandPost user. Fidelis recommends adding at least one new
user, even if you are the only one accessing the system. Refer to Users
Access the Guides
Click the help icon at the top of the CommandPost GUI. The Fidelis XPS WebHelp system
displays. Click the PDF Downloads link in the Table of Contents to display the Guides page with its
links to the PDF files for the guides, the release notes, and the redistribution notice.
The information in the User Guide and The Guide to Creating Policies is accessible in WebHelp.
Lock Icon
Fidelis XPS CommandPost and sensors communicate over encrypted SSL connections, using se lfsigned certificates and an internal authentication method. This mode can be overridden by
installing externally generated certificates that use the Public Key Infrastructure (PKI). Refer to the
Enterprise Setup and Installation Guide for information about installing PKI certificates to run in this
mode.
When operating with PKI certificates, a lock icon appears at the top right of the CommandPost
menu bar. You can mouse over the lock icon to see the expiration date for the certificate.
CommandPost Navigation
With the exception of Radar, clicking a main menu option in the CommandPost GUI displays
subnavigation menus. A highlighted option from the subnavigation menu indicates which page is
currently accessed. CommandPost navigation is "sticky" meaning that if you later return to the
same major heading, the page last accessed displays.
Note: Users need permissions to see many of the menu options. If a user d oes not
have the appropriate permissions for a menu option, that option does not display.
Refer to User Roles
.
for more information.
System Status
System Status provides information about Fidelis XPS components and their status that you can
access from any GUI page. The diamond next to System Status reflects the status of the
component with the highest severity. Mouse over the System Status diamond to see the list of
components. The component list that displays is CommandPost and all sensors that have been
registered which are within the user’s access privileges. Refer to
a component in the list to see a message about that component's status. Each component has a
green, yellow, or red diamond next to it to indicate the severity of the component's status.
Note: Users need permissions to see system status. Refer to User Roles
Green indicates that the component is operational.
A red diamond indicates a condition with critical severity. The following table describes some of the
more common conditions that can cause system status messages with this severity.
Define User Profiles. Mouse over
.
Fidelis XPS User Guide Version 6.0 Getting Started 8
Page 17
Table 1. Critical conditions
Condition Description
Invalid License Contact Technical Support for a new license.
Sensor has lost connection
Sensor has not communicated
in the last 10 minutes
Insufficient disk space, alerts &
sessions not being inserted
Unable to make space for
alerts/sessions, alerts &
sessions not being inserted
Process is having difficulties
starting
Disk space on partition is gone
A yellow diamond indicates a condition with high severity. The following table describ es some of
the more common conditions that can cause system status messages with this severity.
Table 2. High severity conditions
Condition Description
High stress levels Fidelis XPS sensors reassemble packets into sessions in the sensor
Sensors can lose connectivity with the CommandPost for a number of
reasons.
This can occur if CommandPost cannot insert alerts or sessions into
the data store.
This can occur if CommandPost cannot delete alerts or sessions from
the data store when operating at space limitations.
The process manager sends this notification if it cannot start one of the
server processes on the sensor or on CommandPost.
The process manager runs on sensors and checks the disk periodically.
memory.Stress is an indication of the amount of memory currently
consumed by the sensor for reassembly. As stress increases, the
sensor's ability to analyze all traffic diminishes. There are several
reasons for increased stress:
1. When the incoming data is missing packets, stress will be high. In
this situation, the sensor cannot efficiently reassemble sessions. In high
stress situations with high packet loss, the sensor may be inoperable.
Packet loss is the most common culprit in high sensor stress and must
be remedied within the enterprise network.
2. When sustained network bandwidth exceeds the rating of the sensor,
stress may be high. The remedy is to analyze the sensor model and
whether it is rated to handle the observed network bandwidth.
3. When network bandwidth exceeds the rating of the sensor for small
bursts, stress may rise temporarily. The sensor can withstand busts as
indicated by momentary rises in the stress level.
Policy update required
Fidelis XPS User Guide Version 6.0 Getting Started 9
This occurs when policy assignments on CommandPost are not sent to
the sensors by a policy update . The sensor will be executing the last
policy download, not the assignments shown on CommandPost. Refer
to chapter 9 in the Guide to Creating Policies.
Page 18
Condition Description
License refresh required
License expired
License expires within one day
License expires in [number of]
days
Demo mode
License error
No sensor registered
[number of] alerts & [number of]
sessions deleted to create space
Database maintenance running,
alerts are being spooled
Rate of logging too high, spooler
cannot keep up
Ensure that you entered the license key for the component. Refer to
License
Register each sensor with the CommandPost. Refer to Add a Sensor
CommandPost deletes alerts from the data store when operating at
space limitations.
This occurs when database maintenance takes place on
CommandPost. Refer to Alert Storage
A sensor sends this message if it cannot write alerts to the spool file
fast enough.
. Contact Technical Support if you require a new license.
to schedule this maintenance.
Logout
To securely log out of CommandPost, click the logout link at the top of the page. Logging out will
end your browser session to CommandPost.
Note: If inactive for 15 minutes, CommandPost will log you out.
Using Non-ASCII Characters in Fidelis XPS
Fidelis XPS supports the use of non-ASCII characters in most input fields.The fields that do not
allow Unicode are: e-mail addresses, host names, domain names, login names, and server
directory names. CommandPost user names and passwords also do not support Unicode
characters.
.
Fidelis XPS User Guide Version 6.0 Getting Started 10
Page 19
Chapter 2 The Dashboard
The Dashboard enables you to access either the Fidelis XPS Radar page or the Information Flow
Map page.
All users can access the Radar
Both the Radar and the Information Flow Map pages require the Adobe Flash Player. Refer to
Getting Started
for details.
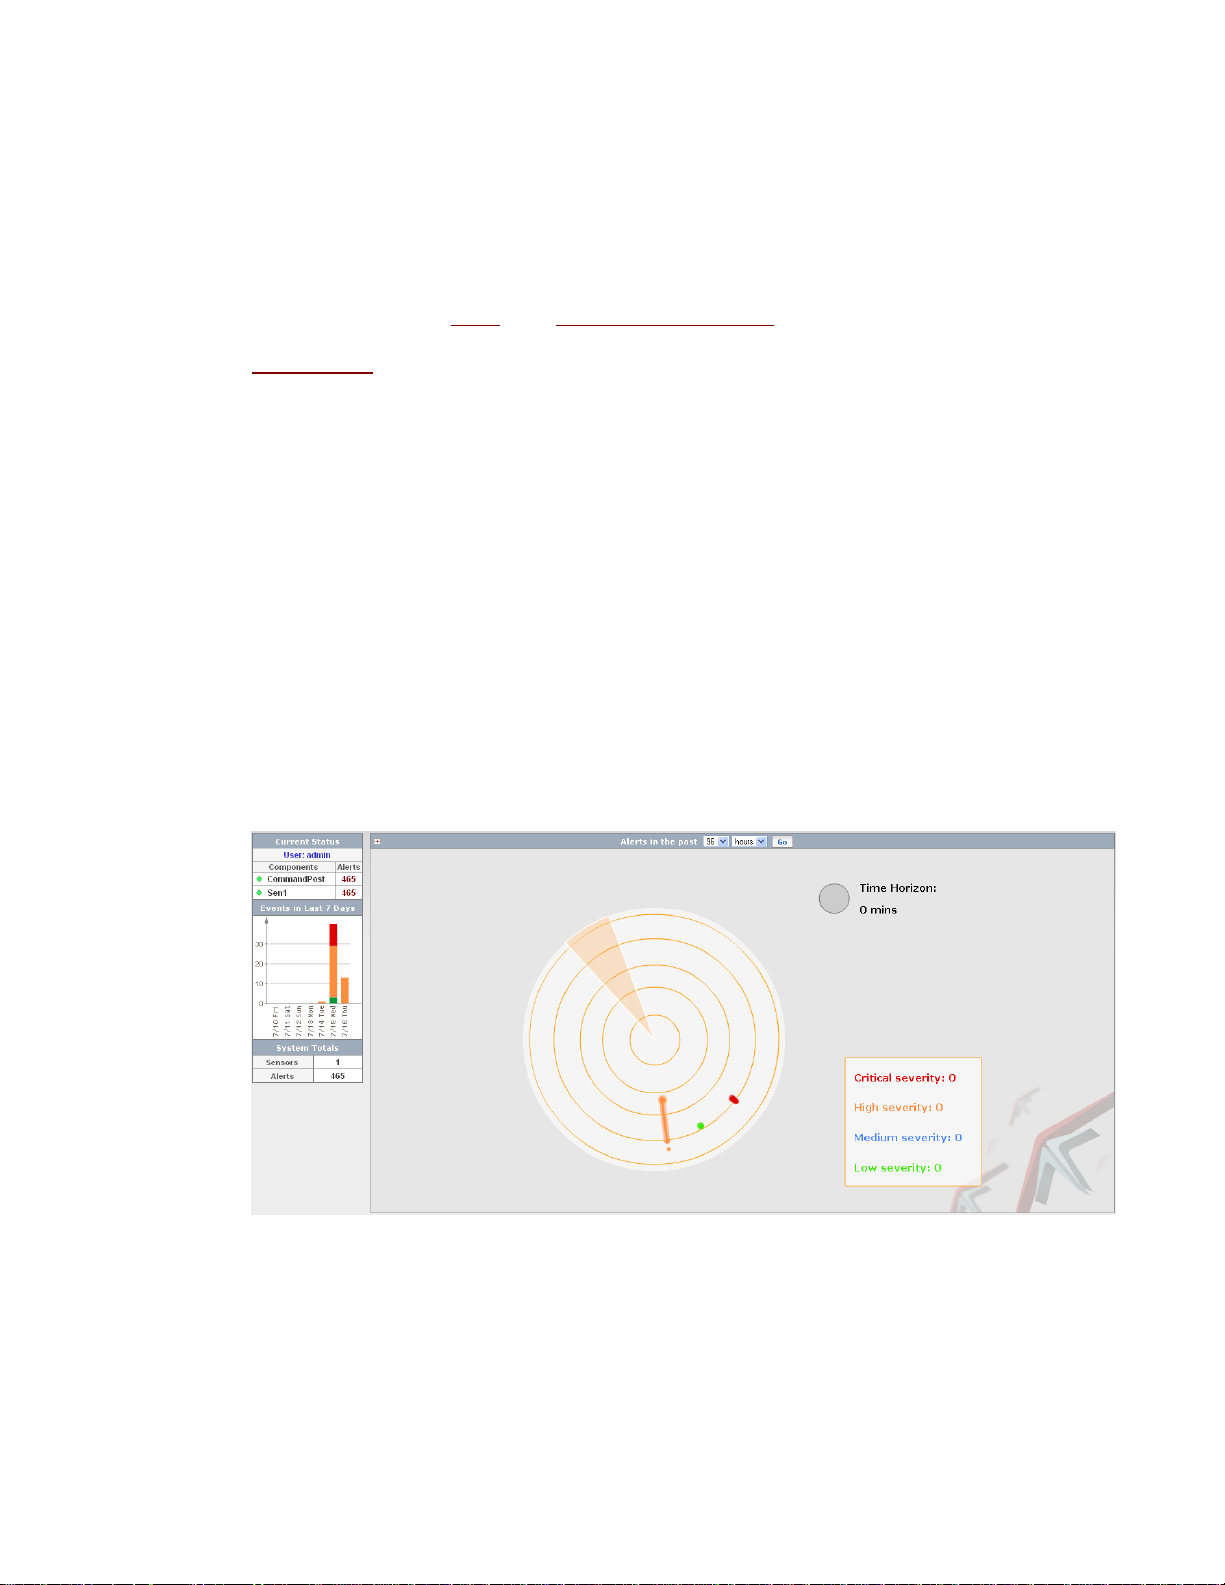
The Radar Page
CommandPost’s unique Radar page is a real-time graphical representation of alerts occurring on
your network.
To access this page, Click Dashboard>Radar.
The Radar page refreshes with new alert data periodically. Alerts are caused by events o n your
network.
What is an event?
When a Fidelis XPS sensor detects an extrusion of sensitive information or security brea ch, it
generates an event. An event can be generated as the result of a match to a specific rule and can
result in generating an alert, preventing the session, throttling the session, quarantining e-mail,
rerouting e-mail, or combinations of these actions.
What is an alert?
An alert is the recorded and displayed incidence of an event. Alerts are generated on ly if the alert
action for an event is enabled in the violated rule. Alerts are transferred to and stored by
CommandPost.
or the Information Flow Map page.
Figure 3. The Radar page
What is alert radar?
Alert Radar graphically represents alerts occurring on your network, grouped by common
characteristics identified by CommandPost’s Adaptive Alert Classifier which uses artificial neural
networks technology.
Fidelis XPS User Guide Version 6.0 Dashboard 11
Page 20
What are alert clusters?
CommandPost’s Adaptive Alert Classifier groups related network alerts into an alert cluster.
Clusters are a visual presentation of similar alerts. When creating a cluster, CommandPost
considers the sender and receiver of the information transfer, the time of the transfer, the sensor on
which the alert was detected, the rule violated, and the priority of an alert.
CommandPost creates clusters based on similar information, but not necessarily equivalent or
related information. For example, alerts with similar, but not equal, source IP addresses may be
grouped in a single cluster, which may be indicative of a problem generated by a loc ation rather
than an individual. Also, alerts from a similar time period during normal working hours may be
grouped together while others occurring during non-working hours may be grouped into a different
cluster.
A cluster is represented by a dot or a line on the alert radar. The line represents a cluster that
contains several alerts over time. The line connects the first and most recent alerts within the
cluster. A dot represents a single alert or several alerts that were detected at the same time.
The clusters are intended as a visual representation of alert activity and are not necessarily
presented in the best form for investigation into network behavior. CommandPost offers many
features for investigative purposes, including the Alerts and Alert Details pages, the Quarantine and
Quarantine Details pages, reports, searches, filtering, and sorting.
What does the Radar show?
Alert clusters requiring immediate attention are in red. The orangecolored alerts represent alerts with a high severity. Alerts with medium
severity are colored in blue and green and symbolize a low-level alert.
The shape of the alert cluster on the radar corresponds to its
duration—an alert grouping that appears as a point has a succinct
duration and an alert grouping over a longer duration may appear as a
line. Severity is determined, per rule, when the rule is created.
What is a time horizon?
The Alert Radar shows data over a configurable time horizon. As the radar beam sweeps over the
alert cluster, each alert cluster is identified by rule. Mousing over the alert cluster displays a pop-up
containing more information including:
• The rule violated by the alerts in the cluster.
• Sensor: provides the name of the sensor that detected the alert.
• Source address: indicates the sender’s IP address.
• Destination address: indicates the receiver’s IP address.
• Duration: provides the time difference between the oldest and newest alerts in the cluster.
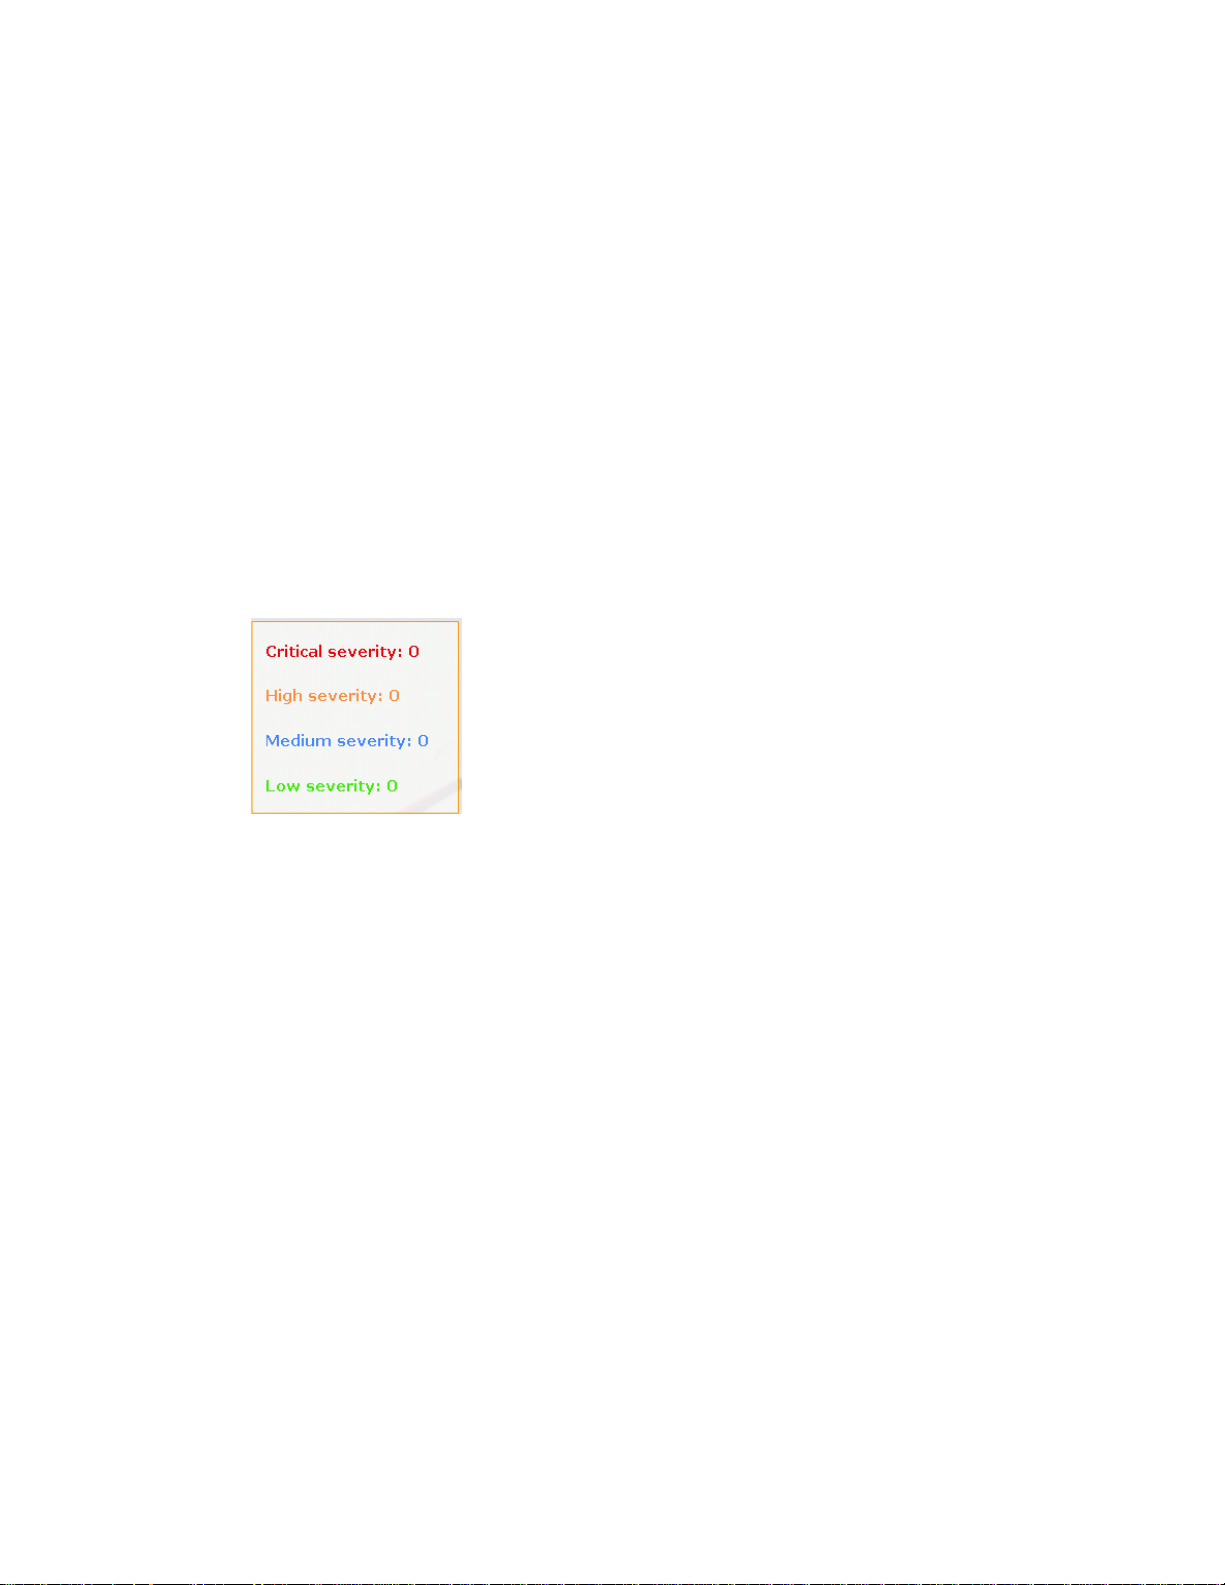
As you mouse over the radar and change the horizon, you will notice a change to the key in the
lower right hand corner of the page. The numbers listed here refer to the number of alert clusters,
per severity level, that fall into the current time horizon. If any portion of a radar line falls within the
horizon, this cluster is included in the key.
Uses of Alert Radar
Alert Radar allows network security personnel to monitor at a glance significant alerts occurring on
the network.
The maximum time horizon can be set from 1 hour to 96 days by selecting from the pull-down
options at the top of the alerts table and clicking Go. Moving the mouse out from the radar’s center
allows you to examine data within that time horizon. As the mouse moves out, the number of alert
clusters displayed by severity changes in real time.
Fidelis XPS User Guide Version 6.0 Dashboard 12
Page 21
Examining Alert Clusters
Clicking on an alert cluster takes you to the Alert Report for that alert cluster.
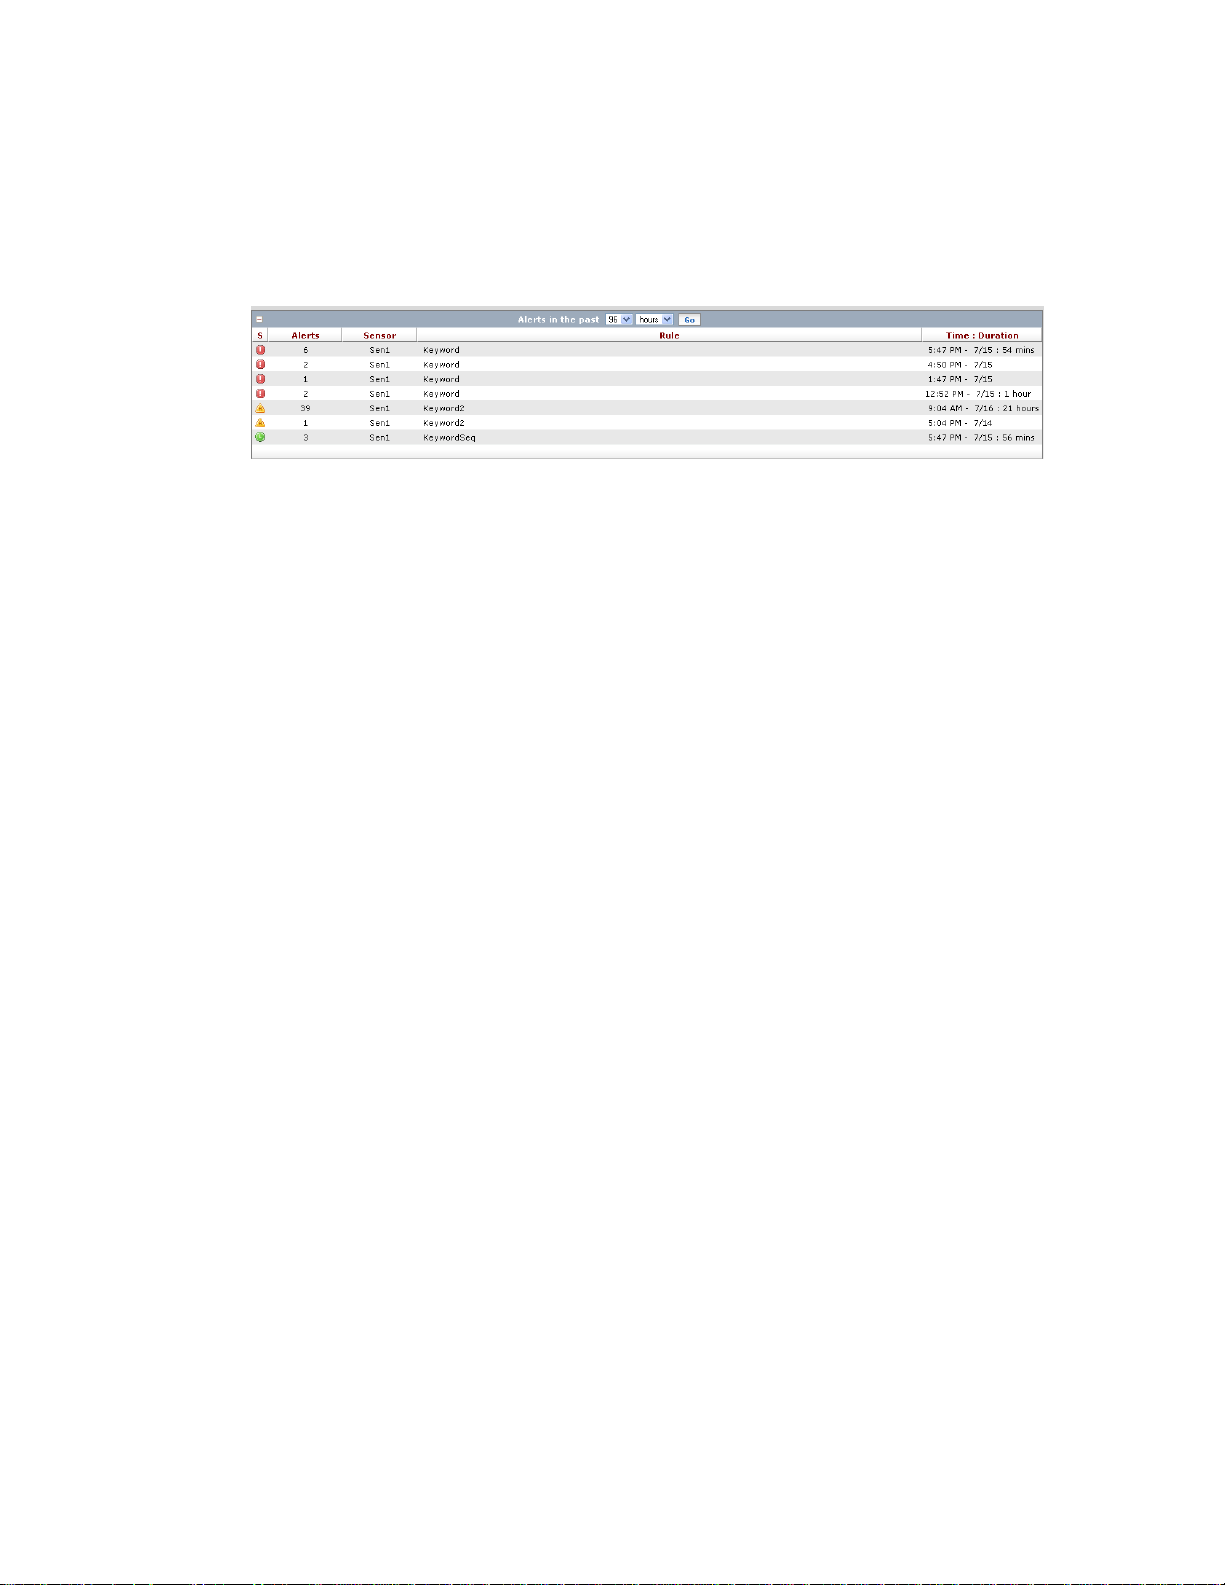
Alert Cluster Table
Above the Alert Radar, the Radar page displays a table of alert clusters over a configurable time
horizon. Click + to display the Alert Cluster table. Click – to hide the Alert Cluster table.
Figure 4. The Alerts table
The Alerts Cluster table of the Radar page displays:
• Severity of the alert cluster
• Number of alerts in the alert cluster, hyperlinked to Alert Report
• Sensor discovering the alerts
• The rule that was violated
• Time and Duration
The display time period can easily be changed from 1 hour to 96 days by using the p ull-down
menu. Changing the pull-down selection also changes the time display on Alert Radar. If the list is
truncated, the More link appears in the bar at the table’s foot.
Current Status Frame
The Current Status frame, located on the left of the Radar page, displays the following information,
updated in real-time.
Fidelis XPS User Guide Version 6.0 Dashboard 13
Page 22
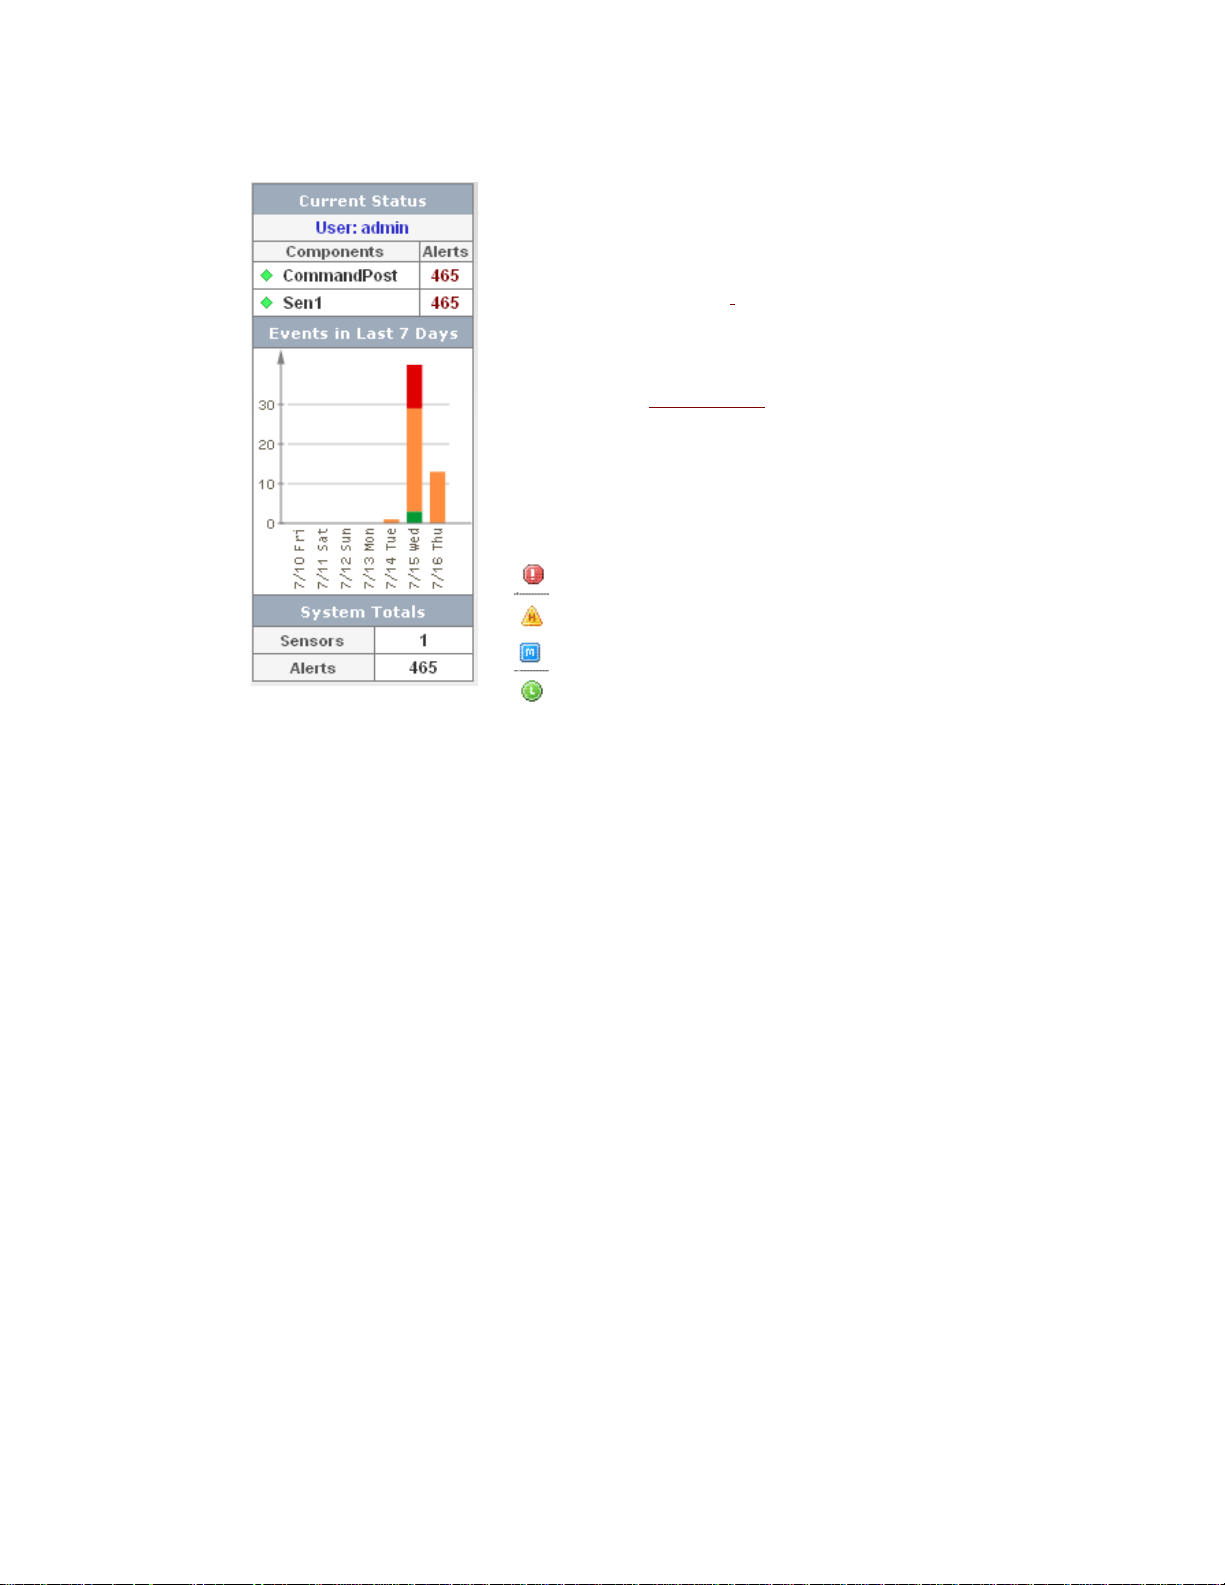
User:
Displays the login name of the user currently logged in and the total
number of alerts per sensor and per CommandPost. The component list
and numbers represent only those alerts the user is permitted to see
based on the user’s role, alert management group assignments, and
sensor assignments. Refer to
of alerts displays a list of these alerts.
Hold your cursor over the green, yellow, or red diamond to see useful
information about a component: for example, if a license is expiring, if
the sensor needs updating, or if the sensor is experiencing traffic
problems. Refer to System Status
critical and high severity.
Define User Profiles. Clicking the number
for explanations of conditions with
Events in the Last 7 Days
Presents a graph of events in the past seven days, by severity. This
graph lists all events in CommandPost, including those the user may
not access. The colors in the graph refer to severity levels.
Critical severity
High Severity
Medium Severity
Low Severity
Information Flow Map™ Page
The Information Flow Map™ feature within Fidelis XPS takes data leakage prevention (D LP)
beyond alerts to an actual understanding of how information flows across your network. A Direct
sensor automatically collects information about the network it monitors and displays all levels of
communication, from the transport protocol through to the content involved in network
communications. Information Flow Map displays communication between nodes as network flows
in real time.
Information Flow Map can display up to 64 nodes based on activity monitored by the sensor. You
can manipulate the nodes that display by using the controls available on the page.
• The map reflects the activity monitored by a single sensor, as chosen at the sensor selection
control.
• Filtering and sorting criteria change the sensor configuration. Manipulation of these controls
will change the way nodes are chosen for display.
• The Watch list can be used to mark a node for inclusion in the map at all times, regardless of
the filtering and sorting settings.
• The Ignore list can be used to mark a node for exclusion from the map at all times.
• A scanning radar line passes over the map to highlight the activity of each node. The radar
can be stopped to examine details of any node on the map and to view a summary of the
node’s activity over the past 24 hours.
Information Flow Map is a CommandPost view of data collected by the sensor. The sensor process
is resource intensive and cannot be executed on low performance sensor hardware. Information
Flow Map can only be enabled on a Direct sensor with enough capability to support Information
Flow Map. In addition, the sensor to CommandPost network bandwidth will increase significantly,
Before Information Flow Map is enabled, verify the following:
Fidelis XPS User Guide Version 6.0 Dashboard 14
Page 23
• The sensor is a Direct 1000 or Direct 2500. Lower performance sensors have insufficient
resources.
• The sensor must be registered and actively communicating with CommandPost.
• Each sensor enabled for Information Flow Map will increase the network load between
sensors and CommandPost by approximately 5 - 10 Mbps. If your system uses an
administrative network of 100 Mbps or higher for Fidelis system component communication,
Information Flow Map should not present a problem. Refer to the Enterprise Setup Guide.
• Information Flow Map is not supported on Internet Explorer 6.0.
• Information Flow Map requires version 10.0 and above of the Adobe Flash Player.
Refer to Direct and Internal
To see a different network flow:
Select a different sensor at the drop-down list. The main Information Flow Map change and so do
the filtering options for Transport, Protocol, Format, Content, Rule, and Alert.
Click Dashboard>Information Flow Map to access the page. The main sections of Information Flow
Map page are described in subsequent sections:
• The Information Flow Map
• Controls in the left panel
• Filtering and Sorting Criteria
for details about enabling Information Flow Map on a sensor.
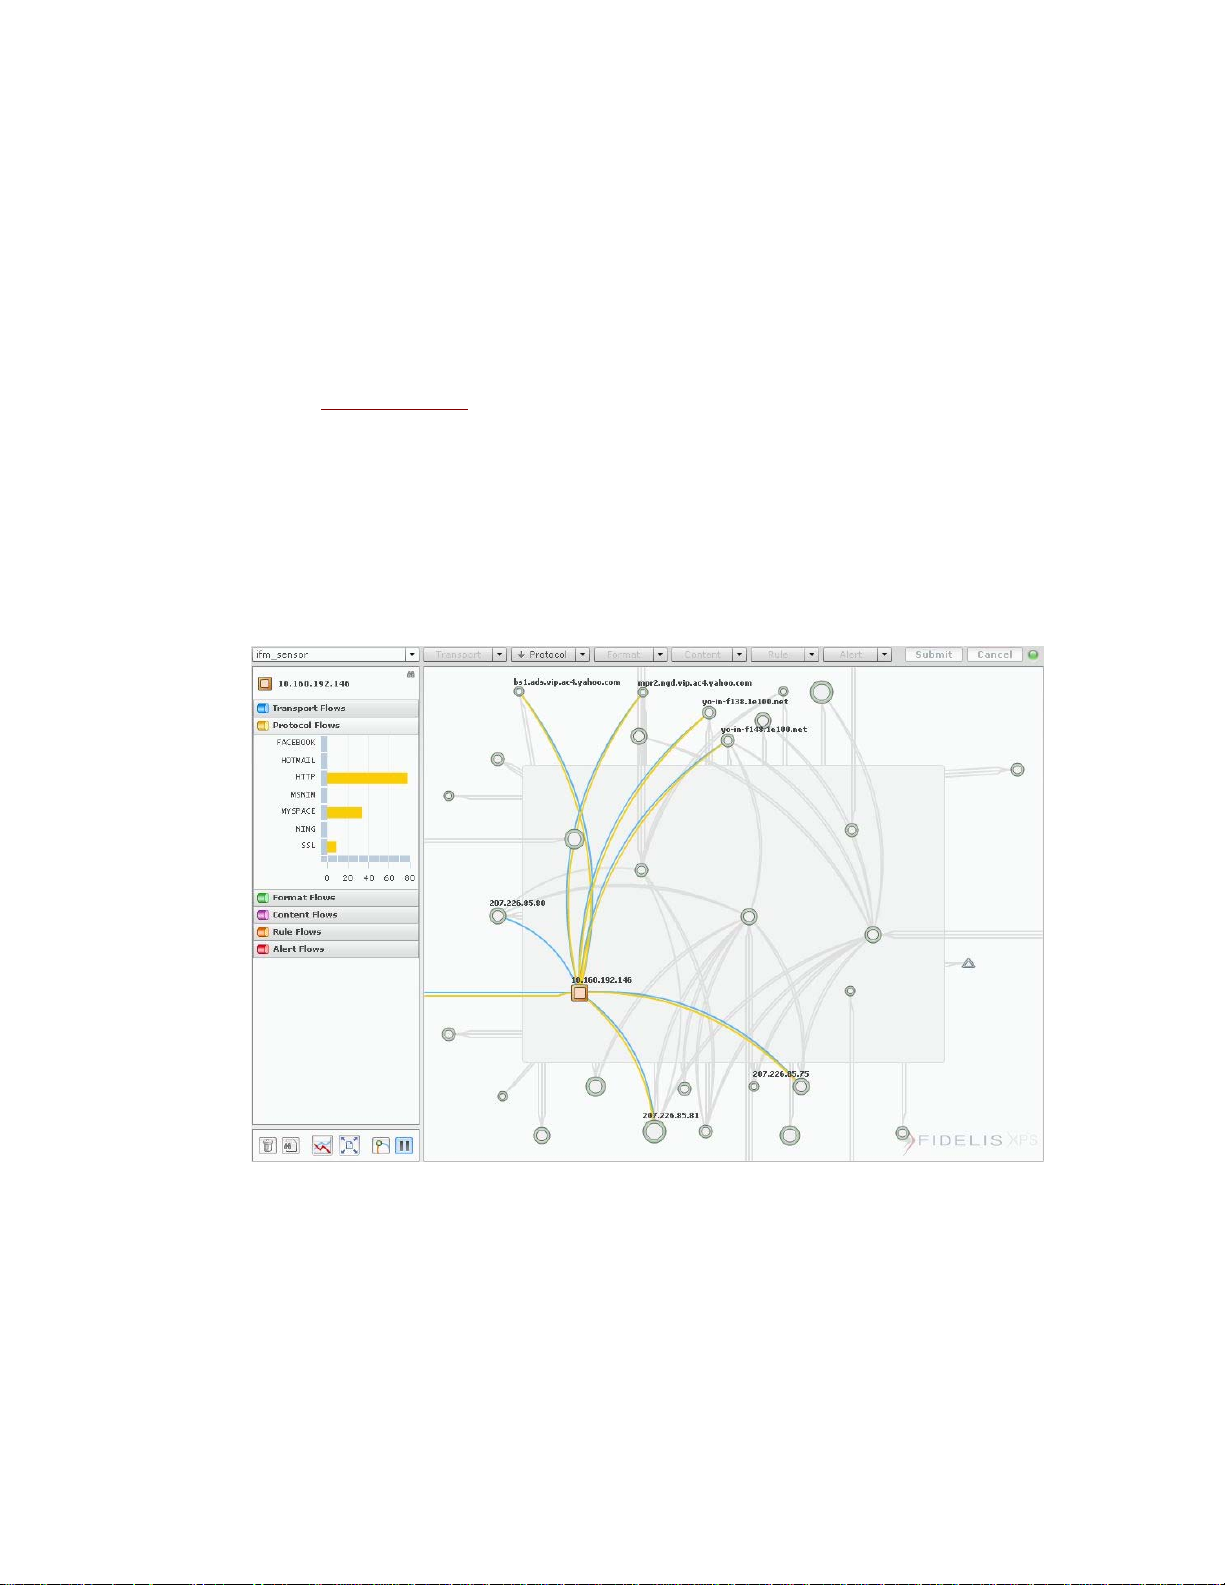
Figure 5. Information Flow Map
The Information Flow Map
The map displays network nodes based on the selected sensor and its filter and sort configuration.
The map is presented with a scanning radar line. As the radar passes over a node, the node and its
communication flows are highlighted. The left panel will reflect the name of the node under the
radar and details about each color coded flow. The radar can be stopped by clicking on an y node
or by clicking the Pause button located at the lower left. When the radar is stopped, you can access
details about the node and its communication.
Fidelis XPS User Guide Version 6.0 Dashboard 15
Page 24
Understanding the Map
By default, nodes are represented by green circles on the map. Larger circles represent nodes with
more activity. Nodes represent hosts on the network. The lines between the nodes represent
communication between nodes. Clicking a node pauses the radar a nd provides more information.
The map presents up to 64 nodes based on the sensor configuration. Many flows will be seen
between nodes on the map, in addition to flows with the “cloud.” In the context of Information Flow
Map, the cloud represents all nodes not currently shown.
If a border is configured for the sensor, a grey box will appear in the center of map. Nodes are
classified as internal or external based on their placement according to the network border. In this
view there are two clouds. Flows between a node on the inside of the border to the external edge of
the map reflect communication with an external node that is not part of the 64 nodes being
displayed, otherwise known as the external cloud. Similarly, flows from an external node to the
edge of the grey box represent communication to an internal node that is not being displayed, or
the internal cloud.
If no border is configured, the grey box will not appear. In this case, there is only one cloud
represent by flows that terminate at the edge of the map.
The lines between nodes represent communication between the nodes, col or coded to match the
accordion bars in the left panel:
• Blue represents the transport protocol, (for example:TCP or UDP).
• Yellow represents application protocol, (for example: HTTP. GoogleMail, AOL Instant
Messenger, Facebook).
• Green is the format of the data transfer, which may represent the format of a file (for example:
text, MS-Word, PDF) or the format of email or chat content (for example: text, HTML, XML).
• Purple represents content, as defined by fingerprints that are running on the sensor.
Fingerprints are descriptions of content, communication channel, or location. The information
flow map presents all fingerprint matches detected by the sensor. Refer to chapter 5 in the
Guide to Creating Policies for details about the creation of fingerprints.
• Orange represents rules that have an action of Information Flow Map. Using Information Flow
Map rules, fingerprints can be combined in a logical manner to monitor information without
creating alerts. Refer to chapter 7 in the Guide to Creating Policies for details about creating
and using rules.
• Red represents rules that have an action of Alert. Detailed alert information is available on the
Alerts report. Refer to Alert Details
Nodes are represented by their IP Address. CommandPost will attempt to resolve the host name of
all nodes and the with display the resolved name instead of the IP Address when possible.
.
Using Information Flow Map Controls
Information Flow Map controls enable you to view more information about a node, its flows, or
detailed information for a selected node's history. The controls also all ow you to manipulate the
Watch List and the Ignore List. Controls are located in the lower left of the screen or within the map
itself.
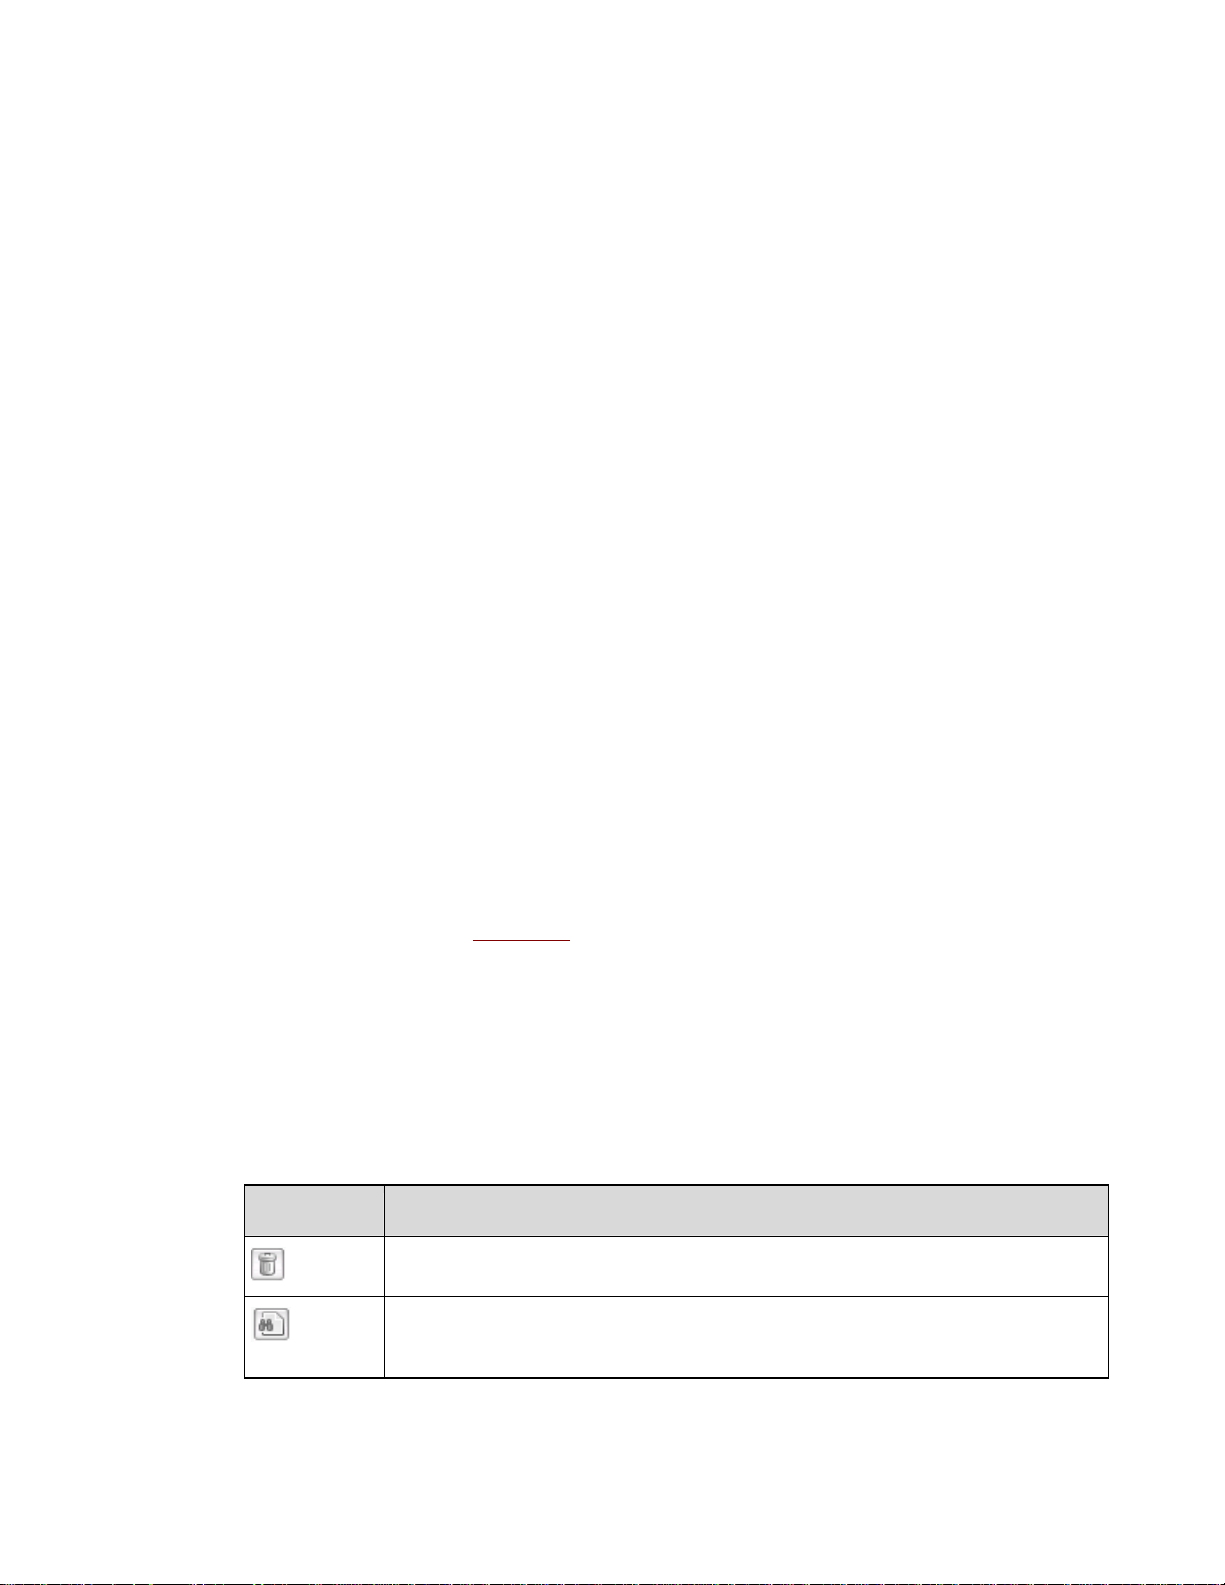
Table 3. Controls
Control Description
Fidelis XPS User Guide Version 6.0 Dashboard 16
Click to open or close the Ignore List in the left panel. Adding a node to the Ignore List
instructs the sensor to not collect information from that node.
Click to open or close the Watch List in the left panel. Adding a node to the Watch List
instructs the sensor to collect information from that node regardless of filter and sort
settings.
Page 25
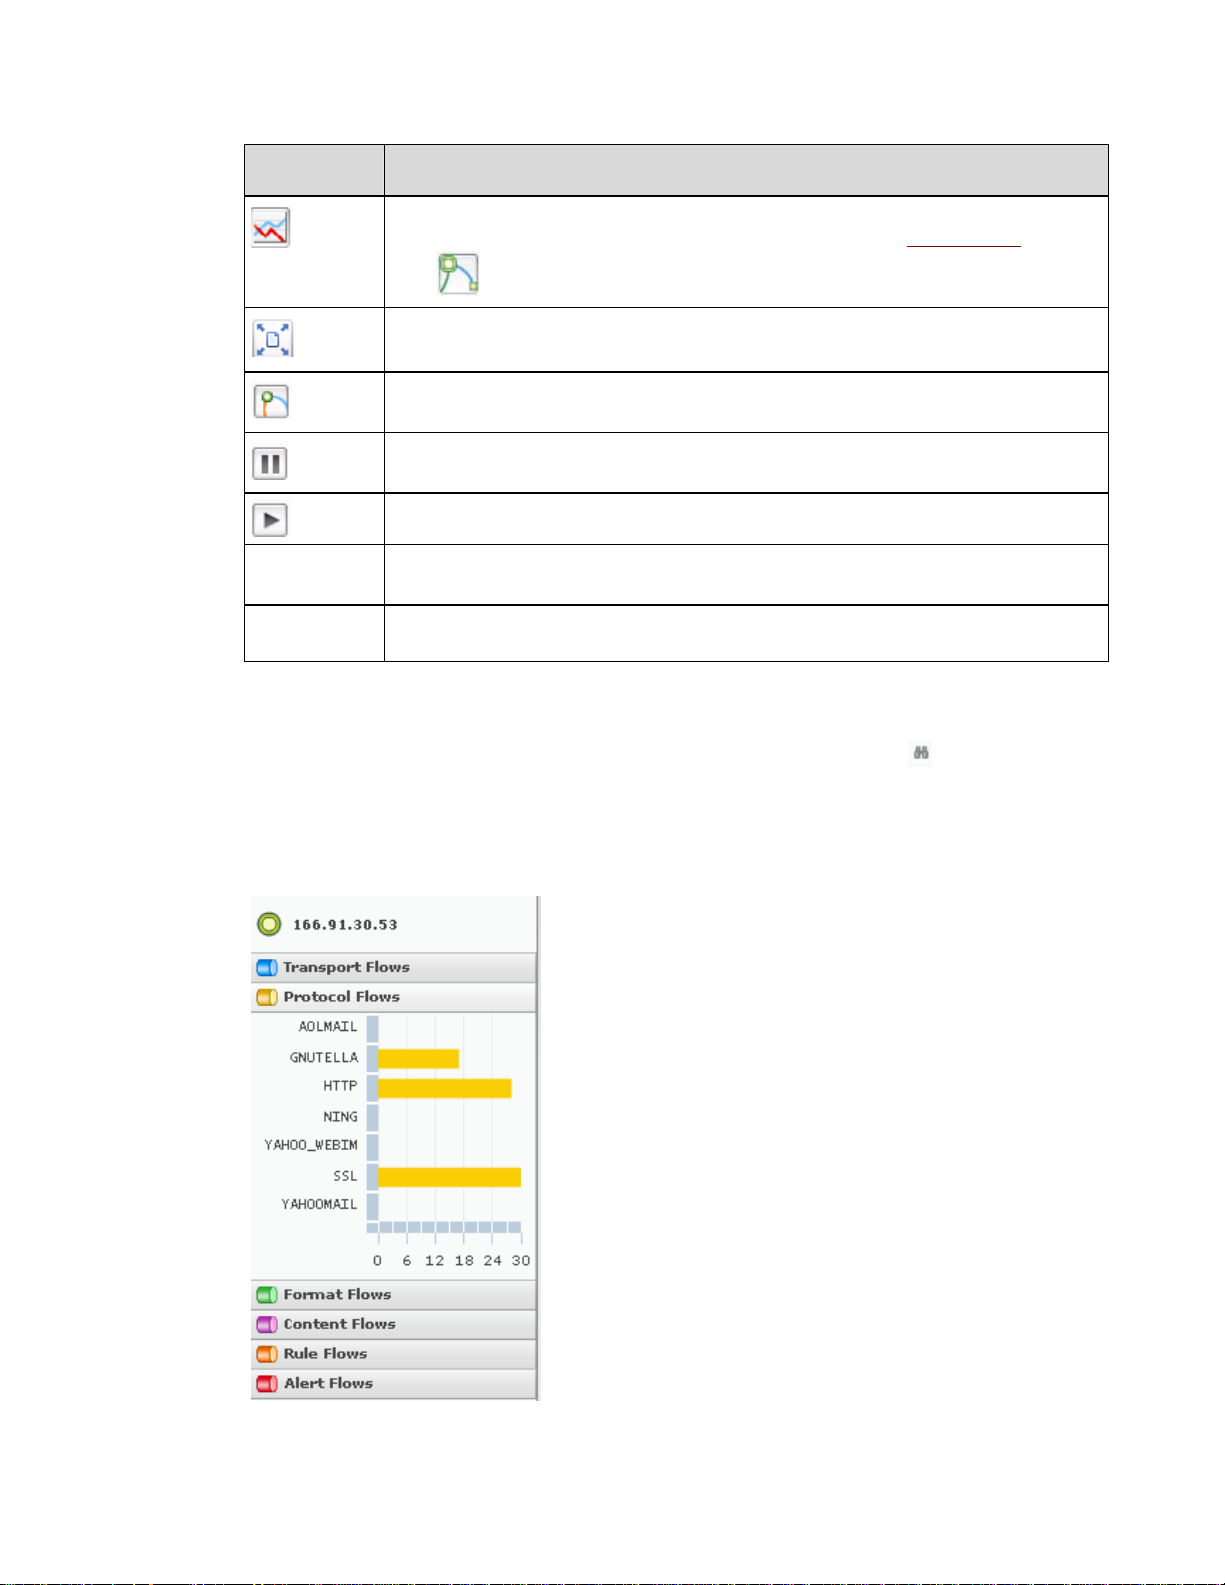
Control Description
This button becomes active if the radar is stopped and if a node is selected. Click to view
the activity of the selected node over the past 24 hours. Refer to History Charts
.
Click a node on
the map.
Drag a node on
the map.
Click
Click to switch to full screen mode.
Press ESC to exit full screen mode.
Redraws the Information Flow Map. The map will automatically redraw approximately
once per minute. Clicking this button will redraw the map immediately.
Pause the radar. The sensor will continue to collect information but the map will remain
static until the radar is restarted.
Starts the radar.
Clicking a node causes the same behavior as the pause button. In this case, you select
the node to be reflected on the left panel.
Nodes can be dragged within the map to change their position. When many nodes are
displayed, the communication flows may not be obvious without dragging.
to return to the Information Flow Map.
Controls in the Left Panel
The left panel is used to view details about activity for a selected node and to manage the Watch
and Ignore lists. The name of the selected node appears at the top of the panel. A
the name of the selected node indicates that the node is part of the Watch List. Node activity is
presented by accordion bars which provide a quick view of a node's recent activity.
Accordion Bars
The accordion bars in the left panel display node activity The
information for each node displays when the radar passes over the
node or when the node is selected while the radar is stopped. Click an
accordion bar to view the associated chart.
You can mouse over the graph to see specific information such as the
number of sessions, packets, and bytes.
icon next to
Fidelis XPS User Guide Version 6.0 Dashboard 17
Page 26
Each chart presents a bar chart reflecting the node activity. The X-axis of the chart reflects the
average activity in the last minute. The Y-axis reflects all possible values available within the map.
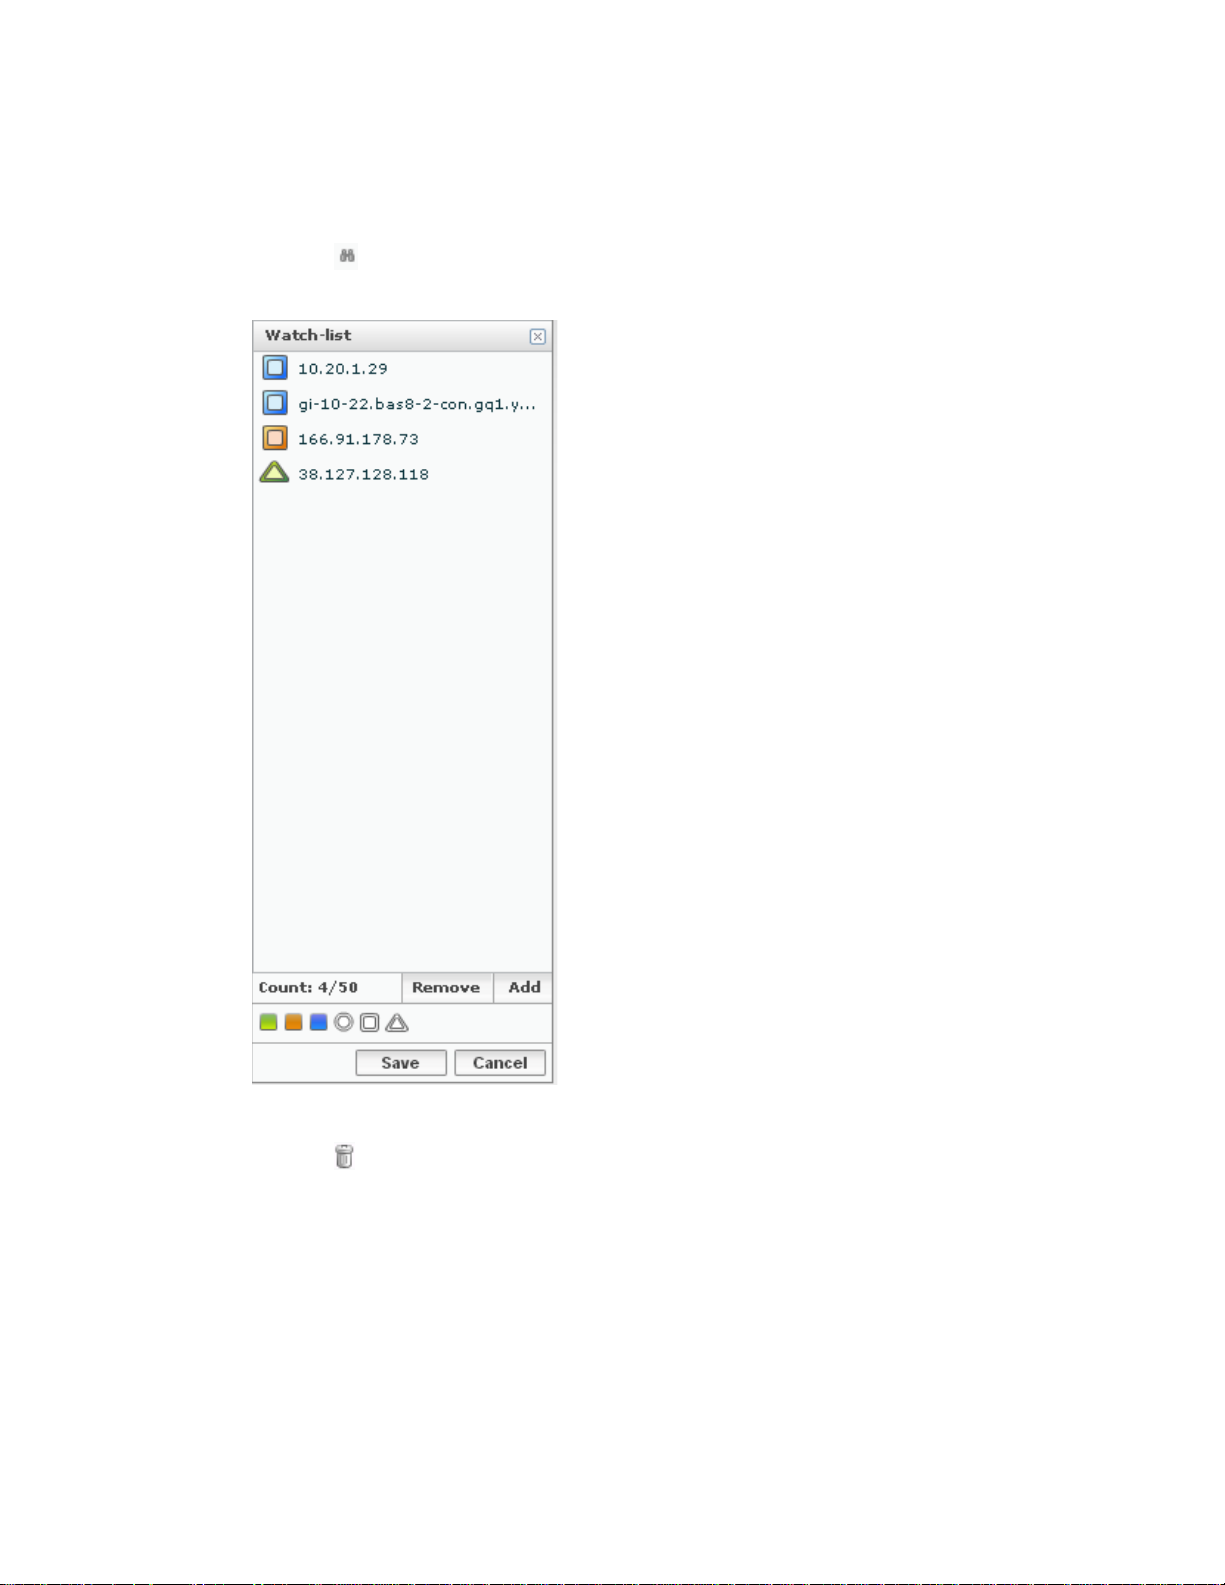
Watch List
When the control on the l ower left of the screen is clicked, the left panel is replaced by the
Watch List. Nodes in the Watch List are displayed on the map regardless of filtering criteria
selected. However, they will not display if they have no detected activity.
The Watch List can contain up to 50 nodes. The Count at the bottom
tracks how many nodes are in the list.
To add a node to the list, select it on the map and click the Add
button at the bottom of the Watch List. To remove a node from the
list, select it from the Watch List and click the Remove button.
When you select a node in the Watch List the following occurs in the
Information Flow Map:
• The radar stops.
• The node and its flows are highlighted.
Note: If the node has no activity, it is not on the map and
nothing is highlighted.
• Select a new shape or a new color and click Save.
Changes to the Watch List are not effective until you click
Save.
Ignore List
When the control on the lower left of the screen is clicked, the left panel is replaced by the
Ignore List. Nodes in the Ignore List are not displayed on the map and the sensor will not collect
information on these nodes.
The controls for adding or removing nodes from the list operate in the same manner as the Watch
List.
Fidelis XPS User Guide Version 6.0 Dashboard 18
Page 27
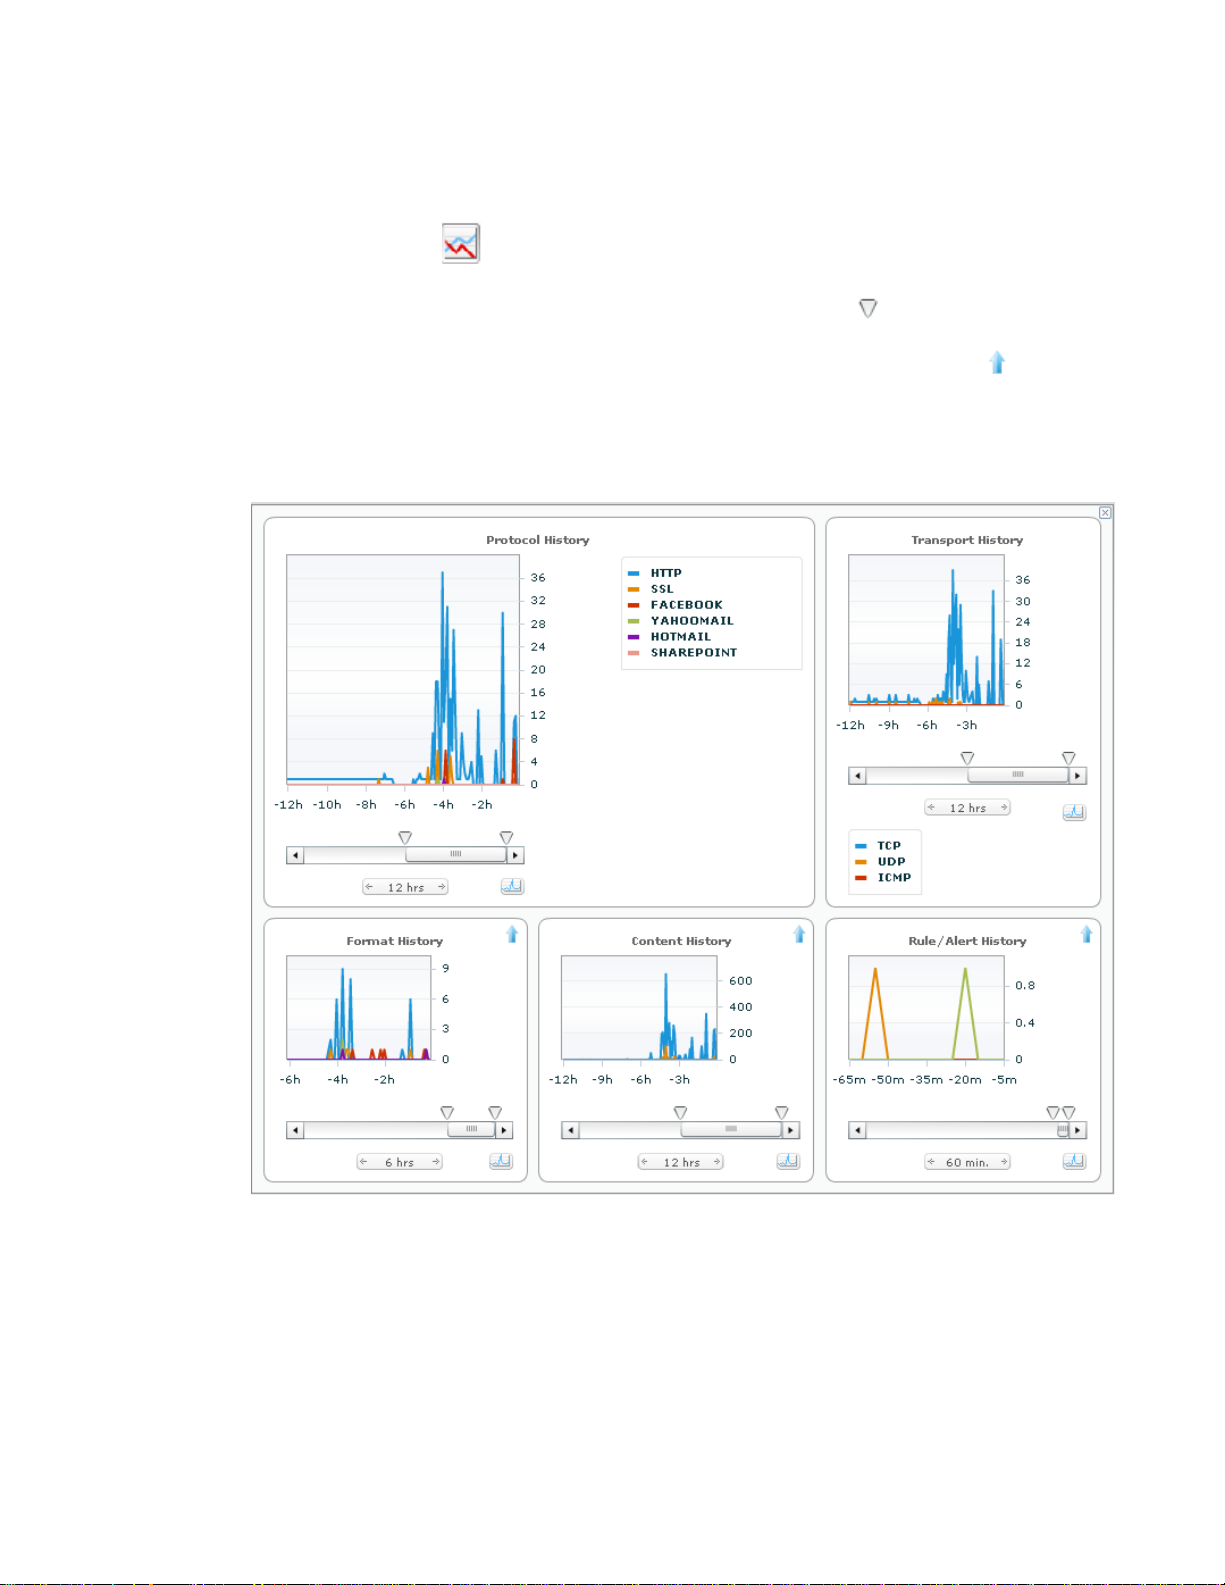
History Charts
Select a node and click to view the charts for the selected node. History charts provide a
summary of Protocol, Transport, Format, Content, Rule, and Alert activity for the past 24 hours.
You can examine specific time periods within that time frame by moving the
time frame or move the slider bar to view a different time segment.
The page is presented by one large chart in the upper left in addition to smaller charts. Click
move a chart into the large section. The large chart provides an interactive legend. Clicking on a
name in the legend will toggle whether the associated line in the graph is shown or not.
The history charts may include gaps of time where information is missing. This represents periods
where the node was not being tracked by the sensor. This can be due to inactivity, filter or sort
criteria changes, and changes to watch and ignore lists.
icons to change the
to
Figure 6 . Information Flow Map: History
Filtering and Sorting Criteria
The selection area at the top of the Information Flow Map page contains a sensor selection, filter
and sort controls, Submit and Cancel buttons, and a status icon. These controls enable you to
change the map by selecting a different sensor or by modifying the sensor configuration via filtering
and sorting changes.
By default, no filters are selected. This means that the network sensor collects all available
information from each node and the map will reflect the most active 64 nodes. You can filter this
information by selecting specific criteria from the filter lists available at the top of the page. This
Fidelis XPS User Guide Version 6.0 Dashboard 19
Page 28
changes the criteria used by the sensor to collect information, which changes the method used to
determine the nodes to display.
When filters are applied only those nodes that meet the chosen criteria are displayed. However, all
activity of these nodes will be seen. For example, if you choose to filter by the Protocol Facebook,
the Information Flow Map show all nodes using Facebook. The map will also show other flows
involving these nodes.
Filter criteria across the lists are taken as a single criterion for node selection. For example, if you
choose the Protocol Facebook and Content of Sensitive Data, the map will only show nodes that
are communicating with Facebook and have flows that match Sensitive Data. Note that this does
not mean that a single flow contains both parameters used in this example, only that the node is
involved with flows that match both.
To change the filter, click
to view a list and select criteria.
Table 4. Filter Lists
List Description
Transport Enables you to filter based on transport protocols: TCP, UDP, and ICMP.
Protocol Select protocols of interest from a list of all application protocols.
Format
Content
Rule
Alert
Select from a list of all supported data formats.
Select from a list of fingerprints assigned to the sensor through policy assignments. Each
sensor can track information for up to 64 fingerprints. The fingerprints are chosen according to
this order: Content fingerprints are first, followed by channel and location fingerprints found in
rules with an action of Information Flow Map followed by all remaining fingerprints. Each sublist
is sorted alphabetically. This list is displayed according to this order, on the Content filter
control.
Select from a list of rules that have an Information Flow Map action running on the sensor. The
list can contain up to 32 rules, sorted alphabetically.
Select from a list of rules that have an alert action running on the sensor. This list can contain
up to 32 rules. Rules that also have Content fingerprints display first, then all other rules. Each
sublist is sorted alphabetically.
To change the sort, click the button of the list you wish to sort. Only one list can be chosen for
sorting. The
activity). The
Clicking the button again switches sort mode.
Note: Sort is only possible if at least one item is selected as filter criteria. For
example, if all Protocols are deselected, sorting by Protocol has no effect.
After selecting and sorting criteria, you can:
• Click Cancel to eliminate current selections.
• Click Submit to send your changes to the network sensor and to nodes on the same network.
The sensor collects information from the network based on your selected configuration and
sends it to the CommandPost GUI for display in Information Flow Map. Once configuration
changes are sent, new changes cannot be sent until the sensor is synchronized. The Sync
Synchronization takes about 1 minute to complete.
Sample uses of Filtering and Sorting:
Fidelis XPS User Guide Version 6.0 Dashboard 20
icon indicates that the sort that will choose the most active 64 nodes (high to low
icon indicates a sort that will choose the least active 64 nodes (low to high activity).
icon changes to indicate that information is being retrieved from the sensor.
Page 29

• To show the most active nodes on the network, use the default filter settings.
• To show the most active nodes, based on application protocol usage, sort based on the
Protocol control. This will sort the nodes based on protocol usage rather than any other level
of activity.
• To show the most active nodes using Facebook and sharing sensitive data, deselect all filters
except the Protocol Facebook and Content of Sensitive Data, assuming such a fingerprint is
defined and running on the sensor. Nodes are selected based on the most active Facebook
users and the most active Sensitive Data transfers, which are not necessarily the same set of
nodes.
• To show all nodes sharing Sensitive Data over Facebook, define a rule that defines this
condition. Filter the Information Flow Map based on this rule.
• To show the least active nodes, change the sorting criteria to low-to-high.
Fidelis XPS User Guide Version 6.0 Dashboard 21
Page 30

Chapter 3 Understand and Manage Alert
Workflows
From the Alert Report or the Quarantine pages, you can assign, monitor, and manage alerts and
quarantined e-mail. The Alert Report and Quarantine pages are available f rom the Reports main
heading.
This chapter covers the following topics:
• Access to Alerts and Quarantined e-mail
• Assign a New Alert
• Manage an Alert
• Manage Multiple Alerts
Access to Alerts and Quarantined E-Mails
The Alert Report page provides a list of all alerts accessible to the user. Accessibility to this
information is determined by the CommandPost user’s role, sensor assignments, and alert
management group assignments.
Refer to Access Control in CommandPost
groups, and how these affect users. Refer to chapter 9 in the Guide to Creating Policies for details
on assigning policies and rules to sensors and to alert management groups.
Users with full access to the Alert function may:
for details on assigned sensors, alert management
• Read and examine the details of an alert, including the original transmission that caused the
violation.
• Export summary alert information to Microsoft Excel or any other application that accepts
comma-separated files.
• Purge alerts.
Users with full access to the Quarantine function may:
• Read and examine the details of every quarantined e-mail, including the original e-mail that
caused the quarantine.
• Deliver e-mail from quarantine, sending it to its original recipient.
• Discard e-mail from quarantine, removing it from the quarantine queue without delivery.
Users with full access to the ticket system may also:
• Assign alert tickets to another user with access to the alert.
• Close an alert ticket, providing a ticket resolution.
• Move an alert from its current alert management group to another. This action makes the alert
accessible to another group of users.
• Add comments to the alert workflow log.
Handle Alerts
To find all alerts currently assigned to you, use the My Alerts view on the Alert Report page. Refer
to System Reports for Alerts
To find all alerts owned by a specific user:
.
Fidelis XPS User Guide Version 6.0 Alert Workflows 22
Page 31

1. Click Search.
2. Enter the user name in the Search for text box.
3. Select Owner and click Go.
To find all unassigned alerts:
1. Click Search
2. Enter unassigned in the Search for text box.
3. Select Owner and click Go.
The Alert Workflow Log
New alerts are not assigned to an owner. A user with ticketing privileges and access to the alert
may open, close, and assign an alert. Alert Workflow Management includes:
• Assign one or more alerts to another user with access to the sensor(s) that generated the
alerts and have access to the alert management group(s) to which these alerts belong. When
an alert is assigned, an e-mail is sent to the new alert owner.
• Close an alert. This action may be performed by anyone with access to the alert. When the
alert is closed, a resolution is entered to the alert workflow log.
• Add comments to the ticket log.
• Change Management Group will make the alert accessible to a different group of users. When
the group is changed, an e-mail is sent to the group mailing list, to make members of the new
group aware of the alert.
• Change Label changes the label that displays in the Alert Report and Alert Details pages.
For each action, the alert manager has the option to fill out the Subject and Details fields which will
be added to the alert workflow log. The alert workflow log will display the full history of the alert with
all comments as it changes from group to group, owner to owner, and finally to a closed state.
The subject and details information will be included in the body of an e-mail sent to the newly
assigned user or group.
Alerts may be managed individually at the Alert Details page or may be managed in bulk at the
Alert Report page. The same options are available in the Quarantine and Quarantine D etails
pages.
The alert workflow log only applies to alerts – not to quarantined e-mail. When managing alerts
from the Quarantine Details page, the action will apply to all alerts associated with the e-mail.
When managing alerts from the Quarantine page, the action will apply to all alerts associated with
all selected quarantined e-mail messages.
Manage a Single Alert
You can manage an alert at the Alert Workflow Log section of the Alert Details page. You can
access this page by clicking
Management page. This functionality enables users with ticketing privileg es to do the following:
Change Status
• Enter a Subject or Comment.
• Click Assign to and select a user from the list to assign the alert. The list of users includes
those with access to the sensor that generated the alert and have access to the alert
management group to which the alert belongs. After you submit the change, the selected user
receives an e-mail reflecting the assignment.
• Click Add comment to add comments to the ticket log without changing the ticket status or
ownership. After you submit the change, information entered in the Subject and Details text
boxes will be appended to the comment.
Fidelis XPS User Guide Version 6.0 Alert Workflows 23
next to an alert at the Alert Report pageor from the Quarantine
Page 32

• Click Close as and select a reason from the list. Your options are Allowed, Action taken, No
action taken, and False positive. The alert is closed.
Note: Closing an alert marks you as the owner of the alert.
Change Alert Group
Click Change Group to: and select the alert management group for the alert at the dialog box. If
you do not belong to the selected group, you will not have access to the alert after clicking Submit.
Note: Changing the alert management group, removes the assigned owner and
changes the status to new.
Manage Multiple Alerts
Multiple alerts can be managed from the Alert Report and Quarantine pages by using checkbo xes
and the Actions list at the top of the Alerts List.
To manage multiple alerts from both pages:
1. Select one or more alerts or one or more quarantine e-mails.
To select all alerts or e-mails on the page, click the checkbox at the top of the page.
2. Select a management option from the Actions list. The dialog box that displays depends on
the option selected.
3. Enter changes into the dialog box and click Submit.
Table 5. Actions list options
You can access these options from the Alert Report and Quarantine Management pages.
Management
option
Change Status Assign, Close, or add comments to the selected alert
Change
Management
Group
Note: From the Alert Report you can also apply labels, purge, and export selected
alerts. These functions do not impact the ticketing system and are described in
Understand and Manage Alerts
From the Quarantine Management page you can discard or deliver selected quaran t ine
e-mails. Refer to Deliver or Discard Quarantine E-Mail
Description
tickets.
Changes the management group associated with
selected alerts. Enter a subject or a comment if desired.
.
.
Fidelis XPS User Guide Version 6.0 Alert Workflows 24
Page 33

Chapter 4 Understand and Manage Alerts
The Alert Report displays a list of all alerts accessible to you. You can filter which alerts display,
search for specific alert attributes, and research details about alerts.
With ticketing privileges, you can also assign or close alerts. Refer to The Alert Workflow Log
This chapter covers the following topics:
.
• Alert Report
• Navigate Alert Pages
• Select Alert Actions
• Alerts Page Controls
• Alert Details
To access the Alert Report, click Reports>Alerts or click an alert cluster in the Radar page. The first
time you access it, the Default Report displays. You can change the report to another system report
or to a Custom Report that you create. The last report that you view will restored on your next
access.
When you Access Alerts by clicking an alert cluster on the Radar page, you will see yo ur last saved
report, filtered by the cluster that you selected.
Figure 7. Alert Report
The Alert Report contains the following major elements:
• Alert Report—a list of all alerts displayed according to the selected report and actions taken at
controls on the Alert Report page.
Fidelis XPS User Guide Version 6.0 Alerts 25
Page 34

• Page Navigation
• Actions—Enables you to take action on selected alerts.
• Alert Report controls—Enables you to search, group, change the display settings of the page,
and retrieve a custom report. Click
to open the control section or to hide the controls.
Alert Report
An Alert Report is created from all alerts available within your assigned groups and sensors. T he
report can be greatly customized by choosing the columns to display, by reducing the alerts to
those that match specified criteria, by summarizing, and by choosing to display the results as
charts or as a table.
In all cases, the report is highly interactive. Rows in a table and sections in a graph can be clicked
to obtain further information; specific details of any alert can be obtained; actions can be taken on
single alerts or groups of alerts; and alerts can be purged.
The selection of a report restores settings for that report, including:
• The columns available in your report. Primary columns are shown on your report. Secondary
columns become available when you click on a row within the report to view the quick
summary of the alert.
• Data criteria including Searches, Filters, and Duration. These terms serve to reduce the
number of alerts in the report.
• Grouping and sorting of the report. Reports can be grouped by any one or multiple primary
columns to produce a summary of the data. Sorting can be applied to any primary column
whether grouped or not.
• The report can be displayed as a chart or table. Charts are available only for grouped reports.
• A trending chart can be saved with any type of report. The trending chart will show alerts per
time above the report.
After running a report, you can use the controls on the Alert Report to further manipulate the
information. When you make changes, you are changing the report into an Unnamed Report. By
clicking Customize you can save this new report with your new settings. Alternatively, you can use
the Unnamed Report to analyze and drill down into your information as you would any other report.
in the in the upper right corner of the Alert Report page
Alert Quick Summary
Click a row on the Alert Report to display a Quick Summary, which provides the information
associated with the columns in the secondary row of your view.
At the Quick Summary, you can click
You can also choose to filter alerts based on the value of the available information.
The Quick Summary of an alert shown below is from the Default Report.
Figure 8. Alert Report: Quick Summary
Fidelis XPS User Guide Version 6.0 Alerts 26
to view the Alert Details page for the selected alert.
Page 35

Filter Alerts
You can filter alerts by selecting items at the Quick Summary page. Filters are used to reduce the
list to only those alerts that match your filter criteria. For example, you can use a filter to see only
those alerts generated by a specific rule. Or if you choose to filter by Sensor = Sensor-One, the
result will be a list of all alerts from the sensor named Sensor-One. This list would not include alerts
from any other sensor.
To set a filter:
1. Click the check box next to one or more values in the Quick Summary page.
2. Click Filter.
3. CommandPost finds all alerts that exactly match the filtered value and display only these
alerts.
Figure 9. Filtered alerts
When a filter is applied, the following occurs:
• If you selected multiple fields, all are applied to the filter. The more filters that you select, the
more narrow your results.
• The applied filters display above the table.
• The [x] next to the value in the filter list allows you to remove the filter.
Filtering performance is typically fast when filtering on one column , but can degrade as more filters
are applied.
Navigate Alert Pages
Because CommandPost may contain thousands or millions of alerts, Alert Report is presented in
pages. Each page initially contains 25 rows of alerts. You can change the number of rows per page
by entering the new amount in the text box at the bottom of the page. This value will be stored as
your new default page size.
Up to 10 page numbers display at the top and at the bottom of each page. Clicking a page number
takes you to that page. Click the < or > arrow buttons to move to the next page in either direction.
Click << or >> to advance to the first or last page. These buttons may be disabled when you are
currently at the beginning or the end of the alert report.
Fidelis XPS User Guide Version 6.0 Alerts 27
Page 36

Alert Actions
Click the check box next to one or more alerts to select them. Clicking check boxes again deselects
alerts. Clicking the check box at the top of the Alert Report page selects (or deselects) all alerts on
the current page.
Figure 10. Alert actions
The following actions may be taken on selected alerts:
• Change Status. Refer to The Alert Workflow Log
• Change Management Group. Refer to The Alert Workflow Log
• Manage Label. Refer to Alert Labels
• Export alerts to Microsoft Excel or any other application that accepts comma-separated files.
Refer to Export Alerts
• Purge alerts from the CommandPost database. Refer to Purge Alerts
.
.
.
.
.
Alert Labels
Labels are tags that a CommandPost user can apply to an alert. By using labels, you can
categorize alerts into meaningful names for your enterprise. You can later search or filter by label to
retrieve alerts that contain your label.
Labels can be applied from the Alert Report page or from the Alert Details page. From the Alert
Report page you can select multiple alerts and apply the same label to each.
To apply a label from the Alert Report page:
1. Click the checkbox next to the alert or alerts that you wish to label.
2. From the Actions list, select Manage Label. The Change Label dialog box displays where you
can select an existing label or create a new one.
3. The Label Name text box lists all previously used labels. You may choose a label from this list
and click Apply Label.
4. If you wish to create a new label, type it into the New Label text box and click Apply Label.
To remove a label from an alert: You can choose a new label using the steps above and overwrite
the label with the new label. To clear the label for all selected alerts, click Clear Label.
To remove a label that is no longer required: Select the label in the Label Name text box and click
. Labels can only be removed if there are no alerts that use the label,
Export Alerts to Excel
Export selected alerts to a comma separated file, which can be opened in Microsoft Excel or a
similar application. If your alerts are grouped, this function will export the group summary
information, not the individual alerts within the group.
Fidelis XPS User Guide Version 6.0 Alerts 28
Page 37

Figure 11. Export alerts
Purge Alerts
Purge Alerts removes selected alerts from CommandPost.
1. Click Purge Alerts.
2. Click Ok at the confirmation dialog box.
Alert Report Page Controls
The Alert Report page contains several options to modify Alert Reports, drill down into alert details,
and manipulate the presentation of alerts to facilitate investigations. The controls are located at the
top of the page. Click in the upper right corner of the Alert Report page to open the control section.
Click
Within this section the following controls are available:
to hide the controls.
• Report—Enables you to select a report from the list. All other functions available on the Alert
Report are based on this initial setting. You may choose from seven system reports plus any
report that you create and save.
• Search—Enables you to reduce an Alert Report to alerts that match your search criteria.
Searches are performed as case-insensitive partial string matches, whereas Filters are
performed as exact matches. Refer to Search for Alerts
• Duration—Enables you to reduce an Alert Report to alerts that occurred during a specified
time period.
• Group— Enables you to summarize alerts by selected columns. The result will display the
selected columns and the number of alerts that match each available value within those
columns. Grouped information can be displayed in a table or graph form.
• Filtered By—Displays what you have selected at the Quick Summary to filter alerts. Refer to
Filter Alerts
. Click an x to delete a filter.
.
•
•
•
•
Fidelis XPS User Guide Version 6.0 Alerts 29
Refresh—Refreshes the Alert Report page.
PDF— Enables you to save the alert report as a PDF document. The generated PDF will
include all elements on the current page of your Alert Report. Refer to Create PDF Reports
for Alerts.
E-mail—Enables you to send the Alert Report via e-mail.
Trending—Enables you to view and control alert trend charts. Refer to Trending.
Page 38

•
Fixed (Relax) Columns—When the report contains many columns, you can select Fixed
Columns to resize columns to better fit within your page size, truncating some of the data in
the columns and replacing it with ellipses. Mouse over the ellipses to view the hidden
information. Relax Columns displays all information in each colum n which may require
horizontal scrolling in your browser window to view all information.
System Reports for Alerts
System Reports are a built into CommandPost and available to all users who can access the Alert
Report. Seven system reports are available:
Table 6. System Reports
Report Description
Default The default report provid es crucial alert information that will be useful to most
users. This report will display all alerts sorted by Alert ID.
Summary The summary report is the most condensed report, offering simple alert
information in a uncluttered and easy to read manner. Enterprises who create
informative alert summaries in their rule definitions will benefit from this simple
report. This report will display all alerts sorted by Alert ID.
Violation The violation report is focused on the policy, rule, and action taken by the sensor.
It is useful for users most concerned with the actions taken by Fidelis XPS
sensors. This report will display all alerts sorted by Alert ID.
Alert
Management
Network The network report provides source and destination information in the primary
Label The label report displays label information in the primary rows. T his enables users
My Alerts My Alerts is identical to the Alert Management report, but includes data criteria to
The alert management report provides a summary of alert tickets and their status.
This report is most useful to alert managers who fully use the CommandPost
ticketing system. This report will display all alerts sorted by Alert ID.
rows. It is most useful to users focused on these aspects of the alerts. This report
will display all alerts sorted by Alert ID.
to see alerts that users tagged with specific labels. This report will display all
alerts sorted by Alert ID.
reduce alerts to only those alerts assigned to the user.
Search for Alerts
Searching alerts can be done by entering criteria in the Search dialog box within the Alert page
controls.
If the alert control buttons are not visible, click
to display them.
Searches differ from filters in the manner that the data is matched:
• Filters use an exact match to find alerts.
• Searches use a case-insensitive, partial string match to find alerts. Refer to Alert Search
Fields.
in the upper right corner of the Alert Report page
Fidelis XPS User Guide Version 6.0 Alerts 30
Page 39

Figure 12. Searchable alert fields
1. Click Search within the Alert control bar.
2. Enter search terms
phrases to find within alert information.
3. Select a search field
4. Include or Exclude
in the Search For: text box. The search term is a simple phrase or set of
at the In: pull down menu.
incoming alerts.
Enter Search Terms
The following guidelines apply to entering search terms:
• Searching for term will match any alert containing term in the chosen field. This will match
alerts with words such as term, terminate, and exterminate.
Entering multiple words such as:
term1 term2
matches alerts containing both term1 and term2. The terms can be found in any order and
with any amount of separation between them.
• You can search on multiple Alert IDs and for multiple Any, Source, or Destination Ports by
separating entries with a comma. For example,entering AlertID1,AlertID2 would find alerts
with both ID numbers.
• You can specify a range for Alert ID and for multiple Any, Source, or Destination Ports by
using a hyphen.
• The use of quotes around a phrase will be treated as a single search term. The phrase “term1
term2” will match any alert containing the exact phrase within the quotes. Any spaces in the
phrase will match any space characters in the alert, including a space, a tab, a new line, etc.
Matching is done on the character boundaries, not word boundaries. Therefore, a phrase of
“top secret” will match an alert containing a phrase such as “stop secrets.”
• Multiple phrases such as a “literal phrase 1” and a “literal phrase 2” can be included in the
Find field. This will match any alerts containing all of the phrases listed.
• You can combine word-terms and phrase-terms. Any combination is allowed, such as:
“literal phrase 1” word word1 word2 “literal phrase 2”
• Matching does not consider the order of the terms, only that all are found within the search
field.
• Placing a minus sign (-) before a word or a literal phrase changes the meaning to “match all
alerts that do not contain” the specified word or phrase. Any combination of positive (no
Fidelis XPS User Guide Version 6.0 Alerts 31
Page 40

minus) and negative (minus) terms is supported.
For example:
Top –secret matches alerts that contain the word top but do not contain the word secret.
“top secret” –confidential –personal matches alerts that contain the phrase “top secret” but
contain neither confidential nor personal.
top secret –”confidential document” matches alerts that contain the words top and secret but
do not contain the phrase “confidential document.”
Important: the following also applies to all searches:
• All searches are case insensitive.
• There is a limit of 40 terms (words or literal phrases). If more terms are entered, the 41st and
beyond will be ignored.
• If Go is pressed without entering a search term, the Alerts List reappears. However, entering
unknown in the Find text box, substitutes for an empty string in the Country, Filename, From,
To, and User fields.
• Search performance is typically fast, even with very large alert databases. With a database of
over 2 million alerts, search will typically respond in a few seconds. Exceptions are searches
over Forensic Data, Session Attributes, and Owner fields, which may require considerable
time to execute.
Table 7. Alert search fields
Alert search fields Description
Action Search is applied over the action field.
Alert ID Enables you to search for specific alert ID numbers.
Country: Any Searches for the specified country in either the source or destination country.
Note: Entering two or more countries in search criteria returns all entries
with any of the countries entered. For example if you do a country search
for France Afghanistan the search will return entries that have either
France or Afghanistan.
This applies to all country searches.
Country: Destination Searches for the specified country in the destination country.
Country: Source Searches for the specified country in the source country.
Filename Searches the name of the file that caused the violation. Will be empty if no file was
involved in the violation.
Forensic Data The search is applied over the data field of the alert, as shown in the Alert Details
page. Note that some alerts will not contain forensic data per policy definition.
From Searches the value of the From field.
IP Address: Any
IP Address:
Destination
Searches for any IP address: source or destination. Refer to Search IP Addresses .
Searches for the receiver’s IP address. Refer to Search IP Addresses
.
IP Address: Source Searches for the sender’s IP address. Refer to Search IP Addresses.
Label Searches for an alert label. The label search has one special feature: A search for the
term unassigned (with or without quotes) will display all alerts that have not been
assigned a label
Fidelis XPS User Guide Version 6.0 Alerts 32
Page 41

Alert search fields Description
Management Group The search is applied over the alert management group field. An alert can belong to
only one alert management group. If you search for multiple groups, the search will
match an alert containing any one of the groups (most other search fields require a
match of all terms). For example, a management group search for: Group1 Group2
yields all alerts belonging to either Group1 or Group2.
Owner An alert can belong to only one owner. However, if you enter a search with multiple
terms, the search will match an alert containing any one of the terms (most other
search fields require a match of all terms). For example, a search for:
Owner1Owner2 yields all alerts belonging to either Owner1 or Owner2.
Also, a search for the term unassigned (with or without quotes) will display all alerts
that have not been assigned.
Policy The search by policy is applied over the name of the violated polic y per alert. There
are no special features for policy searches.
Port: Any Searches on any port, either source or destination.
Port: Destination Searches on the sender's port number.
Port: Source Searches on the recipient's port number.
Protocol An alert can only contain one protocol. Therefore, a search containing multiple terms
will match an alert that matches any one of the terms (most other search fields
require a match of all terms). For example, a protocol search for: ssh http yields all
alerts found over either SSH or HTTP.
Resolved IP Address This search returns alerts where the source or destination address of the alert
matches the resolved DNS name. Note that the text provided to the search may
match several resolved names. Search results improve when the text entered in the
Find text box is as specific as possible.
Rule This search is applied on the Rule field.
Session Attributes This search is performed over the Channel Attributes of the alerts. The value in the
Find text box will match the name of a protocol or file format for which attributes are
available, the attribute name, or the attribute value. Refer to chapter 4 in the Guide to
Creating Policies for details about protocol or file formats and their attributes.
Summary The search by summary is applied over the summary field of the alert.
Target Target refers to the intended destin atio n of the information. The value is protocol
specific. Examples include the destination domain name, server name, or host name.
Target is based on extracted protocol information and not based on the IP address of
the data. In many network configurations, the IP address may be an internal address
corresponding to a local NAT server or proxy, whereas the target represents the
intended destination of the data.
To Searches the value of the extracted To field.
User Searches the value of the extracted User field.
UUID Enables you to search for a specific alert UUID number. This is an exact search.
Fidelis XPS User Guide Version 6.0 Alerts 33
Page 42

Search IP Addresses
There are four methods available to search for an IP address:
• Alert source
• Alert destination
• Both source and destination
• Resolved IP address.
Search Source, Destination, or Any IP Address
Searching can be performed by entering an IP address in the Search For: text box using CIDR
representation. The following formats are supported for single addresses or address ranges.
• 192.167.10.5 finds this exact IP address within the selected field (source, destination, or
both).
• 192.167.10.5/24 applies an IP address mask of 24 bits to the address. This includes all IP
addresses within the 192.167.10 subnet, from 192.167.10.0 through 192.167.10.255. Replace
“24” with any value 0-31 to obtain the appropriate mask.
• 192.167.10.5-192.167.10.15 provides a range of IP addresses and returns all matches within
the range and including the end points. In this example, the search matches any address
within the range of 5 through 15.
• 192.167.10.5,192.167.10.15,192.167.10.25 provides a list of specific IP addresses to match.
A comma must be placed between each IP address in the list. No spaces are allowed. The list
has no limit with regard to the number of IP addresses provided, however, long lists will
require more processing time. A range (using a colon to separate the end points of the range)
is preferred over long lists due to search performance.
• In all cases, IPv6 addresses may be substituted for the IPv4 addresses shown in the
examples above.
Search Resolved IP Addresses
This search returns alerts where the source or destination address of the alert matches the
resolved DNS name. Note that the text provided to the search may match several resolved names.
Search results improve when the text entered in the Search text box is as specific as possible.
Notes on IP address searches
Comma and dash separated strings must contain no spaces for the parser to behave correctly. As
an alternative, the entry may be encapsulated in quotes (“) in which case the spaces do no impact
behavior. For example, “192.167.10.5 - 192.167.10.15” would create an IP address range.
If the search string contains malformed IP addresses, the search will ignore the entry. In the case
of a single address search, no alerts will be found. In the case of a list, malformed addresses will
be ignored. In the case of a range, the search will revert to a single address search using the one
legal address or will return nothing if both ends of the range are malformed.
Fidelis XPS User Guide Version 6.0 Alerts 34
Page 43

Duration
To specify a time period for alerts, click Duration at the alert control bar and select a value at the
Duration list. When you click Go, all alerts during the selected time period will be listed.
Figure 13. Specifying time periods
Duration selections include:
• All Alerts: the default setting of the Alert Report.
• Last Login: reduces alerts to those that have occurred since the last time you logged into
CommandPost.
• Last 24 Hours, 7 Days, or 30 Days: provide shortcuts to reduce alerts to the prior day, week,
and month.
• Specific Hours: will display a text box to which you can enter a two digit number, N. Only
alerts occurring in the past N hours will be displayed.You can use this feature to reduce alerts
by partial days with granularity of one hour increments.
• Specific Days: will display a text box to which you can enter a two digit number, N. Only alerts
occurring in the past N days will be displayed. You can use this feature to reduce alerts to
those that occurred during a specific number of days.
• Specific Date: you can enter a date in the text box or click
your alerts to those that occurred on the specified date. Dates must be entered in the form of
mm/dd/yyyy.
• Date Range: you can enter a range by entering start and end dates in the text boxes or click
to select a date. This reduces your alerts to those that occurred during the specified date
range, including the start and end dates. Dates must be entered in the form of mm/dd/yyyy.
to select a date. This reduces
Include or Exclude Incoming Alerts
Every access to the Alert Report presents live data as it is reported to CommandPost. If new alerts
are occurring on your network, this may distort your view of the data.
For example, you may click Next Page only to see the same set of alerts from the first page. This
occurs because the first set of alerts has been superseded by new alerts, moving them to the next
page. You will notice similar effects any time you apply filters, perform searches, apply column
sorting, change alert reports, or if you access alert details then return to the main report.
You can change this behavior by clicking the Include Incoming Alerts in the Search dialog bo x. By
default, this option is checked, meaning new alerts will be considered in all alert actions.
To change the behavior:
1. Click Search or Duration.
2. Uncheck the Include Incoming Alerts box and click Search.
Fidelis XPS User Guide Version 6.0 Alerts 35
Page 44

New alerts will not be considered in your activities within the Alert Report and Alert Details pages. If
you move to another section of the CommandPost, the behavior will revert to Include Incoming
Alerts on your next Alert page access.
Customize Alert Report
Click Customize to access the Custom Report page. From this page, you can search multiple fields
at the same time. Customize enables you to save current search, filter, duration, or group by
selections.
Using Customize to save criteria entered at the Alert Report page as a Custom Report enables you
to access the report later at the Alert Report page. Refer to Create Custom Reports
The new Custom Report is also available at the Reports>Manage>Report List. From the Report
List, you can edit the custom report, schedule it to run at specified times, or copy it to other users.
You can create other Custom Reports and make them available at the Alert Report page.
Group
This feature enables you to group alerts by information available in one or more of the primary
columns of your current alert page. For example, if you select protocols, alerts are grouped by
protocols. The total number of alerts for each protocol will be listed in the Count column.
Grouped alerts can be displayed in tabular or graphical form. Graphical forms include pi e charts,
bar charts, and stacked bar charts. You may choose the display most relevant to your analysis.
Group By enables you to more easily organize alert information. After grouping, the checkboxes on
the left side of the Alert Report page apply to the whole group. With one click, you can manage,
purge, or label thousands or even millions of alerts at once. The more alerts that you select, the
longer it will take.
To group alerts:
1. Click Group. The Alerts Group By dialog box displays.
.
I
Figure 14. Alerts Group By
Note: If the desired column is not displayed, select another report at Alerts.
2. Click one or more of the desired columns. Clicking Group By Columns selects or deselects all
available columns.
Note: Group by can take several minutes depending on the size of the alert database.
3. Select how the results will display at the View Results as list. You can select from Tabular, Pie
Chart, Bar Chart, and Stacked Bar Chart options.
4. Click Apply Group By.
Fidelis XPS User Guide Version 6.0 Alerts 36
Page 45

Figure 15. Group By results in a pie chart
After applying Group By, you can easily change the output between tabular and graphical output
options.
Displays a pie chart.
Displays a bar chart.
Displays a stacked bar chart.
Displays the alerts in a tabular format.
When alerts not grouped, these icons are disabled.
You can click a section of the pie chart, bar chart, or stacked histogram to see a list of alerts
represented by that section. For example, if you click on the portion of the pie chart representing
the HTTP protocol, a page displays with alerts that have HTTP protocol violations. At the initial
group by list, click a row to see a Distribution Summary for all other elements in the view’s primary
and secondary rows. The distribution summary can provide insight into areas where further group
analysis may be beneficial. For example, a Distribution Summary indicates 25 alerts found over
GOOGLEMAIL. Of these 25 alerts, you can learn that all are from the same sensor, two rules were
violated with a low severity and the alerts were from multiple sources to multiple destinations.
Fidelis XPS User Guide Version 6.0 Alerts 37
Page 46

Figure 16. Group By Distribution Summary
At the Distribution Summary page, you can:
• Click Group Details to see a list of all alerts in the selected row. This action is identical to
clicking a section of the associated graph.
• Click one of the Group By links in the Distribution Summary to group alerts again using this
new element in the group analysis. A new group-by page is generated.
Group Details
When you click a section of a group by graph or click the Group Details but ton within the group
distribution summary, you are taken to a page with ungrouped alerts, filtered by the criteria
associated with the graph section or row in the group table.
You may change the filter, search, and sort criteria as designed. The Group row displays a link to
Return to Group List. Clicking this link will restore the Group By settings that started your flow.
If you change the Group settings, the Return to Group List link will no longer be valid.
Create PDF Reports for Alerts
You can create a PDF of an Alert Report page to open and print immediately or save on your
workstation to retrieve later.
For alerts, the PDF report includes current alert data such as:
• Alerts in the currently selected report.
• Trending information is included if selected. The trending chart displays with alerts in the PDF
report.
• Group by information is included if selected. For example, if you group by Summary and
Protocol, then alerts are grouped by Summary and Protocol. If you select a chart to display
with the alerts, the graphics are included in the PDF report.
• The number of alerts in the current page size. For example, if you selected 25 for page size,
that is the number of alerts that will be in the PDF report.
• The alerts on the selected page. If you are on page 2 of the Alert Report, those alerts are in
the PDF report, not alerts from other pages.
To create a PDF report:
1. Click
2. Select to open the PDF report or to save it.
The PDF is available for your use.
Fidelis XPS User Guide Version 6.0 Alerts 38
.
Page 47

Trending
Trending enables you to graphically display the trend for all alerts within your current settings.
Filtering alerts, entering search or duration values, and groupi ng alerts will change the trending
display accordingly.
1. Click
Figure 17. Alert Trends
2. Select the Time Scale. You can select from the last 24, hours, the last 7, or the last 30 days.
You can also enter a date range.
Note: Any duration settings within your view or set at the Duration dialog box will
override this value. Refer to System Reports for Alerts
3. Click Check to persist trend graphs to keep the trending display. If this is not checked, the
trending display goes away if you navigate awa y from the Alert Report page then later return.
If checked, a trend graph will be part of your Alert Report page for every access, until this
setting is changed.
Note: Response time can slow if trending is selected. This depen ds on the number of
alerts within the specified time period and the number of op tions selected.
4. Click Select. Alert Trends displays. For example, if alerts are grouped by rule and severity and
a 7-day period is selected, then each trend line displays the trend for each violated rule.
Trending charts match colors with the group by charts and vary depending on the groups
selected. If one group is selected, then one color displays in the trending chart.
at the Alert Report. The Alert Trends dialog box displays.
or to Duration.
Fidelis XPS User Guide Version 6.0 Alerts 39
Page 48

Figure 18. Display of alert trends
Fidelis XPS User Guide Version 6.0 Alerts 40
Page 49

Alert Details
The most granular level for examining data is the Alert Details page. To access alert details,
click
Figure 19. The Alert Details page
The Alert Details page contains multiple sections, which can be hidden (or expanded) by clicking
the title bar of the section. Click expand all to display information in all sections. Collaps e all hides
all information.
Page View—Allows you display the Alert Details in one column or two. Viewing the alert in two
columns will maximize the information available and is most suitable for users with wide page
monitors. The same information is presented in both views. Click the appropriate icon to change
the view. The icon related to the alternate page view will be highlighted.
at the selected alert.
Note: Alert Details is only available to users with the correct privileges. Refer to User
Roles.
Fidelis XPS User Guide Version 6.0 Alerts 41
Page 50

Table 8. Sections in Alert Details
Alert Details Description
Alert Information Provides information about the alert including the severity, time/date of detection, age
(elapsed time since detection), the sensor that detected the alert, the application
protocol, alert label, and the action taken by the sensor.
This section also specifies the Format Type of the content whether it is sent within a
file, in the body of an e-mail, or in any other form. Alert Information also includes the
Format Data size to indicate a match of the size of the data.
Alert Information also includes information about the TCP session including source
and destination IP address and source and destination ports (presented as the
service). If alert compression has occurred, this table will include the number of events
that were compressed into this alert. Refer to Alert Compression
When the source or destination IP address is a registered host, its location will also be
presented. Location data includes the city, state, and country of the registered host. If
the IP address is not registered then location will not appear.
below.
Violation
Information
Related Alerts A single user action can create multiple alerts. When this occurs, related alerts will list
Provides the names of the policy and rule that were violated, in addition to the rule
summary.
The Matched on table provides a table of all fingerprints in the violated rule, along with
the fingerprint true/false match result. When the result is true, the table will include a
table of fingerprint matches that were detected. This table will vary by fingerprint type.
For example, if the fingerprint is a keyword content fingerprint, you will see a table of
all keywords that were found. If the fingerprint is an identity profile content fingerprint,
you will see a table of all pattern sets that were detected.
Each fingerprint in the Matched on table will be associated with a color code,
representing the highlight color for this fingerprint. Refer to Alert Highlighting
The highlighting can be disabled per fingerprint in this table. Alert highlighting can be
turned on or off. Click the icon next to Highlighting.
all alerts generated by the user’s actions.
There are two scenarios where this may occur:
• When multiple rules are violated. For example, you may have a rule to alert on
webmail and another to alert on the detection of Personally Identifiable
Information (PII). A user who sends PII data over webmail would violate both
rules and generate two related alerts (if both rules contained Alert in the action).
• A user may violate the same rule multiple times. For example, consider a PII rule.
If a user sends one webmail message with five attached files containing PII, this
will result in five related alerts, since each file violated the rule.
Refer to chapter 1 in the Guide to Creating Policies for more information about how
Fidelis XPS decodes and analyzes network traffic.
When related alerts exist, a list appears showing the severity, alert ID, summary, and
time of the alert. The Alert ID of a related alert can be clicked to access the details of
that alert.
below.
Alert Workflow
Log
Fidelis XPS User Guide Version 6.0 Alerts 42
Provides information about history of the alert ticket. In this section you can assign the
alert to a CommandPost user, change the alert management group, close the alert
ticket, and add comments to the alert workflow log. Refer to
The Alert Workflow Log.
Page 51

Alert Details Description
Decoding Path
and Channel
Attributes
Forensic Data
and TCP
Recorded
Session
Provides the Decoding Path and the information extracted by Fidelis XPS decoders.
The Decoding Path provides access to the original data detected by the sensor,
broken into each level of protocol or file format extraction. Refer to Decoding Path and
Channel Attributes below for a description of how you can use this information.
Each line in the Decoding Path represents the output of a Fidelis XPS decoder. These
decoders also extract attributes from the protocol or file that is being decoded. The
Channel Attributes present a table, per decoder, listing all extracted attributes.
Channel fingerprints are based on matching these attributes to those liste d in the
fingerprint. Refer to chapter 4 in the Guide to Creating Policiesfor more information
about channel fingerprints.
When the alert is generated based on directory information, this section will include
Directory Attributes extracted from your LDAP server. Refer to CommandPost
Configuration for information about how to configure which attributes are extracted
from your directory server.
This window presents the session data in two forms:
• Forensic data is the information extracted from the session that is used by
content fingerprint analyzers. You will see text, stripped of all formatting, that
represents a portion of the actual extracted data used by the sensor. You may
view this information in either a text or hexadecimal format.
• The recorded session is the entire session, recorded up to the configured limits.
This information is not stripped in any way and is presented as it was recorded
on the network (in client side and server side data). Refer to Configure an XPS
Direct Sensor for session limit settings.
Forensic data may not be present for every alert – especially those that are not based
on content fingerprints. Recorded session data will be present for most alerts, but not
immediately. The recorded session will not be available if it is corrupted or truncated in
any way, including when the session is prevented by an action taken by your policy.
Forensic data is recorded up to the point where a rule is violated. Sessions are
recorded in their entirety, which is why there may be a significant delay between the
alert generation and the arrival of recorded session data.
Viewing Forensic Data in text form is the default setting. When you change to view the
data as text, hexadecimal, or recorded session, your choice will become your new
default and will be applied the next time you access alert details.
Alert Highlighting
Every alert is triggered by matching some element defined in a fingerprint to some aspect of the
data transmission. Each fingerprint displayed in the Matched on table will be associated with a
color code. Within the Alert Details page, some element will be highlighted in this color so you can
easily determine the cause of the violation.
You will find highlighted information within Alert Information, Decoding Path and Channel Attributes,
Forensic Data, and TCP Recoded session sections of the Alert Details page.
It is possible that a single element can match more than one fingerprint. In these cases, the
highlight will be dashed lines over the text.
Moving your mouse over any highlighted element will display the name of each fingerprint that
matched this element. You can also click on a highlighted element to focus on it. Hitting TAB will
move the focus to the next highlight.
Highlighting may be disabled per fingerprint, by clicking the color coded box next to the fingerprint
name within the matched on section.
Fidelis XPS User Guide Version 6.0 Alerts 43
Page 52

Figure 20. Alert Details: highlighting
Scroll through Alert Details
From the Alert Report page, you can create a list of alerts by searching, filtering, or sorting. When
you enter the Alert Details page of any alert, CommandPost remembers the original list so that you
can scroll through it by clicking Previous and Next at the top of the page. As you move through alert
pages, the title refers to the location of the specific alert within the list.
Click Back to Alert List to return to the Alert Report page at the location of the current alert.
Scrolling is done within the parameters of the initial list, which includes the page size. If you scroll
outside of the page size, CommandPost returns to the database to find the next group of alerts.
Because CommandPost is working with a real-time list of alerts, any new alerts generated since the
original Alert Report list may alter the result. This will not occur if your list was generated by
unselecting Include Incoming Alerts. Refer to Include or Exclude Incoming Alerts
When you click on the ID of a related alert, CommandPost remembers the current list. Therefore,
clicking through related alerts does not change your place in the list. Previous, Next, and Back links
will work as if you did not click on a related alert.
.
Download Text File
Click Download text file to open the Alert Details page in a text file. This feature can be useful for
sending details of an alert by e-mail
Find Similar Alerts
Click on the Find Similar links within the Alert or Violation Information sections to find similar alerts.
This action will apply the selected values as filters and return you to the Alert Report page showing
the result of these filters. For example, clicking the Find Similar link next to the Rule displays a list
of alerts that violated the same rule.
Fidelis XPS User Guide Version 6.0 Alerts 44
Page 53

Figure 21. Finding similar alerts: clickable fields
Manage Label
Within the Alert Information section, you will see the label applied to the aler t. T o change the label
or to delete labels, click Manage Label. The process is identical to that described in Alert Labels.
Purge this Alert
Clicking Purge this alert will remove the alert you are viewing and the display will move to the next
alert in the list. If you purge the last alert in the list, you will be returned to the Alert Report page.
Once purged, the alert cannot be restored.
Alert Compression
In cases of high event activity, the sensor may compress multiple, very similar events into a single
alert to reduce the network communication load on the CommandPost-to-sensor connecti on.
When one alert represents several events, the Alert Details will include the Events/Compression
data in the Alert Information section. The associated value indicates the number of additional
events represented by this alert. For example, if the value is 8, then there were nine similar events,
the one displayed in the Alert Details plus eight similar events.
If the alert contains no compression, you will not see the Events/Compression data. This is the
typical case.
Decoding Path and Channel Attributes
The Decoding Path displays each level of decoding performed by Fidelis XPS during analysis of a
data transmission. Many levels of the decoding path can be clicked to provide a file of the decoded
transfer from that stage of the decoding process.
Which part of the decoding path you click determines the format of the file that is downloaded. The
result will either be a text file or binary file revealing the partially decoded session.
If you click on the line that includes a file name, the file will be opened. Your browser will choose
the appropriate application for the file, based on the file extension. Note that the file name is the
Fidelis XPS User Guide Version 6.0 Alerts 45
Page 54

exact name used in the original transmission which may indicate an incorrect file type. Your
browser may not be able to handle this situation.
In some cases, if the file has been encrypted, clicking on the file name will not provide the original
file. Usually, the next item in the Decoding Path list will provide the unencrypted file. Base64
encryption is the most common cause of this problem.
Let’s take, for example, the decoding path of an MS Word document that was zipped, attached,
and sent in an e-mail with multiple attachments. You can click on any part of the decoding path to
download the file as decoded up to that point. The table below describes what file is downloaded
for each part of the path.
Table 9. Decoding paths
Decoding path Files downloaded
SMTP[1] The entire SMTP message (including complete SMTP
headers)
MIME The body of the full MIME (Multipurpose Internet Mail
Extensions) message. This includes all MIME attachments.
multipart[3] The particular MIME attachment that contains the file
(including the part header).
MIME(cnd.1.zip) The MIME attachment without the part header (in this case,
a Base64-encoded file).
Base64 The Base64-decoded file (in this case, a zip file)
zip(cnd.1.doc) The unzipped file (in this case, an MS Word file).
ms-word The core content stripped of all Microsoft Word formatting
(analogous to copying the contents of the Word document
and pasting them into Notepad). The data from the last
element in the Decoding Path will match the Forensic Data
for the alert.
It is important to note that whether an entire file can be downloaded depends on how much of the
intercepted session is recorded in the Fidelis XPS alert database. The maximum amount of the
session that is recorded is specified in the TCP session forensics limit setting. Refer to Configure a
Fidelis XPS Direct Sensor for information on setting the TCP session forensic limit. If prevention is
turned on, the file will be truncated at the point where the session was terminated.
If the recording of a session ends in the middle of a file you wish to download, you may get a partial
file that cannot be read by the original application. For example, Fidelis XPS decoders and
analyzers can read a partial zip file even though the WinZip Windows application cannot.
If the recording of a session ends before a file you wish to download, that part of the decoding path
will not be clickable, and that file cannot be downloaded.
Fidelis XPS User Guide Version 6.0 Alerts 46
Page 55

Forensic Data
The forensic data represents the unformatted text on which content fingerprint analysis is
performed. When there is a match to a content fingerprint, you will see the matched information
highlighted.
Figure 22. Alert Details: Forensic Data
The forensic data window is limited to 16K bytes of data. The information in the Matched on table
within the Violation Information section of the Alert Details page includes the entire analyzed buffer
which may be bigger than the data shown in the forensic data window. For this reason, in some
cases, the number of highlights in the forensic data may not match the numbers shown in the
Matched on table.
The forensic data buffer begins near the occurrence of the first matching data. In some cases, the
forensic data will only represent a portion of the original data transmission and it may not start from
the beginning of the data. The entire data transmission is available in the recorded TCP session.
Recorded TCP Session
A verbatim session recording is available from the Alert Details page. Click View recorded TCP
session link in the Forensic Data table to view the Recorded TCP Session.
The View recorded TCP session link will appear as soon as the session is terminated or completed.
In cases where the session is not complete or there is some other kind of session corruption, this
link will not appear.
The recorded TCP Session contains session information and verbatim transcripts of both the client
and server halves of the session.
Fidelis XPS User Guide Version 6.0 Alerts 47
Page 56

Figure 23. Alert Details: Recorded TCP Session
Session Information
Session information includes client and server IP address (with resolved DNS names if possible),
start and end times of the session, session duration, and the total size and number of packets of
both the client and server halves of the session.
Note that the total size and number of packets includes all packet retransmissions, so this number
may exceed the size of the recorded session.
Client and Session Server Transcripts
The client and server session transcripts are shown exactly as reassembled by Fidelis XPS. If the
total size of the session exceeds the Alert Recorded Object Limit setting, the transcript sizes may
be less than the total session. You can change this at the configuration page for your sensor. Refer
to Configure a Sensor
The transcript is in raw form. No content decoding of any kind is shown, so if all or part of the
session is encrypted, encoded, compressed, or in some other way transformed it may not be
legible. Most high-level protocols like SMTP and HTTP are composed of la rgely human-readable
exchanges so this information can be very useful in investigating network and information handling
policy violations.
It is possible to download the complete client and server transcripts by clicking on the Client Data
and Server Data links, respectively. The complete transcript is downloaded regardless of the Show
Amount setting below. The transcripts are downloaded as files with a .bin extension as the data
may be binary data.
.
Show Amount
It is possible to vary the length of the transcript displayed in the recorded TCP
Session page. Enter the number of kilobytes you wish to see in the Show KB text box and press
enter. This setting only affects the number of bytes displayed in this page.
Fidelis XPS User Guide Version 6.0 Alerts 48
Page 57

Tune Rules from an Alert
When reviewing alert details, you can create a rule exception based on the alert's attributes. For
example, to suppress all alerts from a specific location, you can access the rule tuning interface at
the alert details page to modify the rule and make the identified location an exception.The rule
tuning interface is a four-step wizard that enables you to create the rule exceptions.
From the Alert Details page:
1. Click Tune Rule. The first page of the wizard lists attributes of the current alert.
Figure 24. Tune Rule: Alert Attributes
2. Select the fingerprint type: IP Address, Country, Alert Information, and Channel Attributes.
The available options change depending on the type of fingerprint se lected.
• IP Address enables you to create an exception based on the alert source and destination
IP addresses. Choosing both will create an exception for transfers from the source IP to
the destination IP, but not the reverse. Choosing one will create an exception for all
transfers from/to the source/destination IP address.
• Country enables you to create an exception based on the alert source and destination
countries. Choosing both will create an exception for transfers from the source country to
the destination country, but not the reverse. Choosing one will create an exception for all
transfers from/to the source/destination countries.
• Alert Information enables you to create an exception based on the source and destination
TCP ports and the application protocol. Selecting more than one option will create an
exception when all selected items are found in network traffic. For example, selecting
Source TCP port 8080 and protocol HTTP will create an exception for HTTP detected
from port 8080 on the source. It will not match traffic from port 8080 on other protocols
nor will it match HTTP on other ports.
• Channel Attributes enables you to create an exception based on a ny channel attribute
extracted from the alert. Choosing more than one attribute will match any one of the
attributes found in network traffic. For example, choosing HTTP command = “GET” and
HTTP URL = a specific URL will match all HTTP get requests and all accesses (GET or
POST) to the selected URL. To match the combination, you will need to use the Policy
interface, create separate fingerprints for each attribute, and logically combine them in
the rule expression. Refer to Create an Expression in the section: Define a Rule
3. Select at least one attribute and click Next. The Modify Rule screen displays with the current
rule and its expression.
.
Fidelis XPS User Guide Version 6.0 Alerts 49
Page 58

Figure 25. Tune Rule: Modify Rule
4. Select from the following options. Available options vary depending on the attributes selected.
• Add attributes to the fingerprint [fingerprint name].
One or more fingerprints are available for modification. The list of fingerprints are those
that have been previously modified by the Tune Rule wizard and were marked as
exception fingerprints. If there are no such fingerprints in the rule, this option is not
available. Selecting this option will add the selected attributes to the chosen exception
fingerprint. The fingerprint will be modified not the rule expression.
• Add attributes to a new fingerprint.
Enter a name for the new fingerprint. This new fingerprint will be added to the rule
expression as an exception.
• Add attributes to the [fingerprint name] fingerprint in the rule.
One or more fingerprints are available for modification. The list of fingerprints are all
applicable Channel, IP Address, or Country fingerprints in the rule excluding those that
were previously modified by the Tune Rule Wizard (refer to the first option). Selecting this
option will add the selected attributes to the chosen exception fingerprint. The fingerprint
will be modified not the rule expression.
• Add attributes to an existing fingerprint to be included in the rule.
Select an existing fingerprint to be added to the rule. The drop down list includes all
applicable fingerprints not in the rule. The fingerprint will be added to the rule expression
as an exception.
5. Click Next. The tuning summary displays with the revised rule expression and a list of
attributes that will be added to the selected fingerprint.
Fidelis XPS User Guide Version 6.0 Alerts 50
Page 59

Figure 26. Tune Rule: tuning summary
6. Review your selections.If these are the changes you want to implement click Submit . Click
Back to change your selections. The last page of the wizard tells you that the rule was
modified.
Click the rule name on the last page of the wizard to review the rule in the editor and make any
needed changes.
You will need to update the sensor for these changes to take effect. You can access the update
page by clicking Update on the last page of the wizard or by going through the Policies link on the
main navigation bar. Refer to chapter 9 in the Guide to Creating Policies.
Fidelis XPS User Guide Version 6.0 Alerts 51
Page 60

Chapter 5 Understand and Manage
Quarantined E-Mails
The Quarantine Management page displays all e-mails that are currently held in a quarantine
queue by a Fidelis XPS Mail Sensor. Click Reports>Quarantine to access this page.
E-mail is quarantined when it violates a rule that specifies the action of alert and quarantine.
Quarantined e-mail resides on the Mail queue until a quarantine manager takes action, or until the
e-mail expires.
Figure 27. Quarantine Management
The information about each e-mail includes the message ID, and the From, To, Subject, and Time
information.
Understand Fidelis XPS Mail Quarantine
The Mail sensor operates on e-mail messages. Due to the nature of e-mail, the Mail sensor can
analyze an entire e-mail at once, and take action if policy violations are found.
Most other Fidelis sensors operate on data in flight. They cannot analyze an entire transfer, but are
operating on data as it passes through the analyzer. This is an important difference in
understanding how a Mail sensor works and how managing quarantined e-mail differs from
managing alerts from other types of sensors.
As an example, consider a transfer of information that violates multiple rules. One example is an email message containing attachments; the body of the e-mail may violate one rule, while an
attachment violates another. A second example is an Instant Messenger session where the chat
content violates one rule, while a file transferred over the same IM session, violates a second rule.
The Direct sensor would detect the IM violations. It would issue an alert immediately after finding
the chat violation. It would issue a second alert at a later time, when the file transfer occurred.
These two rules may have required different actions and each action would be taken. For example,
the chat violation may result in an alert, while the file transfer may result in preventing the session.
Both actions are taken at the time the violation is determined.
The Mail sensor operates differently in this situation. Because e-mail is delivered as a single entity
from mail server to mail server, the Mail sensor can analyze all content at one time. Therefore, only
one action is taken for the e-mail, even if multiple rules are violated and each rule requires different
action.
The Mail sensor applies the following priority to e-mail actions:
• Quarantine takes first priority. Any e-mail that violates one or more rules with the Quarantine
action will be quarantined.
• Prevent has second priority. Any e-mail that violates one or more rules with the Prevent action
will be prevented (unless it also violates one or more rules with the Quarantine action).
• Reroute has third priority. If other actions such as quarantine are detected, they are taken.
If the quarantine action is taken, the following occurs:
Fidelis XPS User Guide Version 6.0 Quarantine E-Mails 52
Page 61

• The e-mail is placed in the quarantine queue on the Mail sensor. It remains here until a
person responsible for quarantine management decides to deliver or discard the email, or
until the message expires. Contact Technical Support to change the default expiration of 14
days, if needed.
• Information about the e-mail message, and all associated alerts, is transferred to
CommandPost where it can be viewed by a quarantine manager. The action for each alert
refers to the action taken by the Mail sensor.
Note: This action may be different than the action specified by the rule due to the
prioritization described above.
• Each alert is assigned to the alert management group defined by the rule.
• A quarantine manager assigned to the Mail sensor that holds the e-mail in quarantine, can
view the message, and take action.
• Alerts and quarantined e-mail are managed independently. E-mail actions will remove an email from quarantine and if All is selected, can remove all associated alerts. Removing all
alerts associated with a quarantined e-mail purges these alerts from Fidelis XPS. Selecting
None keeps associated alerts available at Alert Report. Refer to Deliver or Discard
Quarantine E-mail.
• Most quarantined e-mail will have at least one alert. The only exception will be when alert
compression becomes active. Refer to Alert Compression
generates many alerts, it will begin to compress similar alerts to relieve congestion between
CommandPost and the sensor. In some rare cases, all alerts from one e-mail will be
compressed together with other similar alerts, and therefore not be available on
CommandPost. The quarantined e-mail will always be available.
Quarantined e-mail is another key difference between the Mail sensor and other sensor types.
Other sensors make a decision to prevent, alert, or throttle immediately based on analysis. The
Mail sensor offers the quarantine option, which defers the final decision to a person who reviews
the offending message. Therefore, persons with quarantine management responsibility may need
to take immediate action to avoid unnecessary delays in business communication. The Mail sens or
offers the ability to notify quarantine managers immediately upon taking the quarantine action.
Refer to Fidelis XPS Mail
for configuration options.
for details. When the sensor
The Quarantine Report
The Quarantine report displays a summary of information for each quarantined e-mail. The From,
To, and Subject columns provide information about the e-mail message held in quarantine. You
may click the row of an e-mail to view expanded information.
Note: Navigation is performed the same as it is in the Alert page. Refer to Navigate
Alert Pages.
Figure 28. Expanded quarantine information
Fidelis XPS User Guide Version 6.0 Quarantine E-Mails 53
Page 62

The expanded information includes the message ID, time stamp, and the sensor. Information about
any corresponding alerts also displays.
• Quarantine Details: Click
mail.
• Alert Details: Quarantined e-mails can have alerts associated with them. Click an alert
number at the Quarantine Details page or at the Quick Summary for the quarantined e-mail.
The Alert Details page displays with information for the alert. Refer to Alert Details for more
information. Any changes made at the Alert Details page will only affect the selected alert and
not the quarantined e-mail or any other alerts generated by the e-mail.
next to the e-mail to see the Quarantine Details page for that e-
Take Actions on Quarantined E-Mails
Click the check box next to one or more quarantined e-mails to select them. Clicking check boxes
again deselects the e-mails. Clicking the check box at the top of the Quarantine Management list
selects (or deselects) all e-mails on the current page.
The following actions may be taken on the selected alerts:
• Change Status. Refer to The Alert Workflow Log
• Change Alert Management Group. Refer to The Alert Workflow Log.
• Deliver or Discard the message. Refer to Deliver or Discard Quarantined E-Mail
options also enable you to purge alerts associated with the quarantined e-m ail.
.
Deliver or Discard Quarantined E-Mail
You can choose to deliver or discard quarantined e-mail. Either action will remove the qu arantined
message from the sensor and CommandPost. You may choose to also remove all alerts
associated with the message or to leave all alerts on CommandPost.
. These
• If deliver is chosen, the e-mail is sent from the quarantine queue to the original recipient. An
e-mail is also sent to the original sender of the e-mail notifying them that their e-mail was
delivered.
• If discard is chosen, the e-mail is removed from the quarantine queue and not sent to its
original recipient. An e-mail is sent to the original sender of the e-mail notifying them that their
e-mail violated policy and was not delivered.
• A dialog box displays asking if you want to remove all of the alerts associated with this
message. If you choose All, the alerts are purged from CommandPost. Make sure that you
really want to discard all alerts before proceeding.
If you select None, any associated alerts remain available on the Alert Report page. T he
quarantined e-mail is delivered or discarded.
• If the quarantined e-mail does not contain associated alerts, a dialog box asks if you want to
continue. Click OK to continue to deliver or discard the quarantined e-mail.
After you deliver or discard the quarantined e-mail it is removed from the quarantine qu eue and will
no longer appear on the Quarantine Management page.
Search Quarantined E-Mails
Searching for quarantined e-mails can be done by entering criteria in the control section at the top
of the Quarantine page. If the page controls are not visible, click in the upper right corner to
open them. Searches use a case-insensitive, partial string match to find quarantine e-mails. The
search term is a simple phrase or set of phrases to find within quarantine information.
1. Enter search terms in the Search For: text box. Refer to Enter Search Terms for Alerts
specific search guidelines.
2. Select a search field at the In: pull down menu.
for
Fidelis XPS User Guide Version 6.0 Quarantine E-Mails 54
Page 63

Figure 29. Searchable Quarantine fields
You can search for quarantined e-mails by searching for specific text strings in the following fields:
Table 10. Quarantined E-mail: search fields
Quarantine search
Description
fields
Message ID The ID the system assigns to the quarantined e-mail.
Sensor T he Mail sensor on which the e-mail resides.
Sender Any part of the From line of an e-mail message.
Recipient Any part of the To line of an e-mail message.
Subject Any part of the subject line of an e-mail message.
Management Group Any part of the management group associated with alerts.
Forensic data Any part of the data captured from the e-mail.
Refer to Alert Search Fields for more specific information about how these searches are applied.
3. Include or exclude Incoming quarantined e-mails.
Every access to the Quarantine page presents live data as it is reported to CommandPost. If
new quarantine e-mails are occurring on your network, this may distort your view of the data.
For example, you may click Next Page only to see the same set of quarantined e-mails from
the first page. This occurs because the first set of quarantined e-mails has been superseded
by new quarantined e-mails, moving them to the next page. You will notice similar effects any
time you perform searches, or if you access Quarantine Details then return to the Quarantine
Management page.
You can change this behavior by clicking the Include Incoming Quarantine in the Search
dialog box. By default, this option is checked, meaning new quarantined e-mails will be
considered. To change this behavior, uncheck the Include Incoming Alerts box.
4. Click Search. You can search without specifying a time period.
Fidelis XPS User Guide Version 6.0 Quarantine E-Mails 55
Page 64

Search Quarantined E-Mails using Duration
You can use Duration to reduce the list of quarantined e-mails to those that occurred within a
specified time range. Duration can be found in the control section at the top of the Quarantine
page. If the page controls are not visible, click
1. Click Duration to select a time period, If needed. The default value is all messages.
Figure 30. Quarantine search duration
Duration selections include:
• All Messages: the default setting of the Quarantine page.
• Last Login: reduces messages to those that have occurred since the last time you
logged into CommandPost.
• Last 24 Hours, 7 Days, or 30 Days: provide shortcuts to reduce the messages to the prior
day, week, and month.
• Specific Hours: will display a text box to which you can enter a two digit number. You
can use this feature to reduce alerts by partial days with granularity of one hour
increments.
• Specific Date: you can enter a date in the text box or click to select a date. This reduces
your messages to those that occurred during the specified date. Dates must be entered
in the form of mm/dd/yyyy.
• Date Range: you can enter a range by entering start and stop dates in the text boxes or
click to select a date. This reduces your messages to those that occurred during the
specified date range, including the start and stop dates. Dates must be entered in the
form of mm/dd/yyyy.
2. Include or exclude Incoming quarantined e-mails.
3. Click Search.
in the upper right corner to open them.
Fidelis XPS User Guide Version 6.0 Quarantine E-Mails 56
Page 65

Advanced Search for Quarantined E-Mails
An advanced search gives the ability to search on two or more fields simultaneously.
1. Click Advanced Search. The Quarantine Report Editor displays.
Figure 31 . Quarantined e-mail: advanced search
2. Enter search criteria into the search fields.
Table 11. Quarantined E-mail: advanced search fields
Field name Description
Sensor(s) From the sensor box, choose a Fidelis XPS sensor or Ctrl-click to
choose multiple sensors.
Interval Specify a time interval to search: 1 hour to 96 days.
Date Specify a date. If you also specify an interval, the report searches
from this date and includes any interval times. For example, if you
enter September 1 as the date and select an interval time of 10 days,
the report searches from September 1 through the preceding 10
days.
Sender Any part of the From line of the e-mail m essage.
Recipient Any part of the To line of the e-mail message.
Subject Any part of the subject line of the e-mail message.
Forensic Data Enter search terms to search within Forensic Data.
3. Click Run Report to retrieve reports that match your search.
Fidelis XPS User Guide Version 6.0 Quarantine E-Mails 57
Page 66

Quarantine Details
Click next to the quarantined e-mail to access Quarantine Details. You can view the original email message, a list of any attachments, and alerts associated with this e-mail.
Note: Quarantine Details is only available to users with the correct privileges. Refer to
User Roles
.
Figure 32. Quarantine Details
Users with full privileges to quarantine management can choose to deliver or discard the
quarantined e-mails. Refer to Deliver or Discard Quarantined E-Mail
Users with ticketing privileges can access the Message Workflow Log to make changes to alerts
associated with the quarantined e-mail. The alerts may be assigned to individuals or groups,
closed, or commented. Any ticket action applies to all alerts associated with the quarantined e-mail.
Fidelis XPS User Guide Version 6.0 Quarantine E-Mails 58
.
Page 67

Chapter 6 Manage Reports
Manage enables you to access and manage all your reports from one location. You can use criteria
entered at the Alert or Quick Report pages and save these reports which are then available at the
Report List. You can continue to use these reports or include other criteria such as filters, duration,
columns, and group by to create new custom reports.
To access the list of your saved reports, click Reports>Manage. When you first access the list, it
displays the seven default system reports.If you have upgraded from a version of CommandPost,
the list will also contain entries related to any saved customer reports, quick reports, and views.
• System Reports – These reports ship with Fidelis XPS and include: Default, Summar y
Violation, Alert Management, Network, Label, and My Alerts. You can run these reports or
use them as the basis for a new custom report. If saved as a custom report, the original
system report is not affected. System reports are also available at the Alert Report page.
Refer to System Reports for Alerts
• Custom Reports –Customized reports allow you to control the contents and the display of
your report. From the Manage page you can run, modify, and schedule these reports. Refer to
Create Custom Reports
• Saved Quick Reports – These are Quick Reports (such as Alerts by rule or Data Discovery)
that were created and scheduled at the Quick Reports page. From the Manage page you can
run, modify, and change the execution schedule. Refer to Create Quick Reports
.
.
.
Figure 33. Manage page
Click a report to see report details. The following buttons also display depending on the report
selected.
• Run to view the report. This is active for all reports. Refer to Run Custom Reports
• Edit takes you to the Custom Report page to edit criteria and save the report under a new
name. Refer to Create Custom Reports
• Modify is available for saved Quick Reports and takes you to the Quick Reports page. Refer
to Create Quick Reports.
• Delete is available for Custom and Quick reports. Refer to Delete Reports.
• Schedule enables you to enter scheduling information. This button is active for Custom
Reports.Refer to Save and Schedule Custom Reports
• Modify Schedule also enables you to enter scheduling information and is a c tive for Quick
Reports. Refer to Save and Schedule Reports
• Copy enables you to copy a report and send it to other users. This button is active for Custom
Reports. Refer to Copy Custom Reports
Fidelis XPS User Guide Version 6.0 Manage Reports 59
.
.
.
.
.
Page 68

Create Custom Reports
Custom Reports are only available to the user who creates the report. These reports can be
modified, scheduled for automatic execution, and copied to other users.
There are several ways to begin creating a custom report:
• Click Customize at the Alert Report page. All alert search, filter, and view criteria is selected in
the Custom Report page. You can change any parameter and save it.
• Click the appropriate report at the Manage page and click Edit. The Custom Report page
displays with any criteria selected for the saved report. This enables you to create a new
Custom Report based on a system report or an existing custom report.
• Click Create New Report at the Manage page.
The Custom Report page contains the following sections that you can expand or collapse as
needed:
• Search provides an interface to identify alerts by a search rather than an exact match. Search
terms are typed into the available input fields.
• Filters provide an interface to identify alerts by an exact match of one or more attribute.
Values are selected by choosing one or more from the available lists.
• Duration provides an interface to identify alerts by time.
• Columns provides a control for the information available in your alert report.
• Group By provides a control to summarize and chart the results of your report. The fields
available for grouping are those chosen as your primary columns for the report.
Search
To search, enter criteria into one or more of the text boxes within Search. Searches use a caseinsensitive, partial string match to find alerts. Refer to Enter Search Terms
Figure 34. Custom Search: Search
Table 12. Search Fields
Search fields Description
Alert Id Enter a single alert ID, a comma-separated list of alert ID’s or a range. Ranges are
entered by a hyphen between the start and end of the range
UUID Enter a specific alert UUID number. This is an exact search.
.
Fidelis XPS User Guide Version 6.0 Manage Reports 60
Page 69

Search fields Description
Source Ip
Destination Ip Enter an IPv4 or IPv6 IP address, a comma-separated list of IP addresses, or a
Source Port Enter a TCP port number, a comma-separated list of port numbers, or a range.
Destination Port Enter a TCP port number, a comma-separated list of port numbers, or a range.
Summary The search is applied over the summary field of the alert.
Forensic Data The search is applied over the forensic data field of the alert, as shown in the Alert
Session Attributes This search is performed over the Channel Attributes of the alerts. The value will
Note: Search terms entered for Summary, Forensic Data, and Sessio n Attributes
follow the same syntax as described in Search for Alerts.
Enter an IPv4 or IPv6 IP address, a comma-separated list of IP addresses, or a
range. Ranges are entered by a hyphen between the start and end of the range.
Custom Search cannot accept resolved IP addresses, however, other information is
valid in Search IP Addresses
range. Ranges are entered by a hyphen between the start and end of the range.
Custom Search cannot accept resolved IP addresses, however, other information is
valid in Search IP Addresses
Ranges are entered by a hyphen between the start and end of the range
Ranges are entered by a hyphen between the start and end of the range
Details page. Note that some alerts will not contain forensic data per policy definition.
match the name of a protocol or file format for which attributes are available, the
attribute name, or the attribute value. Refer to chapter 4 in the Guide to Creating
Policies for details about protocol or file formats and their attributes.
.
.
Fidelis XPS User Guide Version 6.0 Manage Reports 61
Page 70

Filters
Filters use an exact match to find alerts. You can use filters to limit the report to only those alerts
that match your filter criteria. If you select multiple fields, all are applied to the filter. The more filters
that you select, the more narrow your results.
Figure 35. Custom Search: Filters
Table 13. Filters
Filter Description
Severity Select one or more severit y levels. Severity could be low, medium, high, or critical as
indicated by the rule that was violated.
Sensors Select one or more sensors. This refers to the name of the sensor that detected the
violation.
Protocols Protocol refers to the network protocol over which the violation was detected.
Source Country
Fidelis XPS User Guide Version 6.0 Manage Reports 62
Select one or more source countries.
Page 71

Filter Description
Destination Country Select one or more destination countries.
Rules Select one or more rules. This list displays all rules – even those not assigned to a
policy.
Policies Select one or more policies. This list displays all policies – even those not assigned to
a sensor.
Labels Select one or more alert labels.
Alert Actions Select one or more alert actions.
Assigned to Click to select an alert owner. All CommandPost users with alert management
privledges are listed.
Groups Select one or more alert management groups to which the alerts belong. All groups
available in CommandPost are listed.
Ticket Status Select one or more statuses for the alerts.
Ticket Resolution Select one or more resolutions for the alert s.
Duration
Duration enables you to specify a time period for your Custom Report and include trending
information.
Figure 36. Custom Search: Duration
Duration selections include:
• All Alerts: the default setting of the report.
• Last Login: reduces alerts to those that have occurred since the last time you logged into
CommandPost.
• Last 24 Hours, 7 Days, or 30 Days: provide shortcuts to reduce alerts to the prior day, week,
and month.
• Specific Hours: will display a text box to which you can enter a two digit number, N. Only
alerts occurring in the past N hours will be displayed. You can use this feature to reduce
alerts by partial days with granularity of one hour increments.
• Specific Days: will display a text box to which you can enter a two digit number, N. Only alerts
occurring in the past N days will be displayed. You can use this feature to reduce alerts to
those that occurred during a specific number of days.
• Specific Date: you can enter a date in the text box or click
your alerts to those that occurred on the specified date. Dates must be entered in the form of
mm/dd/yyyy.
• Date Range: you can enter a range by entering start and end dates in the text boxes or click
to select a date. This reduces your alerts to those that occurred during the specified date
range, including the start and end dates. Dates must be entered in the form of mm/dd/yyyy.
Click Trending to graphically display the trend for all alerts in your report Trending is based on the
time periods entered at Duration.
to select a date. This reduces
Fidelis XPS User Guide Version 6.0 Manage Reports 63
Page 72

Columns
Columns determine what information is displayed in the custom report. You must select at least
one primary and one secondary row to run or save a report.
• Column Choices lists all columns that you can include in a report. Refer to the table below
that describes system report columns.
• The Primary Row contains the columns that will display as the main columns for the custom
report. These columns can be sorted or used to group alerts.
• The Secondary Row contains additional columns that can be used to provide extende d
information on the Alert Report. When the report is run within CommandPost, each primary
column is show per alert. You can click the alert to open the the Quick Summary to access
your secondary information. Secondary row columns can be used to filter alerts and to
navigate to other pages by following clickable information fields. When the report is scheduled
for automatic delivery, secondary rows are not shown as part of the report.
• Sort By displays columns selected for the primary row or those selected for grouping. The
selection will determine the order of your report.
Figure 37. Custom Search: Columns
To set up columns:
• To add a new column: Select one or more choices from Column Choices and click
.
• To edit column order: Select one or more column and click
the desired order.
• To delete columns: Select one or more rows and click
Table 14. System report columns
Available
columns
Action The action taken by the sensor in response to the violation.
Alert Id Displays a unique ID belonging to an alert.
UUID The Universal Unique ID (UUID) is an alert ID that will be unique over all
Compression Indicates the number of additional events represented by an alert. Refer to Alert
Description
CommandPost systems. If an alert is archived and imported at a later date, the
UUID will not clash with the current set of CommandPost alert IDs, however the
Alert Id may.
Compression.
or until all columns are in
.
or
Fidelis XPS User Guide Version 6.0 Manage Reports 64
Page 73

Available
columns
Description
Country:
Destination
Country: Source The country to which the source IP address is registered.
Filename Displays the name of the file that caused the violation. Will be empty if no file was
Format Type Displays the data format type that caused the violation.
From Displays the value of the extracted From field. The value is protocol specific and
Group Displays the alert management group to which the alert belongs.
IP:Destination The IP address of the recipient of the data. When avail able, both IP and resolved
IP: Source The IP address of the sender of the data. When available, both IP and resolved
Label Displays the label assigned to the alert.
Owner The name of the CommandPost user to whom the alert has been assigned.
Policy
Port: Destination The destination TCP port number
Port: Source The source TCP port number
The country to which the destination IP address is registered.
involved in the violation.
most applicable to email or webmail. The value will be empty if the violation
occurred over a protocol that does not provide From.
host name are provided.
host name are provided.
The name of the policy that was violated
Protocol The application protocol on which the violating transfer occurred.
Resolution Displays the resolution to an alert that was closed. Resolution can take the
following values: Allowed, Action taken, No action taken, and False positive. Refer
to The Alert Workflow Log
Rule Dispays the name of the rule that was violated.
Sensor Displays the name of the sensor that detected the violation.
Severity Displays a level of severity. Severity could be low, medium, high, or critical.
Status Provides the status of an alert, which can be new, open, or closed. Refer to The
Alert Workflow Log.
Summary Displays summary text associated with the rule.
Target Target refers to the intended destination of the information. The value is protocol
specific. Examples include the destination domain name, server name, or host
name.
Target is based on extracted protocol information and not based on the IP
address of the data. In many network configurations, the IP address may be an
internal address corresponding to a local NAT server or proxy, whereas the target
represents the intended destination of the data.
Time Displays the time when the alert was detected.
.
Fidelis XPS User Guide Version 6.0 Manage Reports 65
Page 74

Available
columns
To Displays the value of the extracted To field. The value is pr otocol specific and
User Displays the value of the extracted User field. The value is protocol specific and
Alert Details
Icon
Description
most applicable to e-mail or webmail. The value will be empty if the violation
occurred over a protocol that does not provide To.
most applicable to protocols that require a login or user name. The value will be
empty if the violation occurred over a protocol that does not provide User.
Displays the
icon at the location of your choice in the Alert List .
Group By
Group by enables you to summarize your report by grouping selected values. The list of availa ble
columns matches your selection of primary columns. If you choose to group, you can also choose a
graphical output format of your report.
Group by enables you to group alerts in your report by selecting primary columns. Use CT RL-Click
to select one or more columns to group report results. You should also select a view for your report,
either tabular, pie chart, bar chart, or stacked bar chart. Refer to Group
.
Figure 38. Custom Search: Group By
Custom Report Controls
After entering criteria, you have the following options:
• Reset–removes all criteria.
• Run–runs the report after it is saved.
• Save–enables you to save the report with a unique name.
• Save & Schedule–enables you to save and schedule the report. Refer to Save and Schedule
Custom Reports.
Fidelis XPS User Guide Version 6.0 Manage Reports 66
Page 75

Run Custom Reports
Select the appropriate report and click Run. CommandPost displays any data that matches your
criteria in the Alert Report page. The criteria chosen will be displayed at the top of the report. All
normal operations of the Alert Report page are available. Refer to Understand and Manage Alerts
Click Customize to return to the Custom Report page.
Figure 39. Report Results
.
Edit Custom Reports
To edit a report:
1. Click Reports>Manage.
2. Select the appropriate report.
3. Click Edit. The Custom Report page displays with any previously selected criteria. Refer to
Create a Custom Report
4. Save your changes. Click Save to save your changes to this report. Enter a new report name
to save this report with a new name.
to make any needed changes.
Copy Custom Reports
Custom reports are created for the sole use of the CommandPost user who creates the report.You
may a copy a custom report to one or more CommandPost users that hold the correct privileges
(full access to reports and access to any sensors or groups chosen in the report).
You can send a copy of a Custom Report to one or more users. Users must have full access to
reports. Also, If the report being shared has a sensor or group selected, the user must have access
to the same sensor and alert management group. Refer to Manage User Roles and Groups
To copy a custom report:
1. Click Reports>Manage.
2. Select the appropriate report and click Copy.
.
Fidelis XPS User Guide Version 6.0 Manage Reports 67
Page 76

Figure 40. Copy a Custom Report
3. Enter a new report name if desired. The copy of the report is saved under this name and sent
to selected users. If the selected users already have a report with this name, CommandPost
will attempt to find a new name for the copied report. The name of the copied report will be
displayed upon successful copy.
4. Select one or more users from the list. Selecting your login copies the report to your list .
5. Click Copy.
The report is copied to the selected users and they can manage it as any of their other saved
reports. Any changes made will not affect your original report.
Save and Schedule Reports
You can save or choose to save and schedule a custom report.
To schedule a system report, you must edit it and save it as a custom report. To schedule a Quick
report, refer to Schedule Quick Reports
Save
To save a custom report:
1. After entering your report criteria, click Save at the Custom Report page.
2. Enter a unique report name.
3. Click the checkbox next to Save as alerts report to have this report available as a shortcut on
the Alert Report page.
4. Click Save.
Your saved report displays in the Manage page.
.
Save and Schedule
To save and schedule a custom report:
1. Click Save & Schedule at the Custom Report page.
If you select a Custom Report and click Schedule you can select scheduling information
without entering a report name or saving as an alerts report. Proceed to step 4.
2. Enter a unique report name.
3. Click the checkbox next to Save as alerts report to have this report available at the Alert
Report page.
4. Select a report delivery time.
5. Specify report frequency. This ranges from every day to specific days of the week or the
month. Report Frequency only determines the delivery schedule for the report and does not
change any times entered when creating the report.
Note: If you selected Date Range for the report, this date range will not change when
the report is executed. However, if you choose Last 24 hours, 7 days, or 30 days, the
time frame of the report will change with each execution.
6. Enter an e-mail address for report delivery.
Fidelis XPS User Guide Version 6.0 Manage Reports 68
Page 77

7. Choose to send the report as a pdf attachment to the e-mail. You can also send the report as
HTML or text. Click Save.
Note: If your report includes group by, trending, or pie or bar chart criteria, the Send
As option is not available. The report is sent as a pdf attachment.
To send as HTML: Click, HTML and select columns. Any columns that display in the column
list will send that information from your report in the e-mail.
For more information about columns, refer to Columns
To send as Text: Click Text. Select keywords and click Add Keyword. Keywords display in
the text box. If a user-defined format is chosen, type your format into the text box. Use
keywords to select the specific alert information to include in the report. If you desire a
comma-separated list, for example, enter each keyword from the drop-down list and type a
comma between each valid entry.
For more information about keywords, refer to Email user-defined
8. Click Save.
Your saved report displays at the Manage page. The Scheduled column at the Report List indicates
that your report is scheduled.
Delete Reports
To delete a report:
1. Click Reports>Manage.
2. Click Delete next to the appropriate report.
3. Click OK at the confirmation dialog box. The report is removed from the Manage page.
.
.
Fidelis XPS User Guide Version 6.0 Manage Reports 69
Page 78

Chapter 7 Create and Use Quick Reports
The Quick reports page provides access to commonly used reports of alert and session data.
Reports can be generated immediately or scheduled for periodic creation and delivery.
Click Reports>Quick then select a report by clicking on the corresponding link. Refer to Define
Quick reports.
Figure 41. The Quick reports page
Define Quick Reports
Quick reports enable you to answer key questions about policy violations detected on your network
and associated alert management activities.
These reports are organized under some of the more common concerns that administrators often
need to address.
• The Executive Summary provides four reports in one view to give you a snapshot of data
leakage violations.
• Select a date range.
• Select one or more sensors.
• Include the number of results to be considered. The graphics will display the top nine
results individually and sum the remaining results into a tenth result.
• Traffic Summary reports provide a view of violating network traffic compared to the total
traffic analyzed by Fidelis XPS sensors.
• Choose from available data filters.
• Select a date range.
• Select one or more sensors.
• Tickets provide an analysis of your alert management activities.Tickets reports can provide
a summary of ticket activity as well as a breakdown by current status and the resolution of
closed alert tickets.
• Choose from available data filters
• Select a date range.
• Select one or more sensors.
Fidelis XPS User Guide Version 6.0 Quick Reports 70
Page 79

• Select the chart type (for status and resolution reports only).
• Include data provides a table listing all results.
• Include trend adds a time chart to show the distribution of alerts over time. The trend
chart is based on the time the alert was detected on the network.
• Alerts Breakdown reports provide an analysis of your alerts.
• Choose from available data filters.
• Select a date range.
• Select one or more sensors.
• Include the number of results to be considered, up to 99. The graphics will display the
top nine results individually and sum the remaining results into a tenth result. The
chosen number will influence the size of the associated data table, if selected.
• Select the chart type: pie or bar chart.
• Include data provides a table listing all results. T he number of rows in this table is
determined by the Number Of Results value.
• Include trend adds a time chart to show the distribution of alerts over time. The trend
chart is based on the time the alert was detected on the network.
• Data Discovery provides a view into the source and destination of sensitive data crossing
your network. The report enables you to track the location of this information so that you
may take the necessary actions to secure it.
• Choose from available data filters. Choose to view results based on the sender
(source IP address), receiver (destination IP address) or the transmission path (IP
Pair).
• Choose to view results based on the sender (source IP address), receiver (destination
IP address) or the transmission path (any IP address).
• Select a date range.
• Select one or more sensors.
• Include the number of results to be considered, up to 99. The graphics will display the
top nine results individually and sum the remaining results into a tenth result. The
chosen number will influence the size of the associated data table, if selected.
• Select the chart type: pie or a stacked bar chart.
• Include data provides a table listing all results. The number of rows in this table is
determined by the Number Of Results value.
• Include trend adds a time chart to show the distribution of alerts over time. The trend
chart is based on the time the alert was detected on the network
Table 15. Quick reports
Report
Organization
Executive
Summary
Fidelis XPS User Guide Version 6.0 Quick Reports 71
Report Description
Executive
Summary
The Executive Summary provides a snapshot of your data
leakage violations by showing the percentage of traffic in
violation, and the policies, rules, and network protocols
contributing to the violations.
Page 80

Report
Organization
Report Description
Traffic Summary
Tickets
Alerts Breakdown
by Protocol
by Session
by Status The Tickets by Status report shows the total number of tickets
by Resolution The Tickets by Resolution report shows the total number of
Workflow Summary Workflow Summary displays alert management statistics including
by Policy
The Traffic Summary by Protocol report compares the total
number of TCP sessions analyzed by the selected sensors to
those that were in violation. The report breaks down the analysis
by application protocol.
For each protocol, you will see a comparison between compliant
and non-compliant sessions as well as a trend analysis of the
non-compliant sessions.
The Traffic Summary by Session report compares the total
number of TCP sessions analyzed by the selected sensors to
those that were in violation.
The report includes a trend analysis of all violations.
broken down by the current ticket status: New, Closed, or Open.
Time selections and trend graphs refer to the alert creation time.
closed tickets broken down by resolution: Allowed, Action taken,
No action taken, and False positive.
Time selections and trend graphs refer to the alert creation time.
the average time to progress ticket status andthe total number of
alerts processed You can run this report by user, group, rule, or
policy.
The Alerts by Policy report shows the total number of alerts
generated during a selected time period broken down by policy.
by Rule Alerts by Rule shows the number of alerts broken down by rule
for the selected time period.
by Severity The Alerts by Severity report shows the total number of alerts
generated during the selected time period broken down by
severity. Severity includes Low, Medium, High, and Critical.
by IP Address The Alerts by IP Address shows the total number of alerts
generated during a selected time range and broken down by
source, destination, or any IP addresses.The choice of IP Pair
results in a report showing communications paths.
by Directory
by Destination
Country
by Protocol The Alerts by Protocol report shows the total number of alerts
The Alerts by Directory report displays alerts for user attributes
extracted from your LDAP or Active Directory server. This report
depends on the CommandPost configuration settings for LDAP
Reports.
This report displays the number of alerts broken down by
destination country. This enables you to determine which country
the transmission was going to when the alert was generated.
generated during the selected time range summarized by
application protocol.
Fidelis XPS User Guide Version 6.0 Quick Reports 72
Page 81

Report
Organization
Report Description
Data Discovery Data Discovery
Note: The Traffic by Session and Traffic by Protocol reports are the only ways to view
the effects of policies that use the prevent option. This option prevents violating
sessions without generating an alert. The alert and alert and prevent options generate
alerts that display in all custom and alert reports.
Create Quick Reports
You can run any Quick Report by selecting it and clicking Run Report. Each report has several
customizable fields which can be left in their default setting or changed before clicking Run Report.
Note: Not all of the controls described in the steps below are available for each
report.
To create a Quick Report with more specific criteria:
1. Select all alerts or only those that match your selection. For example to run a report on
specific rules, uncheck All Rules at the Alerts by Rule page. A list of individual rules displays.
You can then select one or more rules on which to report.
2. Select a time range.
• The Time Range allows you to select from several options:Last 24 hours, Last 7 days,
Last 30 days, and Date Range.
• If you choose Date Range, text boxes for start and end date s display. These text boxes
only accept dates in the mm/dd/yyyy format. You can also click the Calendar icon to
display a calendar that allows you to choose the start and end dates.
3. Select one or more sensors. The Sensor list allows you to select either a single sensor or all
sensors.
4. Choose the number of results to include in your report. The graphic will include the top nine
results as individual sections of your bar or pie chart. All remaining results will be combined
into the last element of the chart labeled "Other."
5. Select a chart type to display your information – either pie chart or bar chart.
6. Click Include Data to include a tabular report of your data associated with each bar or pie
section in the graphical output.
7. Click Include Trend to display alert trends in your report during the selected time period for
each alert item.
The time reported by trending graphs and the time used in time range selection reflect the
time at which the network violation occurred.
8. If needed, click Reset to restore default values. You can also do the following:.
Data Discovery can be used to report the flow of sensitive
information observed by the selected sensors. The report breaks
alerts down by the combination of the violated rule and the IP
address (source, destination, or pair). If you select only a single
rule, you can use the report to discover the flow of that type of
information in your network,
• Click Run Report. The result displays in a p op-up window. You can print the report, save
it as a PDF, or send the report as an e-mail attachment. Refer to Create PDFs for Quick
Reports.
• Click Schedule to schedule this report for delivery to an e-mail address at a specified
time. Scheduling a Quick report makes it available at the Reports>Manage>Report List.
Refer to Schedule Quick Reports
• Click Customize. The Custom Report page displays with any criteria entered at the Quick
report page.Once you make the required changes you can save the report and manage
and schedule it as a Custom Report from Reports>Manage. Refer to Create Custom
Fidelis XPS User Guide Version 6.0 Quick Reports 73
.
Page 82

Reports. Saving a Quick report as a Custom Report does not affect the original Quick
report.
Note: Not all quick reports can be customized. Specifically, the Executive
Summary, Traffic Summary, and Workflow summary reports cannot be
customized.
Create PDFs for Quick Reports
All Quick reports can be saved as a PDF.
To create a PDF report:
1. Create and run a Quick Report. Refer to Create a Quick Report
2. Click Save PDF.
The PDF will open in your browser. You may choose to view or save the file to your local
workstation.
To send a PDF report via e-mail:
1. Enter an e-mail address at the Email text box.
2. Click Send Report.
The PDF report is attached to the e-mail and sent.
Schedule Quick Reports
You can schedule any of the Quick Reports to distribute automatically via e-mail at specified times
and intervals. You can use the default criteria when creating a report or select your own criteria.
To schedule a Quick Report:
1. Select one of the Quick Reports.
2. Keep the default report criteria or edit as needed. Refer to Create Quick Reports
3. Click Schedule. The Schedule Report dialog box displays.
4. Enter a unique report name.
5. Select a report delivery time.
6. Specify report frequency. This ranges from every day to specific days of the week or the
month. Report Frequency only determines the delivery schedule for the report and does not
change any times entered when creating the report.
7. Enter an e-mail address for report delivery.
8. Click Submit.
The report can be managed at Reports>Manage with all other saved reports .
.
.
Fidelis XPS User Guide Version 6.0 Quick Reports 74
Page 83

Chapter 8 Network Reports
The Network Reports page displays statistical information about the data flow observed by Fidelis
XPS sensors.
To display network statistics:
1. Click Reports>Network.
2. Select the time period.
3. Select the type of report.
4. Select the sensor.
5. Click Go.
The following reports are available depending on the type of Fidelis XPS sensors co nnected to
CommandPost. If a module you select is not present for the selected sensor, a message appears
stating that the module is disabled.
• TCP Resets
• Application Protocols
• IP Defragmenter
• Inline Module
• TCP Processor
• XPS Proxy
• XPS Mail
• XPS Connect
• XPS Web Walker
Each Network report provides an interactive performance graph that you can use to closely
examine what is occurring on your network at specific times. With the performance graph, you can
look at time periods from 10 minutes to 7 days.
To do this:
• Highlight an area of activity to expand that portion of the report.
Note how the time changes in the
measurements also change on the graph.
• Mouse over a line to see what occurred at that point and how frequently.
Network Statistics
button below the slider bar. Time
Fidelis XPS User Guide Version 6.0 Network Reports 75
Page 84

Figure 42. Network reports: interactive performance reports
• To return to a larger view, double click in the graph. Each time you double click, the time
displayed in the graph doubles.
• Clicking
displays the information available for the 7-day period, even if you
initially selected a shorter time period.
• Use the slider bar to see another portion of the graph.
Move the
to expand or contract the time period being examined. You can also move to another
part of the performance graph. The time changes in the
measurements on the graph also change.
Click
to switch the graph to linear or to logarithmic scale.
button and time
Fidelis XPS User Guide Version 6.0 Network Reports 76
Page 85

TCP Resets
CommandPost displays the following information about the sensor. If enabled, TCP Resets control
the insertion of TCP reset packets for prevention.
• Sample (size by time, showing when taken)
• Total processed packets since last restart
• Wire statistics (errors, dropped, invalid, received, and captured packets)
• Requests
• Resets
• Recent Resets
• Runtime (shows packets per minute transferred and reset)
Figure 43. Active Mode statistics
The legend contains controls to remove or restore the associated information from the graph
Fidelis XPS User Guide Version 6.0 Network Reports 77
Page 86

Application Protocols
CommandPost shows the following information about the Application Protocols observed by the
sensor:
• Sample (size by time, showing when taken)
• Total processed packets since last restart
• Packets by protocol: a graphical display and a numerical breakdown
• Bytes by protocol: a graphical display and a numerical breakdown, bits/sec
• Packets per second by service, graphically
• Bytes per second by service, graphically
• Volume of packets by size, graphically
The two charts in the Protocols row show observed protocols during the selected time frame at the
top of the page while the interactive chart in the Per minute row shows all protocols that had a per
minute rate greater than 1 for at least 10 minutes at some point during the past 7 days. Therefore,
the list of displayed protocols in the two rows may be very different.
Figure 44. Application Protocol statistics
The legend contains controls to remove or restore the associated information from the graph
Fidelis XPS User Guide Version 6.0 Network Reports 78
Page 87

IP Defragmenter
CommandPost shows the following information about the IP Defragmenter module:
• Sample (size by time, showing when taken)
• Total processed packets since last restart
• Wire statistics (errors, dropped, invalid, received, and captured packets)
• Config (shows current configuration and capacity of IP defragmenter module)
• Runtime (information about the IP defragmentation alerts per minute over the selected time
period)
Figure 45. IP Defragmenter statistics
The legend contains controls to remove or restore the associated information from the graph.
Fidelis XPS User Guide Version 6.0 Network Reports 79
Page 88

Inline Module
CommandPost shows the following information about inline and throttle modes.
• Sample (size by time, showing when taken)
• Total processed TCP packets since last restart
• Wire statistics (errors, dropped, invalid, received, and captured packets)
• Throttle drop: how many packets were dropped in response to the throttle action.
• Throttle TCP window cut: the number of packets on which the TCP window size was reduced
• Bytes of TCP packets: a graphical display and a numerical breakdown, bits/sec
• Throttle drop: the number of bytes in dropped packets
• Throttle TCP window cut: the number of bytes in packets on which the TCP window size was
reduced
Figure 46. Inline Module statistics
The legend contains controls to remove or restore the associated information from the graph.
Fidelis XPS User Guide Version 6.0 Network Reports 80
Page 89

Network Statistics
CommandPost displays the following statistical information about your network data flow by sensor,
including:
• Sample (size by time, showing when taken)
• Total processed packets since last restart
• Packets by protocol: a graphical display and a numerical breakdown
• Bytes by protocol: a graphical display and a numerical breakdown, bits/sec
• Packets per second by service, graphically
• Bytes per second by service, graphically
• Volume of packets by size, graphically
• Wire statistics (NIC errors, dropped and invalid packets)
Figure 47. Network statistics
The legend contains controls to remove or restore the associated information from the graph.
Fidelis XPS User Guide Version 6.0 Network Reports 81
Page 90

TCP Processor
CommandPost displays the following information about the TCP Session module:
• Sample (size by time, showing when taken)
• Total processed packets since last restart
• Wire statistics (errors, dropped, invalid, received, and captured packets)
• Configuration (shows current configuration and capacity of TCP Session module)
• Runtime (TCP sessions per minute over the past 12 hours)
Figure 48. TCP Processor statistics
The legend contains controls to remove or restore the associated information from the graph.
Fidelis XPS User Guide Version 6.0 Network Reports 82
Page 91

Proxy
CommandPost shows the following information about a Proxy sensor using the ICAP interface to
an external proxy server:
• Total transactions since last restart
• Total protocol errors
• Connection information: current, postponed, total, and rejected connections
• Traffic information: input and output traffic and buffers
• Proxy Traffic: a graphical display and a numerical breakdown, Proxy traffic per minute
Figure 49. Proxy server statistics
The legend contains controls to remove or restore the associated information from the graph.
Fidelis XPS User Guide Version 6.0 Network Reports 83
Page 92

CommandPost shows the following information about the Mail sensor:
• Number of connections
• Alerts generated
• Messages prevented
• Messages rerouted
• Messages that were appended to
• Messages that were appended to
• Messages with custom header added
• Number of messages
• Messages quarantined
• Messages rejected by IP white list
• Sender notification messages sent out
• Messages that did not violate policy
Figure 50. XPS Mail statistics
The legend contains controls to remove or restore the associated information from the graph.Hard
drive utilization displays a breakdown of usage on the Mail sensor.The Postfix Queue size indicates
how much space is available for quarantined messages.
The Postfix Queue graphic displays a breakdo wn of the postfix queue size. Refer to the Postfix web
site for more information.
Fidelis XPS User Guide Version 6.0 Network Reports 84
Page 93

Connect
The network report indicates how much traffic is on a Connect sensor and contains the following
information:
• Sample (size by time, showing when taken)
• Total processed packets since last restart
• Total Protocol errors
• Connection: Displays current and total connections
• Traffic: Displays total transactions, input and output traffic, and maximum input and output
buffers
Figure 51. Connect Statistics
The legend contains controls to remove or restore the associated information from the graph.
Web Walker
The Web Walker sensor downloads and analyzes the files stored on configured web sites, and
generates alerts when policy violations are detected. T he Network report reveals the Web Walker
activity in terms of local disk space used to store downloaded files
Figure 52. Web Walker Statistics
The legend contains controls to remove or restore the associated information from the graph.
Fidelis XPS User Guide Version 6.0 Network Reports 85
Page 94

Chapter 9 Manage Users, Roles, and Groups
CommandPost includes multiple concepts of administrative users: local, LDAP, and AutoLogin
users.
• Local users are defined within CommandPost. Using the System>Users page, you can
create a user profile, which includes the local password and all permissio n settings.Local
users obtain a CommandPost user name and password and are the easiest to configure and
manage. CommandPost includes one default local user (admin) which must be used to
configure all other settings. Fidelis recommends that you create local user accounts for all
persons responsible for the maintenance and support of the Fidelis products.
• LDAP users are created and managed by an external LDAP or Active Directory server.
Directory attributes can be used to map users or user groups to CommandPost permission
settings. LDAP users can access CommandPost using their directory user names and
passwords. They have full access to the system once logged on. Management is performed
by creating a user profile that maps directory attributes, such as group names, to
CommandPost access permissions.
• AutoLogin users are authenticated by a remote authentication server. CommandPost detects
the user name in the HTTP header sent by the remote server and uses this name to map
AutoLogin users to a CommandPost user profile. This mode is recommended only for
enterprises that include a central user authentication mechanism which can intercept all
HTTPS communication. AutoLogin users are not provided a CommandPost user name nor a
password. Some capability will be limited due to the lack of these credentials.
Note: LDAP and AutoLogin users display in the Users>Profiles list after the first
login.
To create and manage LDAP and AutoLogin CommandPost users, refer to LDAP Configuration
and Auto Login
To manage CommandPost users, click System>Users. The Users page displays with the current
list of CommandPost user profiles (local, LDAP, and AutoLogin) and basic information about each
user.
Note: The Users option is only available if you have access to user features. Refer to
Define User Roles
. To understand CommandPost permissions, refer to Define User Roles.
.
Figure 53. CommandPost Users page
When first installed, CommandPost has one default user, admin, with full System Administrator
privileges. Fidelis Technical Support
password immediately after you first log in.
Fidelis XPS enables you to manage local user access by assigning each user to:
Fidelis XPS User Guide Version 6.0 Users, Roles, Groups 86
provides the default password for the admin user. Change this
Page 95

• A role; required
• Zero or more groups; needed for alerts and quarantine management features.
• Zero or more sensors; needed to manage sensors and to view alerts from sensors.
LDAP and AutoLogin users are managed in a similar fashion. In these cases, you create a profile to
map user attributes to role, group, and sensor assignments. Each profile may manage a single user
or many users, depending on your configuration.
The user page provides two icons to note user status:
Denotes a valid user. The user has a role and has at least one group and sensor
assignment.
Denotes a user with limited access to the system. This user may have a role, but lacks
either a group or sensor assignment. They may log into the system, but will not be able to execute
their role.
Access Control in CommandPost
CommandPost provides multiple layers of access control to the secure information stored in
CommandPost and to the information collected from network sensors. The design is scalable from
small to large enterprises, so that access can be easily assigned to security teams that range in
size from a single person to a large, multi-tiered team.
Access control is managed by three entities: a role, alert management groups, and sensor access
control.
• Roles provide access to CommandPost functions.
• Sensor access restricts the CommandPost function to specified sensors.
• Alert Management Groups can be used to divide the work of violation review and to segregate
violations by type.
The role is the first part of the access control system. Each CommandPost user is assigned one
role. This determines which parts of the system the user can access. Refer to User Roles
Sensor access control is the second part of the access control system. Each user’s role provides
that user with access to certain CommandPost features. However, these features may only be
applied to the sensors to which the user is assigned. This control applies to all CommandPost
functions. For example:
• A network operator may only configure and manage sensors to which that operator is
assigned.
• A Policy author may write policies, but may only install these policies on assigned sensors.
• An alert or quarantine manager may only view violations from sensors to which the manager
is assigned. The sensor access control serves to segregate data depending on where it was
found in the network.
The alert management group is the final component of the access control system. This is a group
of one or more users with a similar function, who should review similar network violations.
Examples might include a network administration group, Human Resources, or a net work securit y
office.
Rules are associated with an alert management group. When a rule is violated, an alert or a
quarantined e-mail may only be managed by persons in the assigned group. Once viewed, an alert
manager may move the alert or quarantined e-mail to a different group as needed.
Alert management groups allow you to segregate data based on the rule that was violated. For
example, PII (personally identifiable information) violations may be sent to one group of users,
while violations involving inappropriate use of net work resources are sent to a different group. It
also helps to split the workflow involved with alert management across one or more teams of
individuals.
.
Fidelis XPS User Guide Version 6.0 Users, Roles, Groups 87
Page 96

Small Security Teams
Many enterprises may be too small to need access control. This is especially true of enterprises
with a single network security office. To simplify access control, Fidelis Security Systems has set
up default configurations:
• The System Administrator role provides full access to the system.
• All rules and all new users are initially assigned to the default group.
• When a sensor is registered to a CommandPost, no user will have access, except the admin
user and the user who created the sensor.
• The admin user has access to all groups, all sensors, and all system functions.
Define User Profiles
At Profiles, you can view all CommandPost users. Each user will be denoted as Local , LDAP, or
AutoLogin within the profile list.
• Local users can be added, deleted, and managed from this page.
• LDAP users can be deleted at the Users>Profiles page. Management of these users is
performed by mapping your external LDAP or Active Directory server information to
CommandPost user access profiles.Refer to LDAP Configuration
• AutoLogin users can be deleted or have full name and e-mail information edited at this page.
Management of these users is performed by mapping your AutoLogin profile to
CommandPost user access profiles. Refer to Enable AutoLogin
To access user profiles:
Click System>Users>Profiles.
The Profiles page appears with a list of CommandPost users. You can click on any user name to
see expanded information, and the Edit and Delete buttons as appropriate.
.
.
Fidelis XPS User Guide Version 6.0 Users, Roles, Groups 88
Page 97

Figure 54. CommandPost Users
The roles, groups, and sensor assignments are links that you can click to access the Roles,
Groups, or Sensor pages.
Add or Edit a Local User
Those with a role that allows user management can add, edit, or delete local CommandPost users.
Adding a user involves the following:
• Provide identifying information for the user to Fidelis XPS. This information includes user
name, password, and e-mail address. This information is stored and managed within
CommandPost.
• Determine access to Fidelis XPS features by assigning the appropriate role.
• Assign the user to the appropriate groups and sensor to implement assigned roles. Alert
Management Groups can be used to divide the work of violation review and to segregate
violations by type
User managers have the following restrictions when creating or modifying users:
• Create users with permissions equal to or less than their own permissions.
• Assign users to groups to which they belong. For example, a User Manager that belongs to
group A and group B can only assign new users to those groups. Use CTRL+click to choose
multiple groups. Select No Groups to unassign a user from every group.
Fidelis XPS User Guide Version 6.0 Users, Roles, Groups 89
Page 98

• Assign users to sensors to which they belong. For example, a User Manager assigned to
sensor A and sensor B can only assign new users to those sensors. Use CTRL+click to
choose multiple sensors. Select No Sensors to unassign a user from every sensor.
The following table provides an overview of how to make role, group, and sensor
assignments so that a user has access to the more frequently used Fidelis XPS features.
Table 16. Determine user access
To access: The assigned
role must
provide:
Alerts Full or view access
to Alerts
Quarantine Full or view access
to Quarantine
Policies Full or view access
to Policies
XPS sensor
configuration
CommandPost
configuration
Users Full or view access
Full or view access
to Sensor Admin
or view access to
CommandPost
Admin
to Users
Group assignment: Sensor assignment
Users must be assigned to
the same group as the alert
and its associated rule to
access the alert.
No impact Users must be assigned to
No impact Users can only assign
No impact Users can only configure
No impact No impact
A new user may be added to
any group to which the user
manager belongs.
Users must be assigned to
the sensor that generated the
alert.
sensor that generated the
quarantined e-mail.
policies to sensors to which
they are assigned.
sensors to which they are
assigned.
A new user may be added to
any sensor to which the user
manager belongs.
Audit Full access to
Audit
To add or edit a local user:
1. Click Add User and the New CommandPost User page displays. To edit an existing user,
select the user and click Edit.
Fidelis XPS User Guide Version 6.0 Users, Roles, Groups 90
No impact No impact.
Page 99

Figure 55. New CommandPost User page
2. Enter user name, password, and e-mail address.
• User name is required for new local users and must conform to valid name restrictions.
Valid names start with a letter and may contain letters, numbers, and underscores (_).
• If needed, you can enter a full name to identify this user.
• E-mail is optional. If entered, a correctly formatted Internet e-mail address is required. If
omitted, this user will not receive notification messages when alerts are assigned.
• Passwords are required for new local users. Passwords must conform to the
CommandPost password settings defined in CommandPost Configuration
existing user, click the Change Password button to change the password.
Note: Local users can change their account information after they log into
CommandPost. LDAP and AutoLogin users have limited ability to change their
account settings.
3. Select a role from the drop-down list.
4. Select the appropriate alert management groups for this user. Multiple groups may be
selected by dragging the mouse or using CTRL+click. Assignments may be reset by choosing
the “No Group” option.
5. Select the appropriate sensors for this user. Multiple sensors may be selected by dragging the
mouse or using CTRL+click. Assignments may be reset by choosing the “No Sensor” option.
6. Click Save.
The new or modified user is included in the list on the CommandPost Users page.
. For an
Delete a User
Before you can delete a user, you must first reassign all alerts assigned to the user.
To delete a user:
1. Click Profiles.
2. Click the appropriate user. The Delete button becomes available. The Delete button will not
be available if open alert tickets are assigned to the selected user.
3. Click Delete.
4. Click OK at the confirmation dialog box.
The user is deleted from the list on the Users>Profiles page.
Fidelis XPS User Guide Version 6.0 Users, Roles, Groups 91
Page 100

To prevent future login from an LDAP user, you will need to change or remove this user from your
directory server or alter or remove the profile to which this user belongs. Refer to LDAP
Configuration .
To prevent future login from an AutoLogin user, you will need to change or remove the profile to
which this user belongs. Refer to Enable AutoLogin
.
Define Alert Management Groups
You can create alert management groups to which you can assign users and alerts.
Each rule is assigned to an alert management group. Alerts generated when a rule is violated are
assigned to this group and visible only to the users in the group associated with the rule.
The alert manager may later move the alert to a different alert management group so that it may be
managed by members of other Alert Management Groups.
To access alert management groups:
Click System>Users> Groups. The Alert Management Groups page appears with a list of existing
groups. You can click on any group name to see expanded information, and the Edit and Delete
buttons.
The user and rule names and Assigned to Alerts are links that you can click to access Users,
Rules, and Alert Report pages.
Figure 56. Alert Management Groups page
Add or Edit an Alert Management Group
You can use groups to control user access to alerts. For example, a legal group could incl ude
users with access to alerts generated when a personally identifiable information (PII) rule is
violated, while a different group could manage alerts for inappropriate use of the network.
To add or edit an alert management group:
1. Click Add Group. The New Alert Management Group page appears with empty text boxes. or
Select an existing group and click Edit.
2. Enter a name and a description for a new group.
3. Enter an e-mail address for the group. When an alert changes from one group to another, a
notice is sent to this e-mail. Similarly, notifications of quarantined e-mails are sent to this
Fidelis XPS User Guide Version 6.0 Users, Roles, Groups 92
 Loading...