

Page 1

iLoft VDS Dominium Monitor
V4.0
USER MANUAL
COD. 97754Ic V06_16
Page 2

Page 3

USER MANUAL
ILOFT VDS DOMINIUM MONITOR - V4.0
Graphic control
2 of 52
Index
1 General Description ______________________________________________________________ 3
1.1 Operating Modes ____________________________________________________________________ 4
1.1.1 Home Automation Mode ____________________________________________________________________ 4
1.1.2 Energy Efficient Mode ______________________________________________________________________ 4
1.2 About using the BUSing system ________________________________________________________ 4
2 Technical description _____________________________________________________________ 5
3 Operating in Home Automation mode _______________________________________________ 6
3.1 Main screen ________________________________________________________________________ 6
3.1.1 Browsing between pages ____________________________________________________________________ 7
3.1.2 Common Page Icons ________________________________________________________________________ 7
3.2 Upper scenario row. ________________________________________________________________ 15
3.2.1 Execute a scenario ________________________________________________________________________ 15
3.2.2 Configuration of scenarios. _________________________________________________________________ 15
3.3 Lower control bar __________________________________________________________________ 17
3.3.1 Notepad ________________________________________________________________________________ 18
3.3.2 Technical Alarms notifications _______________________________________________________________ 20
3.3.3 Schedule ________________________________________________________________________________ 21
3.3.4 Intruder Alarm ___________________________________________________________________________ 25
3.3.5 Presence Simulation _______________________________________________________________________ 26
3.4 Configuration Menu ________________________________________________________________ 27
3.4.1 WIFI configuration ________________________________________________________________________ 27
3.4.2 Security _________________________________________________________________________________ 31
3.4.3 System Restart ___________________________________________________________________________ 33
3.4.4 Firmware update _________________________________________________________________________ 34
3.4.5 Search of equipment without addresses _______________________________________________________ 34
3.4.6 Time zone _______________________________________________________________________________ 35
3.4.7 Email list ________________________________________________________________________________ 36
3.4.8 Language ________________________________________________________________________________ 36
3.4.9 Register Installation _______________________________________________________________________ 37
3.5 Weather forecast ___________________________________________________________________ 38
4 Operating in Energy Efficiency Mode _______________________________________________ 41
4.1 Control ___________________________________________________________________________ 41
4.2 View _____________________________________________________________________________ 43
4.2.1 Total registries period _____________________________________________________________________ 44
4.2.2 Instantaneous values ______________________________________________________________________ 45
4.2.3 Total Registries ___________________________________________________________________________ 46
4.3 Configuration Menu ________________________________________________________________ 47
5 Recovery screen. _______________________________________________________________ 48
5.1.1 Restart project ___________________________________________________________________________ 48
5.1.2 WIFI configuration ________________________________________________________________________ 48
5.1.3 Synchronisation __________________________________________________________________________ 48
5.1.4 Restore default settings. ___________________________________________________________________ 49
6 Installation ____________________________________________________________________ 50
Page 4
USER MANUAL
ILOFT VDS DOMINIUM MONITOR - V4.0
Graphic control
3 of 52
1 GENERAL DESCRIPTION
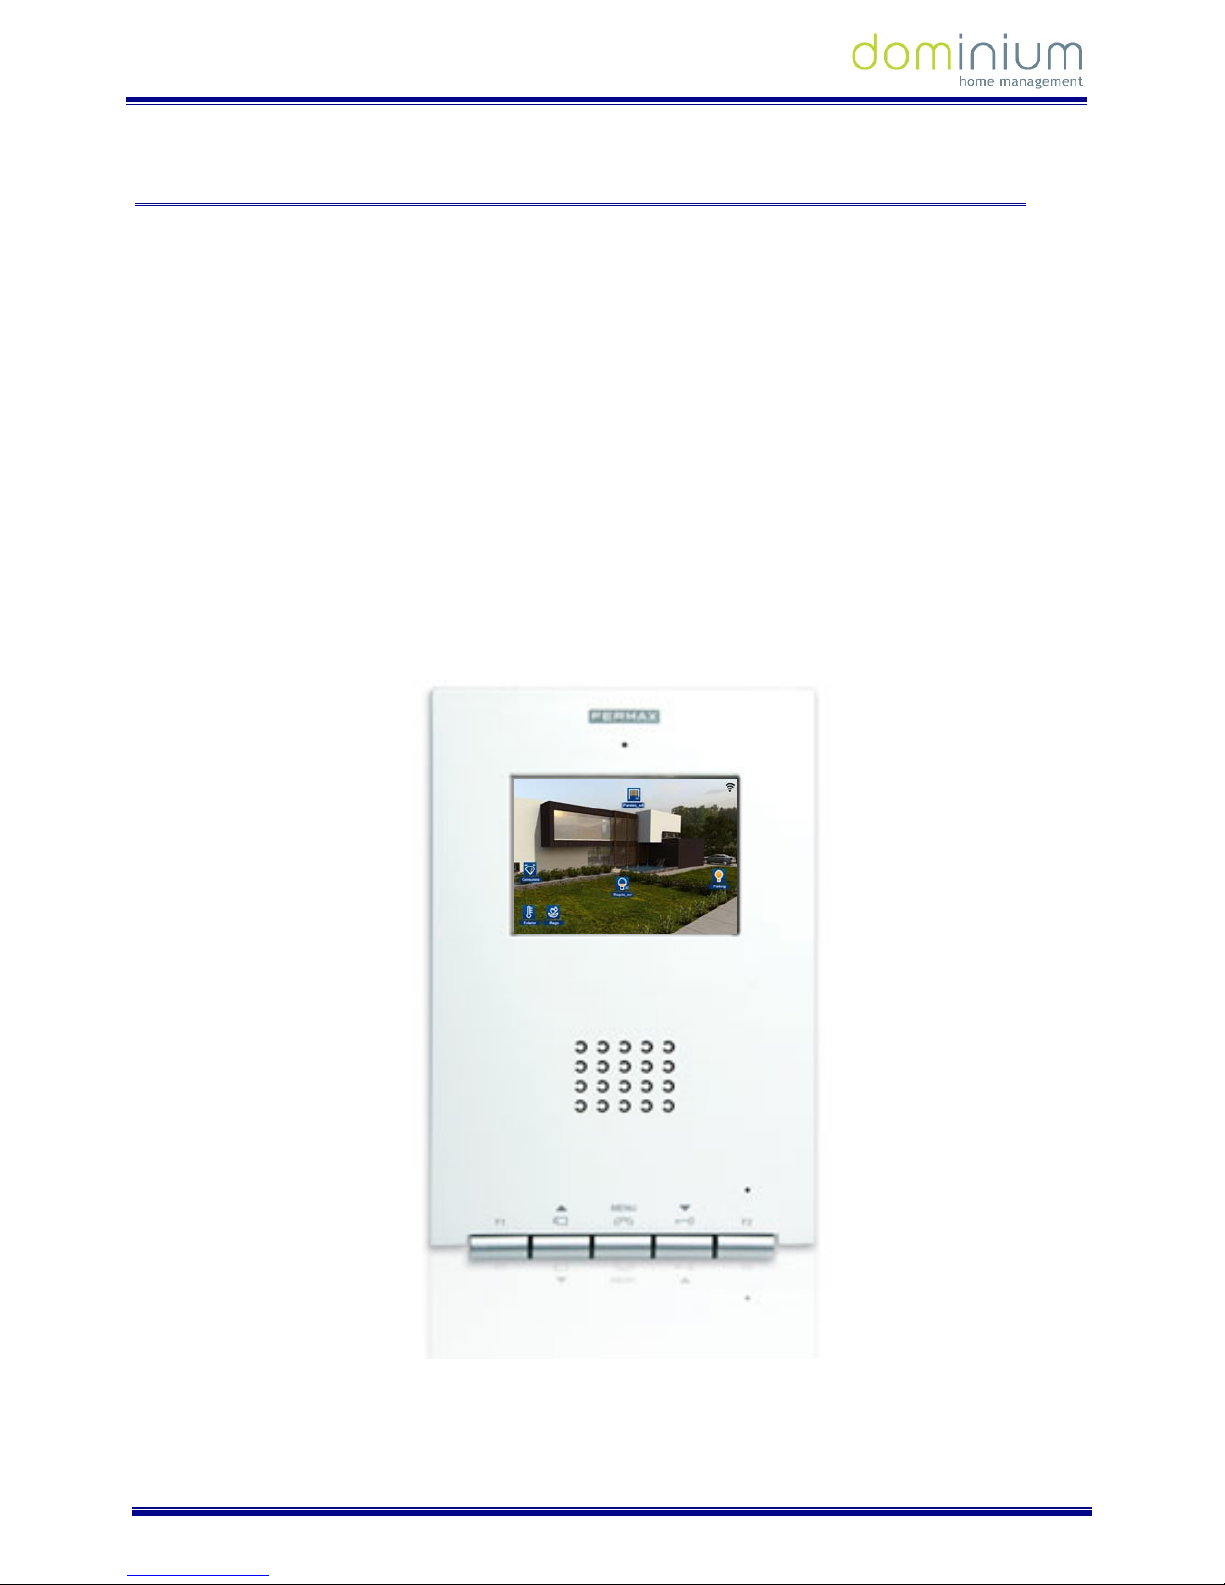
The iLoft VDS Dominium Monitor is a video entry unit as a result of FERMAX’s joint venture with ingenium. This
monitor has a 3.5” colour touch screen that allows you to monitor and control the home automation BUSing
®
system quickly and intuitively via allusive icons in each of the installation’s rooms.
It has configurable Wi-Fi connection, allowing you to connect to the network for different functions such as
updating software versions immediately or showing weather information in the previously configured locations.
It incorporates with the option of editing scenes, allowing for the addition of new events in the installation
(besides those included with SIDE) taking advantage of the nodes’ status associated to the icons included in the
different installation plans from SIDE.
It also allows for the control of technical alarms for flooding, gas, fires, etc., and the management of intrusion
alarms within the area via a 4 digit numeric code, simulating real presence, programming annual schedules,
graphic notebooks, etc.
Page 5

USER MANUAL
ILOFT VDS DOMINIUM MONITOR - V4.0
Graphic control
4 of 52
1.1 OPERATING MODES
Depending on the installed devices and the required features, the monitor can be configured to function in 2
different modes: Home automation and Energy Efficiency mode.
This configuration must be done during the installation’s start-up and must not be changed by the user under
any situation, since all of the installation’s programming could be lost.
1.1.1 HOME AUTOMATION MODE
Home automation allows you to configure and manage any type of BUSing device, along with the management
of alarms, scenarios, presence simulation, etc.
1.1.2 ENERGY EFFICIENT MODE
Energy efficient mode is optimized for installations that only have installed consumption meters and thermostat
options, offering a graphic interface adapted to these features. This mode is not possible to control other Home
automation elements or alarm management.
1.2 ABOUT USING THE BUSING SYSTEM
BUSing is a decentralized, flexible and scalable home automation system. The BUSing elements are
communicated via a 4 wire bus and in home automation BUSing installations this may reach up to 255
connected devices.
The home automation features that may be obtained with a BUSing device are:
Lighting control: on/off and regulation.
Control of blinds, curtains, etc.
Air conditioning controls.
Energy efficiency.
Electric load management.
Technical and Security Alarms.
Each BUSing device requires address and parameters programming to be able to integrate into an installation.
This programming must be performed by a specialised technician via the SIDE Fermax programming software
Page 6

USER MANUAL
ILOFT VDS DOMINIUM MONITOR - V4.0
Graphic control
5 of 52
2 TECHNICAL DESCRIPTION
3.5” TFT screen
Resolution: 480 (H) x 234 (V) lines.
Flush Monitor Dimensions: 131 (width) x 197 (height) x 60 (depth) mm
o It emerges from the wall 14 mm once installed
FERMAX Flush Mounted Box Size: 108 (width) x 158 (height) x 45 (depth) mm
Standard Flush Mounted Box Size: 114 (width) x 174 (height) x 50 (depth) mm
Surface Monitor Dimensions: 131 (width) x 197 (height) x 34.3 (depth) mm
System Power supply: 18 Vdc
Consumption:
o in standby: 150 mA.
o During start-up: 250 mA
o active: 250 mA
o during a call: 600 mA
Page 7
USER MANUAL
ILOFT VDS DOMINIUM MONITOR - V4.0
Graphic control
6 of 52
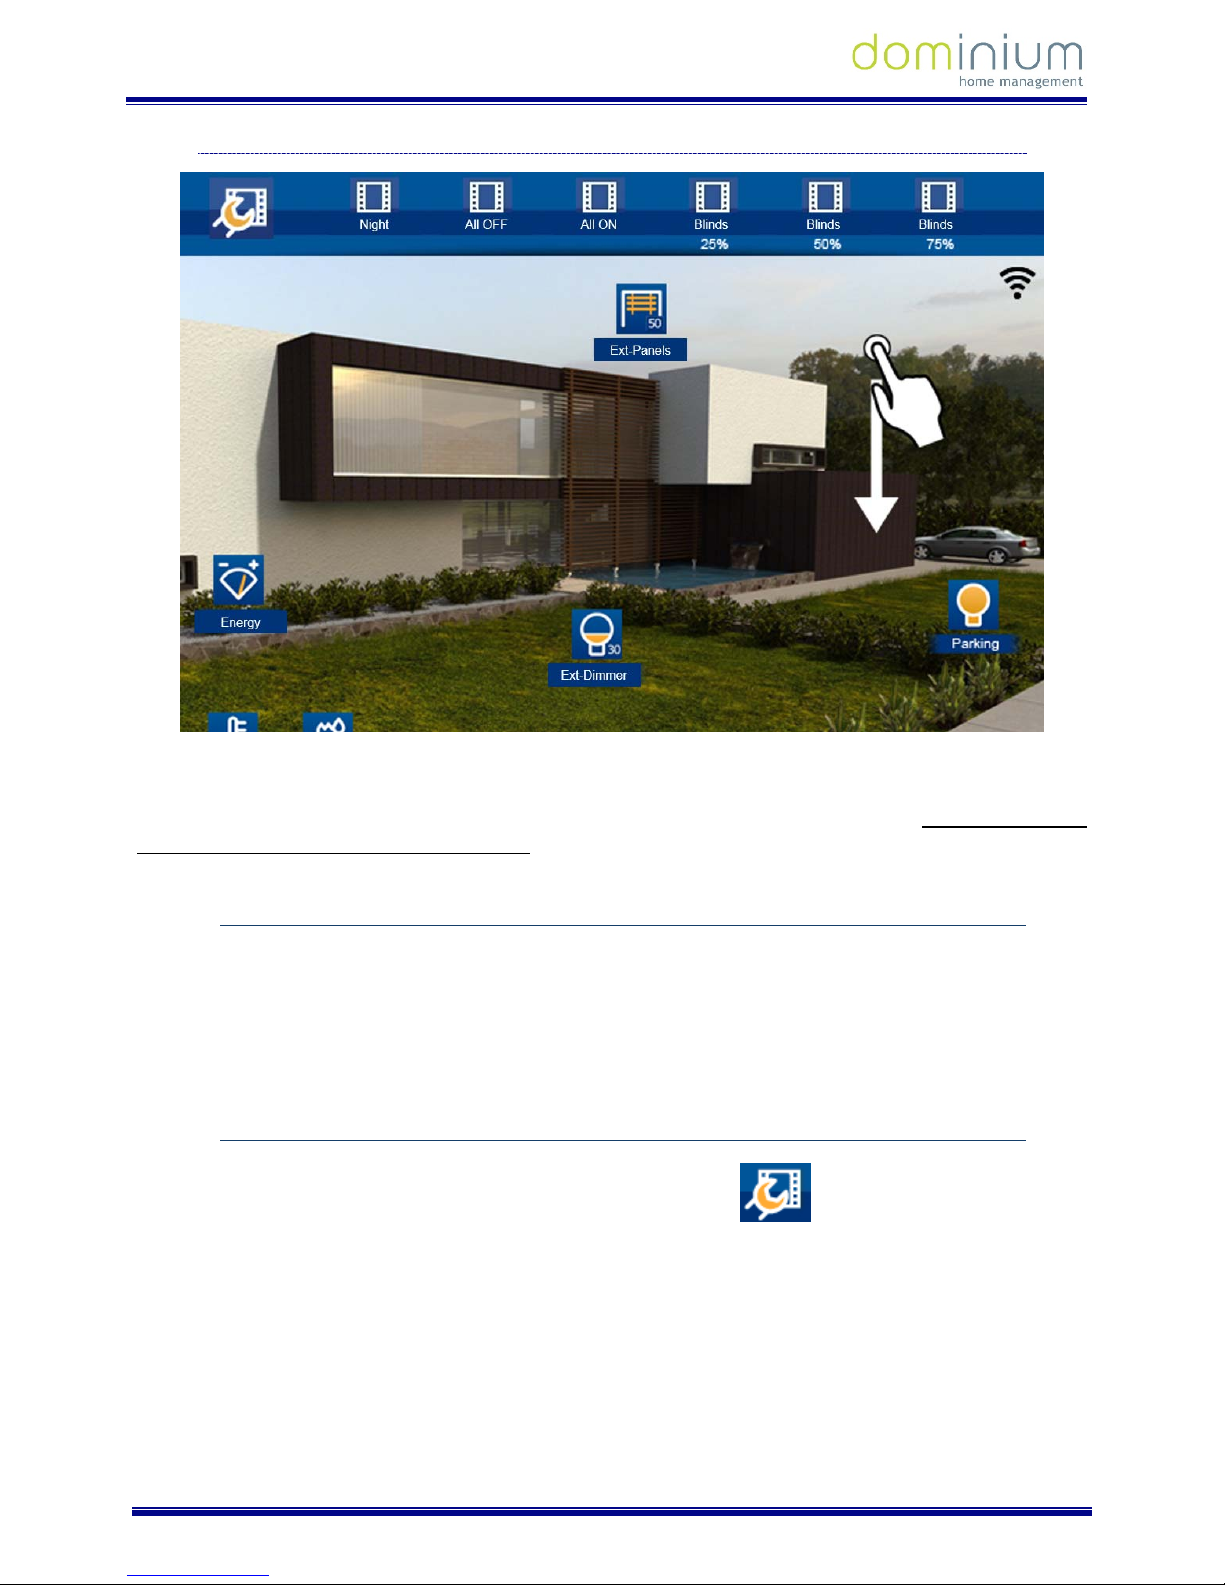
3 OPERATING IN HOME AUTOMATION MODE
The graphic interface is divided into three main areas:
A central area with the installation’s maps over which the control icons are distributed over the different
equipment.
An upper bar which becomes visible upon dragging the map main screen down. In this bar we can
activate different scenarios programmed in SIDE, besides being able to create new scenarios. After the
creation of scenarios you can delete and edit those already created by using the screen itself. You can
not delete or edit scenes programmed and included via SIDE.
A lower bar which becomes visible upon dragging the map main screen up. This bar gives you access to
notepad function, technical alarms, annual schedules, intruder alarm, presence simulation, screen
parameter configuration and weather forecasts.
Below we explain in detail each of the areas to control in the graphic interface.
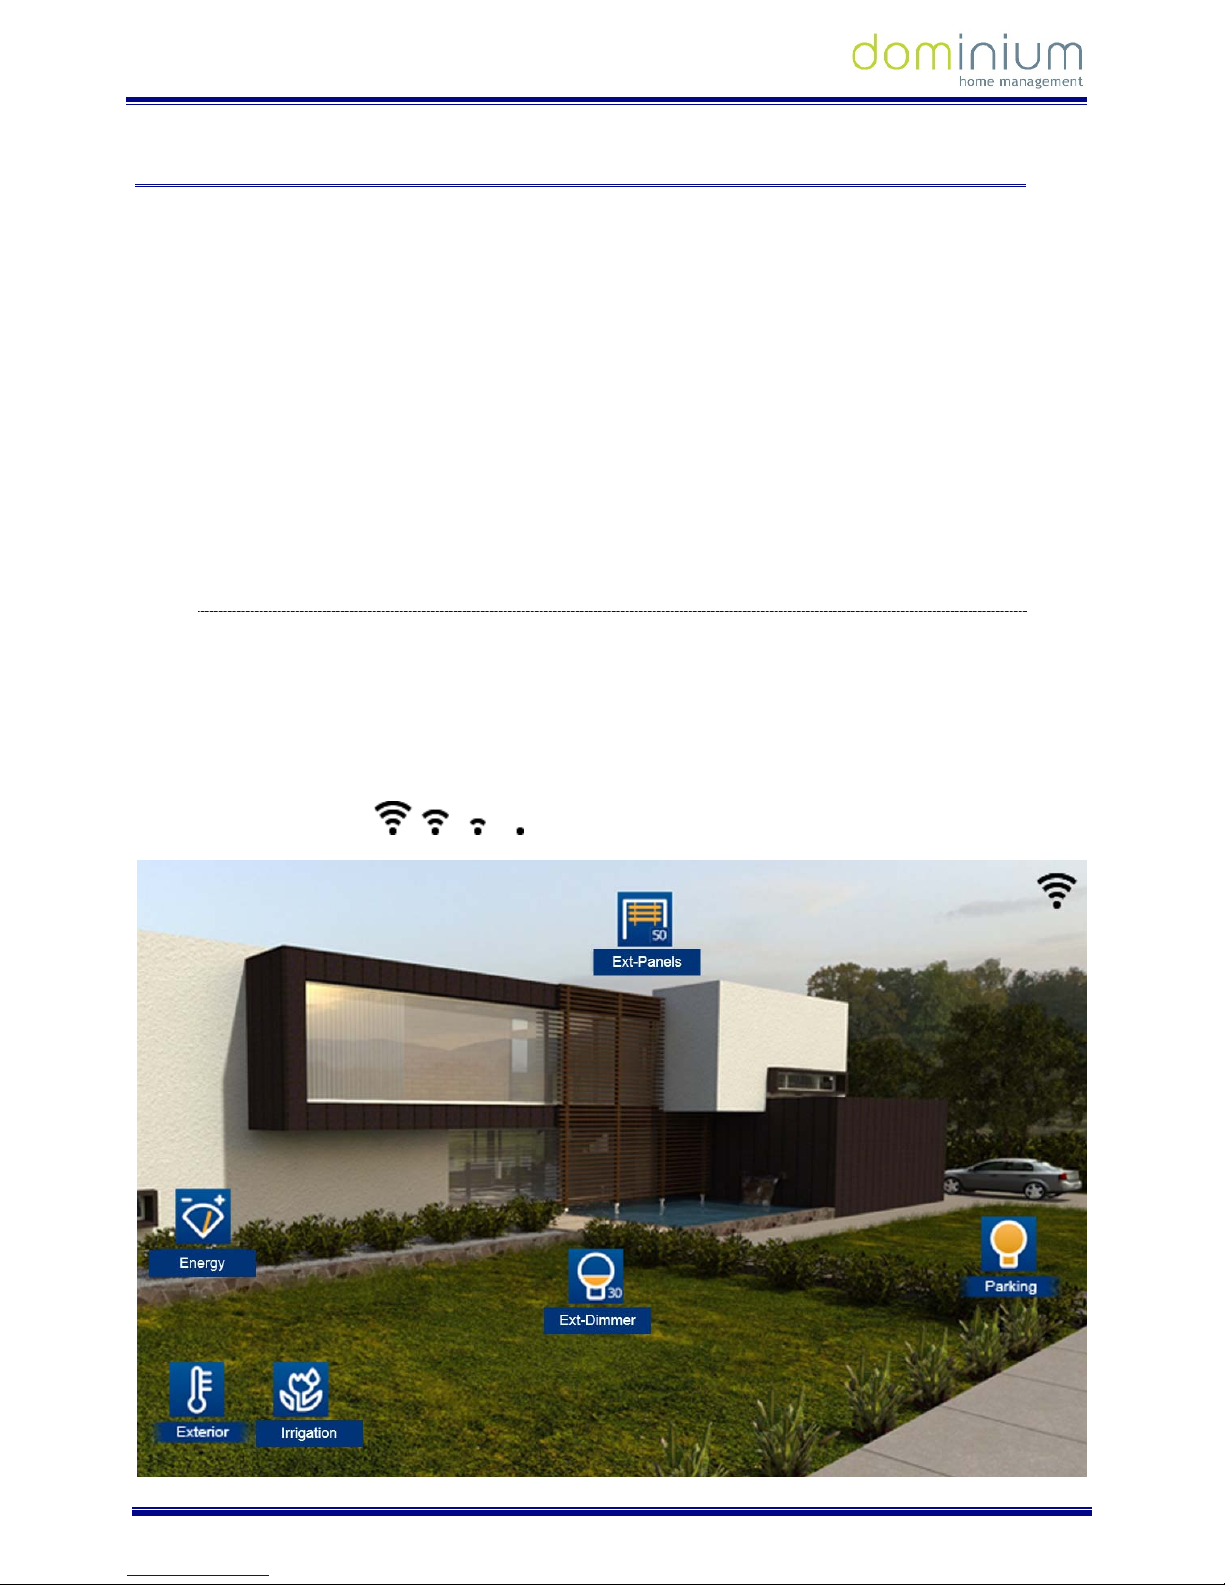
3.1 MAIN SCREEN
This screen is made up of maps of the project, besides a series of icons that correspond to each of the devices or
outputs making up the home automation system. These icons allow for the supervision and control of each of
the associated devices.
Besides the maps and icons, the upper right corner of the screen permanently shows the wireless coverage to
the connected network.
(From maximum to minimal coverage)
Page 8

USER MANUAL
ILOFT VDS DOMINIUM MONITOR - V4.0
Graphic control
7 of 52
3.1.1 BROWSING BETWEEN PAGES
Slide your finger over the screen to the right or left to browse between pages
3.1.2 COMMON PAGE ICONS
3.1.2.1 LIGHT BULBS
To light up or turn off any of the light switches just click over the light bulb drawn on the page. When the light
bulb is yellow, the light is lit, otherwise when it is blue it is off.
Once you have clicked it, the system sends the order and the components´ status will change.
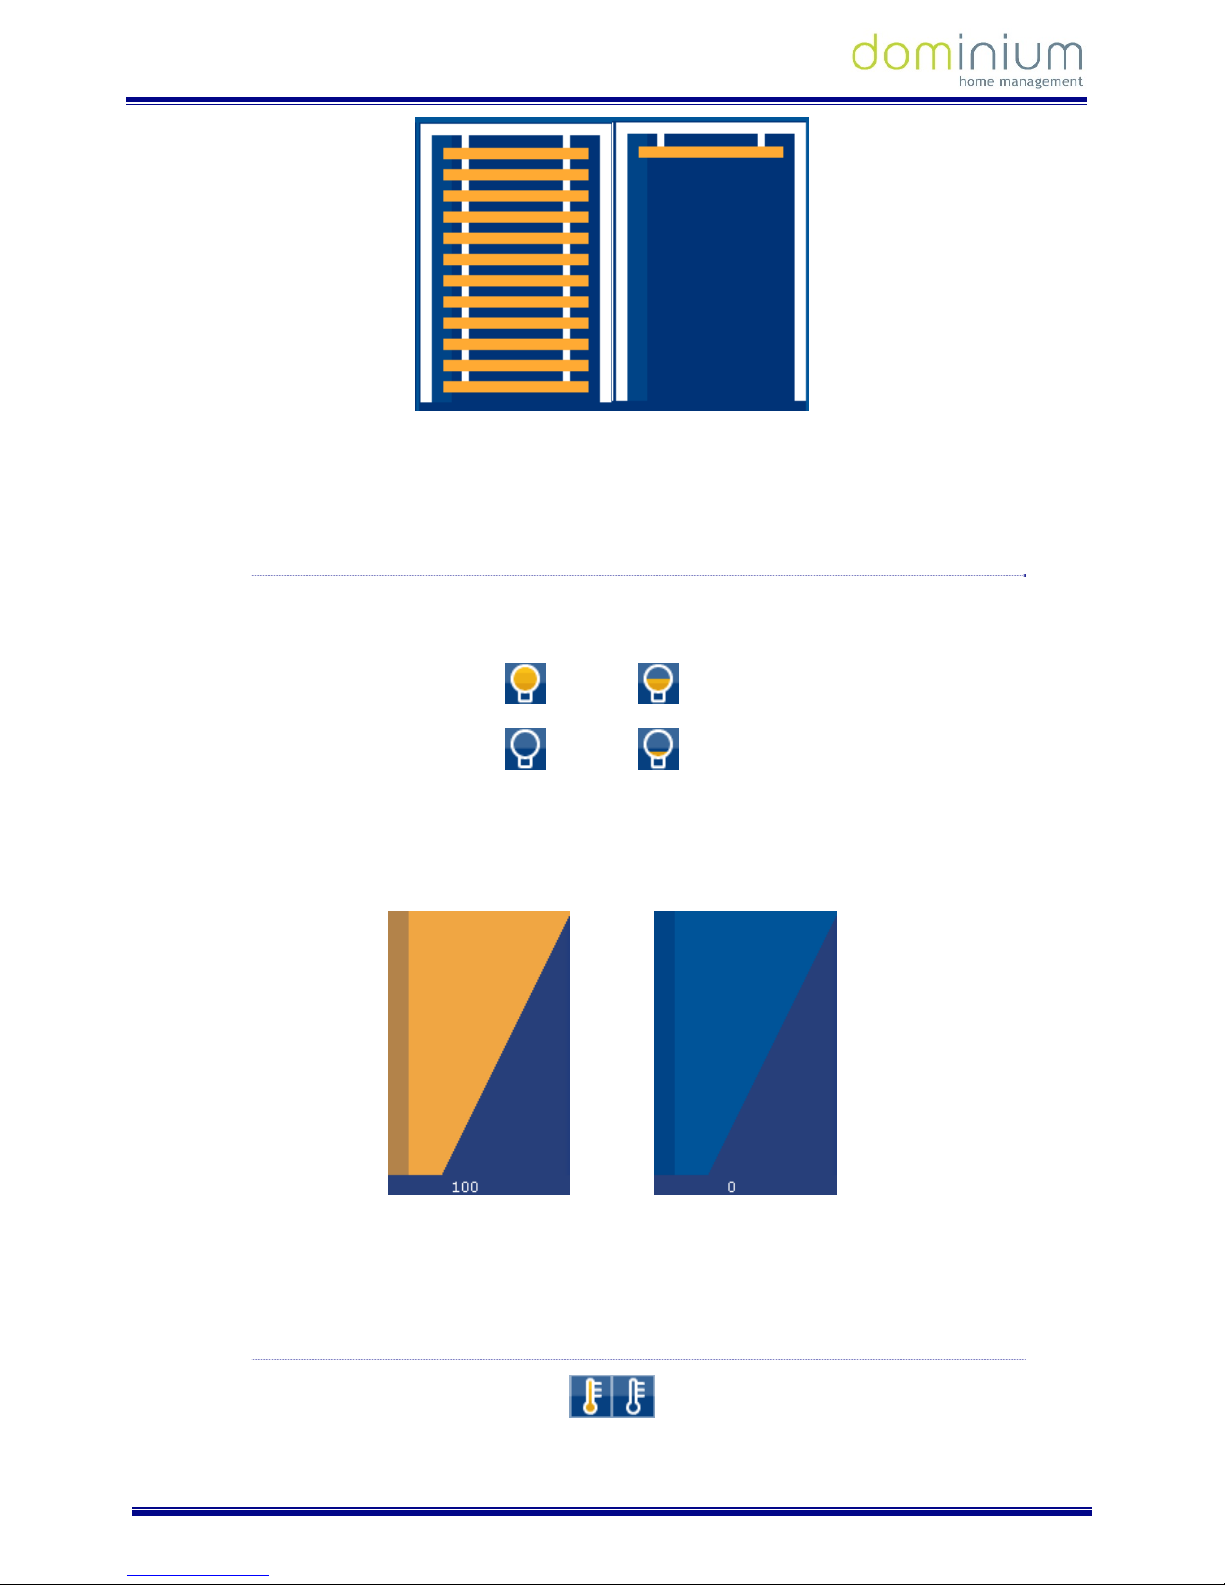
3.1.2.2 SHUTTERS
The shutter icons on the page indicate an orientative level of the shutter’s status both graphically and
numerically.
Once you press the selected shutter icon, it will move with the shutter’s status and the value as a %.
Page 9
USER MANUAL
ILOFT VDS DOMINIUM MONITOR - V4.0
Graphic control
8 of 52
In the new drop down window, drag your finger over the shutter to adjust the opening level, dragging your
finger up or down on the touch surface. When the user lifts his/her finger the open level is set, the shutter level
window will close and the actuator will activate the corresponding output.
3.1.2.3 REGULATING LIGHT
The light regulation icons on the page indicate an approximate level of the shutter’s status both graphically and
numerically.
100% 60%
0% 30%
Upon clicking on any of the light bulb icons associated to the regulation, a box with the regulated circuit’s status
is displayed on the page.
In the new drop down box, drag your finger over the image to adjust the circuit’s intensity level, dragging your
finger up or down on the touch surface. When the user lifts his/her finger the intensity level is set, the intensity
level window will close and the regulator will display the changes made.
3.1.2.4 THERMOSTAT (KT)
Page 10
USER MANUAL
ILOFT VDS DOMINIUM MONITOR - V4.0
Graphic control
9 of 52
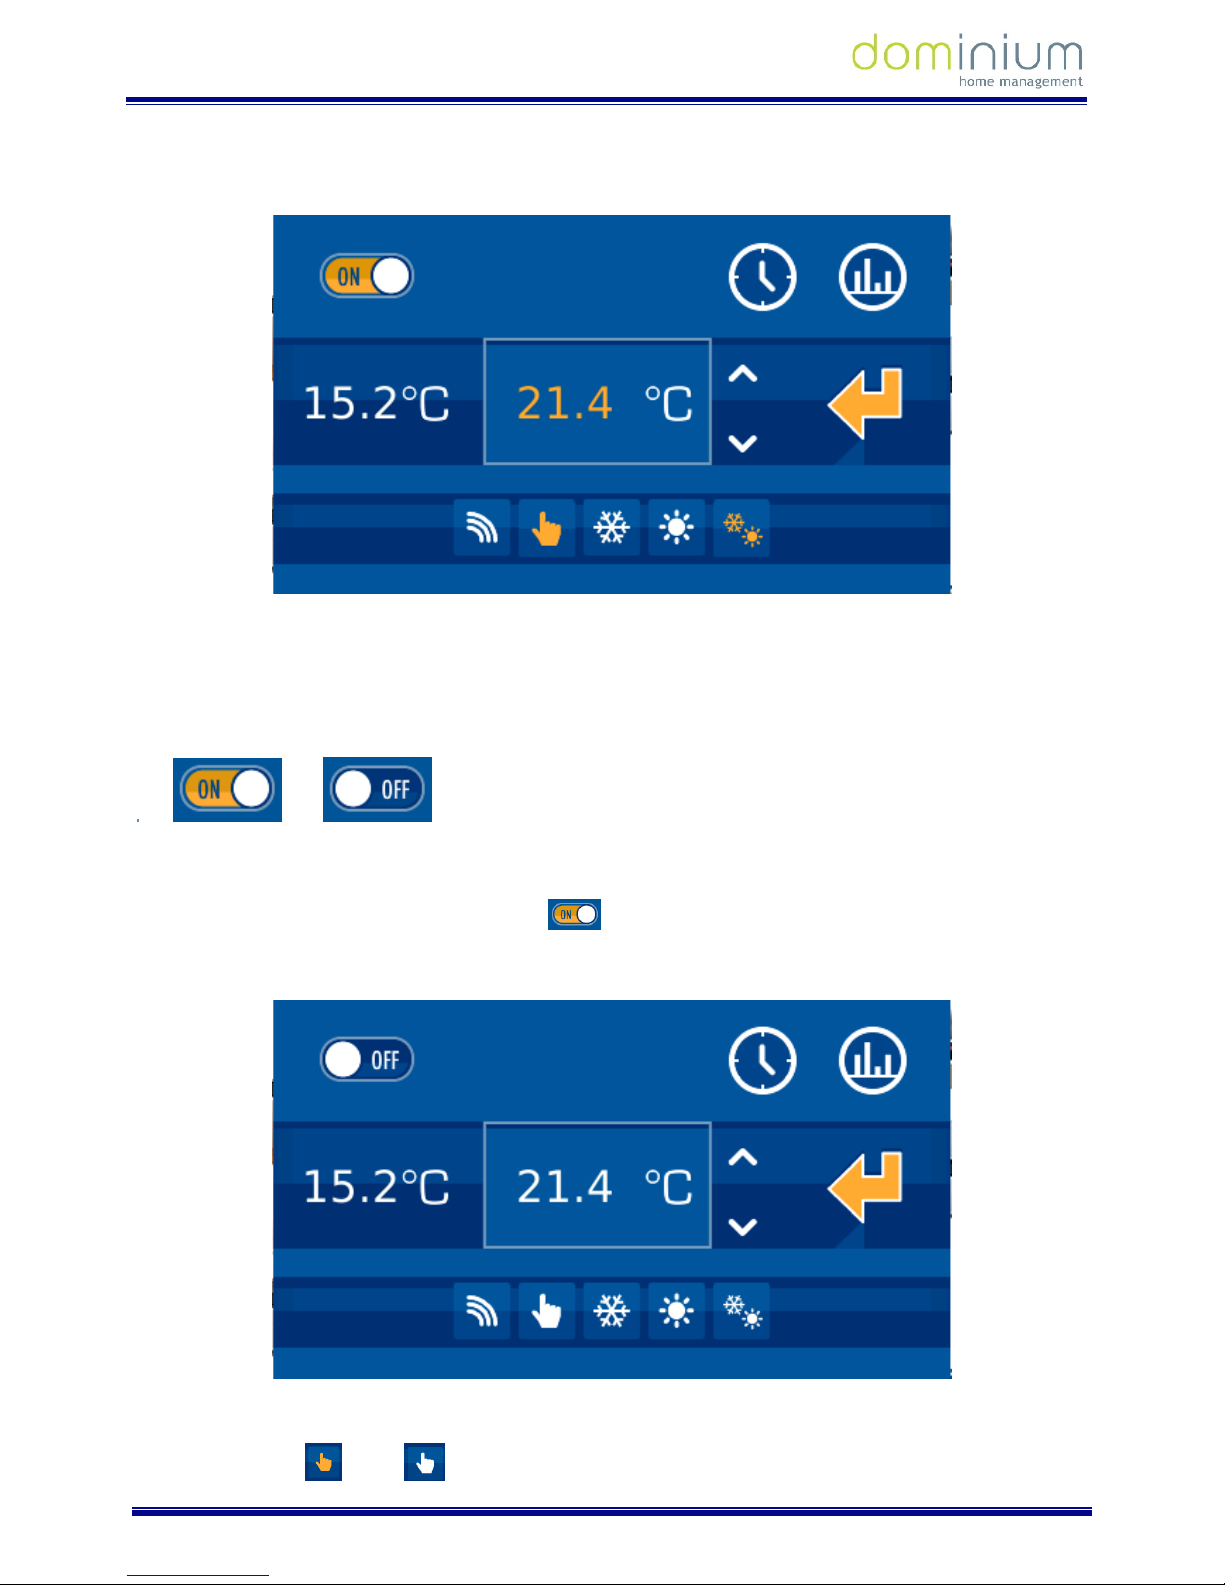
By clicking on a thermostat icon, a box appears to be able to turn the thermostat on or on, adjust the
temperature, establish the operating mode, check data history and configure up to 10 different scenarios with
the schedule.
The drop down box displays two values in the middle row, on the left, the current measured temperature, and
on the right, the set value, which can be changed by pressing the up and down arrows.
On the upper row, the left side allows you to turn the thermostat on or off, which is controlled with the
following slide bar:
On: Off:
If the thermostat is off, all of the thermostat’s configurable options remain deactivated (icons in white). You also
won’t be able to change the set temperature. For the parameters to be editable again (icons in yellow), just turn
the thermostat on again by sliding the bar to ON .
An example of the thermostat off:
In the lower row, we can configure if the control of the thermostat is in:
Local mode
Page 11
USER MANUAL
ILOFT VDS DOMINIUM MONITOR - V4.0
Graphic control
10 of 52
Remote mode and operating mode:
Summer (demand for cooling)
Winter (demand for heat)
Mixed
When the icons are in white the selection is deactivated. When they are in yellow, the selection is activated and
it is the mode currently in operation.
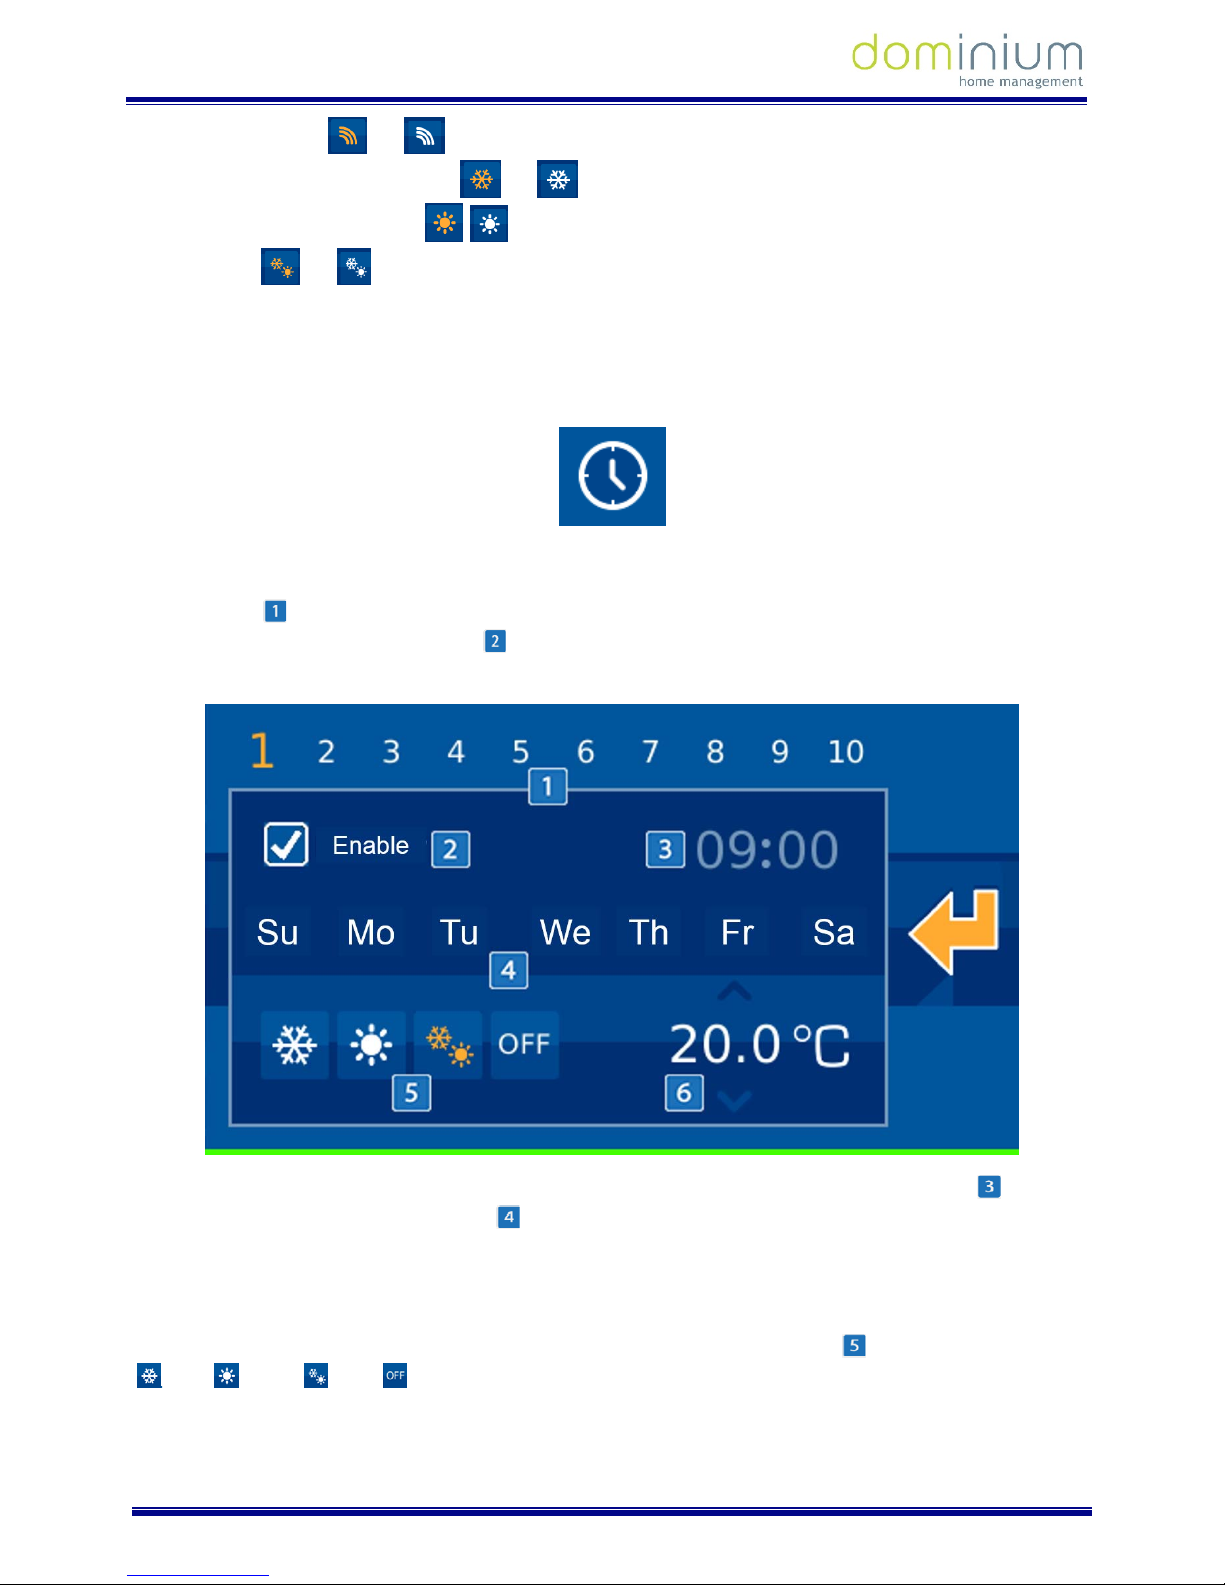
THERMOSTAT TIMERS
By accessing the Thermostat Timer option, a new window appears to configure up to 10 weekly scenarios
related with the thermostat’s functions. To access each of these, just press on the representative numbers on
the upper bar
. The selected number, representing the scenario currently edited, is bigger than the rest. To
identify which timers are active or not
, they are white when deactivated, and yellow when activated. To
enable or disable, just tick or untick the specified box in the upper left hand corner.
For each of the scenarios you can indicate the time when you will activate the thermostat’s timer
and what
days of the week they will be executed in
(Monday through Sunday, from left to right), represented by their
initials. To add or delete timer days, just press on the day of the week you want. If the start for the day is
displayed, it is activated, while if a dash is displayed, the timer is deactivated and will not perform on that
specific day.
Another configurable element is the operating mode selected for the thermostat,
, which can be set to cool
, heat , mixed or off .
Page 12
USER MANUAL
ILOFT VDS DOMINIUM MONITOR - V4.0
Graphic control
11 of 52
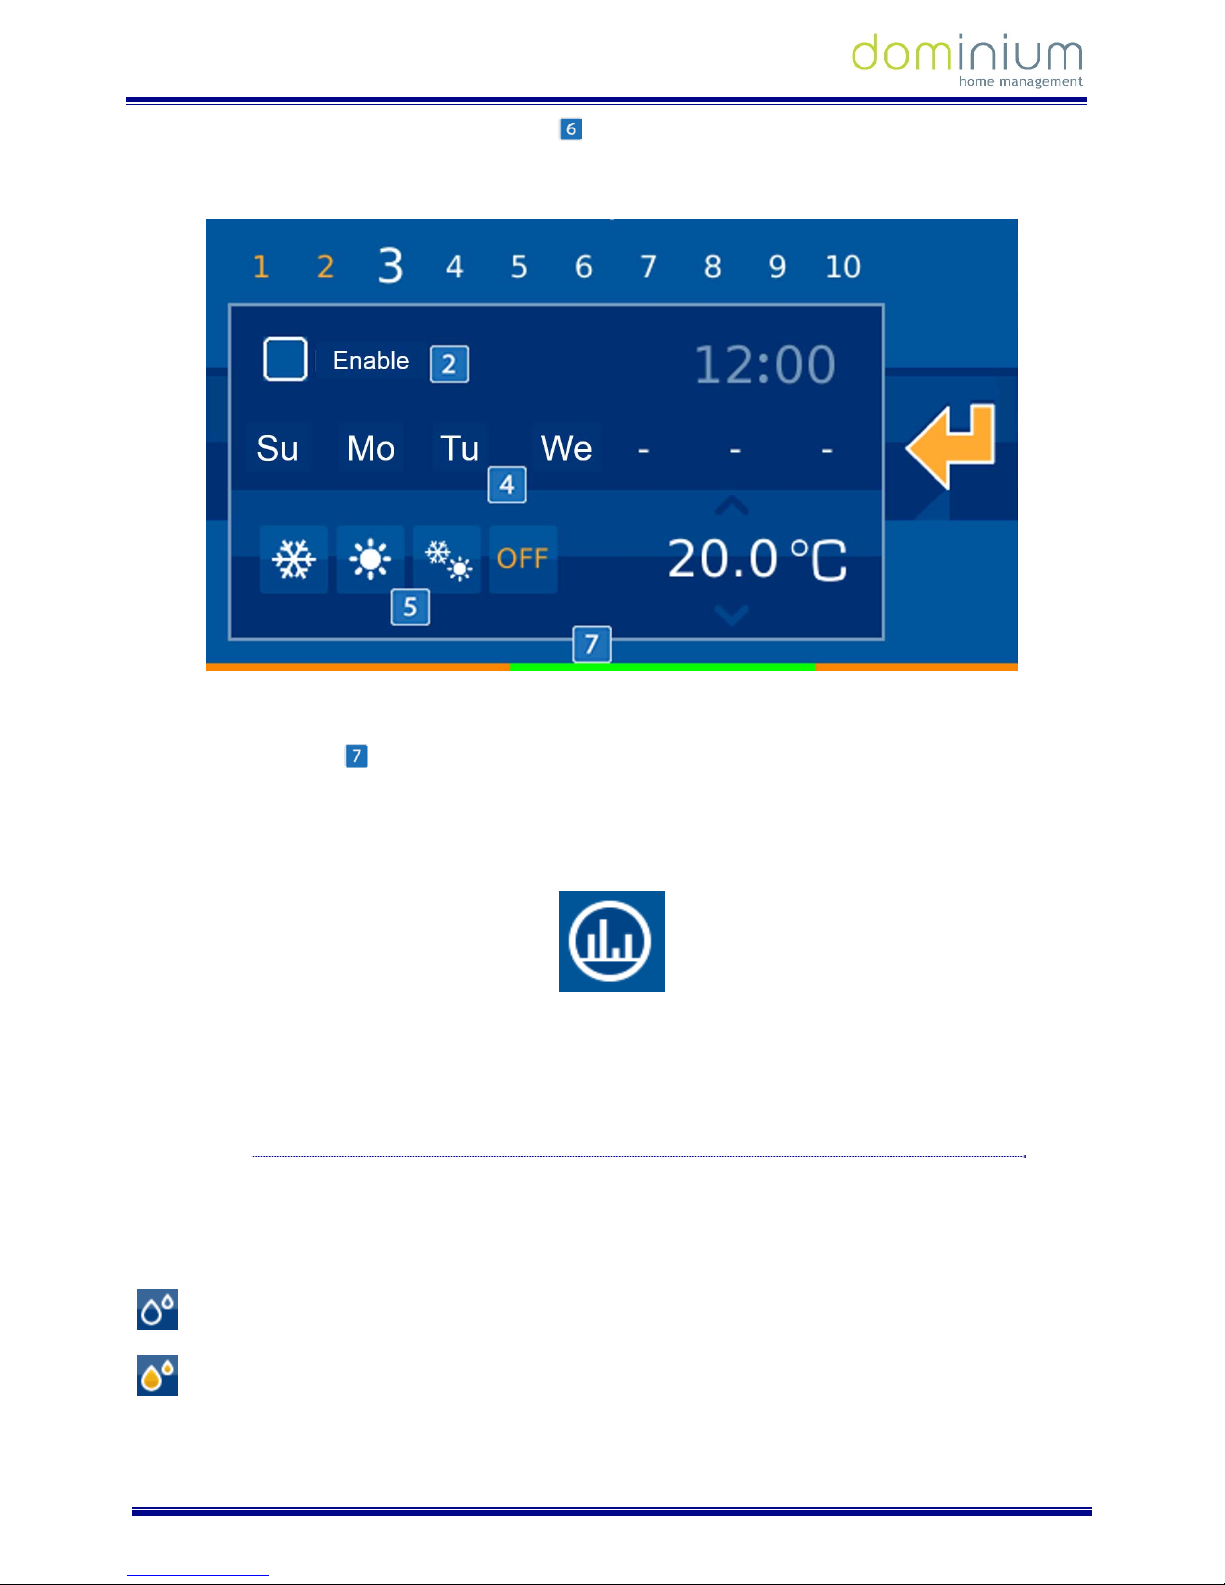
Finally, you can set the temperature for the timer , and it will be defined in the thermostat when the scenario
turns on. This temperature can be edited by pressing the number and sliding your finger up without releasing it
to increase, down to reduce it.
Once all of the thermostats parameters are defined, check on the coloured horizontal bar on the lower part to
see what is established for the next 24 hours (with 00:00h at the far left, and 23:59 at the far right) with regards
to programmed settings
. The higher the setting value, the closer to red, while green represents low setting
values. Yellow tones are intermediate, and grey are periods of time where the thermostat is off without any
defined programming.
HISTORY
On the upper right, the icon gives us a history of the thermostat’s measured temperature, presented in a graph
in a new drop down window. In this new interface, we can view the daily, weekly or monthly information by
simply selecting the mode in the lower part of the image.
3.1.2.5 FLOODING
The operating procedure for the flood sensor is as follows:
When there is a water leak in the home, this indicates it by lighting the icon (yellow). In standby the icon is off
(blue).
Sensor in standby
Detector activated
You can not act locally on the icon by pressing on it, since the icon will not change status. It´s status changes
depending on the detection of water by the sensor.
Page 13
USER MANUAL
ILOFT VDS DOMINIUM MONITOR - V4.0
Graphic control
12 of 52
3.1.2.6 DETECTORS
Detector in standby
Detector activated
This icon is used to show the installation’s presence detector’s status.
Detector on switch
: This icon is to manually turn the detector on, that is, by pressing on this icon the
SRBUS detects movement and operations normally.
Detector off switch
: This icon is to manually turn the detector off, that is, by pressing on this icon the
SRBUS does not detect movement and does not operate.
3.1.2.7 GAS, FIRE OR SMOKE
The operating procedure for the gas or fire/smoke probe is as follows:
When there is a gas leak in the home or a smoke detector goes off, this indicates it by lighting the extinguisher
icon (yellow). In standby the extinguisher icon is off (blue).
Sensor in standby
Sensor activated
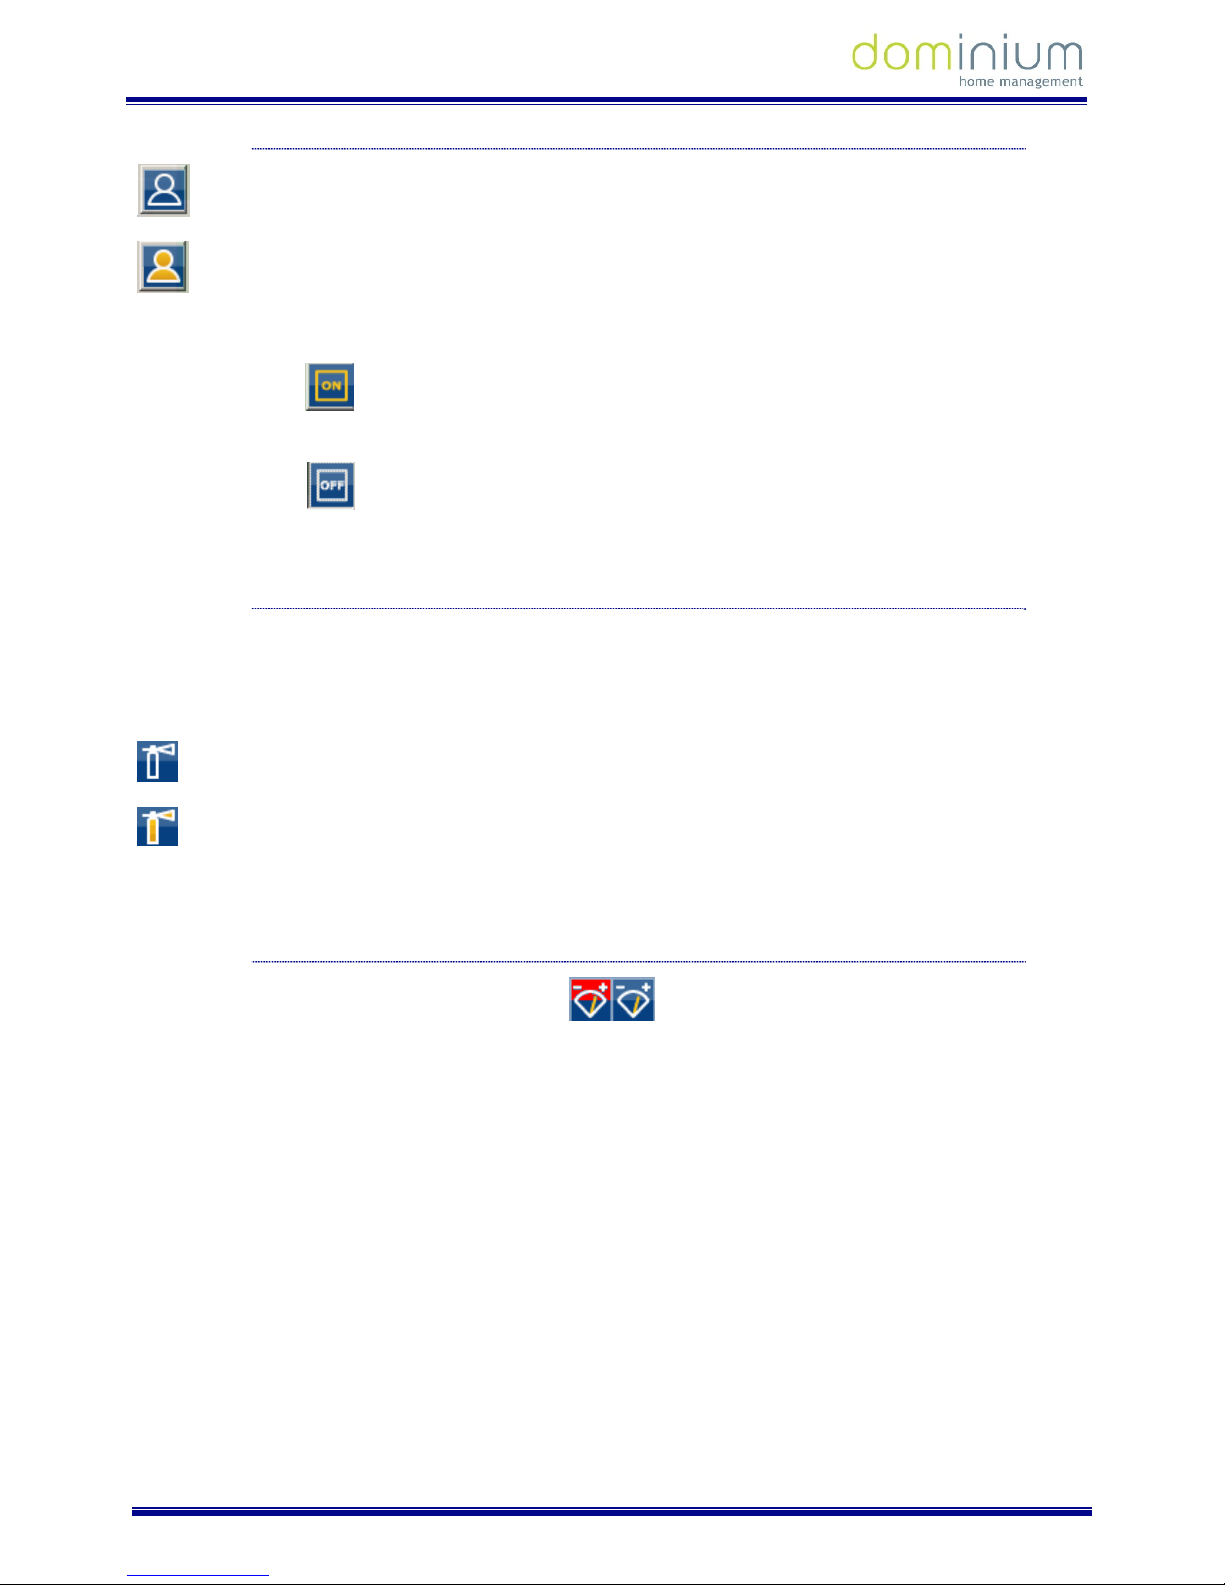
3.1.2.8 CONSUMPTION METER (METERBUS)
By clicking on the displayed icon we access a drop down panel with the instant consumption information in each
of the channels connected to the METERBUS. In the left column it displays instantaneous consumption of each
channel, while the right column displays the consumption limits for each channel.
Page 14
USER MANUAL
ILOFT VDS DOMINIUM MONITOR - V4.0
Graphic control
13 of 52
Each channel can have its maximum limit set, which the consumption measurements should remain under. If it
surpasses this range, the installation would perform a series of actions to correct the excess in demand
according to the configured parameters. The limits per channel are set by pressing on the side arrows on both
sides of the set value. To the left, to reduce the limit, and the right to increase it.
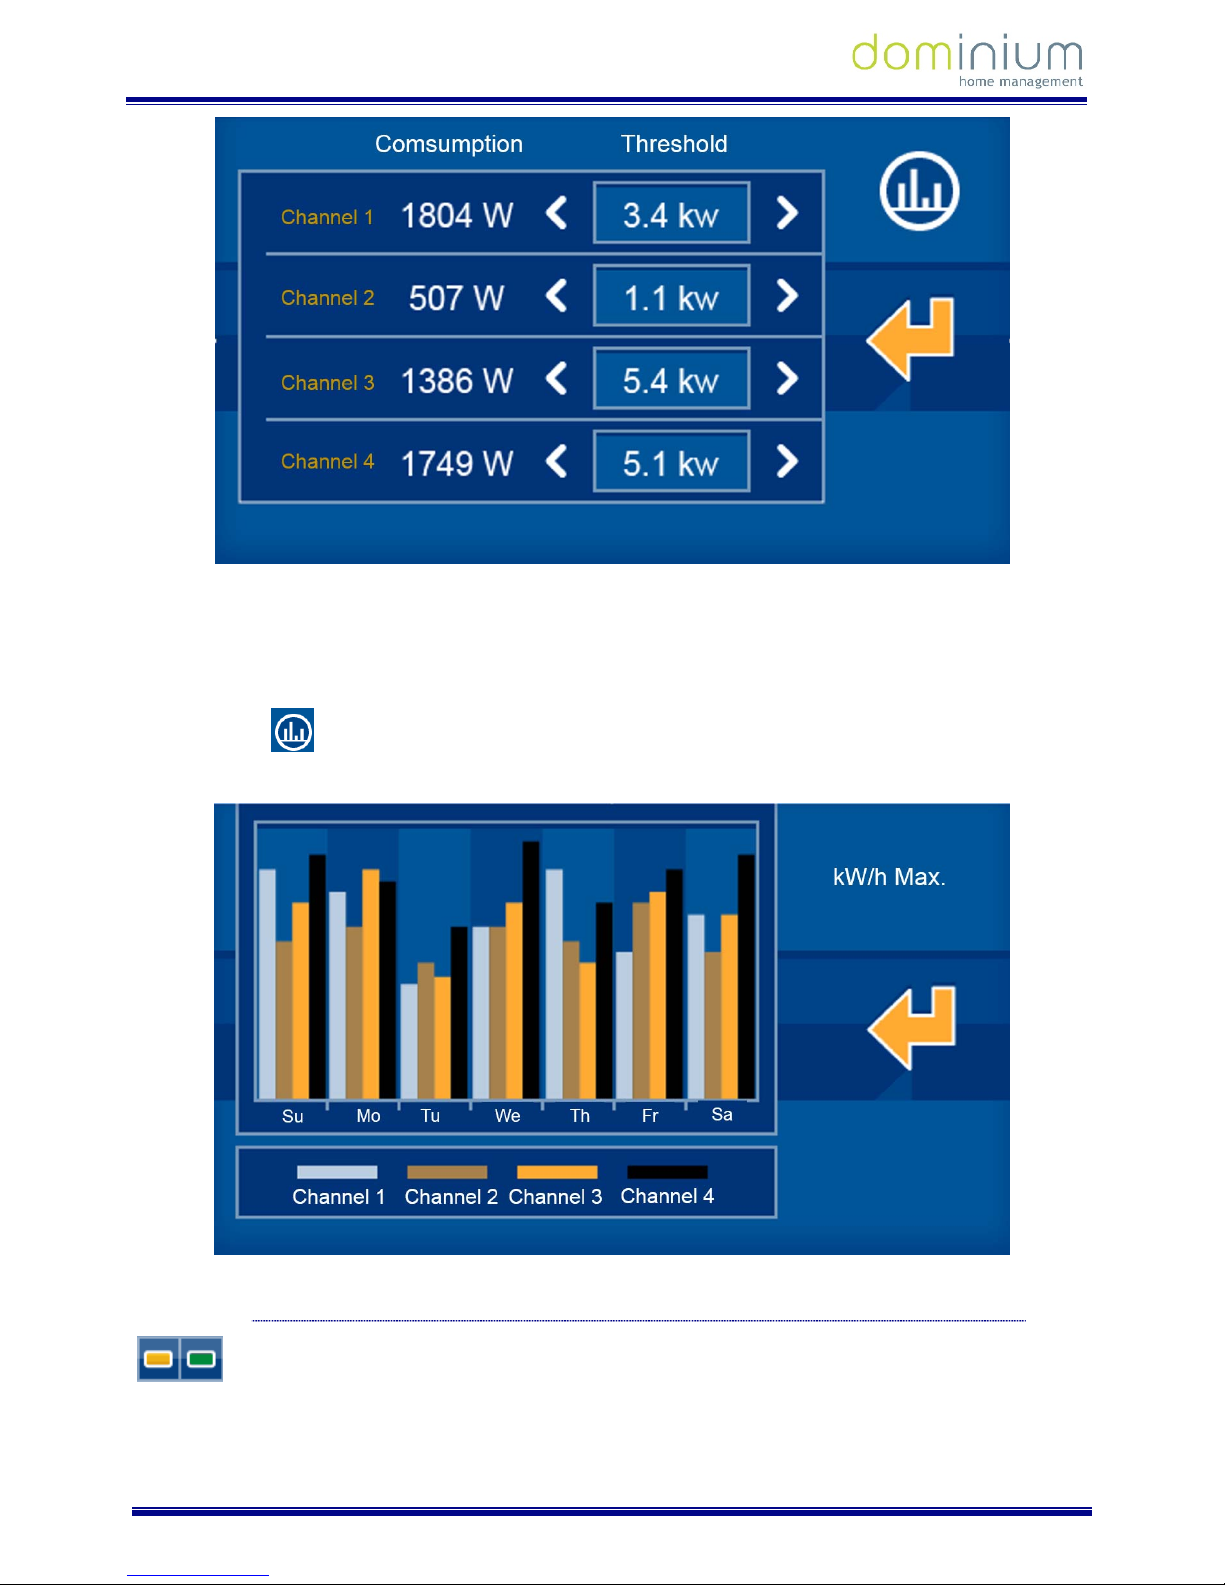
By pressing the
button, you access a graph that shows the history of the collected data in the last 7 days of
each of the channels.
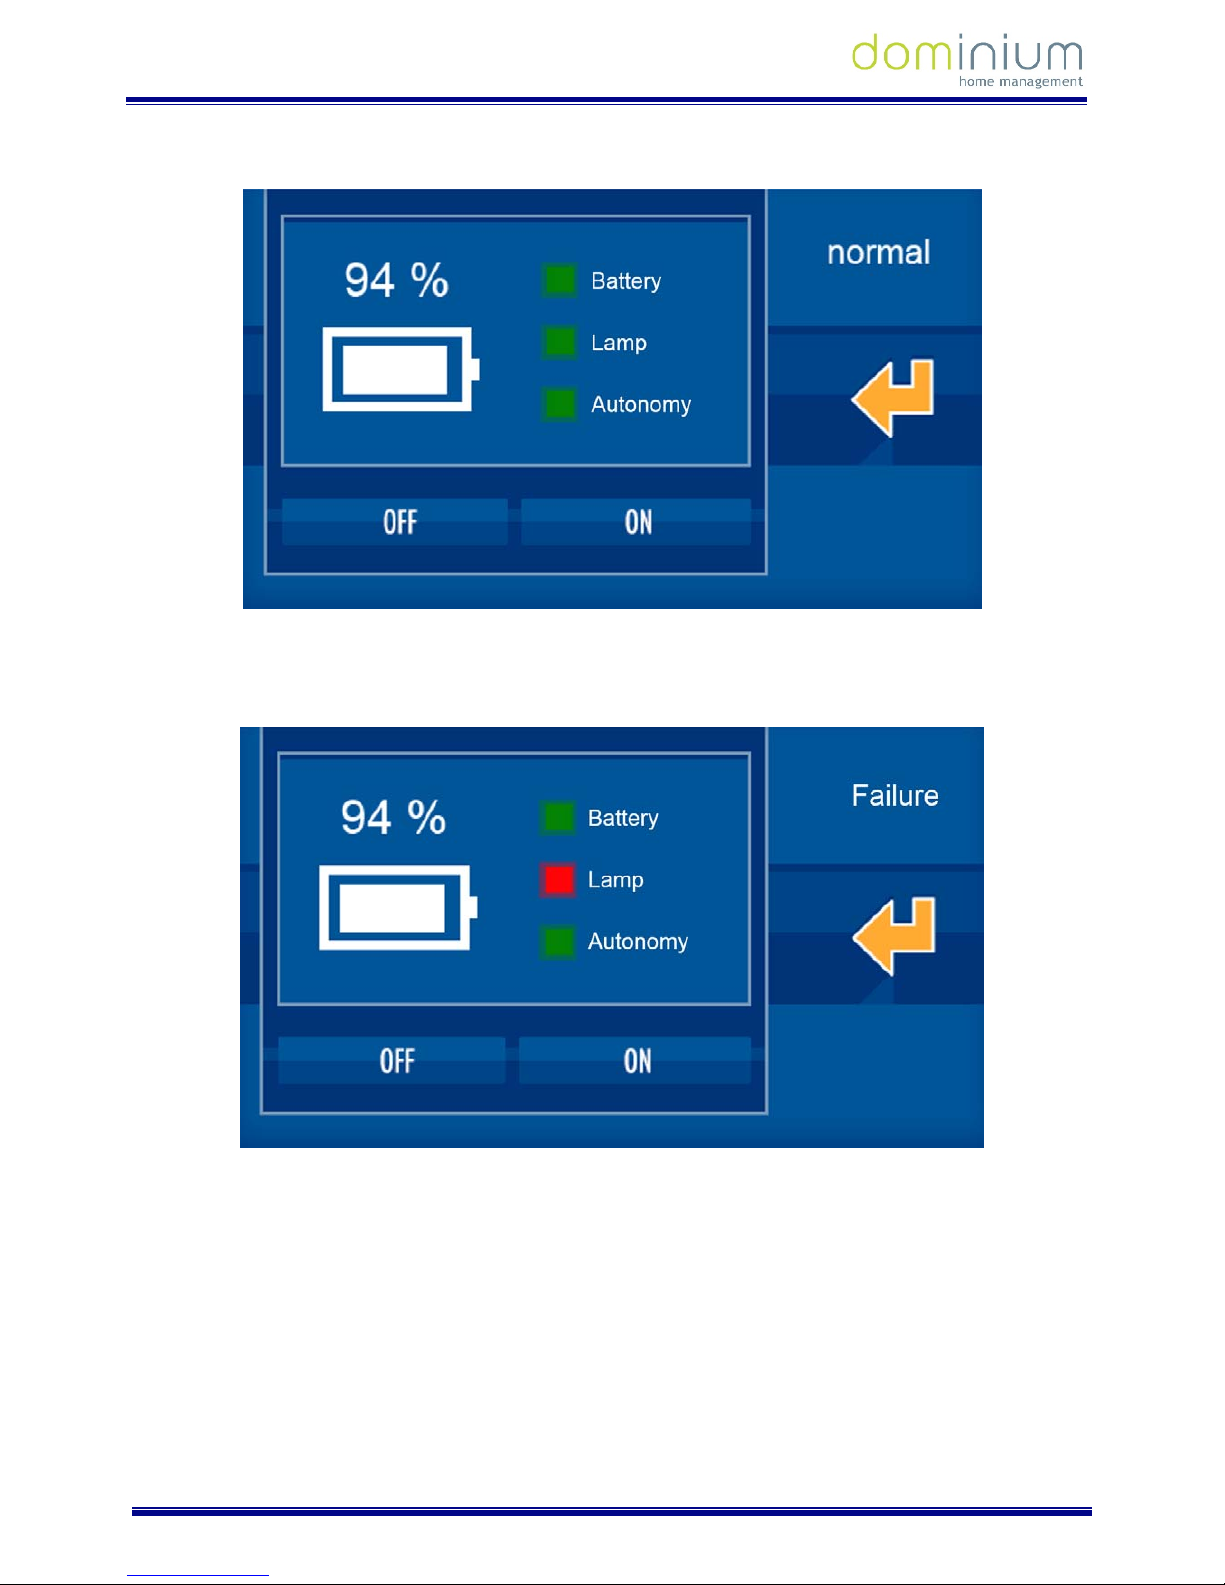
3.1.2.9 EMERGENCY LIGHTING:
By clicking on the previous icon we access the emergency lighting information corresponding to the icon on the
page. To display this information, a drop down window appears with the data on emergency lighting, like battery
Page 15
USER MANUAL
ILOFT VDS DOMINIUM MONITOR - V4.0
Graphic control
14 of 52
status (including percentage of charge), pipe status or equipment autonomy. As a complement, you can turn the
lighting on or off to check its proper performance.
As you can see, in the middle it shows the lighting’s status, offering information on its battery percentage, tube
or autonomy. If any of these fail, they are shown graphically on the screen, as we can see in the following
capture.
This is also possible from the ON and OFF buttons, turning the lights on and off as we previously mentioned to
check its performance.
Page 16
USER MANUAL
ILOFT VDS DOMINIUM MONITOR - V4.0
Graphic control
15 of 52
3.2 UPPER SCENARIO ROW.
The upper bar, which appears after swiping the main screen down, displays all of the configured scenarios in the
project since the SIDE, and also includes an icon on the left (always visible) that allows you to create new
scenarios, along with editing or deleting those that have been created on the screen itself. Scenarios imported
from SIDE may not be edited from the monitor.
3.2.1 EXECUTE A SCENARIO
To execute a scenario from SIDE, just drag to it from the upper bar, and press on the scenario’s icon.
To execute a scenario edited on the screen, just swipe the scenario bar horizontally until the last positions
(furthest to the right), which his where the user programmed scenarios are. Once you find the scenario, just
press on the selected icon.
3.2.2 CONFIGURATION OF SCENARIOS.
When editing a new scenario, press on the icon on the left upper bar , and it will open a new window
dedicated to scenario configuration. This window is divided into three parts:
A first zone (1) on the left part with a list of already created scenarios. Another zone (2) on the right part of the
icons associated to this scenario and its status and last zone (3 - lower horizontal bar) with the icons that can be
incorporated to the scenario we are editing.
Page 17

USER MANUAL
ILOFT VDS DOMINIUM MONITOR - V4.0
Graphic control
16 of 52
3.2.2.1 ADD A SCENARIO
By clicking on the add a new scenario icon , an on-screen keypad appears with which you can name a new
event to later be associated to the desired status icons.
3.2.2.2 REMOVE A SCENARIO
Press the remove a scenario icon , to delete the selected event (of those previously configured on the
screen).
3.2.2.3 EDIT A SCENARIO
By accessing the monitor scenario configuration , we can modify the scenarios previously created from
the graphic interface. For this, just press on the scenario on the vertical list of the left zone of the screen. Once
within the scenario, you can add or remove references of all the available icons in the lower horizontal bar.
Page 18

USER MANUAL
ILOFT VDS DOMINIUM MONITOR - V4.0
Graphic control
17 of 52
To add events to a scenario, just drag the corresponding icons from the lower horizontal bar to the icon box on
the upper right. If you want to delete an event, just mark the corresponding icon by pressing it, and press the
remove button on the right of the screen:
.
If adding icons, the status of the output associated to this icon remains linked to the scenario, so that when the
scenario is executed, it will establish the statuses associated upon editing the scenario.
While editing scenarios, the monitor will only allow you to add icons that are represented in the levels discussed
in section 3.1 of this manual. You can edit the status to obtain in the scenario, for this you need to select each
icon in question and press the option
. That is, if upon editing a scenario the icon in question is off, we can
define that within the scenario, this icon’s status is lit.
Just select the status you want for each icon and it is defined and included in the corresponding scenario.
3.3 LOWER CONTROL BAR
The lower bar remains visible by pressing and dragging the main screen up. This way we can access all functions
described in this section.
Page 19

USER MANUAL
ILOFT VDS DOMINIUM MONITOR - V4.0
Graphic control
18 of 52
By pressing on the different available icons in the lower bar, new windows appear with the functions of each
section. In order to close the drop downs, just confirm the actions within the drop-down panel, or by re-pressing
the corresponding icon via which we open a new window.
In order to distinguish which option of the lower menu we are working in, all icons in the lower bar are in black
and white, while the selected option remains coloured. Below is an example where the sixth option of the menu
is lit (iLoft Configuration):
3.3.1 NOTEPAD
The iLoft has a touch notepad that allows you to draw or jot down notes, leaving a notice on the user’s general
screen.
Page 20

USER MANUAL
ILOFT VDS DOMINIUM MONITOR - V4.0
Graphic control
19 of 52
To access the notepad you must press on the corresponding icon located on the lower bar.
To draw or jot down a note simply slide your finger over the screen. If you want to delete something you can
select the eraser icon
available in the left area. To delete the notepad press on the trash bin icon
located under the eraser icon.
To confirm the note and return to the main screen press on the confirmation icon
located in the lower left
corner of the screen.
Whenever there is a note left on the notepad it is displayed with a notification on the main screen.
The graphic notepad allows you, on the upper left corner, to select the thickness and colour of the line drawn,
allowing for a more graphic or attractive result.
Page 21

USER MANUAL
ILOFT VDS DOMINIUM MONITOR - V4.0
Graphic control
20 of 52
3.3.2 TECHNICAL ALARMS NOTIFICATIONS
The iLoft video entry unit allows for up to 5 different technical alarms to be displayed when produced in the
installation, whether flooding, gas, fire, etc.
Whenever a technical alarm has been generated, the screen warns the user via an icon in the upper right corner
next to the WiFi signal icon
, and blinking the technical alarms icon in the lower bar’s menu options. If
you want to see which alarm has sounded you can press on the alarm icon in the screen’s lower bar.
To turn the technical alarm notification into a received alarm, stopping the icon from blinking, just press on the
delete button in the middle
, between the registered alarms vertical bar arrows. If you do not want to
delete the warning, you can press the validation icon on the right part
.
3.3.2.1 NOTIFICATIONS VIA EMAIL
From the technical alarms home menu you can also configure a list of up to 10 emails to send the generated
alarm notifications. For this just press on the
icon and select the icon to add a new email to the list via
the screen keyboard. To delete an email from the list, press the
icon with the selected mail.
Page 22

USER MANUAL
ILOFT VDS DOMINIUM MONITOR - V4.0
Graphic control
21 of 52
For each technical alarm on the installation, you can link the IP cameras to send images of the incident together
with the alarm notification email when it goes off. The technical alarms menu option is
which will give us
access to assigning these cameras for the notification of each alarm. Just activate or deactivate the cameras of
interest for each alarm, selecting or deselecting the corresponding IP.
3.3.3 SCHEDULE
The schedule allows you to program what day and when you want the monitor screen to execute one of the
scenarios in the memory, which can be programmed annually. To access the timer menu, press on the
corresponding menu on the lower right bar of the screen.
The start screen for the schedule is divided into two zones, the left, where a list of all the scenarios that have
been scheduled appear, and the right shows a calendar of the days it is programmed for.
Page 23

USER MANUAL
ILOFT VDS DOMINIUM MONITOR - V4.0
Graphic control
22 of 52
3.3.3.1 ADD SCHEDULE
On the vertical list on the left side, you find the set of schedules programmed on the monitor. To add a schedule
just press on the
icon and a new window appears to select the scenario, with two columns, one on the left
with the already created schedules, and another on the right with the available periods to schedule. It is in this
second block where we select the scenario that interests us and then press the confirmation button.
After selecting the scenario, go on to the next window that remains in two columns. The left one allows you to
select the level of repetition that a scenario occurs, and the calendar on the right places us on the date in which
to link the properties of the left hand column. A couple of fields to the right allow us to enter the hour on which
the timed event occurs on the selected date.
By levels of repetition:
Page 24

USER MANUAL
ILOFT VDS DOMINIUM MONITOR - V4.0
Graphic control
23 of 52
Add year: Add all the days of the year for the same schedule.
Add the whole month: Add the schedule for every day of the month in which the calendar on the right
is. For example, if we have 21 May selected, the monitor will configure the schedule for everyday of 1 to
31 May.
Add day of the week: Add the schedule for every day of the month in which the calendar on the right is
on. For example, if we have a Wednesday in May selected, the monitor will configure the schedule for
every Wednesday of the year.
Add specific day: Add the schedule exclusively to the day in which we are on. For example, if we have 21
May selected, the monitor will configure the schedule solely for 21 May.
Delete year: Delete the schedule for everyday of the year.
Delete month: Delete the schedule for every day of the month in which the calendar on the right is. For
example, if we have 21 May selected, the monitor will delete the schedule for everyday of 1 to 31 May.
Delete a day of the week: Delete the schedule for every day of the week in which the calendar on the
right is on. For example, if we have a Wednesday in May selected, the monitor will configure the
schedule for every Wednesday of the year.
Delete day: Delete the schedule exclusively for the day in which we are on. For example, if we have 21
May selected, the monitor will delete the schedule solely for 21 May.
On the right side of the window, a text field with time schedule
, allows you to establish the hour in
which we want to run the scenario. This is the value associated to the selected dates, as explained in the
previous paragraphs. To enter these values, just press on the corresponding boxes, and a numerical keypad will
appear to edit them
Once we reached the desired configuration, just press the confirmation icon
for the timers to be
stored. To delete the whole configuration, just press the
icon.
3.3.3.2 DELETE A SCHEDULE
To delete a previously made schedule on the monitor, you must select it on the vertical list on the left side of the
screen Once selected, press the
icon, a confirmation message appears to accept the deletion or to
cancel it
.
Page 25

USER MANUAL
ILOFT VDS DOMINIUM MONITOR - V4.0
Graphic control
24 of 52
3.3.3.3 EDIT A SCHEDULE
To edit a previously made schedule on the monitor, you must select it on the vertical list on the left side of the
screen.
Once selected, pressing the
icon, the previously described screen drops down to add a schedule. On this
screen we can add or delete schedules for the previously selected scenario, taking advantage of the repetition
levels as discussed in point 3.3.3.1 Add schedule. To accept the changes press
or to delete
them.
3.3.3.4 ACTIVATE /DEACTIVATE A SCHEDULE
The monitor allows you to activate/deactivate a timer without needing to delete it. This option is interesting
when you want a schedule to temporarily stop running, but we want to maintain the configuration to recuperate
it later on, and avoid having to edit all of it again.
To do this, just mark or unmark the icon on the left of the schedule in the vertical list of the configured
schedules. To change the icon's status, just press on it. The steps are as follows:
Schedule activated
Schedule deactivated
Page 26

USER MANUAL
ILOFT VDS DOMINIUM MONITOR - V4.0
Graphic control
25 of 52
If in the previous example we click on the icon, the schedule remains deactivated and does not execute until
reactivated by clicking on the icon.
3.3.4 INTRUDER ALARM
The intruder alarm icon, identified below, allows you to activate/deactivate the intruder alarm.
After pressing the indicated icon, a numeric keypad appears on the screen to enter the user code: 1234 (By
default).
Once the 4 digits are entered, just press OK to confirm and activate/deactivate the intruder alarm. The system
will change its status: If deactivated, it will be activated, and if activated, it will be deactivated.
Page 27

USER MANUAL
ILOFT VDS DOMINIUM MONITOR - V4.0
Graphic control
26 of 52
When the intruder alarm is deactivated, the
icon is fixed in the lower horizontal bar. Once the intruder
alarm system is activated, the
icon blinks continuously.
3.3.5 PRESENCE SIMULATION
The icon indicated in the following image allows us to activate/deactivate the presence simulation in the home.
By pressing it, a dialogue box will appear in which you have to confirm or cancel the presence simulation
system’s activation/deactivation: Then the following is displayed:
To activate:
To deactivate:
To accept press
otherwise press to cancel the activation/deactivation.
Page 28

USER MANUAL
ILOFT VDS DOMINIUM MONITOR - V4.0
Graphic control
27 of 52
When the presence simulation is deactivated, the icon is fixed in the lower horizontal bar. Once the
presence simulation is activated, the
icon blinks continually.
3.4 CONFIGURATION MENU
In this section we can edit the different configurable parameters, which have 9 options that are described
below:
Once the configuration icon is pressed, a window with the menu options opens
3.4.1 WIFI CONFIGURATION
The WiFi configuration option allows you to edit the wireless network’s name to which the screen is connected
to, and its access password. As a complement, you can establish the screen’s IP address, subnet mask and local
network’s gateway.
Click on the following menu option to access:
In the first WiFi screen the text fields for configuration of the local network are displayed (network name,
password and encryption type). It also allows you to mark a field ad hoc to create the screen’s own wireless
network to then connect other equipment directly, like PCs, tablets or Smartphones without needing to depend
on an access point.
Page 29

USER MANUAL
ILOFT VDS DOMINIUM MONITOR - V4.0
Graphic control
28 of 52
To edit the fields just press on them and use the on-screen keypad that drops down.
Within the editable parameters:
SSID: Public name of the wireless network to which video entry unit connects to. When the editable
fields are selected, a list with all of the available WiFi networks drops down, displaying each of their
coverage. If activating the AP field (Access Point), it is the wireless network’s name that the screen
generates and to which the equipment will be connected to if wanting to communicate with it. When
configuring an AP in the drop down list, you must choose the “Other…” option, and edit the name with
the on-screen keypad.
Steps: Wireless network password. Leave it as “none” if you do not want a password. If activating the AP
field (Access Point) and WEP or WPA, it is the wireless network’s password that the screen generates
and that must be entered if wanting to establish communication.
Type of encryption: This allows you to select the encryption characteristics to connect to the local
network via WiFi: WEP and WPA.
Selecting the AP option (Access Point), the video entry unit allows you to create its own wireless
network (without requiring an access point) to which the different equipment from which you want to
Page 30

USER MANUAL
ILOFT VDS DOMINIUM MONITOR - V4.0
Graphic control
29 of 52
control the installation may connect to (PCs, tablets, smartphones, etc). The wireless network will have
the visible name as indicated in the SSID field (Option “Other…” from the editing drop-down menu) and
the password from the password field. For the password, the type of encryption is that which we mark in
the selectable field WEP, WPA, or no encryption if we select none.
When AP mode is activated, the WIFI coverage icon in the upper right corner changes to this other one
, to inform what type of configuration the video entry unit has. Once the AP mode is configured,
the screen’s WiFi module takes a few minutes to restart, so you must wait until the wireless network is
available for connection.
By pressing on the icon from the upper right of the screen, you access the configuration of parameters within
the local network.
Page 31

USER MANUAL
ILOFT VDS DOMINIUM MONITOR - V4.0
Graphic control
30 of 52
This option allows you to establish the screen’s IP address, subnet mask and local network’s gateway to connect
to.
The following are the configurable parameters:
IP Address: The screen’s IP address within the local network.
Subnet mask: the local network where the video entry unit is installed.
Gateway: The gateway through which the screen has to the exterior, generally the router’s address.
You can configure the network parameters for it to be the router (or the screen itself, if AP mode is activated)
who assigns the IP address, the subnet mask and the Gateway automatically on the equipment. For this you
need to activate the DHCP option.
To validate the data and return to the previous screen (not to save them yet), press
.
Once you have completed editing, upon pressing
on the screen where you edit ssid, the video entry unit
displays the following message:
Page 32

USER MANUAL
ILOFT VDS DOMINIUM MONITOR - V4.0
Graphic control
31 of 52
To confirm saving these changes. To save the changes press
, to cancel them press .
3.4.2 SECURITY
In this menu option the user can activate monitor usage protection via a 4 digit password, or modify this
administrator screen password, which is necessary to carry out actions like activating/deactivating the intruder
alarm. To manage this video entry unit administrator password, you must access the menu option indicated
below.
The interface is divided into two options, a left area for activation/deactivation of the number code block, and
the right area to change the password.
Using the bar on the left side, you can activate or deactivate the screen block, for which it requests an
administrator password. Once activated, the yellow icon is displayed, indicating that the block is activated.
When the video entry unit is in stand-by (screen off or dimmed after a few seconds of inactivity), and the user
touches the screen, this password is requested to be able to access the home automation application.
Page 33

USER MANUAL
ILOFT VDS DOMINIUM MONITOR - V4.0
Graphic control
32 of 52
On the right side, the application lets you modify the video entry unit’s administrator password, using various
menu options. Once the change is accessed, the screen asks for the current password, necessary to be able to
continue with the process.
Once entered press
. Then, if the current password is entered correctly, the screen will ask for the new 4
character long password.
Page 34

USER MANUAL
ILOFT VDS DOMINIUM MONITOR - V4.0
Graphic control
33 of 52
In order to guarantee proper insertion with the touch screen, and to avoid errors when entering the password, it
is asked for a second time to compare it with the first one.
If the new password is entered erroneously, or the two consecutive attempts do not coincide, the screen will
display the corresponding error message. If the new password is entered correctly, the screen will display an OK
and the new password becomes the current one for activating/deactivating the intruder alarm.
3.4.3 SYSTEM RESTART
The "System Restart" option in the options menu, with the icon indicated below, allows for various options
associated to the video entry unit’s maintenance and operating mode.
Accessing this menu option (after requesting for the administrator password) you get 4 alternatives, described
below:
Page 35

USER MANUAL
ILOFT VDS DOMINIUM MONITOR - V4.0
Graphic control
34 of 52
Reboot: Restart the system to resolve any inconsistent situation that could have been produced. The
video entry unit restarts again after a few seconds.
Restore Data: The application restores the internal database, and restarts it as a clean system,
maintaining the project but without historical registries, schedules, new edited scenarios, etc. The video
entry unit restarts a few seconds after the process.
Home Automation Mode: This presents the "Home Automation Mode" application, with maps, icons on
the maps, scenarios, schedules, technical alarm management, etc. The video entry unit starts again a
few seconds after the process.
Efficiency Mode: Activate "Efficiency Mode" to control and view consumption measuring equipment
and/or thermostats. The video entry unit restarts after a few seconds of the process.
Having chosen some of the previous options, the system asks for confirmation to guarantee the voluntary
selection, and if the user confirms the selection, the system restarts with the desired changes.
3.4.4 FIRMWARE UPDATE
This option downloads the latest available software version for the video entry unit (only if there is a new
version and the video door entry device is connected to the Internet), installing the update immediately and
restarting it automatically. When this option is selected from the menu, the screen displays the following
message on the screen:
To accept, press
, to exit without updating press . If you accept, the yellow progress bar
under the menu icon appears on-screen indicating the download status of the software update, and when
finished, the process is complete.
If there is a new software version on the server, the screen completes the process and restarts automatically. If
upon completing the update process the screen does not restart, the latest software version is already installed.
In a short period of time, the screen will be updated to the latest software version and maintain the same
BUSing project installed prior to the process.
3.4.5 SEARCH OF EQUIPMENT WITHOUT ADDRESSES
When working with new equipment from the factory connected to the installation, and they are not
programmed, the application can detect these nodes and assign them an address.
Page 36

USER MANUAL
ILOFT VDS DOMINIUM MONITOR - V4.0
Graphic control
35 of 52
The new equipment without programs launches a periodic message to the bus, which the video entry unit can
receive and display on screen as shown below.
For each equipment, you can
3.4.6 TIME ZONE
This option helps select the time zone in which you find yourself, so as to set the screen’s clock to the
corresponding zone, guaranteeing proper execution of the timed scenarios.
If the screen has internet connection, the time is set automatically from the network, so it is only necessary to
set the time zone for where it installed to adapt to the international time.
The tool has a search engine so you do not have to go through the whole list, selecting the point directly.
You can just select the city and confirm it by pressing
.
Page 37

USER MANUAL
ILOFT VDS DOMINIUM MONITOR - V4.0
Graphic control
36 of 52
3.4.7 EMAIL LIST
You can receive notifications from the video entry unit via email. For this, just edit the email list with those used
for different notifications.
Using the + and - buttons, the user has the option of adding new email addresses to the list or delete the
selected ones.
In the home automation application, the video entry unit will notify the included emails, the programmed
technical alarms recorded (For example, flooding, fire, intrusion, etc.) Meanwhile, in the energy efficiency
application, the application will inform the user via email of any rise in consumption of any of the controlled
channels or any surpassing the established threshold.
3.4.8 LANGUAGE
On the video entry unit configurations panel, you can select the screen language, so that the texts displayed in
the different menus are translated to the language selected by the user. To select the one that interests us, just
press on the icon indicated to select from a list of supported languages, until having found the desired language
(ES - Spanish, FR - French or EN - English).
Once you have selected the screen language, just press
to confirm it and load the texts.
Page 38

USER MANUAL
ILOFT VDS DOMINIUM MONITOR - V4.0
Graphic control
37 of 52
3.4.9 REGISTER INSTALLATION
This menu option is indispensable for registering the project on the ingenium server and for making it available
for remote control via the ingenium applications for PC, iOS, Android and Samsung SmartTV.
Accessing this tool you must press on "Register device," and then enter the username and password that the
client wants to have to access their installation’s controls remotely.
Once all user password fields are filled, just press
to confirm it and start the server upload process, after a
few on-screen validation questions.
Upon completing the process, the screen restarts, and the project remains accessible remotely via the ingenium
APPS, with the defined username and password.
If you want to unregister and delete a project from the server, repeat the operation, but this time the available
operation is "Restore data" (this option can only be accessible if the project was previously registered). If you
Page 39

USER MANUAL
ILOFT VDS DOMINIUM MONITOR - V4.0
Graphic control
38 of 52
decide to delete the server’s project, the screen will request confirmation from the user prior to starting the
process.
After confirming, the project is deleted from the server, and may not be controlled remotely. If you want to
upload the project up to the server again, the user can do so by registering their device again and defining the
username and password.
If a change is made on an already started project, you must restore data (delete the project from the server) and
re-register the device (upload the server’s project) so that the project is in the server in its latest version. This
way we can guarantee that the project accessible remotely for controlling the installation via the APPs is the
latest version.
3.5 WEATHER FORECAST
The weather forecast allows you to see the weather predictions for previously configured places, providing rain
forecasts, maximum and minimum temperatures, etc.
Upon pressing the previous icon, a window drops down showing the forecast for the next three days of the
previously configured city, along with the current day. The upper arrows let you move through the previously
added cities, checking their forecast.
Page 40

USER MANUAL
ILOFT VDS DOMINIUM MONITOR - V4.0
Graphic control
39 of 52
3.5.1.1 EDITING LOCATIONS
The screen allows you to add or delete forecast locations for future searches. For this just use the icons on the
lower-right, pressing the
button to add a new city, and the button to delete the current city you are
currently searching.
To add a location, an on-screen keyboard appears, and as the characters are entered in the text field, the list
limits the locations until defining the one we are searching for. Using the arrows on the right we can go through
the vertical list of available cities.
Page 41

USER MANUAL
ILOFT VDS DOMINIUM MONITOR - V4.0
Graphic control
40 of 52
Once selected from the vertical list of results, to add the location to our screen just press the icon amongst
the vertical drop down arrows, to add it to the iLoft memory. The new location is added in the last position of
the already configured list. To access your forecast just swap the start screen sideways.
Page 42

USER MANUAL
ILOFT VDS DOMINIUM MONITOR - V4.0
Graphic control
41 of 52
4 OPERATING IN ENERGY EFFICIENCY MODE
In this mode you are optimising the control of thermostats and consumption meters, along with viewing their
status instantaneously and/or accumulated in the established period.
The application of efficiency is divided into two large groups:
Control
View
To access either of these, just press on the button on the upper left of the screen. Once pressed, a new mode
appears.
4.1 CONTROL
In the control part, you can manage the operating mode of the consumption meters or thermostats.
The first action to take on the control interface of the energy efficiency must be to focus on the column on the
left side where you choose the element to control:
Thermostats
Consumption meter
.
Once this selection is made, the upper horizontal bar
allows us to move sideways to a
specific element that we want to control (in case there is one or more elements of this type selected). Once the
Page 43

USER MANUAL
ILOFT VDS DOMINIUM MONITOR - V4.0
Graphic control
42 of 52
specific element to control is selected, we can act upon it in the central part of the screen, over the information
displayed.
For thermostats, you can activate or deactivate the thermostat (On- Yellow, Off - White). The average
temperature continues functioning to include registries but not make decisions on how to turn the boiler on or
off, for example), view the measured temperature, set the temperature with the + or - buttons, and the
operating mode by pressing on any of them.
The operating modes are as follows:
Cooling Mode (Summer) – When there is need for cooling in the installation
Heat Mode (Winter) – When there is need for heating in the installation
Mixed mode– Both modes simultaneously
The operating mode selected is marked in yellow.
Page 44

USER MANUAL
ILOFT VDS DOMINIUM MONITOR - V4.0
Graphic control
43 of 52
For the consumption meters, you can establish the threshold for each channel upon which programmed
commands will be executed if this value is surpassed. This value can be changed by using the side arrows for
each one.
4.2 VIEW
In the view section the horizontal bar on the upper section allows you to select the equipment to view its
evolution (consumption meter or thermostat). .
In the column on the left you have three menu options:
Select the query period for the total registries.
Check and view the registries instantaneously
Check and view the total registries during the selected period in point 1.
Page 45

USER MANUAL
ILOFT VDS DOMINIUM MONITOR - V4.0
Graphic control
44 of 52
4.2.1 TOTAL REGISTRIES PERIOD
This menu option allows you to select the range of dates to view the total registries. As a quick access, you can
define them to the current day, for the last week or last month. For other customised periods, select the last
option and show a calendar that gives the option to choose the range's start date and end date. Below are some
examples in image capture:
Page 46

USER MANUAL
ILOFT VDS DOMINIUM MONITOR - V4.0
Graphic control
45 of 52
After having completed the selection process, the calendar icon shows the established range in the lower part.
4.2.2 INSTANTANEOUS VALUES
The application includes information issued from thermostats or consumption meters, and is capable of
processing and showing them in a real evolution graph, with up-to-date consumption instantaneously. This way
we can see the evolution of consumption or temperature during these times.
Page 47

USER MANUAL
ILOFT VDS DOMINIUM MONITOR - V4.0
Graphic control
46 of 52
If the consumption meter has more than one channel, you can select the one that interests you most in the
listed circles on the right of the screen by simply pressing what was desired.
4.2.3 TOTAL REGISTRIES
In this section we see the total registries, according to the selected period in the first option of the view menu.
According to the indicated range, the included values are displayed.
If you want to show a specific channel of a consumption meter with various channels, just select it in the column
of circles on the right of the interface.
Page 48

USER MANUAL
ILOFT VDS DOMINIUM MONITOR - V4.0
Graphic control
47 of 52
4.3 CONFIGURATION MENU
The configuration menu, accessed via the button in the upper right corner, has 9 options.
The explanation of each of these options is found in section 3.4 Configuration Menu of this manual.
Page 49

USER MANUAL
ILOFT VDS DOMINIUM MONITOR - V4.0
Graphic control
48 of 52
5 RECOVERY SCREEN.
This screen is shown when the video door-entry system enters in an inconsistent mode, facilitating the tools to
restore specific values or to recuperate the device from operating problems.
The screen has four options: Restart the complete video entry unit project
, configure the WiFi network on
the screen
, restore the vital application files from the ingenium server for the screen to work (for these
options you need an internet connection) and the last option, restore to default values
.
5.1.1 RESTART PROJECT
This first menu option restarts the screen, resolving minor problems that may be presented. This is the fastest
solution to recuperate a mistake in the system, and the first to recur to in any case. If the problem persists, you
can go to any of the other options explained below.
5.1.2 WIFI CONFIGURATION
This allows you to configure the WiFi connection to the screen, using the same interface as explained in section
3.4.1 WiFi Configuration. Just press on any point on the blue rectangle to access the tool.
5.1.3 SYNCHRONISATION
The synchronisation downloads all of the application's vital files for the screen's function, reinstalling all files and
updating the equipment to the latest available firmware version. To access the tool, press it on the menu. After
completing the synchronisation process, the screen restarts.
For proper performance of this tool, you need a properly configured WiFi and the screen must have an internet
connection.
Page 50

USER MANUAL
ILOFT VDS DOMINIUM MONITOR - V4.0
Graphic control
49 of 52
5.1.4 RESTORE DEFAULT SETTINGS.
This option lets you restore the screen to the default setting. Sometimes this option can solve stability problems
relative to the screen’s function. When you select this tool, the screen asks for a user password to confirm the
operation.
Once the password is entered, the included scenarios are deleted, along with the schedules and other elements
edited by the user ( WiFi-network, cities for the weather forecast, time zone, etc.), but the project with the
diagrams and icons, along with the scenarios edited by the integrator, are intact after the parameters are
restored to default.
Page 51

USER MANUAL
ILOFT VDS DOMINIUM MONITOR - V4.0
Graphic control
50 of 52
6 INSTALLATION
Page 52

NOTES
 Loading...