

Page 1
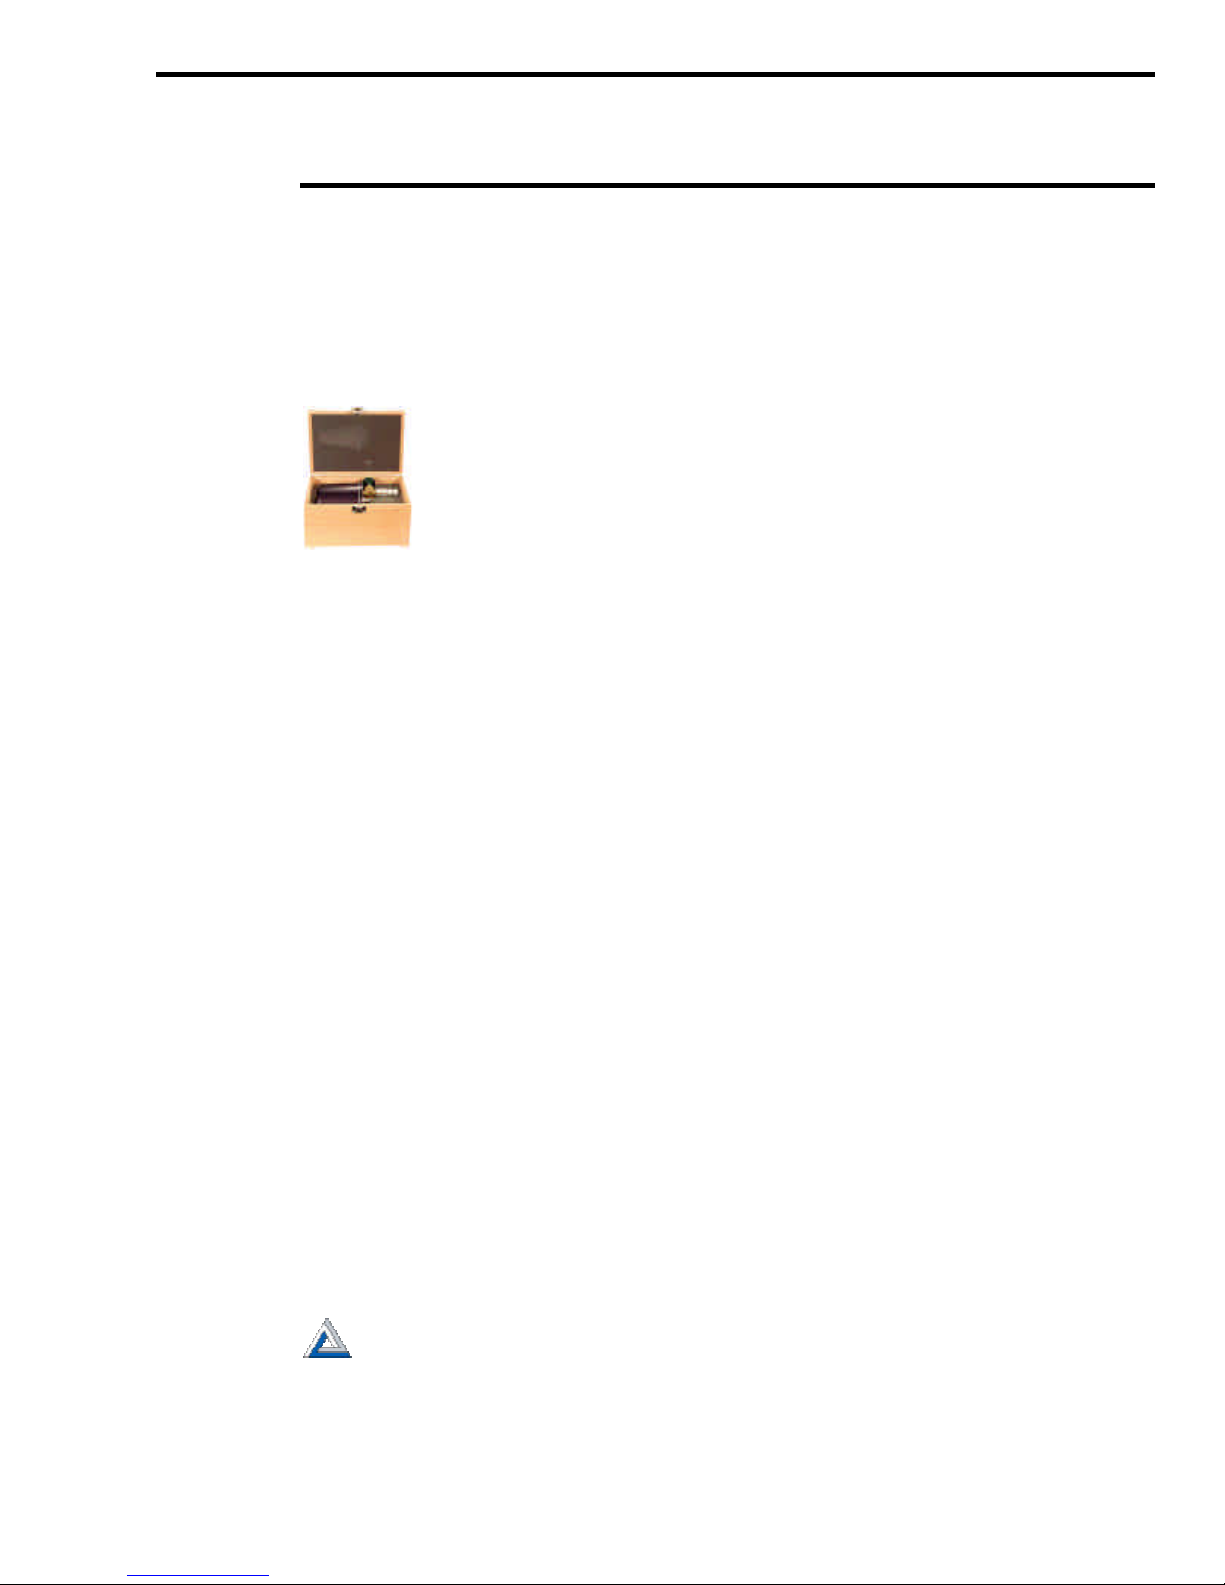
Model LET-SW2
June 2004
OPERATION MANUAL
Far West Technology, Inc.
330 South Kellogg Ave, Suite D
Goleta, CA 93117
Page 2

GENERAL INFORMATION
This instrument is manufactured in the United States of America by:
Far West Technology, Inc.
330 South Kellogg Ave, Suite D
Goleta, CA 93117-3814
Tel: 805.964.3615
Fax: 805.964.3162
Email: [email protected]
Web Site: www.fwt.com
Far West Technology has been manufacturing radiation measuring devices since 1972.
REPAIR SERVICEREPAIR SERVICE
Although we design and manufacture our instruments to a high standard, we realize that repairs are sometimes
necessary. If you believe service is needed on this instrument please call our service department before shipping
the instrument to us for repair; often we can help you with simple problems. If you do decide to return it to us for
repair then please include:
1. Contact person’s name
2. Organization or Company name
3. Address
4. Phone number of contact person
5. Description of the problem
6. Anything else you may think important
We will inform you of the repair charges and wait for your authorization before we repair your instrument.
TABLE OF CONTENTS
I. INTRODUCTION ..............................................................................................................................2
II. PHYSICAL CHARACTERISTICS OF THE INSTRUME NT........................................................2
III. FILLING THE INSTRUMENT WITH GAS ...................................................................................3
IV. ELECTRICAL CHARACTERISTICS............................................................................................3
V. INTERNAL ALPHA SOURCE.......................................................................................................4
VI. TYPICAL SPECTRUM FROM
VII. TYPICAL OPERATION OF THE INSTRUMENT........................................................................4
252
CF NEUTRONS.....................................................................4
VIII. DATA REDUCTION METHODS ..................................................................................................5
IX. REFERENCES..............................................................................................................................5
MODEL LET -2 FAR WEST TECHNOLOGY 1
Page 3
I. INTRODUCTION
Wall thickness: .05 In, .13 cm
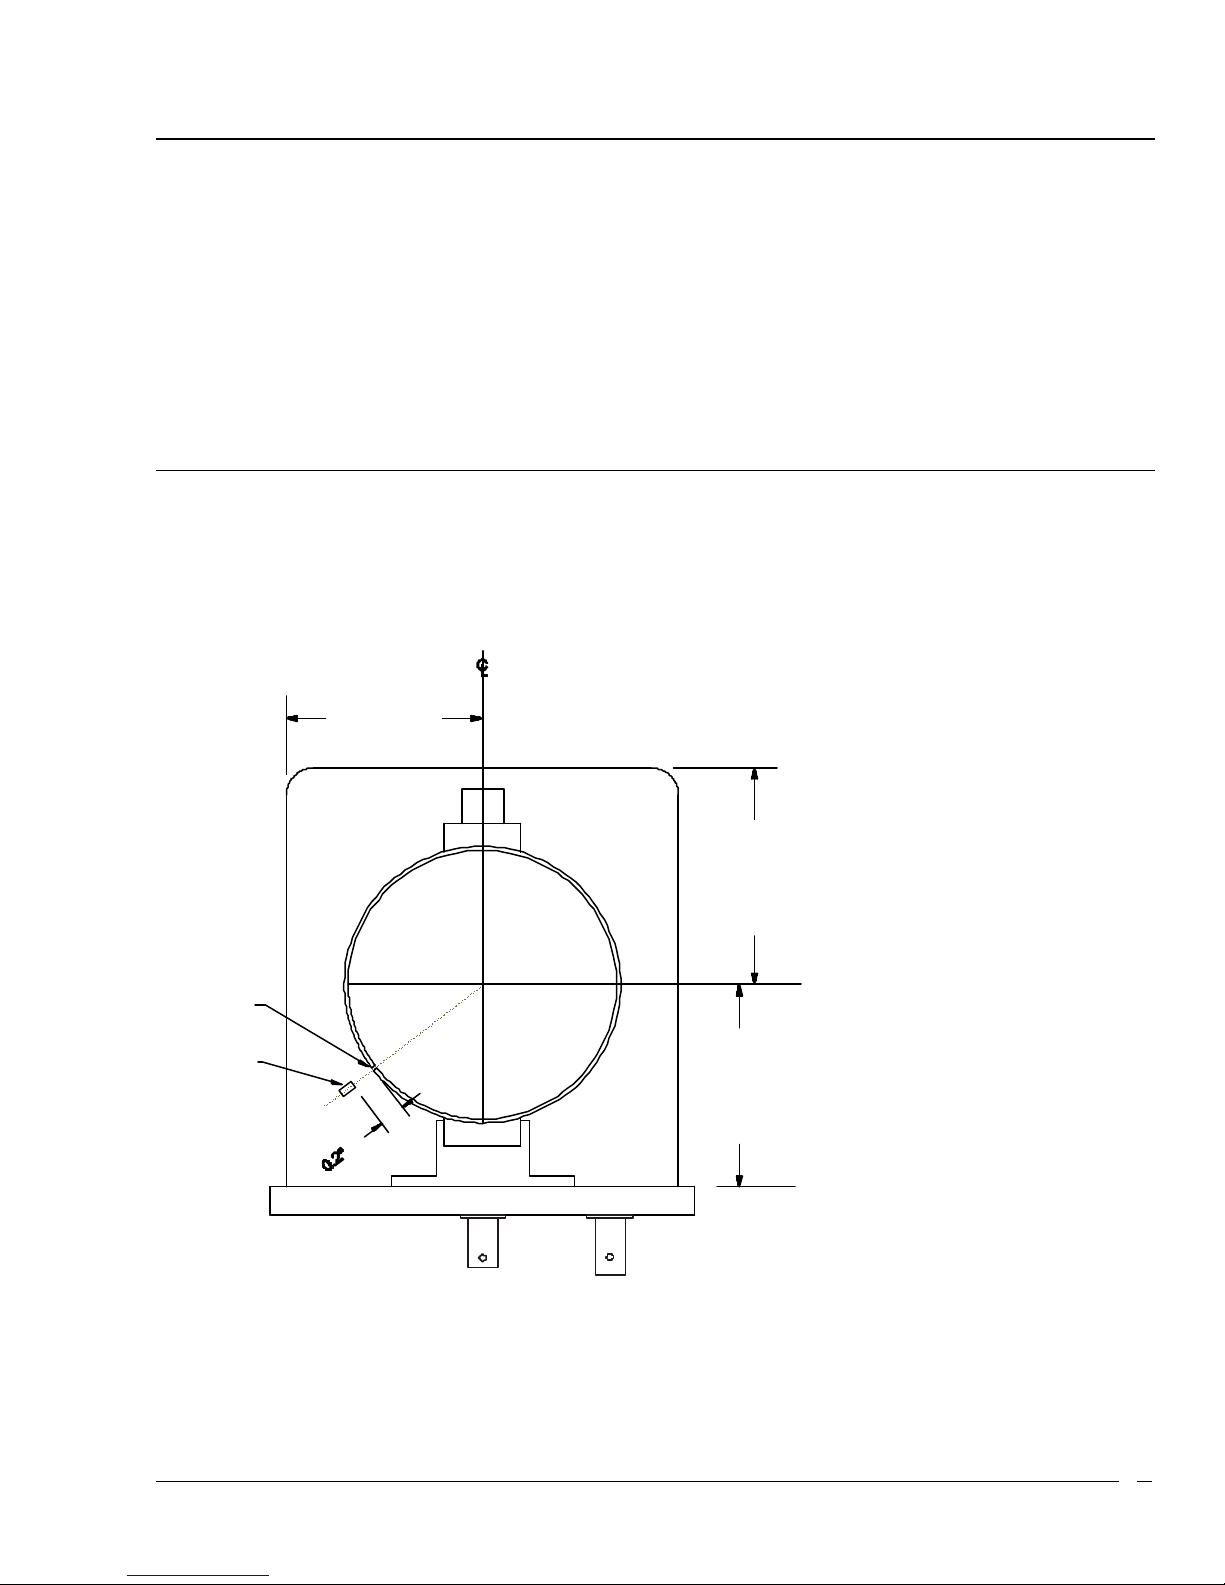
The instrument, as shown in Figure 1, is a spherical tissue equivalent proportional counter. It is usually filled with
tissue equivalent gas at a reduced pressure. An aluminum shell is used as a vacuum tight container for the sphere
and is mounted on an aluminum plate, which holds the electrical and gas connectors.
The instrument is generally used to accumulate a pulse height spectrum proportional to the energy deposited in
the sensitive volume. This spectrum may then be transformed into a distribution of absorbed dose in LET with the
aid of computer processing (or, at less convenience, by hand).
Simple electronic processing of the pulse height data as it is accumulated can also be used to allow measurement
of exposures in Rads -tissue directly. This technique involves scaling of the oscillator pulses in the common
Wilkinson type ADC used in most analyzers.
II. PHYSICAL CHARACTERI STICS OF THE INSTRUMENT
The detector is a spherical cavity in tissue equivalent plastic (Shonka Type A-150)
1,2
with a 2.24 inch (5.69 cm)
internal diameter. An aluminum can surrounds the TE plastic that provides electrostatic shielding and serves as a
vacuum tight container. The aluminum is 0.063 inch (0.159 cm) thick. The plastic sphere is 0.125 inches
(0.318cm) thick, which is sufficient for proton equilibrium at least to 20 MeV.
The collecting wire is positioned on a diameter of the sphere. This design is similar to those originally published
by H. H. Rossi and associates.
1.75"
4.4 cm
.040 Hole
6-8
The collecting wire is .005 inches (0.0127cm) in diameter.
1.89”
4.8 cm
Inside Diameter: 2.35-2.40 In, 5.97-6.1 cm
Figure 1 Dimensions of LET-SW2 Detector
MODEL LET -2 FAR WEST TECHNOLOGY 2
1.84”
4.67 cm
Page 4
III. FILLING THE INSTRUMENT WITH GAS
The standard ins trument is provided with a Quick-Connect manufactured by Crawford Fitting Company. This
connector mates with a Swagelok B-QC4-D-400 DESO-type connector. These connectors contain spring loaded
plungers that seat against elastomeric o-rings providing a gas -tight seal. Experience will allow the gas filling tube
to be "snapped off" the instrument with no detectable change in instrument gain. Dirt must not be allowed to get
into the Quick-Connect. It will invariably cause instrument gain shifts with time. When a bellows valve is used,
this is not a problem.
The usual procedure for gas filling is, initially, a pump down to 5 to 10 microns with a good quality rotary pump.
Liquid nitrogen cold traps may be useful, but have not been found necessary. The instrument is then filled to about
50 cm Hg with tissue equivalent gas and pumped down to 5 to 10 microns. This procedure may be repeated if the
instrument has not been in use for some time.
The instrument is next filled to the proper pressure for operation. This is determined by the tissue equivalent gas
density. Our usual gas mixture is 29.9% CO2, 2.75% N2 and 67.54% CH4 by volume with a density of 1.062 grams
per liter at 20 c and 760 mm Hg. The instrument cavity is 2.24 inch in diameter (5.69 cm) and thus a pressure of
1.26 cm Hg will simulate a cavity of about 1 x 10⁻⁶ meter diameter in density 1.00 tissue. This effective diameter
can be made smaller or larger by variation of the gas pressure. A more recent tissue equivalent gas mixture5
composed of 39. 6% CO2, 5.4% N2 and 55% propane has been used with equivalent results. Addition of 10%
isobutane will provide better operation at very high multiplications.
Gas purity is of considerable importance in counter operation. Poor resolution, gain or a low voltage arc -over point
are evidences of gas problems. Water in the gas will invariably cause arc -over. A dew point of -40°c or lower is
recommended.
IV. ELECTRICAL CHARACTERISTICS
The end plate carries the signal and high voltage connectors. The high voltage should be negative with respect to
ground, i.e. the center wire of the H.V. cable should be positive with respect to the shield. The voltages needed for
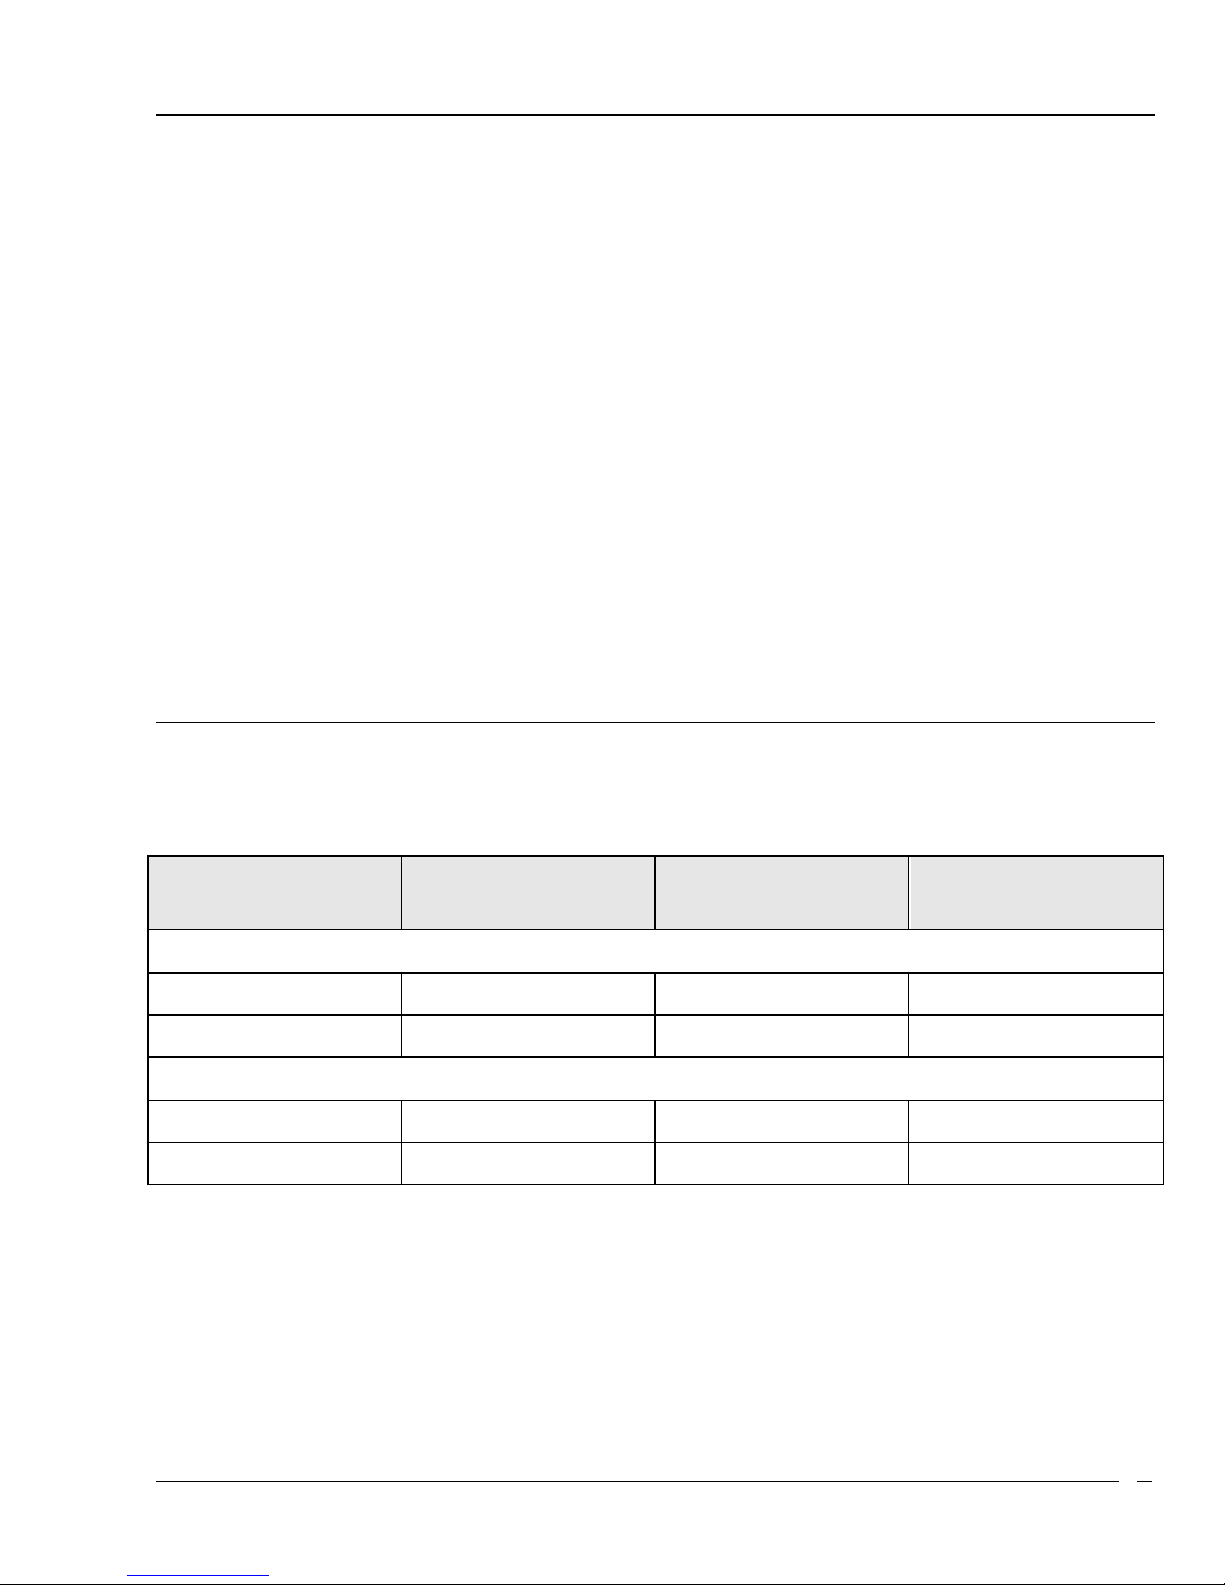
operation is given below:
Counter Diameter Gas Pressure Negative Operating
Arc-Over Voltage
Volts
Methane Base TE
1 micron 1.26 cm Hg 600-700 800
2 micron 2.52 cm Hg 700-800 950
Propane Base TE
1 micron 0.74 cm Hg 500-600 650
2 micron 1.48 cm Hg 600-700 750
Arc-overs should be avoided due to the inevitable insulator carbon tracking which occurs. This can seriously
degrade the chamber performance. Large arc -overs can transfer enough charge to destroy the input FET on some
preamplifiers. If a solid-state preamplifier is used, it is usually necessary to limit the rate of rise of the high voltage
so that switching transients do not destroy the first amplifier stage semi-conductor. If high voltage is applied to the
bias connector on your preamplifier, use a positive voltage.
The signal from the detector appears on the connector block marked SIG. This connector mates with BNC cable
connector UG-260/U. Low noise cable such as Microdot (Malco) 250/3834-0000 should be used for best low noise
performance. The cable length should be as short as possible to reduce input capacity. There are no coupling
capacitors in the signal circuit. The pulses produced are negative going.
MODEL LET -2 FAR WEST TECHNOLOGY 3
Page 5
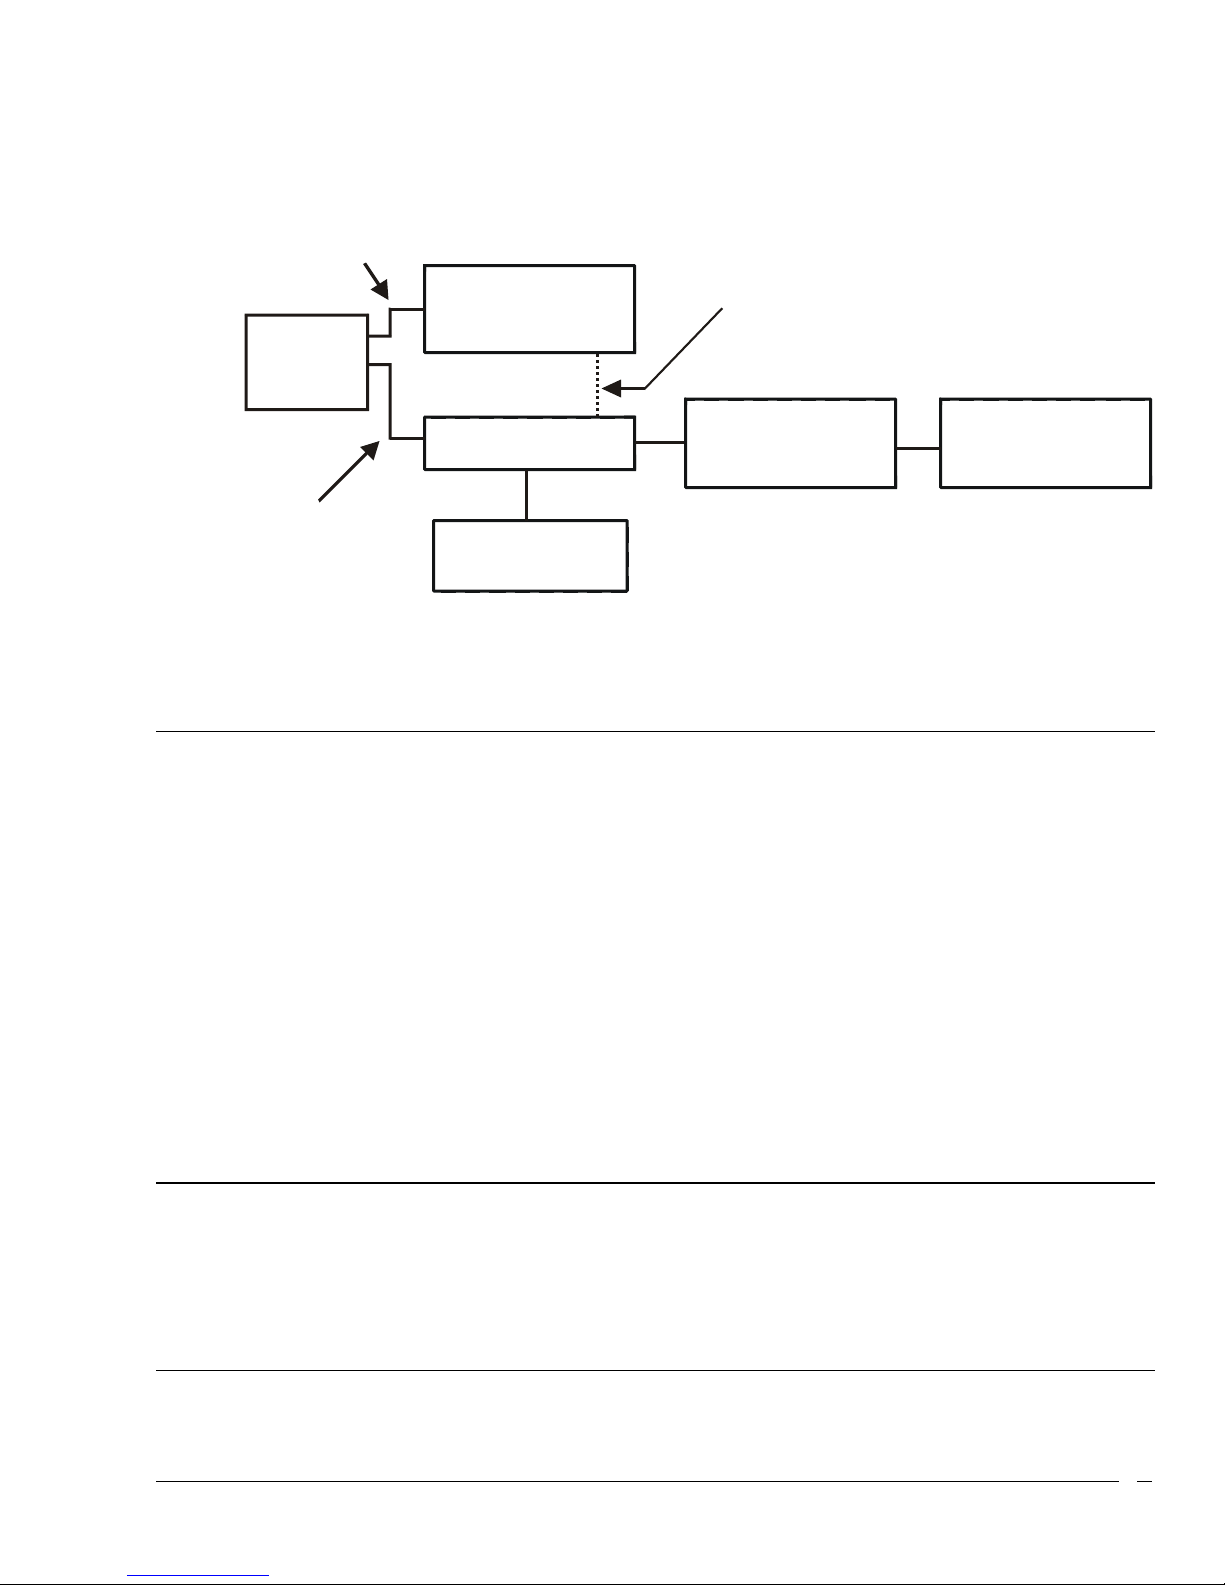
The SIG connector should be connected to a low noise preamplifier. The type usually specified for cooled Ge(Li)
-HV
detectors is suitable (Tennelec TC -174 or 175, or Ortec 142A or 142PC). Gain should be approximately 100 to 200
mV/MeV(Ge). The detector output is AC coupled so the preamplifier may not need an input coupling capacitor.
This may result in lower noise. Removal of any protection diodes across the input FET will also lower the noise,
but the rate of rise of the high voltage must be limited when turning it on or off, in this case. See Figure 2.
HIGH VOLTAGE
SUPPLY
OPTIONAL HV CONNECTION
+VOLTAGE
LET-SW2
PREAMPLIFIER
LOW NOISE
SIGNAL CABLE
Figure 2 Electrical Interconnection Diagram for LET-SW2 Operation
PULSE
GENERATOR
LINEAR
AMPLIFIER
PULSE HEIGHT
ANALYZER
V. INTERNAL ALPHA SOURCE
The detector cont ains a
particles can enter the sphere through a collimator.
to 81.72 keV/u over a range of 1u (1u = 1 x 10⁻⁶ meters) in tissue. Because of the collimator, the source produces
a peak on a multichannel pulse height analyzer. The center of this distribution is characteristic of the LET of the
alpha particle averaged over the detector diameter. Exact work can benefi t from fitting a parabola to the upper half
of this peak in order to find the precise position of the maximum. The alpha source resolution is relatively poor due
to a compromise between source strength, collimator opening and useful count rate.
244
Cm source for gain verification. The source is positioned so that the
244
Cm has a mean alpha energy of 5.80 MeV which averages
244
Cm alpha
The standard LET-SW2 is supplied with a gravity operated source. It is activated by turning the detector on its
side with the lettering on the baseplate upside down. If the LET-SW2 is supplied with the optional magnetically
operated source, then there is a mark on the housing for the location of the supplied magnet. Place the magnet on
the mark to activate the source.
A plot is included with each detector showing the alpha peak produced by its internal source. Data are included
on the graph giving the high voltage used, gain settings of the linear amplifier, gain settings of the pulse height
analyzer and the gas filling pressure.
VI. TYPICAL SPECTRUM FRO M
Plots of the pulse height spectrum derived from a standard
enclosed with each detector. These data were taken with standardized electronics as a quality control measure
and are not representative of the best in low noise circuitry. The channel numbers written on the graph near the
proton "edge" may be used to calculate resolution. These values so obtained are usually 10 to 11 percent.
252
CF NEUTRONS
252
CF exposure and from the internal
244
Cm source are
VII. TYPICAL OPERATION OF THE INSTRUMENT
The instrument is initially prepared as noted in the section "Filling of the Instrument with Gas", i.e., pump-down
and flushing with T.E. gas, a second pump-down and filling to the required pressure. The Quick-Connect is
snapped off freeing the instrument form the gas filling apparatus. The signal and high voltage cables are then
connected (using low noise cable in the signal lead). The high voltage power supply is adjusted to provide -600
MODEL LET -2 FAR WEST TECHNOLOGY 4
Page 6

volts if the detector has an effective diameter of 1 micron. The signal from the preamplifier and through the linear
amplifier is presented to a pulse height analyzer. A small magnet is plac ed on the counter where "magnet" is
written to turn on the alpha source. The system gain is then adjusted to place the alpha peak in a convenient
channel in the pulse height analyzer. For example, at an effective diameter of 1 micron, the average LET of the
244
Cm alpha particles in 81.72 keV/u and if the peak is placed near channel 82, then the analyzer display is
approximately 1 keV/u per channel.
After this preliminary work, an alpha spectrum is accumulated. Data should be accumulated for at least 10
minutes or more so that the position of the peak may be accurately determined. The alpha source is then turned
off by removing the source magnet making the counter ready for data taking. Data are usually accumulated at
several gain settings so that the limited dynamic range of the pulse height analyzer does not restrict the results.
For example, the first run might be from about 40 to 400 keV/u (for the 400 channel analyzer). The second from 6
to 60 keV/u, the third from 1 to 10 and the fourth from noise up to 3 keV/u. This scheme allows overlap between
the various segments so that they may be fitted together accurately. Obviously analyzer non-linearities must be
known, as well as the precise gain shifts used to select the spectrum segments. We have us ed a sliding pulse
generator to advantage in determining the analyzer non-linearities. A simple very stable mercury pulser can be
used to measure the overall gain at the different settings.
After the data are accumulated it is good practice to take a noise spectrum for the highest gain segment. This will
allow subtraction of the electronically produced noise and usually allows good data to be obtained down to about
0.5 keV/u. A second alpha spectrum should also be taken to establish detector drift characteristics, if any.
Usually the detector can be expected to drift less than 1 channel out of 100 in 8 hours. Drift rates greater than this
generally can be traced to gas leakage, either through pinholes or occasionally to the Quick-Connect. Since the
latter is a o-ring sealed device a bit of dirt may allow some gas leakage. This can be cured in most cases by
repeated operation of the Quick-Connect. The Quick-Connect leakage is not a problem if your detector is fitted
with a bellows valve. Temperature changes can also cause gain shifts.
VIII. DATA REDUCTION METHO DS
Some methods of data reduction are discussed in References 6, 7, and 8. Invariably, computer aided processing
is required because of the large number of data points gathered. Smoothing of the data before processing may
also be helpful. Both linear and quadratic smoothing have been used with success.
If only certain segments of the data are needed initially a simple program can usually be written for one of the
many programmable calculators now on the market. Such a program must include a smoothing routine if it is to
be satisfactory.
IX. REFERENCES
1. F. R. Shonka, J. E. Rose and G. Failla, "Conducting Plastic Equivalent to tissue, Air and Polystyrene",
A/Conf. 15/p/753, Second United Nations International Conference on Peaceful Uses of Atomic Energy, June
1958.
2. F. R. Shonka, J. E. Rose, and G. Failla, Progr. Nucl. Energy Ser. , XII, I, 160 (1958).
3. P. W. Benjamin, C. D. Kemshall and J. Redfern, "A High Resolution Spherical Proportional Count er", Nuclear
Instruments and Methods, 59, 77 (1968).
4. B. Day, "A Portable LET Spectrometry System for the Calibration of the Concorde Radiation Meter", AWRE
057/69, Avg 1909
5. D. Srdoc, "Experimental Technique of Measurement of Microscopic Energy Distribution in Irradiated Matter
Using Rossi Counters", Radiation Research, 43, 302 (1970).
6. H. H. Rossi and W. Rosenzweig, "A Device for the Measurement of Dose as a Function of Specific Ionization",
Radiology, 64, 404 (1955).
7. H. H. Rossi and W. Rosenzweig, "Measurements of Neutron Dose as a Function of Linear Energy Transfer",
Radiation Research, 2, 417 (1955).
MODEL LET -2 FAR WEST TECHNOLOGY 5
Page 7

8. H. H. Rossi, Chapter 2 in F. H. Attix and W. C. Roesch, Radiation Dosimetry, Volume 1, Second Edition,
Academic Press, New York and London, 1968.
9. W. H. Grant, III, G. D. Oliver Jr, and B. A. Mitchel
MODEL LET -2 FAR WEST TECHNOLOGY 6
 Loading...