


1
© 2007-07-13 FAG Industrial Services
From software version 3.2.0

2
Table of Contents
............................................................................ 7
1 Welcome
............................................................................ 9
2 General
.............................................................................................................. 92.1 About this documentation
.............................................................................................................. 9
2.2 Mode of functioning
.............................................................................................................. 12
2.3 Intended use
.............................................................................................................. 13
2.4 Scope of delivery
.............................................................................................................. 15
2.5 Characteristic values
.............................................................................................................. 17
2.6 Statement of Conformance to electrical safety and EMI requirements
............................................................................ 18
3 Trendline 3
.............................................................................................................. 183.1 Program installation
................................................................................................. 18
System requirements 3.1.1
................................................................................................. 19
Trendline software installation 3.1.2
................................................................................................. 22
Detector Flash Updater installation 3.1.3
................................................................................................. 24
MSDE installation 3.1.4
..................................................................................................... 27
Registering databases at the MSDE/SQL server3.1.4.1
................................................................................................. 29
Uninstalling3.1.5
.............................................................................................................. 30
3.2 User interface
................................................................................................. 30
Main window 3.2.1
................................................................................................. 31
Menu bar 3.2.2
................................................................................................. 33
Toolbar3.2.3
.............................................................................................................. 34
3.3 First steps
................................................................................................. 34
Adding a sensor 3.3.1
................................................................................................. 36
Installing USB-serial converter 3.3.2
................................................................................................. 38
Balancing activation 3.3.3
................................................................................................. 40
Register new detector 3.3.4
.............................................................................................................. 42
3.4 Setting up configuration
................................................................................................. 42
Enter system tree 3.4.1
................................................................................................. 43
Automatic assignment of RFID tags to measuring points 3.4.2
................................................................................................. 45
Create a measuring point 3.4.3
................................................................................................. 50
Setting characteristic values 3.4.4
................................................................................................. 52
Editing / deleting sensors 3.4.5
................................................................................................. 52
Managing measurement comments 3.4.6
................................................................................................. 53
Add balancing configuration 3.4.7
................................................................................................. 61
Setting up run up/coast down 3.4.8

3
Table of Contents
................................................................................................. 65Change alarm levels automatically 3.4.9
................................................................................................. 67
Send configuration 3.4.10
................................................................................................. 68
Deleting the Trendline database 3.4.11
.............................................................................................................. 68
3.5 Bearing database
................................................................................................. 69
Search bearing 3.5.1
................................................................................................. 71
Add bearing 3.5.2
................................................................................................. 72
Edit / delete bearings 3.5.3
................................................................................................. 74
Exporting / importing bearings 3.5.4
................................................................................................. 75
Manage groups 3.5.5
................................................................................................. 78
Add manufacturer 3.5.6
................................................................................................. 78
Edit / delete manufacturer 3.5.7
................................................................................................. 80
Select a different bearing database 3.5.8
.............................................................................................................. 82
3.6 Create a route
................................................................................................. 82
Create a new route 3.6.1
................................................................................................. 83
Create template 3.6.2
................................................................................................. 84
Send route 3.6.3
.............................................................................................................. 85
3.7 Download data from Detector
................................................................................................. 86
Sorting Wizard 3.7.1
.............................................................................................................. 88
3.8 Viewing measuring data
................................................................................................. 88
Measured values 3.8.1
................................................................................................. 91
Graphic3.8.2
.............................................................................................................. 92
3.9 Reset Alarm Status
.............................................................................................................. 93
3.10 Delete measured data
.............................................................................................................. 94
3.11 EService
................................................................................................. 94
Before starting 3.11.1
................................................................................................. 94
Send data 3.11.2
.............................................................................................................. 95
3.12 Create reports
................................................................................................. 96
Measurement report 3.12.1
................................................................................................. 100
Alarm Report 3.12.2
................................................................................................. 102
Route report 3.12.3
................................................................................................. 102
Balancing report 3.12.4
................................................................................................. 104
Creating a run up/coast down report 3.12.5
.............................................................................................................. 105
3.13 Importing and exporting data
................................................................................................. 105
Importing data from a Trendline 3.x database 3.13.1
................................................................................................. 105
Export wizard 3.13.2
................................................................................................. 106
Export a measuring point 3.13.3
................................................................................................. 110
Import and export between different workstations 3.13.4
.............................................................................................................. 110
3.14 Program settings
................................................................................................. 110
General3.14.1
................................................................................................. 111
Database3.14.2

4
................................................................................................. 111Report3.14.3
................................................................................................. 112
E-mail3.14.4
................................................................................................. 113
Data view 3.14.5
................................................................................................. 113
Automatic export 3.14.6
............................................................................ 114
4 The FIS-Viewer
.............................................................................................................. 1144.1 The working interface
................................................................................................. 114
Interface areas 4.1.1
................................................................................................. 115
Toolbar4.1.2
................................................................................................. 116
Tools4.1.3
................................................................................................. 122
Diagram display 4.1.4
................................................................................................. 123
Cursor and measuring information 4.1.5
................................................................................................. 125
The diagram information bar 4.1.6
.............................................................................................................. 128
4.2 Working with the Viewer
................................................................................................. 128
Displaying several diagrams simultaneously4.2.1
................................................................................................. 128
Modifying the appearance of a diagram 4.2.2
................................................................................................. 132
Using the mouse to control the cursor or zoom function 4.2.3
................................................................................................. 132
Zoom tools 4.2.4
................................................................................................. 137
Cursor tools 4.2.5
................................................................................................. 144
Positioning of base cursor 4.2.6
................................................................................................. 145
Modifying the cursor properties 4.2.7
................................................................................................. 151
Other tools 4.2.8
................................................................................................. 152
Using the diagram information bar 4.2.9
................................................................................................. 160
Exporting data via the clipboard 4.2.10
................................................................................................. 160
Viewer settings 4.2.11
.............................................................................................................. 171
4.3 Keyboard shortcuts
............................................................................ 174
5
Detector III
.............................................................................................................. 1745.1 Detector display
.............................................................................................................. 174
5.2 Keyboard
.............................................................................................................. 175
5.3 Explanation of the symbols
.............................................................................................................. 176
5.4 Connectors
.............................................................................................................. 176
5.5 Accumulator
.............................................................................................................. 178
5.6 Switching on and off
.............................................................................................................. 178
5.7 Main menu
.............................................................................................................. 181
5.8 Data transfer
.............................................................................................................. 182
5.9 Measuring procedure
.............................................................................................................. 182
5.10 CM-measurement
................................................................................................. 183
Selection of measuring point 5.10.1
................................................................................................. 185
Measuring procedure 5.10.2

5
Table of Contents
................................................................................................. 185Display of values measured 5.10.3
................................................................................................. 186
Viewing time signals on the Detector display 5.10.4
................................................................................................. 187
Display of the FFT on the Detector display 5.10.5
................................................................................................. 188
Repeated measurements 5.10.6
................................................................................................. 188
Measuring with temperature sensor 5.10.7
................................................................................................. 189
Using the headset 5.10.8
.............................................................................................................. 189
5.11 Balancing measurement
................................................................................................. 194
Measuring rotational speed 5.11.1
................................................................................................. 194
Reference run 5.11.2
................................................................................................. 195
Trial run 5.11.3
................................................................................................. 197
Display coefficients and apply balance weights 5.11.4
................................................................................................. 198
Trim run 5.11.5
.............................................................................................................. 199
5.12 Determining the resonance range of a machine
.............................................................................................................. 201
5.13 Free measurement
.............................................................................................................. 205
5.14 System messages and their meaning
.............................................................................................................. 208
5.15 Update firmware
............................................................................ 211
6 Special information
.............................................................................................................. 2116.1 Time signals
.............................................................................................................. 212
6.2 Frequency selective characteristic values
.............................................................................................................. 213
6.3 Dynamic memory management
.............................................................................................................. 214
6.4 Analog branches in the Detector III
.............................................................................................................. 214
6.5 Establishing a data connection
............................................................................ 216
7 Appendix
.............................................................................................................. 2167.1 General information on vibration monitoring
................................................................................................. 216
Introduction7.1.1
................................................................................................. 217
Frequency analysis 7.1.2
................................................................................................. 218
Demodulation analysis 7.1.3
................................................................................................. 227
Vibration characteristic values 7.1.4
..................................................................................................... 228
Arithmetic mean value7.1.4.1
..................................................................................................... 228
Peak values (peak, peak to peak)7.1.4.2
..................................................................................................... 228
Root mean square (RMS)7.1.4.3
..................................................................................................... 229
Broad band RMS value7.1.4.4
..................................................................................................... 229
Selective RMS value7.1.4.5
................................................................................................. 230
Bibliography7.1.5
.............................................................................................................. 231
7.2 Principles of non-contact temperature measurement
................................................................................................. 231
Introduction7.2.1
................................................................................................. 231
Advantages of using IR thermometers 7.2.2
................................................................................................. 232
Infrared measuring system 7.2.3

6
................................................................................................. 232Target7.2.4
................................................................................................. 236
Handling the pyrometer 7.2.5
..................................................................................................... 236
Distance to spot size ratio7.2.5.1
..................................................................................................... 237
Emissivity7.2.5.2
..................................................................................................... 237
Measurement considerations7.2.5.3
................................................................................................. 237
Bibliography7.2.6
............................................................................ 239
8
Technical data
Index
............................................................................239

7
Welcome
1 Welcome
Overview
The FAG Detector III
is a vibration measuring device, data collector and
operational balancing device in one. Together with the Trendline 3
software,
the device allows improved planning of maintenance and increased machine
availability.
Machine vibrations are a good indicator of a machine's condition. With the aid of
Detector III, you can monitor machine vibrations according to ISO 10816 and roller
bearing condition by means of the demodulation detection method. The base
curve and demodulation signals stored in the system can then be used to analyze
the signals in the time and frequency range. This permits detection of alignment
errors and imbalance as reliably as roller bearing damage or gearing problems.
Other process parameters that can be recorded are temperature and rotational
speed.
Applications
Measuring and analyzing machine condition
The FAG Detector III records vibration signals at pre-defined measuring points by
means of a sensor and then calculates the effective values for velocity,
acceleration and demodulation. These characteristic values
describe the
condition of the machine and component.
You can define and monitor frequency bands of any frequency width in the range
from 0.1 Hz to 20 kHz. FAG Detector III can save up to 1600 measuring points and
up to 270 time signals. Once a measuring round has been finished, all data
recorded are transferred to the Trendline software, where they are evaluated,
analyzed and displayed.
174
18
15

8
Balancing with the Detector III (available as accessory function)
There are many and diverse reasons for unscheduled machine standstills.
However, a considerable number of these is due, directly or indirectly, to
imbalance or alignment errors. During operation, imbalance may cause severe
vibrations, that can lead to consequential damage, for example premature bearing
wear or fatigue-induced breaks. The result is machine failure and thus
unscheduled production downtime.
The FAG Detector III is a tool with which you can not only detect but also remedy
such conditions easily and efficiently. The easy user interface provides good
support during the balancing process. Step by step, the device software guides the
user through the balancing process. The user can create a configuration for each
balancing process with the Trendline software. Furthermore, he can define
templates that can be adapted on site on the machine. The balancing results are
sent to the Trendline software. You can display them there in table form or as a
diagram.
Analyzing data with the Trendline bearing database
The integrated bearing database (approx. 20,000 bearings from various
manufacturers) simplifies and speeds up analysis of measured data in
combination with the FIS-Viewer
. It allows you to detect any irregularities at
first glance and assign the appropriate components. You can save multiple
bearings per measuring point. This allows you to check multiple bearing ball-pass
frequencies at a measuring point. Every user can add new entries to the bearing
database to suit individual needs.
114

9
General
2 General
2.1 About this documentation
This documentation describes the functionality of the Detector III and the Trendline
software. It explains:
· how to create configurations
or measuring routes on a computer and
transfer these to the Detector;
· how to use the device to record measuring data;
· how to transfer data from the Detector to the computer and
· how data can be analyzed and stored.
The appendix also contains an introduction to the basic principles of vibration
monitoring
and a brief description of the subject "Temperature measurement
with the Detector III
".
Safety information symbols
DANGER
Safety symbol
This safety symbol warns you of material damage and dangers to
health, life-threatening injuries and death.
General information symbols
This symbol indicates
· helpful additional information and
· device settings or application tips that help you perform tasks
more efficiently.
Cross-reference symbol : This symbol indicates a page in the manual with more
detailed information. If you are reading the manual on screen in PDF format, you
can jump to this page by clicking the word to the left of the cross-reference symbol.
2.2 Mode of functioning
Detector III is a hand-held measuring instrument with data recording function for
offline monitoring of systems and machinery (condition monitoring). For this
purpose, the instrument senses vibrations at pre-determined measuring points
using a detector and works out the RMS values of vibration velocity, acceleration
in vibration and demodulation, the so-called characteristic values, for
characterizing machine or component condition. In addition, Detector can measure
42 82
216
216
9

10
temperatures using an infra-red sensor.
· Once a measuring round is finished, the measured characteristic values and any
recorded time signals are transferred to a computer where they are evaluated,
analyzed and graphically depicted using the Trendline software
.
· The exact location of the measuring point within the system to be monitored is
stored in the configuration
. There, the sensor sensitivity for each measuring
point and the threshold values for main or preliminary alarm are stored as well.
The configuration is created using the Trendline software
and transferred to
the Detector prior to measuring.
· For measuring, the vibration sensor is fixed to a pre-determined measuring point
with the help of a magnet footing. If this is not possible due to the housing
material (e.g. aluminum), attach an iron plate or a washer the size of the
magnetic at the measuring point. This is easiest done with the help of a fastcuring superglue (e.g. cyan acrylate glue).
· The configuration of the measuring point is selected on the Detector and the
measuring started. Detector records the sensor signals broadband and works
out the characteristic values. These characteristic values are stored and
transferred to the computer once the measuring round is finished.
· For each measuring point, the newly measured characteristic values are
compared with the threshold values determined for this measuring point for a
main alarm and pre-alarm. The Detector (main alarms) and the Trendline
software (main and pre-alarms) display the threshold events. New characteristic
values are stored. You can depict them graphically in the Trendline software
depending on time of measuring.
In addition to the condition monitoring measurement (subsequently referred to as
CM measurement
) the Detector III also masters what is known as operation
balancing. During this process the Detector helps you find the optimum position of
balancing weights when carrying out the balancing measurement
. These
weights serve to compensate for imbalances in rotating parts and therefore extend
their service life.
18
42
18
182
189

11
General
Before you start
Ferrit modules will reduce electromagnetic fields from the device which could
otherwise affect other electronic devices in the vicinity.
You will receive three ferromagnetic modules with the RFID-Kit or the
RFID-Detector. The ferrit modules have to be fasten to the three sensor cables
(cable for the acceleration sensors as well as for the trigger sensor) of the
Detector.
Ferrit module
Proceed as follows:
1.
Put the sensor cable into the groove of the ferrit.
2.
Adjust the cable so that the rim of the ferrit modul is placed addording to the
picture. Please note that the ferrit module should be placed as close as possible
to the Detector.
3.
Close the retractable ferrit module enclosing the cable firmly till it engages.
Ferrits fasten at the sensor cables

12
2.3 Intended use
Disposal information
Neither the Detector not the associated components may be disposed of via
domestic waste as they contain electronic components and NiMH accumulators
that must be disposed of in the proper manner. Please return them to us so that
we can ensure disposal in keeping with legal and environmental requirements.
Returning used devices is an important contribution to environmental protection.
Information to the user
Changes or modifications not expressly approved by the party responsible for
compliance could void the user's authority to operate the equipment.
Note: This equipment has been tested and found to comply with the limits for a
Class A digital device, pursuant to part 15 of the FCC Rules. These limits are
designed to provide reasonable protection against harmful interference when the
equipment is operated in a commercial environment. This equipment generates,
uses, and can radiate radio frequency energy and, if not installed and used in
accordance with the instruction manual, may cause harmful interference to radio
communications. Operation of this equipment in a residential area is likely to
cause harmful interference in which case the user will be required to correct the
interference at his own expense.
Industry Canada
This Class A digital apparatus complies with Canadian ICES-003.
13
General
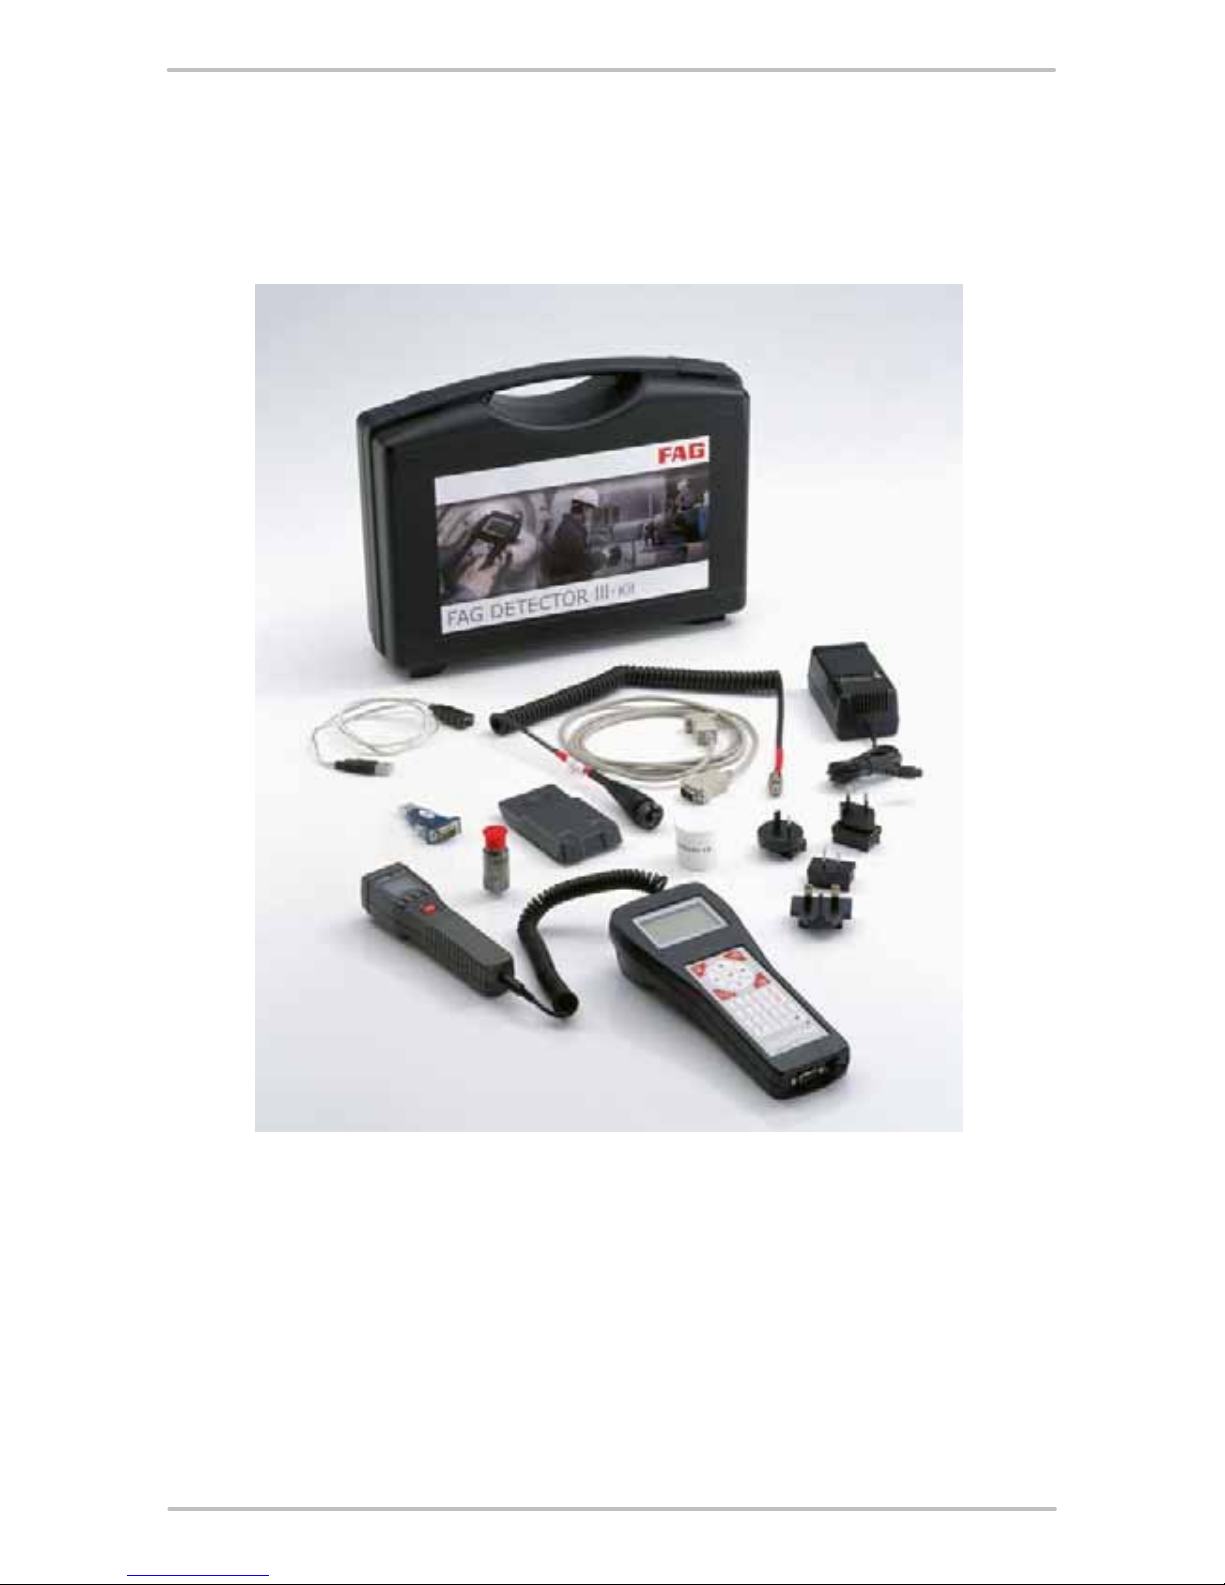
2.4 Scope of delivery
DETECT3-KIT
· Base unit with accumulator
· Accelerometer with magnetic foot
· Infrared temperature sensor
· Battery charger with travel adapter
· PC data cable (serial/USB)
· Manual
· Protective bag with temperature sensor holder
· Trendline PC software
· Case

14
DETECT3.BALANCE-KIT
· Acceleration sensor with magnetic foot and sensor cable
· Trigger sensor (optical and inductive)
· Scales
· Magnetic holder for trigger sensor
· Extension stick for magnetic holder
· Cable for trigger sensor (length 10 m)
· Reflex mark for optical trigger sensor
· Dongle for activating the balancing function
· Case

15
General
RFID KIT
· Base unit with accumulator and RFID reader
· 5 RFID tags
· Accelerometer with magnetic foot
· Infrared temperature sensor
· Battery charger with travel adapter
· PC data cable (serial/USB)
· Manual
· Protective bag with temperature sensor holder
· Trendline PC software
· Case
Accessories
Sensor extension cable (5m and 15m length), sensor bases and rail magnet
available on request.
2.5 Characteristic values
Detector III can store up to 4 different (or same just as well) characteristic values
per measuring point. The following characteristic values can be selected:
Characteristic
value
Meaning
ISO 10816
RMS value of vibration velocity
Frequency range: 10 Hz to 1 kHz
Unit: mm/s
v
sel
RMS value of vibration velocity with freely selectable upper and lower limiting frequency
Frequency range: 0.3 Hz to 20 kHz (depending on the lowpass frequency)
Unit: mm/s
a
eff
RMS value of acceleration in vibration
Frequency range: 2 Hz to 20 kHz (depending on the lowpass frequency)
Unit: g
a
sel
RMS value of acceleration in vibration with freely selectable upper and lower limiting frequency
Frequency range: 0.1 Hz to 20 kHz (depending on the lowpass frequency)
Unit: g
d
eff
Demodulation signal of acceleration in vibration with switchable low-pass
Frequency range: 0.1 Hz to 20 kHz (depending on the lowpass frequency)
Unit: g
d
sel
RMS value of demodulation in vibration with freely selectable upper and lower limiting frequency
Frequency range: 0.1 Hz to 20 kHz (depending on the lowpass frequency)

16
Characteristic
value
Meaning
Unit: g
T
Temperature
Range: -20°C to +550°C
Unit: °C
Crest factor
Ratio between peak value and RMS value (Crest factor = peak value / RMS value)
In addition to the aforementioned characteristic values, you can
also measure rotational speed.

17
General
2.6 Statement of Conformance to electrical safety and EMI
requirements
Declaration of conformity as per the Radio and Telecommunication
Transmitter Devices Act (FTEG) and Directive 1999/5/EC (R&TTE)
The manufacturer:
F'IS, FAG Industrial Services GmbH
Kaiserstraße 100
D-52134 Herzogenrath Germany
declares that the product:
Detector III
Radio installation
Purpose:
RFID application
Device category: Category 1
corresponds to the basic requirements of §3 and the other relevant provisions o
f
FTEG (article 3 of R&TTE) if used for the intended purpose.
Health and safety as per § 3 (1) 1. (article 3 (1) a))
Harmonised standards used: EN 60950-1: 2001, EN 50364: 2001
Protection requirements with regard to EMC § 3 (1) 2, article 3 (1) b))
Harmonised standards applied: ETSI EN 301 489-3 V1.4.1
Measures for efficient use of the radio frequency spectrum
Harmonised standards applied: ETSI EN 300 330-2 V1.3.1.
This statement of conformance is issued based on testing the EMC aspects of a
representative product sample of the above mentioned product in conformance
with the following standards:
ETSI EN 301 489 ETSI EN 300 330 EN 61000-6-2
EN 61000-6-4 EN 60950-1 FCC Part 15
Measuring device identifier: CE
Herzogenrath, 22.06.2007
18
3 Trendline 3
The Trendline software is the server-based program for the Detector III. The
Detector itself is designed only for the recording of measured values. All data
organization and evaluation tasks are carried out by the Trendline software.
The monitoring of a system is configured using the software which also evaluates,
analyses, and stores the measuring data delivered by the Detector.
Further, Trendline 3 manages the exchange of data between the server on which
the software is running and the Detector.
3.1 Program installation
In addition to the application program, the Trendline software requires the MSDE
database server. It must be installed either on the local computer or on a network
server. If you are already using an MSDE database server, you can register the
databases with this.
Please note that you need Administrator permissions for your
computer to install the Trendline software completely. If you do not
have these permissions, ask your system administrator. For
example, you can install the software with Administrator
p
ermissions and then switch back to a normal user.
3.1.1 System requirements
In order to use the Trendline software in an optimum way, the following minimum
requirements must be met:
General system requirements
· Pentium III PC with 500 MHZ (recommended: 1 GHz)
· at least 512 MB RAM (recommended: 1 GB)
· Screen resolution: 1024x768 (pixels)
Operating systems
· with MSDE 2000: Windows 2000, Windows Server 2003, Windows XP
Please note that the Trendline software does not yet run on
Windows Vista.
Hard disk memory for installing the Trendline software
· Trendline software 3.2 (without database and database server): 62 MB

19
Trendline 3
· Detector Flash Updater: 4 MB
· Demo database and bearing database: 20 MB
Hard disk memory for installing the database server
· MSDE 2000: 50 MB
Hard disk memory for the database
· MSDE 2000: at least 2 GB (recommended: 6 GB)
Other requirements
· Microsoft Internet Explorer 6.0 SP1 or later
3.1.2 Trendline software installation
Please insert the Installation CD. If you do not have a CD, you can download the
current version of Trendline from our website (www.fis-services.de).
If the installation program does not start automatically you can start it manually
using Windows Explorer:
1.
Open My computer.
2.
Under Equipment with removable media click the right-hand mouse button on
the CD-ROM drive then click Open.
3.
Start the Trendline installation file (Trendline-Setup-3.2.exe) by doubleclicking
on it.
4.
Please select the language to install the Trendline software. You can change the
language settings
at any time after installing.
The Setup Wizard guides you through the rest of the installation:
110

20
5.
Select the directory where you want to install the software and click Next.
6.
Select the Start menu directory to create the program link. Click on Continue.

21
Trendline 3
7.
Optionally, you can select other components of the Trendline software to install.
To do so, check the checkbox next to the option
a)
Flash Updater to update the Detector firmware
b)
Database installations to install the demo database and/or bearing database
and click Continue.
208

22
Please note that the Trendline software requires MSDE (Microsoft
SQL Server 2000 Desktop Engine)!
8.
In the next window check your settings and click Install or Back to correct your
settings.
This installs the Trendline software.
3.1.3 Detector Flash Updater installation
If you selected Flash Updater when you installed the Trendline software, the
Setup Wizard automatically starts installation:
1.
Select the directory where you want to install the software and click Next.

23
Trendline 3
2.
Optionally, you can add program icons on the desktop or to the quick launch
bar. To do so, check the checkbox next to the option
a)
Create a desktop icon to add a shortcut on your desktop
b)
Create a Quick Launch icon to add a symbol to the Quick Launch bar next
to the Start button
and click on Next.
3.
In the next window check your settings and click Next to install the Detector

24
Flash Updater or Back to correct your settings.
This installs the Detector Flash Updater.
3.1.4 MSDE installation
If you selected Database installation when you installed the Trendline software,
the Setup Wizard automatically starts installation:
1.
Please select whether you want to
a)
install MSDE and register database,
b)
only install MSDE or
c)
register databases with an existing MSDE/SQL server
and click Continue.

25
Trendline 3
If you selected Register databases with MSDE/SQL server, please continue
with registration
.
2.
Select the directory in which you want to install the database server. Click on
Continue.
3.
Select the directory in which you want to install the MSDE database. Click on
Continue.
27

26
4.
Optionally, you can select additional databases to install. To do so, check the
checkbox next to the option
a)
bearing database
to install the most common bearings in a database
b)
demo Trendline database to install a database with demo data
and click Continue.
This installs the Microsoft SQL Server 2000 Desktop Engine (MSDE) with the
selected databases.
68

27
Trendline 3
5.
Click Finish to close the Setup Wizard.
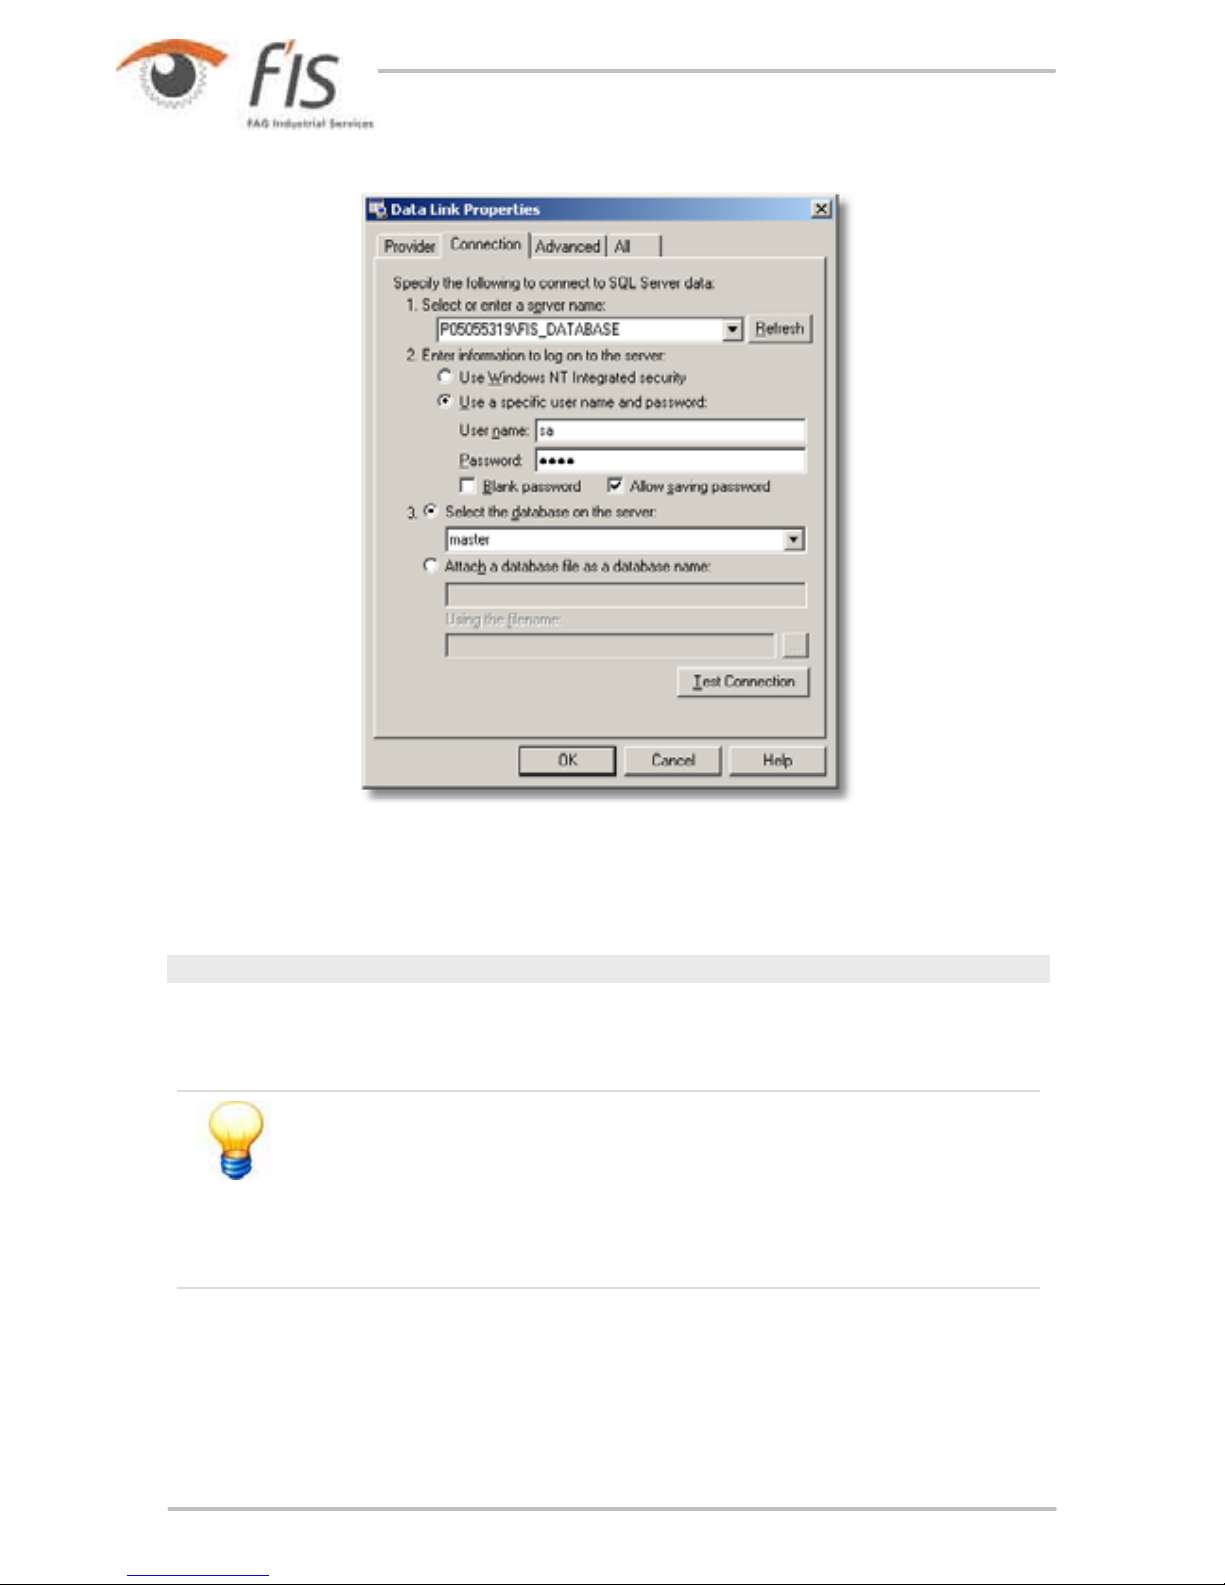
3.1.4.1 Registering databases at the MSDE/SQL server
If you selected Register databases with the MSDE/SQL server, you must
connect the databases (Trendline and bearing database) to the MSDE/SQL server:
Registering Trendline databases at the MSDE/SQL server
1.
Select the database server that contains the database from the server list or
enter the server in the input field in the upper area of the window. Click on
Refresh to display the list of available servers.
If you do not find any entries in the server list due to restricted user
p
ermissions, enter "Computer name\FIS_DATABASE" manually (if
the name of your computer, for example, is "peters_laptop", the
server name would be "peters_laptop\FIS_DATABASE"). You can
find your computer's name in the Windows Explorer drives. If you
are not sure about your computer's name, ask your administrator.
2.
Select Use a specific user name and password and enter your user name
and password to log-on to the database. If you select a database server that
was installed during a Trendline installation (contains FIS_DATABASE in its
name), the user name is sa and the password is sql8. Make sure to enable
Allow Password Save to save the password.
28
3.
Select the database master from the list.
4.
Click on OK.
Registering a bearing database at the MSDE/SQL server
1.
Select the database server that contains the database from the server list or
enter the server in the input field in the upper area of the window. Click on
Refresh to display the list of available servers.
If you do not find any entries in the server list due to restricted user
p
ermissions, enter "Computer name\FIS_DATABASE" manually (if
the name of your computer, for example, is "peters_laptop", the
server name would be "peters_laptop\FIS_DATABASE"). You can
find your computer's name in the Windows Explorer drives. If you
are not sure about your computer's name, ask your administrator.
2.
Select Use a specific user name and password and enter your user name
and password to log-on to the database. If you select a database server that
was installed during a Trendline installation (contains FIS_DATABASE in its
name), the user name is sa and the password is sql8. Make sure to enable
Allow Password Save to save the password.

29
Trendline 3
3.
Select the database master from the list.
4.
Click on OK.
If you want to register the database later on, please select
bearingDB instead of masterDB.
3.1.5 Uninstalling
To uninstall the Trendline software, please click Programs > FIS > Trendline 3.2
Uninstall Trendline in the Start menu. This uninstalls the Trendline software and
its components.
Please note that configuration and export files are left on your computer. For your
safety, the database is not deleted either. To completely uninstall, you must delete
these files manually.

30
3.2 User interface
3.2.1 Main window
The layout of the main Trendline 3 software window is based on standards which
have developed for user interfaces in the meantime.
At the top edge of the main window you will find the menu bar , where you can
call up the functions of the program via the menu items. Frequently used functions
can also be activated using the buttons in the toolbar
.
On the left-hand side of the window the structure of the configuration for the
system to be monitored is depicted in the form of a directory tree. The
“Configurations”, which are splitting in descending order into the levels “Section”,
“Machine” and “Measuring Point”, are the highest classification element. That way,
a measuring point within a configuration is clearly defined by it’s denomination as
well as the specification and location of the machine the measuring place is to be
found at.
Next to the denomination of each element of the configuration and system
structure you will find a field marked in color. It indicates the alarm condition for
this part of the system following the table below.
31
33

31
Trendline 3
Color
Meaning
For this level of the system structure no alarm is recorded.
For this level of the system structure preliminary alarm is recorded.
For this level of the system structure main alarm is recorded.
An RFID tag has been assigned to this measuring point.
An RFID tag in this part of the system has been marked as defective.
On the right-hand side next to the configuration and system structure you can
insert an image. At the highest level you will find the tabsheets, where you can
adjust the settings of the individual measuring points.
The dividing line between the image of the configuration and system structure can
be shifted towards the right or left by dragging with the mouse.
In the configuration structure, always one element is marked. The
p
roperties of this element are depicted in the right-hand part of the
window.
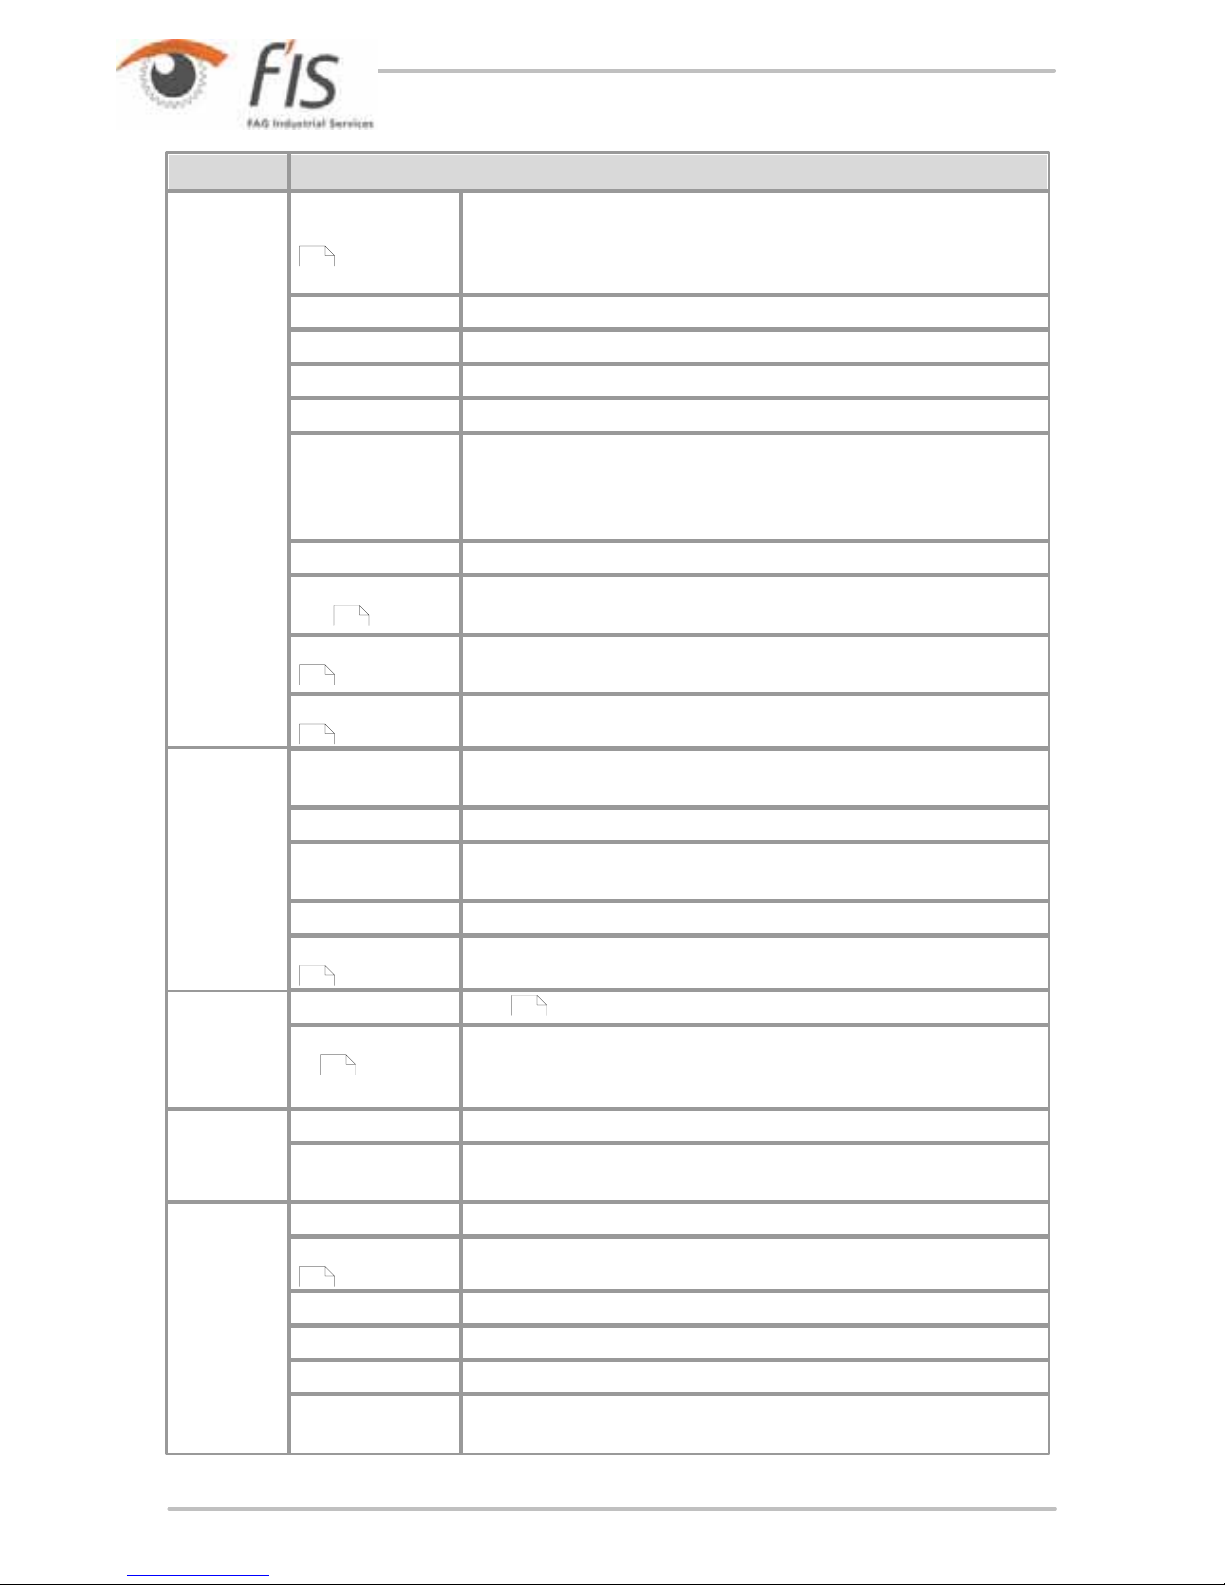
3.2.2 Menu bar
The menu bar allows access to the following functions of the Trendline 3 software:
Menu
Menu items and their functions
File
New Creates a new database.
Open Opens an existing database.
Import Loads records exported with Trendline.
Export Exports part of a current measuring point structure using the export wizard
or export a single measuring point .
Recently used
databases
Trendline displays recently used databases at this point in the menu. You
can specify the number in the program settings
.
Close Quits the Trendline software.
System
To root level Takes you from your current position in the tree right back to the
beginning, all the time.
Rename Rename currently selected element.
New item Inserts an element of the configuration structure in the same level as
currently displayed.
New subitem Inserts an element of the configuration structure in the level below the
current.
Add balancing
configuration
Inserts a balancing configuration.
105 106
111
53
53
32
Menu
Menu items and their functions
Add run up/coast
down configuration
Creates a run up/coast down configuration.
Expand selection Flaps up all elements under the current element.
Collapse selection Closes the complete tree structure.
Cut Cuts out the current element of the tree.
Copy Copies the current element of the tree.
Paste Pastes the element on the clipboard into the current position in the tree.
This is only possible in the tree level above that of the copied element, e.
g. when copying a machine, this can only be pasted into the plant level of
the tree.
Delete entry Deletes the current entry at the tree with all sub-entries.
Delete measured
data
Deletes measured data from the current position.
Reset alarm status Reset all alarms for the element of the configuration and system structure
selected.
Adjust alarm levels Automatic adjustment of the alarm levels.
Detector
Send configuration Send all measuring points from currently selected element downwards to
detector.
Send route Sends one of the pre-selected routes to the detector.
Load data from
Detector
Opens a connection to the detector and downloads all data stored in the
detector.
Configure Detector Allows to set all options to the detectors registered.
Balancing activation Enables the balancing function on the Detector.
Sensor
Adds , edits and deletes sensors.
Comment selection
list
Create and edit a list of comments.
Planning
Route Creates out and edits routes.
Template Defines and edits configuration templates that can be used for ad-lib.
measurements.
Service
EService Sends selected data for further analysis.
Measurement report Creates a measurement report.
Alarm Report Creates an alarm report.
Route report Creates a route report.
Balancing report Creates a balancing report.
Run up/coast down
Report
Creates a run up/coast down report.
61
93
92
65
38
34
52
96

33
Trendline 3
Menu
Menu items and their functions
Tools
Options Program settings
Bearing DB
Opens the bearing database .
?
Contents Contents of the online help.
Index Search index for the online help.
First steps Start using the Trendline Software.
Menu bar Explains all menus of the Trendline Software.
Toolbar Explains all icons in the toolbar.
About Trendline Information about the Trendline Software.
3.2.3 Toolbar
Frequently used functions of Trendline software can be used via the toolbar.
Toolbar
Go to root element Paste
Create new item Delete
Create new sub-item Reset Alarm Status
Add balancing configuration Send configuration to detector
Add run up/coast down configuration Send route to detector
Expand tree entries Download data from detector
Close selected element Alarm Report
Cut EService
Copy
68

34
3.3 First steps
3.3.1 Adding a sensor
Before you can set up configurations, you must define the sensors you want to
use. Detector III is delivered with all necessary sensors. They are pre-defined in
the Trendline software.
Proceed as follows to add new sensors:
· In the Detector menu click Sensor > Add.
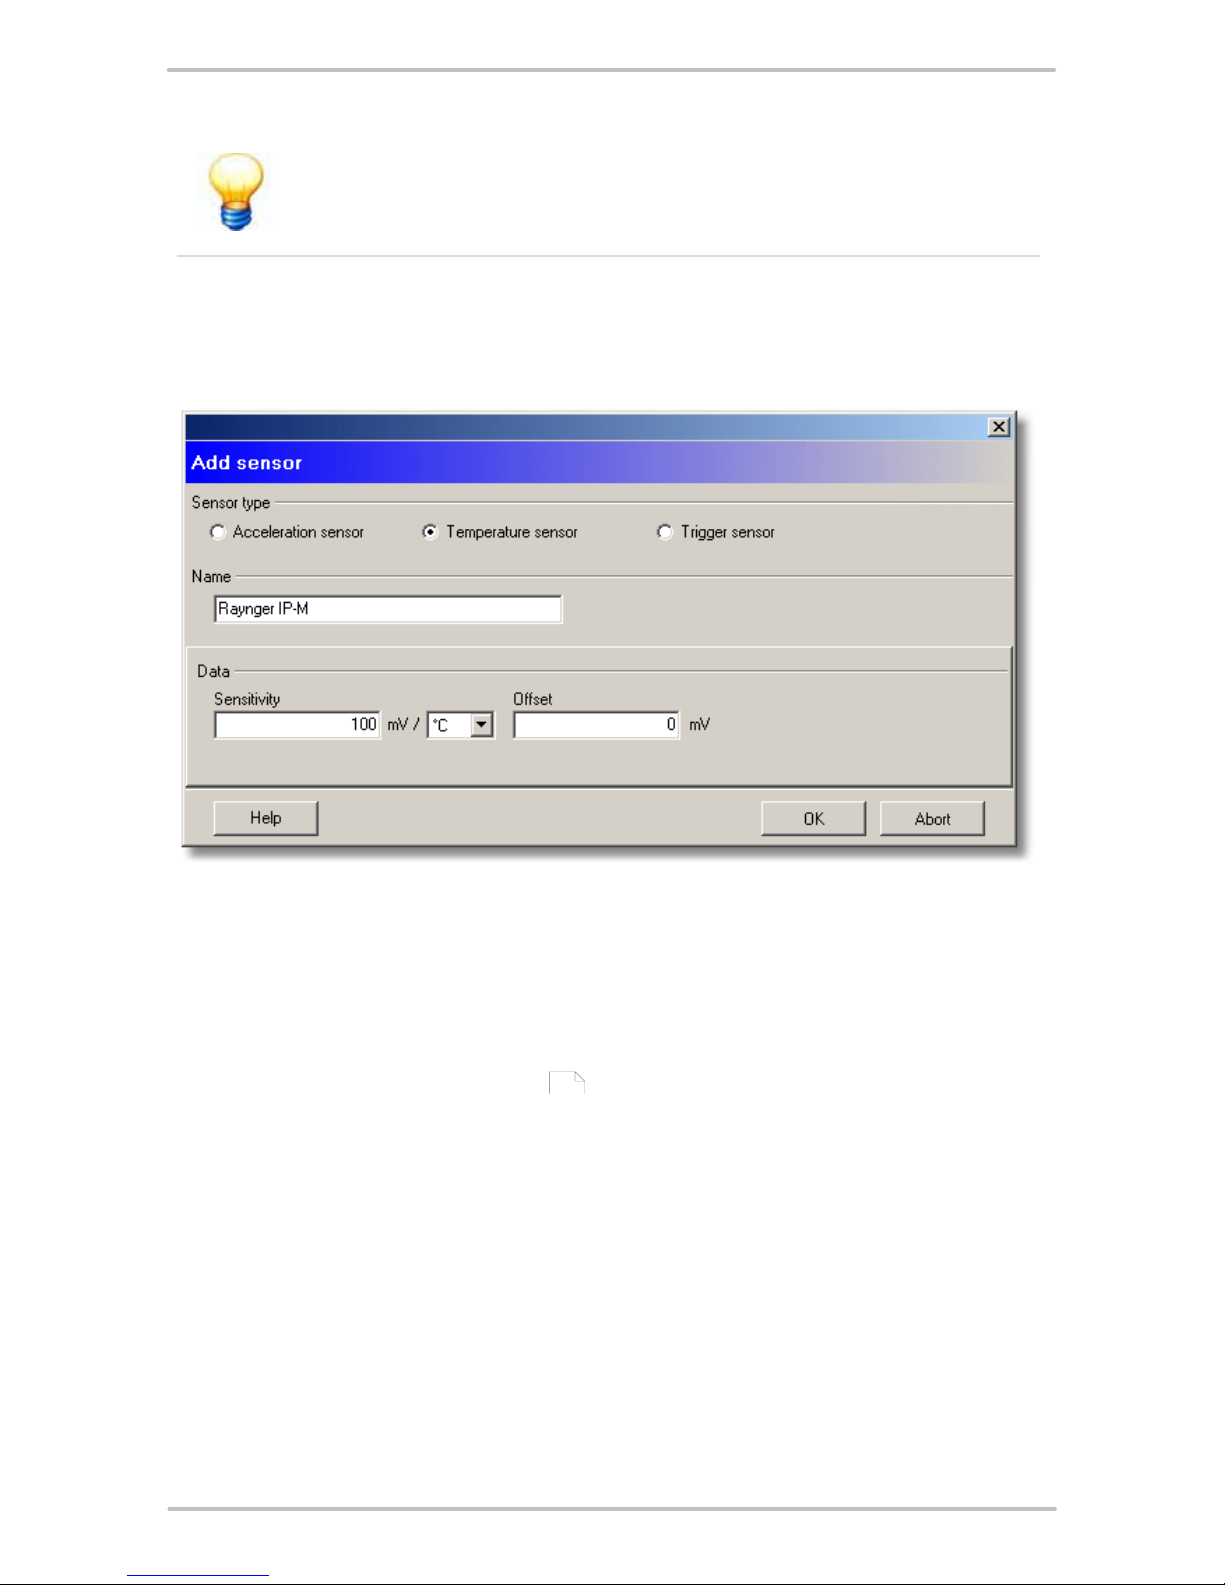
· In Sensor type choose from Acceleration, Temperature or Trigger sensor.
· In the Name field, enter a name for the sensor, e.g. "IMI 627".
Acceleration sensor
· Enter sensor sensitivity in mV/g in the Sensitivity field. Sensitivity is printed on
the sensor or indicated in the enclosed specifications.
· When you add an active sensor, select Active sensor and enter minimum and
maximum bias voltage in the appropriate input boxes. On the one hand, this
activates sensor supply voltage in the Detector before the measurement is
performed and activates a high pass to filter the supply voltage out of the
measuring signal. On the other hand, the Detector checks whether sensor bias
voltage is within the set thresholds. Minimum bias voltage must be at least 3,
maximum bias voltage must not be greater than 17. The difference between the
two values must not be less than 10.
35
Trendline 3
If you want to measure on a power supply unit, Active sensor must
not be enabled.
· Click OK to save the new sensor.
Temperature sensor
· Enter sensor sensitivity in mV/°C, mV/°F or mV/K and the offset in mV.
· Click OK to save the new sensor.
Trigger sensor
The trigger sensor serves to measure rotational speed and is used in operational
balancing to start the measurement
.
189

36
· Select the Supply voltage: External, 5V, 12V.
· Click OK to save the new sensor.
3.3.2 Installing USB-serial converter
A USB serial adapter is supplied with the Detector which you can use to connect
the Detector to computers with USB interfaces.
When installing the adapter software make sure you have the adapter and the
installation CD provided to hand.
Installation of the adapter software
To install the adapter software proceed as follows:
· Insert the supplied CD. The installation program should start automatically.
If the installation program does not start automatically you can start it manually
using Windows Explorer:
1.
Open My computer.
2.
Under Equipment with removable media click the right-hand mouse button on
the CD-ROM drive then click Open.
3.
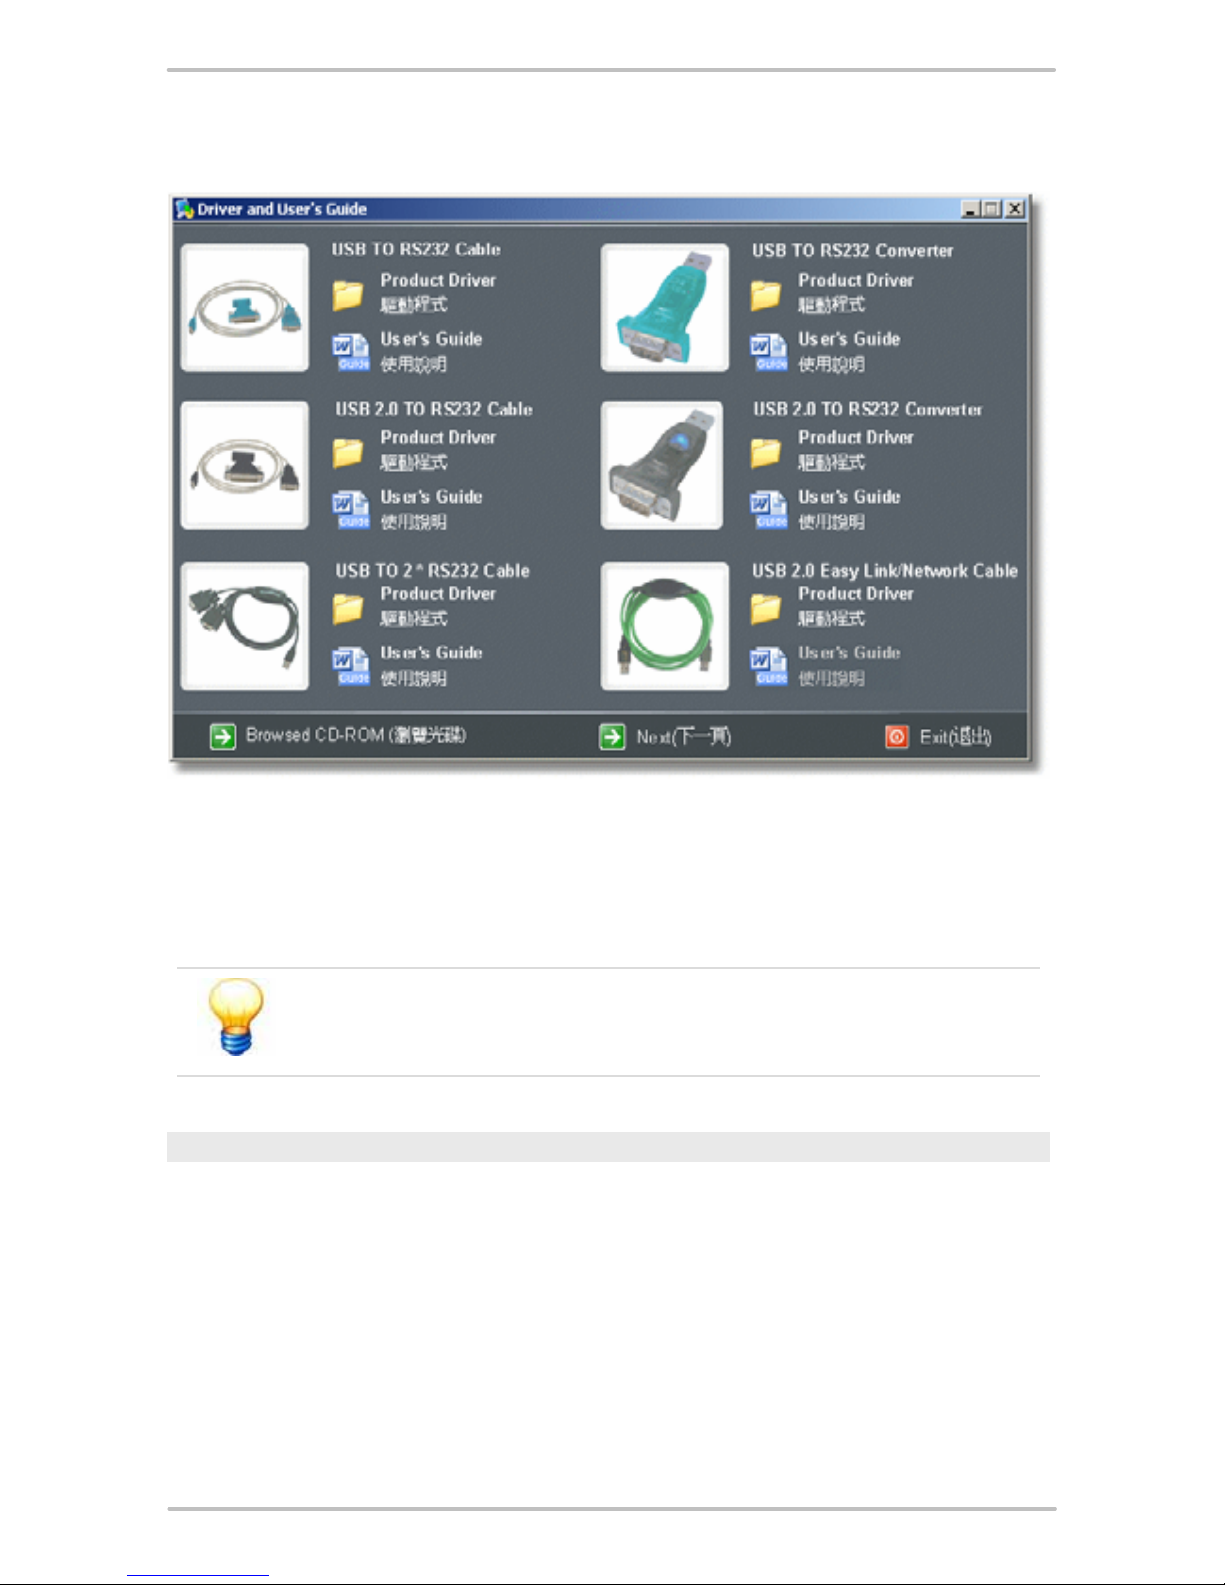
Double click to launch autorun.exe.
4.
At USB TO RS232 Converter, click the folder icon next to Product Driver.
37
Trendline 3
5.
Select the win_98se_me_2000_xp folder.
6.
Click on Setup.exe.
This launches the installation wizard which guides you through the installation.
If you are already using other devices that use a Prolific USB to
Serial chip, please uninstall the drivers for the old devices first as
this may result in conflicts.
Checking serial interface settings
To make sure that communication between the Trendline software and the
Detector works smoothly, you can check the USB serial adapter settings for the
serial interface:
1.
Click the right mouse button on My computer then click on Properties.
2.
Click Hardware then Device manager. The adapter should be displayed as
"Prolific USB-to-Serial Bridge" under Connections (COM and LPT).

38
3.
Close the Device manager.
Removing the adapter software
The adapter software can be removed as follows:
1.
Click on Start, click on Control panel and then click on Software.
2.
Click on Modify or remove program then click on PL-2303-USB-to-Serial.
3.
Click on Modify/remove to uninstall the software.
3.3.3 Balancing activation
The Detector III is supplied ex works with the balancing functionality switched off.
You can enable this function if you have purchased a Detector III balancing kit.
The balancing kit contains a USB dongle which can be used to enable one unit
only.
Dongle
This activation is essentially carried out as follows:
· A dongle is supplied with the balancing kit that has not previously been used.
· You can use this dongle to enable the balancing functionality for only one
Detector which can be selected at will.
· Once enabled, the serial number of the Detector is saved on the dongle. From
this point onwards the dongle may only be used with this specific Detector.
· You can also deactivate the balancing functionality in the Detector once again

39
Trendline 3
using the corresponding dongle. The serial number on the dongle is then
deleted and you can now use it to enable any other Detector of your choice. This
is useful, for example, if you are sending a Detector to the manufacturer for
calibration and want to use the balancing function on a different Detector in the
meantime.
To activate the balancing function on the Detector, start the Trendline software.
Connect the Detector to the PC using the serial cable. Plug the dongle into a free
USB port. Switch on the Detector and select the Trendline menu item Detector >
balancing activation. The following window is now displayed:
The serial number of the connected Detector and the dongle identified are
displayed at the top and bottom respectively. The identified version should start
with "3" in the case of Detector III. The serial number of the Detector for which this
dongle has already been used or, if the dongle has not yet been used, <Empty> is
displayed in the Used for Detector: column. Now select the required dongle from
the Type column (should be displayed as "<Empty>" in the "Used for Detector"
column). You can now enable the balancing functionality via Activate balancing
for connected Detector. A new line Balancing should now be visible and the
serial number of the Detector is displayed in the dongle line.
40
· The first time the dongle is used Windows detects the driver that
was previously installed with the Trendline software. If Windows
asks for a driver select the automatic search option.
· If the dongle is not displayed or a previously used dongle
appears in the list, please click Refresh dongle list.
· If the dongle is correctly identified by Windows but this is not
displayed in the Trendline dongle list you may have an old driver
installed on your system. You can check this in the device
manager under USB controller -> CBUSB Ver 2.0. If Version 1.x
is displayed, uninstall this driver and install the up-to-date driver
on the Trendline CD in the CbSetup directory. In this case select
the CRYPTO-BOX USB.
3.3.4 Register new detector
The Trendline software holds a database for administrating all detectors you use
with your program. Prior to sending data to the Detector for the first time, it has to
be registered to Trendline software. To do that, you connect the Detector to a
serial interface of your computer using the data cable supplied and switch on the
Detector.
The Detector which has just been connected to the computer is
normally automatically detected by the system and registration of
this is not compulsory.
How to register a new Detector:
· Click on Detector > Configure Detector.

41
Trendline 3
· Connect the Detector to your PC and switch it on. Click on Search for new
Detector to register the new Detector on to the program.
· You may give the Detector a name, which will be displayed in the default display
when switching on the instrument.
· You can select the language for the Detector. Nevertheless it still can be
changed at the Detector.
· You can set the time of the Detector either by entering the correct time and date
(to do this, click on the figure you want to change) or by clicking Send system
date to the Detector (that way the detector is set to the same time and date as
your PC).
· Here, you can select the baud rate of the Detector. Under normal
circumstances, you should select the highest possible (57,6 kbps). In case of
problems with communication (e.g. the connection breaks down at times) you
may select the lower baud rate of 38,4 kbps.
· After completing all settings, click on OK to send the changes to the Detector.
Make sure that the Detector is switched on when clicking OK, because
otherwise no communication is possible.

42
3.4 Setting up configuration
3.4.1 Enter system tree
Each configuration is subdivided into three levels, e.g. section – machine –
measuring point.
Setting up configuration elements
In order to create a new configuration, carry out the following steps:
· Click on System > New item (or on
).
· Name the entry, e.g. "Cement Plant 1”.
· Add the new sub-entry by clicking on System > New sub-item or click on
.
That way, you add a new section to the configuration. Name that e.g. "Section
1".
· Exactly as with the section, add another machine (“Machine 1”) and a new
measuring point (“Measuring Point 1”) by following the sequence via New sub-
item.
Moving or copying configuration elements
You can only move configuration elements if the target is on a higher level, i.e. you
can
· move or copy a measuring point (level 3) to another machine (level 2), and
· move or copy a machine (level 2) to a different section (level 1).
If the target already contains sub-elements, the moved/copied
element is always appended to the end of the list.
Moving an element
· Left-click on the element, keep the mouse button pressed, and drag the element
onto the target element.
· Release the mouse button to insert the element.
Copying an element
· Left-click on the element while pressing the CTRL key, keep the mouse button
and CTRL pressed, and drag the element onto the target element.
· Release the mouse button and CTRL to copy the element.
or:
· Right-click on the element and select Copy.
· Right-click on the target element and select Paste.

43
Trendline 3
or:
· Right-click on the element, keep the mouse button pressed, and drag the
element onto the target element. A pop-up menu displays.
· Select Move.
3.4.2 Automatic assignment of RFID tags to measuring points
In order to simplify allocation of measuring points in the Trendline configuration to
measuring point in your system, you can add RFID tags to them. The Detector can
read existing RFID tags at the measuring points and automatically assign the
measured values to the correct measuring point in the Trendline software.
If you transfer a configuration with RFID settings to a Detector
without an RFID reader, it displays an error after data transfer and
ignores the RFID settings.
Assigning an RFID tag to a measuring point
Before using, you must assign the RFID tags placed on the measuring points. You
can do this immediately before a CM or balancing measurement. Select the
measuring points wither in the Trendline software or in the on-site Detector:
Selection in the Trendline software
1.
Select a measuring point in the Trendline configuration.
2.
Click on the Configuration tab.
3.
In the RFID Status box select Assign RFID.
4.
Repeat this procedure for all measuring points to which you wish to assign RFID
tags.
5.
Send
the configuration to the Detector.
6.
During the round, select the appropriate measuring point in the Detector (see
Selection of measuring point
).
a)
Select Start measurement. The Detector reads the RFID tag on site and
assigns it to the measuring point.
b)
If you do not want to perform a measurement but just want to assign the RFID
tag, select Assign RFID at the appropriate measuring point on the Detector.
7.
Load the data from the Detector in Trendline. The RFID status of the measuring
points is now set to "RFID assigned" and the green RFID icon is displayed in
front of the measuring point in the configuration tree.
67
183

44
You can set the status of all measuring points of an element (e.g. a
machine) to "RFID assigned". To do so, right-click the element and
select Assign RFIDs globally. On the next round with the Detector
you can assign the RFID tags placed here to all the appropriate
measuring points.
Selection in Detector
1.
If you have not assigned an RFID tag to a measuring point yet, you can also
assign one on the Detector. You can assign it immediately before a CM/
balancing measurement or before a run up/coast down test. Select the
measuring point on the Detector and then the Assign RFID command. You can
then perform a measurement.
2.
Load the data from the Detector in Trendline. The RFID status of the measuring
points is now set to "RFID assigned".
Removing the assignment of an RFID tag
1.
Select a measuring point with an RFID tag assigned in the Trendline.
2.
Click on the Configuration tab.
3.
In the RFID Status box select Delete RFID.
4.
Send
the configuration to the Detector.
5.
During the round, select the appropriate measuring point in the Detector (see
Selection of measuring point
).
6.
Select Start measurement. The Detector prompts you to delete the tag.
Delete the tag and select Tag deleted.
If you do not delete the tag, select Tag stays.
7.
Continue measuring.
8.
Load the data from the Detector in Trendline. The RFID status of the measuring
point is set to "No RFID" if the tag was deleted.
You can globally delete all RFID tag assignments to measuring
p
oints of an element (e.g. a machine) in the configuration. To do so,
right-click the element and select Delete RFIDs globally. On the
next round, confirm deletion of the RFID tag assignment for each
measuring point before the measurement.
Changing the assignment of an RFID tag
To change the assignment of an RFID tag to a measuring point: First change the
RFID status in the Trendline configuration and transfer the modified configuration
to the Detector. On the next round with the Detector, you can then import the new
RFID tag.
67
183

45
Trendline 3
1.
Select the measuring point in the Trendline configuration.
2.
Click on the Configuration tab.
3.
In the RFID Status box select Edit RFID.
4.
Send
the configuration to the Detector.
5.
During the round, select the appropriate measuring point in the Detector (see
Selection of measuring point
).
6.
Select Start measurement. The Detector prompts you to delete the tag.
a)
Delete the tag and select Tag deleted. You can now assign the new RFID
tag.
b)
If you do not delete the tag, select Tag stays.
7.
Continue measuring.
8.
Load the data from the Detector in Trendline. The new RFID tag is assigned in
the measuring point in the system configuration.
Exchanging a defective RFID tag
If communication with the RFID tag at a measuring point does not work, the user
can mark it as "defective" in the Detector and then continue measuring. After the
next data synchronization with the Trendline software, the RFID status "RFID
defective" is displayed at the measuring point and recursively up to the top level in
the configuration tree. You can then assign a different RFID tag to the measuring
point.
1.
The Detector cannot read the RFID tag at the measuring point. Select RFID tag
defective in the Detector.
2.
The program displays "Is the tag defective?". Select Yes.
3.
Delete the RFID tag from the measuring point.
4.
Load the data from the Detector in Trendline. The RFID status of the measuring
points is now set to "RFID defective".
5.
You can now assign a different RFID tag to the measuring point.
Additional information
· You can abort Detector RFID tag assignment handling functions by pressing
Esc. This preserves the previous state of the assignment.
· If the Detector recognizes an RFID tag that is not in the configuration, it displays
the error message: "At least one configuration does not exist".
3.4.3 Create a measuring point
The settings for the measuring point can now be made. Three tabs are assigned to
each measuring point in the right-hand window: Information
, Configuration
and Measured values .
67
183
46 46
88
46
Info
Comments on this measuring point may be entered in the field provided in the
Information tab. It is also possible to insert an picture. To do this, click
and
select the desired picture in the file dialogue. Please observe that these pictures
should not be larger then 100kB, otherwise the program will run more slowly with a
lot of large pictures. You can print out the picture using
and remove it using .
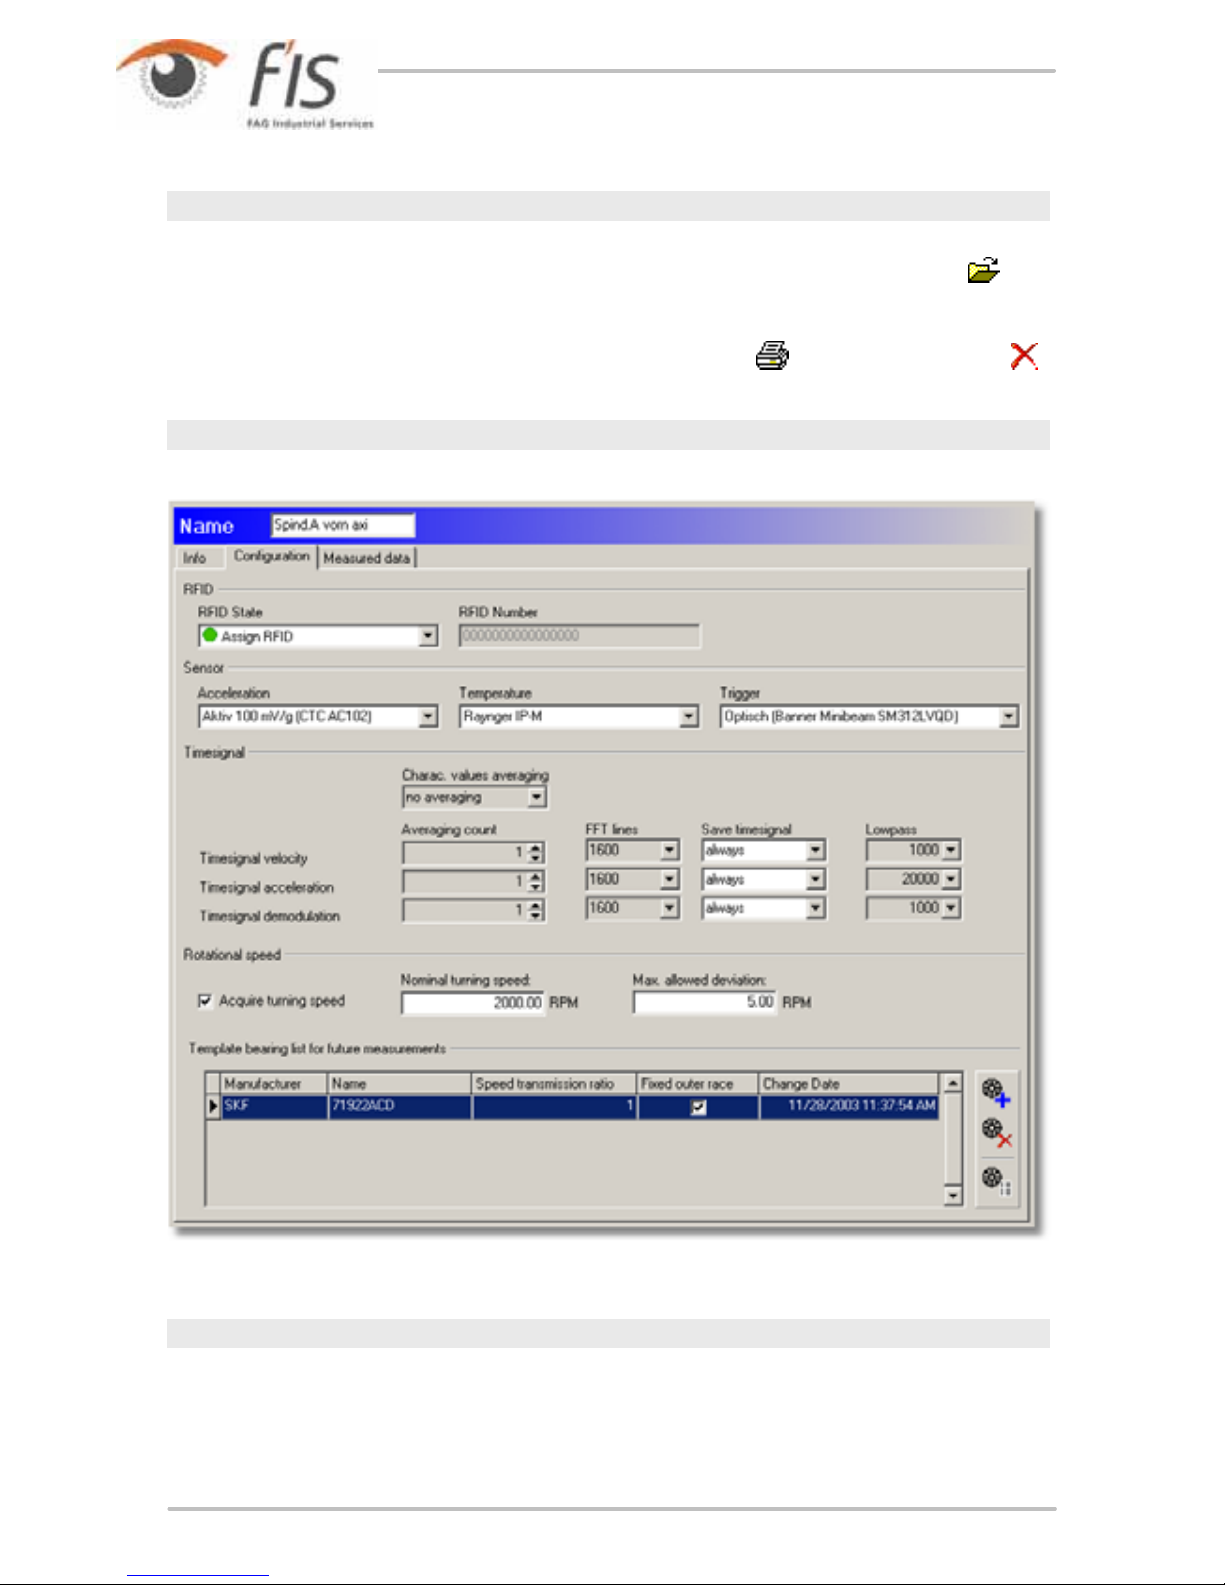
Configuration
RFID status
In this section you can display and edit the status of an RFID tag assigned to the
measuring point:
· No RFID No RFID tag is assigned to the measuring point.

47
Trendline 3
· Assign RFID This option instructs the Detector to assign an RFID tag placed on
the machine to this measuring point during the next round.
· RFID assigned An RFID tag is assigned to the measuring point. The unique ID
is displayed in the RFID number field.
· Delete RFID This option instructs the Detector to cancel the RFID tag
assignment to the measuring point during the next round.
· RFID defective The Detector has marked the assigned RFID tag as defective.
· Change RFID This option tells the Detector to replace the assigned RFID tag.
During the next round, you must delete the tag and assign a new one before you
can perform the measurement at this measuring point.
You can only select the statuses that are accessible as a follow-up
status of the current status.
See also
Automatic assignment of RFID tags to measuring points
.
Sensor
You can adjust the vibration measurement sensors and the temperature at Sensor
. Only the sensors that were previously entered in the sensor database will be
available for selection (see Add sensor
). You can select a sensor for
Acceleration, Temperature and Trigger from the sensor database.
Time signal
In this area you can specify how the Detector should handle time signals
, FFTs
and characteristic values.
· Charac. value averaging: the FFTs or characteristic values calculated from the
time signals are averaged. If the average of four values is determined, for
example, four values are recorded in succession, the FFT is calculated and the
(frequency selective) characteristic values are produced. The time signals
stored for the purposes of an averaged measurement are always the last time
signals measured. Select FFT to determine the mean values of the FFTs
calculated from the time signals and select Char. values to apply the average
determined for the characteristic values calculated from the FFTs.
· You can set the resolution of the spectrum under FFT lines. Select 1600
(corresponds to 4096 samples) or 3200 FFT lines (corresponds to 8192
samples).
· You can use Save time signal to specify when a time signal should be saved:
never, always or on alarm (a main alarm).
43
34
211

48
· At Lowpass you can select a low pass frequency for the frequency band to be
measured from a predefined list. The sample rate in this case is always 2.56
times the selected low pass frequency.
Note that the filter calculation in the software is performed at the
200 Hz and 500 Hz settings and is therefore slower than at the
other frequencies. Therefore, you should only select this high
frequency if you really need it. Otherwise, select a greater number
of FFT lines: For example, it is faster to measure at 1 kHz / 3200
FFT lines than at 500 Hz / 1600 FFT lines, although both
measurements are performed at the same resolution.
A
part from Save time signal the time signal settings can no longer
be changed after the first measurement as otherwise it would no
longer be possible to compare characteristic values.
Rotational speed
If the rotational speed also needs to be determined by the Detector during the
measurement select the Acquire turning speed option. The nominal rotational
speed as well as the maximum permissible deviation in RPM should also be
entered in the appropriate input fields. If the rotational speed deviates from the
rotational speed band defined here during measurement, the Detector issues an
error message but still performs the measurement.
Bearing list template
In this section you can assign bearings from the bearing database
to the
measuring point or delete an assignment. The associated kinematic frequencies of
the selected bearing are then also displayed in the evaluation diagram in the FISViewer. Both when making assignments and deleting assignments you can choose
whether
· to only apply bearing data in future
· for all measurements already performed, or
· only for measurements from a certain period
Specify the bearing assignment at measuring point level in the
configuration. You can also assign bearing data directly to individual
measured values. For more information refer to Measured values
.
68
88

49
Trendline 3
Add bearing
· Click and select the bearing from the bearing database.
· Selecting measurements:
o If you only want to apply the bearing information for future measurements,
click Do not add this bearing to any measurement of this measuring
point.
o If you want to apply the bearing information to all saved measurements, click
Add this bearing to all existing measurements of this measuring point.
o To apply the bearing information to measurements in a certain time range,
click Add this bearing to all measurements of following timerange and
select the time range.
· In the Bearing configuration section enter the speed transmission ratio and
select whether the bearing has a fixed outer race.
Disable bearing
· Click on the bearing to delete and then
.

50
· Selecting measurements:
o To keep the bearing information for the existing measurements of this
measuring point, click Do not disable the bearing for any measurement of
this measuring point.
o To delete the bearing information from all saved measurements of this
measuring point, click Disable the bearing for all existing measurements
of this measuring point.
o To delete the bearing information from measurements in a certain time range,
click Deactivate bearing for all measurements of following timerange and
select the time range.
Displaying bearing information
· Click on the desired bearing and then
. This displays the bearing information
in the bearing database.
Measured values
In the Measured data section you can display the acquired data numerically and
graphically. For more information refer to Measured values
.
3.4.4 Setting characteristic values
You can create the following characteristic values per measuring point:
· ISO 10816
· A
sel
and A
eff
,
88

51
Trendline 3
· D
sel
and D
eff
,
· Temperature,
· V
sel
,
· Crest factor.
Please also observe the information in the "Frequency selective characteristic
values
" section.
Characteristic values can be changed until they have been sent to
the Detector for the first time. After that the characteristic values
turn grey in the tree and cannot be altered anymore. Otherwise, the
measuring results could not be compared.
To add a new characteristic value, right-click the measuring point the characteristic
value is meant for and, after that, on New sub-item. Alternatively, you can do it via
System > New sub-item or via
. Now, the following window opens.
Under Type various characteristic values can be selected, which can be measured
with the detector. With selective characteristic values (e.g. a
sel
) the upper and
lower cut-off frequency can be set in Frequency min. and Frequency max.,
between which the characteristic value will be calculated. More information to that
you will find in Frequency selective characteristic values
. For the other
characteristic values (ISO 10816, a
eff
and d
eff
) the cut-off frequencies are pre-set.
In the Alarm section you can set a threshold value for each characteristic value. If
this is exceeded by a measurement, both Detector and Trendline software show
212
212

52
an Alarm. Additionally, a preliminary alarm threshold can be set in Trendline
software. If the measured value exceeds this threshold, preliminary alarm is given
for this measuring point in Trendline software. The Detector shows main alarms
only. Prealarms are only displayed in Trendline.
See also
Reset alarm status
.
3.4.5 Editing / deleting sensors
If you have added custom sensors in addition to the pre-defined sensors, you
can edit or delete them. However, this is only possible if the sensor is not being
used in a configuration!
Editing a sensor
· In the Detector menu click Sensor > Edit.
· Select the sensor in the Edit sensor window.
· Edit the settings (see also Add sensor
) and click OK.
If the sensor is in use, the input boxes are grayed out and you cannot edit them.
Deleting a sensor
· In the Detector menu click Sensor > Delete.
· Select the sensor to delete in the Delete sensor window and click OK.
If the sensor is in use, this is displayed in the window and you cannot delete it.
3.4.6 Managing measurement comments
In the Trendline software you can create short texts as measurement comments.
The comments list is synchronized whenever data are exchanged with the
Detector. During the measuring round, you can assign a comment from the list to
every measurement on the Detector. The comment is saved with the measurement
and displayed in the measuring results in the Trendline software. You can then edit
the comment if necessary (see "Measured data
").
92
34
34
88

53
Trendline 3
Create comment
· Click Comment selection list in the Detector.
· In the Comments window click
.
· Enter the desired text and click
.
· Click Close.
Delete comment
· Click Comment selection list in the Detector.
· In the Comments window click
.
· Click Close.
Edit comment
· Click Comment selection list in the Detector.
· In the Comments window click
.
· Enter the new text and click
.
· Click Close.
3.4.7 Add balancing configuration
To create a balancing configuration click on a level 3 configuration element
(machine or motor, for example). Then click System > Add balancing
configuration.
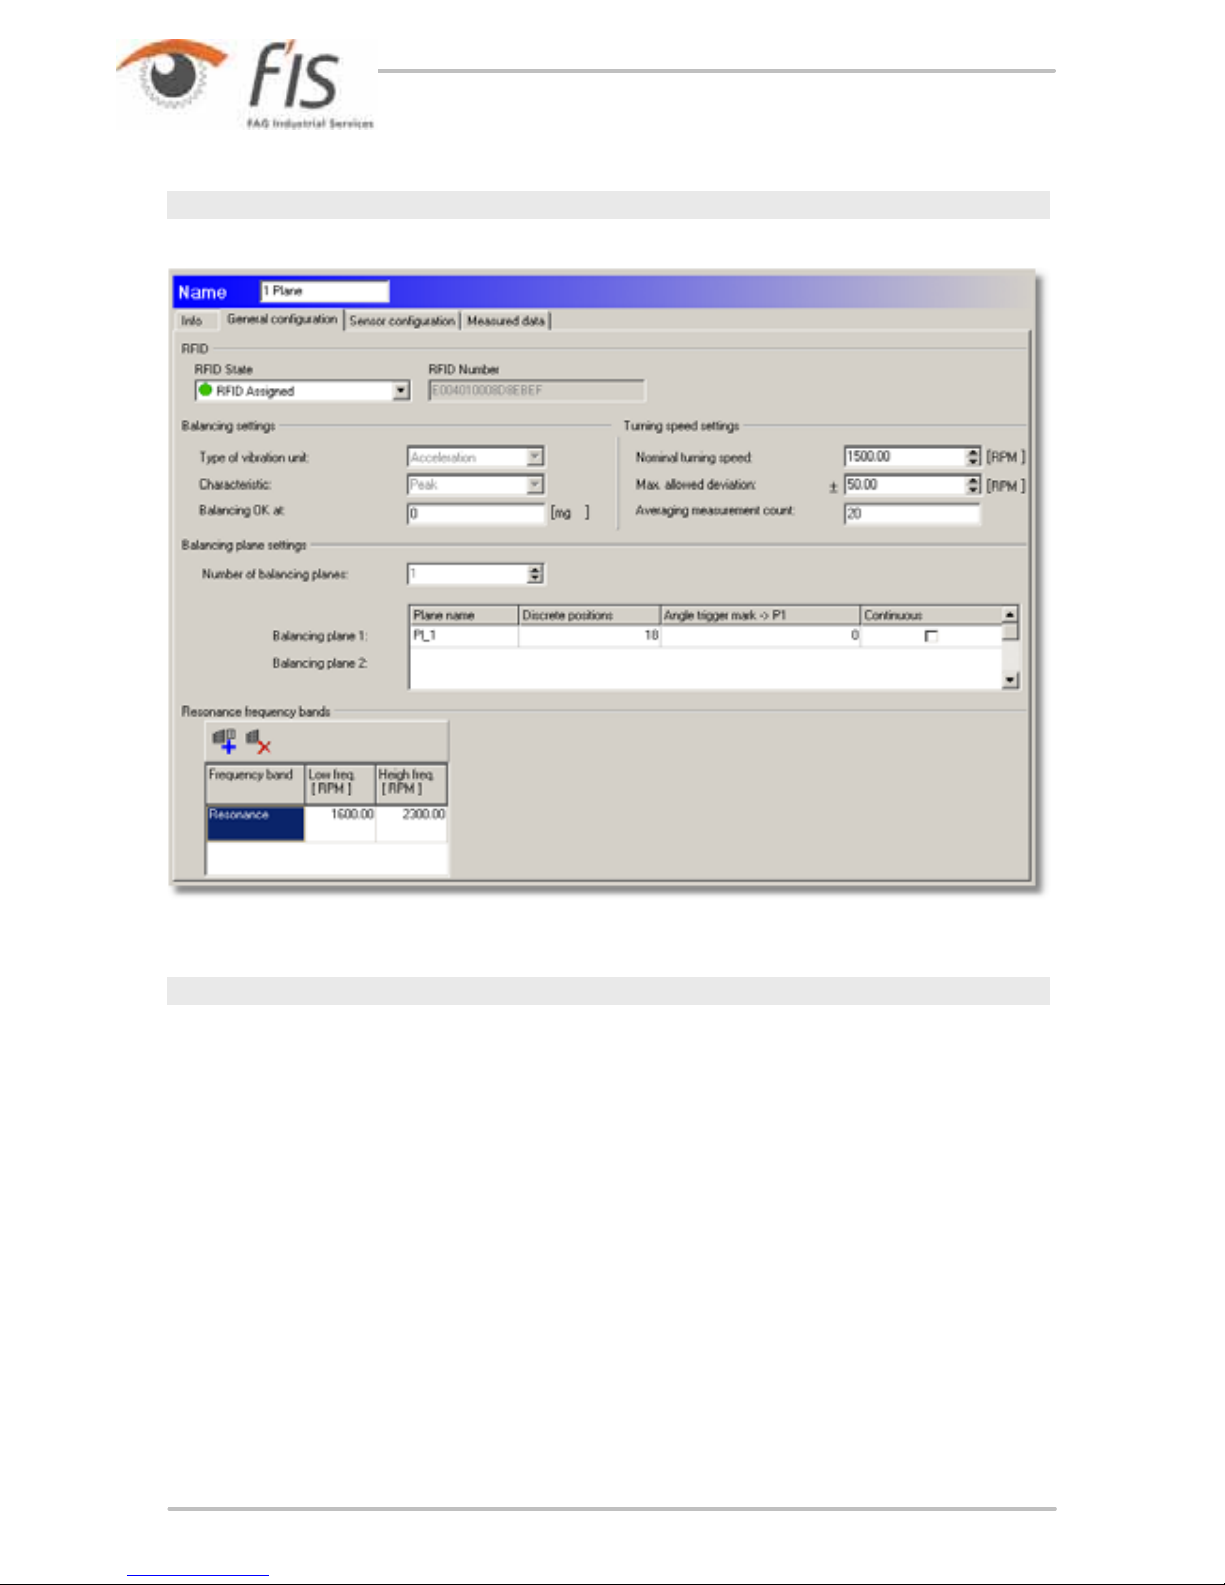
54
General configuration
RFID status
In this section you can display and edit the status of an RFID tag assigned to the
measuring point:
· No RFID No RFID tag is assigned to the measuring point.
· Assign RFID This option instructs the Detector to assign an RFID tag placed on
the machine to this measuring point during the next round.
· RFID assigned An RFID tag is assigned to the measuring point. The unique ID
is displayed in the RFID number field.
· Delete RFID This option instructs the Detector to cancel the RFID tag
assignment to the measuring point during the next round.
· RFID defective The Detector has marked the assigned RFID tag as defective.
· Change RFID This option tells the Detector to replace the assigned RFID tag.
During the next round, you must delete the tag and assign a new one before you
can perform the measurement at this measuring point.

55
Trendline 3
You can only select the statuses that are accessible as a follow-up
status of the current status.
See also
Automatic assignment of RFID tags to measuring points
.
Balancing settings
· Type of vibration unit: Select Acceleration, Velocity or Displacement.
· Characteristic: Specify here whether the peak-to-peak value, the peak value
or the root mean square (RMS) should be evaluated.
· Balancing OK at: define the limit value for the balancing measurement here. If
all measured values are below the value specified during the trim run
the
balancing procedure has been successfully completed and the Detector ends
the balancing measurement.
Rotational speed settings
· Enter the Nominal turning speed (in the predefined unit, see "Program settings
/ General
") and the Max. permissible deviation in the appropriate input
boxes. Note that a deviation of more than 10% is not possible. If the rotational
speed measured by the Detector is outside the rotational speed band defined
here the Detector outputs an error message
.
· During the measuring process the Detector averages the rotational speed
values. Specify how many rotational speed values are to be used for averaging
at Number of averages to be determined during one measurement. If you
enter 20, for example, the Detector averages the values obtained for rotational
speed across 20 revolutions.
Balancing plane settings
· Number of balancing planes: Select "1" for single-plane balancing or "2" for
two-plane balancing.
· Enter a plane name for the selected planes or use the name suggested
Trendline software (see also "Program settings / General
"). Due to the
Detector display this name can only contain 5 characters.
· Click Continuous if you can attach the balancinf weights anywhere on the shaft.
If this is not possible (e.g. with a fan with 10 blades), Continuous must not be
selected.
· If you deactivated Continuous, use Discrete positions to select the number
of possible positions for the balancing weights, e.g. for a fan. In addition, please
enter the angle of the next possible position against the direction of rotation to
the reflex mark edge in Angle trigger mark -> Pos. 1. This position is called P1.
43
198
110
205
110

56
Resonant frequency bands
In this section you can manually enter the resonant frequency bands determined
for this measuring point.
1.
Click on
.
2.
Enter the name of the frequency band.
3.
Select Lower frequency and Upper frequency and click OK.
You can copy resonant frequency bands determined from a run up/
coast down test and subsequent creation of an amplitude/phase
diagram to the balancing configuration (see Setup run up/coast
down
).
Sensor configuration
61

57
Trendline 3
Sensor position settings
In this section you can insert up to four sensor positions. Each balancing plane
must have at least one sensor position. If you add a new balancing configuration to
the system configuration, a sensor position is automatically added per balancing
plane.
· Sensor position: Enter a name for the sensor here (maximum of 5 characters).
Due to the size of the Detector display this can only be 5 characters long.
· BNC connector: Select the BNC port
used to connect the sensor during the
measurement. If you are measuring with two sensors, you should use both BNC
connectors on the Detector as this accelerates the speed of measurement.
· Angle: Enter the angle of displacement of the sensor from the zero position in
the direction of shaft rotation. The stator is always used as the reference for the
zero position which points vertically upwards.
· Sensor: Select the sensor used from the sensor database
here.
Trigger settings
· Select trigger sensor: Select the trigger sensor used from the sensor database
here.
· Name of trigger position: Enter a designation for the trigger position. This is
required for identification of the trigger sensor by the Detector. Due to the size of
the Detector display this name can only be 5 characters long.
· Angle of trigger sensor: Enter the angle of displacement of the trigger sensor
from the zero position in the direction of rotation.. The stator is always used as
the reference for the zero position which points vertically upwards.
· Select Positive or Negative to indicate whether the measurement should start
on a positive or negative edge on the trigger sensor. This edge determines the
0° position of the shaft.
Configured angles
In this area the Trendline software provides a graphic representation of the
position of the sensors.
The sensor positions are always counted in the direction of shaft
rotation.
Measured data
You can view the measured data in this area once a balancing measurement is
complete and the data have been transferred to the Trendline software from the
Detector.
176
34
34

58
Edit comment
· In order to edit a measurement comment, click on the measurement and then
Edit comment of selected balancing step.
Show details
To display the details of a measurement click on the appropriate entry in the list
then click on
.
The Trendline software displays the sensor position, time of measurement,
rotational speed, amplitude and phase of the vibration at the sensor at each stage
of the balancing measurement. If you also wish to see the coefficients used and
their corresponding amplitude and phase click Show coefficients.
If you wish to hide the details again click on
.
Display sensor charts
Click Sensor charts to display the position of the sensors as a chart. Trendline
enters the sensor position on a circular chart for each individual step of the

59
Trendline 3
measurement. You can activate/deactivate the display of each sensor at Sensor
position <n>.
Display weight graphics
Click Weight charts to display the weights as a chart. The Trendline software
enters the position of the weights during the trial run and trim run in a circular
chart. You can switch the display of weights for each plane on or off by clicking on
Applied weights - Plane <n>.
The positions of the weights are indicated against the direction of
shaft rotation.
60
Print view of graphics
Click on
to call up a print preview of the graphics.
Balancing report
Click on
to generate a balancing report .
Delete balancing data
To delete the data obtained during a balancing measurement click the
corresponding entry in the list then click . Click on
.
102
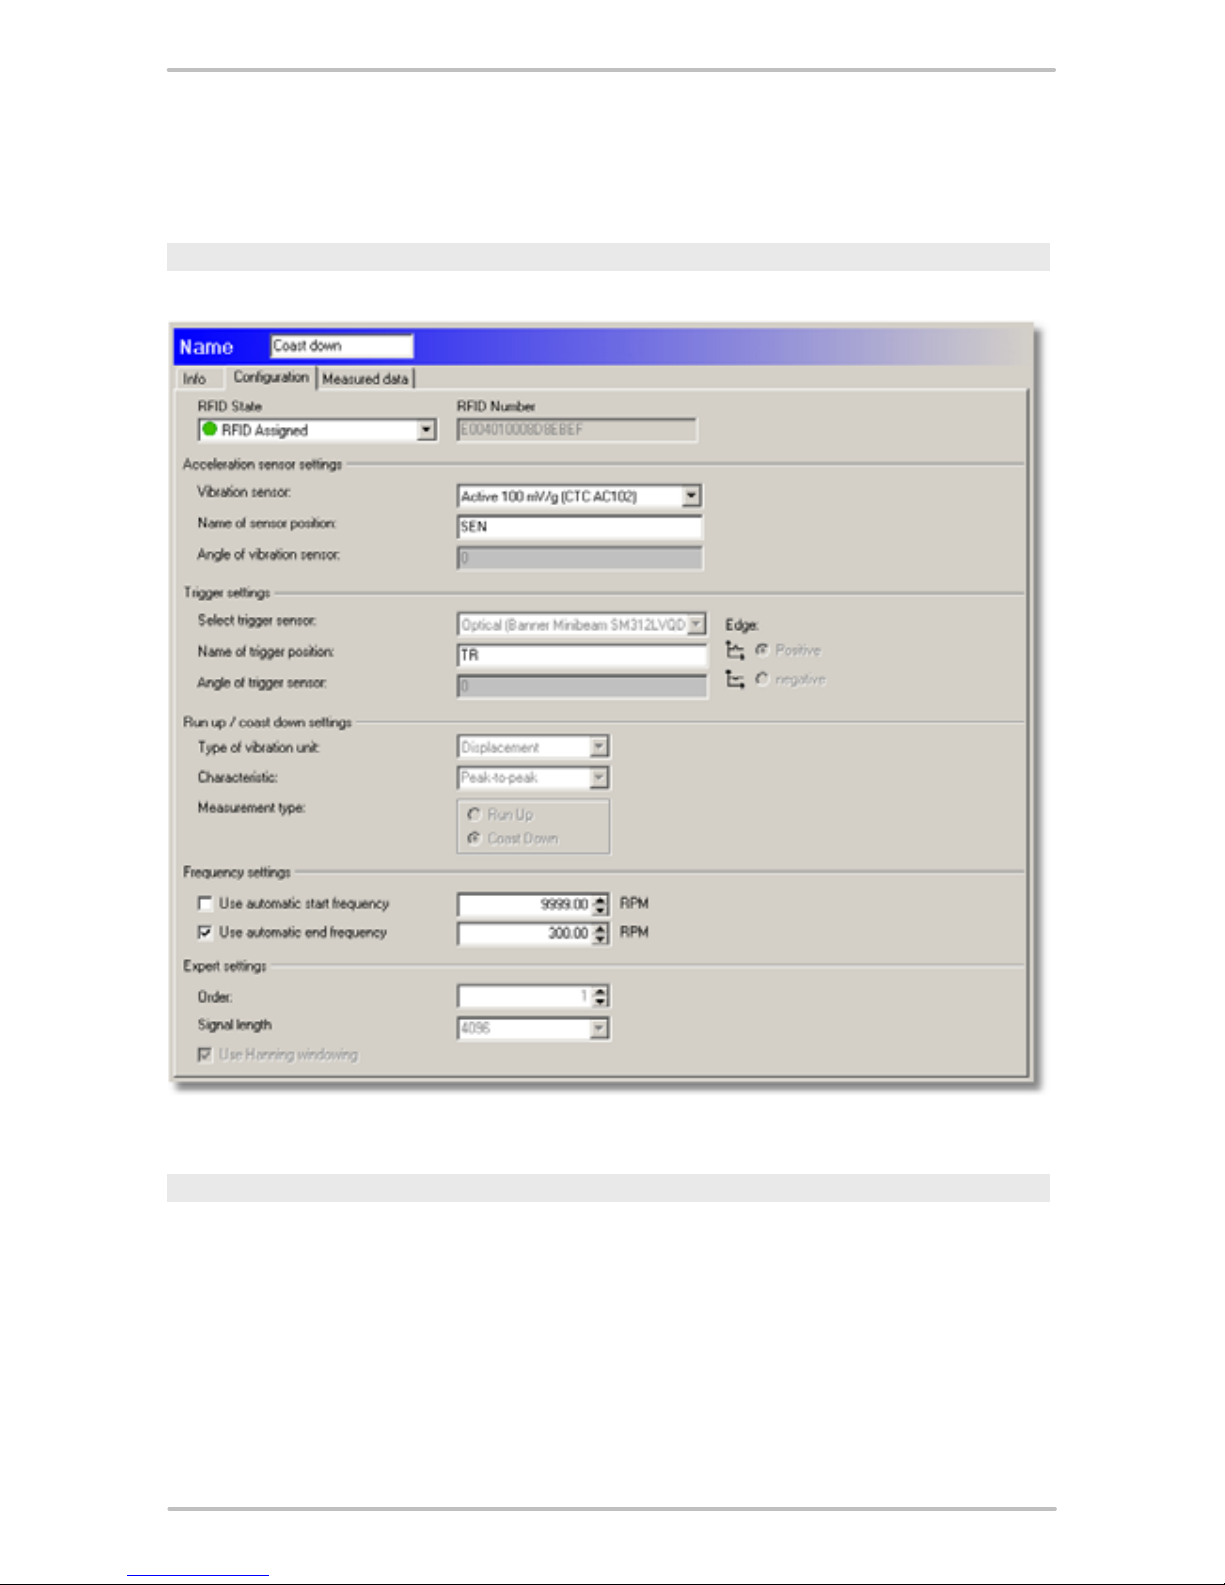
61
Trendline 3
3.4.8 Setting up run up/coast down
Configuration
RFID status
In this section you can display and edit the status of an RFID tag assigned to the
measuring point:
· No RFID No RFID tag is assigned to the measuring point.
· Assign RFID This option instructs the Detector to assign an RFID tag placed on
the machine to this measuring point during the next round.
· RFID assigned An RFID tag is assigned to the measuring point. The unique ID
is displayed in the RFID number field.
· Delete RFID This option instructs the Detector to cancel the RFID tag

62
assignment to the measuring point during the next round.
· RFID defective The Detector has marked the assigned RFID tag as defective.
· Change RFID This option tells the Detector to replace the assigned RFID tag.
During the next round, you must delete the tag and assign a new one before you
can perform the measurement at this measuring point.
You can only select the statuses that are accessible as a follow-up
status of the current status.
See also
Automatic assignment of RFID tags to measuring points
.
Acceleration sensor settings
· Vibration sensor: Select the sensor used from the sensor database
here.
· Name of sensor position: Enter a designation for the sensor position. This is
required for identification of the sensor by the Detector. Due to the size of the
Detector display this name can only be 5 characters long.
· Angle of vibration sensor: Enter the angle of displacement of the trigger
sensor from the zero position in the direction of rotation.. The stator is always
used as the reference for the zero position which points vertically upwards.
Trigger settings
· Select trigger sensor: Select the trigger sensor used from the sensor database
here.
· Name of trigger position: Enter a designation for the trigger position. This is
required for identification of the trigger sensor by the Detector. Due to the size of
the Detector display this name can only be 5 characters long.
· Angle of trigger sensor: Enter the angle of displacement of the trigger sensor
from the zero position in the direction of rotation.. The stator is always used as
the reference for the zero position which points vertically upwards.
· Select Positive or Negative to indicate whether the measurement should start
on a positive or negative edge on the trigger sensor. This edge determines the
0° position of the shaft.
Run up / coast down settings
In this section you can make settings required for Determining the resonance
range of a machine
with the run up/coast down test.
· Type of vibration unit: Enter which vibration unit to use at run up/coast down.
The following are available: Displacement, Velocity and Acceleration.
· Characteristic: Specify here whether the peak-to-peak value, the peak value
43
34
34
199

63
Trendline 3
or the root mean square (RMS) should be evaluated.
· Measurement type: Enter whether the Detector measures during run up or
coast down of the machine
Frequency settings
In this section you can set the start and end frequency for Determining the
resonance range of a machine
with the run up/coast down test.
· Use automatic start frequency: Enter the frequency at which the Detector
starts measuring.
· Use automatic end frequency: Enter the frequency at which the Detector stops
measuring.
Expert settings
The settings in this section concern conditioning of the measuring signal
determined while Determining the resonance range of a machine
with the run
up/coast down test.
· Order: Select what signal order the Detector should determine (1 = rotational
speed signal, 2 = 1st harmonic, 3 = 2nd harmonic, 4 = 3rd harmonic).
· Signal length: Enter how many samples (1024, 2048 or 4096) the Detector
should measure per measuring signal.
· Use Hanning windowing: Select whether the Detector should use Hanning
windowing when conditioning the measuring signal. Hanning windowing leads to
better quality of the digitized measuring signal, particularly at low rotational
speeds. However, this additional step requires computing time in the Detector
and leads to increased noise in the digitized signal.
The effects of this setting depend very much on the type of machine
and on the individual demands on the ratio of accuracy to the
number of signal support points. As a general rule, you should
· measure as many amplitude and phase values as possible for
machines that run up/coast down quickly - i.e. reduce signal
length and thus signal quality and do without Hanning windowing,
· increase accuracy for machines that run up/coast down slowly, i.
e. increase signal length and thus signal quality and activate
Hanning windowing.
Measured data
In the Measured data window you can
· create an amplitude/phase diagram for a set of measured data,
· save frequency bands selected in the diagram and copy them to a balancing
configuration
.
199
199
53

64
The Run up/coast down measurements section displays the run up/coast down
measurements saved for the measuring point.
Limit time range
· In order to limit the time range of the measured values displayed, select the
Time range option.
· Set the desired start and end date.
Edit comment
· In order to edit a measurement comment, click on the measurement and then
Edit comment.
Below the measurements the window is split into three sections. The amplitude/
phase diagram is displayed in the middle, with the diagram editing tools to the left.
To the right of the diagram there is a list of the user-defined frequency bands.
Displaying the amplitude/phase diagram and setting the frequency band
Click on a measurement to display the amplitude/phase diagram in the diagram
window. You can use the FIS-Viewer zoom tools described in the "FIS-Viewer
"
section to edit the diagram. Cursor tools for the diagram include the base cursor
114

65
Trendline 3
(see "Cursor tools ") and a difference cursor, with which you can specify a
frequency band.
How to specify a frequency band in the amplitude/phase diagram:
· Move the base cursor (yellow) to the measuring point to specify the lower cutoff
frequency.
· Move the difference cursor (green) to the desired measuring point to specify the
upper cutoff frequency.
In the diagram information, you can read the position of the base and difference
cursor and the width of the frequency band and amplitude difference.
Saving the frequency band
1.
Select the frequency band in the amplitude/phase diagram and click
.
2.
Enter a name for the frequency band and click OK.
or:
1.
Click on
.
2.
Enter the name of the frequency band.
3.
Select the start and end frequency and click OK.
Deleting a frequency band
1.
Click on the frequency band to delete.
2.
Click on
.
Copying frequency bands to a balancing configuration
1.
Click on
.
2.
The Add frequencies to balancing configuration window displays the
balancing configurations available in the system configuration. Select the
desired balancing configuration and click OK.
3.4.9 Change alarm levels automatically
The Trendline software can automatically adjust the alarm settings for the
individual characteristic values. During this process the software determines the
average of all measured values for the relevant characteristic value and
automatically adjusts the corresponding alarm value according to your
specifications. Alternatively, you can use the values suggested by the software.
CAUTION
Modification of alarm thresholds may have severe effects on the
service life of the monitored components if used improperly. You
should therefore always carefully check whether the intended
settings are suitable for your specific system.
137

66
To modify the alarm values automatically proceed as follows:
· Select the required element from the configuration tree – a specific machine, for
example. The alarm values for this element and all sub-elements it contains are
modified.
· Click on Alarm thresholds in the System menu.
Specify time range
You can use the Time range option to limit the measuring values used for
averaging. To do this, enter the start and end time. Alternatively, you can enter the
end time and specify the duration in whole days in the No. of days input field. In
the latter case the start time is automatically determined.
Configuration of automatic adjustment
Automatic adjustment of alarm values can be defined for each individual
characteristic value
(acceleration, demodulation, velocity and temperature) of
the element selected in the configuration tree.
15

67
Trendline 3
To activate the automatic adjustment for one characteristic value proceed as
follows:
· Select the characteristic value.
· Enter the main alarm adjustment as a factor of the average value.
· Enter the pre-alarm adjustment as a percentage (less than 100).
or:
· Click Recommended to set the values recommended by Trendline.
The values suggested by Trendline for the automatic adjustment of
alarm values are based on empirical values used by FAG Industrial
Services GmbH. As entirely different settings may be required
depending on the properties of the components being monitored
these must be regarded purely as suggested values which are
therefore non-binding. In all cases the user is responsible for
selecting appropriate alarm values.
Select the machine class for the characteristic value ISO 10816.
3.4.10 Send configuration
You can send a configuration or a part of a configuration to the Detector. For that,
follow the sequence below:
· Select a machine in the tree.
· Connect the connector to the serial interface using the data cable.
· Switch on the detector.
· Click on Detector > Send configuration in Trendline 3 software or click on
.
Now, the configuration for the machine selected including all measuring points is
sent to the Detector. If you want to send a complete configuration, you would have
to select the configuration in the tree (in the example in paragraph 3.3.1 this would
be “Cement Plant 1”) prior to sending the data. It is even possible to send one
measuring point. This facility is mostly used for test purposes.

68
If the "Always save" option is selected for more time signals in the
configuration that you wish to send to the Detector than are
p
ermitted in the Detector memory an error message will be output
and the data will not be transferred. Also refer to Frequency
analysis
.
3.4.11 Deleting the Trendline database
To delete a Trendline database and remove all configuration and measured data
irreversibly, the database must be open.
· To delete the currently open Trendline database, click Delete current database
in the Tools menu. The program displays a security prompt.
· Click Delete to delete the database irreversibly.
You cannot interrupt the delete process!
3.5 Bearing database
The Trendline database provides you with data on the most widely used bearings
for use in your individual configuration (see Setting up measuring point
).
You can also add your own bearings
to the above. Furthermore, the Trendline
bearing database also includes a group administration feature
which you can
use, for example, to group bearings of different makes that have similar
characteristics.
Click Tools > Bearing database to open the bearing database.
217
45
71
75

69
Trendline 3
3.5.1 Search bearing
To find a bearing click on Search bearing in the bearing database.
· Click on
to display all bearings.
· To restrict the search you can specify the manufacturer and/or group.
· Additionally, you can further limit the name of the bearing in Search criterion.
You can use the wildcards "?" and "*" in the usual way, e.g.
o "*1200*" to find all bearing names containing 1200 or
o "?200*" to find all bearings whose name includes the text "200" at position 2-4.
The list of hits is displayed in Search result.
· Select the bearing to be modified and click on Continue.

70
· Enter the data for the required bearing as described under Add bearing .
· Click on Save.
If the search results do not return a bearing, the bearing database may be
defective or inaccessible. Then proceed as follows:
· Close the Trendline software.
· Deregister the database by running the deinstall_fis_bearing_db_ocx.
bat file in C:\Program Files\Common Files\FIS\BearingDB.
· Register the database element by running the install_fis_bearing_db_ocx.bat
file in the same directory.
· You can now restart Trendline.
71

71
Trendline 3
3.5.2 Add bearing
To add a bearing to the bearing database click on Add bearing.
· Select a manufacturer from the list.
· Enter a name for the bearing in the Label field.
· Detailed comments may be entered in the Comment field (optional).
Geometry data or damage frequencies
· Use the Geometry and Frequencies options to switch between the input fields
in the right-hand area of the window in order to enter corresponding data. When
inputting the contact angle select either degrees or radians as the unit. When
specifying the frequencies enter whether these should be in Hz or rpm.

72
Trendline indicates whether any information still needs to be input in
the bottom right-hand area of the window. The bearing can be
added to the database only if all input is complete.
· Click on Continue to store the bearing in the bearing database.
3.5.3 Edit / delete bearings
Editing bearings
Click on Edit bearing and start by searching for the corresponding bearing as
described at Search bearing
.
69

73
Trendline 3
The list of bearings found is displayed in Search result as well as the number of
hits.
· Select the bearing to be modified and click on Continue.
· Enter the data for the required bearing as described under Add bearing
.
· Click on Continue.
Click on to open the Manufacturer details window. You can call
up the contact details for the manufacturer here.
Deleting a bearing
· Carry out your search initially as described above
then select the bearing to
71
72

74
be deleted from the Search result.
· Click on Delete bearing to remove the bearing from the database.
You can only delete bearings that you have entered yourself!
Once all the bearings for a particular manufacturer have been
deleted you can also delete the manufacturer
.
3.5.4 Exporting / importing bearings
Exporting bearings
Click on Export bearing and carry out your search for the bearing to be edited as
described under Edit/delete bearings
.
· You can use the Export self-created bearings only option to restrict the
export to bearings you yourself have entered.
71
78
72

75
Trendline 3
· Click and select the path and file name. By default, Trendline uses a file
name according to the convention
FISBearingDB_export_<year>_<month>_<day>.zip. Alternatively, you
can use your own file name.
Importing bearings
· Click on Import bearings, then on
.
· Select the import file.
3.5.5 Manage groups
You can use the manage group feature to classify bearings with similar
characteristics regardless of their manufacturer.
· Click on Manage groups to call up the bearing database group administration
feature.
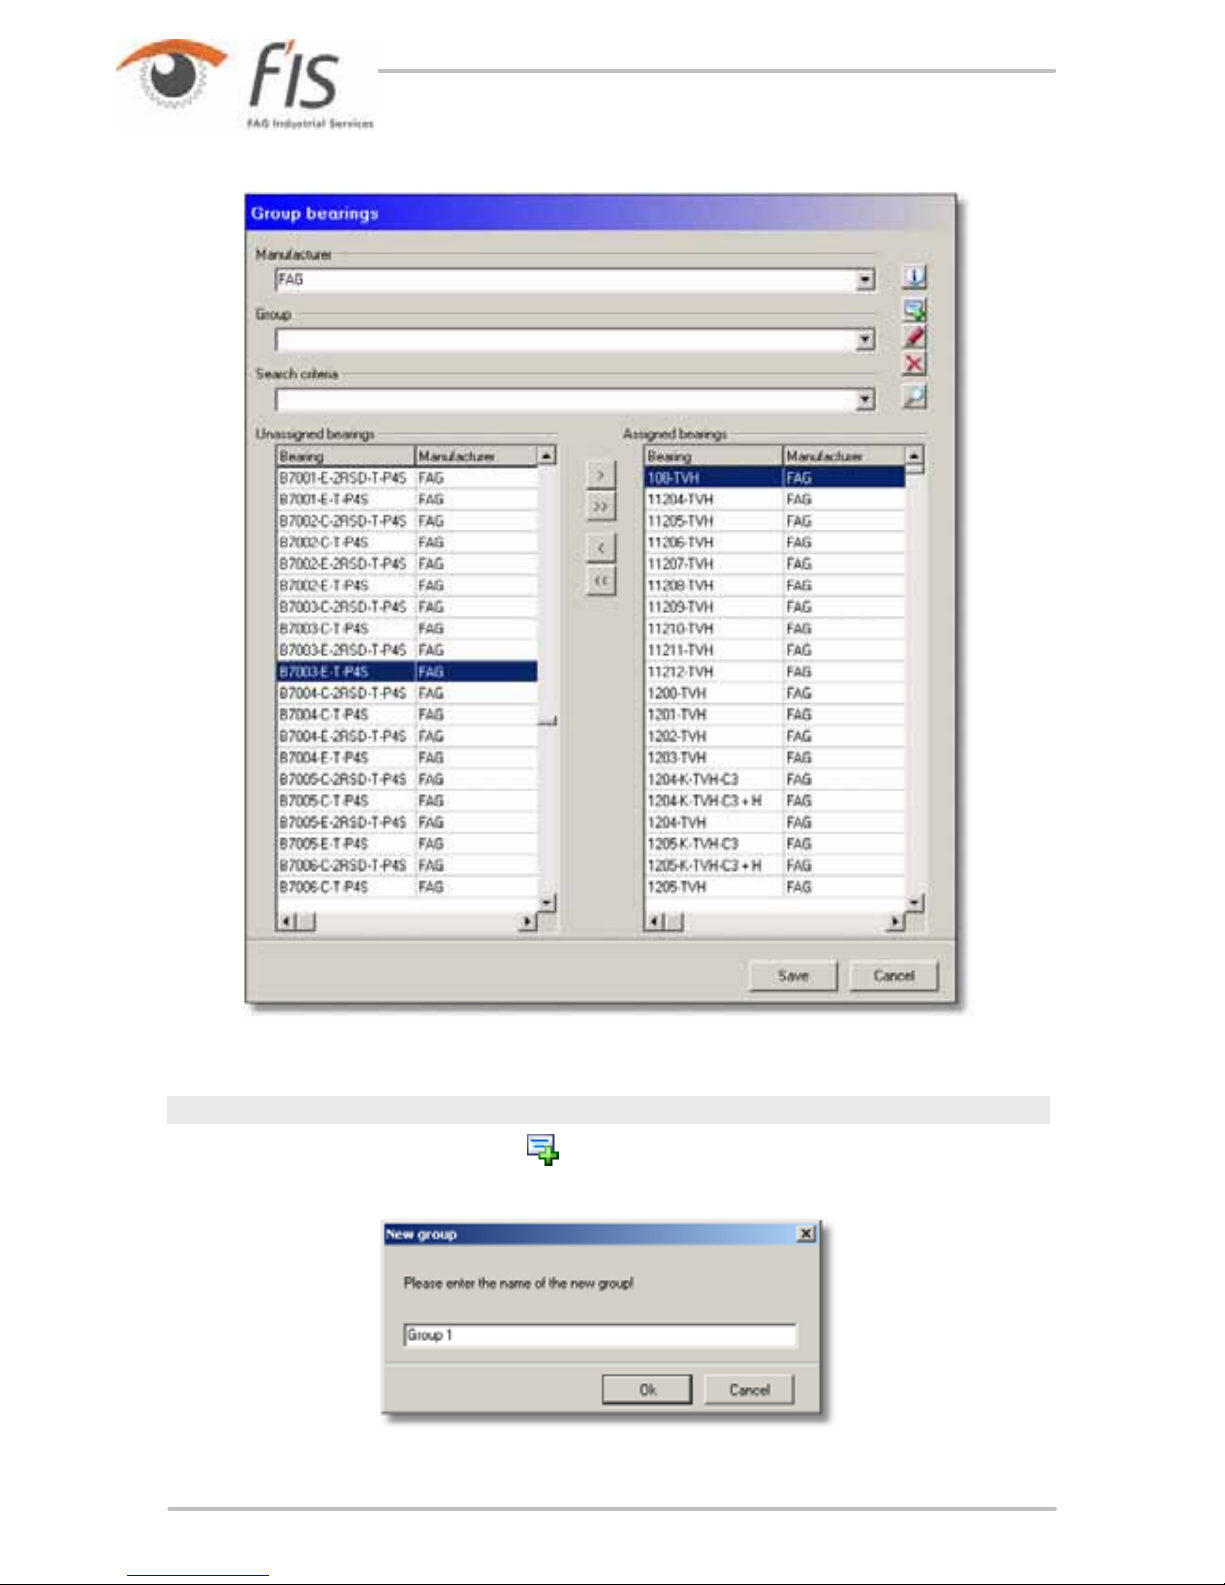
76
Create a new group
· To create a new group click on
.

77
Trendline 3
· Enter a name for the new group and click on OK.
Assign bearings to a group
To assign one or more bearings to a group proceed as follows:
· Select the desired group from the Group list.
· Search for one or more bearings as described at "Edit/change bearing ->
Search bearing
". The bearings found are displayed in the Unassigned
bearings list.
· To assign a bearing to the group click on it then click on
. The bearing should
now be displayed in the Assigned bearings list.
· To assign all bearings found to the group click on
. All bearings should now
be displayed in the Assigned bearings list.
· To delete a bearing from the group click on the bearing in the Assigned
bearings list then click on
.
· To delete all bearings from the group click on
.
· Click on Save assign the bearings to the group in the bearing database.
Rename a group
· To rename a group select it from the Group list and click on
.
· Enter a new name for the group and click on OK.
Delete a group
· To delete a group select it from the Group list and click on
.
Please note: the group is deleted immediately - you will not be
p
rompted to confirm this! You should therefore only use these
functions if you are sure that you wish to delete a group.
72

78
3.5.6 Add manufacturer
· Click on Add manufacturer to create a new manufacturer.
· Enter the manufacturer's data in the appropriate input fields and click on Next.
· Check your input in the window that subsequently appears. If the input is correct
click Add to save the manufacturer in the bearing database or click Back to
modify your input as required.
3.5.7 Edit / delete manufacturer
Edit manufacturer
· Click on Edit manufacturer to modify the data for one manufacturer.

79
Trendline 3
· Change the manufacturer data and click on Next.
· In the next window the Trendline shows your changes and the original data for
an easy compare. Click on Save to stored your changes in the bearing database
or click on Back to change your data.
Delete manufacturer
When you have deleted all bearings from a manufacturer from the database (see
Edit/delete bearings
), you can also remove the manufacturer.
· Click Delete manufacturer.
· Then select the manufacture from the Manufacturer list and click Continue.
The manufacturer is then deleted from the bearing database.
You can only delete manufacturers which have been added by
yourself!
72
78

80
3.5.8 Select a different bearing database
· Click on Change bearing DB.
· Select Use connection string and click Connect.
· Click on Microsoft OLE DB Provider for SQL Server then click Next.

81
Trendline 3
· Select the database server that contains the bearing database from the server
list or enter the server in the input field in the upper area of the window. Click on
Refresh to update the list of available servers.
If you do not find any entries in the server list due to restricted user
p
ermissions, enter "Computer name\FIS_DATABASE" manually (if
the name of your computer, for example, is "peters_laptop", the
server name would be "peters_laptop\FIS_DATABASE"). You can
find your computer's name in the Windows Explorer drives. If you
are not sure about your computer's name, ask your administrator.
· Select Use a specific user name and password and enter your user name
and password to log-on to the bearing database. If you select a database server
that was installed during a Trendline installation (contains FIS_DATABASE in its
name), the user name is sa and the password is sql8. Enable Allow Password
Save to save the password.
· Select a Bearing DB from the list.
· Click on OK then also click OK in the Change database window.
The modified bearing database is now available for use.

82
For the database server installed with Trendline the user name is
"sa" and the password is "sql8".
3.6 Create a route
After the system structure has been entered into a configuration (or several
configurations just as well), there is the option to group parts of those
configurations into routs using the function route. For example, one could create a
route for each day of the week and measure certain machines only on Monday. A
route for a certain mechanic, who maintains some machines of a configuration
only, would be feasible just as well.
Should you want to take measurements at a measuring point not contained in the
current route, you can take a free measurement with the Detector for that. To
define the settings for that, at least one template must have been created
before. In this template you can set exactly the same properties as in an ordinary
measuring point like characteristic values, sensor type, time signals, etc.
3.6.1 Create a new route
Open the window for the route planning under Planning > Route. A new window
will open up, which is subdivided into three parts. On the left, you will find the
configuration tree, in the middle the routes and on the right-hand side, same as in
the configuration display, the settings. To create a new route, follow the sequence
below:
1. Right-click the middle window and subsequently on Add Route. Alternatively you
can click on
just as well.
2. Name the route in the right window and add a picture, if desired (for that, click
on
).
3. Now, you can add elements from the configuration to the route. You can do that
in two different ways:
a) Left-click the element you want to add to the route in the configuration tree.
Subsequently, left-click the route you want to change in the middle window.
Finally, right-click the middle window and then left-click Add Selection.
b) Left-click on the part of the configuration tree you wish to add. Keep the left
mouse button pressed and drag the element onto the name of the route.
Release the mouse button.
4. Repeat this procedure for all routes you want to create, e.g. for Monday to
Friday.
Use the button
to print a route report to get an overview over the created
routes. The following window is opened:
83

83
Trendline 3
In this window you must select the route you want to print in the route report.
In this window you can select the route you want to display in the report.
3.6.2 Create template
A template is a pattern for free measurements, i.e. measurements which are not
in the current route.
You can send up to five templates for free CM measurements,
balancing templates, and run up / coast down tests in a route.
A template has the same layout as a measuring point. As with a measuring point,
time signals can be recorded and different characteristic values set. If you want to
associate a free measurement with a certain measuring point, the template for this
measurement must have the same layout as the respective measuring point. That
means, the same characteristic values (with the same cut-off frequencies) must be
set and the sensor must correspond as well. Time signals and alarm thresholds
may differ, as the characteristic values can be compared none-the-less.
· To create a new template, click in the Planning-menu on Template.

84
· Click on to add a new template group.
· Under Name you can name the group, under Picture you can include a picture
with
.
- With
you create a new template. Here just as well, you can change the
name (under Info) and insert a picture. Once you have created five templates
into a group, you cannot add any more into this group. On the page
Configuration you can set the sensor type and the time signals desired.
- With
you add new characteristic values to the template. More information
to that you will find in "Set up characteristic values
".
· In order to add a new balancing configuration to the template group click on
For more information refer to Add balancing configuration ..
· In order to add a new run up / coast down configuration to the template group
click on
For further details see "Setting up run up/coast down ".
· With
you can delete the element selected from the list.
· With
and with you can unfold the tree starting from the element
selected or close again respectively.
3.6.3 Send route
There are two ways to send a route to the detector:
· Click on Detector > Send Route (or on
) in the configuration window.
50
53
61

85
Trendline 3
· Select the route you want to send to the Detector.
· If you check the checkbox Send Template, you can select one of the previously
defined template groups.
· Connect the Detector with the data cable to your PC and switch it on.
· Click OK to send the route to the Detector.
Another way of sending a route to the Detector is directly from route planning (
Planning > Route). Click on
. The Send route window opens. Then proceed
exactly as described above.
If the "Always save" option is marked for a greater number of
measurement points in the route you wish to send to the Detector
than are permitted in the Detector memory an error message will be
output and the data will not be transferred. Also refer to System
messages and their meaning
.
3.7 Download data from Detector
After measuring with the Detector you have to transfer the data to Trendline 3
software. Connect the Detector with the data cable to your PC and switch it on.
Click on Detector > Load data from Detector or on
. Now, all data, that is
configurations, time signals and free measurements, are downloaded onto the PC.
This process can take several minutes depending on the amount of data.
Once all data have been received, they are stored at the respective locations in
the database. It can happen that the program does not automatically sort the
measuring points, e.g. you have taken free measurements or the configuration on
the Detector had been created on a different PC. In this case, the sorting wizard
will be started automatically for sorting the measurements into your
configuration tree.
205
86

86
3.7.1 Sorting Wizard
When you start the sorting wizard, Trendline displays an information window
showing you why the data cannot be sorted in.
· Click Next to continue sorting in the data.
The next window is subdivided into two parts. On the left-hand side you will find the
measuring points not yet sorted, on the right-hand side your configuration
structure. Now, there are two possibilities.
· When a measuring point, which isn't sorted in yet, exists in one of the
configurations already, you drag it with the left mouse button from the left
window on the measuring point in the configuration. If the two really do match,
the mouse cursor changes. You can release the mouse button to insert the
measurement. In the status bar you can read why it was not possible to insert at
a certain point.

87
Trendline 3
· Alternatively, you can use the suggestions of the Trendline software. For this,
click on Wizard and select a measuring point from the list of proposals.
If the measuring point does not exist in the configuration yet, you again have two
possibilities.
· If you want to add a measuring point to a machine, drag it into the right-hand
window onto the machine name it is supposed to be added to.
· Additionally, you can add new configurations, sections and machines with the
and buttons as you did, when creating the configuration. For this, see

88
also "Enter system structure ".
3.8 Viewing measuring data
3.8.1 Measured values
In the register Measured values the selected measured values are displayed in a
table. When a row is printed in bold, then at least one time signal for this
measurement is stored. The time, the measured values determined and any prealarms or alarms that may have been output are displayed for each measurement
in the measured values view.
Limit time range
· In order to limit the time range of the measured values displayed, select the
Time range option.
· Set the desired start and end date.
Changing acquired speed and comment
You can also correct rotational speeds in the Measured value view and edit the
measured values comment: Proceed as follows:
· Click on an entry in the list of measured values.
· Click Change speed and comment.
42

89
Trendline 3
· Enter the new values and click OK.
Displaying measured values in the Viewer
You can display one or multiple measured values in the FIS-Viewer
.
· Double-click on a measurement to view it in the Viewer.
· To view multiple measured values, click the desired measured values while
holding the CTRL key.
· Then double-click one of the selected measurements while holding the SHIFT
key.
Show/hide bearing data
Click the Display bearing data for selected measurement button to display a list
of bearings assigned to this measuring point in the configuration
. You can also
assign bearings to measurements or delete assignments here. The activation
status of a bearing is indicated by the disabled checkbox. Both when making
assignments and disabling you can choose whether
· bearing data should apply or not for all measurements already performed, or
· only for measurements from a certain period
Add bearing
· Click
and select the bearing from the bearing database.
114
45

90
· Selecting measurements:
o If you want to apply the bearing information to all saved measurements, click
Add this bearing to all existing measurements of this measuring point.
o To apply the bearing information to measurements in a certain time range,
click Add this bearing to all measurements of following timerange and
select the time range.
· In the Bearing configuration section enter the speed transmission ratio and
select whether the bearing has a fixed outer race.
Disable bearing
· Click on the bearing to delete and then
.
· Selecting measurements:
o To delete the bearing information from all saved measurements of this
measuring point, click Disable the bearing for all existing measurements
of this measuring point.
o To delete the bearing information from measurements in a certain time range,
click Deactivate bearing for all measurements of following time range
and select the time range.
Displaying bearing information
· Click on the desired bearing and then
. This displays the bearing information
in the bearing database.

91
Trendline 3
See also
Evaluating measured data with the FIS-Viewer
3.8.2 Graphic
On the Diagram tab, Trendline depicts the measured readings in a trend diagram
with the aid of the integrated FIS-Viewer
. The viewer provides a visual
representation of the signals and characteristic values delivered by the Detector:
· Time signals
· Fast Fourier Transformations (FFTs)
· Trend data
Time range
Click on Time range to limit the shown data to a defined period and enter Start
date and End date.
Alternatively you can select an End date and enter the Number of days. In this
case, the Trendline sets the Start date automatically.
114
114

92
Fullscreen
Click on Fullscreen to view this graphic in the size of your monitor
Show additional bearing
Click Show additional bearing to select a bearing from the bearing database
and display its frequencies in a trend diagram.
Toolbar
Click Toolbar to show/hide Viewer toolbar. For further information, please refer to
the description of the FIS-Viewer in the "Toolbar
" section.
Time signal, FFT signal
When in a trend diagram a certain value is surrounded by a small circle, then there
is at least one time signal for this measurement. You can view this time signal by
marking the value with the cursor and then clicking on Time signal/FFT. When
there is no time signal for the selected value, then this symbol is grey and cannot
be selected.
Print time signal, print FFT signal
Click these buttons to include the respective signal in the trend report (cf.
"Printing").
Print
Click Print to create a trend report. The trend report combines the diagrams of the
selected measured data for printing. Each diagram is printed on a separate page.
More detailed information on the viewer can be found here .
3.9 Reset Alarm Status
In the system structure for each element the Trendline software displays whether
an alarm or pre-alarm was measured (also see Main window
). It may be
sensible to reset this alarm status if the cause of an alarm has been identified and
eliminated. The alarm status must be reset manually by the user as this decision
cannot be made by the Trendline software.
· To reset the alarm status for a configurations element (e.g. machine or motor)
and the associated sub-elements, click on the element in the system tree.
· Then click System > Alarm Status Reset.
68
115
114
30

93
Trendline 3
Only the status display in the system structure is affected when the
alarm status is reset. The measuring data
status displays
remain unaffected.
3.10 Delete measured data
You can delete measured data in a set time range in the database. Doing this, the
characteristic values (i.e. trend data) and the time signals recorded during that
period of time are deleted. To delete data follow the sequence below:
· Left-click the element in the configuration tree, starting from which you want to
delete the data. E.g. select one machine. All data relating to the measuring
points of this machine are deleted for the selected time range.
· Click on System > Delete measured data or right-click on this point and select
delete measured data.
Opens the Delete measured data:
· Select the date and time for the start and for the end of the required period.
· Click on Period to deactivate the option and delete all data.
88

94
· Click on OK to delete the data in the period selected.
Please observe that the data will be permanently deleted if you click
"OK" in the above window and cannot be restored! There is no way
of restoring the data!
3.11 EService
The Trendline software enables you now for the first time to utilize the services of
FAG Industrial Services GmbH easily and conveniently. Regardless of whether we
can assist you with the selection of measuring points or the analysis of the
vibration signals recorded by you, the EServices function allows you to send all
data necessary to FAG Industrial Services GmbH by e-mail.
3.11.1 Before starting
These services are economical, but will be charged for. You will find detailed
information on our website http://www.fis-services.de. Or just contact our sales
department (Tel. +49-(0)2407-9149-99 or sales@fis-services.de). If you have a
valid service contract, you can enter the contract number in the Options menu (
Extras > Options > E-mail). The contract number together with your e-mail
address are needed for identification.
3.11.2 Send data
· Select the element on the configuration tree, starting from which you would like
to send the data. Now, click on
or on Service > EService. Now, the
following window opens.

95
Trendline 3
At the top of the window you can select the time range, which you want to send the
data for. If you have unchecked the Time range checkbox all previous data will be
sent.
Enter at Data to be exported, which data shall be transferred. If no data can be
sent via this selection anymore, i.e. if you want to send alarms only, but no alarms
are in the selection, the OK button will be disabled.
· Click on OK now to send the data. Depending on your e-mail settings the data
are transferred immediately or they are copied into an Outlook mail, which you
will have to send manually.
3.12 Create reports
The Trendline software offers the following report types:
· The measurement report
provides a comprehensive overview of the
measured values for the sensors defined in the configuration in tabular and
graphic form.
· You can use the alarm report
to create an overview of preliminary and main
alarms that have accumulated to date for freely selectable elements in your
configuration.
· The route report
presents all measuring points and corresponding
measurement signals for a given route in the form of checklists. You can
systematically and reliably "work through" the measuring point of a route with
the aid of the route report.
· The balancing report
provides you with a clear overview of balancing
measurements carried out for one element of your configuration.
· The run up/coast down report
creates an overview of the run up/coast down
configuration settings and the associated amplitude/phase diagrams.
96
100
102
102
104

96
A
lso see report options .
3.12.1 Measurement report
To create a measuring report click on Measurement report in the Service menu.
The Configure the report window opens.
You can carry out the following in this window:
· Select which measuring points from the configuration should be displayed;
· Specify the scope and content of the report;
· Save the report configuration or load a previously saved configuration.
Select measuring points
Trendline displays all available measuring point configurations in the left-hand area
of the configuration window.
111

97
Trendline 3
· Select individual measuring points to display the corresponding measured
values in the report.
· Click on
to select all measuring points.
· Click on
to delete the selection.
Scope and content
You can specify the settings for the scope and content of the measuring report in
the right-hand area of the configuration window:
Specifying a report time range
· Select the Time range option to define the limits for the report period.
· Enter the start and end time. Alternatively, you can enter the end time and
specify the duration in whole days in the No. of days input field. In the latter
case the start time is automatically determined.
Alarm selection
Pre-alarms and main alarms can be presented either separately or jointly in the
report.
· Click on Report all to select all alarms or, to select individual alarm types, click
on Report alarms or Report pre-alarms.
Select characteristic values
· Select which characteristic values should be displayed from the Char. values
area.

98
· Click on Show trends to create a trend graphic that presents the measured
values for the period specified.
· Click on Selected to display only a selection of available characteristic values
and select the required characteristic values from the list.
· You can use the Show table of results option to instruct Trendline to create a
table containing the measured values.
Select time signal / FFT
In the Time signal / FFT area you can specify which time signals are output and
also whether their corresponding frequencies should be displayed in the report.
· Click on Time signal or FFT to activate the corresponding display.
· Click on Selected to display only a selection of available signals and select the
required signals from the list.
· Click on Last time signal / FFT only to output only the last signals saved in
each case. All previous measurements will be ignored.

99
Trendline 3
Display additional information
The following options can be selected in the Additional information area:
· Show measuring point pictures to include the pictures inserted in the
measuring point configuration
;
· Show measuring point comments to include the comments entered in the
measuring point configuration
;
· Show cover sheet to output a cover sheet.
Save / load report settings
You can save the report settings for use at a later date.
· To do this click on the diskette symbol. The Insert configuration name window
opens.
· Enter the name of the configuration to be saved in the Configuration name
input field. If this name already exists you can either overwrite the existing
configuration or cancel the procedure.
Create report
Click on Preview to generate the report. Trendline outputs a warning if your
chosen settings will cause a substantial report to be generated accompanied by a
time-consuming calculation.
45
45

100
You still have the option of canceling the operation at this stage in order to reduce
the report period or the quantity of data that will be output.
You can view the measuring report on-screen or print it out via the Measuring
report window. You can use the toolbar to control the screen display:
· The display size can be defined in View. Select Percentage adjustment to
enter a zoom factor expressed as a percentage in the Percentage input field.
· You can navigate forwards or backwards through the report and also jump to the
start or end of the report using the arrow buttons.
· Click on
to print out the report.
3.12.2 Alarm Report
You have the option of displaying main alarms and pre-alarms in an alarm report
using the Trendline software.
 Loading...