

Page 1

Oscilloscope
Digital Storage Oscilloscope
Operation Manual
Page 2

05-
30200/400/600
Digital
Operation
Storage
Manual
0· , · ' • . • ' " , . . , ' • • " .,
11" ' . ., .' • • • • ", . ' . ' • • ,.'•••• , . , .'."
Oscilloscope
•
fi\
V
~
()
!Q)l
----
;::..
:;:;;;.
......
:;::::.~
:;:;:.
......
=.J
@
ez
Digital Co.,Ltd.
Page 3
ac
cording
DE
CLARATIO
to ISO
N OF CONFORMITY
/lE
e
Guid
e 22
and
EN
45014
Manufacturer's
Manufacturer's Addres
Declares that the product :
Product Name :
Model Number
Date:
Conforms to the following product specifications :
Safety:
Name:
s:
s:
EZ Digital Co..
222-28. Nae
Bu
che
on-s i, Gy
R.O.K, 421 -160
OSC
ILLOSCO
05
-30200,
Aug.
18. 1995.
Certified by
EN 61010-1: 1993
(l EC 1010-1: 1990+
-dong,
05
TUV
Ltd.
Ojeong-gu.
ecnggi-do
PE
-30400,05-306
Rhein lan d
A1:1
992, modified )
00 ,
EMC :
Supplementary Information :
The
productherewith
Directive 73
Bucheo n, Gyeonggi
/23
Location
/EEC
complies with t he requ
and
the
EN 50081- 1: 1992
EN 50082- 1: 1992
ireme
EMC Direct ive 89
nts of the Low Volta ge
/336/EEC
Quality As
.
C.
)'
.
Chea l Young Kim
suranceManager
/LU'J?
.
Page 4

Safety Summary
Safety Precautions
Please take a moment to review these safety precautions. They are
provided for your protection and to prevent damage to the osc
illoscope
This safety information applies to all operator and service personnel.
Cauti on and warning statements .
CAUTION Is used to indicate correct operating or maintenance
in order to prevent damage to or destruction
pme
nt or other prop
in order to prevent personal injury.
ert
y.
WA
RNING
procedures
of the equi
Ca
lls
attention to a potential danger that reqwres correct
procedures or practices
.
Symbols
Cautionjrefer to accompanying documents) and Warning,
Protective ground(earth) symbol.
Page 5

Introduction
Thank you for
by EZ Digital
We guarantee their exceptional precision and
the product please read thi s user
Note
pur
chasi ng a EZ product. Ele
ar
e high technology products
manual
carefully.
ctr
onic measurin g instrume
mad
e und erstrict qu
utmo
st reliability. For proper use of
~
EZ
Digital
alit
nts
produ ced
y control.
CO.
.Lt
d,
I. To fully maintain the precision and reliability of the product use it within the range
of
sta
nda rd
2. After turning on-power. please allow a pre-heating period of as long as some 15 minutes
before use.
:J
.
Thi
s equip
4. For quality imp rovem ent the exterior
changed without prior notice.
5.Ifyou have further questions concerning usc. please co
center or sales outlet.
set
ting
(tempe
ment
should be used with a triple line power cord for safety.
rat
ure W'C - 35·C. hu
design and specifications of the product can be
midit
y 45%
nta
-8
5%) .
ct the EZ Digital service
Page 6

Warranty
Warranty service covers a period of one year from the
dat
e of original
purchase.
In case of technical failure within a year, r
epair
service will be
provided by our service center or sales outlet freeofcharge.
We charge customers for repairs after the one-year warranty period has
been expired. Provided that against any failure resulted from the user's
negligence, na tural disaster or accident, we cha rge you for repai rs
arr
regardless of the w
For more professio nal repair service, be sure to contact our service
center or sales outlet.
anty period.
Page 7
- CO
NTENTS
-
l.
Descriptio ns
of
the
prod
uct
\-1. Introduction
1-2. Specifications
1-3. P
oint
s to bc chec ked prior to usc
1-4. Accessories
2.
Op
eratin
g in
stru
ctions
Fun
2-1.
2-1-1.
2-1-2.
2-1-3.
2-1-4. R
2-1-5.
2-1-6.
ction of eac h block
Display and power blocks
Vertical amplifier block
Sweep and
ead
trigger blocks
out
Storage block
Miscellaneous
feature
2-2. Basic func tions and measurement
·
·····
·····
II
I I
13
17
18
14
21
21
21
23
26
27
28
29
2-2-1.
Con
nectionofmeasuring signals
2-2-2. Adj ustment during initial operation
2-2-3. Data display
( I)
Real time m
(2)
Storage mode display
ode
display
2-2-4. Real time mode measurem ent
(()
Single-trace measurement
(2)
Dua
l-trace measurement
(3)
Trigger selection
24
30
33
33
35
38
38
.~<)
-I
I
Page 8
(4) Addition
and
difference measurement
44
(5) X-Y measurement ··
(6) Delayed-time axis operation
2-2-5. Digital storage mode function
(
I)
Normal
(2) Equivalent sampling mode
(3) Roll
(4) Single mode
(5)
Hold mode
(6) Save mode
(7) Save memory display (RECALL)
(8)
X-Y plot output
(9) Hori
( 10) Interpolation
( I I ) ALT
( 12) GO
(13) Menu mode
(14) X - Y measurement
storage mode ( MO
mod
e
zont
al magnification display
MA
G .
-NOGO
·
DE)
45
46
49
·
49
49
51
52
53
53
53
54
54
57
58
59
59
65
2-3. Measurement applications .
2-3-1. Ampl itude mea
2-3-2. Ti me interval mea
2-3-3. Frequency measurements .
2-3-4. Phase difference mea
2-3-5. Rise time measuremen t
sur
ements
sur
emen
sur
ts
ements
66
66
70
72
73
77
Page 9
3.
X-Y
digital
output
RO
Application X-Y
3-1.
Plotter specification
3-2.
Connection
3·3.
Setting
3-4.
3-5.
Operation
3-6.
RS-232C interface
3-7. Major troub le,
4.
Serial
com m u
4-1. Introduction
4-2. Specification
Connector
4-3.
4-4. C
4-5.
4-6.
onne
ction
Operation
Transmission
plott
er
nication
pin
using RS-232C
arrangement
andcommand
/reception
dat
a format
and
signal descripti
on
.··· · 90
..···· 9\
.......
80
80
R5
85
90
90
91
91
. 91
93
94
96
chara
4-7. Separating
Abn
4-8.
ormal operation
cter
handling
4-9. RS-232C interface cable connection
4-10.
Generation
4-11. Key cause
Program
4-12.
of d
ata
of
abn
examples
tran
smission/reception program
ormal
data tr
ansmission
and
instrument operation .... 102
/reception
....
···1
102
102
\0 2
0:1
\0:1
Page 10

5.
Use
r maintenance
5-1.
Cle
anin
g
5-2.
Calibr
ati
OS-
3IXX)
6.
DSRS diugrum
6-1. External views
on
guide
-,
J J I
J
II
J I I
J 12
J 12
6-2. Block diagram
II
.'
Page 11
1.
Description
J. Introduction
1-
This
product OS-3000DSRS is the 2 c
of
produc
which is equipped with
It
combines
commu
the wide
the benefitsofdigital scope to measu re, store, interpret and
nicate the rapid trace, with the benefits of analog scope to meas ure
band
width, 2 time axis generator, delay sweep and separated TV
trigger signal.
It
reduces the mea
rna
l fl
our
esc
inte
ent
observed waveform.
(l)
High speed optical frequency band width
ND
converter installed on each c
the max. rate of 20MHz samples/sec. Any signal with perfect
edn
rcpcat
Thi
ess can be stored. (Max. 20-60 MHz)
s product can be used as
frequen cy range between 20
(2) Large storage capacity
channel
Each
composed of
trace with high accuracy.
t
han
nel digital storage oscillosco pe
ND
converter.
sur
ement error,
and'
uses 6% squared type CRT with
scale which enables to take the
hannel
an
ordinary real time oscilloscope with
and
60MHz.
samples the
has 2kW memory. Sinceitcan
IkW
data
, it measures any rapidly
phot
ograph of
input
signal at
indicate the waveform
cha
nging transition
(3)
Wav
eform save
It
has 1kW memory to save two waveforms stored in each cha nne l.
(4) Multi-Function
It
has a variety
of
following functions to interp ret a wide range
signa ls :
- Roll
mode
function to mea
sur
e low signal.
- Average functio n to elimina te noise from the signal and to mea
the pure signal.
II
of
sur
e
Page 12
(5)
Output
It
uses bot h RS-232C interface function to input/
data
to th e personal com puter,
thro ugh digital plotter.
data
.
CRT
(6)
an d cursor readout
It can pro mptly perform the
CRT r
cur
difference
cursors.
ead
sorread
out function to display the set information of
out f
unction
(8 T) and frequency difference(l/8T)between two
output
and
RS-232C to
It also interprets and reco rds the stored
operation
and
meas
cond
ure
the digital
uct screen h
ment
using
pan
el andthe
bot
to display the voltage difference (8 V). time
ard
h the
copy
12
Page 13
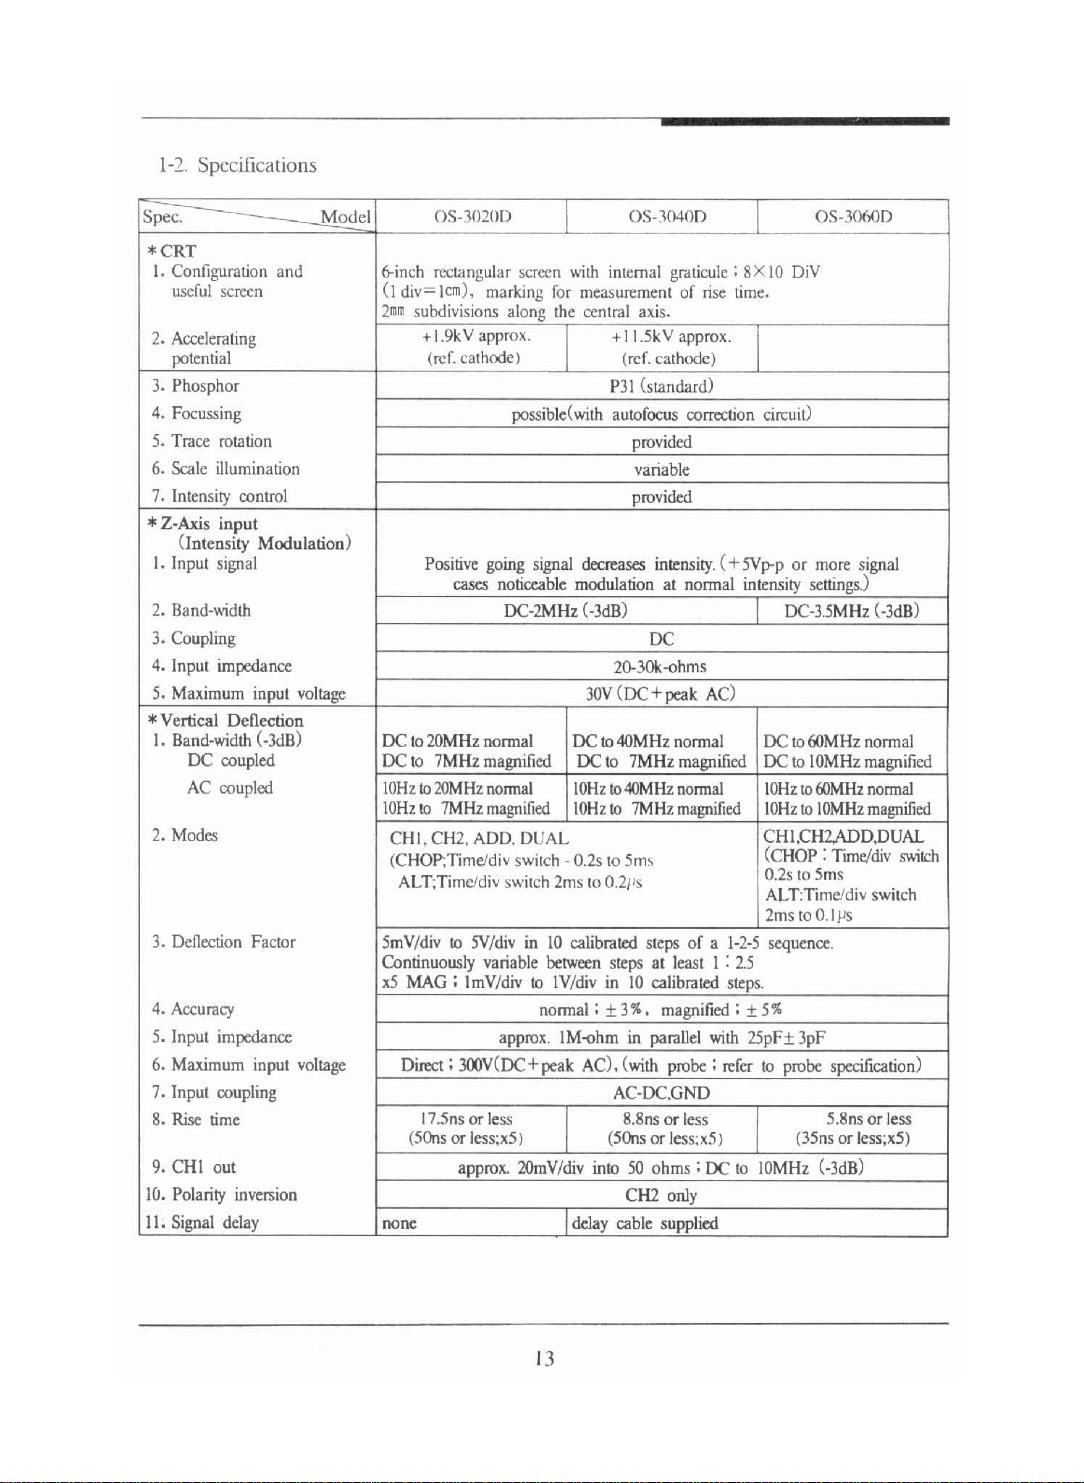
1-2.
Spec
ificatio
Spec.
-CRT
1. Con
figuration and
screen
useful
2. Accel
eratin
g
potential
J. Phosphor
4. Focussing
5.
Tracerotati
6.
Scaleillumin
7. Intensity
-
Z-Axis
on
control
input
(Intensity Modulation)
I. Input signal
2. Band
-wi
dth DC-2MHz(-3dB)
3. Coupling
4. Input
5. M
*
I.
impedance
aximuminput
Vertical
Band-width
DC
coupled
Deflection
(-3dB)
AC coupled
2. Modes
3. Deflection Factor
4. A
ccura
cy
5. Input i
6.
7.
mpe
Maximum
Input
couplin
dance
input
8. Rise time
9. CHI out
10.
11.
Polarity
Signal
inversion
delay
ation
g
ns
Model
voltage
voltage
OS-J0
201l
6-inch
rec
(1div= [
2mmsubdivisions along the cent
tangular
em
+1.9kV approx.
(ref. cathode)
screen
), marking for mea
po
ssible
twith
OS-J04
00
with internal graticulc ; Sx 10 DiV
surem
ent ofrise time.
ral
axis.
+11.5kV
PJI
autofocus
approx
(ref. cathode)
(standard)
correc
.
tion
circuit)
OS-
provided
variabl
e
provided
Positive
going
signal
casesnoticea
decreases
inte
ble modulation at
nsity.( +
normal
5Vp-p
intensity
DC-3
or m
ore
senings.)
.5MHz(-3dB)
DC
2a-3Ok-o
30Y
(DC+
DCto20MHz
DCto 7MHz
10H
zto
20MHz
10Hz107MHz
normal
magnified
normal
magnified
DCto
40MH
DCto 7MHzmagn
10Hzto40
10Hzto7MHz
CHI. CH2.ADD. DUAL
(CHOP;TImeJdivswitch -0.25to 5m
ALT
;Tim
cJdi
v switch2ms10 O.21
SmY/div to SV/div in 10
Continuously
xS MAG;
variablebetween
ImVldivtoIVidivinIOcalibrated
approx.
Direct;3OOV
(DC+peak AC), (with probe;
calibrated
steps at least I : 2.5
normal
; + 3%. magnified; + 5%
IM-<>hminparallel
AC
17.5n
sorle
ss
hms
peak
AC)
zno
rmal
MHznormal
magnified
<,
1s
steps of a
DCto60MHz
ifi
ed DCtoIOMHz
10Hz
1060MHz
10Hz10IO
H2,ADD.DUAL
CHI.C
(CHOP:
0.25to 5ms
ALT:Tim
2mstoO.I
1-2-5
sequence.
MHz
Tune/div
cJdiv
I'S
steps.
with
2SpF+ 3pF
refe
r to
probespeci
-DC.GND
8.8nsor less 5.8nsor less
(sOnsor less;x5) (sOnsor less;,5 ) (35nsorless;x5)
approx.
20mY
/div
into
50 ohms ; DC to
CH2
only
none delay cable supplied
IOM
Hz (-3dB)
JOWO
signal
normal
magnifie
normal
magnified
switch
fication)
d
switch
13
Page 14
.-
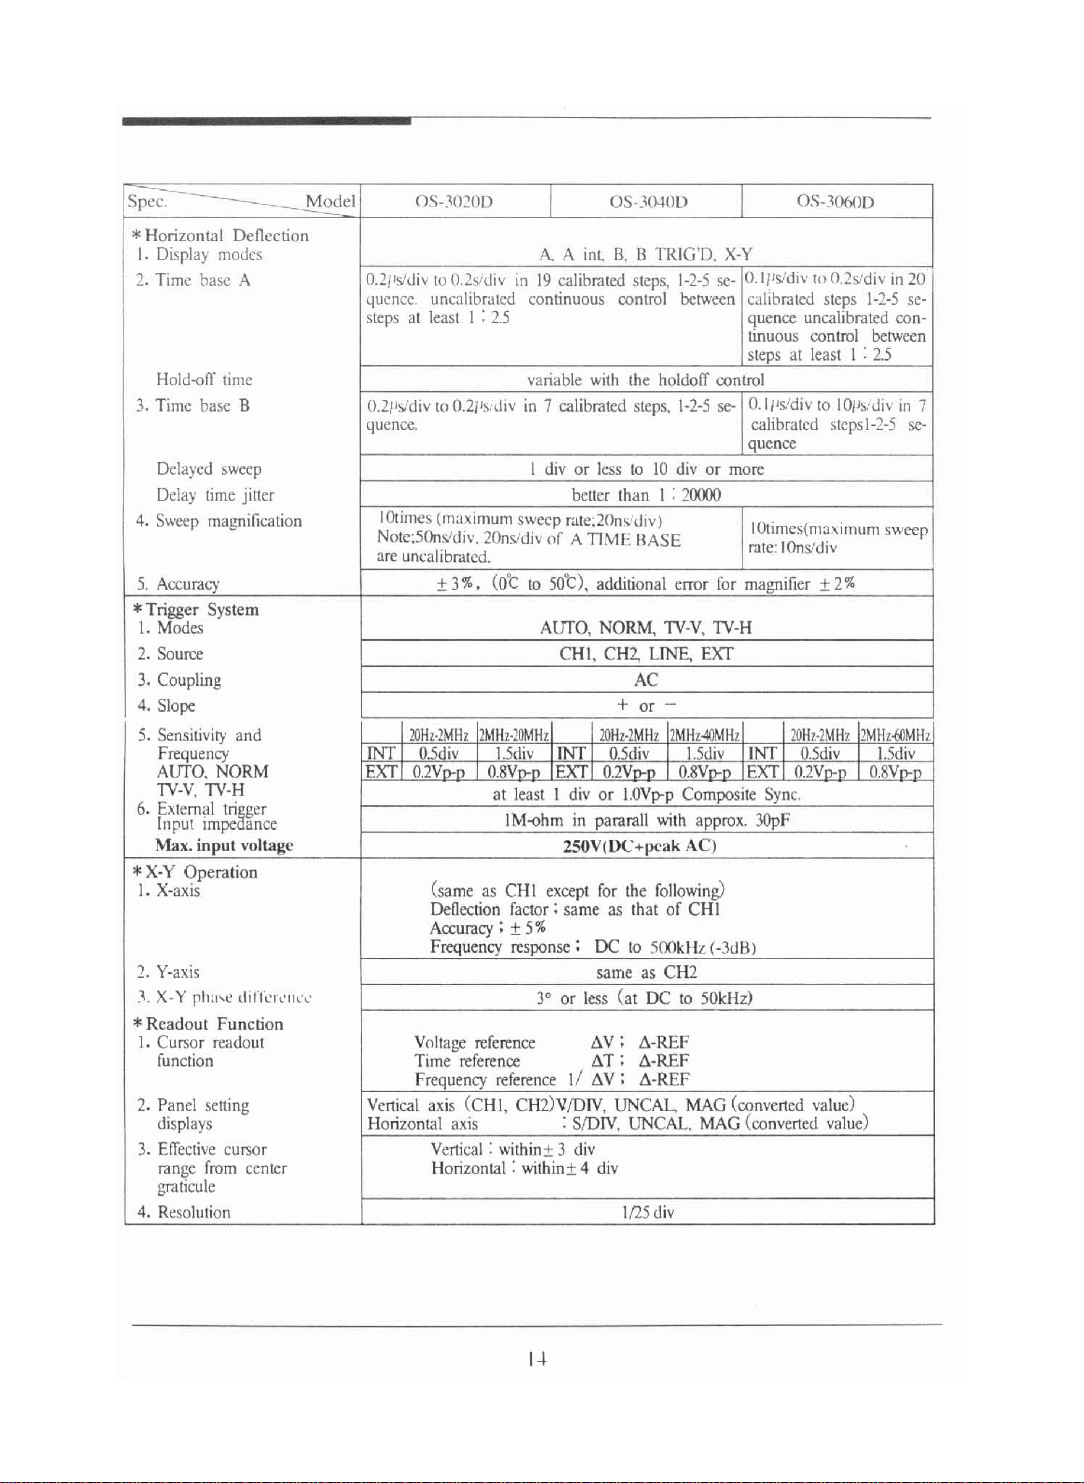
Spec.
--------
______
Model
OS-.'020D
OS-.'O·jOD
*Horizontal Deflection
I.
Display modes
2.
Time
base
A
Hold-off time va
3. Time base B
Delayed s
Delay
4. Sweep magnif
5. Accuracy
*
Trigge
I. Modes AlITO. NORM. lV-V.
2. So
3. Coupling AC
4. Slope
5.
Sensitivity
F
AlITO. NORM
lV
6. External triag"
Input Impe ance
wee
p I div or less to 10 div or more
tim
e ji
tte
r
ication
r System
urce
and
requ
ency !NT
-V. lV-H
Jiv
O.2i
qucncc. uncalibrutcd continuous control
s
teps
Ool/
qucnec. calib
EXT
10
O.2sid
'sh
at least 1 : 2.5
Js/
div to O.2/ls.div in 7 ca
IOtimes (maximum sweep
NOle;50ns/div, lOns/divof A
areuncalibrutcd.
+ 3%.
2OHz·1MHzlMHz
U.S
div l.Sdiv INT
O.2Vo-o
Max. input voltage 250V(LlC+p
*X
·y
l.
X·'
3Xi
~
.
Y axis
.~.
X·Y phu-,e
Operation
s
dittcrcuc...
·
(same as CHI
Defl
ecti
Accuracy; ±5%
Freq
uency response ;
*Readout Function
I. Cursor r
2.
3.
4. Resolution
eadou
f
unction
Panel
splay
di
Effec
tivecursor
range
graticule
t Voltage
sett
ing
s Horizontal axis : SfDlV. UNCAL. MAG (convened value)
fromcenter
Vertical axis (CHI. CH2)VfDlV. UNCAL. MAG (convened value)
refere
Timerefere
Freque
ncy
V
ert
ical : withinf 3 div
Horizontal
A, A
int, B. B TRIGD. X-V
iv in 19 calibrated steps, 1
ria
ble
with
the
holdolT
(ot
be
r..Ll
10 50t ).
CHI, CHl,
libratedste
tte
c;20n\-idiv)
TI~
ps.1-2-5 se-
r than I : 2
lE
BASE
additi
onal e
LINE.
+ or
·1O
MHz
O.8Vo-o
at least I div or
fMo hm in pararall with approx. 30pF
on factor: same as that of CHI
3" or less (at DC to 50kHz)
nce
nce
refe
ren
:
with
2OHz·1MHz2MHz-40MHz
O.5div
O.2
EXT
except for the following)
ce
inf 4 div
Vo-o O.8Vo-o
l.O
Vp-p
cak
DC to 500kllZ(-3dlll
same as CH2
~V;
~-REF
~T;
~V;
~·R
~
-REF
1(25div
II
0.1
-2-5
sc-
bcrwcc
cal
n
quence uncalibrated con-
tinuous con
steps at least 1:
control
0.1}Js.'di
quence
(xx}()
l
Otirncstr
rate; I
rro
r for
magn
lV
-H
EXT
1.5div
INT
EXT
Composite Sync.
AC)
E F
OS-
P~/
di
v 10
ibra
ted
v toIOIJs
rated
nacimurn sweepI
On
s/div
ifier
2O
Hz·1MHz
Il.Sd
O.2Vo-o
.'060D
O.2s-'
uiv in 20
steps
1-2-5
trolbetween
2.5
h.l
s
tcps
t-z
+ 2%
lMll
iv
l.Sdiv
O.8
sc-
iv in 7
-S
sc-
z.ffi
Mliz
Vo-o
1
-1
Page 15
Spec.
Model
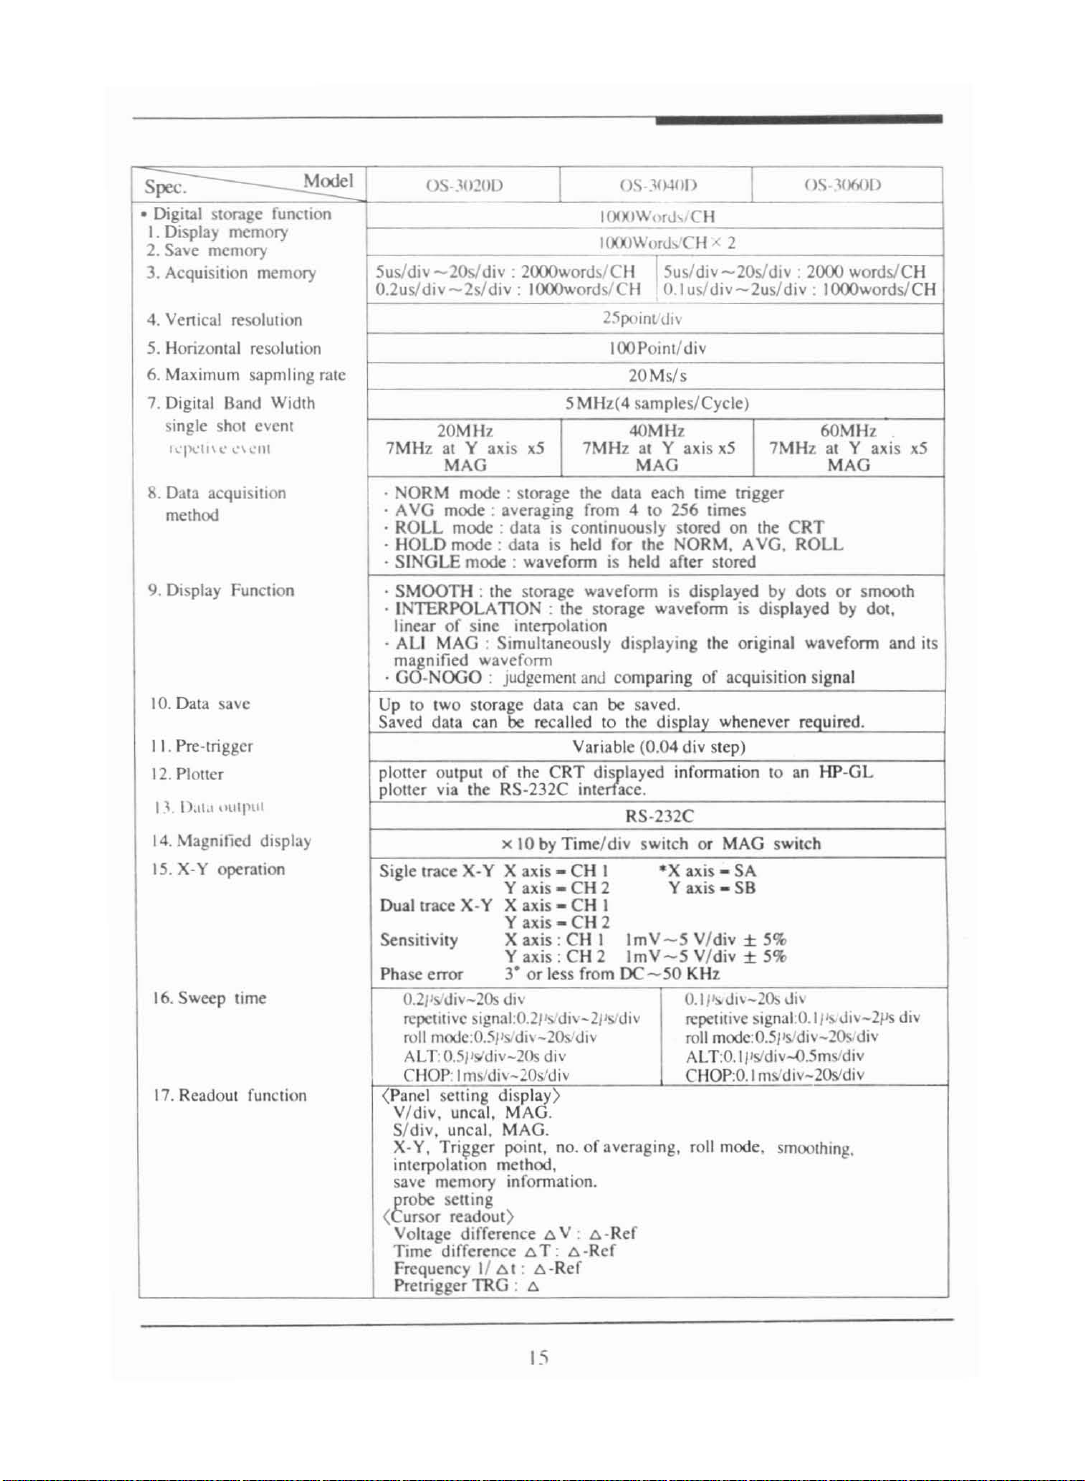
• Digital storage function
I. Display memory
2. Sav'c memory
3. Acquisition memory
4. Vertical resolut ion
5. Horizontal resol ution
6. Maximum sapmling rate
7. Digital Band Width SM
single shot event
"':
I'll..'II\ v
\,.'\
cru 7M Hz at Y axi s
Sus/div
0.2u
sld
()S-
Jll~O()
- 2
0sl
div : 2000word,ICIi !Susl div
iv- 2sl div :
IOOOw
ords/
20M II,
7MJlz
xS
OS ·.'O·I
O»
1()l)l)Wtlnh/CH
I00:IWortJ
...
elf
»:
2
-20
CIio.lu
-
2
~ poi
lOOPoint
nL
t1
i\
/div
,l div-2usl div :
20 Msl s
lIl
(4 samplesl Cycle)
4OMI17
31 Y axis x5 7MHz at Y axis
MAG MAG MAG
8. Data acqu isition · NORM mode : storage the da ta each time trigge r
mode
method
9. Display Function
· A VG
· ROL L
0LD
· 1I
NGLEmode:waveform is held after stored
· S I
·
SM
OOTI
I
l'oTERPO LAn ON : the sto rage wa
·
: averaging from 4 to 256 times
mode
: da ta is
mode
: data is he ld for'he NORM. AVG. ROLL
continuo
usly stored o n the CRT
i : the storage waveform is displayed by dots or s
vef
orm is displayed by dot.
linear of sine interpolation
MAG : Si multa neo usly dis playing the original
· ALI
magnified wavefo rm
10. Data save
I I. Pre-trigger
12. Plotter
1
,'\
"Il.
L1
.1
outp
ut
14. Magnified display
15. X-Y operation
GO·NOGO
·
Up
to IwO
Saved data can recalled
plotter output of the CRT
plotter via the RS· 232C inte ace.
Sigle trace X-Y X
Dual trace X-Y
Sensitivity
: judgement and co mparing of acqui sition signal
sto
ra~
data can be saved.
to tnc display wheneve r reauired .
Variable (0.04 div step)
d~
layed
information to an IJP
RS·232C
x \0 by Tirne/ div switch or
axis - CH 1
axis - CH 2 Y axis -
Y
X
axis - CH I
axis - CH 2
Y
axis
: C II I
X
·X
ImV-SV/div ± S%
MAG
axis - SA
S8
Y ax is : CH 2 ImV-S V/ div ± S%
16. Swee p time
Phase error 3" or less from DC
Js.
O.2I
'div- 20s div
repetitive
roll mode:O.5j
ALT:
signaLO.2Ils/di",'-2/Js/div
'S,
O.51
,'di\"-20s.'di\ roll mooe:O.5j
1~d
i
v- 20s div AI.T O.I
-SO
Kllz
0_11'- dl\-20" di_
repetitive signal:O.1jJs Ji \ - 2ps div,
,><;Idiv"().5
CIIOP:Imsldi_- 20, 'div CHOP:O.Ims'd
17. Readout function
(Panel seuing
disp
ld:
)
V/ div. uncal. MA .
Sidiv, uncal. MAG _
X-Y.
Tri~g
er
point, no. of averaging .
roll mode.
interpolation method.
mem
save
trobe
( ursor reado ut)
Voltage difference
Time
ory information .
sening
diff
erence ,0, T : t::.-Ref
6 V : o -Ref
Frequency II t::.I : 6 -Ref
Pretn gger
'm.G : 6
sldi v :
switch
'S.'di\"
iv-2
smoolhing.
(lS
-'ON) )
2000word
IOOOw
II,
6OM
wavef
orm
·GL
- 20s.'div
msldiv
0s!div
ord
.
moo
siCH
siC
xS
th
and its
H
I:;
Page 16
S
f'L"
.
*
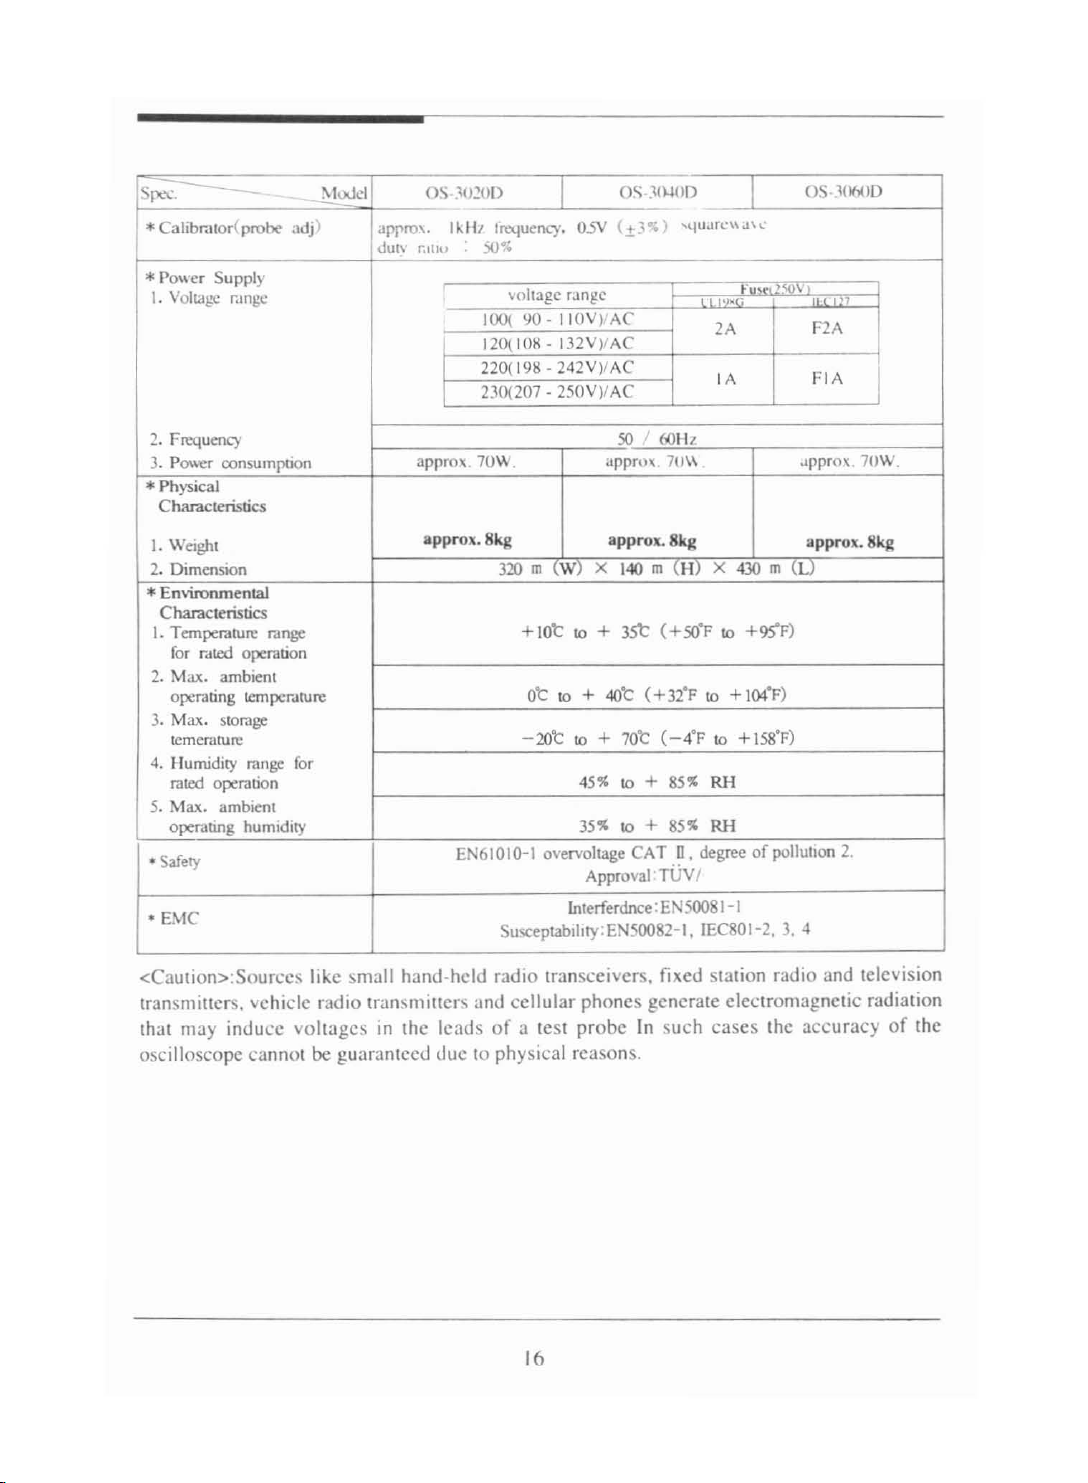
Calibrator'(
*Power Supply
I. Voltage range
probe
OS
-.10.1
(.t]%
(1)
' q U.I H.' \ \
)
2A
IA
..
;j\
F ,
()S
-
\l
uJd
~IJ
j )
approx.
Juty ral l\l
· .lO~()1>
lU I,
fn.."Ju
50%
clli.) ',
05\
'
voltage range
I()()
( 40-IIOV)
'AC"
120( IOK- I32V)/AC
220( 198
2.1(~207
. 242V)/AC
·
250V)iAC
OS·.1( 01)1)
I..'
,
'1
F2A
FIA
2. Frequency
3. Power consumption
appro, . 70 W.
50 I 1'011,
upprov . 7
11
\\ ..ppm\ . 70W .
*Physical
Characteristics
I. Weight
2. Dimension 320 m
approx. 8k
Je
W) X
approx
140 m
.8kJ;::
(10X 430 m (LJ
"Pp'O\
. Ski:
*Environm ental
Characteristics
+
45"
3st:(+5O
4Ot:(+
t:
70
+
to
3tF
(-
4'F to +ISS'F)
85"
I. Temperarure range
for rated
2.
~ta:<
.
ambient
opera
tion
operating temperature
M
a:<.
3.
4. Humidity mnge for
storage
tcmerurure
rated
operation
+ 1Ot: to +
at:to
-2Ot to +
5. Max. ambient
operating humidity
• Safety
, B tC
35"
Er\61010-1 overvoltage CAT
Approval:TOV
lnt
erf
erdnce :EN50081-1
Susceptab,hty: EN50082- 1. IEC80 1-2, 3. 4
to +
85%
IT.
cCautiono .Sourccs like small hand -held radio transceivers, fixed station radio and television
tran
smitters. vehicle radio
that may induce
voltages
tran
smitters anJ cellular phones generate electromagnetic radiation
in the leadsofa lest probe In such ca ses the accu racyofthe
oscilloscope canno t be guaranteed due to physical reasons.
+9S'F)
'F to
to + 104'F)
R11
RH
degree of poilulion 2.
I
16
Page 17
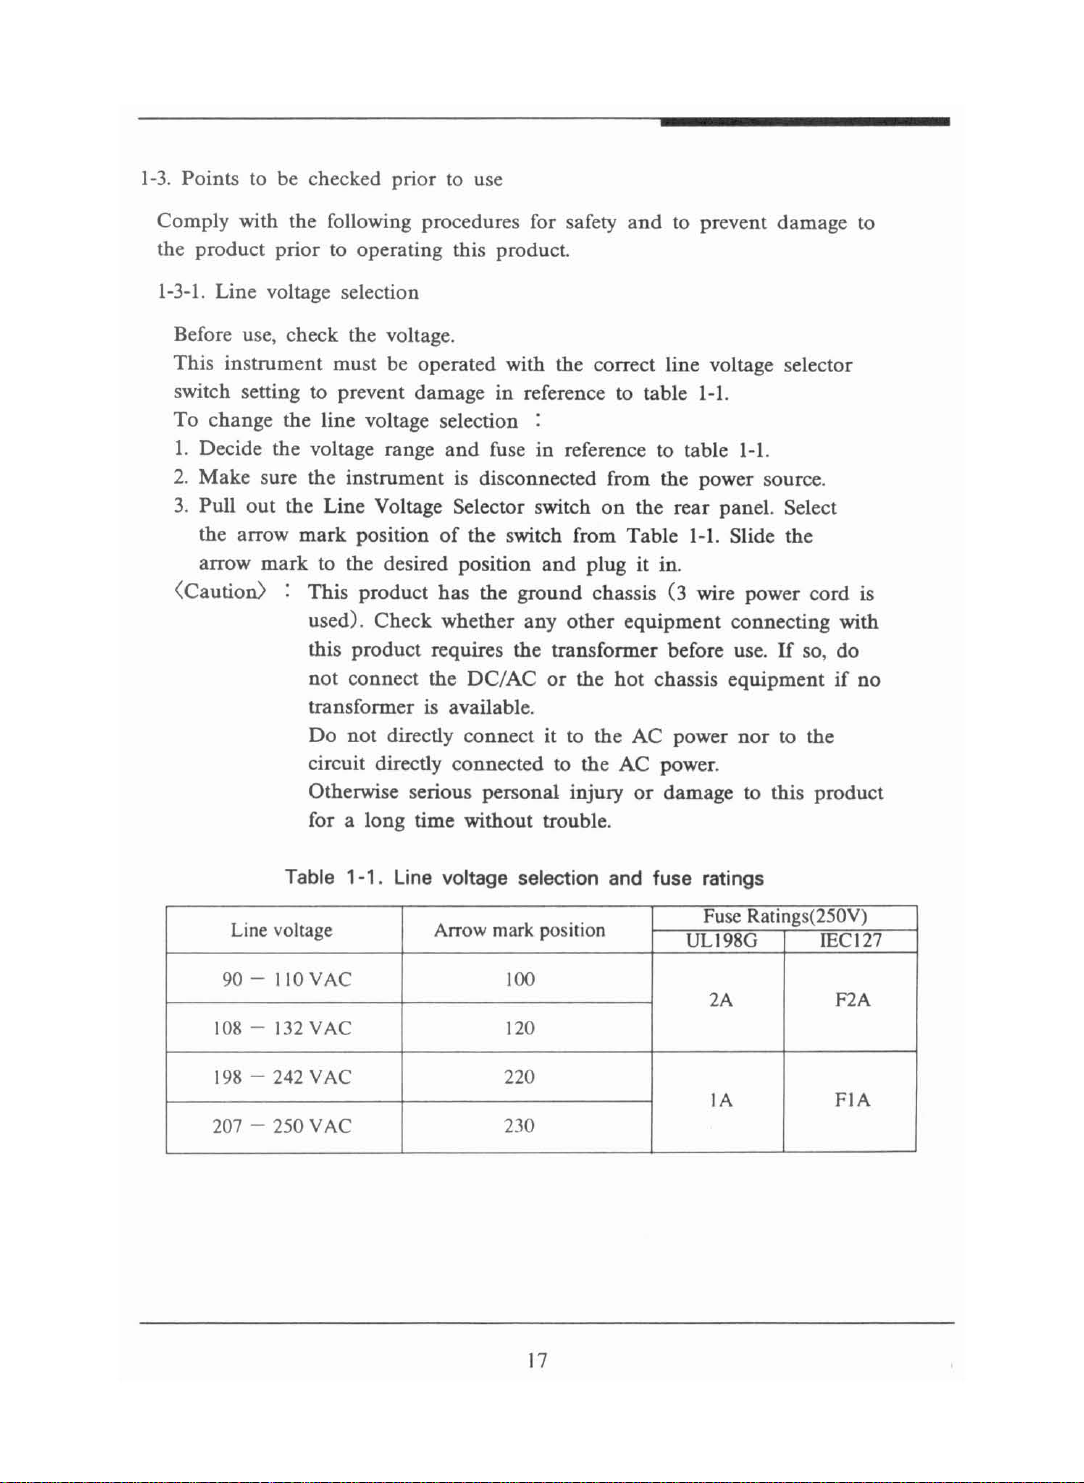
1-3. Points to be checked prior to use
Comply with the following procedures for safety and to prevent damage to
the product prior to operating this product.
1-3-1. Line voltage selection
Before use, check the voltage.
This instrument must be operated with the correct line voltage selector
switch setting to prevent damage in reference to table I-I.
To change the line voltage select
ion
:
1. Decide the voltage range and fuse in reference to table I-I.
2. Make sure the instrument is disc
3. Pull
out
the Line Voltage Selector switch on the rear
onnect
ed from the power source.
pan
el. Select
the arrow mark position of the switch from Table I-I. Slide the
arrow
<Caution> : Th is product
mark
to the desired positi on
has
the ground chassis (3 wire power cord is
used). Check whether any
and
other
this product requires the transformer bef
plug it in.
equipment connecti ng with
or
e use. If so, do
not connect the DC/AC or the hot chassis equipment if no
transformer is available.
Do not directly connect it to the AC power
con
circuit directly
Otherwise serious personal injury or
nected to the AC power.
damag
nor
to the
e to this product
for a long time without trouble.
Table 1-1. Line voltage selection and fuse ratings
Line voltage Arrow mark position
90 - IIOVAC
108 - 132VAC
198 - 242 VAC
100
120
220
207 - 250 VAC 230
17
FuseRatings(250V)
ULl98G
2A F2A
IA FIA
IECI27
Page 18
1-3-2. Installation and handling precautions
OS-
When placin g the
3()()()DSR
following precautions for best instrument perf
S in service at your workplace, obs erve the
orm
ance and longest
service life.
hot
or c
1. Avoid placi ng this instrument in an extremely
Specifica lly, don 't leave this instrument in a close
sunlight in midsummer, or next to a space heater.
2, Do not use this instrument immediately after
cold. Allow time for it to warm to room t
emperatur
brin
old
car
, exposed to
ging it in from the
e, Similarly,
don't move it from a warm place to a very cold place, as
air
condensation might imp
its operation,
3. Do not expose the instrument to wet or dusty environments.
on
top
of
4. Do not place liquid-filled containers
this instrument.
A spill could seriously damage the instrument.
5. Do not use this instrument where it is subject to severe vibration,
or strong wind.
on
6. Do not place heavy objects
the case, nor block the ventilation
holes.
7. Do not use this oscilloscope in strong magnetic fields, such as
motors.
8. Do not insert wires, tools, etc. through the ventilation holes.
ar
9. Do not leave a hot soldering iron ne
the instrument.
10. Do not place this oscilloscope upside dow down on the ground,
otherwise damage to the knobs may result.
11. Do not use this in
strument
the rear-panel connectors,
12. Do not apply voltages in excess of the m
onn
ectors or probes. (Refer to 1-2 specification)
c
upright while BNC cables are attached to
This
will damage the cable.
aximum
ratings to the input
place.
near
13. This oscilloscope is
10 use UL listed double insulated probes only,
-4. Accessories
The below listed accessories are
instrument.
( I) Operating m
anual
(2) AC power code
(3) Probc
(OPTION
)
(4) Fuse
con
I copy
l EA
2 EA
I EA
tained in the
18
pac
kage
of
this
Page 19

2. O
pe
rat
ing
Instructions
(A)
FR
ONT PANEL ITEMS
WAItN'N(;
.........".......
._"'
C......
........
...-s
.
4 ''''__.' ''
ToO/<
' .... .
..
_
"'
..
"'
..-
__
..........,."""
~
.....
(B)
35 20 33
.
REAR
,
7 8
,. '"
PANEL
19
ITE
MS
-
....
..
,-
."...
Fig. 2-1.05-3020D front/rear views
Page 20
~
r
~--
~
-
---f"
-----+---
I
..
..
Ii
!
,
'IT
~
r-'
.
L
o
,
T
l~~
I
,
---
c=j'1
--
I
"'"
1'
I
.''''-
~
:,
:0:
'.-
-,
~:;
"..ss:
I~'©" ;'
_. . . " _ ., J
q ..._- , "
::
I
0 -· -' °' = ...•. - _ .. .
I
0
J
9.
(I)
I
~df
eMf!'!)'!
W5iC)
r-C::I
. • == L:..I
-........c:::J
4 •
, , .
~
©
~::O~ O
-t:~
~~
'--~
,
...
a,0 0 Ll'LJ':
.~-
~
~
~
~
~
L..J
DO
-
~
L.J
~OCJCJ
. ' ,
-
-~'
§g
o ::OU
.. .
~
..
~
~
..
'',,);,'
,.,.?
-
0'
..
"
"'
-
~!'
S>
~'-<"_
~
~
CH1
......
."
©
~
~&
(rJ
0
.:::
,
,
05·30200
I
I
-,
/
c
-- -
-,
I
I
I
I
"
/
I
I!
, -
-._-..-
--
--
,
....
~
,
/
,
I'·~
..
@&,
.
..
_- -
0'
· .
--=
_ ...
"'00
--=
,
-
(I)
..
R
(I)
·
, .
~
©
~
:'0 :' c
, ,
&~~
;~".
)
CHI
,
,~~
..:,; .J : '",'
~«(j1Q
,, - - , ,
--=
......-.0 =
--=
,
·
, .
~
©
~
::0,:. ©
'
'''.~~
- -~I( Hl
I
I
iB
C)
C)
9-
....
0
I
~
9.
II
~
., . -
-c:
., .
......
," :,\
'-._-
' ...
~~
==
D O'
.
:Z:
lA
-
~
~
==
.
==
l[
-
_ i
-oJ
-
'
-
<6:
1/" !!
-
~
il:h.
.-._
i
ll",
-
~
"
_ .
.0
~
ClCJc:::l=
0 0 0 0
II
. ' ,
_.~
~
CD
- ) I •
...
-- . , '"
..
.
,'
©
~,!IZ;.?
_
aoro
__
c.J
CJCJCJ
CJ
CJ CJ
41
_.
I
CD
-
..
~
.......
n.
_A'::'"A:
@i~o
"'
...
....
.'0 .
~
"",,~~
CH2
'h U '
.... _-
~'®§
_.
~ J
. ,
ca
~
~~
.'
() . 8
' '--, ' - .
@5l
~
......
( Hl lt ~ 10:.
,
; o¥
J
...
-
~4:
,
©
~
,
1!lIS~~
",:
,
,
~
..
~,t.
.
:-
...
"
~
~
-,
05·30400
05
·30600
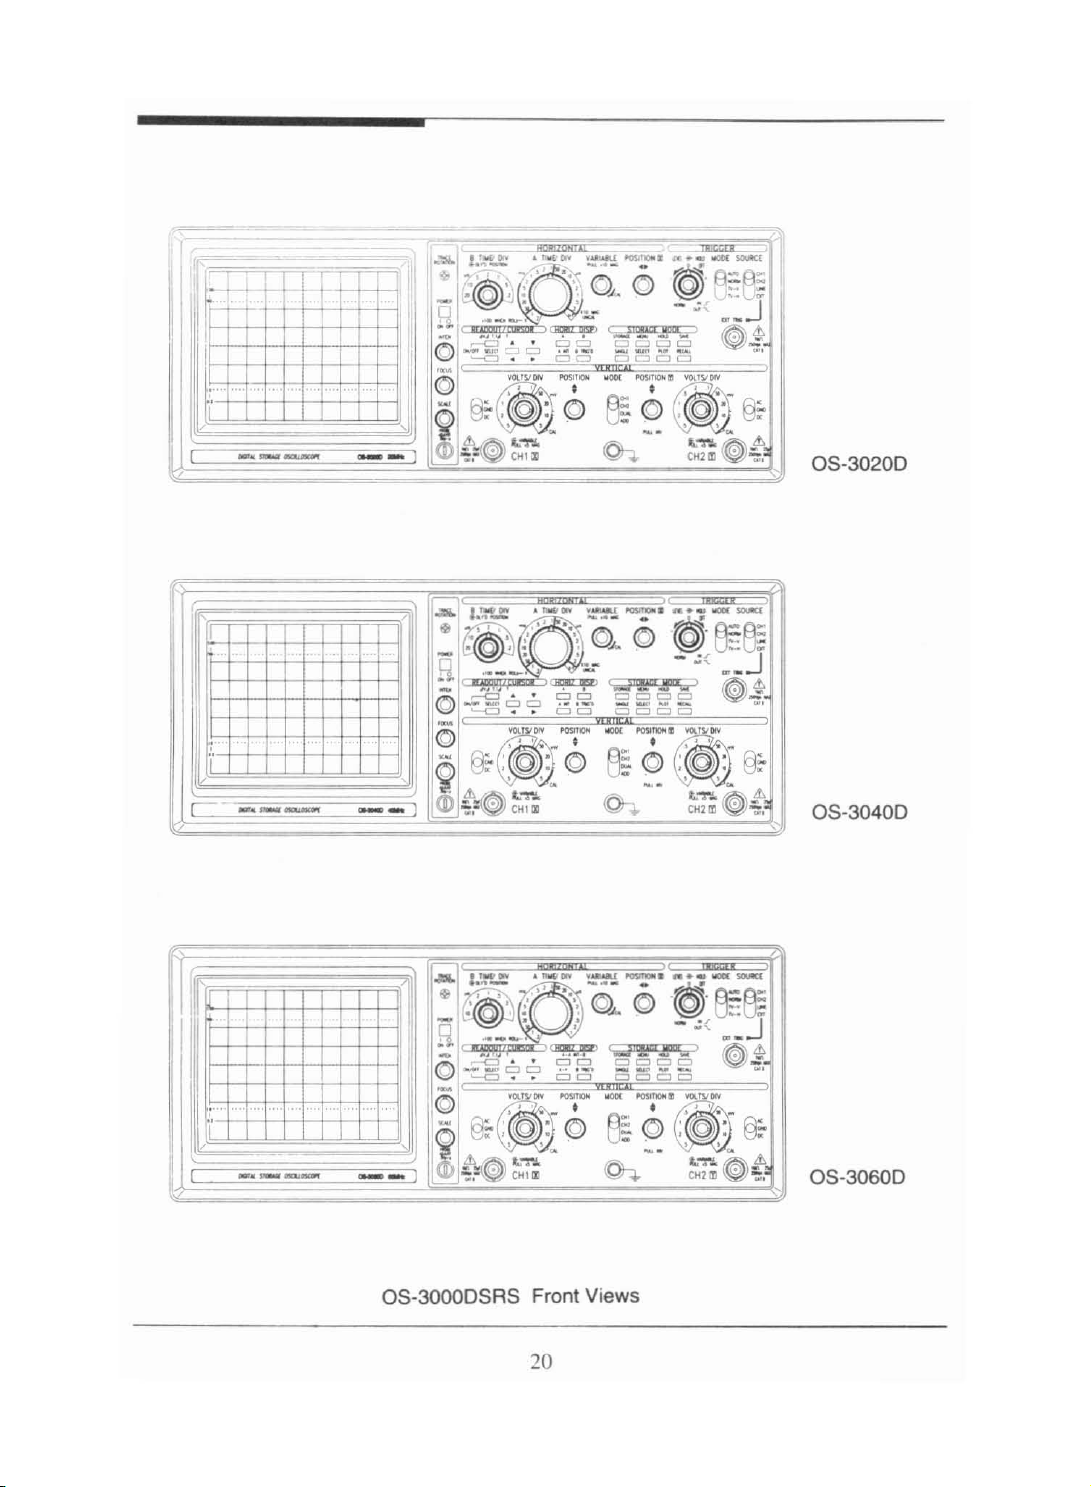
05-300005R5
Front Views
20
Page 21
This section describes the measurement procedures and methods utilizing a
varietyofbasic
instrument.
2-1.
Fun
ctionofeach block
The
numb
indicated on Fig. 2-1.
2-1-1. Display
[ I ]
POWER SWITC
[
3]
INTEN
[
4]
FOCUS
[
5]
TRACEROTATI
[ 6 ]SCALE IL
[ 7 ]
VOLTAGESELECT
[ 8 ]
POWER
inf
ormations and functions needed for operating this
ers shown in the following descriptions represent each t
and
power blocks
tum
H
SITY
ON
LUM
CONNECTOR
OR
Push in to
Adjust the bri
rotation increases brightness.
Adjust sweep lines for obtaining the highest
definition.
Adjust sweep line s for obtaining the highest
definiti
It
when observation is
when taking the ph otogr
Selecti
suitable for operating power.
Connection and removal of the AC power cord is
on
.
adju sts the bri
on
is permissible to make the voltage
instrument power on and off.
ghtn
ess of CRT. Clockwise
ghtn
essofscale. and useful
mad
e in a
aphofscreen.
dar
ermina
k place or
l
easy when using.
2-1-2. Vertical amplifier block
9]
CHI. X INCONNECTOR:
[
<CAUTION> To avoid damage to the oscilloscope. do not apply more than 250VrDC+Peak
AC) between "CHI" terminal and ground.
[10]
CH2
. Y IN
<CAUTION> To avoid damage to the oscilloscope. do not apply more than 250V(DC+Peak
[
1l][12]AC-DC
CONNECTOR
AC) between
.GND
Connects input signal to
amplifier or becomes a X-axis sig
X-Y operation.
:
Con
nects input signal to CH2 vertical
amp
lifier or becomes a Y-axis signal during
X-Y opera tion .
CH
1 vertical
"cnz" terminal and ground.
To be used when selecting the meth od of
coupling input signal to vertical
21
nal
amp
during
lifier.
Page 22
AC
GND
DC
[ 13][14J V
[ 15J[ 16J
[ 17J[ 18J POSIT
PULLCH2.
[19J V
OLTS
VARIABLE
lNV
MODE
CHi
C
H2
/DIY
ION
[18J
SWITC
Ca pacitor between inp ut connector
amplifier interrup ts an y DC componen t of the
signal.
Connec ts input connector
to the ground, thu s establishing
reference point.
By makin g
connector and vertical amplifier,
is directly connected to vertical amplifier.
As being the attenuator by each step selecting
vertical deflection sensitivity, measurement
of waveform is practicable regardless of
signal magnitude and those shall be used by
having t
so as to make waveform mea surement easy .
As being the minute ad
having vertical deflection sensitivity
continuously varied, if they
counterclockwise the attenuation ratio becom es
less
than
pull out the knob, vertical axis sensitivity
becomes x5 times.
At time time. the maximum sensitivity becomes
ImV
.
Being used for
Clockwise rotation moves waveform up
counterclockwise rotation movesitdown.
When pulled'
appea rs inverted.
H
Being used for selec ting th e display m
vertical axis.
Disp
laysonly the signal input to
dir
ect
con
hem
placed at the appropriate positi
1/2.5 of
ind
mov
ing vertical axis waveform .
out, the signal applied to
of
vertical
nection between in put
justor
ar
icated value.
and
vertica l
amp
lifier
G
ND
as a
input
signal
being used when
e fully rotated
When
CHIon
od
you
and
CH2
e of
the
on
CRT.
Displays only the signal input to CH2
on
the
CRT.
Page 23
[20J
CHI
DU
AL
AD
D Displays the algebraic sum of CH I and
Two signals th ai arc input to CH I and CH2
ap
pear
on the CRT simulta neously.
CHOP :
ALT :
TIM
E/DIY 0.
TIME/DIY 2ms
-0.
2s-S
21'i
ms
(.
signals.
OlIT
CONNECTOR
Provides frequency counterorother devices
with a part of signal s that arc
by having
them
amplified.
OS-3060lJ : 0
input
10 CH I
CH
.1
us )
2
2-1-3. Sweeps
[2
lJ H
ORIZONTALDIS
and
trigger blocks
PlAY
A
To select the sweep mode.
A
pushbutton sweeps the CRT at the
tirnebase rate when pressed.
AlNT
pushbu
tton sweeps the CRT at the main
A
!NT
(A) tirncbase rate when pressed, and the B
tirnebase
trac
simuhanously),
B
The sector whose bri
inten
sifies a section of the
ets
). (In case of OS-3
disp layed on the scr
BT
RIG
'D the delay sweep is triggered by the
first trigger pulse.
x-
y
pu
shbuttonprovides X-V operation. (only
OS-3
06(
0 ).
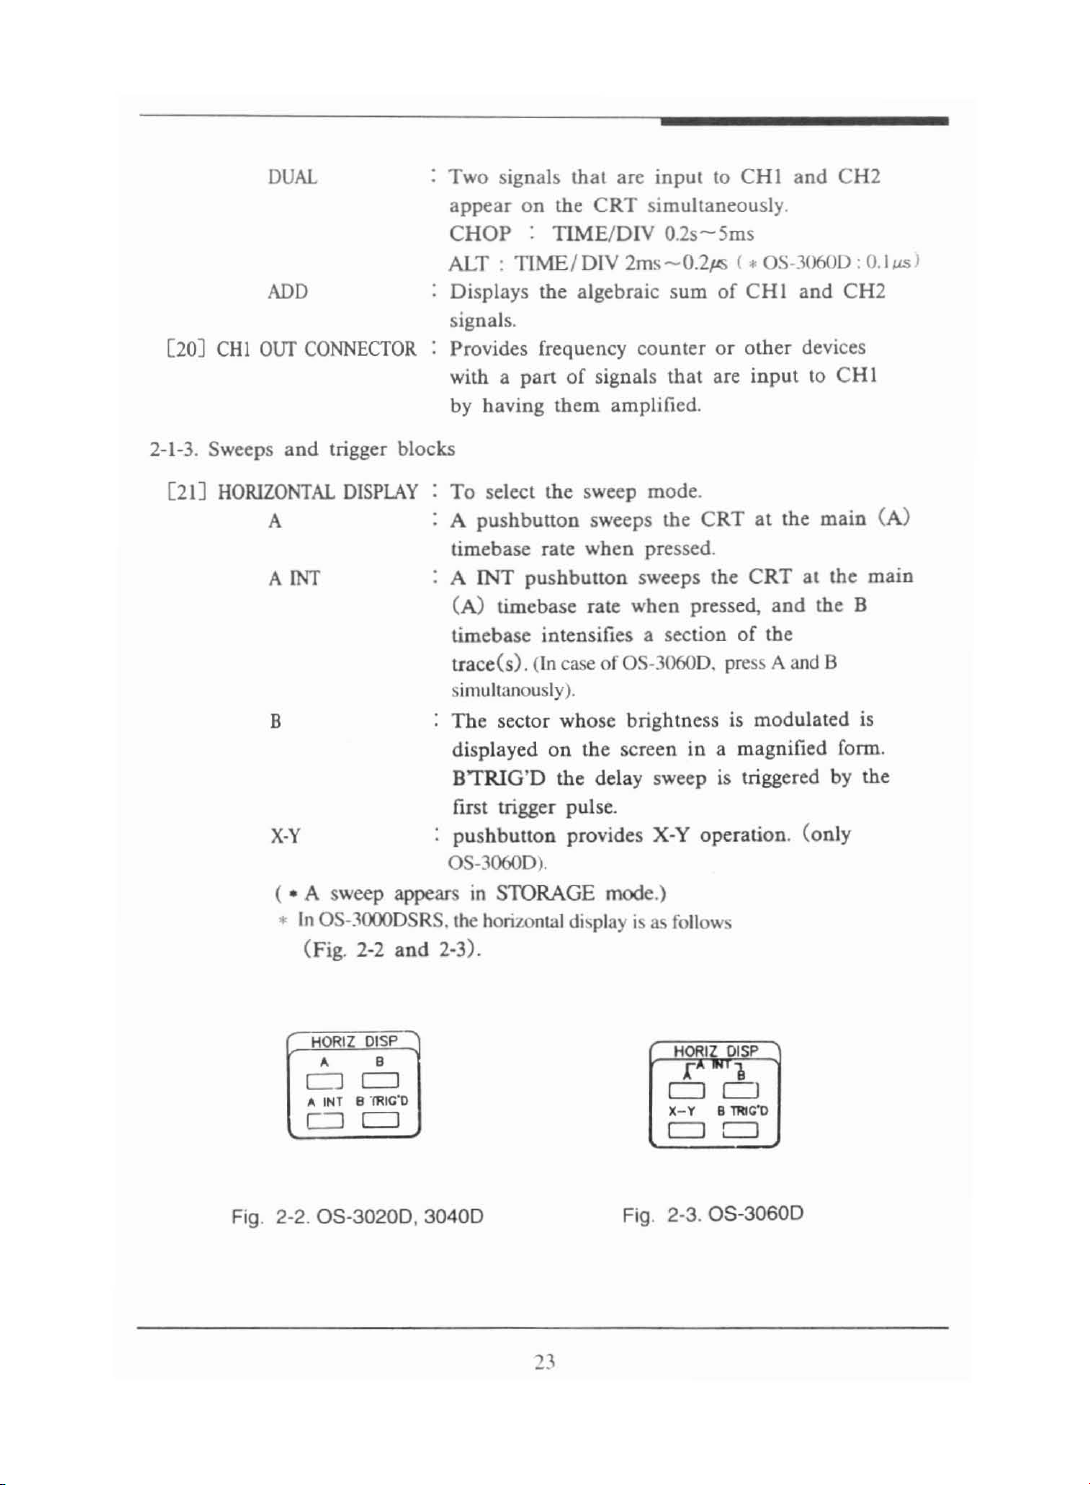
( • A sweep appears in STORAGE mode.)
• In
OS-3000DSRS. the horizontaldisplay is as follows
(Fig. 2-2
and
2-3).
0600.
pres>A and B
ghtne
ss is modulated is
een
in a magnified form.
main
(
A)
Fig. 2-2.
HORIZ OISP
• B
CJ
CJ
A INT B '
c:J
1'R
CJ
05-3020
IC"o
0, 3040D
HORIZ OI<P
fA
CJ
x-Y B 'PtIG'D
CJ
Fig. 2-3.
"
05
'1
0
CJ
-30
600
Page 24

[22J A TIME/DlV To select eithe r the calib rated sweep rate
the m
ain
(A) timebase, and X-V operation
()S-
J()
~()J).
OS -30.fOD) for dcluycd-vwccp operation.
[23
J B TIMElDlV To select the calibrated sweep rate of the
calibrated (B) timebase.
[24J
DELA
Y TIME
POSmON
To determ ine the exact starting p
oint
within
the A timebase delay range at which the B
timebase will begin sweeping.
[25J A
VARIAB
PULL
LE
XIOMAG :
Being used for having A sweep time varied
ontinu
c
When
with the central scale
ously from the calibrated position.
you make
the
part to be magnified align
of
the vertical axis by
adjusting the position of the horizontal axis
and
when
you pull the X10
MAG
switch,
waveform, the left and the right of which are
magnified centering
around
the middle,
appears. At this time, sweep time becomes
of
[26J
HO
RIZONTAL
POSm O
1/10
N:
Being used for adjusting
the indicated value of
and being used i
measurement
of
Clockwise rotation
and
right
count
ndependentl
waveforms.
of
the knob moves it to the
erclockwise rotationmoves it
TIME/ON
horiz
ontal
y of the time
position
to the left.
of
the
.
Page 25
[27J
[28J
TRIGGER
AurO
NORM
TV-V
TV-H
TRIGGER
CHI
CH2
LINE
EXT
MODE
SOURCE
Selects the sweep triggering mode .
The sweep
When
triggered normally is obtained
wavef
Where there is no signal
not
made, the sweep still occurs
automatically.
occur
s automatically.
there is a triggering signal, the sweep
and
the
orm
stops.
and
the trigger IS
This
position is convenient in
general use.
can
Triggered sweep
there is no triggering signal
is not made, then the sweep does not occur,
then the sweep does not occur.
hen
effective w
desired to be
the effective triggering is
done
be obtained, but when
and
triggering
This
mode is
in a low frequency (approx.
25Hz or less) .
Being used for meas uring a composite video
signal in a frame
This
one
is used for meas uring a composite
vedeo signal in a
This
can
select the convenient portionofthe
unit
scanning
line unit.
trigger source.
It
can
select the
when there is a signal on CH
This
can
select the
when there is a signal
Thisone
is used for observing a signal which
is triggered
can
also stable observe components derived
CH
I as the trigger source
l.
CH2
as the trigger source
on
CH2
.
on
the frequency of AC power.
from the power in which a measuring signal
contained.
External signal becomes the sourc e of
And
this
one
triggering signals.
is used when
making a triggering regardless of the size of
of
signals
vertical axis.
It
IS
25
Page 26
[29J
[30J
[31J
HOLD
TRIG
LEVE
TRIGGER
EXTTRI
OFF
G IN
L
SLOPE
Thisone
certa inly by
main sweep. It is also effective in triggering
such
signal, irregula r signal
makes complicated signa l triggerred
cha
nging the H
com
plicated signals as high frequency
OLDOFF
or
digital signal,
timeofthe
etc. by extending sweeping time.
Adjust it slowly for the stab ilized
triggering.
It
is n
orm
ally used after having
it fully rotated counterclockwise.
This one selects a starting p
oint
of
triggering signal.
When
trigger
maximum value and when rotating it
the knob is rotated clockwise, the
point
moves toward the +( positive)
counterclockwise, it moves toward - (negative)
maximum value.
Being used forselecting trigger slopeofthe
initial sweep.
this switch selects positive/
pulled. the switch indicates negativ e
When
the switch is pressed,
+)
slope and when
(-)
slope.
Being used for connecting external trigger
signals to trigger circuits.
<CAUTION> To avoid damage to the oscilloscope, do not apply more than 250V(DC+Peak
AC) between "EXT Trig In" terminal and ground.
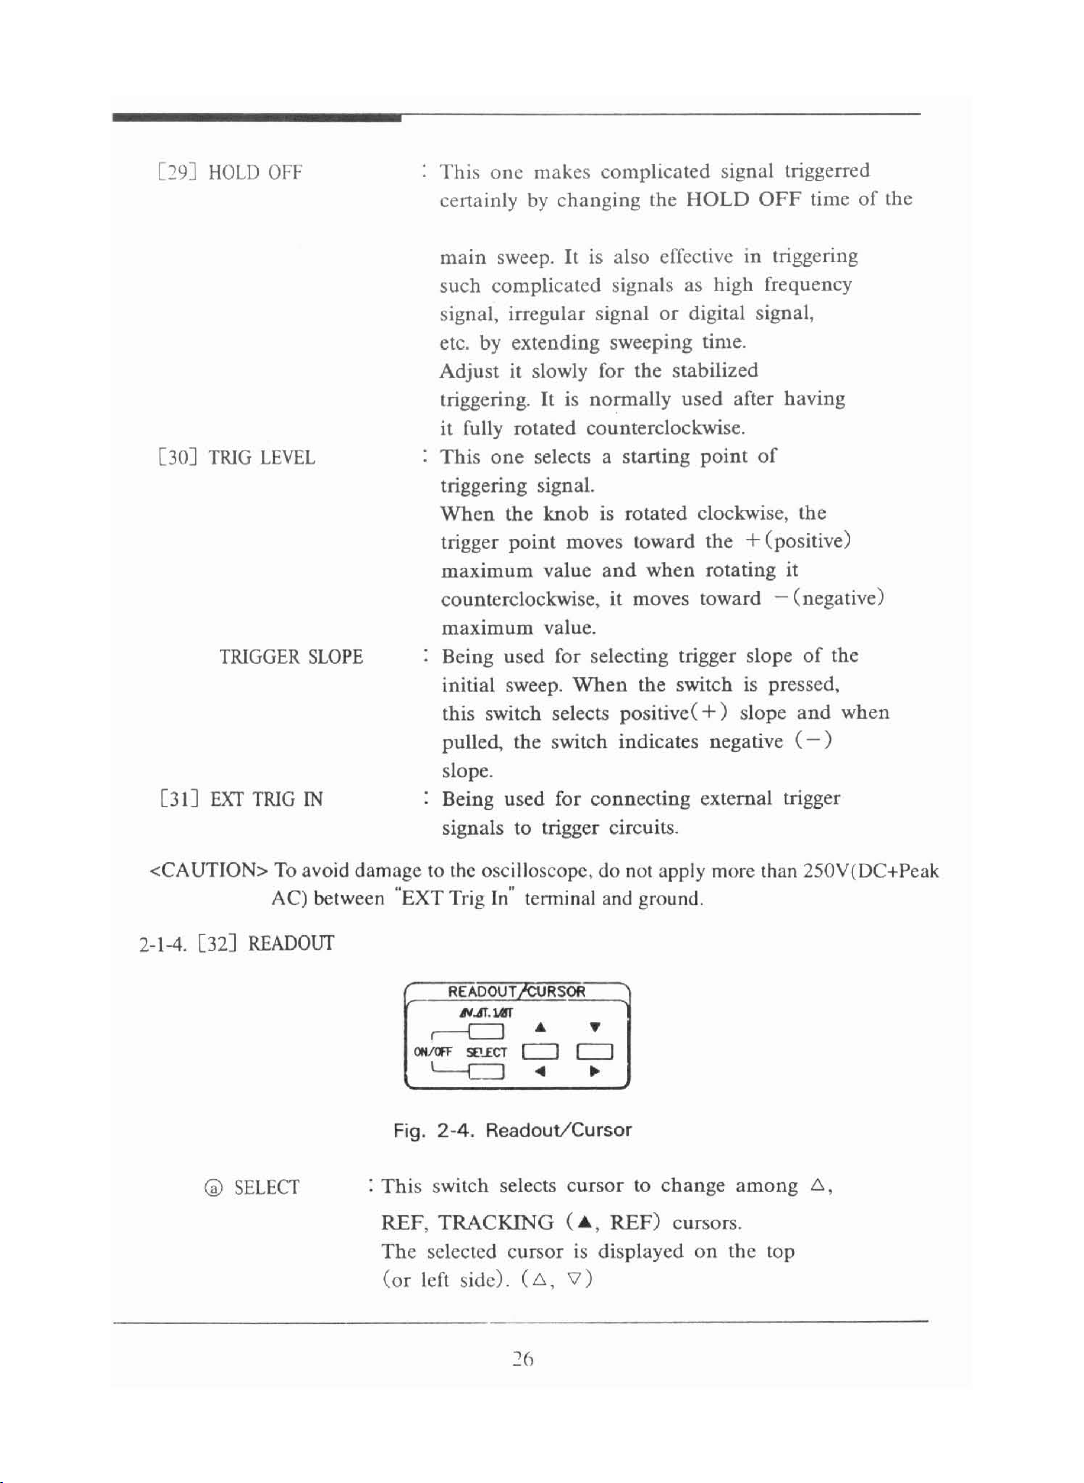
2-1-4. [3 2J
Gi)
READOUT
SELECT
READOU
T/CURSOR
Fig. 2-4. Readou
:
Thi
s switch selects
t/
REF,TRACKING("',
Cursor
cursortochangeamong
REF
) cursors.
6,
The selected cursor is displayed on the top
left side). ( 6 ,
(or
\7)
26
Page 27
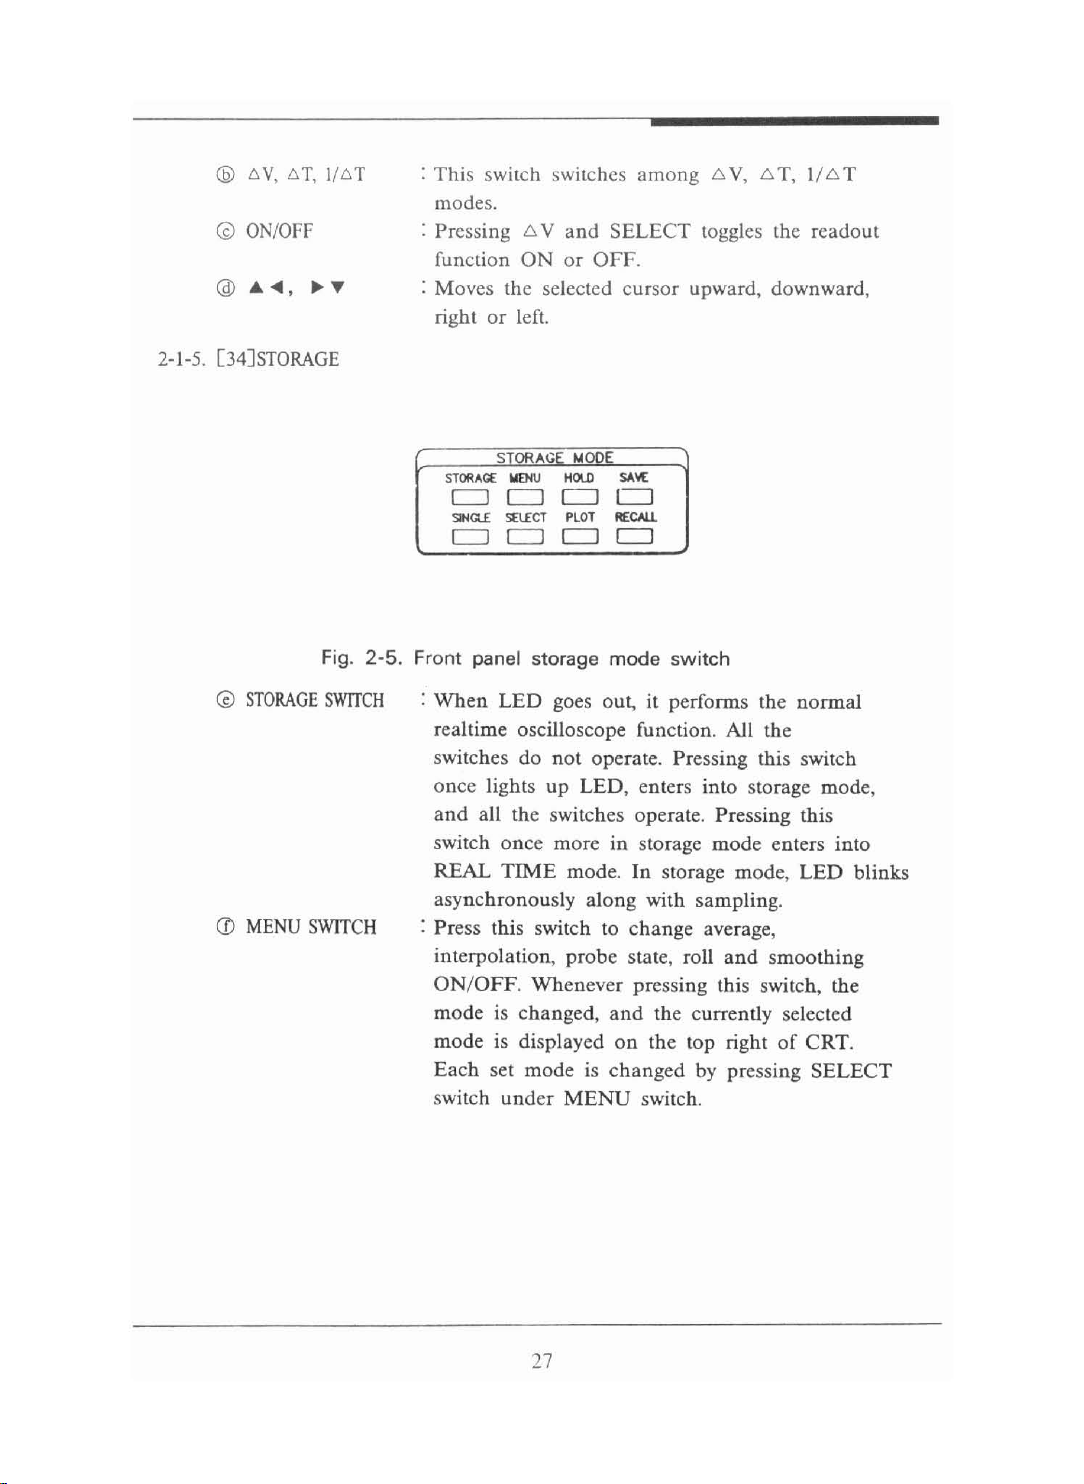
® s
C9
»,
ON
toT, l/toT
/OFF
: This switch switches
among
'" Y,'"T, 1
/'"
T
modes.
{;:,
: Pressing
function
Y and SELECT toggles the readout
ON
or
OFF.
: Moves the selected cursor upward , downward,
right or left.
2-1-5. [ 34]STORA
is>
STORAGESWIT
CD
MEN
U S
GE
SlORAG£YEN
Cl
S1N
Ct£ SElECT PLOT RECAll
Cl
Fig. 2·5. Front panel
CH
When
:
realtime oscilloscope function. All the
switches do not operate. Pressing this switch
once lights up LED, en ters into storage mode,
and all the switches operate. Pressing this
switch once more in storage mode enters into
REAL
hro
async
WIT
CH
: Press this switch to change average,
interpolation, probe state, roll
ON/OFF.
ode
m
mode is displayed on the top right of CRT.
Each set mode is chan ged by pressing SELECT
switch unde r MENU switch.
STORAGE
Cl Cl
Cl
LED goes out, it perf
TIME
~
ODE
U HotD
SA't£
CJ
Cl Cl
storage
mode switch
orm
mode. In storage mode, LED blinks
nously along with sampling.
andsmoo
When
ever pressing this switch, the
is changed,
and
the currently selected
s the normal
thing
27
Page 28
Gil
HOLDSW
®
SAVESWITC
CD
SINGLE
CD
SELECTSWITCH
®
PLOTSWITC
CD
RECALLSWITC
ITC
H
SWITC
H
: Pressing this switch stops sampling,
H
waveform displayed on the screen stops and
lights
ON
. Pressing this switch again
releases
: This switch stores the display waveform in the
storage memory. The display waveform is
stored by this switch in H OLD state.
In no ncha ntged.
H
H
: This switch meas ures the cha nge in the
instantaneo us (intermiuent) waveform.
Thi
:
mode.
: Thi s switch outputs the display wavef
the X-Y plotter.Pressing switch tran smitts
data
only in the H
: Thi s switch is used to display the stored
waveform
lights up the LED. Wh en LED goes
pressing this switch continuo usly it relea ses.
HOLD
HO
s switch changes the M
and
lights up LED. This switch opera tes
state, and sampling begins.
LD mode, only the switch state is
ENU
OLD
state (HOLD LED lights up).
on
CRT again.Pressing this switch
and
the
switch setting
orm
on
out
after
LED
2-1-6. Miscellaneous
DIP
SWIT
[33]
DIP
RS
·131C
[35]
CH and
SWITCH
CONN
EXTBLANKI
RS-232C
ECT
OR Co
CONNE
Sets the
time of plotter outp ut or at the co
with
the time of plotter output or at the
communi
NG INPlIT CONNECTOR
modul ation of the CRT. Tra ce bri
reduced with a positive signal, and increased
with a negative signal,
CTOR
PLOTorcommunication
computer
nn
ects RS-232C cabl e (Fig. 3-2 and 4-2) at
,
cation with co mputer.
mode at the
mmunication
: For applying signal to intensity
ghtn
ess is
Page 29
[ 36J CAL TERMINAL
[37] G
ROUND
CONN
ECTO
2-2. Basic measurements
2-2-1. Connectio n of mea
R
surin
Outp uts the squa re wave (O.5V, Ik
calibrate the
Pro
vides an attachment p
probe
and
verticalamplifier.
ointfor
ground lead .
g signals
Hz)
to
a separate
There are th ree differ
ent
methods forobserving signals by
oscilloscope as follows :
I. Method using lead wire
2. Met
3. Method u
I.
Meth
Thi
that
signal
time, ground wires s
of oscilloscope
However, in case t
wire is
mea suring low level signals. As it is
connected to
for
2.
Meth
Thi
output c
shie ld coating of coaxial cable prevents
hod
using coaxial
sing
probe
cable
for oscilloscope
od using lead wire
s method is the simple onebut it can only be used in the event
the signal level you i
or
a low impedance circuit (such as
and
hat
not
shielded,the
the
connector
BNC
is desirable.
od u
sing
coaxial cable
s method is the m
onnect
or is
ntendto measure is eit
ha
ll be
connec
ted betwee n the
TTL
herahigh
circ
uit).
ground
the gro unding surface of objects to be measured.
the wire picks up h um and noise
meas
ost
prev
attached
urement
of oscilloscope, using a b
ailingone
to the mea
may
often be difficult whe n
hard
to have the wire
which
sur
eing
hum
and
ind
is widely used
object
noise, accurate
measureme nt can be performed.
Since the coaxi
each
end and there are
just would be advisable to usc a suitable
meas
uri
ng high freq
of
the sa me value as the impedance of mea
be used, a
terminator in terms
shou
ld you use the subject method, an accurate measureme nt co uld be
perfo
rmed
al
cable are usually fitted with
man
y varieties
uen
cy signals, a
nd
the coaxial cables should also be
of
impedance. Even
with
out
affect
ing
mea
termin
surement
of
types by
one
when
signals.
BNC
connectors
their
as
needed.When
ator
having
surin
g signal sources shall
matched
using a long cable,
meansof
level
At this
ing terminal
beca
use the
ing
adapte
As
the
purposes
an
impedance
with the
when
on
, it
the
r
an
29
Page 30
3. Method using prob e for oscilloscope
Using a probe is most preferable to any other alternatives when
performing the measurement onto circuits.
with IX (direct c
As thc i
osc
npu
illosco pe with probe increased at lOX position, measurement unit
onn
t signal att
ection) position
enuat
es by 1/10 with the input impedance of
The
probes arc available
and
lOX (attenuation) position.
(VOLT/ OIV) must be multiplied by ten ( 10). (e.g. it becomes 50mV X
10 = 0.05V in 50mV/OIV). As the probe
shielded wires, it
prevent
hum
and noise.
can
perform the measurement by using the coaxia l cable, you s
of
oscilloscope also uses
When
you intend to
ho
exactly know the source impedance, the highest freque ncy involved,
capac
and the
itance
If any of these factors are
of
the cable, etc,
unkn
own, use a 10 X probe.
2-2-2. Adjustment during initial operation
uld
Comp ly with the following procedure before conducting the
I. Adjusting knob is as follows
OFF
OWER
P
INTEN
SWITCH [ iJ
CONTROL
[3J
FOCUS CONTROL [4J
C-GNO-OC
A
/OIV
VOLT
VERTI
CAL
SWITCH [ 11,12J
SWITCH [ 13,14J
POSITION
CONTROL [ 17,18J
VARIABLE
MOD
V.
/OIV
TIM E
CONTROL
E S
WIT
[22J
CH [ 19J
TIME VARIABLE (25)
HORIZONTAL
TRI
GGER
TRIGG
ER SOURCE [28J
TRIGGER
OLDOFF
H
POSITION [26J
MODE
[27J
LEVEL [30J
[29J
[ 15,16J
(released)
Fully counterclockwise
Mid
AC
20mV
In the middle
Fully clockwise
and
and
CH I
111
s
0.5
Fully clockwise
and
Mid
AUTO
CHI
Mid
NORM
(max. CCW)
to the power connector [8J.2. Co nnect the power cord
measurement
pushed in
pushed in
pushed in
30
Page 31

3. Press in the
INTEN
adjust brightn ess so as to
<Caution> A burn-resistant material is used in the
POWER
switch [1J. About 30 seconds later, rotate the
[3] control clockwise until tbe trac e
mak
e it suitable for observing.
app
ears.
CRT
And
then,
. However if
the CRT is left with an extremely bright dot or trace for
a very long time, the screen may be damaged. Th erefore,
if a measurement requires high brightness, be certain to
turn down the I
get in the
the scope is
4. Adj ust the
distinctest definition.
FOCUS
control [4] to make it produce the finest and
NT
EN control immediately afterward. Also,
hab
it of turning the brightness way down if
left unattended for any period of time.
5. Make sure tha t the traces align with horizonta l graticule lines by
turning the CH I vertical
not align with horiz
each other by adjusting the
6,
Turn
the
HORIZONTAL
POSITION
ont
al graticule lines, then make them align with
TRA
POSITION
control [ 17J. Where the traces do
CE ROTATION [SJ.
control
[26]
to make it align with the
left-most graticule line.
7. Connect the PROB E to the
CHI
, X IN connector [9] to make it align
with the left-most graticule line.
8. If the top and a certain porti
pointed, ad
ju
st the control terminal of the PROBE by means of a
small screwdriver as shown
on
of the square waves are tilted or
on
Fig. 2-b(b ).
31
Page 32

HOO
K COVl R
R(
TRA(lABl (
HOO k TIP
CAPACITANCE
CORR
TR,MM(R
CQR;UC TlY
C()'jP( NSAH O
ill
ECT
ION
(tllH H CTS Of
I .. ) PROBl
UNDER
COMP £HSATl D
PROO£COM
~
PENSA
TION
GROUND CLIP
(jVl R
CQMP( NSATfO
Fig.
2-6
. Probe compensation
Page 33

2-2-3. Data d isplay
(I)
Real time mode display
Cursor measurement value
Cursor
CD
I
-
[>-
/
-.
- - - - - - - - - - - - - - - - - - - - - -
I
CHI
CH I and
---
I I
Scale
factor
CH2
scale factor display
r
~1
- r
L
__
L
I
-
- - - -.-- - - - - - - - - -
I I
ADD
CH2 Scale
1
<--
OX
-r->- r
__
L
__
A sweep, B sweep
factor
V/DIV
~
-r0-r-m- r; -1
L
__
L _ _ L
X-V Scale factor
---->1
__
I
L
__
J
PROBE
PIOX lOX
PIX
In
ADD
CH2.
display
PROBE
IX PROBE
mode, •
+'
B
LANK
>
*
is displayed between scale factors of
33
CAL
UNCAL
X5MAG
CHI
and
Page 34

.<t A sweep. B sweep factor display
and
X-V displa y
1< V
r- -r--r- -r--r-
I > I 0. 1 5 m s
l _ _ L
__
IDIV
l _ _ L
__
>1
-1
L _ --.J
[
B
LANK
® Cursor measu re
The meas ured value between cursors is displayed.
•
> :
Xl
CAL
XI0
MAG
UNCAL
ment
I
<:---
1
)ln
X-V ope ration mode, X-V mode is
displayed.
data
and
2)ln B sweep mode, B
displayed
disappear.
display
-
--
Mea
sur
and
B setting data disappear.
and
ed value
TIM
E/DIY
TIME
TIME/DIY
--->
-r
--r- -
I 0 V I
_ L
__
L_---1
setting
is
selling
I
1
data
I
t;.
V : CH I, CH2, AD D, DUAL
o:
T : Time differe nce
between two cursors
for A TI
1/
t;.
T : Reciprocal of
ME/DIY
t;.V : +. - , mv, V. div
6.
T:
+,
-.
ps, ms, s, div
1/
t;.
T :
MH
z, kHz, Hz, mHz, ?
•div" is displayed in the following
t;.
T
cases
-
The
- B sweep
-X
- A sweep (UN CAL mode )
-CHI
with each other when the VERTICAL
MOD
measurement value
channel
MOD E switch is not in CAL mode.
-Y m
selected by VERTICAL
ode
and
CH2
VOLTS/DIYare same
E is
ADD
.
of
the
Page 35

(2) Storage mode displa y
dat
Location of
Pre-trigger and cursor measurement value
1>- - - - - - - - - - - - - - - - - - -
Cursor
::::
a display on CRT
'--------1
Average. smoothing.
interpolationand
~
met
hod
save switch,
I state
sampling
PRO
BE
Save A
scale factor
CH I scale factor CH2
-II------;:===
ADD
NOTE
Wavef
displayed
while input signal is stored in storage mod e. While.
wavef
condition associated with sweep factor
valves are always displayed when wavef
*
* Pre trigger and cursor measurement
+
scale factor
orm
or even previously stored wavef
orm
is stored, the instrument stores the setting
CHI,CH
When
factor corresponding to wavef
The
using cursor selector switch
displayed.
2 and A sweep factors
CH I
and
sweep waveform corresponding to the function selected
,-_~-
A scale and
X-Y scale factor
CH2 waveform s are displayed. the sweep
Save B scale factor
and
wavef
orm
is displayed.
orm
is displayed.
and
vertical mode switch is
orm
orm
may be
. These
* SAVE A and SAVE B sweep factor
When the waveform is stored in the memory. V
ME
/ON is displayed. When the stored wavef
TI
displayed on the CRT by pressing RECALL switch, this
sweep factor is displayed.
/ON
orm
and
is
Page 36

(
1'
CII I and C H
::'
'''CCp
faC
lor display
BLANK
*
n
J
r--r-
I Pl , OX . > I 1 I 0 lD V ;
l
__l__
Probe
PIOX
PIX
@ A and B sweep sweep factor display
display
lOX
probe
IX probe
1
<-
- SIDIV ---->1
-
--
r- -r- -r--r- -1
> . 0
r
L _ _ l _ _ L
XI
CAL
No interpolation
Sine wave interpolation XIO MAG
Linear interpolation (Horizontal
.•
(No hori zontal magnification )
-r
- -r- -r- -r--r--1
l
5
__
__l__
ID
L _ _ L _
,S
L _ _ l
-J
:J
magnification)
__
L _ _ J
Blank
>
*
and
X-V display
C
AL
UNCAL
X5 MAG
In X·Y operation. A sweep sweep
factor dis
displayed.
@ Pre trigger selling display
Trigger point of display waveform agains t the trigger point
display waveform.
(Example
<D
Refer to 2-2-5 for the displayofaverage. smoothing,
interpolation, sampling met
hod
.
36
app
ears and x·yis
of
Page 37

® Cursor measurement value display
Th
e measured value between cursors is displayed.
Measured value
- - - - - >1
lJ.VI : Voltdifference between lJ.V :
cursors for CHI and Dual a T : -l-, - , ns, !'S, rns, 5, div
two
sweep waveform.
lJ.V2 : Voltdifference between
cursors for CH2
two
sweep waveform,
lJ.V : Voltdifference between
cursors for ADD
two
sweep waveform,
lJ.T : Time difference
between two cursors
for A sweep waveform
1/
lJ.
T : Reciprocal
of
lJ.T
•div" is displayed in the following
case :
-The measurement value of the
c
-A sweep VAR mode is
-x-v
-In
exceeds the measurement
-The VOL
-t-
, - . mV,V, div
1/ lJ.T : MHz, kHz,?,
hann
el selected by VERTICAL
switch is not in
mode at the equivalent s
mode.
m
ode
HOLD
not same with each other when
vertical mode is
state,
TIM
TS/DIVofCHI
ADD
mHz,
CAL
state.
EIDIV switch
.
not
am
MAG
and
div
in CAL
pling
MOD
range.
em
E
are
37
Page 38

2-2-4. Real time mode mesurement
(I)
Single-t race mea
Single-trace measurement is the most elementary function of this
measuring instrument.
Use this mode when you intend to measure one single signal. Since
this in
CH2. CH 1
to use it when you i
frequency counter.
CH2, as the INVERT switch [ 1
of
<D
strument
waveform inverted.
Set the switches as indicated below when you use the CH I.The
words in the
PO
WER[I]
AC-GND-DC [Il], [12] AC
VERTICALAXIS
VARIABLE [ IS], [ 16J Fully
V
MODE
HORlZ
AT
IME
TRI
GGER
TRlG
TRlG
HOLD
® Position the trace
Vertical
@
Connect
tum
the VOLT/DIY [ 13], [ 14] so as to make the signal fully
appear
(Cautio
<D
Tum the
the des ired cycle. Forthe general
3
cycles is suitable but when measuring the closed up
waveforms, displ ay
TRlG
GE
stable wavef
sur
ement
comprises two channels, just c
has
an
OlITPlIT
ntend
bra
cket r
POSrnO
[ 19]
. DISPLAY [21J A
VARIABLE[251 Fully
MODE
SOURCE
LEVEL
OFF
[29J
POSmON
the signal by
on the CRT.
n)
Do
AC) .
TIME
R LEVEL control [30] with having it rotated to make a
orm
[27J
[28]
[30]
on
control.
not
apply a signal gre
/DIY
of
appear
termi
nal[20],
to mea sure the frequency by means
8],
is practica ble to have the polarity
epr
esent the setting when using CH2.
ON
N[ 1
7],[
18J : Mid rotat
CHI
AUTO
CHI
Mid
NORM
the
the center of
meansofthe
switch [22] so as to make the signal bec
50-100 cycles is
.
CRT
'IN
measur
hoos
e oneofCH I
and
it is desirable for you
ion
andpushed
CW
andpushed
(c
m)
CW
and
pushed
(Cm
)
rotation
(positioning it at
endofCCW
by adjusting the
connector
ater
than
2S0V ( DC +
ement displayof2 or
proper.And
)
[9J [IOJ
adjust the
in
of
in
and
peak
and
a
ome
38
Page 39

®
If
the signal to be measured does not trigger or the
measurement is
VOLT/D1V switch is position ed
XS MAG) [ lSJ [ 16]. At this time. where the VOLT
set to SmV, it becomes
difficult beca use of its weakness though the
on
SmV. pull the VARIABLE (PULL
/ON
lmV/ON
and
the frequency wide
width decrea ses to 7 MH z. However. the noise increases on the
trace.
® If the signal you wish to observe is a high frequency, thus
resulting in too many cycles tho ugh th e TIME/D1V switch which
of
0
.2~s.
is set to the position
pull the
termi nal ( PULL X10 MAG) [ 2S].
by ten [
J times so that
0.2~s
becomes 20ns/div and
IO
becomesSOns/div.
O.S~
s
0.2 and
less is the calibrated terminal. (When magnified by XIO in
lus
/di
v, the value is ± 10%
than
I ps, the value is ± S%) .
(j)
When
measuring DC or very low frequency. the AC coupling
MAG
arc the uncalibrated term inal
and
results in the attenuation of signal or distortion so that use
the instrument after having the AC-
oned
positi
Caution : Where the wavef
to DC.
ormofvery low AC level is loaded on
the high DC voltage. it may not appear on DC
position.
The
NORMofTRI
GGER MODE switch [27J is the position
to be
reswept. When observing sig
can
also perform the measurement by adj usting the T
LEVEL
.
[30].
(2)
Dual-trace measuremen t
Dual-trace measu rement is the major function of this instrument,
OS-3OOO
0 . The measuring procedure is same as thatof2-2-4
single-trace measurement abov e with the exception of the following :
CD
Set the V
MODE
switch [ 19J to dual.
Use ALT for relatively high-frequency signals (TIME/ON switch
:O.2rns or faster). and usc CHOP for
signals (TIME/DIV switch : O.Srns or slower).
'TIM
E VARIABLE
The
n the sweep speed increases
O.S~s
and
1us or
when mag nified by XIO in less
OC.G
NO switch [ 11], [ 12J
na
l frequency belo w 2SHz, you
relat ivel y l
ow-
freq uency
switch is
band
RIGGE
R
39
Page 40

@ If the two channels are of the same freque ncy. you can exactly
OU
initiate the triggering with TR IGG ER S
S,M"'
'''IIH'
. 1..... 1 \hI1
ISVt< ,., 1..1
1
..
(a) Compositive video signa l
I
:
,
- '--
(b)TV-V coupling
RCE switch [2
s1
I
~
m
, I I
(c) TV-H coupling
r_~r_TI
,
I
,
1
"-
f-
-
i
I
\I
.
,
'I
(d) SYNC polarity
Fig. 2-7.
III
l1T
~
m
II
Ie
!
I
I
\...
M
'TV sinc s ignal
I 1
.1
r-
t
'-,
separation
1
1Il"",1,\'( "'1.AlI T'r
~_u.;1CJ'o
I
40
Page 41

(3)
Trigger selection
Triggering is the most co mplicated operatio n to perform for the
osci ll
osco
pe because this instrument has man y requirements that
have to be incidentally applied. and it requires an exact
synch ronization as well.
CD
Trigger mode selection
Auto trigger mode :
Since the synchronized sweep alwa ys
appear
s. even though there
exists no signal nor has the trigger adjusting been done
improperly granting that there exists a signal. you have
nothing to worry about that erro rs can possibly arise from the
N
ORM
.
However. where the signal frequency is less than 25Hz. the
cannot
the NO RM positi
be used. At this time. the mea surement has to be
on
.
NO RM trigger mode :
CRT b
trigger MODE
there is no signal, that the synchronization adjusting has b
d
incorrectly adj usted or that the YOLT
improperly positi
TV-V. TV-H trigger m
The
separating the waveform such as a co
(Fig. 2-7(a » into the horiz ontal
adding
of
Trigger M
horizo nta l components of the TV signal
Trigger MODE switch to TV-H. When the TRI
separated (Fig. 2-7
negative/ - ).
eam
appears only when the signal is synchronized.
doc
s not cause the trace to appea r in case that
one
improperly
and
that the venieal POSITION has been
/D
IY switch has been
oned
.
ode
:
cleanly synchronized waveform canbe observed with
mpo
site video signal
and
a TV sync separa t
vertical
compo
OD
E switch switch to TV-Y. For the sync
vertical
ion
circuit,For the sync
nents of the TV signal (Fig. 2-7(b » . set the
compon
(Fig
. 2-7(c».set the
GGERhas
(d».the TV sync polarity sho uld be
hron
ents by
izatio n
hro
nization
AUTO
done
This
een
been
at
of
41
Page 42

@ Trigger point selection
The SLOPE switch determines wheth er the sweep shall start from
the rise-starting poi nt or from the fall-starting point. (See
Fig. 2-8).
Depressed switch r
esents the rise-starting point
and
epr
released switch indicates the fallstarting point.
Q) Trigger level selection
This position represents the starting p
is input with either CH I or
CH2
The signal starting point varies as shown
turning the
TRIGGER
LEVEL control [30] to the left
ointofthe signal which
.
on
Fig. 2-9
by
and
right.
42
Page 43

POSITt
y{
Sl
Ol'{(
'~~
I·ISI..1l1'.... ..1
POSITt.(
sco-r
,/~t(.A
T'Y
l
-,
~
STA8l { Il'I
Sll'C>
I
~'~
I
"
"'
C~lI
(a)
Sawtooth waveform
I
~;HJ"
(b)
I ) STAA
N{ (,Al '';(
I IS lAIlTt
I'«(,ATI';{ Sl
'
~Lt
Pf..>
1.IS"'Alt~
POSlflY( Sl cP {
Square
uec ..\
SLoPE
l'C;
"
~
[
-
POflT
, I
""
".~
-
AT
waveform
LI
j-
i
1
L....,j
-
I
1/ II
u
r-«
~
/ 1
II
'-
f-
-
-
-
Fig. 2-8. Trigger
ll
Y1l
"'"
NO
'::;:...
0
Fig. 2-9. Trigger level selection
Start
--
Poi
point
nt
selection
Page 44

(..0 Additi on and difference measurements
The measurementofthe addition and difference isitfunction
repres
entin
g one waveform by addin g two signals. The operation of
the addition (AD D) represents the algebraic sum of the CH I and CH2
signals, and the opera tion of the difference
algebraic difference between the CHI and CH2 signals.
Measuring procedure
ADD
of
this instrument,
of
follows :
I. Set up per paragraph 2-2-4(2) dual-trace meas urement.
2. Set both V
OLTS/DIY
switch [ 13J and [ 14J to the same
and turn the VARIABLE controls [ 15J and [ 16J fully clockwise
until being click-stopped. Where the amplitude difference
the two signals is considerably large, reduce both VOLTS
switches simultaneously as much as to make the amplitude of the
ar
ger signal be within the screen display.
l
TRIG
GER
3. Select the
4. Set the V.
MOD
switch having the biggest signal.
E switch [ 19] to
ADD
Then, the algebraic sum of the CH I and CH2 signals appea rs as a
signal waveform. At this time, since the position cha nge of
ont
Vertical POSITION c
rols [17] and [18J varies the measurement
values, operation shall be prohibited.
e)
(Not
If the two i
signals ap
traces (e.g. 4.2 DIY
Where the two
the two signals
npu
t signals have the same phase, the two
pear
as the algebraic
+
1.2
DIY = 5.4 DIY).
input
signals have 1800counter-phase,
app
ear as the difference (e.g. 4.2 DIY
represents the
OS·.1I1(~
)I)SRS
pOS1l10
of
/DIY
position)
sumofthe individual
i
-,
as
n
1.2 DIY
= 3.0 DIY).
Page 45

5. If the pop amplitud e of the result
ant
trace is very small
signal, perform the measurement after having a large marking
made on the screen display with adju sting both VOLTS/DIY
switches.
There is another method measuring the algebraic
sum
signals of this instrumenL
Tha
t is the method p
pulling the CH2 Vertical
INY" is marked.
CH2
When the
CH
2 Vertical
signal has the same
difference
of
amplitude (e.g. 4.2 DIY - 1.2 DIY = 3.0 DIY).
If the input signals have 180
will be the arithmetic
= 5.4 DIY).
(5)
X-V operation
The internal time bases
deflections of both the
erf
orming the measurement at the same time when
POSmON
POSmON
pha
se, the waveformofADD
0
sum
of
the amplitude (e.g. 4.2 DIY +
control [ 18] on which'PULL
cdntrol is pulled
will be the
of phase difference, the two signals
are not used in X-V operation
vertical
and
horizontal directions are all
operated via external signals.
Trigger switches
inoperative in the
Proceed with the
I. Tum the TIMElDIY switch [22] fully clockwise to its
and
their associated controls
X-V
mode.
X-V operation as follows :
and
connectors are
position.
Caution :
When
spot would damage the
appearing as the spot without being swepts, the
CRT
the trace intensity to prevent
phosphor.
it
from becoming too
brighL
( *
05
-3060D: Press X-Y switch on the horizontal display [
2. If .you apply the vertical signal to the CH2, Y IN connector
[ 10]
and
the horizontal signal to the
the trace
Th
en, adjust the trace to the proper brightness.
appears.
3. Adjust the trace height with the
the trace width with the
PULL
The
X5
TIME
MAG
switches [ 15] [16] and the VARIABLE as needed.
VARIABLE control [25] is measured when it remains
CH
I VOLTS
CHI
, X IN connector [9],
CH2
VOLTS/DIY switch [ 14]
/DIY
switch [ 13]. Adjust the
pushed in.
of the two
and
the input
and
the
X-V
As
such, reduce
21
))
1.2
DIY
and
45
Page 46

4. If you wish to move the waveform vertically rv axis). adju st
the CH2 Vertical PO
Horizontal PO
Sm
ON
ON control [ ISJ
eonlrol [26J when you inte nd to move the
and
adjust the
Sm
waveform hori zonta lly (X-axis).
(The CH I Vertical POSITI
control
[17]
docs not opera te in the
ON
X-Y mode).
5. The phase of the vertical
(Ysaxis) signal
can
be inverted ISo'
by pulling the CH2 Vertical POSITION knob [ ISJ.
(6) Delayed-time base operation
OS·
3IXXI
The
DSRS contains two axis.
immediately up given with trigger,
axis. They are used to measure the
The
A time axis start sweep
and
B time axis starts 2nd time
com
plicated andhorizontally
magnified waveform.
CD
Basic delayed sweep. For delayed sweep, proceed as follows
A. Set up the inst
desire.
B.
Make
sure the B T
C. Press the A INT
rument
for whatever vertical mode you
RIG'Dpushbuttonis o
HORIZ
DISPLAY pu
ut
shbutton
. A sectionof
tracevs) will brighten.
<Note> The intensified portion will be quite smaIl if
there is a large difference between the setting
the A and B TIME
um
D. T
the B
TIME/DN switch [23J until the intensified
portion of the trace widens to an
portion of the trace you wish to
um
E. T
intensificati
the DELAY
on
TIM
over the portionof the trace you wish to
/DN
switches.
amo
unt eq
magn
ify (see Fig. 2-6(b) ) .
ual
E POS control [24J to position the
magnify.
HORI
F. Press the B
Z DISPLAY pushbutton.
trace intensified in Step 5 now appe
of
the full width
the CRT screen.The trace now displayed
is being swept by the B timebase
onal
G. If needed, additi
enlargement is possible by pullin g
the A VARIABLE knob [25J for
ar
(F
ig. 2-6Cc)).
PULLXIO
That
s as spreaded over
MAG.
the
of
to the
portionofthe
-16
Page 47

® Triggered B sweep
In basic delayed sweep, the
signal
comparate
problem with this is that mai n
in the
(100 : I
To prev
itself, or a time-relate trigger signal. The DELAY T
control
sweeps : the actual delay time will be that plus the additional
time until the next available trigger.
actual delay time is variable only with step resolution, in
increments of the interval betwen triggers.
The maximum
thou
@
For
A. Set up the scope for basic delayed sweep as described in
B. Press in the
event, it begins when the main (A umebase) sweep cross
level scuing by DELAY
B sweep at higb ratiosofA to B
and
up).
ent
this, the B sweep can be triggered by the signal
then
determines the mini
mag
nifica tion possible by this tec
sand
times. (CRT brightness be
triggered B sweep, proceed as follows :
the preced ing paragr
B
TRIG'Dpushbutton[21], and adjust the
Trigger LEVEL control
now triggering on the same trigger signal as the A
timebase. Th e stan of
trailing edge of the trigger signal : turning the DELAY
TIME
POS
control will not change this.
B
tirncaxis
tirn ea xis jitter becomes apparent
mum
aph
s.
[3
oJ
if necessary. Th e B timeaxis is
B sweep will always be a leading or
is not triggered by a
TIME
ing
POS. knob. The only
TIME
/DN
IME
delay time between A
Th
e result is that
hnique
the limiting factor.
switch setting
POS
and
is several
B
,)7
Page 48
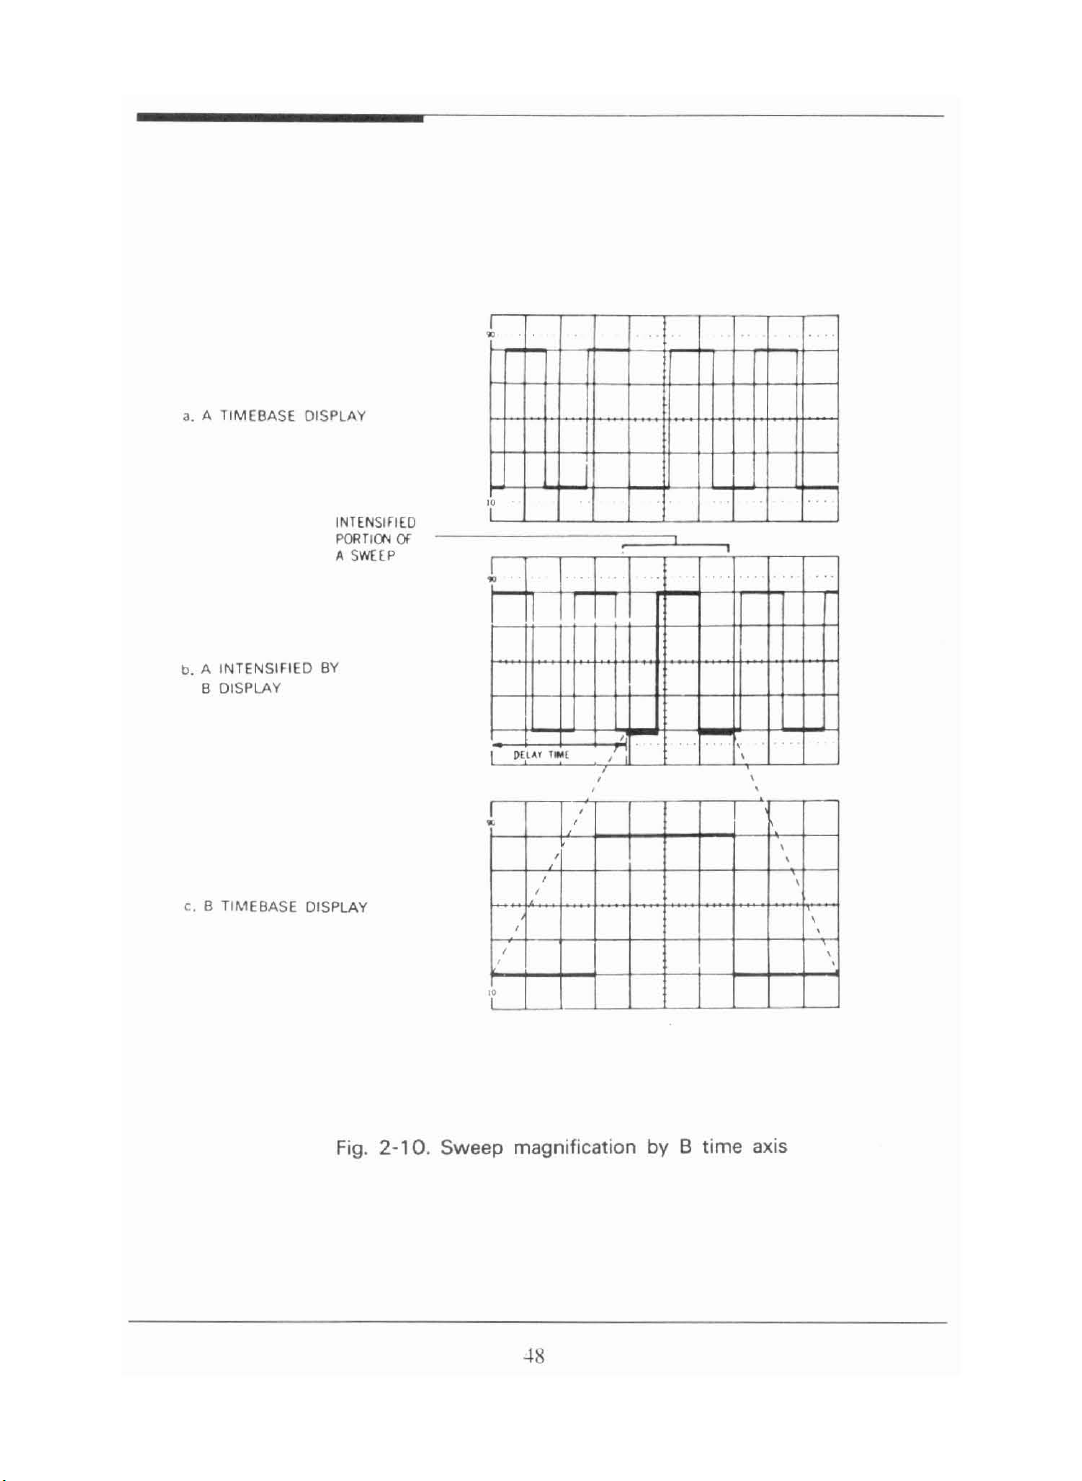
a. A TIM EBASE DIS PLAY
~
INTENSIFIED
PORTlCN
A SWH P
b. A INTENSIFIED BY
B DISPLAY
C, B TIME BASE DISPLAY
Of
'f
,
,
l
..
T
PH~1
, ... (
1
,
,
7
,
,
,
,
,
,
,
'I'
. . .
,
,
,
,
,
,
,
Fig.
2-10.
Sweep magnifi cation by B time axis
Page 49

2-2-5. Digital storage function
Digital storage function operates in the following sequence :
(j
) NORMAL storage mode (NORM)
CD
NORMAL storage mode (NORM) displays the waveform to be stored
in the real mode.
(%)
Press storage switch.
Q) Wav
® When TIME
ef
orm sweeps all the trigger devices depending on the
setting of adjustor in the front size.
stored is displayed on the
retrieval
about three seconds to retrieve
sweep range of 0
that time.
If sweep speed is low, therefore, waveform is not displayed on
the CRT immediately
side.
repeated waveforms may be stored.
and
displayofwaveform require more time. It takes
.1
s/div. Trigger signal is generated after
/DIV
fadjustor is between
CRT
upon
adjusting the adjustor on the front
The
waveform to be
. It sweep speed is low, the
and
display waveform in the
51'S
/div
and 0.2s
/div
® Pressing HOLD switch in NORMAL STORAGE mode stops the correction
operation by CRT display, and the CRT display stops.
Equivalent sampling mode (EQUIV)
(2)
When TIME / DlV switch is set between
*OS
-:\OW
D:0.1
~
I
EQUIV mode. Pay attention to the followings in this
CD
The edge initially rising or dropping in trace (left end) may not be displayed
in the repeated mode range.
of waveforms appearing after the firstone.
/div-2~
/div)
The repeated waveform can be stored in the
In this case, measure the rising or dropping edge
0.
21'S
/div and
21'S
mode:
/ div.
the intermittent and
49
Page 50

I
17
t-,
1/
)
The edge initially /
rising or dropping
(left e
in trace
may
not
in the repeated mode
range.
@
It
(for
nd)
be displayed
takes longer than 5 seconds to store input signal below 1kHz
200Hz
input
Fig. 2
).
V
l-
-f
I
I"
f\
-11.
EQUIV mode
In this case, measure
the risign or dropping
I---
of
edge
appearing after the
first one.
G
® The noise may be included when storing low frequency signal. It
is desirous to use spherica l wave with rising time shorter
O.3
~s
or sine wave with frequency
Note : Sampling rate in storage mode :
When
total hori zontal scale
sampling data.
there is no horizontal
of
higherthan
magn
IOdiv.
lMHz
.
ification in storage mode ,
on
CRT is composed of 1000
waveforms
than
so
Page 51

(3)
ROLL mode
The
displayed waveform flows to the left from the right.
int
Correction po
the signal lower tha n 100Hz or so. To stop the ROLL mode, press
HOLD
switch to hold the final waveform on CRT.
for new data and ROLL mode make it easy to measure
CRT
(~
I
I \
II
•
•
\ I
\
·
.
•
·
\
IJ
\)
xisting
E
Note a) ALIASING distinction
data
If
the
the sample clock frequency is added in the sweep range
when measuring signal in storage mode (NORM, AVG ),
ALIASING occurs.
In this case, the waveform obtained by sample clock
frequency from the input signal frequency is displayed.
This
waveform may be regarded as
If
ALIASIANG is doubtful , convert into REAL
\ I 1\ 11\ I
\ I \ I \ I \ I
\
11
\ 1
\11
Stored data
Fig. 2-12.
input
signal
ROLL
hav
<
•
."
,
·
•
•
\ T .
•
ngger P
'II
ing frequency higher
!
new data.
New dat
mode
correct
oint for
a
thanahalf
TIME
mode to
it
check whether
being measured.
It
ALIASING
signal frequency - sampling clock frequency) is displayed
with its top and bottom section nearly flat. So
possible to decide ALIASING in
difference between these two displays.
is same as the operating mode display
occur
s, the waveform
SI
of
NORM
con
sideration of the
mode (input
it
is
Page 52

b) ROLL wavef
ROLL
orm
correction
mode is possible in high speed ran ge (up to
O.5s/div.l . If vertical mode is set to DUAL, the
waveform
endin
dep
display rate. In reality, the wavef
(4) Single operation in
docs not move smoothly at O.Ss/d iv. which occurs
g on the relation between the waveform data and
orm
is normal.
NORM
mode
With storage mode set to NORM, pressing SING LE switch performs
NORM
mode srnapiing, and renews the wavef
it
aut
omatically converts into
Q) SING LE operation procedure
a) Set storage
modetoNORM,and
store and display
od
b) Set trigger m
such a location as suitable to measure input signal.
c)Press
@
Pr
essing SINGLE switch
SINGLE
e switch to NORM,
switch
HOLD
input
signal in the operation mode.
con
standby state. Wh en trigger signal is applied, the
sampling is carried out. The
input
light up when the
signal trigger is not detected.
orm
state.
verts into
SINGLE
on the tube surface.
Then
adjust the adjustor knob to
and
set trigger level to
input
signal trigger
SINGL
E
switch LED continues to
If
trigger signal is applied or trigger mode is set to AUTO,
GL
OLD
E switch L
state. (Hold
SIN
H
® When trigger mode switch is set to
ED
goes out, and automatically converts into
LED
lights up).
AUTO,SINGL
E treatme nt is
performed if inp ut signal is not triggered. So the DC signal
can be measured in this mode.
@)
Wh en trigger signal enters in N.ORM mode, the
cur
s for the waveform
oc
and
all the
data
renew the tube surface into new wavef
datacorr
esponding to
NORM
one
tube surface,
sampling
orm
data
This fun ction is effective in storing the instaneous waveform.
GL
Note : SIN
state.
perf
E does not operate in averaging, ROLL, EQUIV or
When
orm
vertical mode is dual (AL
s signale operation.
T),
CHI
(or
CH2
.
MAG
)
Page 53

(5)
HOL
D mode
Pressing
In this mode, sampling operation stops in each operating mode.
When mode enters into
continuously displayed.
mode are set, the waveform
(6) SAVE operation (SAVE)
The waveform data sampled
stored in the storage memory.
memory can be displayed on the
SAVE operation
HOLD
switch in EQUIV,
HOLD
When
the waveform
data
and
Data
NORM
mode, the waveform display dataare
can not be moved vertically.
displayed in storage
CRT
or ROLL mode sets H
data
displayed after
which .are stored in the storage
.
(D Use SAVE switch to set the storage memory concerned.
@ Sampling data are displayed in storage mode. Press
to stop waveform.
@ Pressintg SAVE switch saves the suspended waveform in the
storage memory.
CD
When
that waveform is stored.
® When vertical mode switch is set to
is stored storage memory A
switch. When vertical
is stored in storage memory A while
storage memory
(7)
Storage memory display (
The details stored in storage memory in
the CRT in next
(D Pressing this switch once, recall switch displays
waveform stored in storage memory A
and
this switch Once more, the waveform stored in storage memory B
is displayed. Pressing this switch one more time displays b
the waveform stored in storage memory A and B
value.
Pressing this switch again erases di
value.
@
The
vertically.
storage switch
TIME
/ON
waveform
LED
lights up instantaneously, it means
CHI.CH2orADD
and
B in tum whenever pressing SAVE
mod
e switch is set to
CH
B.
REC
ALL)
HOLD
ope
ration,and comparable with current wavef
) regardless of vertical mode switch. Pressing
spla
data
displayed in storage mode
DUAL
2 waveform is stored in
and
the set value (V/div.
yed waveform
, CH I wavef
mode are displayed on
both
and
cannot
mode
HOLD
the
the set
and
be moved
OLD
HOLD
can be
switch
, waveform
orm
orm
.
oth
set
mode.
53
Page 54

(8) x-v plotter output (PLOT)
Waveform displayed in
RS-232C by pressin g
HOLD
PLO
T Sf\V.
(PLOT switch operates only in
10 item 3 for
Refer
(9) Horizontal magnificati
mor
e details.
on
display (Time axis
There are two horizontal maganificati
operatio
I. Magnification (XIO) by XIO
2.
(I)
n:
HOLD
XIO MAG
waveform magnification by T
Displayed waveform magnified ten times from the center of
orm
original wavef
The
wavef
orm
in the tube surface storage.
which is slored in save memory cannot be
magnified.
Gi)
Pulling XIO MAG switch displays
times from the ce
lIE
If it is displayed on both sides of CH I
nter
Idiv. sector magnifie s ten times from the center of CH I
and
CH2
original waveform.
mode is sent to X-V plotter throu gh
HOLD
MAG
of original wavef
rnode.)
MAG
on
methods in storage
switch.
IME
/DIV.
ldi
v. sector magnified ten
orm
.
)
and
CH2, the
CHI
CH
Original state
Magnified state
2
Fig.
2-13.
5-1
X10
MAG
Page 55

(j))
When switch is released by pressing XIOMAG
returns to the original waveform.
(2)
HOLD
When
mode,
wavef
orm
magnifiaction using
TIME
/DIY
storage waveform is displayed on the tube surface in
manipulatingTIME
/DIY
switch makes it possible to
continuously magnify and displ ay up to ten times the
switch set value. Magnificati on is done fromthe center of
original wavef
orm
as in (
I)
.
[Exampleofmagnificationoperation]
Gil
Display the original waveform
(j))
T
urn
TIM
E/DIV switch clockwise to change
set value. When
TIME/DIY
and
set
HOLD
TIME/DI
set value is cha nged on the tube
surface waveform is magnified as correspond ing to the set
value.
switch, it
switch
TIME
mode.
HOLD
/DIY
V to rapid
55
Page 56

(i)
Original
TIMEIDIV
HOLD mode
(ii) Rotating TIME/ DIY
switch. it magnifies
two times with TIM E/
DlV = O.5ms/d iv.
lms/div
CH1
CH
CHI
CH2
fV\II.NVINIM
2
JL
WJ
UUULU
fV\NV\
.JLJLJUUL
(iii) Rotating TIME / DIY agam
switch, it magnifies
ten times with
OlV
= O.5ms/d iv.
@ This operation performs horizontal magnification up to ten
times. Therefore TIME
origina l waveform. But
waveform is not magnified any more even if you turns
TIME/OIV
@ When magnification is displayed, the magnification rate is
grad ually reduced and returned to the original waveform by
selling the TIM E
turning TIME
TIM
E/
/O
lV switch
TIM
E/OIV display is not cha nged
clockwise beyond that ext
/OlV
set switch to the slower side while
/OIV
switch cou nterclockwise.
CHI
CH2
Fig. 2
can
~
-FL
·1.
HOLD waveform
magn ification
set a tenth the
ent
and
) 6
Page 57

(10)Interpolation
As the horizontal magnification rate increases, sine wave loo ks
stepwise and pulse wave g
In this case, interpolationmakes it easy to watch the waveform.
Interpolation is divided
oes
amiss.
int
o linea r and sine interpolations .
Every time you press MEN U selector switch, interpolation selectio n
function converts as follows :
--->
Linear
The current
sweep factor on
lin
ear/sine interpolations
interpolat
int
erp
the
ion
--->
sine interpolati
olationmode is
bottom ri
make
ght
s pul se/
on
--->
no
int
erp
olation
indicat
ed as symbol on the sweep
of tube surface. Selectin g
sin
e wave of
input
clearly displayed on the tube.
(j)
Indi
cate the original waveform,
(2) Carry out hori
TIME
/DIY
. switch,
displayed
(Refer to
on
(9) hori
magnifi cationoperatio
(3)
In (2),
whenever
int
erp
pr
essing
zontal
magnification di
and
have the waveform to be
the tub e surface.
zontal
magnification display for h
n).
olation proceeds in the following sequence
INTERPOLATION
and
set
splay
switch.
the
HOLD
using
mode.
XIO
interp
orizontal
signal
MAG
olated
or
Linear inte
rpo
lation '
Fig.
Sine inte
2-15
57
rpo
latio n
Interpolation
No
int
erp
olat
,
'-
ion
Page 58

In X I() MAG magnilication, pressing X I() MAG after interpolation
stops interpolation and normal magnification display enters
effect.
into
In normal magnification, pulling X10 MAG after interpolation
stops interpolation and X10 MAG magnification display enters
into effect.
(II)
ALT MAG mode
An original waveform and magnified waveform arc displayed simultaneously.
When awaveform of CHI displayed and ALT MAG mode is selected,
the original waveform and its maguified waveform are displayed
simultaneously.
To perform
mode
VERT
ICAL
the ALT MAG display
10 CII2 first, and then set in the ALT MAG mede.
~
IODE
ClII
CII2
DUAL DUAL(CHl. CH2l
ADD
NOR
MAL
DISPLAY
CIII WAV
CIJ2WAVE
WAVEF
ADD(
WAVEFORM I ADD(CIIt + CIJ2)magnified waveform
Ef
FORM
ORM IDUAL(ClII
CHl+CIJ2) ADD(ClI l + C
of
a waveformofCH2, set the vertical
ORM CHI origi
CHZoriginalwaveform
DUAL(CIII,( 12)original
nal
waveform
MAG
ALT
/ CHI magnifie
ICH2magnified
waveform
+C
H2)magnified waveform
1I2)
originalwaveform
d.
waveform
waveform
EX) ALT MAG OPERATION (CII I)
I) ScI the
Press IIOLD switch to stop waveform,
2)
Use MENU switch 10
3)
4) Manipulating TIME
and display up to ten times the TIME
S) Move the CURSOR
The magnified waveform is displayed at approximately 3div below
6)
vertical mode 10 CHI first, and displayed the waveformofCH I
se
rALT MAG mode and then select ALT MAG on.
IDIV switch makes it possible to continuously magnify
IDIV switch set value,
10 a magnified point by the MAG POINT cursor
the original waveform
f-
:
Magnified
l
ellI original
-
CH1
Initial
ri
g. I - I
magn
ifiedwaveform
wavef
orm
5X
Page 59

(12)
GO-NOGO
The
GO
judge
ment
mode
-NOGO
domai
judgement
function is used to
n (Boundary)
se
TI,e input signals acquired in sequence are
When
the re
sult
s satify the conditions (COMPARE. HO LP ). these processing
arc performed automat ically.
This function is used to monito r
frequently,
or
to detect undesired
from the reference signal.
judge
if te acquired signal is in the
i on the CRT screen.
compared
ah
nonnal
sam
pheno
ples which will output signlas different
with the boundary,
mena
which will
occur
not so
GO-NOGO
I)
GO-NOGO
condition. (
CA
RE
2) Use M
3) Selet the condition to
<D
When a w
OPERATION
is perform
The
mode AVERAGI NG . R
ed by limited co nuitions please confirm the operating
LL other than operating).
ENU
switch set
GO-NOG
issue GO -N
avef
orm
is out
of
the judgement
® " is onl y co mparing
4) Usc
5) To perform
6) XH : Comparing wavefo rm in the
MEN
U selector switch set G
pressing
OH
MEN
U selec tor switch
O.4div
GO
--7
-NOGO
O.8div
operation, press RC
cha
--7
: If the result waveform is outofthe judgme nt domain
Holds a waveform on the screen.
ope
ration
I
I
I
"'"
I I
I
''j;
,
I
OLL
, MAG. D
UAL
, SING LE,
O mode.
OGO
from the following two option.
domain
O-NOGO
judgement
domain
.
nges mode in the follow ing seq uence.
1.2div
ju
--7
O.4div
ALL
Switch
dgme nt dom ain
rcsulls
(HOLD
-
I
I
I
I I
,
•
j->
I 1
)
I
,
I
,
~
.
1/
'-(
(13)
MENU
mode
Fig. 1
-2
59
Page 60

Using MENU switch. it is possible to set interpolation. wavef
smoothing ON/OFF in average horizon tal magn ifi
pressing MENU switch. [ PROB], [SMTH], [AV
appear on the top of CRT one by one and
Pressing the switch again release s
<D
Probe factor selector mode (PROB)
WhenMENU
right of CRT, you c
LED
lights up and
an
select
MENU
PROBE
mode, and
[PROB
factor.
XIO
cat
ion whenever
G],
[ROLL] and [ ITPL]
LED
lights np.
LED
] is displaye d on the top
I X
10 X
PROBE
PROBE
Xl
orm
goes out.
Using
mode.
@ Smo
When
right
menu
oth
ing selector
MENU
of
CRT,
selector switch, it is possible to select XIO/XI
mode(SMTH)
LED
lights up
SMOOTHING
and
turns
tSMTH]
ON
/OFF
rs-r~-r~-r~-r--r- -r- 0- r; -r-F
l _ _ L _ _ L
__
l _ _ L _ _ L
__
l _ _ l
IT
In
OFF
state, storage waveform is displayed in dots.
urn
ing it
T
wavef
gna
si
it is displayed with ampl itude low. In this case, set
smoothing mode to
similar to that
ON
, the dots are connected to display smooth
orm
. If sampling frequency is low in connection with input
l (when signal with more
OFF
of
inpu
t signal.
than
5 cycles
to display the waveform with amplitude
is displayed on the top
.
-1
__
l _ --.J
OFF
:
~l
SMOOTHIN
ON
:
SMOOTHIN
per
each sector),
G
G
60
Page 61

Q)
AVERAGING
When MENU LED
right
of
CRT, the
The
number
selector switch.
from 4
The
Ibm
average waveform is displayed after
the set sweep
the
number
setting
mode
lights
numberof
of averaging operations is changeahle using
Pressing
256.
number.The
same
as the
waveform display is corrected.
Thus
it is possible to detect non-repetitive signal
influence by non-trigger noise.
The
numberofaveraging operations is same as the set average
number
. In
ROLL
mode, no averaging
(AV
G)
up and [AV
G]
averaging operations
NORM
4
16
64
256
MENU
numberofsweeps,
selector switch changes
dataisobtained
averageofnext
operation
is displayed on the top
can
be set.
MENU
NORM
for
dataisohtained
and
the average
under
in
the
is carried out.
61
Page 62

<D
ROLL selector mode
When MENU LED lights up and [ ROLL] is displayed on the top
right of CRT, ROLL ON/OFF can be selected.
r~-r~-r~-r~-r - -r- -r
l
__
L
__L__
L _ _ L
__
l _ _ L
-0
__
- r
~
l _ _ L
-r - -1
_-J
ON
OFF
ROLL ON/OFF is carried out using MENU selector switch.
® Interpolation selector mode (ITPL)
When MENU LED lights up
right
of
CRT. you can select interpolation.
and
[ITPL] is displayed on the top
OFF
SIN
LIN
Mode is selected using
MENU
selector switch. Pressing this
switch changes mode in the following sequence :
.....
SIN
.....
OFF
.....
LIN
Interpolation is
LIN
10 interpolate the magnified waveform data
when magnifyin g the display waveform horizontally (excluding
storage wavef
orm
). In
OFF
position, waveform is magnified
horizontally. In SIN position. the initial waveform becomes
similar
state, considerable ranging takes place.
10 sine wave.
If
the square wave is connected in this
and
the displayed
waveform looks different from the input waveform. In this
case. set switch to LIN from
OFF
. In LIN position, data are
interpolated linearly and waveform is displayed more smooth ly
than
in O
FF
position.
Page 63

Note In SIN position , set the amplitudeofinput signal below
8 DIV on
connected on the
CRT
. If any signal with large amplitude is
CRT
, tortion is observed in the top
bottom sector of waveform. After waveform stops in ROLL
mode, the interpolation operates depending on the
selection between
waveform does not stop, both the MAG XIO
MAG
XIO mode
and
TIME/DIV.IfROLL
and
interpolation modes do not operate.
® ALT MAG selector mode (AMAG)
When MENU LED lights up and [AMAG) is displayed on the top right
of
CRT, you can select ALT MAG.
and
OFF:AL
T MAG
OFF
ON:ALTMAGON
ON/ OFF can be selected using MENU selector switch.
® GO-NOGO selector mode (G-No)
When MENU LED lights up and [G-NO] is displayed on the top right
RT,
T
of C
I)
XH/OH can beselected using MENU selector switch.
2) IF XH mode (or OH mode) is selected,
you can select GO-NOGO.
r----.-
----.
--,----.
-,---.-
----.
-~
~
O.4<1iv:JUDGEMENT
0
.8div
:JUDGEM
1.2dIV
:JUDGEM
~-,_~~
T
XH:COM
OH: HOLD
PAR
E
~
T
DOMAIN0.4<11'
ENTDOMAINO.8<l1v
ENTDOMAIN1.2d
IV
Pressing MENU selector switch changes mode in the following sequence
O.
4div
--->
O.8div
--->
1.2div
6.1
--->
O.4div
Page 64

® Menu display in the mode " the than MEN U mode
In the modes other than MENU, the setting information of the numbe r
average and the smoothing is displayed as follows.
of
EQ
UIV
:EQUlVALENT
(0.
2J.o/
div(60MHLO.IJ"Jdiv)to2",1
NORM:NORMAL
(5",1
div
to0
ROLL:ROLL
MODE
(0.5s1divto0251div)
SAMPLING
SAMPLING
.15
1div)
BLANK
AV4:4times of
A V 16:
[
AV64 :64
AV256:256times of average
div)
:NoIaverage
average
16timesofaverage
1ime
sof
SA:
[
SB:SAVE
average
t;
SAVE
BLANK
Memory
Memory
mOO
thingon
:Smoothing off
A
B
Page 65

(\ 4) X-Y operation
The
interna l time axis is not used for ,X-Y measureme nt.
opera
X-V
I. Set the vertical mode selector switch to
(
If
2. Pressi ng
HOL
tion is carried
it is set to
CHI,
HOLD
D mode. Th en sampling operation stops whil e waveform
out
as follows :
CH2
or AD D, erro r may
switch in EQUIV, NORM or ROLL mode enters into
display data arc displayed continuously.
urn
3. T
A TIMEIDIV switch [22J completely clockwise to X-V
position . ( * OS-3
X·y
)
()('()D
: Set horizontal
(Note) :If it is displayed in dots
ent
fluoresc
surface of CRT may be damaged.Ifthe
brightness is to high, lower it.
DU
mode
" lector switch to
and
not deflected, the
AL.
OCCU
R) .
65
Page 66

2
-3
MEASUR
This section contains the measurem ent procedures applying basic functions
of this instrument.OS-3
Though only some of them arc introduced, we assure you that a variety
specific mea
As the measurement applications set out herein are the important and
essential particulars, it is desirable for you to
with those basic operating proc
Amp
2-3-1.
EMEN
sur
litude Measurem
T APPLICATIONS
02(J
().
ement can also be performed based on the said functions.
mak
e yourself familiar
edur
es while you use the oscilloscope.
ent
The latest trigger sweep osc illoscope has two majorfunctions.
amp
The first of these is to measure the
It
is practicable to perform all the measurement with the oscilloscope
r
angin
g from th e simple waveforms to the complex ones.
Th
e oscilloscope in general has two different voltage measurements,
namely peak-to-peak
(1'-1') measurement.
Instantaneous voltage measurement is to measure the voltageofeach
point on the waveform from a ground reference.
In order for you to p
(1'-1') measurement
erf
orm the aforementioned
make sure that the VARIABL E controls are fully t
(J) Peak-to-Peak (1'-1') Voltage Measurem
1. Set up the vertical
ma nner as that set out in
2. Adjust the TIME/DIV switch
waveform
of
mode
switches
2-2. BASIC MEAS
as many as two
[221in such a manner as to form a
or
shall he so adjusted as to ma ke the wavef
litude.
and
ins
tantan
eous peak-to-peak
measur
urned
ement
s exactly,
clockwise.
ent
of
the oscilloscope in the same
UREMENTS.
three cycles and the VOLTS/OIV switch
orm
be on the CRT screen
display.
3. Adjust
make
of
line
the Vertical POSITION contro ls 1
the end of the wavefor m align with the horizontal grariculc
the CRT screen display. (See Fig. 2-7).
171
and [ IXI properly and
of
4. Adjust the Horizontal POSITION control 1261 and make the end of the
waveform be on the central vertical lineofthe CRT scree n display.
(This line is graduated in 0.2 scale divisions) .
66
Page 67

5. Co unt the
numberofdivisionsofboth the top and botto mofthe
waveform and multiply the resultant number by the value
/DIV
VOLTS
For
examp
the wavef
would in fact be 8.0
switch. thus result ing in the peak-to-peak voltage.
le, if the value of the VOLTS/DIV switch was set to 2V when
orm
same
as that shown in Fig. 2-16 had bee n measured, it
Vp
-p,
(4.0divX 2.0V= 8.0V)
ind
6. If the
mea
ication of the vertical magnification is X5, divide the
sur
ed value by 5.
However, if the probe is 10:1, multiply the voltage by 10.
7.
When mea
set the AC-
lIT
CA
surin
ION :
g a sine wave below 100Hz or a squa re wave below 1KHz,
DC
,GND switches to DC.
Wh
ere the waveform
voltage, the above mea
At this time ,
AC-DC,GND
perf
switches to DC.
(Wh en the mea
For
any
:
instrument
is lo
aded
with the high potential DC
surement
orm
the measurement with setting the
is difficult.
surementofAC com po
equipped
with readout function, movin
of
nen
t is needed).
the
cursor to the top and bottom of wavef
poten tial differen ce V on the screen.
antan
(2) Inst
1. Set up the vertical m
manner
BASIC
2. Adjust the
eous Voltage
as
that
set out in 2-2.
MEASURE
TlM
E/DIV switch [
Measurement
ode
MENT
switch of the oscilloscope in the same
above.
221
or [23I so as to become a complete
waveform ' and set the VOLTS/DIY switch to prod uce 4 to
(See Fig.
3. Set the AC
4. Turn the Vertical POS ITION control [1
with eit
positive (%) signal) or the up permost
2-(7) .
-DC,GND
her
the lowest central horizo ntal graticule line (in case
switch
(I
I)
or (12) to G ND.
71
or [ 18] and make it align
one
(when the signal is
ncgativef-) ) .
NOTE
: The vertical PO
SITION
cont
rols must not be touched until the
measure ment is completed.
orm
displays the
6 divisions
of
67
Page 68

5. Set the AC/
If
the sig nal is positive ( ,1 ) . th e
refe
renc
appears
C
AlJrION : Wh ere the DC volta ge is relatively greatly l
6. Make the p
graticulc lin e
Gt'O/OC switch to DC.
wavef
orm
appears above the gro
e lin e and where the signal is negative
belo
w the ground reference lin e.
with the wavef
from
oth
oint
you wish to measure align with the central vertical
on
the CRT screen display by movi ng the Hori
orm
, then measure the AC portion separately
ers with selling the AC-OC ,GN O switch to AC.
(-
POSIT ION control lZo].
Since the
0.2 division, the mea
In the example cited for Fig. 2-7, if the VOLTS
positioned at 0,5V, the value bec
7. If the X5 ma gnified mov
in para
the re
8. After setting
curso r
cent
graph
sultant
(+
) to
ral vertical gra tieulc is graduated in sca les at every
surement
is easy to p
erf
orm
/OIV
ome
s 2,5V (5,0 divX0.5V= 2.5V).
ement
6 above by 5
is performed, divide the value mea
and
where the XIO P
value by 10.
READ
OUT
cursor (X)at
the
waveform to be mea
theGNO
sured
dis
voltage on the screen.
), the
.
ROBE
level, posit
pla
ys the ins
wavef
orm
oad
ed co mpa red
zont
switch is
is used, multiply
ionin
tantaneou
und
al
sur
g
ed
1:0.
s
68
Page 69

Fig. 2
I
I
.l
: I
~
L
I
I
I
i
(
1\
\
.
iI
,
l
\
\
!I 1\
i i
1\
,
I
I
I
.
J
)
i 1 $
·16
. PEAK·TO·PEAK VOLTAGE MEASUREMENT
.l
!
T
>
H
o
.,
VE
RTIC
DISTA
~
Fig. 2
I
I
AL
NCE
I
11
I I
I
I
REFERENCE LINE
·17
. INSTANTANEOUS VOLTAGE MEASUREMENTS
69
I
~
5 DIV
Page 70

2
-.3-~.
Time Interval Measu rem
ent
s
The second most important measurem
oscilloscope is the very measurement of time interval.
Since the divisions uniformly marked
calibrated to the time bases. the time interval measurement is
prac
ticable,
(I)
Basic Tec
hniq
ue
ent
of the synchronous-sweep
on
the CRT screen are all
The basic techniq ue for measuring time interval is described in this
section. In addition. characteristics measurem ent and variation
techniqu e using this technique will be helpful. if you apply the
following procedure
I. Set up switches in the same
, Set the TIM E/DIV switch
s:
manne
[n
] in such a manner as
r as that described in 2-2-4.
to
make the
\\ aveforrn appear on CRT screen display as large as possible.
Tum the TIM E VARIABLE control [25J fully cloc kwise until being
clickstopped .
Otherwise you so do. the measured value will be
requiring you to exercise due care.
ina
ccurate. thus
3. Adjust the Vertical POSITION controls [17] and [18] and make the
waveform you wish to measure align with the central horizontal
graticule line.
-+
. Turn the Horizontal Position control [26] and make the left side
of
the waveform correspond to the vertical gracitule line.
5. Cou nt the
numberof
to measure. Horizontal central line is graduated in divisi
graticule divisions up to the point you intend
on
s
ranging to 0.2 division.
70
Page 71

6.Ifyou multip ly the value mea
E/D
by the TIM
IV switch. the time you wish to measure will be
obtained. If the T1MEIVRIAI:lLE knob 1251i, pulled
mode). divide the measured value by
sur
ed in Item 5 above by the value set
(X I(J magnified
10.
(2) Period . Pulse Width . and Duty Cycle Measurement
If you make good usc of the measurement based on the basic tech nique.
you can also measure the perio d of
pulse, pulse width,
and
dury cycle,
etc. When a complete period of pulse of the signal appears on the CRT
screen display, the period of pulse of that time can be measured.
or
example, if the TIME/DIV switch were .set to lOms, the measured value
F
one
of
cycle between A and C in Fig. 2-9 would be a waveform havin g a
period of cycle of IOmsX7= 70ms.
The pulse width represents the time between
In Fig. 2-IS, it is
1.5
division so that it becomes 1.5div X IOms=
15ms. However, in this example, as an 1.5 divisi
TIME
distance, should you set the
/ON
A and B.
on
is a rather short
switch to 2ms, it would be seen
magnified as shown on Fig. 2-ISb.
Then , though the pulse is short, the measureme nt accuracy becomes
increasingly better. Where it is still disp layed small even with
adjusting the TIM E
switch, it is advisable to perf
orm
the
/DN
measurement under XIO magnified condition by pulling the A VARIABLE knob
(25).
When pulse width and period are
kno
wn, dury cycle
can
be calculated.
Duty cycle is the percentage against ON-time of the pul se period (total
ON-andOFF
of
-time).
In Fig. 2-IS: the duty cycle is as follows :
D ty I
u cyc e Period - A C
(e. g) Duty cycle
lit Mea
The dury cycle of required wavef
(%)=Pul
sur
e the cycle by moving cursor. Th en measure the pulse width.
se width X100- A B
(%)=j~:~
X 100=21.4%
X 100
orm
is obtained by applying the
measured value to the formula.
71
Page 72

A 8
c A
r~
~T-~
!
i
'r
I
f-t-
....
+ •
l
1-+
+1
8
,
I
,
I
i
I I
I
i
1
.
1
1
+1
~
'H
I
•
(a) roms DIvIS ION
Fig.
2-18
. TIME INTERVAL MEASUREMENT
lb) 2mS DIv IS ION
2-3-3. Frequency Measurement
Whe n an accurate mea
If
used.
you have the frequency cou nter connected to the CH I
sur
ement is needed, a frequency counter shall be
connector [20] on the rear panelofthe oscilloscpe, you will enjoy the
convenience
frequency measurement simultaneously. However, w
is not availabl e, the oscilloscope can directly meas ure the
orm
wavef
the waveform bearing a lot
period. First of all, in brief, you can simply
calculating with I/t as
appea ring in section 2-3-2
formula of
Hertz
rH
oh
ertzC
kil
and
advantage to perform both the waveform observing
that
can
hardly be measured by
of
suming
TimeInt
1/t.
when
period is depicted in seconds, the frequ ency is
z) ; period in millise
kf-lz
r . period in microsec
hen
a frequency counter
modulat
meansofa frequency counter,
noise.
that
cond
Frequ
ency is interrelated to the
obtain
the frequency by
you' hav e already known the period t
erval
Mea
surement.
With
svms) yields frequency in
ond
s (
IlS)
yields fr
equ
ency in
rnegahertzt.Ml-lz).
Th
e accuracyoffrequency is determined by an accurate calibration
the timeba se
and
careful mea
surement
of the period.
OUT
PUT
and
ed
applying the
of
or
72
Page 73

2-3-4. Phase Difference Measurements
Phase difference in phase angle between signa ls can be measured using
the du altrace methodofpha
method of phase measurem
(J)
Dual-trace Method
Thi
s method works withany type of waveform. Even if the waveform s are
different from each other or the
se measurement or Lissajous diagrammatic
ent
in the X-Y mode of the oscilloscope.
pha
se difference is great, the
measurement up to 20MHz is practicable.
Measurement shall comply with the following:
1. Set the switches as described in 2-2-4
Connect one signal to the CH
I IN connector
Dual-trace
191
and another one to
Measurement.
the CH2 IN connector 110]
omin
NOTE : Where the frequency is bec
g higher, usc the same probe or
the cabl e having an equal delay time so that an measurement
error can be reduced.
2. Position the Trigger SOURCE switch 12
At this time, move
the vertical
POSmON
another
waveform upward or downward by adjusting
control so as to make the said waveform
81
toward the stable waveform.
invisible.
3. Move the waveform to the center adjusting the vertical POSITION
control,
4. Adjust the Trigger LEVEL control130J and ensure that the beginning
point
the horiz
5. Adjust the TIM E/DIV switch 122JTIM E VARIABL E control
hori zontal POSITION control 126] properly so as to make one cycl e of
the wavef
horizontal division represents 50°
and
make the waveform occupy 6 divisions.
of
the waveform corresponds exactly to the starting point of
ont
al graticule line (See Fig. 2-19).
orm
become 7.2 divsions.
When
and
this is done, each major
each subdivision represents
125]
, and the
10°.
6. Perf
7.
orm
the same procedure as that described in Item 3 above so as
to have another
displayed on center
The
horizontal distance between the beginning points on the
horizontal axis
waveform already moved to be invisible also
of
the horizontal graticule line.
of
two waveforms is the phase difference.
For
example, the phase difference shown in Fig. 2-10 is 5.2
divisions, hence 60°
73
Page 74

S. If the
p
that o ne major division represen ts 5°.
9. For any ins trument equ ipped with READOUT func tion. mea
value after moving cursor as shown in the figure makes it possible
to measure the phase
(2) Lissajous Pall
Thi
Measurements can possibly be perfor
500KHz depending on wide
for you to m
pha
se difference is less than 500. the measurement can be
erforme
d closely using X
dif
em
Method
IO
magnifica tion m
ference in the entire cycle.
s method can only be used where the wavef
med
at frequencies even higher th
band
width of the amplifier. However, inorder
aintain
the m
aximum
accuracy
pro
ode
. In this case. note
surin
orm
is sine wave.
vided in features. it is
g T
desirable to conduct the measurement at the phase difference less than
20kHz.
an
7
-1
Page 75

L
,
f--
--
f--lf
: /
/
1/
'
Li.
"I -
- -
,
IT
V
v-
[\
1\
\
1\ 1\
\
,
,
,
,
-r-r-
1\ '
x
,
~
,
1\
1/
I
I
1/
II
J
1/
II
}
J
Fig, 2
I
~
-19
. DUAL-TRACE METHOD OF PHASE MEASUREMENT
,1
I
,
L
,
~
ru
,
.
/
1/
.:;.:
1/
V
~
Olff
( k(
7 zoiv 360'
1/
1/
1/
t>
f(;
( I
--,
1./)
- j
V
V
I
!
I
•
I
1
PHASE DIFFERENCE(angll!() =
(
a)
PHASE
ANGLE
CALCULATION
son
- I A
B
/0
O'
(b) LlSSAJOUS-PATIERNS
Fig. 2
-20
. LISSAJOUS METHOD OF PHASE MEASUREMENT
0 \:j
.,.
-,
,
OJ'
OF
75
,,.
VARIOUS PHAS E
r
eo-
ANGL
ES
Page 76

Pha
se difference measurement shall comply with the following proced
I. Rotate the TIME
position.
CAUTION:At this time, the trace on the CRT screen is so bright
2. Make sure that CH2 POS ITION [I
pushed in.
/D
IV switch fully clockwise and set it to the X-Y
tha t it could often d
trace intensity properly.
am
X] and PULL X5 MAG knob r1
age the CRT ph osphor. So reduce the
61
ure:
arc
3. Connect
signal to
4. Center the waveform by adjusting the
[18). and adjust the CH2 VOLTS/DIV switch [14J and VARIABLE control
[16) together so as to make the waveform be
waveform ex ists on the 100% and 0% graticule line).
5. Adjust the CH I VOLTS/DIV switch
waveform bec
Pr
6.
the horizontal center by
1261
7.
Count
central vertical graticule line. You may count movin g the wavef
by me
8. The ph ase difference
arc sine of A B (the
example, when the waveform is
if you perform the calculation according to Item 7 above, the
resultant is the arc sine value of 2
which is conve rted into 19.5° in terms o
one signal to the CHI, X IN con nector
the C1I2. Y IN connector [l O],
CH2
com
113].
ome
6 divisions as done in Item 4 above.
ecisely center the wavef
orm
to have it exactly positi
adju
sting the horizontal
.
the
number
ansofthe CH2 position control for close me
of divisions indicated by the wavef
of
the two signals (angle e) is equal to the
numb
er divided by 6 in Item 7 above) . For
sam
e as the described in Figure 2-20a,
+6=
0.3334.
f'theangle.
19
J,
and another
vertical POSITION c
e 6 divisions (the
and
VARIABLE to make the
oned
right on
POSmON
orm
along
asur
ement.
control
ontr
the
orm
ol
8)
=si
n
76
-'~
can
be obtained in acc
and
trigonometric function
tha
PHASEDIFFERENCE(angle
9.
The
simple method
As for angles greater than 90°, add 90° thereto. So
required to determine its value with referring to various phase
angle indicated in Fig. 2
NOT
E : The conversion of sine angle
with trigonometric function table
expression.
can
directly be applied to angles less than 90°.
-1I(b)
.
t you are
ordance
Page 77

10.For an y ins trum
values after moving cursor as shown in the figure makes it possible
to ca lcula te the
ent
equipped with READOUT function mcasuriug A
pha
se difference (8).
and
B
2-3-5. Ris
Rise time is the time required for the Icadi ng edge
from 10% to 90 %
required for the trailing edge
ctim
e
Measurem
ent
of
a pulse to rise
of
the tota l pulse ampli tude. Fallti rnc is the time
of
a pulse 10 drop from 90%
of
the total
pulse amplit ude to 10%. Risctime an d falltime, which may be
sur
collectively called transition time, are mea
same
manner
.
ed essentially in the
To mcasure rise and fall time, procccd as follows :
I. C
onnec
t the pulse you wish to measure to the CH I
and
set
the
2. Adjust the
AC-DC,GND switch
TIME/DIV
switch
III
1 10 AC.
[::'::'1
to display abo ut 2 cycles of the
pulse. Make sure that the TIME VARIABL E co ntrol
fully clockwise
3. Center the pulse vertically by adjusting the CH I vertical POSITION
11
71·
4. Adju st the CHI VOLTS
be closest to the 100% graticule line,
be closest
then
rotate the VARIAB LE
making graticulc lines
both
pulse peaks rest exactly
respectively.
5.
Adj
ust the hori
rest
on
the central vertical graticule line (crosses at the 10%
poin
t) .
6. If the risetim e is sloas
magnificati
as to correspo nd al
adj
ustment as described in Item 5 above by pulling the
VARIABLE
and
pushed in.
/D
IY switch
1131
so as to make topofthe pulse
and the bott
10 the 0% line.
(See
Fig. 2
zontalPOSITIONcontrol
on
is necessary. If, however, the risetime is as short
mos
/PULL
XIO
Wher
e the
cor
respo ndence is not ma de,
contro
l [15J slightly co unterclockwise with
of
both sides deviate a little to make the
on
the 100% and 0% graticule lin es,
-2f)
.
126 J and
com
pared to the period, no further
t to the vertical graticule line, make an
MAG
control [251 (See Fig. 2·21(
IN
con
nector (9 1,
1::'51
is rotated
omofthe pul se
mak
c the ri
TIME
b)).
singedg
e
77
Page 78

7. Co unt the
(central v
8.
Mul
tiply the nu mberofdivisions counted in Item 7 ab ove by the
numerical value of the
numb
er of horizontal divis ion s between the 10% p
eni
eal graticule line)
and
TIME/DIY
the 90% point.
switch, then you wiUobtai n the
measured risetime. Where the mode is XI O
of
the
TIME
/DIY
value
switch was set to Ips,
in Fi
gur
e 2-l la, the risetim e w
l
OO
ns X 3.6div = 36005 : because the m
mea
surin
9. Wh en
align
mea
with the
surem
g Ialltime, simp ly
cen
tral venical graticulc line,
ent
conform
setting by 10. Forexample,if
and
the
measurement
ould
be 360ns. ( I
make
ing
to the procedure sel
above.
magn
was con
ode
the 10%
and
oint
ification, divide the
the
TIME
/DIY
duc
ted as sho wn
OOO
ns
-=-
10 =
lOOn
is XIO magnification).
poin
t in fall time
perf
orm
the
out
in Items 7and 8
s,
10. When
measuri
transition time iscontai
cO
Ill
JX)SeJ
The above all is explained withthe followin g formula:
ng the rise and fall time. note that 17.5ns-Rise lime
ned
in the OS-30
of measure transition time (tnu and tr,
Ic = Real transition time
tm= Measured
tr - Rise lime of oscilloscope
:20Donese
tran
tr= 17.5ns:
tr = 8.8ns:
* For the instru ment equip
cursor
to measure rise/fall t
and
6 cursor to 10% and 90% re
ime
tr = 5.8
.
ped
ns:
with R
lf. Therefore the
sition time
05
-30200
05
-30·100
05-3()(,(J0
EADOUT
real
function, positioning
spe
ctively
make
(tr)=O
.35/f-
tra
nsi
tion time uc) is
s it possible
.'JH
which is
78
Page 79

r:
o.
I
•
..
I
i
l"
q H
r-:
~m
n .u
.
..
.
..
10QQ
•
f-s
+-+
f-
-
•••
+
\
o . b
i
. r
~
I
a. BASIC DIS
,1
"
I
•
..
I
C 1
b. WITH H
...
"""
1
~
..
OPIZONTAL
PLA
r:
i
Y SETUP
:-...
...
.b
«
MAGN
.a
"
IFICATION
Fig.
2·21.
RISETIME MEASUREMENT
79
Page 80

3. X-Y plot
All
planer connected with this instrument through RS-232C
ter
digital o
utp
ut
the dat a displayed on the screen is the ou tput
appearin
cab
g o n the X-Y
le.The
op/eration of instrument is describ ed as follows. Refer to the plotter
on
operati
operation .
3·1. X-Y plotter
manual attached to plott er for instruc tions on the X-Y planer
HP-GL
3-2. Specificati
( ]) Cha racter and
(RS-232C specification) plotter
on
cursor
All the characters and cursors displ ayed on the screen are plotted.
(2) Wavef
orm
data
All the waveform dala displa yed on the screen are plaited.
zont
hori
In magnificati
(3) Grid
al and vertical wavef
on
and
scale
Th e grid with horizontal
mode, only the magnifi ed sector is plotted.
orm
s with 10
and
vertical 10 and 8 div are plotted. In
and
8 div arc plotted.
horizontal and vertical rids , the 0.2 div nit scale is plotted.
(4) Screen mode
Setting
screen modes. Refer to chapter 3.4,
DIP
S/W on the rear side
make
s it possible to select f
SElT
ING
for more details.
(5) Pen replacement
It is possible to specify the pen replac
rear side. Refer to
(6) Ex
ampleof
Fig. 3
-1
plouin
(a) thru 3-1 (d) show the example of ploui ngs.
cha
gs
pter 3.4,
SElT
ement
ING
using
for more details.
DIP
S/W
Th
on
e
our
the
Page 81

lJ
0
x
p
Ul
---
~
0
x
~
'""
0
<
f--'>
:3
UJ
~
- - - - - t
:::>
Jl
-,
I-.-.
~~
F:
,
[::
F--
bn
~
f.-"-
~
.
~
~
f-'>.
~
I
I
I
t
l
l
L
~
I
I
I
[
- - - .
~
l
J
I
I
1
j
I
j
1
j
I
LJ
---_ . . -
--
r-
-
<------
c-
- 0 _ O_
<
<
::>
j 0 0 0
,/
:>
<,
:>
----
:>
--
.:
p
<
b
:<
P
----
'---
C
-
:>
:>
<
<
t>
\
J
\
u
-1
-. -
..
~
+
f--'>
0
\
\
m
f-J .
<
z
1."\
::0
:s:
J
V
/
c..n
'"
Fig. 3-1 (a)PLOT OUTPUT DISPLAY 1
81
Page 82

, '"Ii
! ,
l
I
If\
I
I
{
I
:\/
I I
: I
~
I I i
~
~;
L.:.-J
1--
•... . .
i P
IOX
!
+1
2V NC
/
I
i
I
,
I
I
,
,
~
L--
0.2
' .
RM
d
....- -.
~
I
...-..
~
\
I
,
f\
I ! n
!
I
I
I
I
L
.J
l
OX
V
I I
L
\
T
i
-
...
7\
I
0.5
51
.
SM
r\
\ /
-
l
I
L
l1S
\
~
G.
Tl
+4
L
~
r---.
~
V\
I V I
I
k
L i
r
D.~
IP
ioxi0.
•
-l
:
!
()
Fig.
~
'-
~
.
II
5 '
3·'(b)
Om
I
NC
RM
V
.-'
1
1\
\
v
-
lOX
PLOT OUTPUT DISPLAY 2
-
(\
OV
-
\1
rv
""
L0-
/
0
\
x,
;;;;;::::;;:
"()
1
I
W
1_ -
A
(\
T
0.5
51
1
\7
~
'-
~.
" ()
rns
/
SM
<,
\
\.
,........
m..,
82
Page 83

:J>
~
~-~$~
i
~
'F,,:-;
~
-
F
~F
;f
I
.---~
-
-
--
ro
c---'--- :J.
C I __
til
,= j.-.,::
- -=c t .
~J
--
,. ..
=-:P
- -
C'-
~
__D-c
-
:
~
--
--
,
--
-
-. -
-,
~_:J
-- - -
.J
~c:
.....
~;
..... ..
.
c:
--
,
1
....
-T;-
··
..
tI
I .
,
--
i
:
,
~
I
.,.
'-I
c
til
Ul
:I
II'
~
-
if
....
<
--
-T
.
1.-
111
-s-
til
_1
II
~
<::
~
- .
»>
-
----
-
.
.
;:;r
--
<:
<:
-c:::
-e::
<::
-c:::
-e::
. .....
:::>
"U
..;
+
111
'-I
ru
...
-
<
~
,
01
1
-
-'
~
-
II'
I
3!
I
--
~
-
'
..
:,
"
31-
~
II
o
-c
Fig. 3, ' ee)PLOT OUTPUT DISPLAY 3
·-r-T--
, I •
-t
--l-- .::S..
l I I:
-r--t--"~':l
I I 1'; 0 I
~
I: + I
oi
, c. ,
.
83
Page 84

r-·-
-rr
-
..
,
to:
In
..... .....
.,
-
! I
--+- -
1
~t;
....
~~-
~--m
___ _
·
··
· ·~lr
- T
-i-
~
-t
t-
l i
~
-
l
~
I
!I
-l
'.~
.
H
Ll
r
I
I
i!l
f
~
a
I~
iii l
~~~
~
~
~
.
~
.
F
In I
~
<,
./
,
I
·
"
l
l I
J
·
·~F
u /
11
L--
1
Pn<
(
l
~
r--
I '"
p
U1
1"\
~
I
~
I
rt
~
-J-
I
L..
. -
r
.
II']
_....J
II
·
·J~J
~
~
I :D
3
r
r
r
i
,
I{'
I
\
I'.....
,
V
Fig. 3-'(
/'
d)
PLOT OUTPUT DISPLAY 4
(
84
Page 85

3-3. Connections
Connect X-Y plotter with the connector on the rear side usin g RS-232C
interface cable. Fig 3.2 shows tbe wiring of RS-232C int erface cable
HP
used to connect the graphic plotter
7475A with the instrument.
FG
TXD
RXD
RTS
CTS
DSR
DTR
SG
Fig.
3-4 Setting
UsingDIP SIW on the rear side, set botb the
modes.
Off
I
ON
BBBBBB
t o
20
3 0
4 0
5 0
60
20
0
7
0
3-2RS-232C
INTERFACE CABLE WIRING
- -
PLOT
I
0
2
0
3
0
4
0
5
f-O
6
0
20
0
7
0
and
communication
BB
FG
TXD
RXD
RTS
c
rs
DSR
DTR
SG
o
No. I 2 3 4 5
~
II
Co
Ex I) HP7475A plotter (9600 BAUD RA
NO
.
stale
Date format
mmunication type
1 2
0
(Oscilloscope side)
3 4
I
I
5
I I I
85
6 7 8
l ' L
Pen
TE
)
6
S~r
replacement
7
0 0
een
mode
8
Page 86

Pin
NO
.
name
g
8
S2 SI Y
7
6 5 4 3 2 1
US
A3 B4
B3 B2
B1
(I)
PLOT Modc
(a)
Slate
0 0 0 0 0 1 0 I 0
(Ploner side>
Ex 2) HITACHI 681-XA PLOTTER (9600 BAUD RATE)
7 B
NO.
Slale
2 3
I
0
0
4 5
I
1
6
I)
I
I
(Oscilloscope side>
NO
State
.
I
0
2
I I 0
4
3
5
I I 0
7
6
(plotter side)
Screen mode setting
Screen size can be set using
DIP SfW No. 7 and 8.
One
selected out of the modes in table 3-1.
Table 3-1 . Screen mode se
tti
ng
0
B 9
I 0
mode
9
0
is
Screen
mode NO
1
OFF
2
3
4
DIP SfW
.7
ON
OFF
ON
Descriptions
Screen Size
NO. 8 (m
OFF
OFF
ON
One screen is plotted in a sheet
of
A4 paper
Two screens are plotted in a
sheet
of
A4 paper
Four screens are plotted
in
a
175
Refer to Fig.
3-1
(a)
118
Ref
er to Fig.
3-2
(b)
87
x70
sheetofA4 paper Refer to Fig.
3- 1 (c)
ON
Two
screens are plotted in a
87 x 70
sheet of A4 paper Refer to Fig.
3-1
(d)
m)
X 140
x95
.8
Page 87

(b
) Pen replacement setting
It is possible to set the pen replaceme nt listed
DIP
S/W 6.
Table 3-2 Pen replacement settinq
In
table 3-2 using
DIP S/W
NO
OFF
ON
When
DIP S/W 6 is set to
Table shows the details
Table
GRID
AND
3-3
. Pen number correspond ing to the details of plot.
SCALE
WAVEFORM
CURSOR
Character
Pen feplacement
.6
NO
YES
OFF
. six colors arc used for plotting .
of
plot and corresponding pen
numb
Details of plot Pen
CH I 3
CH2
SAVE A 5
SAVE B 6
CHI
VOLTS
/DIY
CH2
SAVE A 5
SAVE B 6
SWEEP
TIM E RAN
GE
SAVE A 5
SAVE B 6
Others
er.
number
I
4
2
3
4
1
I
X7
Page 88

(~.)
Co
mmunicau on mod e
Set baud
use.
plotter.
(a) Baud rat e setting
rate and
S~Hn
('
It is possible to set RS-232C baud rate as shown in table 3-4 using
DIP SiW
NO. 3
data
format
baud rate and data format sho uld be set in the instrument and
depe
nding
on the plotter speci fica tion and
3,4 and 5.
Table 3-4 Baud rate seni ng
siw
DIP
BAUD RATE
NO. 4 NO. 5
OFF
0;\1
OFF
ON
OFF
ON
OFF
ON
OFF
OFF
ON
ON
OFF
OFF
ON
ON
(B) Data format setting
It
is possible to set RS-232C data format as shown in table 3-5
using
DIP
SiW 2.
Table 3-5 Data format sening
DIP SiW
No. 2
OFF
START BIT
ON START BIT
OFF
300 BAUD
OFF 600 BAUD
OFF
OFF
1200 BAUD
2400 BAUD
ON 4800 BAUD
ON
9600 BAUD
ON
ON
Data Form at
+ 8BIT
+ 8BIT
ISTOP BIT
+
2STOP BIT
+
~
~
88
Page 89

(0) Communication mode setting
DIP S/W 1 sets RS-232C communication type (unilateral or bilateral)
Unil
ateral communication means the plotter output and bilateral
communication mea ns the co mm unication with person al computer.
Table 3-6 Communication typeselling
DIP S
/W
No.1
OFF
ON
Note : Before tu
If
you
want
mode,
mak
setting.
Communication type
Unilateral ( plotter output)
Bilateral (communicatiof with personal
computer
rnm
g on th e in
to c
hange
strum
ent, check DIP S/W set
the DIP S/W setting forcommunication
e it sure to turn on the instrum
ent
after the
ung
.
89
Page 90

3-5.
Ope
rati
on
\\'111:11
plotting.
plottin g is
3-6. RS -232C interfa ce
th e instrument is in HOLD
Red lamp lights lip while plotting is carried out.
oye
r.
lamp
goes o ut and pen is relea sed .
The instrument is
equipped
functionenables person al
mod
e. pre
ssing
[PLOT] SAV starts
When
with RS-232C as a
com
puter to control the plotting operation as
standar
d functio n. This
well as data input/output to/from computer. Th is communication function
can
not be used together with the
Do not use the X-Y plotter
out
outpu
t to the X-Y plotter.
put function(p
lotter output using PLOT
S/\V) when you use the co mputer communication function.
3-7. M ajor tr
oub
les
If X-Y plotter does not operate normall y, check the followings :
( I)
Cab
le wiring is not done in acc
ordan
ce with Fig. 3-2.
(2) X-Y plotter power turn s off.
(3 ) Commun ication type setting (DIP S/W 1) is wrong.
(4) The instrument is not in
and
data f
(5) Baud rate
ormat
HOLD
mode.
are not properly set (Set them correctly
after turning power off. Refer to paragraph 3.4 (2»
(6) Baud setting is not c
(7)
Wh
en plotting stops, turn plotter poweroff and on to initialize
plotter.
Th
en try to perf
orr
ect on the plotter side.
orm
plotting.
'i()
Page 91

4. RS-232C
4-1. Int rodu cti
on
RS-232C is the serial communication interface standardized by U.S.
and
Electronic Industry Associati on ,
thr
ough RS-232C interface.
4-2. Specificati
(
I)
Electric feature
Tra
(2)
on
nsmission type
(3) Stop big length
ha
(4) C
racter len gth
(5) Parity bit
ha
(6) Separating c
Tra
(7)
(8) Co
nsmission rate
mmun
4-3. Connector
(I)
Fig. 4-1
and
pin
racter
icationprotocal
pin
alignm
and
table 4-2 shows the RS-232C connector pin alig
ent
functio ns, respectively.
transmits
EIA RS-232 is applicable
on-
synchronization
N
I bit/2 bits
8 bits
disabled
CIR
300, 600, 1200, 2400, 4800 or 9600 BAUD
Hardw
and
ire h
signal te
chn
and
ology
and
receives digital
shake
dat
a
nment
NOTE
Fig. 4-1 .
RS-232C
connector pin alignment
: Use DB-25P (FEMALE) which is used for connector cable.
() J
Page 92

Table 4·1 . RS·232C Connecto r terminal
Pill No.
I FG (."'A)
2
3
4
5
TXD
RXD (BIl)
RTS (CA)
CTS
6 NC
7
SG (AB)
8 NC
9
10
I I
12
13
14
15
16
Signal
GND
(IlA)
Data
Data reception IN
Transmission request
(CIl)
Transmissio n
Non
Signal G ND
No
"
"
~
~ ~
~
~
~
~
Function
configuration
tran
smi
sxion
request
-connection
n connection
~
~
~
"
~
~
~
Signal direction
OUT
OUT
IN
17
18
19
20
21
22
23
24
25
"
"
~
~
~
~
~
~
"
"
"
"
"
"
"
"
NC Nonconnection
92
Page 93

(2) RS-232C inte rface signals arc as follows:
<D
FG Ground configuration
Chassis ground cable
@TXD Data tran smi ssion
Data output signal transmission
+9V level - - - - - "0" (space)
® RXD
® RST
®crs
® SG
- 9V level
Data recepti
Datainput
Transmission request
Th is output signal indica
request state, and is used to control the data
transmission function at modem transmission
"0" (space) - carrier
" I" (mark) - carrier stop request
Transmission p
This
and
is in an
part is allowed to transmi t.
Signa l grou nd
Signal ground cable
--
- - -
on
signal reception
erm
input signal controls
ind
"I
tran
ission
ication state when modem t
" (mark)
tes
smissionreques t
modemtran
the transmission
smissionpart,
pan
ran
smission
.
4-4. Connection
C
onnec
t the i
cable. Interface varies depe nding on personal computer type.
operation manual carefully before connecting it to personal computer,
and select pr
cab
le wiring used for connecting GoldStar PrecisionCo., LId's pers
computer B-I6 with the instrument.
nstrument
oper
interface ca ble. Fig 4-2
FG
TXD
RXD
RTS
CTS
SG
Fig. 4-2. RS-
1
2
3 0
4 0
5 0
7 0
to per
sona
l comp uter using RS-232C interface
sho
0
0
232
C INTERFACE CABLEWIRING
93
So read
ws the RS-232C interfa ce
1
0
rO
0
0
0
0
1 1
2
3
4
5
7
FG
I
TXO
I
RXD
RTS
CTS
SG
onal
Page 94

4-5. Operating function
If the instrument is connec ted with personal com purer through RS-232C
interface. it is possible 10 use personal computer with appropriate
programs. Function
carried
using personal computer to configure the automatic measurement system
having a variety
RS-232C
( I) Panel selling
(2) Operating function
out
by instrument,Itis possible to prepare a setofprograms
andfunc
Panel selling enables the communication with personal co
both storage or n
to storage mode to transmit accurate
<D
Wavef
orm
Th
e instrument
CHI acq uisition memory storing CH I wavef
CH2 acquisition memory storing
Two sweep trace memories (SAVE A and B)
CH I display memory
CH2 display memory
CH 1 and CH2 acquisition memories have each 2000 data l
capacity depend ing on the sample mod e. CH I and CH2 display
memories two sweep trace memories have 1000
CHI and CH2 display mem ories
transmitted using
and
function
comma
of
function s.The functions to be used by using
tion
data
nd designate the program operation to be
com
ma nds are described as follo
on
storage mode. Ford
transmissi
has
the following six d
per
sonal computer.
command
on
ata
communication, set it
data
.
ata
memories.
ormdata
CH
2 wavef
and
orm
two save memories
ws:
data.
dataload
.
mp
uter in
capacity.
can
oad
be
Table
Sample mode
OLL
R
NO
RM 2000
EQU IV 2000
4·2
Sampling mode and acquisition
Acquisition memory capacity
1000
Page 95

The
numberofdata
to be transmitted each time is selected
within thc memory capacity. Decimal ASCII system or binary
system is selected as data transmission type. Waveform data
each memory is S bits. T
for decimal n
umber
hat
is to say, it is between a
and between (00) 16 and (
FF)
16 for
and
of
255
hexadecimal number. The scope of these data corresponds to ten
vertical
The data correspo n
haxadecimal number).
step lower
location one step higher
div,
on
than
25
5
(FF) " 1 DIV
128
(80) "
the CRT.
ding
to central cross h
Data
0 « 00) 16)
graticule line.
~.,..--,---.--....-
228
Data
than
graticule line.
1-+-+--1--+-
air
is 12S. «SO) 16 in
mean
s the location one
255(
~FF
)
16) means the
---,-
-..,.-,,--r--,----
-+-+--11-+-
-11-
28
o _ .1 DIV
(00)
"
® Measuremen t condition data transmission (C haracter
transmission)
It
is possible to tran smit the wavef
to SAVE
mem
ory A or B using person al computer comma nd. All the
data are transmitted except for special data.
for the measure ment
cond
ition is subject to ASCII system.
@ Waveform data recepti on
The
details in SAVE memory A an d B can be changed using
or
m da ta coming from personal computer. Set RECALL S/W to
so that the rewritten
sur
ement
condition data reception
dat
@)
wavef
ON
Mea
The meas urement condition da ta coming from personal computer
can be registered as the data for SAVE memory A
When
TIME
RECAL
/DIY
L S/W is set to ON, the dataofVOLTS
are displayed on the CRT.
orm
mea
a are displayed
(ch
95
sur
ement condition
Th
e data f
on
the CRT.
ormat
aracter reception)
or
B waveform.
/DIY
and
Page 96

4-6. Transmission data format
The transmissiondata format is as follow s:
(
j)
Wavef
orm
data
tran
smis
sion
format
After receivin g Ri command (i = 1-4) the i
waveform
item.
data
in the following format. Refer to tab le 4-4 for each
• ASC II System
• Binary System
orm
(2) Wavef
• AS
• AS
data recepti on f
CII
System
CII
System
orm
at
nstrument
transmi
ts the
Comma
binary
c
ode
used for D I thru
O J Mea
After inst
measur
( , J is the separing c
system, D I th ru
DN
data. In binary system the separating character code are not
DN
data.
sur
emen t conditiondata transmissionand
rumen
t receives Ro
ement
condition data arc tra nsmitted in the following format.
Refer to table 4-5 for mo re details.
Wo
command
register them as mea
. it receives the data sen t in the f
surement
memory.
hara
are
cter code.
binary
data.
DE
L type is C/R. In
and
rernainings are AS
receptionf
command,
the memory waveform
Wh
en the in
strument
ollo
condition data forthe de
96
wing f
signat
ormat.
receives
orm
at,
ed SAVE
CII
and
Page 97

Table 4 J.
Function
command
No.
Function Command Description
Transmissionl
I
reception signal
SI • Check the transmission/
command
recepti
on signal to enable
check communication with
persona
l computer.
Waveform
2
tran
data
smission command waveform datastored in
Ri • The transmission of •
memory
the
data
Whose head has address
data (mmmm).
• ASCII or binary system may
be d
esigna
method by X on the right
column.
•
After
tran
command. personal computer
receiv
es the
i is d
esigna
number
ted as
smitting
designated
ted
by
(nnn
n)
transmi
ssion
this 3
data
.
Transmission fonnat
~
IR i(mmmm.nn nn. X) DELI
denotes the memory
I
i Memory
I CHI Display
2 CH2
Display
Save
memory
4
Save
memory
.
mmmm"
: Front
Four
digit
oo»-rm!
memory
memory
A
B
address
integer
number.
o(memory
:
'17
•nnnn·: N
umberoftr
data
Fourdigit
lXXll-lOOO
CHI and CH2 display
mem
I =A:
ASCII
B: Binary
ory)
syst
em
system
ansmi
integer:
(save
mem
tted
ory.
Page 98

No. Function Command Description
Mea
surem
J
dition d
tra
Chareter stored in the me
ransmission)
4 Waveform data Wi
reception
ent con Ro •
ata
nsmission me
command
command
designates
or wa
asurement
• Af
ter
comma
receives
data•
• P
mits
ins
SAVE memory A and B in
order to
data
address (mmmm),
•
ASCII
be
method by X on the
right
•
After
command.
transm
the
tran
smission
veform
comdi
mory
transmittion
nd.
the designated
ersonal
waveform
tru
ment to
writeaserie
from the front memory
or bi
designatedastransmission
column.
transmitting
its waveform.
person
compu
data
designate
nary
personal
this
al computer
ter
system may
this
tion
data
I •
transm its
to the
s of
computer
Transmission
format
~
"i"(- 1- 4) denotes the
memory
Eifmmmm. nnn
t d
i"should be J or 4
3
4 Save
•
mmmm"
enotes
i
Save
number.
the
Memory
memory
memory
:
Front
.F
our
lXXXl
n.X)
mem
ory
num
A
B
addressofmem
digit
integer:
-0999
DELI
ber.
ory
"
nnnn":
Number
data
Fourdigitinteg
0001-1000
CHI and CH2 display
mem
x=A :
AScn
B:
Binary
oftransm
(savememory.
ory)
sys
tem
system
ined
er:
Page 99

No.
Mcsurcmcnt co-
5
ndition data
reception
(Character
reception)
F
unction
Com
mand
Wo
command the measurement condition
• Personal computer transmits
to the instrument. and
designates memory to save
the waveform measurement
condition data stored in "i"denotes the memory number.
the SAVE memory A and B.
Descript ion
Tran smission forma t
~
"j"should be 3 or 4
• After transmitting this
command. personal
transmits measurement
condition data.
compute
i
r
3 Save memory A
4 Save memory B
Memory
Page 100

No.
2
1
Item
i@
mmmm
Table 4
Name Type
Memory
Fronr add
numbe
ress
-4.
W avef
"i"is
r
! thru 4
(Not, 2)
Decimal number.
Four digits 000
3 nnnn Data number Decimal number.
Four digits
4
Di Data • ASCII system, Decimal
number
Three digits/Idata
0001-1000
000-255
• Bina
ry
system
8 bits binary data
S DEL
Separatin
cha
racter
g C/ R
orm
1-
datatran
1000
smi
ssion f
ASCII
Data code Byte Data code Byte
ASCII
ASCII
ASCII 4
ASCII
orm
at
System
Binary System
3 ASCII 3
4
3
ASCII
ASCII 4
Binary
4
!
number
ASCII 1 ASCII 1
Note L: Sepa rating character
or
Note 2 : 3
4 is designated in receptionmode.
dataforma
t is C/ R.
100
 Loading...