

Extreme Networks NG300, Sentriant NG Operation Console User Manual
Sentriant NG Operation Console User Guide
Software Version 2.5
Extreme Networks, Inc.
3585 Monroe Street
Santa Clara, California 95051
(888) 257-3000
(408) 579-2800
http://www.extremenetworks.com
Published: January 2008
Part Number: 100290-00 Rev 01

AccessAdapt, Alpine, Altitude, BlackDiamond, EPICenter, ESRP, Ethernet Everywhere, Extreme Enabled, Extreme
Ethernet Everywhere, Extreme Networks, Extreme Standby Router Protocol, Extreme Turbodrive, Extreme Velocity,
ExtremeWare, ExtremeWorks, Essentials, ExtremeXOS, the Go Purple Extreme Solution, ScreenPlay, Sentriant,
ServiceWatch, Summit, SummitStack, Triumph, Unified Access Architecture, Unified Access RF Manager, UniStack,
the Extreme Networks logo, the Alpine logo, the BlackDiamond logo, the Extreme Turbodrive logo, the Summit
logos, the Powered by ExtremeXOS logo, and the Color Purple, among others, are trademarks or registered
trademarks of Extreme Networks, Inc. or its subsidiaries in the United States and/or other countries.
Adobe, Flash, and Macromedia are registered trademarks of Adobe Systems Incorporated in the U.S. and/or other
countries. AutoCell is a trademark of AutoCell. Avaya is a trademark of Avaya, Inc. Internet Explorer is a registered
trademark of Microsoft Corporation. Mozilla Firefox is a registered trademark of the Mozilla Foundation. sFlow is a
registered trademark of sFlow.org. Solaris and Java are trademarks of Sun Microsystems, Inc. in the U.S. and other
countries.
Specifications are subject to change without notice.
All other registered trademarks, trademarks, and service marks are property of their respective owners.
© 2007-2008 Extreme Networks, Inc. All Rights Reserved.
Sentriant NG Operation Console User Guide, Software Version 2.52

Table of Contents
Table of Contents
Introduction .................................................................................................................................... 5
Installing the Sentriant NG Operation Console ...............................................................................5
Getting Started ...........................................................................................................................6
Running the Sentriant NG Operation Console ...........................................................................6
Log In to the Sentriant NG Operation Console ..........................................................................6
Using the On-line Help System...............................................................................................6
Chapter 1: Overview ........................................................................................................................ 9
Navigating the Sentriant NG Operation Console..............................................................................9
Menu Bar .............................................................................................................................9
General Status Bar ..............................................................................................................10
Tab and Folder List .............................................................................................................14
Information Panel ...............................................................................................................14
Panel Navigation Bar ...........................................................................................................15
Customizing the Screen .............................................................................................................16
Setting User Preferences......................................................................................................16
Sorting Data .......................................................................................................................17
Showing and Hiding General Status Bar ................................................................................20
Getting Help .............................................................................................................................20
Messages and Tool Tips .......................................................................................................21
Context-Sensitive Help.........................................................................................................21
About the Sentriant NG Operation Console.............................................................................22
Icon Legend .......................................................................................................................22
Contacting Extreme Networks .....................................................................................................23
Chapter 2: Monitor ........................................................................................................................ 25
Table View................................................................................................................................25
View Domains and Appliances from the Table View.................................................................25
Viewing Domain and Appliance Details from Table View ..........................................................28
Launch Sentriant NG Manager from Table View......................................................................30
Radial View ..............................................................................................................................31
View Domains and Appliances from the Radial View ...............................................................31
View Domain and Appliance Details from the Radial View .......................................................33
Showing Appliances ............................................................................................................35
Radial View Actions .............................................................................................................37
Launch Sentriant NG Manager from Radial View ....................................................................43
Finding Appliances....................................................................................................................44
Setting Preferences ...................................................................................................................46
Changing Password .............................................................................................................46
Setting Paths ......................................................................................................................47
Setting Communication Preferences......................................................................................48
Setting User Preferences......................................................................................................48
Sentriant NG Operation Console User Guide, Software Version 2.5 3

Table of Contents
Chapter 3: Setup ........................................................................................................................... 51
Appliances Panel ......................................................................................................................51
Adding Appliances ..............................................................................................................51
View Appliance Information..................................................................................................53
Removing Appliances ..........................................................................................................55
Editing Appliances ..............................................................................................................56
Appliance Software Updates.................................................................................................58
Disable/Enable Appliances ...................................................................................................60
Launching the Sentriant NG Manager....................................................................................62
Backup Appliance Configuration ...........................................................................................64
Rollback Policy Distribution .................................................................................................66
Domain Panel ...........................................................................................................................67
Creating Domains ................................................................................................................68
Viewing Domain Information.................................................................................................70
Deleting Domains ................................................................................................................71
Editing Domains .................................................................................................................72
Moving a Domain ................................................................................................................73
Adding Appliances to the SOC from the Domain Panel ............................................................75
Removing Appliances from the Domain Panel ........................................................................76
Editing Appliances from the Domain Panel ............................................................................78
Moving an Appliance ...........................................................................................................80
Launch Sentriant NG Manager from the Domain Panel............................................................81
Policy Distribution Panel............................................................................................................82
Creating a Policy Distribution ...............................................................................................83
Viewing Policy Distribution Information .................................................................................85
Delete Policy Distribution.....................................................................................................86
Sending Policy Distributions.................................................................................................88
Editing Policy Distribution....................................................................................................89
Glossary ....................................................................................................................................... 93
Index.......................................................................................................................................... 103
Sentriant NG Operation Console User Guide, Software Version 2.54
Introduction
Wel c om e t o t he Sentriant NG Operation Console User Guide. This user guide gives complete instructions
for using the Sentriant
and administrator instructions for configuring and customizing the Sentriant NG Operation Console.
This documentation uses the following conventions:
Menu tabs and subtabs used to access screens are shown in bold separated by a greater than symbol.
For example instructions for how to get to the Monitoring Sources Panel, which is accessed by first
clicking the Monitoring tab, then the Network Topology subtab, and then selecting Sources will be
shown as Montoring > Network Topology > Sources in the documentation.
™
NG Operation Console (SOC). Included are user instructions for everyday tasks
Installing the Sentriant NG Operation Console
You must install the Sentriant NG Operation Console either from the CD that was shipped with your
Sentriant NG appliance, or by logging in to the Extreme Networks support site and downloading the
Sentriant NG Operation Console software.
To install the Sentriant NG Operation Console:
Insert the CD and follow the on-screen instructions for installing the Sentriant NG Operation Console
or
Open a web browser and enter the URL for the Extreme Networks Support site. Follow the instructions
for downloading and installing the Sentriant NG Operation Console.
NOTE
You can download the installer, save it locally and perform the install to reduce network traffic. After downloading,
double-click
You do not need to install any other software. A Java virtual machine is included with this download.
Follow the on-screen instructions.
SOC_x_x_x_xxxx_windows_Installer.exe
NOTE
.
Getting Started
Extreme Networks provides an online help system where you can find information for using the
Sentriant NG Operation Console.
Sentriant NG Operation Console User Guide, Software Version 2.5 5
Introduction
Running the Sentriant NG Operation Console
To start the Sentriant NG Operation Console in Windows:
Choose Start > Programs > Sentriant Operation Console > SentriantOpConsole.
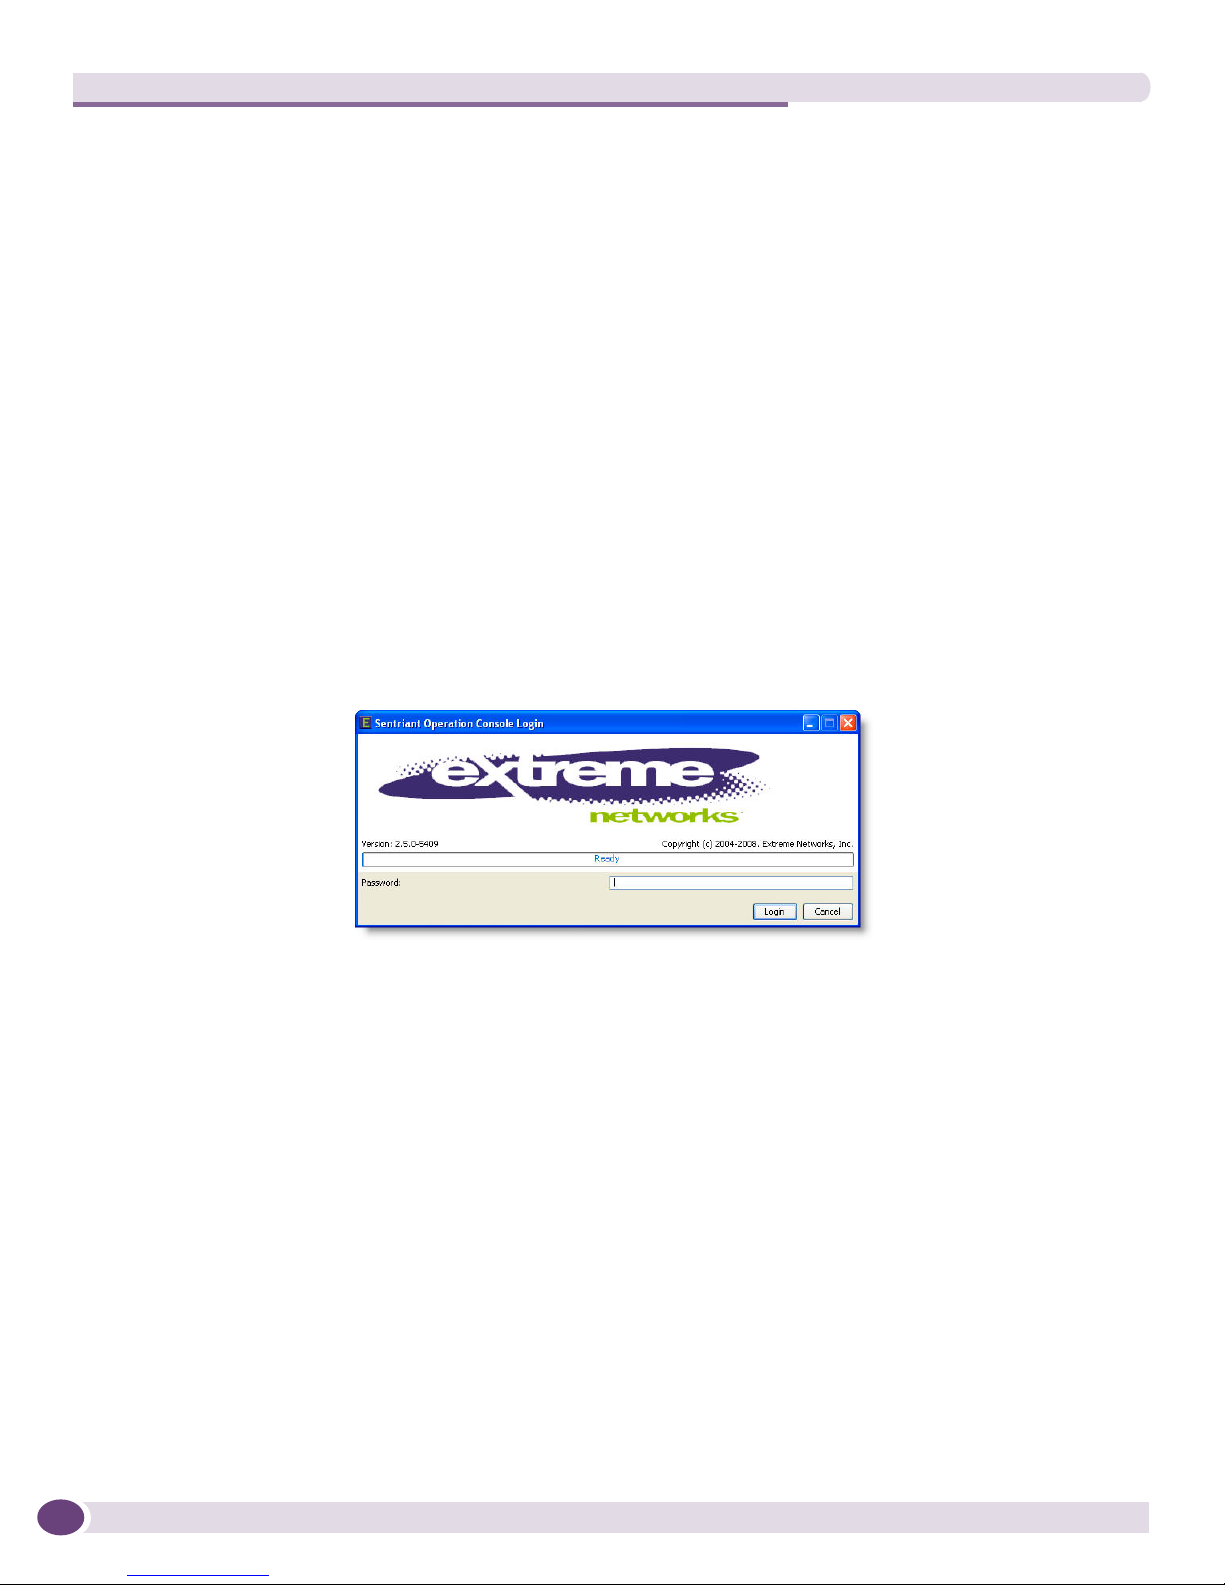
Log In to the Sentriant NG Operation Console
To login to the Sentriant NG Operation Console, you will need to be a user of the system and have the
IP Address of a Sentriant NG appliance which you will be connecting to.
To login to the Sentriant NG Operation Console:
From the Sentriant NG Operation Console Login screen,
● type your user password
Example: ******
● Click Login.
Using the On-line Help System
The Sentriant NG Operation Console also includes complete documentation in a Java-based help
system. The Sentriant NG Operation Console Help system includes all of the information in this User
Guide.
Online Help provides three ways of locating information. The Contents and Index links let you find
general information, and the Search link lets you look up specific words or phrases.
To start online Help:
From the File Menu, choose Help > Sentriant Operation Console Help.
Sentriant NG Operation Console User Guide, Software Version 2.56

1Overview
Welcome to the online Help System for the Sentriant NG Operation Console, a tool for managing
multiple Sentriant NG appliances from one location.
This section provides an overview of the Sentriant NG Operation Console interface and its tools for
locating, organizing, and displaying information. Consult the topics in this section to find out more
about the Sentriant NG Operation Console's Menu Bar, General Status Bar, the Folder List, Information
Panel and the Panel Navigation Bar. This section also includes topics on customizing elements of the
interface.
To get answers to your questions, use the following tabbed pages in the navigation pane of the Sentriant
NG Operation Console Help:
Contents - displays major topics and subtopics. For Windows clients, clicking the plus sign (+) next to
the folder icon expands the topic and shows its related subtopics.
Index - displays an alphabetical list of keywords.
Search - displays a box where you can type a term that the Sentriant NG Operation Console Help
system will look for in the Help topics.
Glossary - contains definitions for unique terminology used by Sentriant NG Networks.
Favorites - gives you quick access to topics that you designate for future reference.
Navigating the Sentriant NG Operation Console
The Sentriant NG Operation Console provides a variety of standard navigation tools for finding your
way around and locating information you need quickly. You can customize views to suit your need or
hide them to save space.
Menu Bar
Clicking an item on the Menu Bar opens a drop-down menu of commands. Clicking a menu command
either carries out the command or opens a sub-menu or dialog box with additional choices. An arrow
symbol next to a command signifies a sub-menu; an ellipsis ( ... ) signifies a dialog box
Sentriant NG Operation Console User Guide, Software Version 2.5 9

Overview
.
Some menu commands turn a view off and on. A check mark next to the menu command indicates that
the setting is currently on.
In addition to the pull-down menus on the Menu Bar, shortcut menus are available on certain screens
which give you quick access to common commands for a particular context.
Shortcut menus are activated by clicking the right mouse button when the mouse pointer is positioned
over an item in a list or in a particular area of the screen. Clicking a command on a shortcut menu will
apply to the currently selected list item or the part of the screen where the pointer is resting.
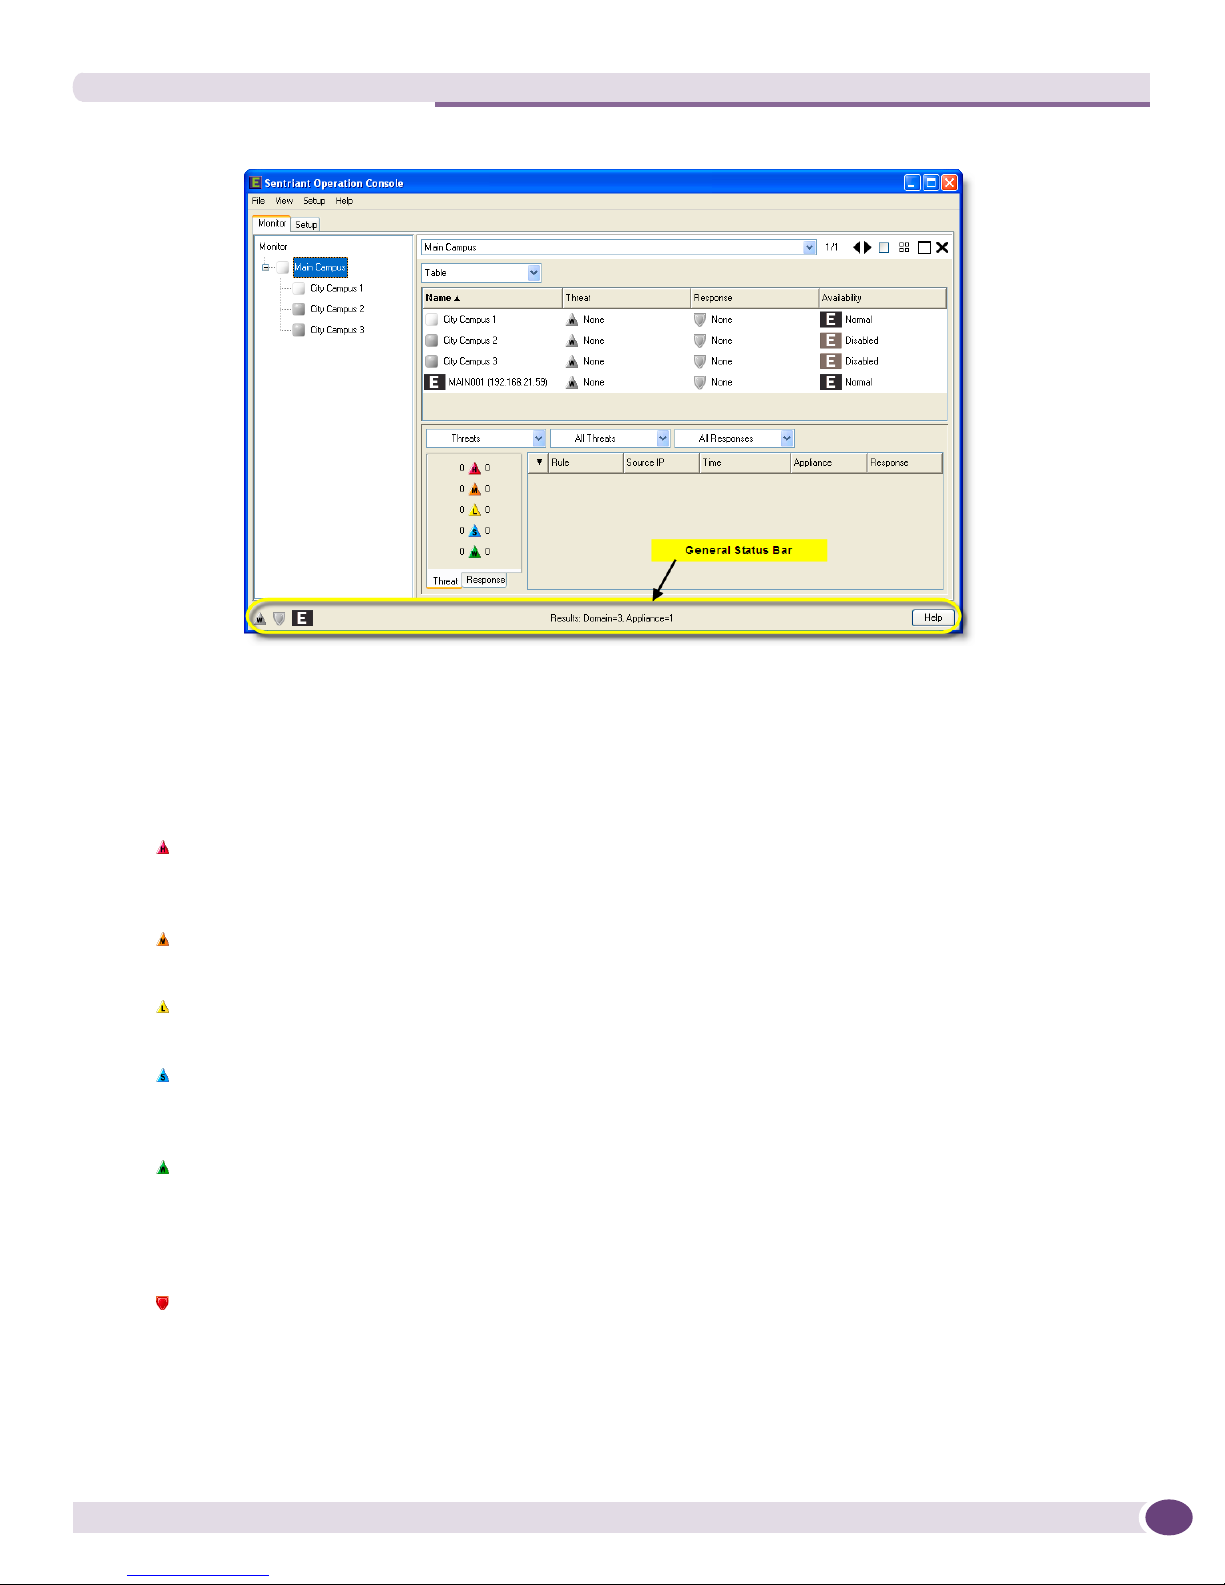
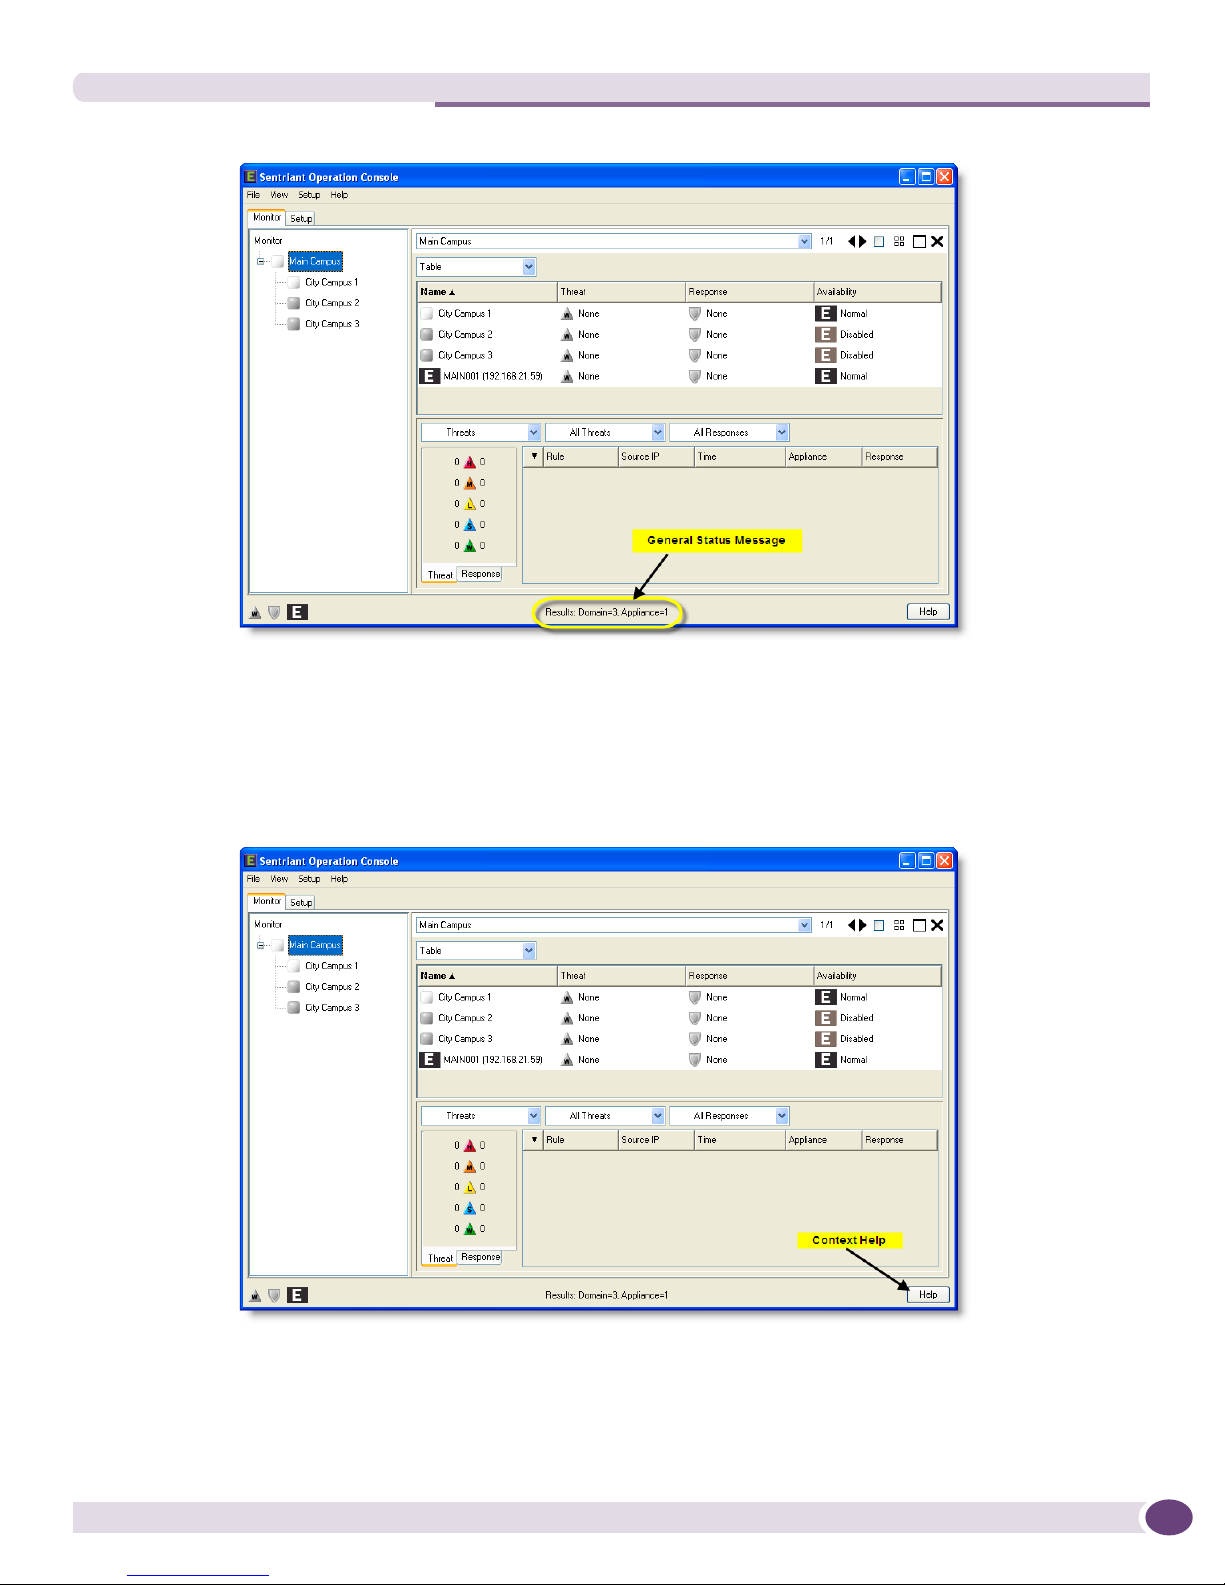
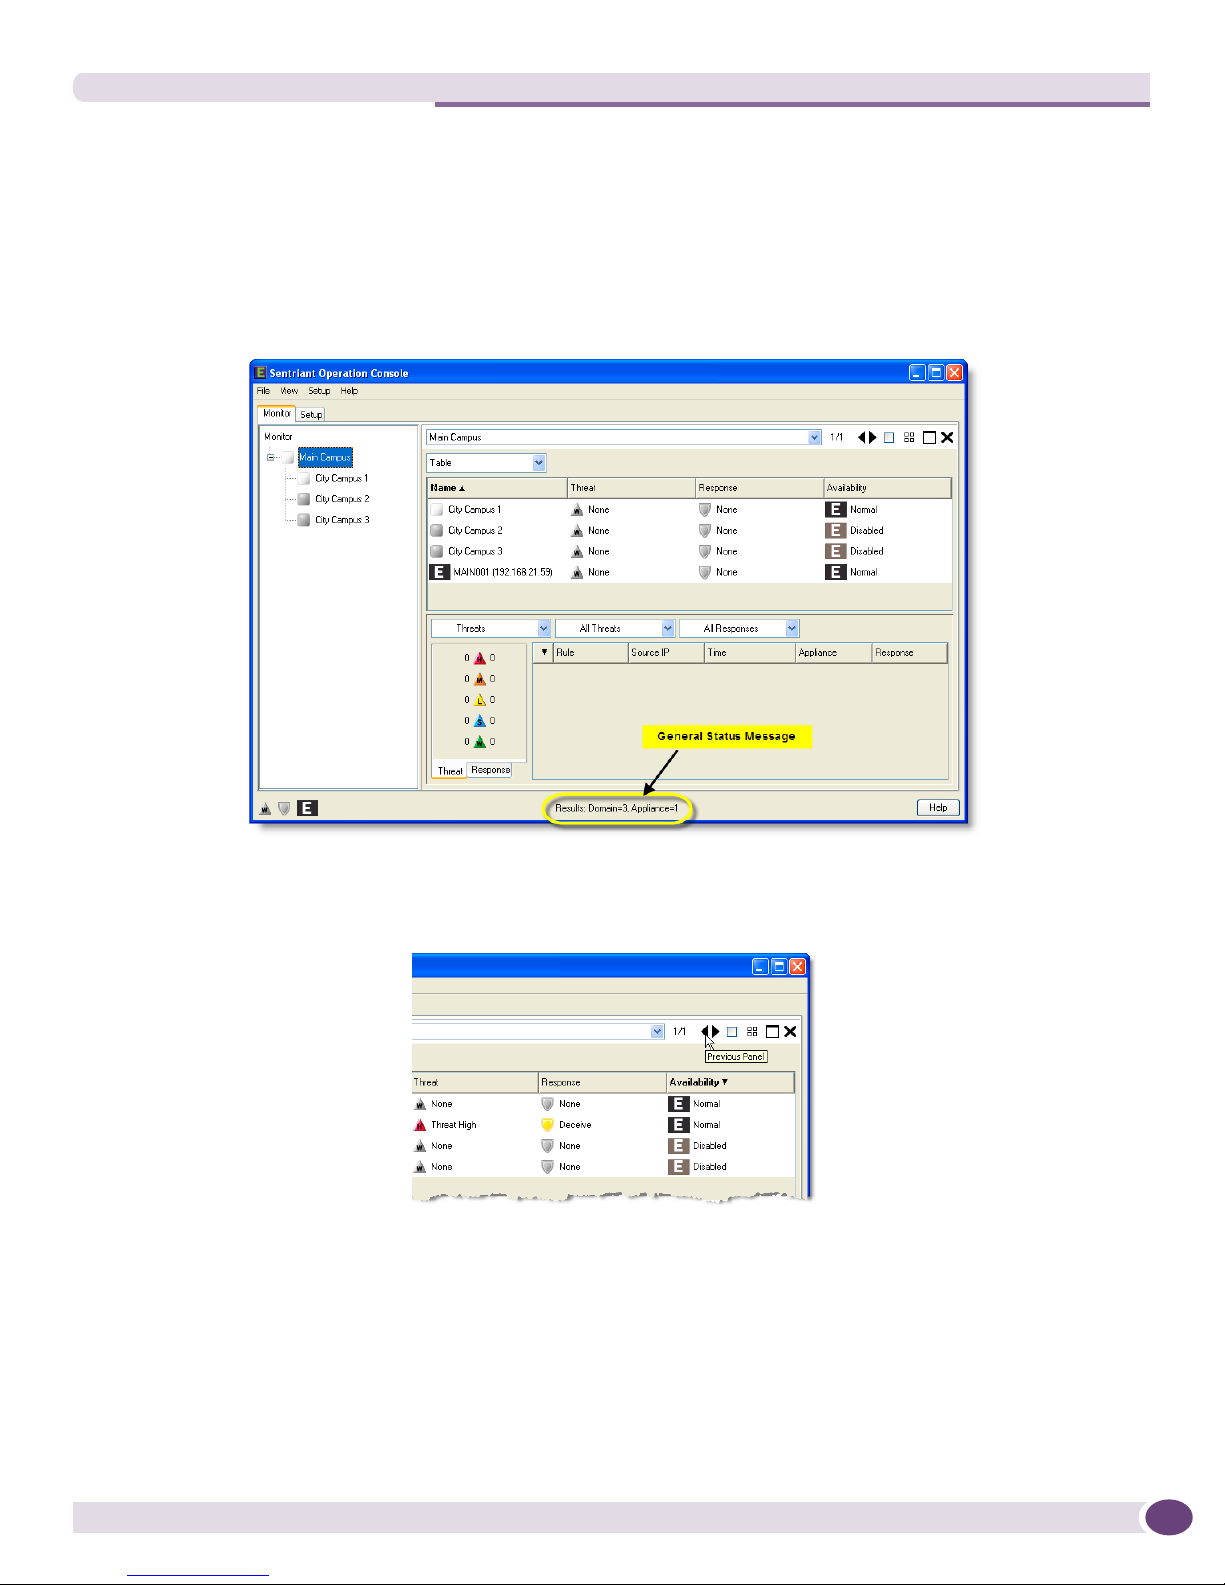
General Status Bar
The General Status Bar displays aggregate sets of threat, response, and health data for all Sentriant NG
appliances managed by the Sentriant NG Operation Console; a General Status Message containing
domain and appliance information, and a button for context-sensitive help.
Sentriant NG Operation Console User Guide, Software Version 2.510
Navigating the Sentriant NG Operation Console
The Threat icons represent an aggregate threat count for all Sentriant NG appliances managed under the
SOC. Threat sources that have triggered rules, or that communicate with a target monitored by Sentriant
NG are assigned a priority level. Priority levels are governed by Sentriant NG appliance policies, rules,
and response modes that can be modified or configured as needed to meet network requirements.
The Sentriant NG appliance supports five priority levels:
High - the most severe priority level. High priorities take precedence over all other priorities
within SOC panels. For example, if a source has triggered a medium and high priority, only the
high threat will be shown. A high can be dismissed to a watch.
Medium - threat rules configured with medium priority take precedence over low, suspect and
watches. A medium can be escalated to a high threat or dismissed to a watch.
Low - threat rules configured with low priority take precedence over suspect and watches. A low
can be escalated to a medium or high threat priority or dismissed to a watch.
Suspect - a source that communicated with a number of unused IP Addresses within a protected
segment. A suspect can be escalated to a low, medium, or high threat. Suspect can be dismissed
to a watch.
Watch - a source that communicated within a protected segment. The source may or may not
reside within the segment. A watch can be escalated to a suspect, low, medium or high.
The Response icons represent an aggregate threat response for all Sentriant NG appliances managed
under the SOC. The detection states are described below:
Cloak - A patent-pending technique by which the Sentriant NG appliance unilaterally controls
and terminates a communications flow between two or more computers.
Sentriant NG Operation Console User Guide, Software Version 2.5 11
Overview
Deceive, Snare, and Slow Scan - Sentriant NG appliances use a special "deceiving" technique to
engage and hold TCP-based attacks, thus preventing them from spreading. Snaring stops an
attacking threat from moving to another computer. Slow Scan sends the attacking threat traffic
designed to significantly increase the time it takes for an external host to scan the monitored
network, causing the attacker to consume time and resources.
Track - A Sentriant NG appliance monitors the communication between two or more computers
but does not take a response action.
None - No response is invoked.
The Appliance Health icon represents an aggregate operating status for all Sentriant NG appliances
managed under the SOC. If an error or warning is encountered with an appliance, the icon will change
accordingly displaying the highest severity. For example, a domain made up of four (4) appliances
encounters an error with one appliance and another has a warning. The Appliance Health icon will
show that there is an appliance with an error since it is a higher severity. Clicking on the icon will
navigate to the appliance with the error. The appliance states are described below:
An error has been found with a Sentriant NG appliance
A warning with the Sentriant NG appliance
The Sentriant NG appliance is operating normally
The Sentriant NG appliance is off line
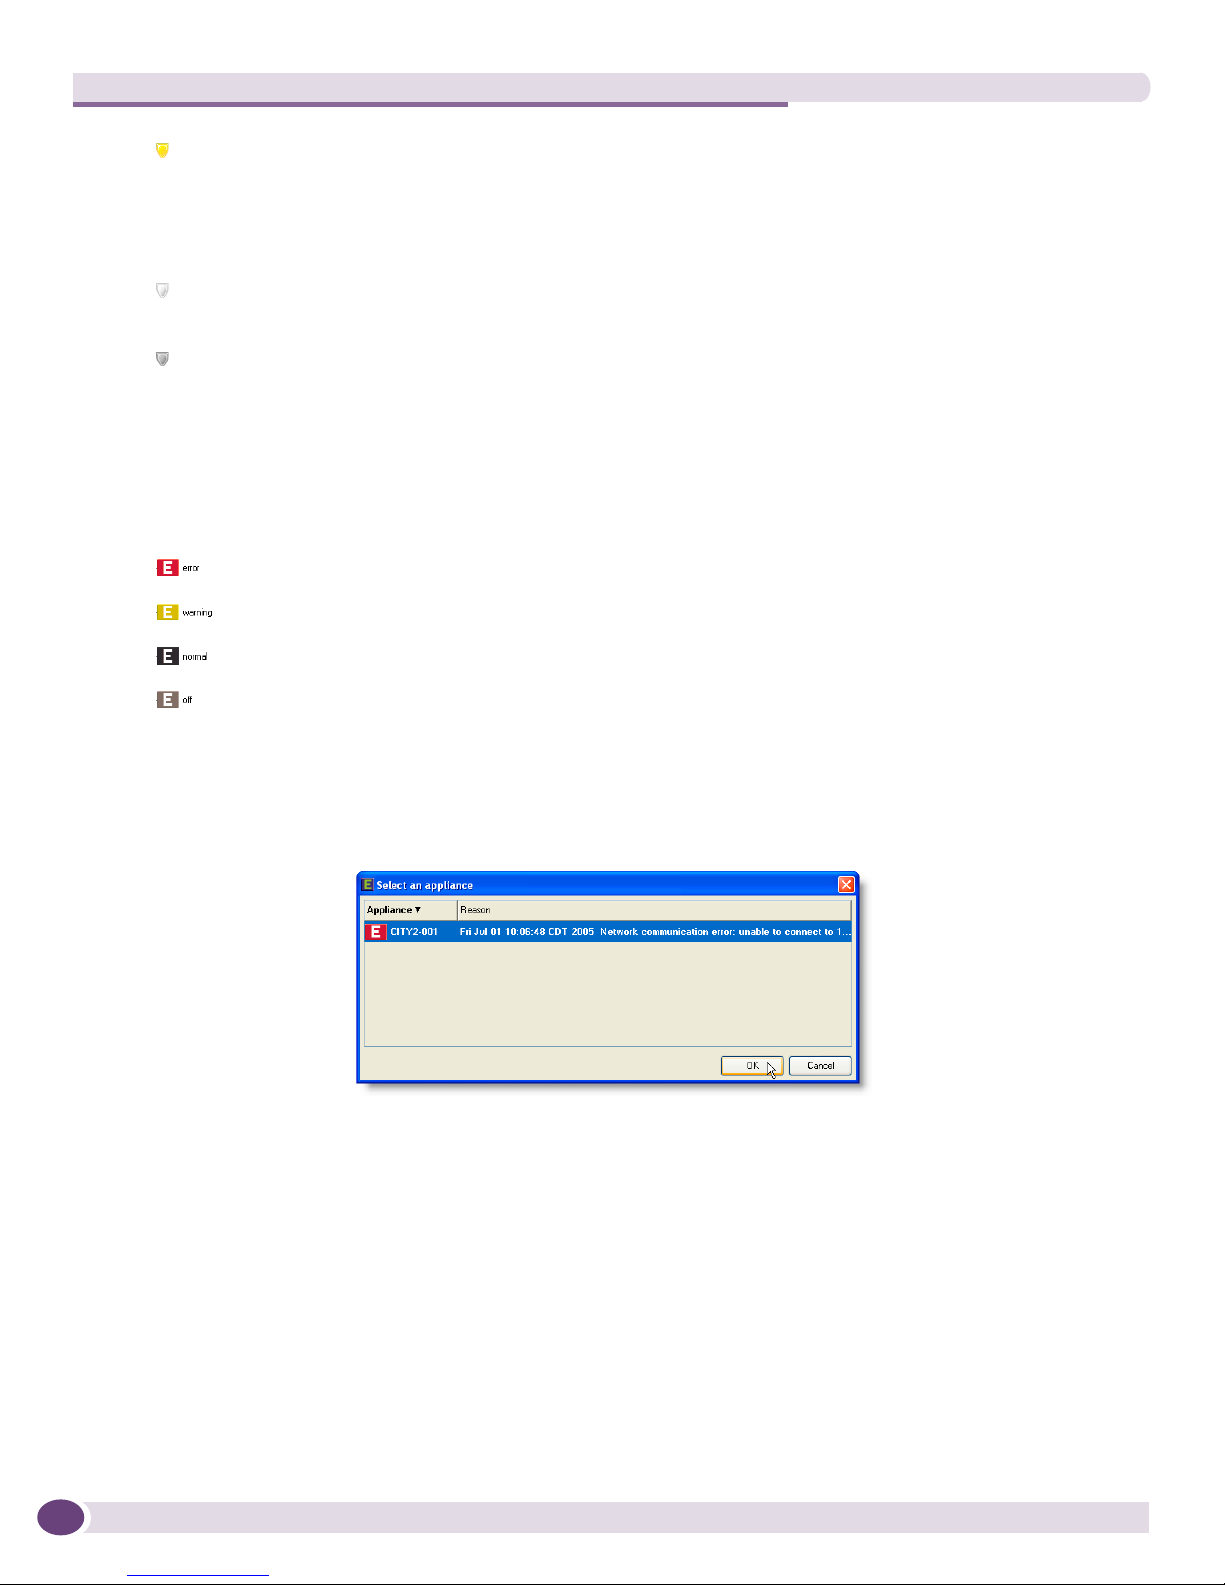
When an appliance is not available, an error message is generated. Clicking on the appliance icon in the
General Status Bar opens the Appliance Availability dialog. The message contains a timestamp of when
the SOC last tried to contact the appliance, and a message that describes the problem. Selecting the
appliance and clicking OK will navigate to the appliance in the Setup > Appliance panel.
The General Status Message displays a textual representation of the filtering done by the Folder List or
Panel Navigation Bar in the Information Panel.
Sentriant NG Operation Console User Guide, Software Version 2.512
Navigating the Sentriant NG Operation Console
For example, a query or filter on a domain named Main Campus containing 3 domains and 1 appliance.
The General Status Message returns:
Results: Domain=3, Appliances=1.
Clicking the Help button brings up context-sensitive help for the currently displayed panel.
Sentriant NG Operation Console User Guide, Software Version 2.5 13
Overview
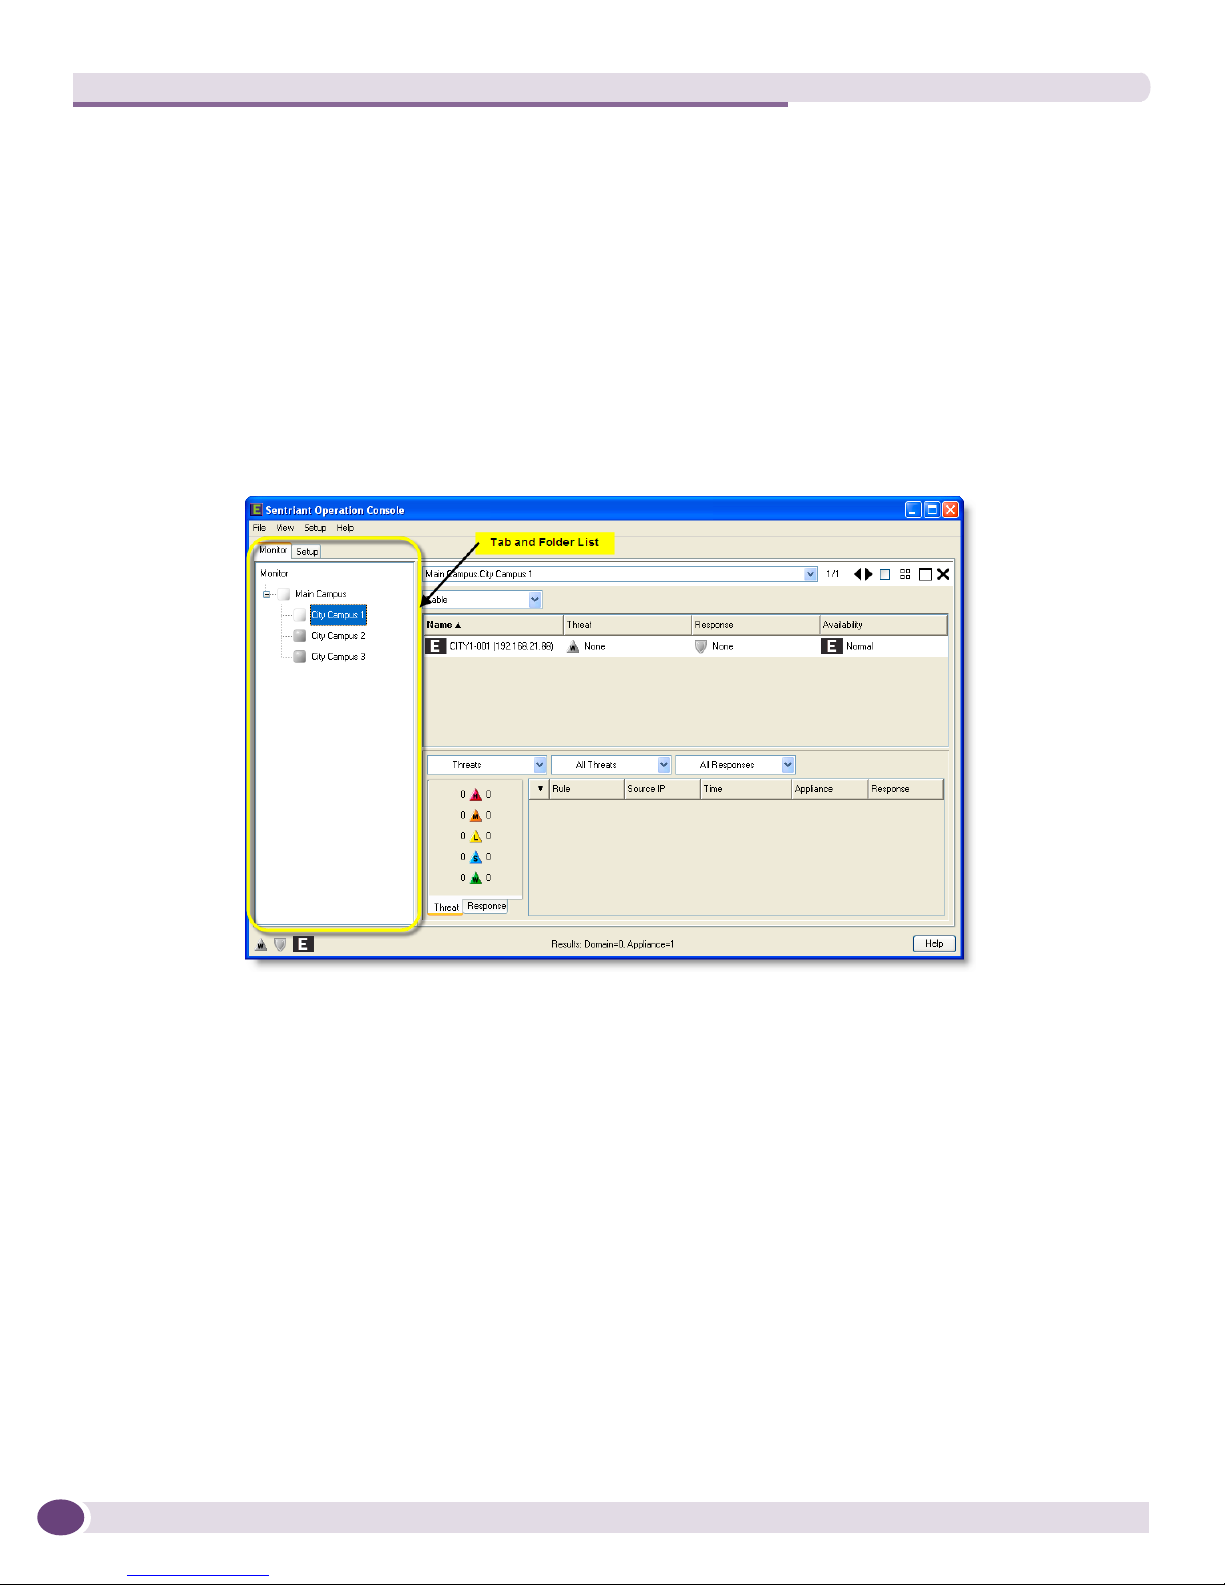
Tab and Folder List
The main SOC screen is divided into two panels. The left side of the screen is dedicated to navigation
and organizing similar information.
The Tab List has two tabs, Monitor and Setup. The Monitor Tab contains information and controls to
monitor domains and appliances. The Setup Tab contains information and controls to manage SOC
configurations of domains, appliances, and policy distributions.
The Folder List is a tree list with a hierarchical structure graphically representing domains, appliances
and policies managed by the SOC. For example, selecting a domain will display the assigned appliance
for that domain. For Windows, a plus sign ( + ) next to a folder icon indicates a closed folder; a minus
sign ( - ) indicates an open folder.
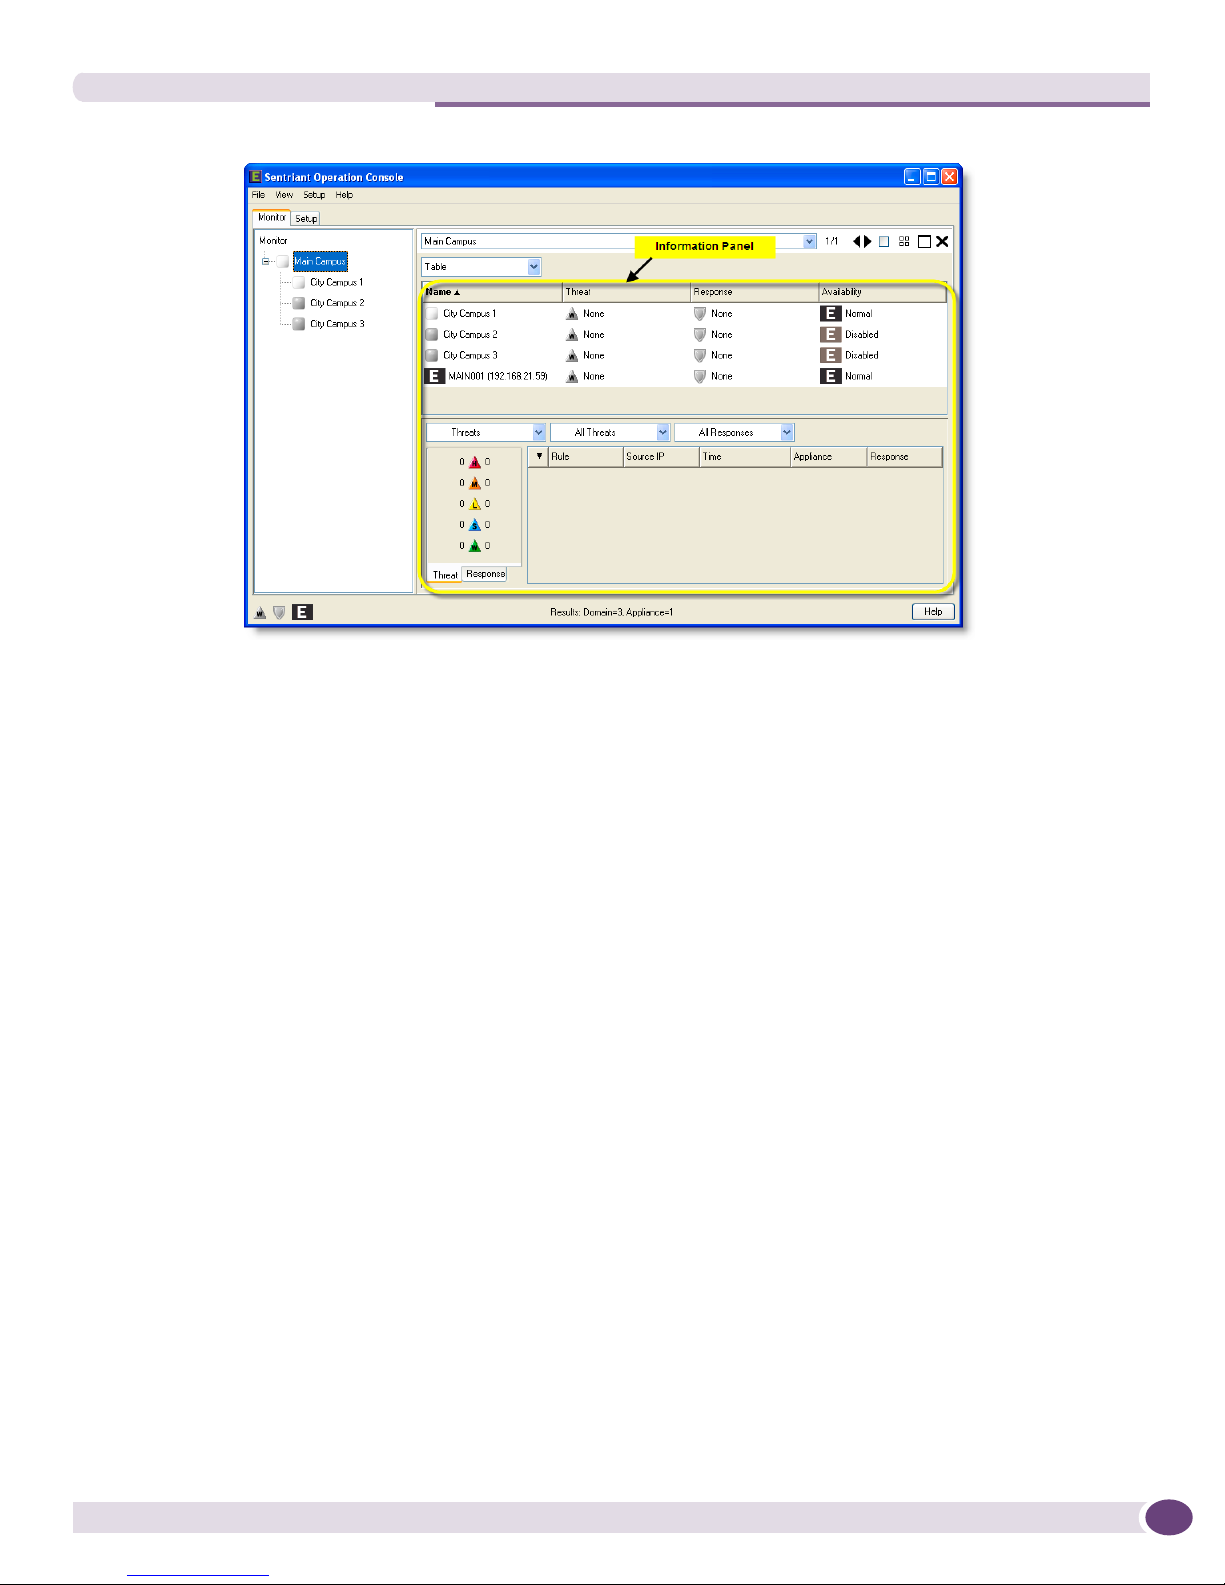
Information Panel
The large area that occupies most of the program window is the Information Panel which displays the
contents of a selected object. Each object has a corresponding panel that provides menus and tools
specific to the tasks that you may need to perform while working in that object.
Sentriant NG Operation Console User Guide, Software Version 2.514
Navigating the Sentriant NG Operation Console
Selecting a tab and then clicking a folder in the Folder List displays one of the following panels:
Monitor - From this panel you can view and manage appliances and threats. The Monitor Panel
displays threat and response information rolled up for the selected domain. Selecting an appliance
displays only threat and response information for the selected appliance. You may multi-select domains
that reside under the main domain and/or appliances to view threat and response information.
Setup - From this panel you can create domains and add appliances as members of the SOC. The Setup
Panel displays domains and appliances in a navigable tree format. Domains can have multiple layers of
domains. Appliance and domains can be moved from one location to another.
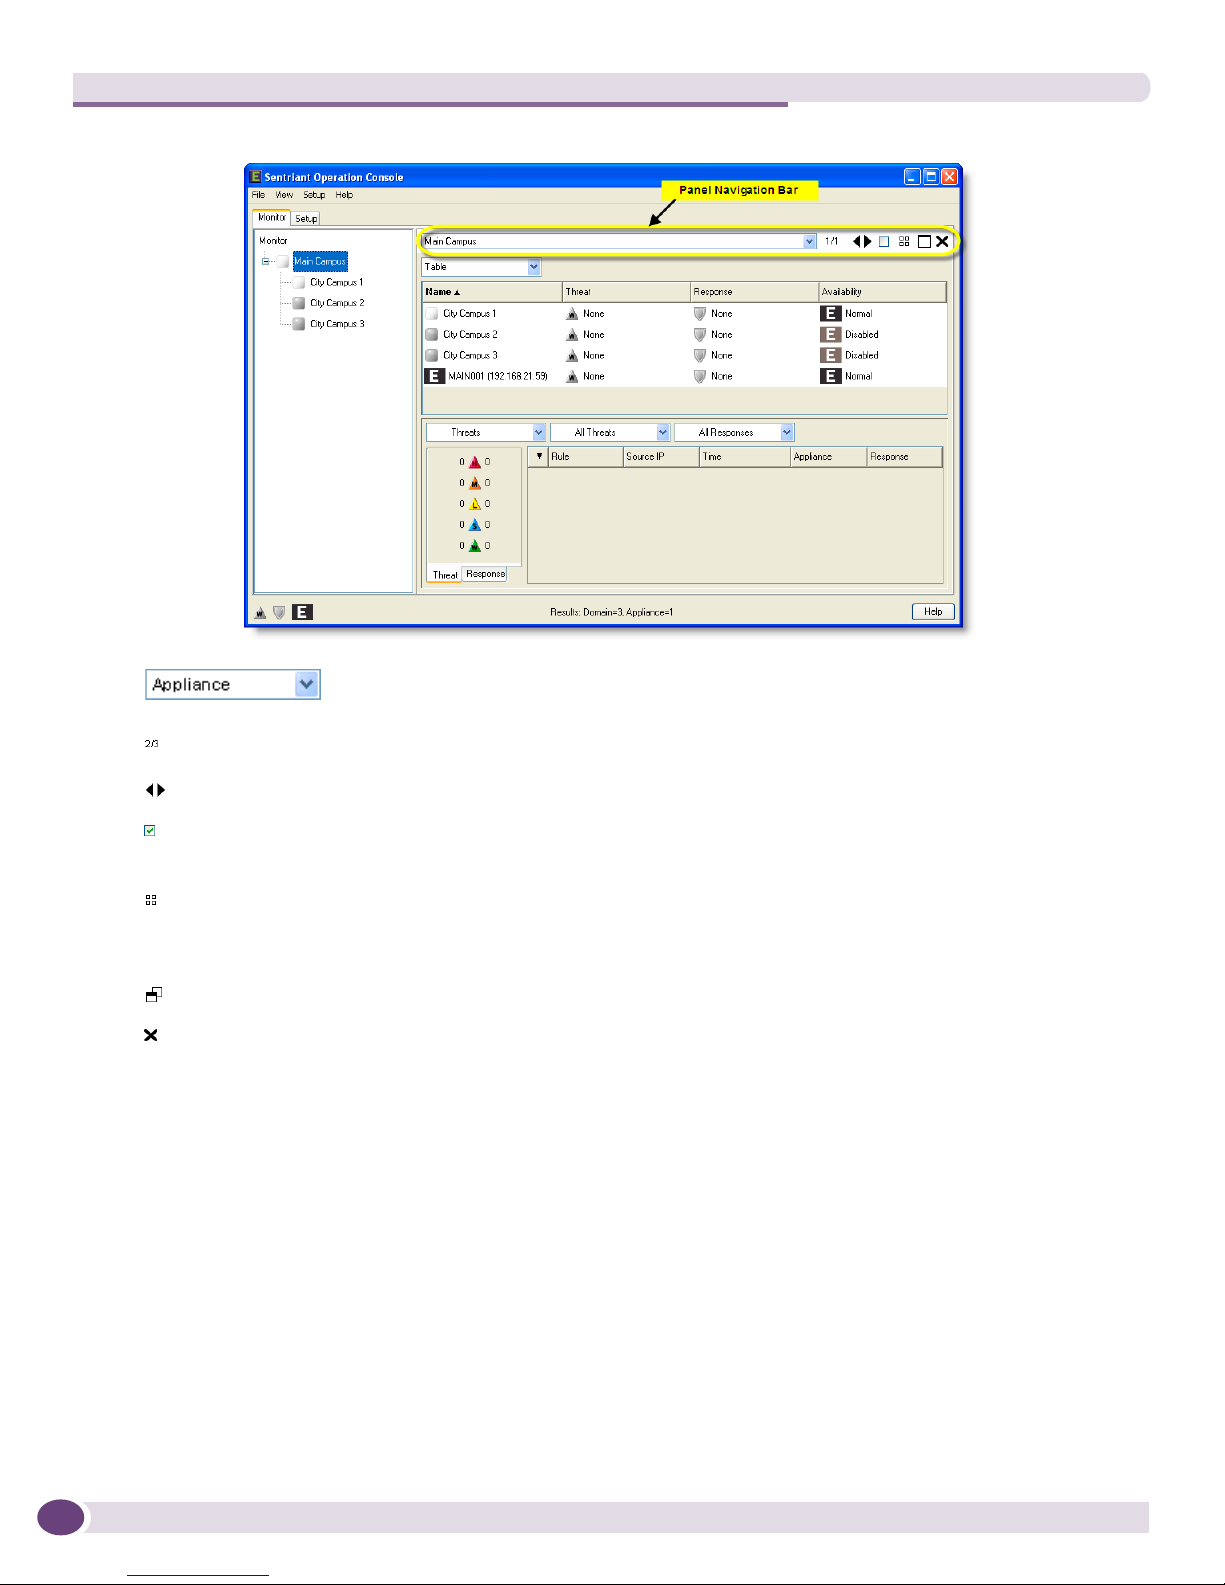
Panel Navigation Bar
The Panel Navigation Bar provides a means of changing the way panels are displayed within the
Information Panel. A drop-down list keeps track of opened category panels. Controls for changing
Information Panels are provided and determine how the panels are displayed. Panels can be turned off,
tiled or displayed singularly.
Sentriant NG Operation Console User Guide, Software Version 2.5 15
Overview
Drop-down list of opened panels. Selecting a panel from the drop-down list will
display that panel.
Indicates the logical ordering of panels under the current top-level node.
Click the right or left arrow to scroll forward or backward through the panels.
Keeps the current panel active when you navigate to another panel. When selecting Tile, the
panel marked as 'keep' will be displayed in the panel workspace.
Click the Tile icon to tile all panels that have been opened. The tile panels button is used mainly
when you are reviewing charts across multiple segments. By tiling the trend charts, you will see
activity across multiple segments on the screen at once.
Click the icon to maximize or minimize the panel.
Click the icon to close the panel.
Customizing the Screen
The Sentriant NG Operation Console displays information in the Information Panel as a tabular list of
items, along with their major properties. These properties are arranged in columns that you can sort,
hide, and resize.
Setting User Preferences
To set user preferences:
Sentriant NG Operation Console User Guide, Software Version 2.516

Customizing the Screen
1 From the Menu, select File > User Preferences.
The User Preferences dialog opens. From this dialog, you can change the panel that opens when you
start the SOC and how the help system is displayed.
2 From the Startup drop-down list, select either Last panel before exit or Use current panel. If you
select Last panel before exit, the last panel you had open will reopen the next time you start the
SOC. If you select Use current panel, the panel you have open when setting this option will open the
next time you start the SOC.
3 From the Help drop-down list, select either Console, Popup Window, or Help System. Selecting
Console will display the console with the SOC in the Information Panel, selecting Popup Window
will open a browser-like window, selecting Help System will display help in Java Help application.
Sorting Data
Sorting arranges data in a list sequentially according to values. Data can either be sorted in an
ascending or descending order alphabetically, by threat or response type, availability, and numerically.
Clicking a row header in the Information Panel will sort data. See the examples below.
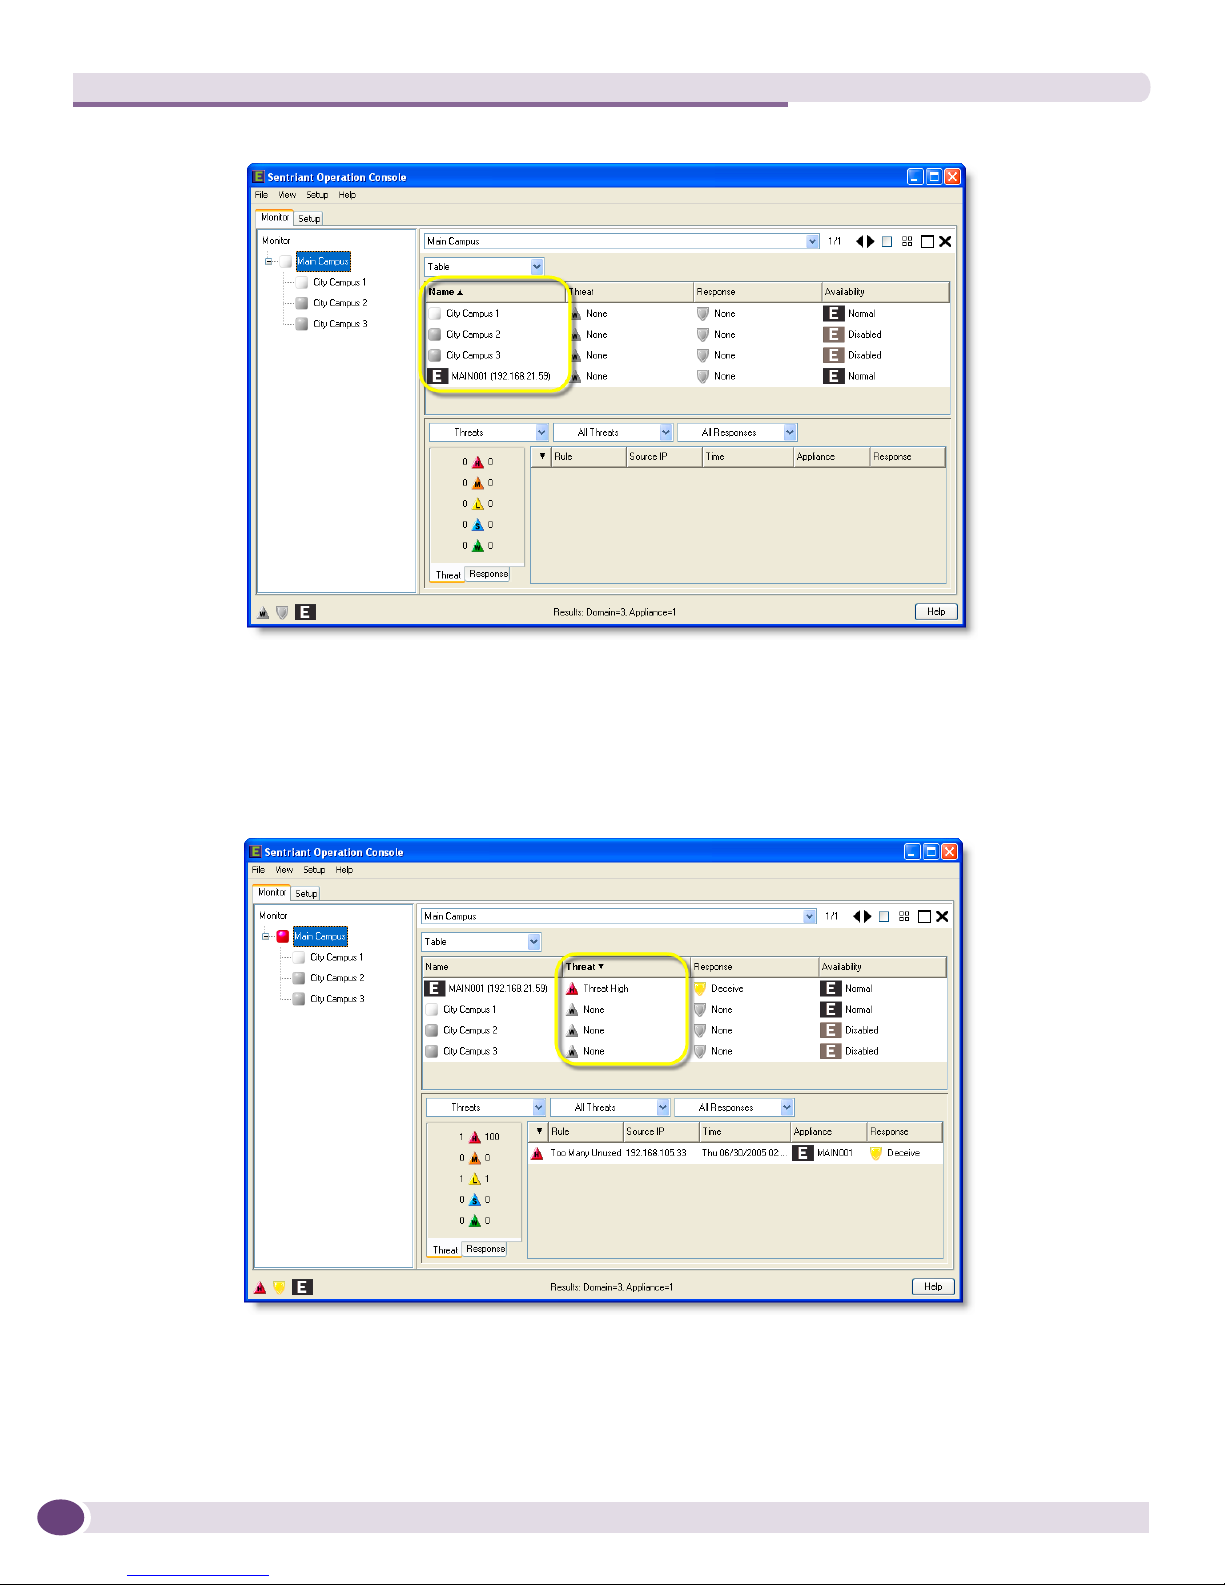
Sorting Alphabetically
Clicking the Domain row in the Monitor Panel will sort domains alphabetically in an ascending order
(A-Z). Clicking again will sort domains in a descending order (Z-A).
Sentriant NG Operation Console User Guide, Software Version 2.5 17
Overview
Sorting Threats
Clicking the Threat row header in the Monitor Panel will sort threat detection based on threat priority.
When you see the arrow in the row header pointing up, the sort will start with the lowest priority and
increase in priority with high at the end of the list. Clicking the row again will sort the list with the
highest priority at the beginning of the list and the lowest at the end.
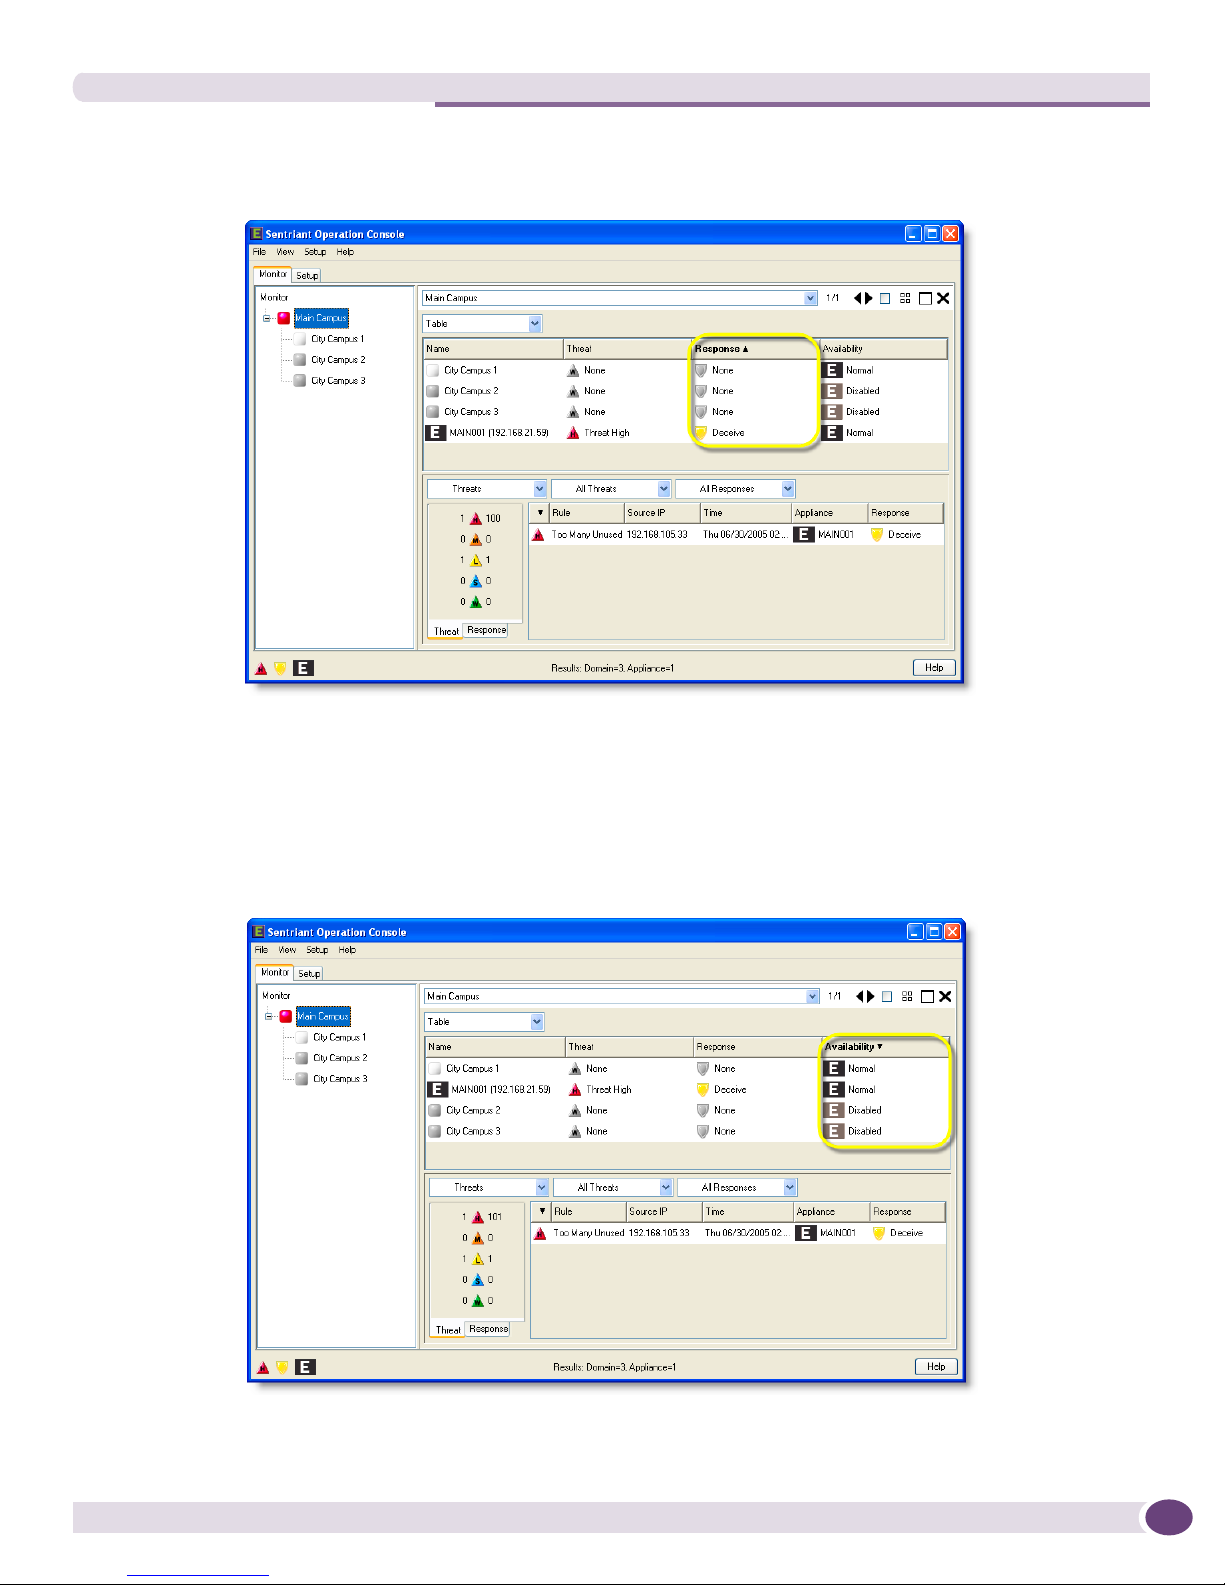
Sorting Response Type
Clicking the Response row header in the Monitor Panel will sort responses to threats based on type.
When you see the arrow in the row header pointing up, the sort will start with the lowest priority and
Sentriant NG Operation Console User Guide, Software Version 2.518
Customizing the Screen
increase in the following order; None, Track, Deceive/Snare and Cloak at the end of the list. Clicking
the row again will sort the list with Cloak at the beginning of the list and None at the end.
Sorting Availability
Clicking the Availability row header in the Monitor Panel will sort responses to threats based on
appliance health. When you see the arrow in the row header pointing up, the sort will start with the
appliances in a normal working state and increase in the following order; Normal, Warning, Error and
Off at the end of the list. Clicking the row again will sort the list with Off at the beginning of the list
and Normal at the end.
Sentriant NG Operation Console User Guide, Software Version 2.5 19
Overview
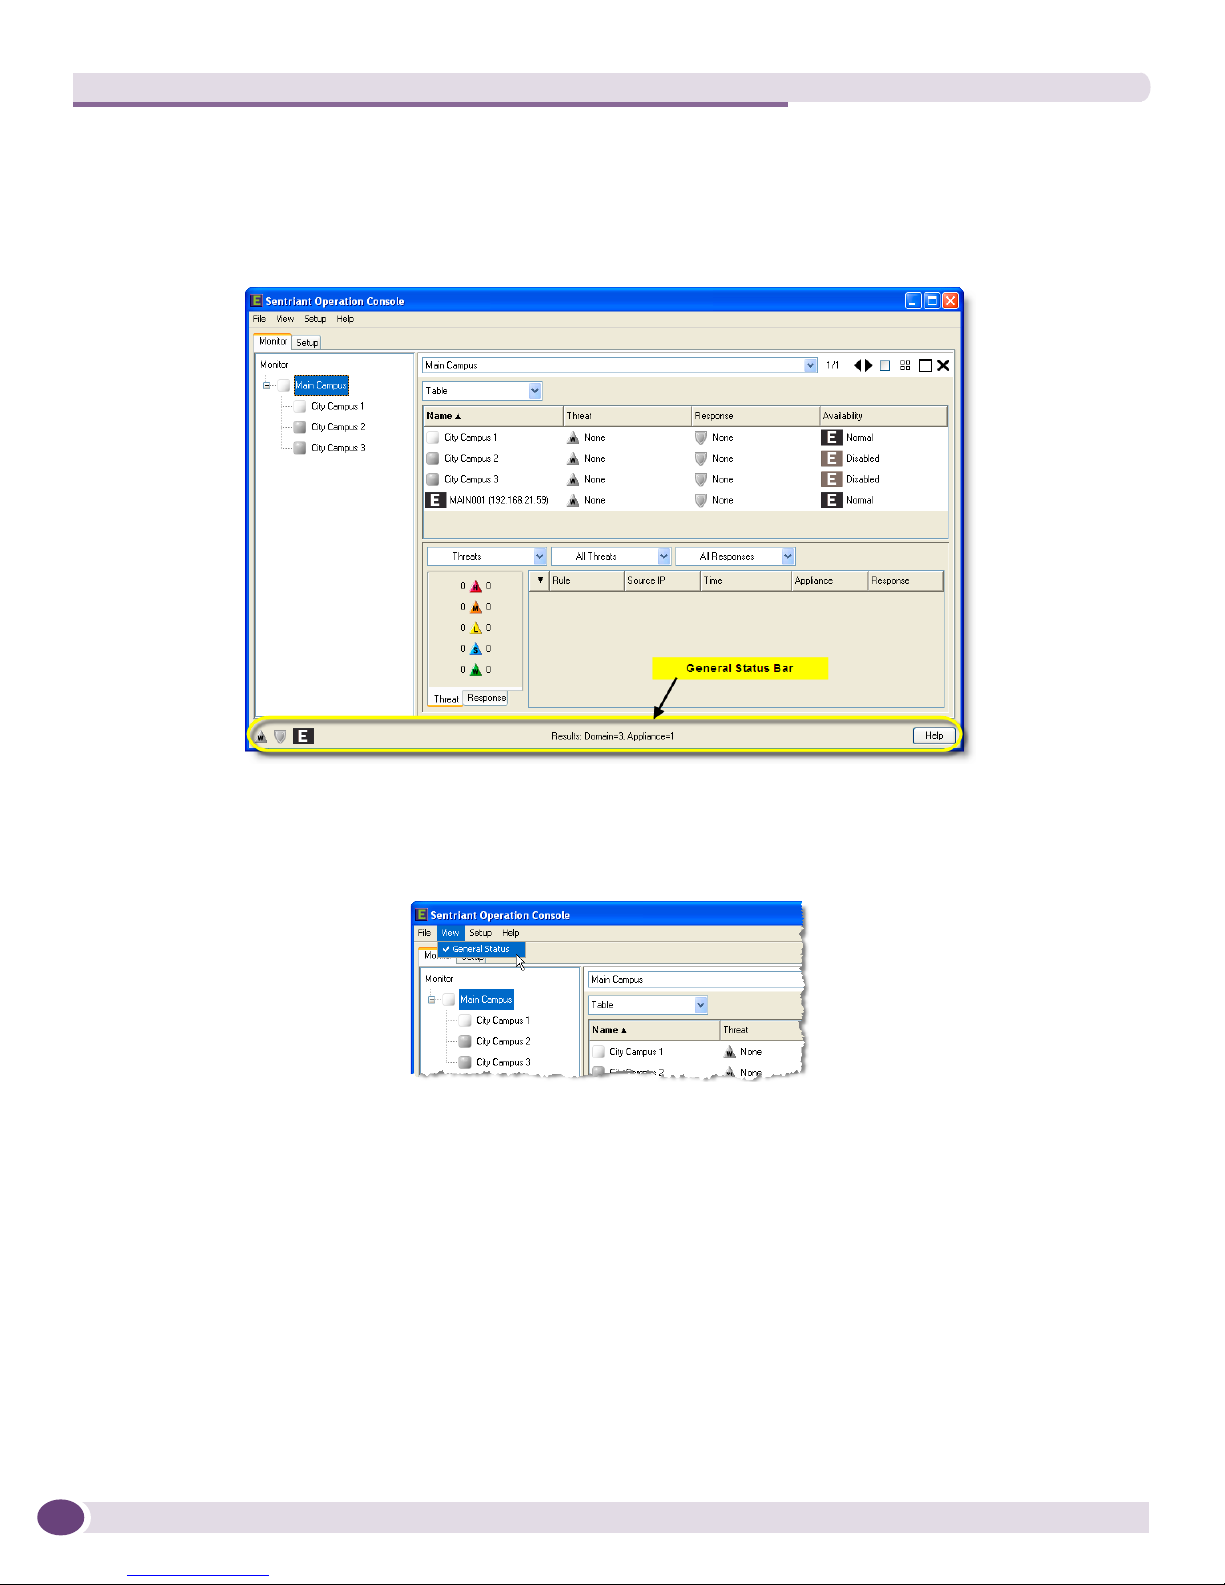
Showing and Hiding General Status Bar
The General Status Bar displays the status of activities for the appliance health, segments, and events.
You can hide and show the General Status Bar as needed while you work.
To show or hide the General Status Bar:
From the View menu, select General Status to hide. A check mark indicates the display is visible.
Getting Help
The Sentriant NG Operation Console provides on-screen assistance as you move about and perform
tasks by displaying messages, tips, and by clicking on the Help button to display context sensitive help.
Additional information under the Help menu includes an icon legend and software version installed.
Sentriant NG Operation Console User Guide, Software Version 2.520
Getting Help
Messages and Tool Tips
The Sentriant NG Operation Console provides brief descriptive messages that indicate what a command
will do before you select the command. One kind of message is the General Status Message, which
appears in the General Status Bar at the bottom of the screen. When you perform a command, the
General Status Message is constructed based on the command. For example, selecting a domain will
display the number of domains and appliances residing within the selected domain.
Another type of message is a Too l Tip , a text label describing the function of a toolbar button. Tool Tips
appears when you place the pointer over a button, table field or other type of command or control
.
Context-Sensitive Help
Context-sensitive help is also available for most of the Sentriant NG Operation Console Information
Panels. The corresponding Help topic displays when you press the Help button located at the bottom
right of the General Status Bar.
Sentriant NG Operation Console User Guide, Software Version 2.5 21

Overview
About the Sentriant NG Operation Console
The About command on the Help menu displays the About Sentriant Operation Console dialog which
shows the version of the Sentriant NG Operation Console that you are using in the title bar of the
dialog.
Icon Legend
An Icon Legend is provided that groups icons relative to their usage (for example, threat priority,
domain, appliance). A short description follows each icon. You may collapse or expand each group as
needed.
To view the Icon Legend:
Sentriant NG Operation Console User Guide, Software Version 2.522
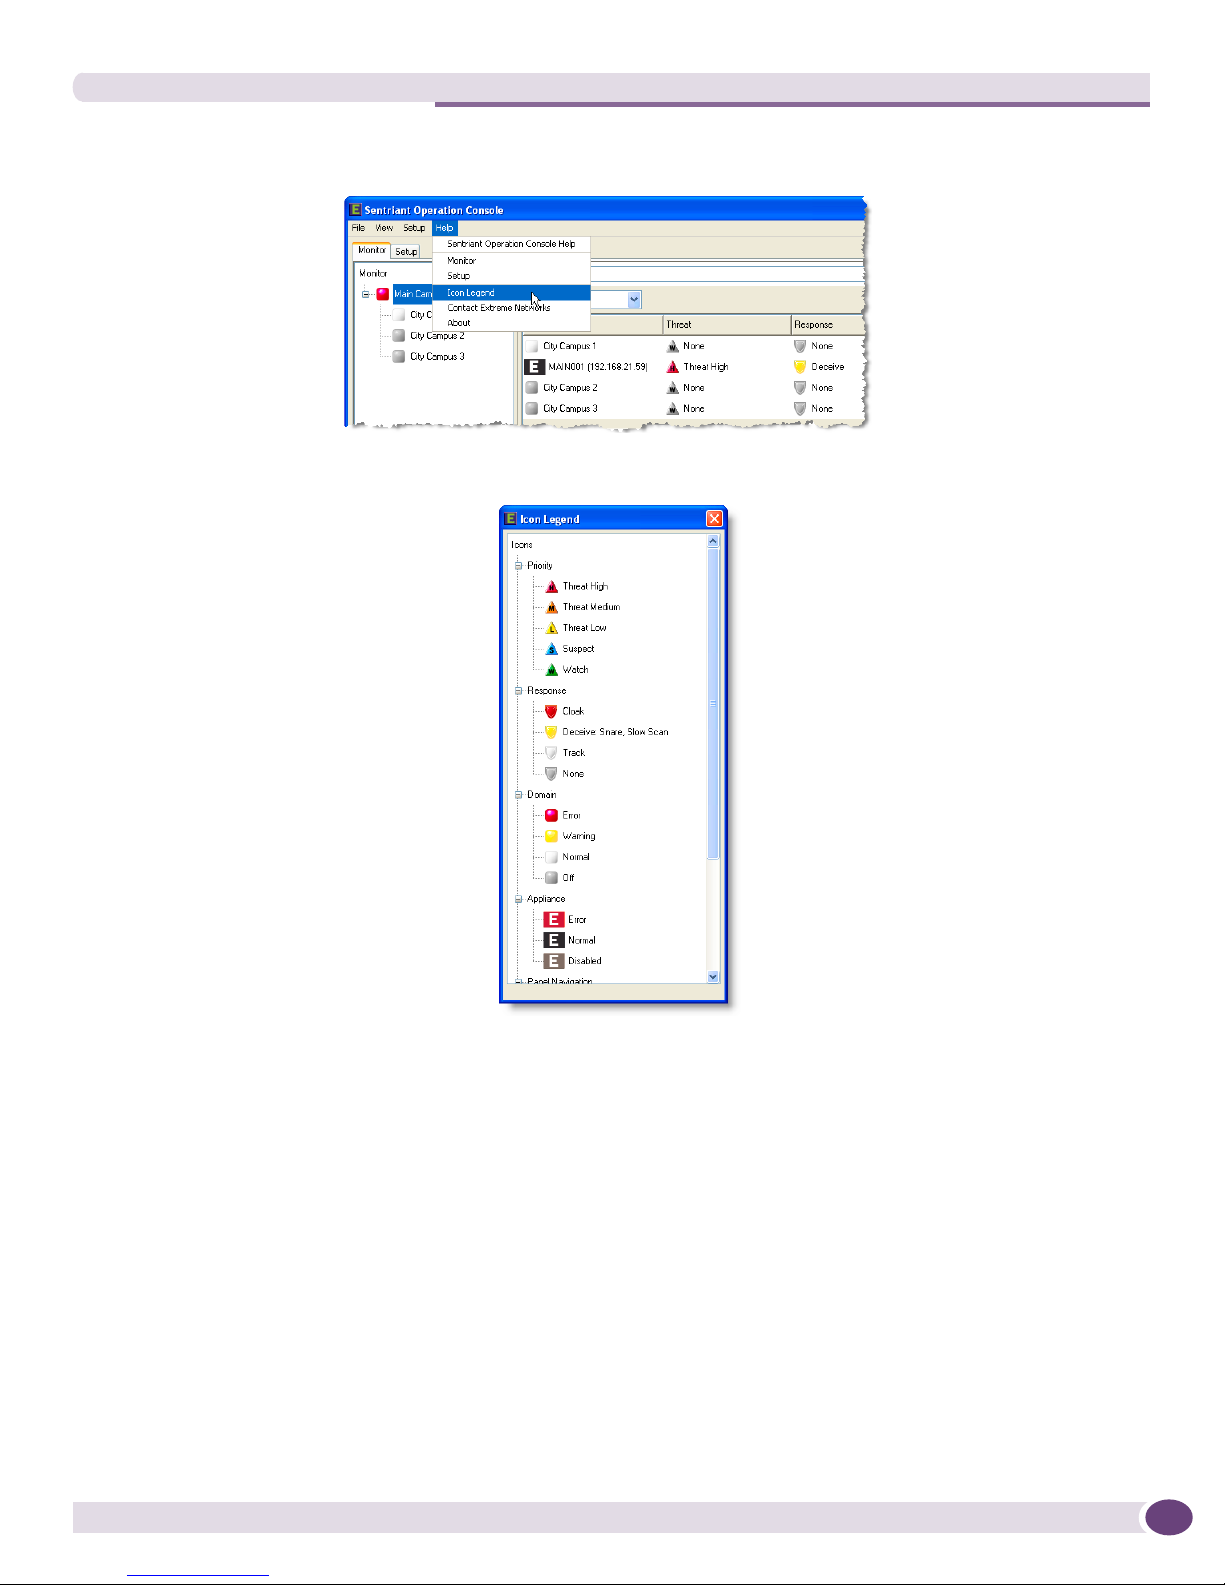
1 From the Menu Bar, select Help then Icon Legend.
2 Scroll down the list to see the icon categories.
Contacting Extreme Networks
Contacting Extreme Networks
Please contact Extreme Networks Support by logging into our Technical Support Portal at
https://esupport.extremenetworks.com. The portal allows you to search the Extreme Networks
knowledge base, submit a support incident, and track incidents that your organization has submitted. If
you wish to speak with a support representative, call toll free at (800)-998-2408. Before calling, please
create a support incident through the portal and reference the incident number.
If you report an incident with the Sentriant NG Operation Console, please include the following
information:
● Your name, email, phone and fax number
● A description of the incident and what you were trying to do
Sentriant NG Operation Console User Guide, Software Version 2.5 23

Overview
● Sentriant NG Manager Software version number
Sentriant NG Operation Console User Guide, Software Version 2.524

2 Monitor
The SOC Monitor Panel provides a navigation view for ascertaining threat and appliance status across
multiple domains containing multiple appliances. When the SOC is launched, the Monitor Panel
displays a navigation tree on the left of the screen that represents nodes of the enterprise or domains.
Domains may contain sub-domains based on network deployment. Domains are where appliances are
added as members of the SOC that have been deployed throughout an enterprise.
Selecting a domain will display the appliances within the domain in the Information Panel to the right
of the navigation tree. Appliance information is relayed to the operator to include the appliance name,
threats detected, responses sent to threat sources, and appliance availability.
Appliance information can be viewed in two modes, a table mode that displays appliances under a
single domain in a tabular view, and a radial view that displays the entire enterprise deployment
graphically like the spokes of a wheel. The center of the wheel is the highest level, or root of the
deployment with each spoke representing a branch of the network. Appliances are located at the end of
each branch.
Threat and Response information is displayed in the details panel located at the bottom of the screen.
The Threat and Response counters represent a roll up of the threats detected for the appliance. For
example, if an appliance is configured to monitor four(4) segments, the Threat counter will display the
total number of threats detected by the appliance. Selecting the appliance will display the type of
threats and priority status. The Response counter acts similarly by rolling up the responses sent to a
source threat. Filters can be set on the threat or response views to display only certain threat priorities
or response types.
The details panel also contains a trend view. The trend view is an historical representation of threats
detected by Sentriant NG appliances. The trend chart shows total threats and responses for an
appliance. You may multi-select appliances within a domain and display an aggregate count of threats
and responses.
Table View
The Table View displays domains and appliances in a hierarchal list. Choosing a domain gives you subdomains and appliances that are part of the domain. Information for domains include the name of the
domain or appliance, the highest priority threat and response type for an appliance under the domain
or if an appliance is selected, the highest threat detected by the appliance, and availability of the
appliances within the domain or if an appliance is selected. The purpose of this panel is to provide a
means of ascertaining threat and appliance status across multiple domains containing multiple
appliances.
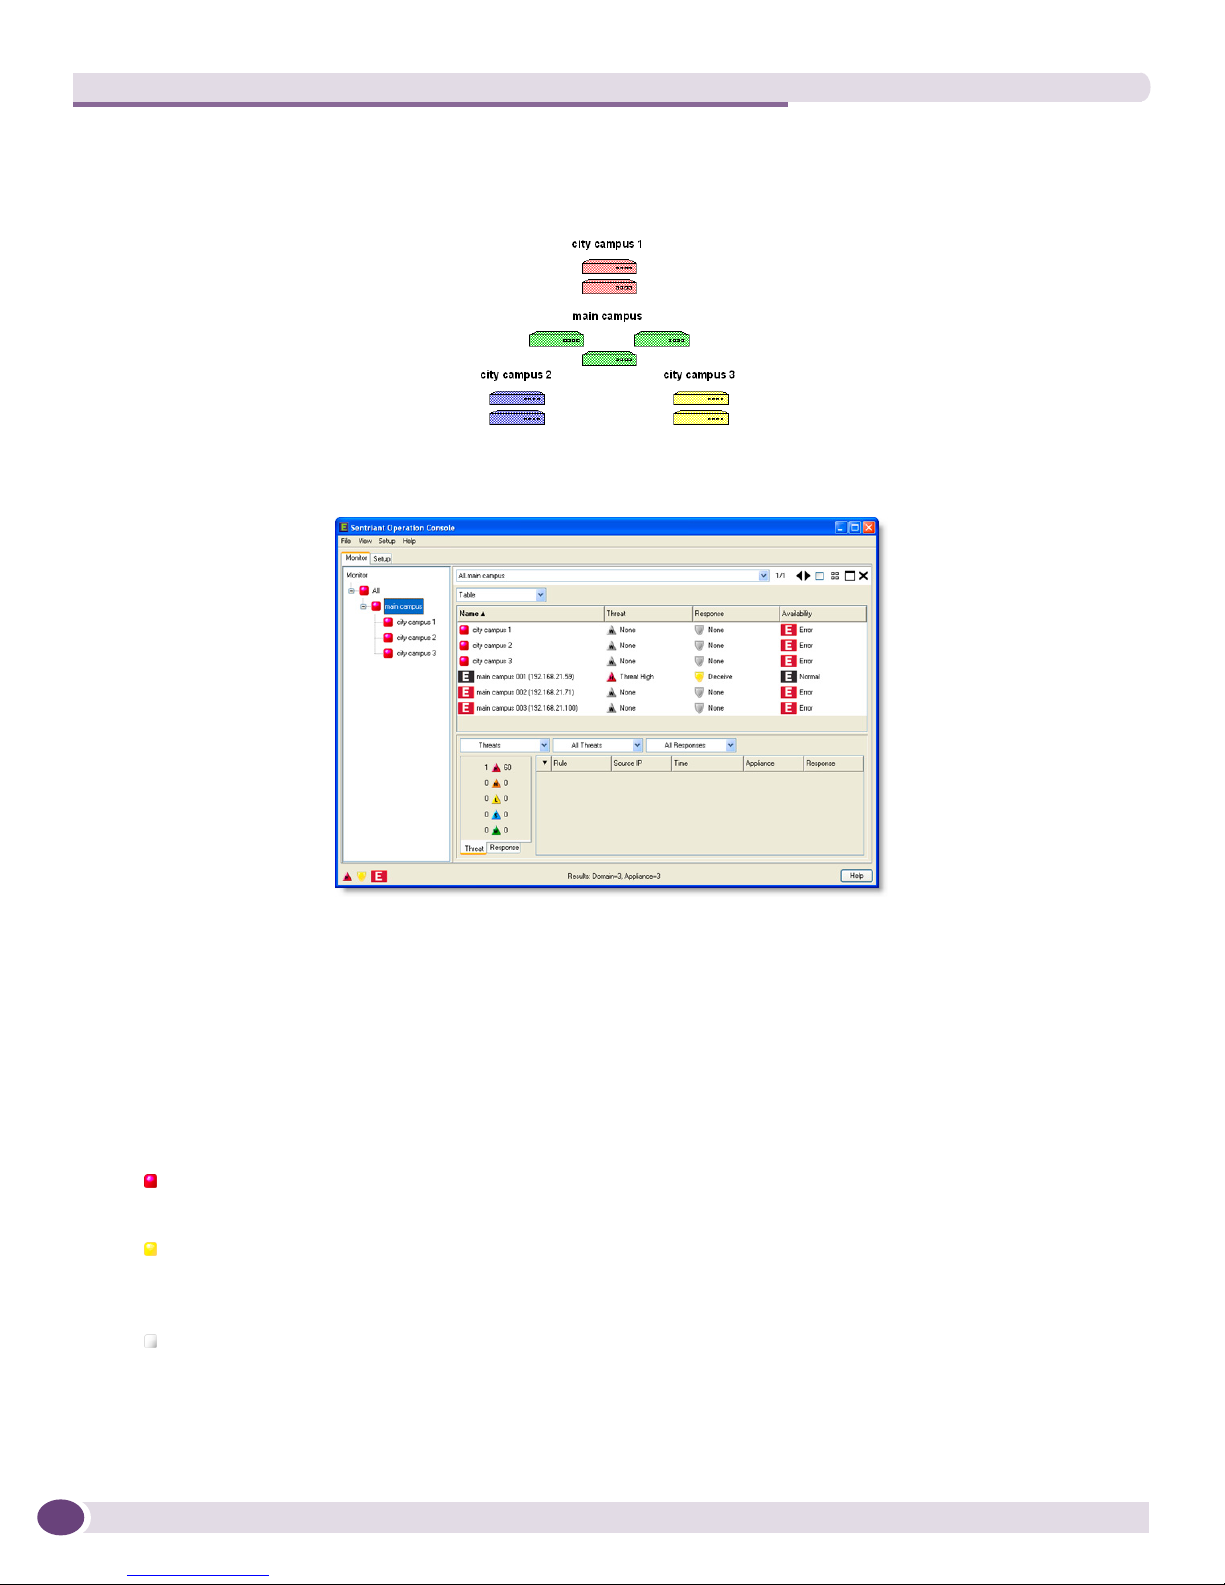
View Domains and Appliances from the Table View
The Table View displays domains which may have sub-domains. Each domain may have a single or
multiple appliances assigned to it. For example, the following diagram shows an enterprise deployment
Sentriant NG Operation Console User Guide, Software Version 2.5 25
Monitor
at a university with a main campus, and three remote city campuses. The main campus has three
Sentriant NG appliances deployed and each remote campus has two Sentriant NG appliances deployed.
The table view will look like this:
The Table view is made up of three components - on the left of the screen is the Domains List, on the
right of the screen is the Information Panel, and at the bottom of the screen is the Details Panel.
Domains List
Domains display an icon that represents the health and status of the domain. The tree displays top level
domains. Clicking on the plus icon will open the folder which displays sub-domains. Domain health
and status icons are as follows:
Error - A general error has been detected on an appliance that may be a high threat or the health
of an appliance encountered an error. High priority threats will result in an error condition.
Warning - A warning has been detected on an appliance that may be an appliance threshold for
disk space usage or a network connection went down. Suspect, low and medium priority threats
will result in a warning condition.
Normal - The appliance or appliances within a domain are functioning normally. Watches may be
present.
Sentriant NG Operation Console User Guide, Software Version 2.526
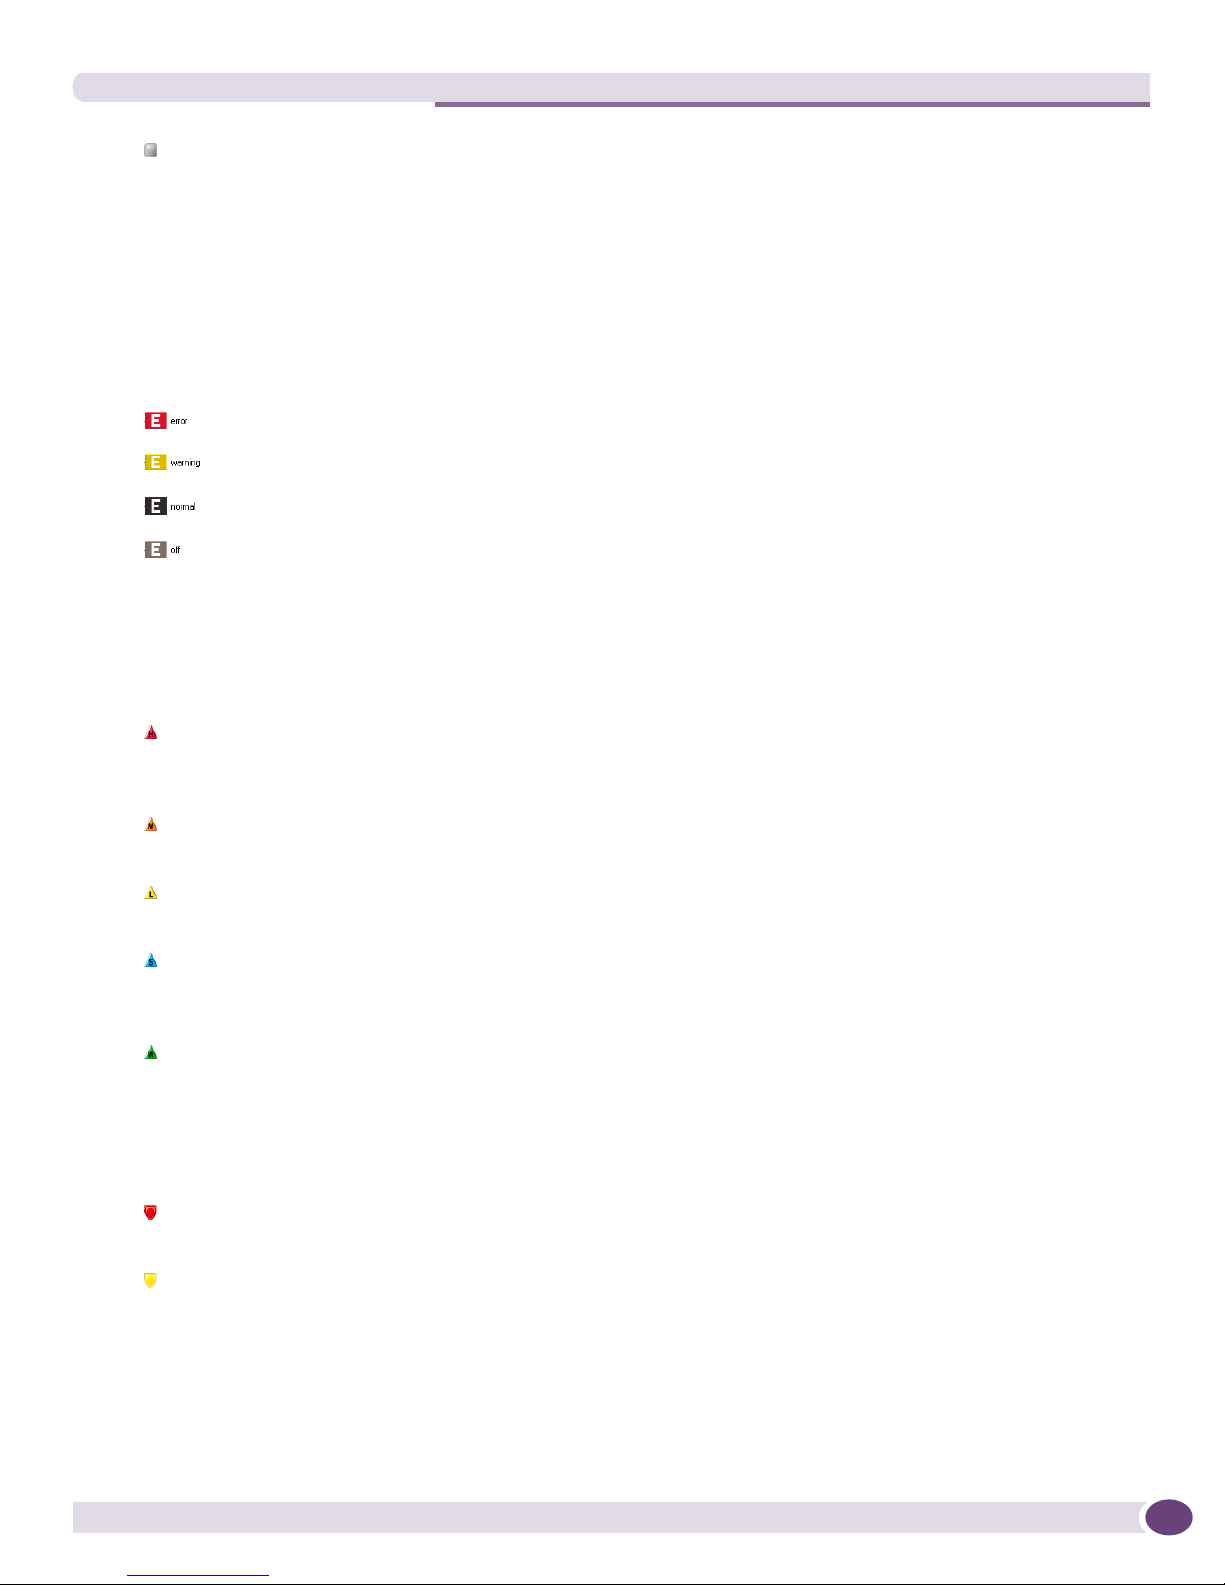
Table View
Off - An appliance has stopped communicating to the SOC.
Information Panel
The Information Panel to the right displays sub-domains and appliances. The Information Panel
displays the following data:
Domains/Appliances - The name of the domain or appliance with an icon representing the health and
status. Appliance status icons are as follows:
An error has been found with a Sentriant NG appliance
A warning with a Sentriant NG appliance
The Sentriant NG appliance is operating normally
The Sentriant NG appliance is off line
Threats - A roll up of threats that have been detected. At the domain level, the roll up represents the
total threats with the icon representing the highest threat priority received. Therefore, if an appliance
detects 3 high and 5 medium priority threats, the counter will display the total number of the highest
threat detected, in this case the icon would indicate a high threat with a count of 3. Threat priority icons
are as follows:
High - the most severe priority level. High priorities take precedence over all other priorities
within SOC panels. For example, if a source has triggered a medium and high priority, only the
high threat will be shown. A high can be dismissed to a watch.
Medium - threat rules configured with medium priority take precedence over low, suspect and
watches. A medium can be escalated to a high threat or dismissed to a watch.
Low - threat rules configured with low priority take precedence over suspect and watches. A low
can be escalated to a medium or high threat priority or dismissed to a watch.
Suspect - a source that communicated with a number of unused IP Address within a protected
segment. A suspect can be escalated to a Threat. A suspect can be escalated to a low, medium or
high or dismissed to a watch.
Watch - a source that communicated within a protected segment. The source may or may not
reside within the segment. A watch can be escalated to a suspect, low, medium or high.
Responses - The type of response sent to the threat source. The response displayed will be determined
on the type. Types of responses are Cloak, Deceive, Snare, Slow Scan, Track and None with Cloak being
the most severe response against a source threat.
Cloak - A patent-pending technique by which the Sentriant NG appliance unilaterally controls
and terminates a communications flow between two or more computers.
Deceive, Snare, and Slow Scan - Sentriant NG appliances use a special "deceiving" technique to
engage and hold TCP-based attacks, thus preventing them from spreading. Snaring stops an
attacking threat from moving to another computer. Slow Scan sends the attacking threat traffic
designed to significantly increase the time it takes for an external host to scan the monitored
network, causing the attacker to consume time and resources.
Sentriant NG Operation Console User Guide, Software Version 2.5 27
Monitor
Track - A Sentriant NG appliance monitors the communication between two or more computers
but does not take a response action.
None - No response is invoked.
Availability -The availability of the appliance or appliances under a domain. Appliances have the
following availability states: Error, Normal and Disabled.
An error has been found with a Sentriant NG appliance
A warning with a Sentriant NG appliance
The Sentriant NG appliance is operating normally
The Sentriant NG appliance is off line
Details Panel
The Details Panel displays counts of threats and responses in the counter on the right of the panel. The
counter can show threat and response counts for a single appliance or a roll up of threats and responses
if a domain is selected. You may also multi-select domains and appliances to show a total count for the
selected objects. Filters can be set to select only the threat priority and responses to be displayed in the
counter. The list to the right of the counter displays threat information. Selecting Trends from the
Threat/Trend drop-down list will bring up a chart. The Trend chart shows threats and responses over
time and begins collecting data once the Sentriant NG appliances are started. Threat and response
information is historical and updates periodically therefore may not match what is displayed in the
counters.
Viewing Domain and Appliance Details from Table View
To view Threat Details:
1 From the Monitor Panel, select a domain from the list.
2 Double-click an appliance from the Information Panel or select and right-click to bring up the menu
and select Details.
Sentriant NG Operation Console User Guide, Software Version 2.528
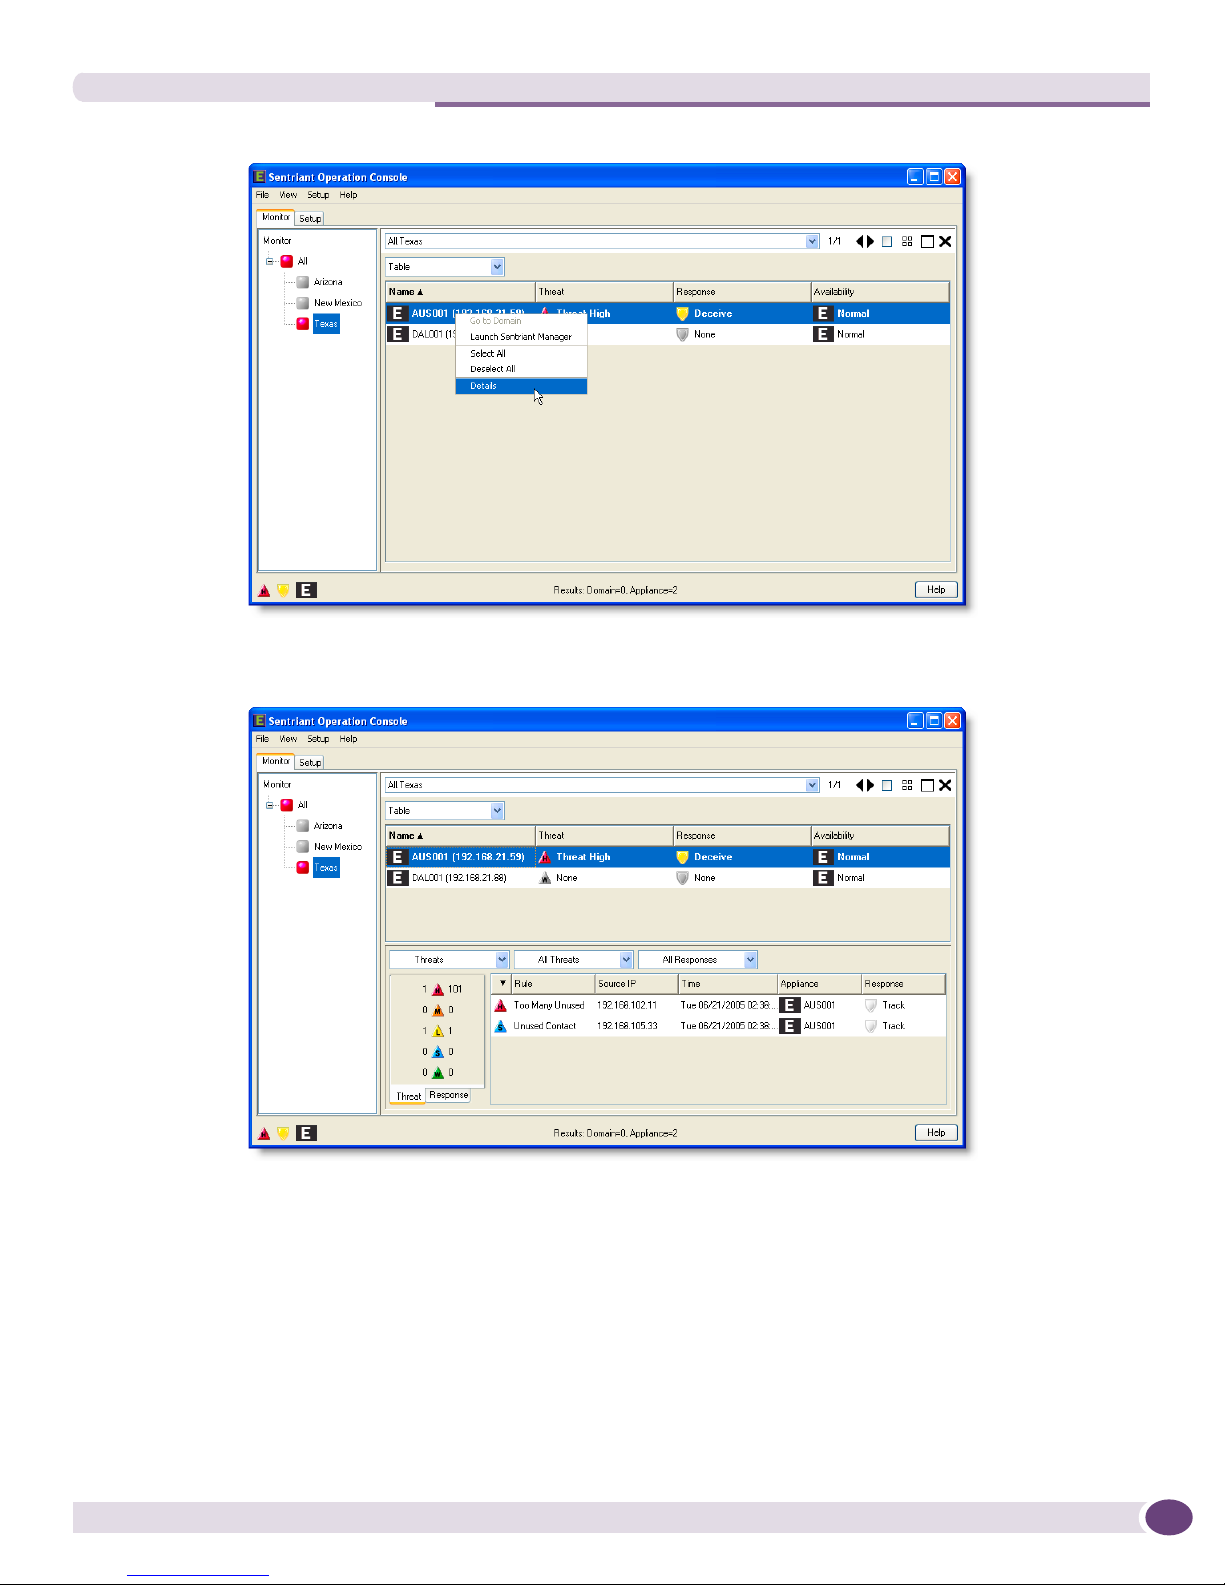
Table View
The Details Panel opens with a set of drop-down lists across the top, a threat/response counter to
the right and an information list displaying active threats for the domain or appliance selected.
Details Panel Drop-down Lists
Threat/Trend - The first drop-down list toggles between the Details Panel displaying the threats/
response counter and the trend chart.
Threat Filter - The second drop-down list filters the threat priorities that are displayed in the counter
and information list. Selecting a threat priority will display data only for the selected priority.
Response Filter - The third drop-down list filters response types that are displayed in the counter and
information list. Selecting a response type will display data only for the selected response.
Sentriant NG Operation Console User Guide, Software Version 2.5 29
Monitor
Counter
The counter can be toggled between threats and responses by clicking the tabs located below the
counter. The counter can show threat and response counts for a single appliance or a roll up of threats
and responses if a domain is selected. You may also multi-select domains and appliances to show a total
count for the selected objects.
Information List
The information list displays a breakdown of all threats detected from a domain or appliance. This view
differs from the Information Panel in that the Information Panel shows a roll up of the highest threat
priority only. The detail information list displays a breakdown of all threats detected. The following
data is displayed in the information list:
● threat priority
● rule that has been triggered
● source IP Address
● date and time the threat triggered
● appliance name and status
● response type taken against the threat
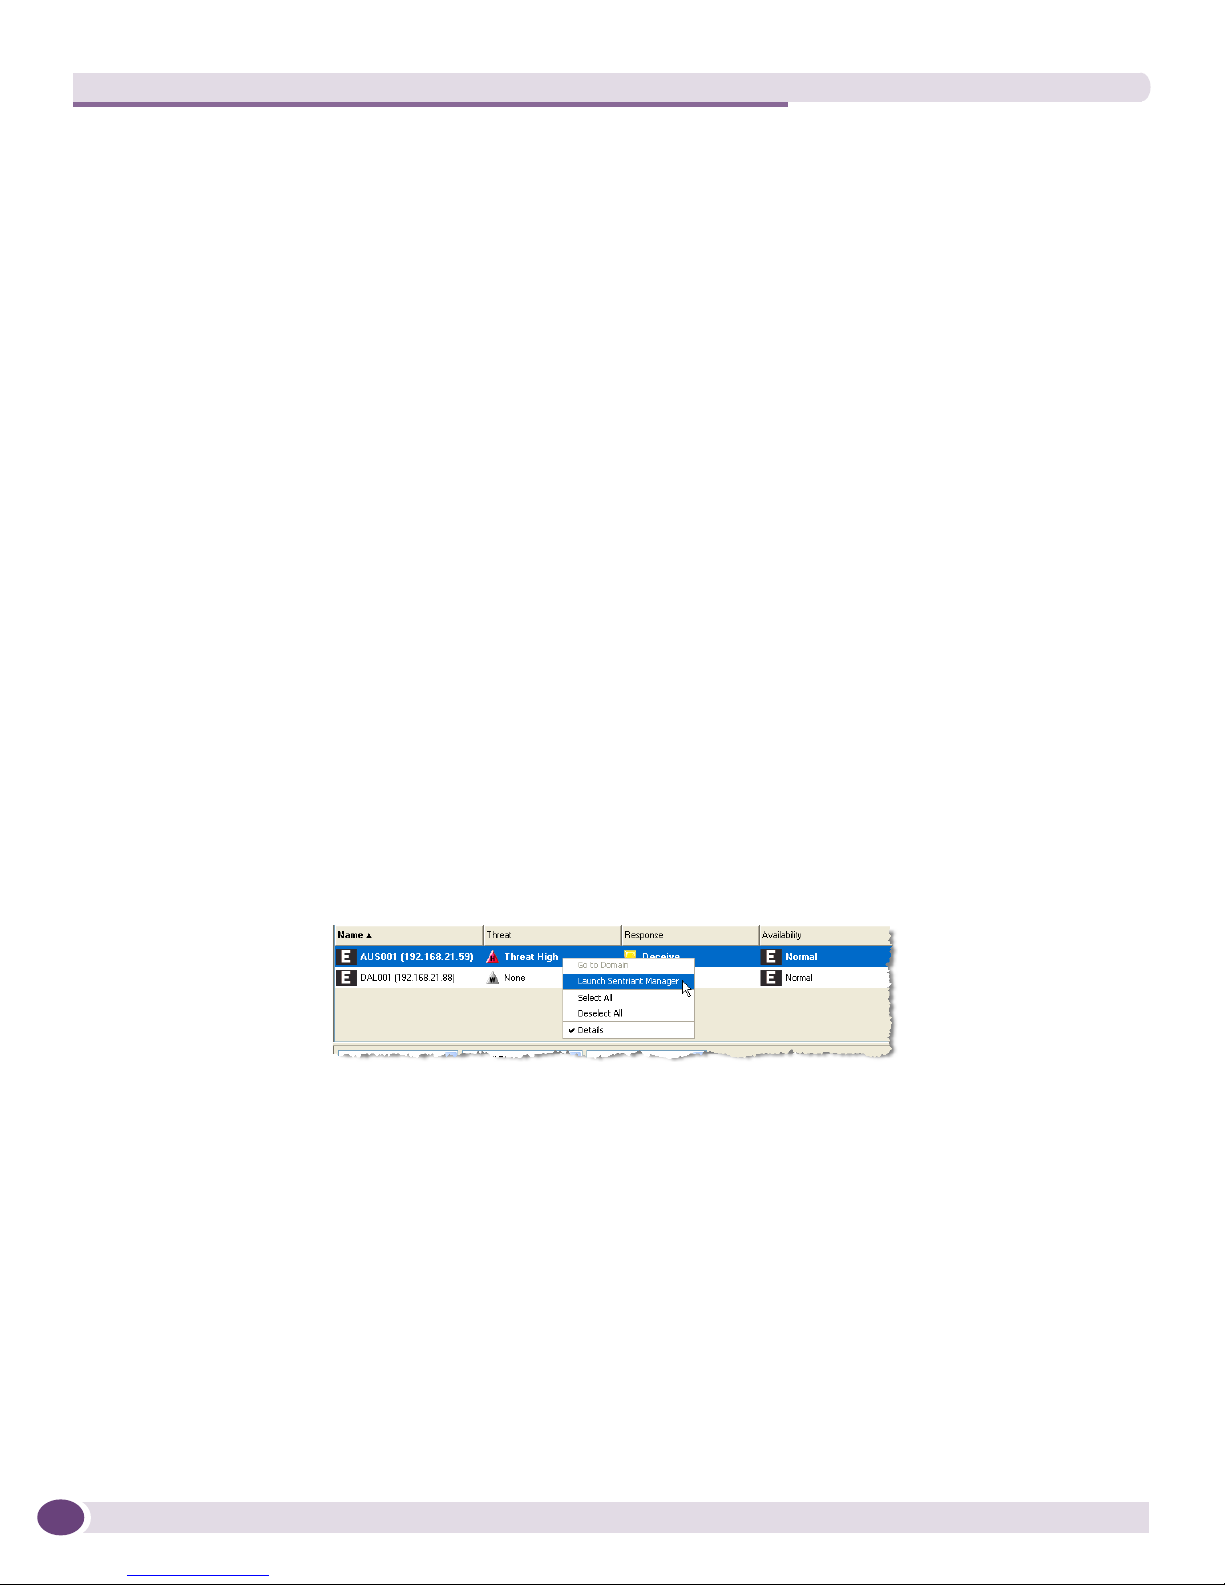
Launch Sentriant NG Manager from Table View
There are two locations from where you can launch Sentriant NG Manager.
To launch Sentriant NG Manager from the Information Panel:
1 From the Monitor Panel, select an appliance from the Information Panel.
2 Right-click to bring up the menu and select Launch Sentriant Manager.
To launch Sentriant NG Manager from the Details Panel:
1 From the Monitor Panel, select an appliance from the Information Panel.
2 Right-click to bring up the menu and select Details.
3 Select a threat from the information list.
4 Right-click to bring up the menu and select Sentriant Manager.
Sentriant NG Operation Console User Guide, Software Version 2.530
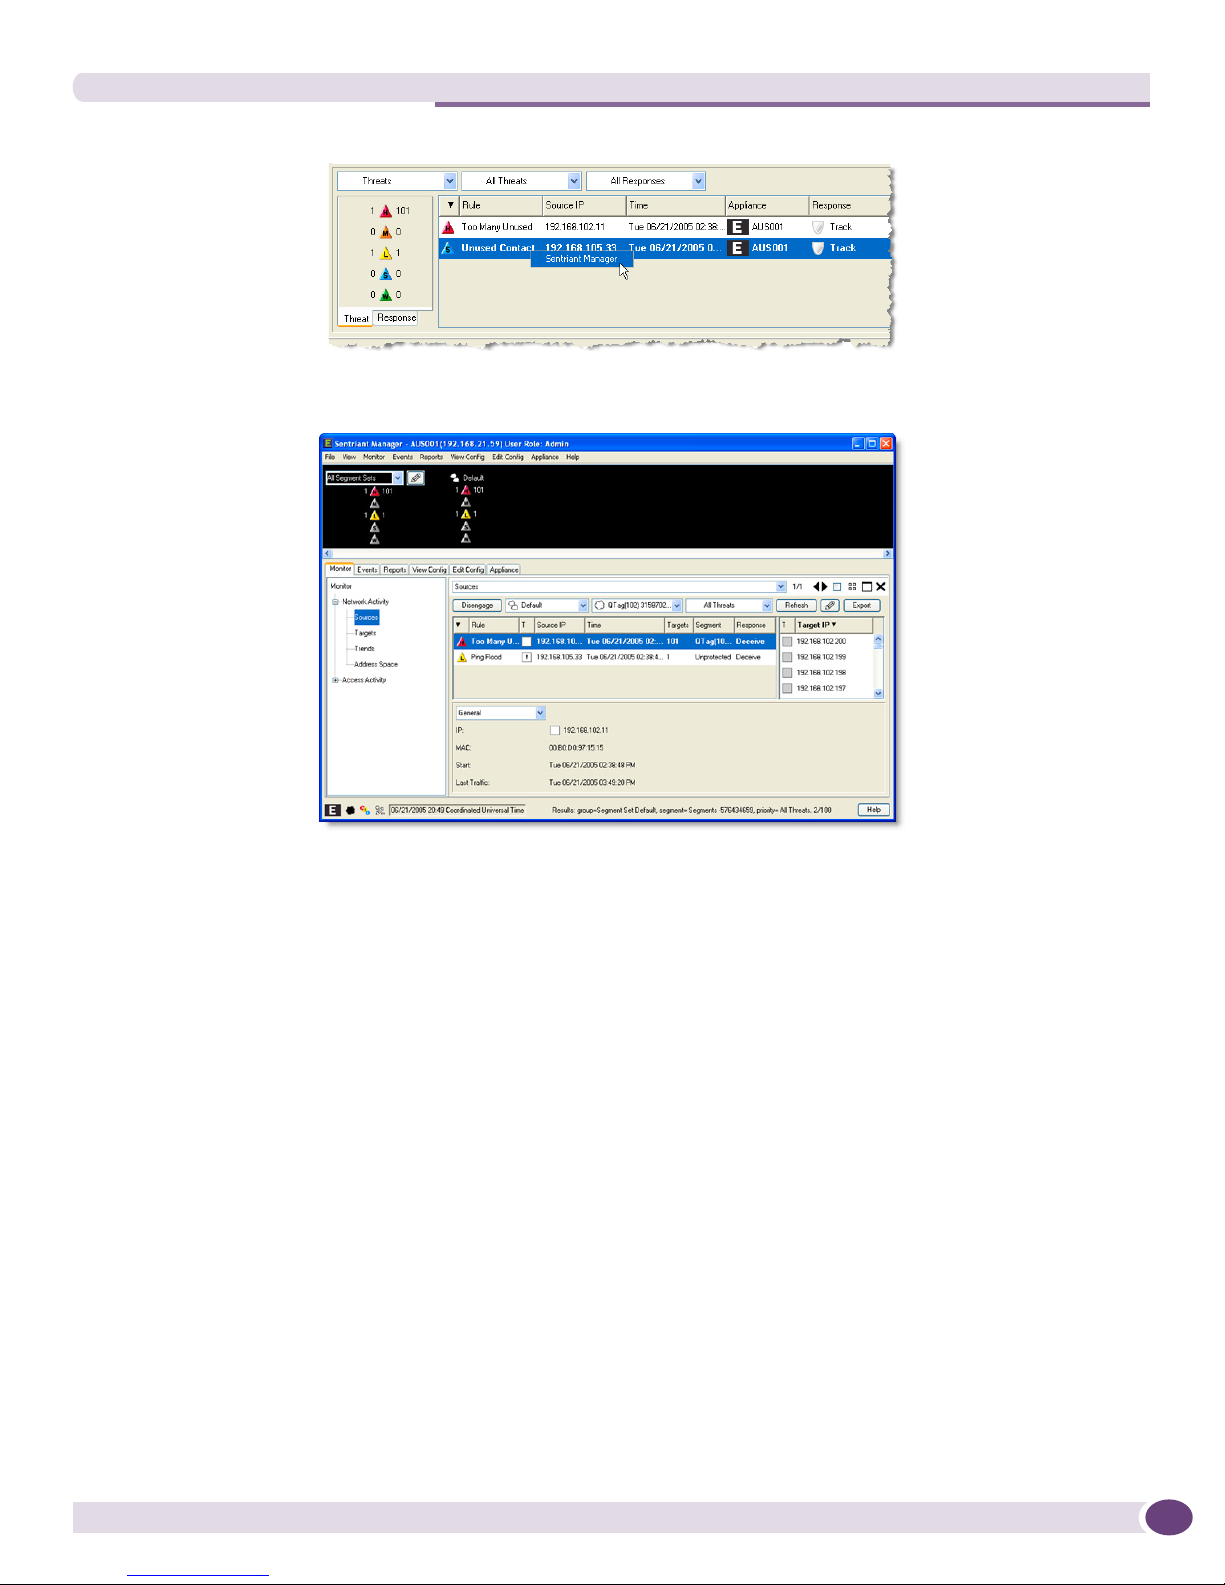
The Sentriant NG Manager opens to Sources in the Monitor Panel.
Radial View
Radial View
The radial view displays the entire enterprise deployment graphically like the spokes of a wheel. The
center of the wheel is the highest level, or root of the deployment with each spoke representing a
branch of the network. Appliances are located at the end of each branch.
The Radial View displays domains and appliances in a graphical view. Clicking a domain displays the
sub-domains and appliances that are part of the domain. Clicking a sub-domain displays the appliances
of the sub-domain. Clicking an appliance will display icons for threats, responses and availability of the
appliance. The purpose of this panel is to provide a means of ascertaining threats, responses, and
appliance status within a large deployment that reside in many domains.
The main difference from the table and radial views is that you can display sub-domains and appliances
in one view and determine which domain or appliance has detected threats. Once the appliance has
been determined, you can move to it quickly without having to navigate through a tree.
View Domains and Appliances from the Radial View
The radial view displays the entire enterprise deployment graphically like the spokes of a wheel. The
center of the wheel is the highest level, or root of the deployment with each spoke representing a
Sentriant NG Operation Console User Guide, Software Version 2.5 31
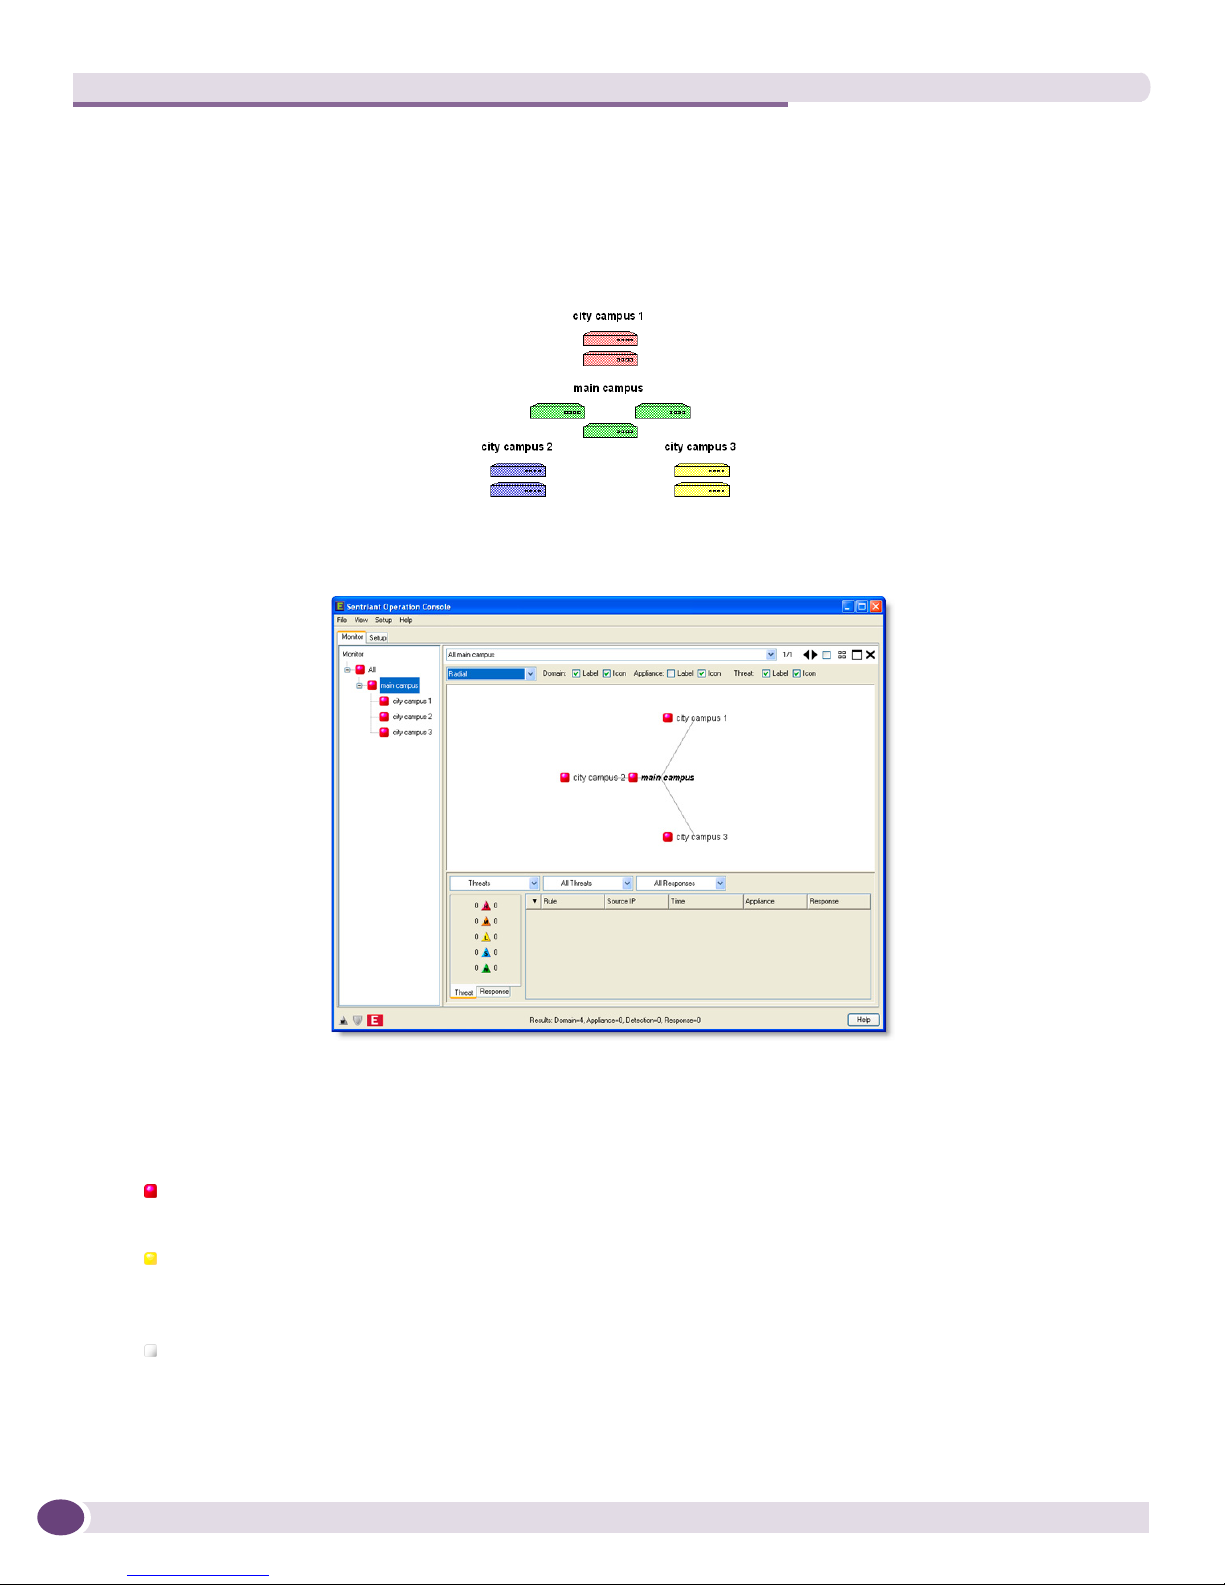
Monitor
branch of the network. Appliances are located at the end of each branch. The benefits of the radial view
is where there is a large deployment of appliances that reside in many domains. For example, the
following diagram shows an enterprise deployment at a university with a main campus, and three
remote city campuses. The main campus has three Sentriant NG appliances deployed and each remote
campus has two Sentriant NG appliances deployed.
The radial view will look like this:
The radial view gives the operator a high level view of all Sentriant NG appliances deployed and then
can drill down or filter to the appliance detecting threats by double clicking on a domain and then the
appliance. Domains display an icon that represents the health and status of the domain. Domain health
and status icons are as follows:
Error - A general error has been detected on an appliance that may be a high threat or the health
of an appliance encountered an error. High priority threats will result in an error condition.
Warning - A warning has been detected on an appliance that may be an appliance threshold for
disk space usage or a network connection went down. Suspect, low and medium priority threats
will result in a warning condition.
Normal - The appliance or appliances within a domain are functioning normally. Watches may be
present.
Sentriant NG Operation Console User Guide, Software Version 2.532
 Loading...