

Page 1

HD700 Manometer
Software Introduction
MANOMETER serial software is a program for collecting data from HD700 Manometer when
it is connected to a PC or notebook computer. The data may be displayed graphically, as
text or exported to Excel or similar programs. The major functions are all listed in the main
window.
The maximum number of data points is 17278.
System Required:
Windows 2000 or Windows XP
Minimum Hardware Required:
PC or NoteBook with Pentium 90MHz or higher 32 MB RAM ;
At least 5 MB byte hard disk space available to install MANOMETER serial software.
Recommended display resolution 1024X768 with High Color(16 bit).
Page 2
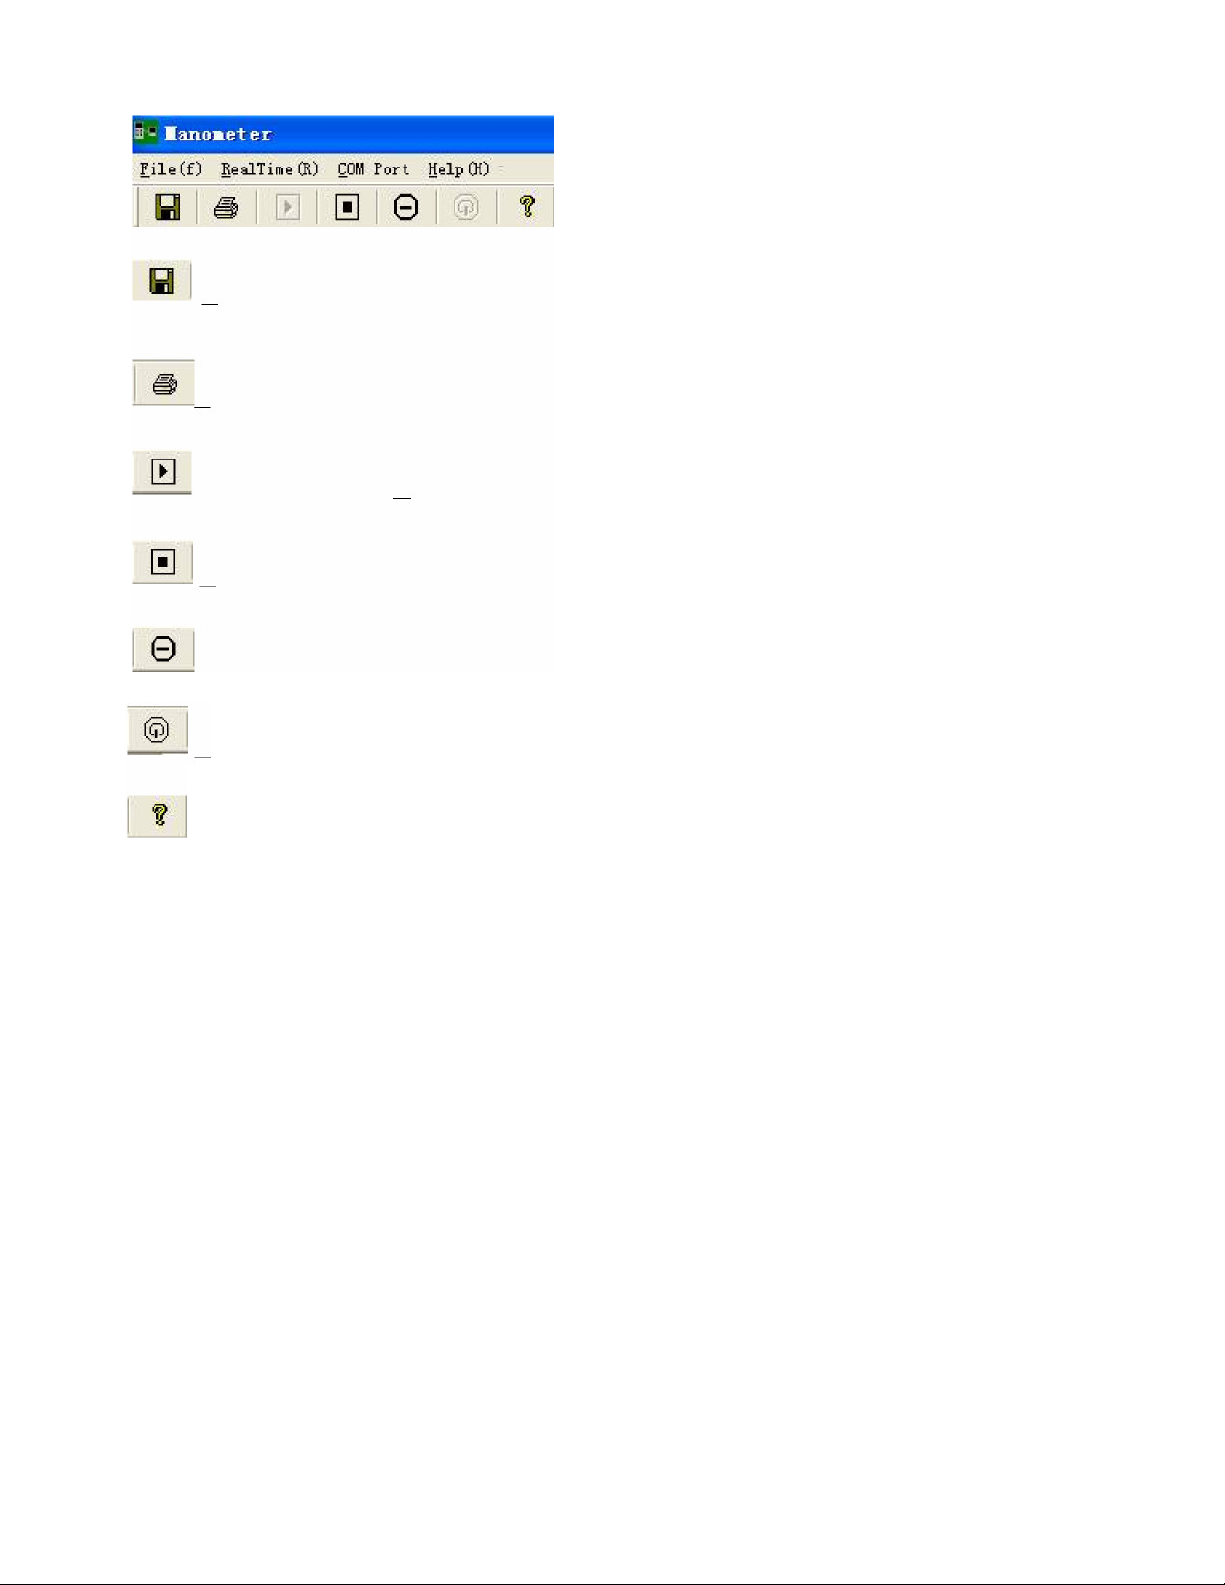
Main Menu
Save - Save the recorded real time data to the disk.
Print- Print the real time graph.
Real Time Data I Run - Start collecting real time data .
Stop - Stop collecting real time data .
Undo Zoom.
Power off-power off the manometer
Help document
Page 3
Operation
Starting communication
1 .Power on the manometer first and connect it to a PC USB port with the cable
provided
2. Run the MANOMETER software program.
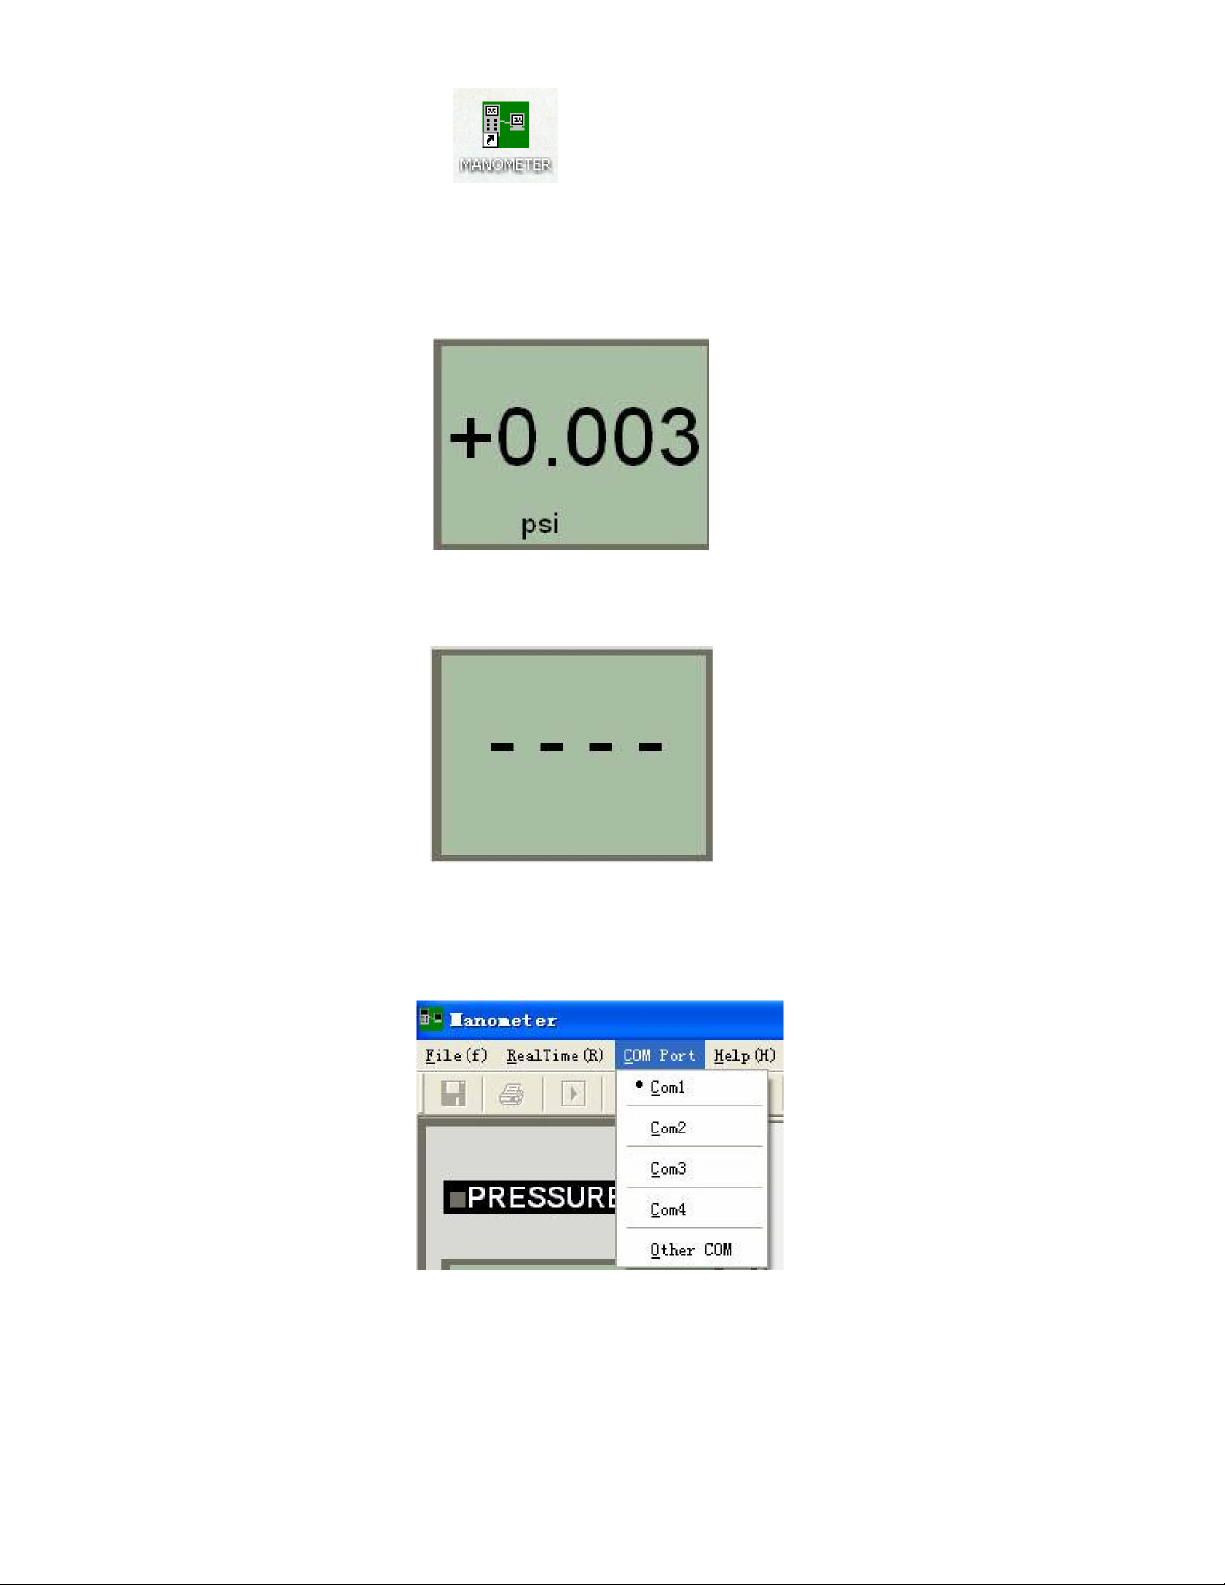
3. If the connection is successful the panel will display the same value as the
manometerr
4. If the connection fails the software will display "- - - -" on the panel window .
5. If you fail to connect, check you cable first, close all other application and then choose
other serial ports from the menu until the connection is successful. Wait a few second
after a new com port is selected to see if the communication is successful. When
successful, the com port selections will turn gray (become inactive).
Page 4

Plotting Data
1. If the connection is successful click and the Sample Rate dialog box will pop up.
2. Enter a number (1 or greater) in the edit box to set the sample rate, then click “OK”.
The data will start plotting on the Real Time Graph Window
Zoom in:
1. Press the left mouse button and drag a rectangle around the area to be expanded.
2. Release the mouse button.
3. Use the scrollbar to scroll through all the data.
Zoom out: Zoom out to full view by clicking
Page 5

Display of Max, Min, Time, and Average in a selected time range
1. Place the mouse cursor on the graph at the starting time of interest and right click. A
yellow vertical cursor will appear.
2. Place the mouse cursor at the end time and right click. A blue vertical cursor will
appear.
3. The Max, Min and Avg data from the selected range will appear at the below the
graph.
4. Press the button to remove the cursors and data.
Display of the Running Max, Min and Average:
1. Click the button to record the running Max, Min and Average value of the
plotted data. The data will appear above the graph.
2. Click the button stop the recording
Page 6

Saving the recorded real time data to a file
1. Click the icon to open the file save dialog box.
2. Name the file and save it with the default extension. The file will be saves with the
“.AsmDat”. extension to be reopened in the Manometer program and also as a “.TXT”
file to be opened in other word processing or spreadsheet programs.
Opening a saved data file
1. Click the icon to open a saved file.
2. The opened graph supports Printing, Opening files, Zooming and Cursor data point
selection
Exporting to Excel
If the Excel spreadsheet program is installed on the computer, the data from the plotted
graph can be directly exported to a spreadsheet.
Click on , Excel will open and the data will appear. Save the file as desired.
Page 7

Frequently Asked Questions
1. I connected the manometer to PC port and turned meter power on, I tried all serial
ports, and the software always shows"— — — —".
Answer: It could be that all serial ports are occupied by other applications. Close all other
application, restart your computer and run MANOMETER serial software again. The software
will check COM1 first with running. If it shows "— — — —", please choose other COM ports in
the software until the connection is successful.
2. Why there is only (*.AsmDat ) file type selection in the save dialog, and no
(*.TXT) type?
Answer: Because the text file is creating automatically, as long as you click SAVE in the save
dialog, you will get the text file in the same path as the binary file.
3. Why did the error message "Create Excel service failure!" appear when I
clicked ?
Answer: EXCEL software is not installed on the computer.
4. Why did the software stopped automatically?
Answer: If communication is disrupted for any reason the program will stop automatically.
 Loading...