

Page 1

HD400 Light Meter
Software Introduction
The HD400 software program provides a means to collect real time data from the meter to a PC. Data is
presented by the software in a graphical format. The program is simple to use via the graphic user interface
and all major functions are located in the main window indicated with large icons.
System Requirements
Operating System: Windows 95/98, Windows NT 4.0 (or above) and XP
Minimum hardware requirements:
PC with Pentium 90MHz or higher
32 MB RAM
At least 5 MB byte hard disk space for the supplied software
Display resolution of at least 800 x 600 with High Color (16 bit)
Page 2
Operation
Starting communication
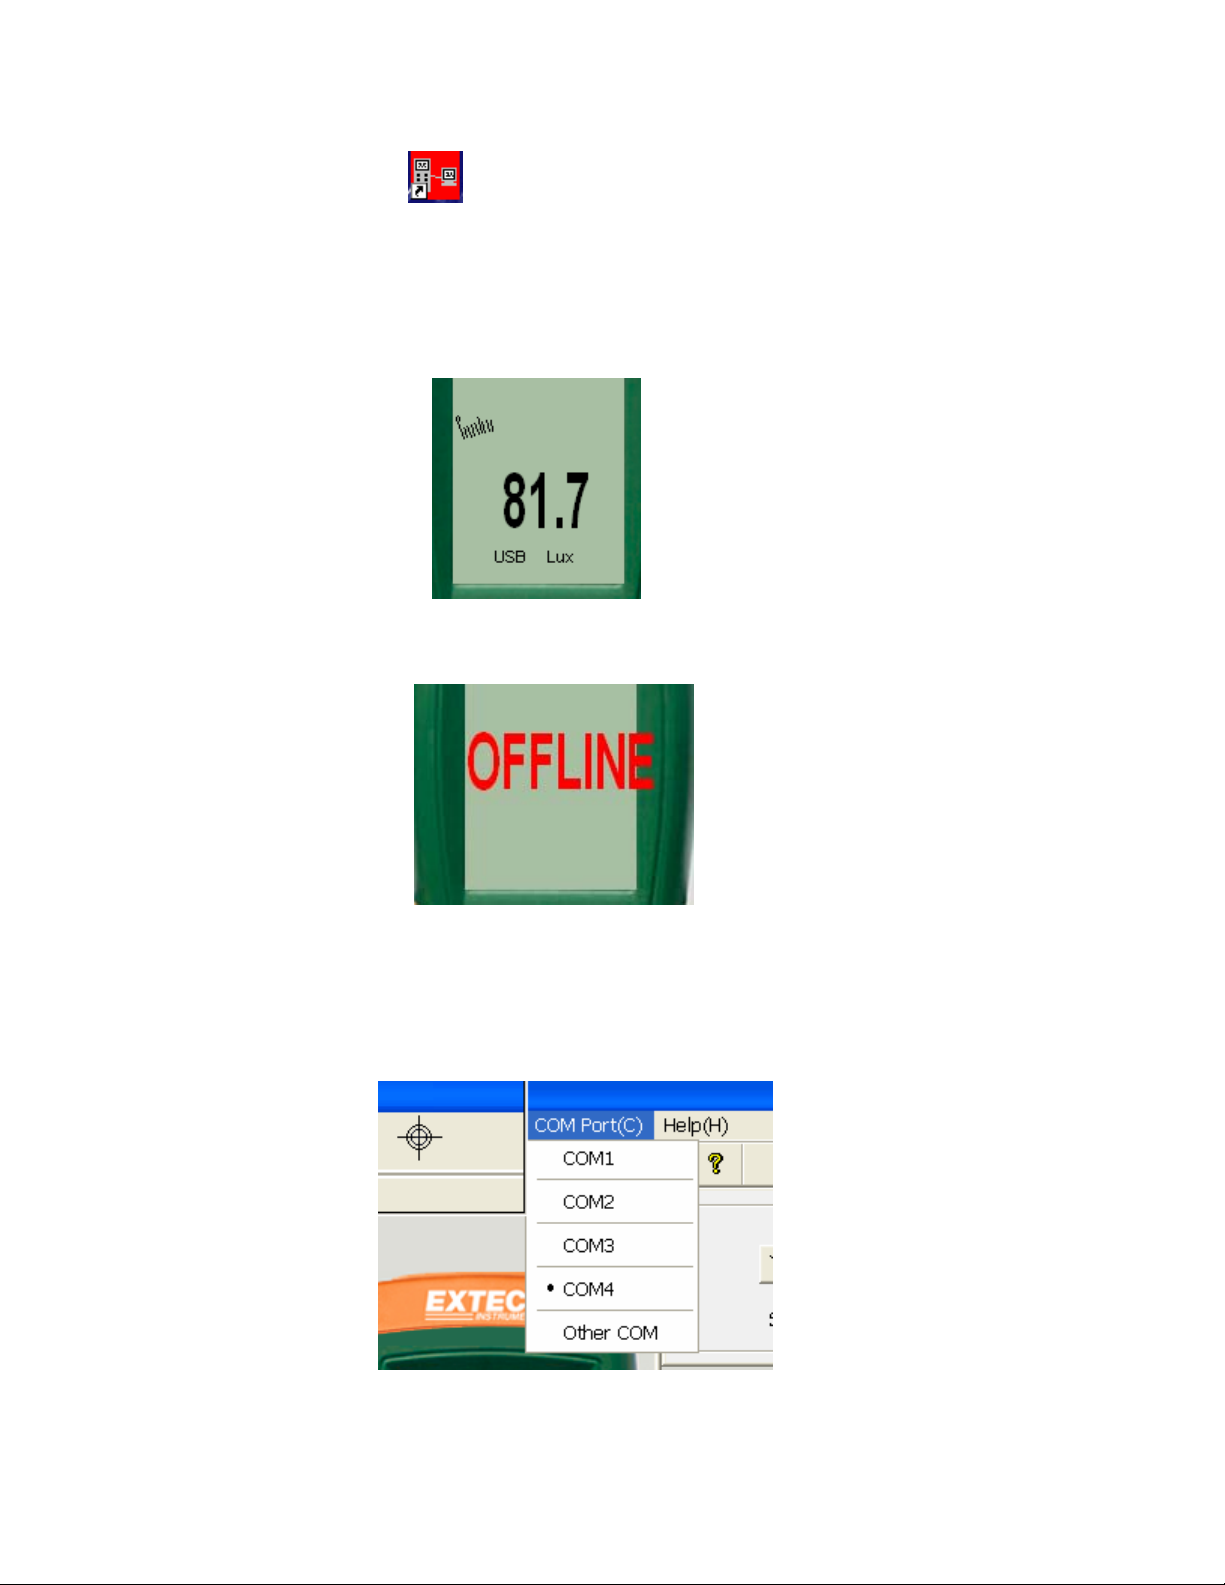
1 .Power on the light meter first and connect it to a PC USB port with the cable provided
2. Run the HD400 software program.
3. If the connection is successful the panel will display the same value as the light meter
4. If the connection fails the software will display "OFFLINE" on the panel window .
5. If you fail to connect, check you cable first, close all other application and then choose other
serial ports from the menu until the connection is successful. Wait a few second after a new
com port is selected to see if the communication is successful. When successful, the com port
selections will turn gray (become inactive).
Page 3

Main Menu
Save - Save the recorded real time data to a file.
Open - Open a saved file.
Real Time Data Run - Start plotting and collecting real time data .
Stop - Stop collecting real time data .
Print- Print the real time graph.
Undo Zoom.
Help document
Page 4

Plotting Data
1. Click and the Sample Rate dialog box will pop up.
2. Enter a number (1 or greater) in the edit box to set the sample rate and then click “OK”. The
data will start plotting on the Real Time Graph Window
Page 5

Zoom in:
Press the left mouse button and drag a rectangle around the area to be expanded.
Zoom out: Zoom out to full view by clicking
Y Axis Offset and Gain: Click to change the vertical axis offset or
full scale range (gain)
Cursor: The vertical cursor appears at the mouse location on the graphs. The value
and time of the point on the graph is displayed on the bottom of the real time graph and at
the top on the recalled data graph
Page 6

Saving a Data File:
1. Click the icon to open the file save dialog box.
2. Name the file and save it with the default extension. The file will be saved with the “*.AsmDat”
extension to be reopened in the HD400 program and also as a “.TXT” file (automatically saved to
the desktop) to be opened in other word processing or spreadsheet programs.
Opening a saved data file
1
. Click the icon to open the “Graph” window and then click “Download” to open a saved
file.
2. The opened graph supports: Opening files, Printing, Zooming ,Y Axis Setting, graph channel
selection and Cursor data point selection.
3. The left list bar will show how many files were opened and detailed information for each file (Time,
Sampling rate and data numbers of the file). You can click any list to change the graph.
V1.0 5/08
 Loading...