

Page 1
PSO-100
Optical Sampling Oscilloscope Series
User Guide
Page 2

Copyright © 2007–2010 EXFO Inc. All rights reserved. No part of this
publication may be reproduced, stored in a retrieval system or transmitted
in any form, be it electronically, mechanically, or by any other means such
as photocopying, recording or otherwise, without the prior written
permission of EXFO Inc. (EXFO).
Information provided by EXFO is believed to be accurate and reliable.
However, no responsibility is assumed by EXFO for its use nor for any
infringements of patents or other rights of third parties that may result from
its use. No license is granted by implication or otherwise under any patent
rights of EXFO.
EXFO’s Commerce And Government Entities (CAGE) code under the North
Atlantic Treaty Organization (NATO) is 0L8C3.
The information contained in this publication is subject to change without
notice.
Trademarks
EXFO’s trademarks have been identified as such. However, the presence
or absence of such identification does not affect the legal status of any
trademark.
Units of Measurement
Units of measurement in this publication conform to SI standards and
practices.
Version number: 1.0.0
ii PSO-100
Page 3

Contents
Contents
Certification Information ....................................................................................................... vi
1 Introducing the PSO-100 Optical Sampling Oscilloscope Series ................ 1
PSO-100 Optical Sampling Oscilloscope Series Basic Theory ...................................................3
Typical Applications ................................................................................................................4
Conventions ............................................................................................................................6
2 Safety Information ....................................................................................... 7
Laser Safety Information .........................................................................................................7
Electrical Safety Information ...................................................................................................8
3 Getting Started with Your Optical Sampling Oscilloscope ...................... 11
Host Computer Minimum Requirements ..............................................................................11
Installing the Matlab Runtime, USB Drivers and Optical Sampling Oscilloscope Software ....12
Installing and Starting the Optical Sampling Oscilloscope ....................................................20
Turning off the Optical Sampling Oscilloscope ......................................................................24
Cleaning and Connecting Optical Fibers ...............................................................................25
Installing the EXFO Universal Interface (EUI) .........................................................................27
Optical Sampling Oscilloscope iii
Page 4

Contents
4 Setting up and Using the Optical Sampling Oscilloscope ........................29
Adjusting the Zero Level (Nulling Offsets) .............................................................................32
Managing SoftSync Input .....................................................................................................33
Scaling Channel 1 to Channel 2 (PSO-102 Models) ...............................................................35
Finding a Pattern in a Sampling ............................................................................................36
Using the Zoom Functions ....................................................................................................37
Synchronizing the Input to a Specific Channel ......................................................................38
Selecting Sync Format ...........................................................................................................38
Selecting the Channels (PSO-102 Only) .................................................................................40
Selecting Trace and Background Colors ................................................................................41
Using the Dual Window View ...............................................................................................42
Using the Clock Input ...........................................................................................................44
Selecting the Number of Samples per Layer of Display .........................................................48
Changing the Persistence Time .............................................................................................49
Changing the Averaging Value .............................................................................................50
Displaying Histograms ..........................................................................................................52
Managing Filters ...................................................................................................................55
Using Colorgrade ..................................................................................................................58
Using Markers .......................................................................................................................59
Using the Eyeline Mode ........................................................................................................61
Using Masks .........................................................................................................................63
Displaying the FFT Spectrum of a Sampled Signal ................................................................66
Displaying a Reference Trace for your Measurements ...........................................................68
Managing Measurement Parameters ....................................................................................69
Managing Synchronization ...................................................................................................75
Setting the Data Phase Tracking Algorithm ...........................................................................76
Filter-Based Phase Tracking ...................................................................................................77
Saving Sample Files ...............................................................................................................79
5 Maintenance ................................................................................................81
Cleaning EUI Connectors ......................................................................................................82
Replacing Fuses ....................................................................................................................84
Recycling and Disposal (Applies to European Union Only) ....................................................85
6 Troubleshooting ..........................................................................................87
Solving Common Problems ...................................................................................................87
Contacting the Technical Support Group ..............................................................................95
Transportation ......................................................................................................................96
iv PSO-100
Page 5

Contents
7 Warranty ..................................................................................................... 97
General Information .............................................................................................................97
Liability .................................................................................................................................98
Exclusions .............................................................................................................................99
Certification ..........................................................................................................................99
Service and Repairs .............................................................................................................100
EXFO Service Centers Worldwide ........................................................................................101
A Technical Specifications ........................................................................... 103
B Burst Mode Measurements ..................................................................... 105
C Measurement Definitions ........................................................................ 109
One Level ............................................................................................................................110
Zero Level ...........................................................................................................................110
Signal-to-Noise Ratio ..........................................................................................................111
Crossing ..............................................................................................................................111
Timing Jitter ........................................................................................................................112
Rise Time and Fall Time .......................................................................................................113
Extinction Ratio ..................................................................................................................113
Eye Height ..........................................................................................................................114
Eye Amplitude ....................................................................................................................114
Eye Opening Factor .............................................................................................................114
Eye Width ...........................................................................................................................115
Duty Cycle Distortion ..........................................................................................................116
Pulse Width ........................................................................................................................117
Contrast Ratio .....................................................................................................................117
Duty Cycle ...........................................................................................................................118
D Asynchronous Sampling Principle ........................................................... 119
Trigger-Free Synchronization ...............................................................................................119
Frequency Holes ..................................................................................................................120
Pattern Effects ....................................................................................................................123
Index .............................................................................................................. 125
Optical Sampling Oscilloscope v
Page 6

Certification Information
Certification Information
FCC Information
Electronic test equipment is exempt from Part 15 compliance (FCC) in
the United States. However, compliance verification tests are
systematically performed on most EXFO equipment.
Information
Electronic test equipment is subject to the EMC Directive in the European
Union. The EN61326 standard prescribes both emission and immunity
requirements for laboratory, measurement, and control equipment.
This unit has undergone extensive testing according to the European Union
Directive and Standards.
vi PSO-100
Page 7

Certification Information
Application of Council Directives: 2006/95/EC - The Low Voltage Directive
2004/108/EC - The EMC Directive
2006/66/EC - The Battery Directive
93/68/EEC - CE Marking
and their amendments
Manufacturer’s Name: EXFO Inc.
Manufacturer’s Address: 400 Godin Avenue
Quebec, Quebec
Canada, G1M 2K2
Equipment Type/Environment: Electrical Equipment for Measurement / Control and
Laboratory
Trade Name/Model No.: Optical Sampling Oscilloscopes / PSO-100 Series
Standard(s) to which Conformity is Declared:
EN 61010-1:2001 Edition 2.0 Safety Requirements for Electrical Equipment for Measurement,
Control, and Laboratory Use, Part 1: General Requirements.
EN 61326-1:2006 Electrical Equipment for Measurement, Control and Laboratory
Use - EMC Requirements – Part 1: General requirements
EN 60825-1:2007 Edition 2.0 Safety of laser products – Part 1: Equipment classification,
requirements, and user’s guide
EN 55022: 2006 + A1: 2007 Information technology equipment - Radio disturbance
characteristics - Limits and methods of measurement
I, the undersigned, hereby declare that the equipment specified above conforms to the above Directives and Standards.
Manufacturer
Signature:
Full Name: Stephen Bull, E. Eng
Position: Vice-President Research and
Development
Address: 400 Godin Avenue, Quebec (Quebec),
Canada, G1M 2K2
Date: August 11, 2010
DECLARATION OF CONFORMITY
Optical Sampling Oscilloscope vii
Page 8

Page 9
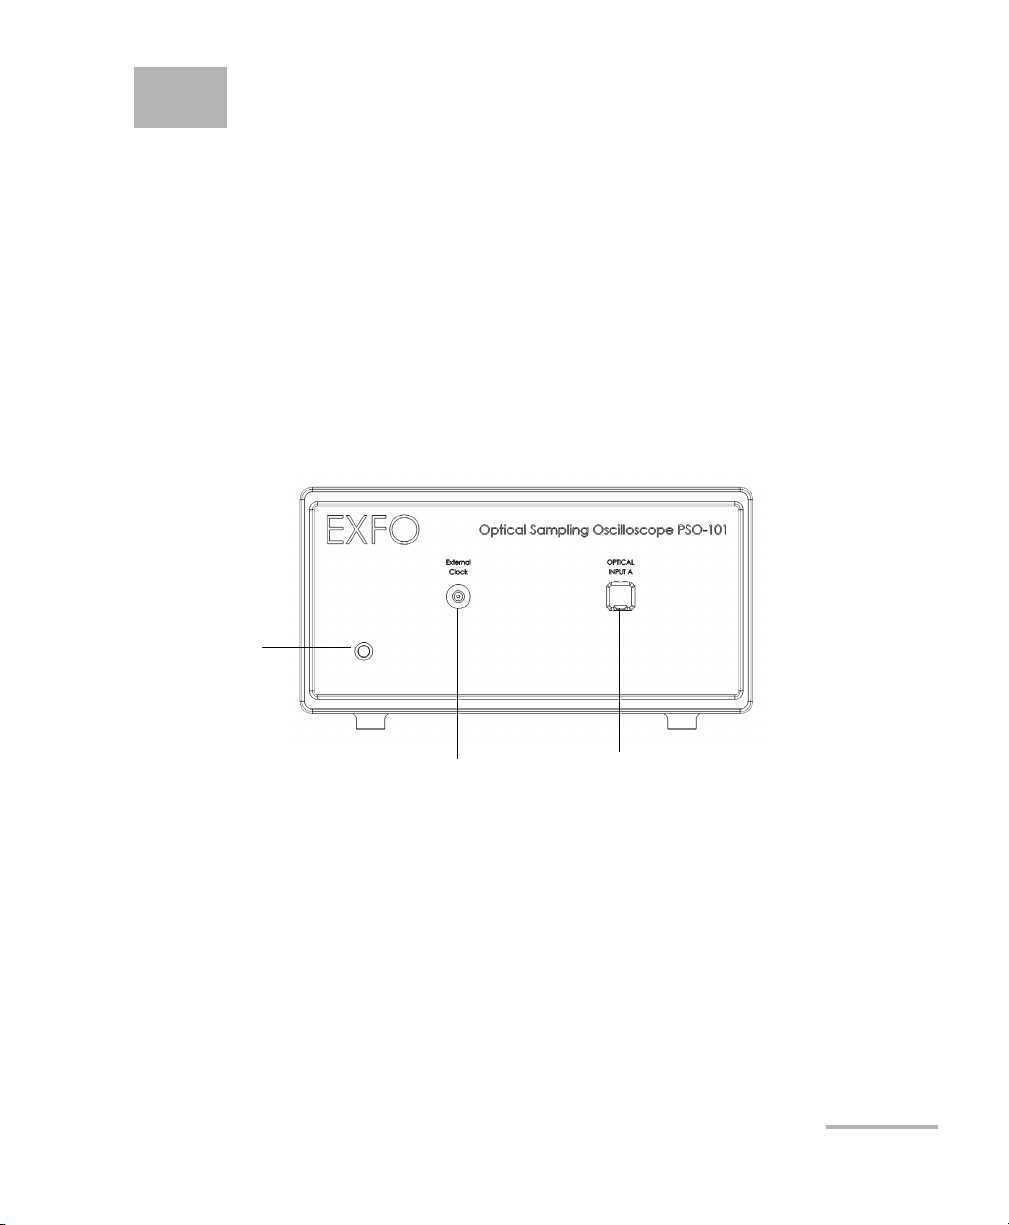
1 Introducing the PSO-100
Front View (PSO-101)
LED ON/OFF
indicator
External clock input
(optional)
Optical fiber input, FC/PC connection
Optical Sampling Oscilloscope
Series
Based on a unique optical sampling approach, the PSO-100 Optical
Sampling Oscilloscope Series eliminates almost all the limitations typically
found in electrical sampling oscilloscopes. This is done when narrow
sampling pulses open a sampling gate that generates a time-stretched
version of the measured signal. The optical samples are then converted to
electrical signals, which can be easily detected by low-speed electronics
and digitally processed.
The figures below show the front and rear panels for both models.
Optical Sampling Oscilloscope 1
Page 10
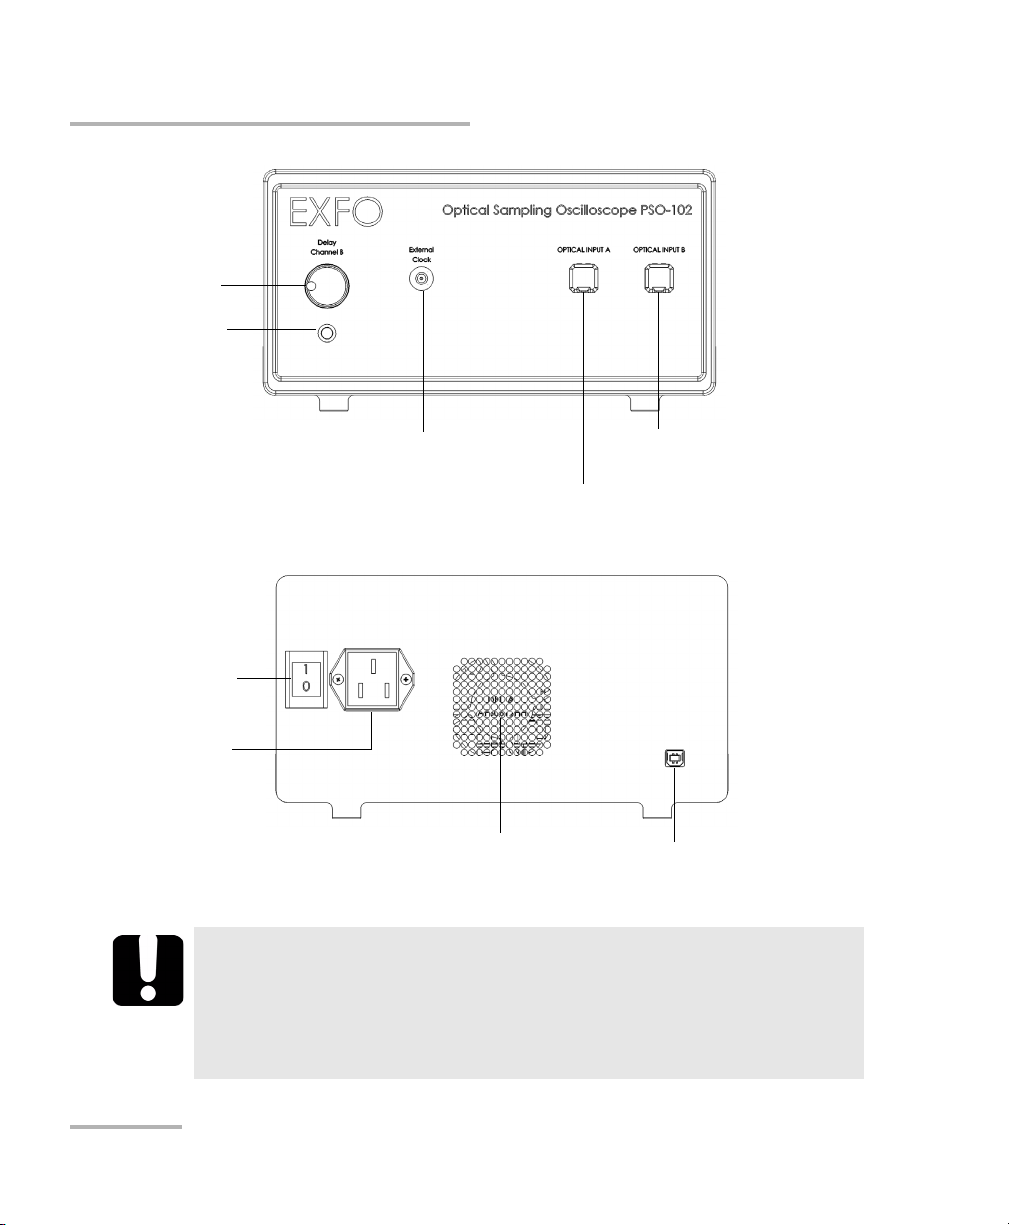
Introducing the PSO-100 Optical Sampling Oscilloscope Series
Front View (PSO-102)
External clock input (optional)
Optical fiber input B,
FC/PC connection
Optical fiber input A, FC/PC connection
Delay adjustment for
Input B (optional)
LED ON/OFF
indicator
Rear View
USB 2.0 connection
to the host computer
Power switch
110-240 V AC
voltage supply input
Fan
2 PSO-100
All instruction or information in this user documentation pertain to
both models, unless specified otherwise. The image you see
on-screen may be slightly different depending on which model you
are using.
IMPORTANT
Page 11

Introducing the PSO-100 Optical Sampling Oscilloscope Series
Signal
Sampling Pulses
Sampling
Gate
Time-Stretched Copy
Generated Samples
Detection, A/D
Conversion,
Visualization
PSO-100 Optical Sampling Oscilloscope Series Basic Theory
PSO-100 Optical Sampling Oscilloscope Series
Basic Theory
The theory behind the Optical Sampling Oscilloscope is that the input
optical signal is repeatedly sampled in an all-optical gate with high
resolution.
The optical samples are detected and then A/D converted and buffered in a
data acquisition board. The data is transferred via USB 2.0 to a host
computer, where it is processed. An internal software synchronization
algorithm calculates the frequency offset between the signal and the
sampling frequency. As a result, you can view synchronized eye diagrams,
patterns, or pulses without the need for external triggering.
Optical Sampling Oscilloscope 3
Page 12

Introducing the PSO-100 Optical Sampling Oscilloscope Series
Typi c a l A pp licat i o ns
Typical Applications
The Optical Sampling Oscilloscope displays eye-diagrams, patterns, or
pulses with very high temporal resolution. It is therefore a useful tool for
studying and characterizing very high bit-rate systems or very fast events
like short pulses, where the bandwidth of ordinary electrical sampling
oscilloscopes is not sufficient.
The instrument can measure a number of amplitude modulation formats,
such as:
³ non-return-to-zero (NRZ)
³ different kinds of return-to-zero (RZ) formats (for example chirped RZ
(CRZ) and carrier suppressed RZ (CSRZ))
³ other formats, such as duo-binary transmission (DBT).
Since only the amplitude of the signal is measured, the system cannot
directly measure the optical phase. By placing a delay interferometer
before the scope, you can also handle phase modulated formats like
differential phase shift keying (DPSK).
A number of measurement tools are included in the software for
characterizing eye-diagrams and waveforms, such as:
³ ultra-low timing jitter
³ rise and fall times
³ extinction ratio (ER)
³ and signal-to-noise ratio (SNR), etc.
Functions for waveform averaging, histograms and color grade, are also
included.
4 PSO-100
Page 13

Introducing the PSO-100 Optical Sampling Oscilloscope Series
Typical Applications
If the optional external clock input is installed, the internal software
synchronization can be performed on the clock signal instead and thereby
relaxes the requirements on the signal quality. The external clock is useful
in a number of measurement situations where the internal synchronization
may fail, such as:
³ very noisy or distorted signals
³ unconventional modulation formats
³ low duty cycle RZ pulses
³ sub-optimally multiplexed signals.
If the gated clock mode is installed, the PSO-100 can be used for measuring
gated data that come in bursts (for example, circulating loop experiments
and optical packet switching).
Optical Sampling Oscilloscope 5
Page 14

Introducing the PSO-100 Optical Sampling Oscilloscope Series
Conventions
Conventions
Before using the product described in this manual, you should understand
the following conventions:
WARNING
Indicates a potentially hazardous situation which, if not avoided,
could result in death or serious injury. Do not proceed unless you
understand and meet the required conditions.
CAUTION
Indicates a potentially hazardous situation which, if not avoided,
may result in minor or moderate injury. Do not proceed unless you
understand and meet the required conditions.
CAUTION
Indicates a potentially hazardous situation which, if not avoided,
may result in component damage. Do not proceed unless you
understand and meet the required conditions.
IMPORTANT
Refers to information about this product you should not overlook.
6 PSO-100
Page 15
2 Safety Information
CAUTION
Do not open the unit. It contains fragile fiber-optic components,
which can be damaged if the unit is opened. There is also a risk for
exposure of laser light if the unit is opened. EXFO shall not be liable
for any damages resulting from opening the unit.
Laser Safety Information
WARNING
Do not install or terminate fibers while a light source is active.
Never look directly into a live fiber and ensure that your eyes are
protected at all times.
WARNING
Use of controls, adjustments and procedures for operation and
maintenance other than those specified herein may result in
hazardous radiation exposure or impair the protection provided by
this unit.
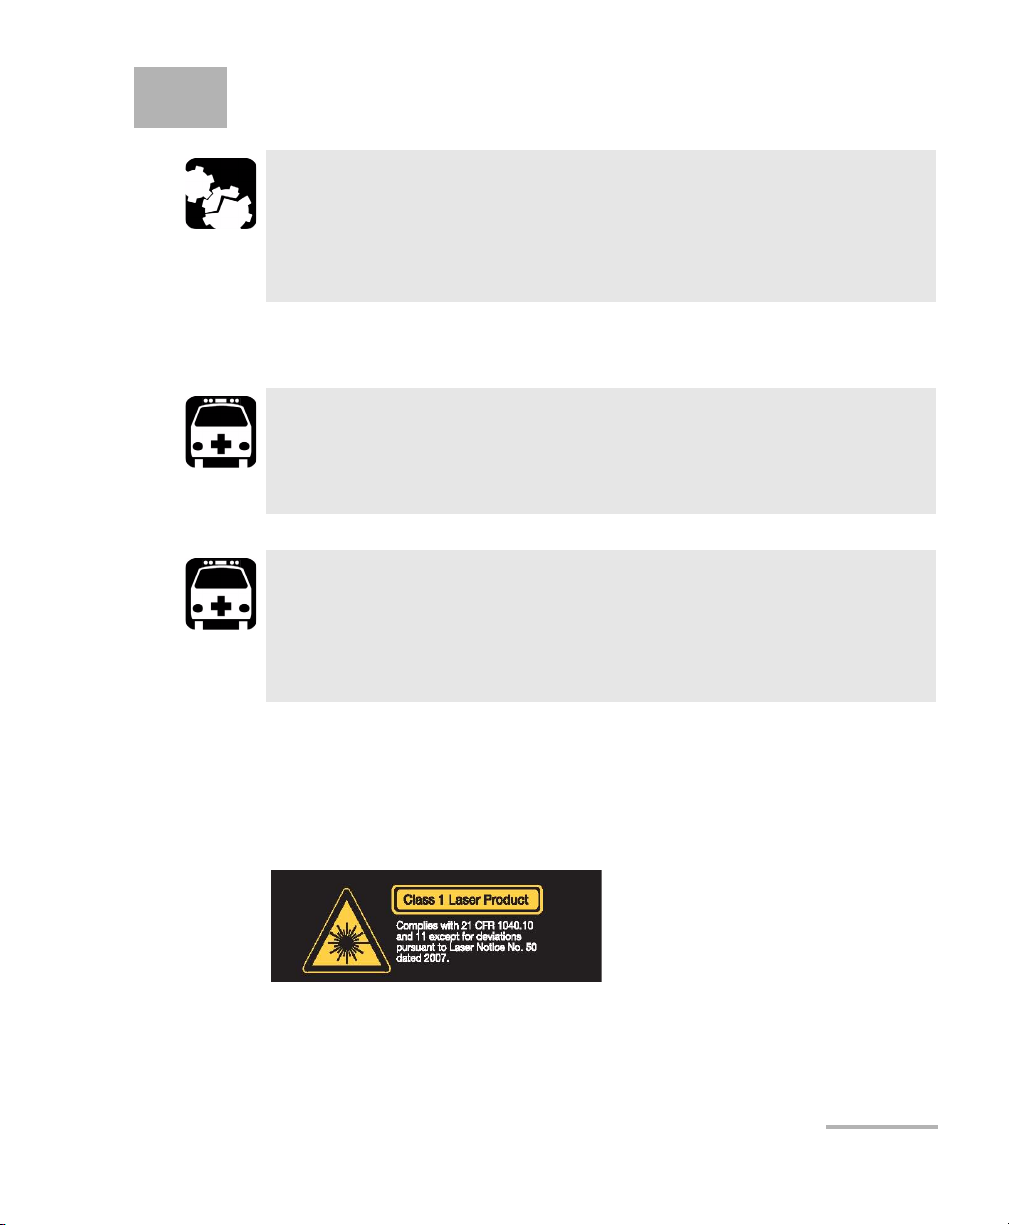
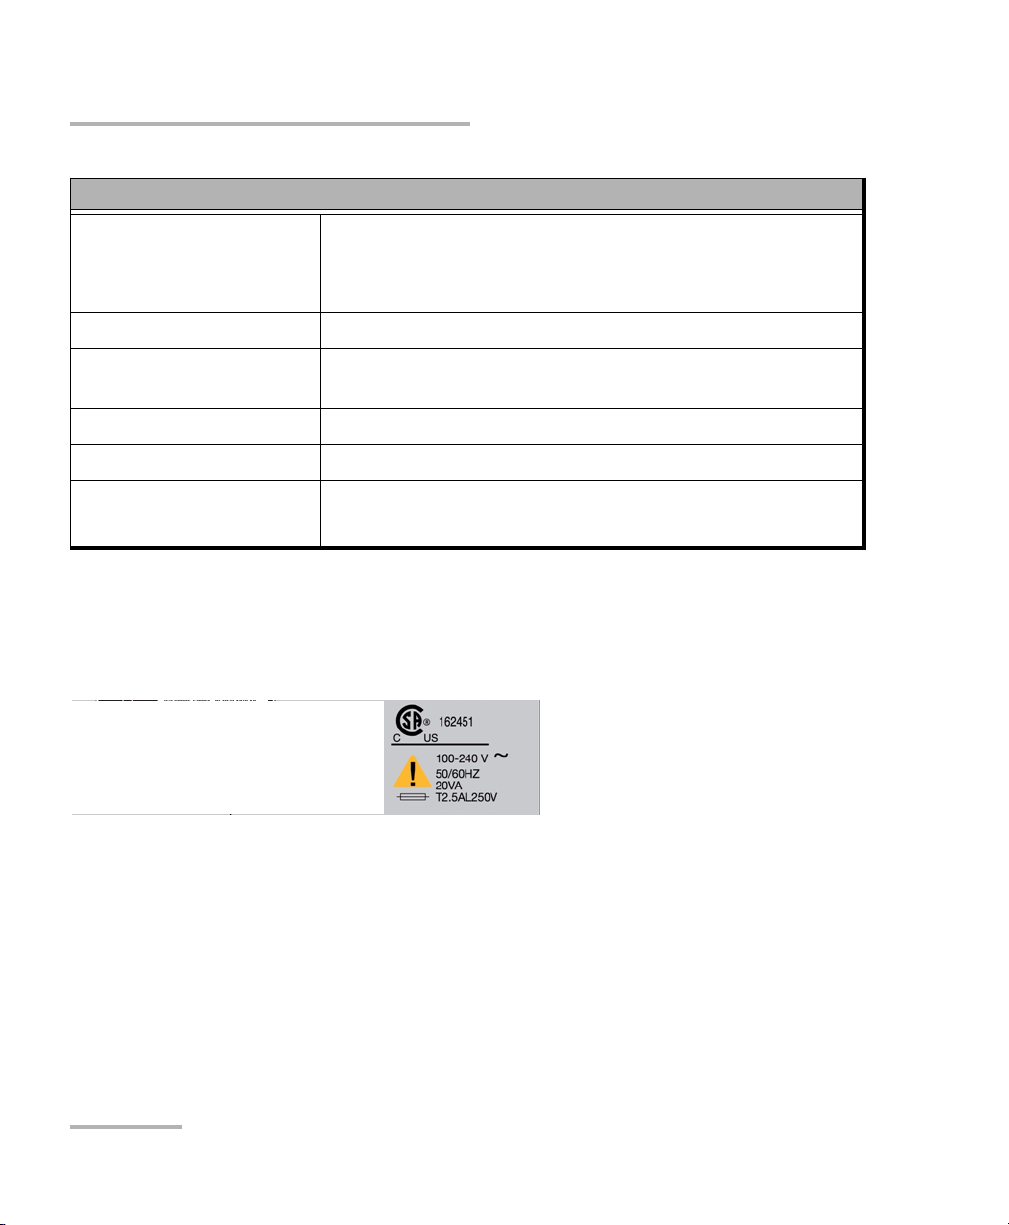
Your instrument is a Class 1 laser product in compliance with standards
IEC 60825-1 and 21 CFR 1040.10. Laser radiation may be encountered at
the output port.
The following label indicates that a product contains a Class 1 source:
Note: The label is located at the back of the unit.
Optical Sampling Oscilloscope 7
Page 16

Safety Information
Electrical Safety Information
Electrical Safety Information
This unit uses an international safety standard three-wire power cable. This
cable serves as a ground when connected to an appropriate AC power
outlet.
Note: If you need to ensure that the unit is completely turned off, disconnect the
power cable.
WARNING
³ Insert the power cable plug into a power outlet with a
protective ground contact. Do not use an extension cord
without a protective conductor.
³ Before turning on the unit, connect all grounding terminals,
extension cords and devices to a protective ground via a ground
socket. Any interruption of the protective grounding is a
potential shock hazard and may cause personal injury.
Whenever the ground protection is impaired, do not use the
unit and secure it against any accidental operation.
³ Do not tamper with the protective ground terminal.
8 PSO-100
Page 17

Safety Information
Electrical Safety Information
The color coding used in the electric cable depends on the cable. New
plugs should meet the local safety requirements and include:
³ adequate load-carrying capacity
³ ground connection
³ cable clamp
WARNING
³ Use this unit indoors only.
³ Position the unit so that the air can circulate freely around it.
³ Do not remove unit covers during operation.
³ Operation of any electrical instrument around flammable gases
or fumes constitutes a major safety hazard.
³ To avoid electrical shock, do not operate the unit if any part of
the outer surface (covers, panels, etc.) is damaged.
³ Only authorized personnel should carry out adjustments,
maintenance or repair of opened units under voltage. A person
qualified in first aid must also be present. Do not replace any
components while power cable is connected.
³ Capacitors inside the unit may be charged even if the unit has
been disconnected from its electrical supply.
Optical Sampling Oscilloscope 9
Page 18
Safety Information
Electrical Safety Information
Temp er at ur e
³ Operation
³ Storage
Relative humidity
a
Equipment Ratings
18 °C to 30 °C (64 °F to 86 °F)
0 °C to 50 °C (32 °F to 122 °F)
80 % non-condensing
Maximum operation
3000 m (9843 ft)
altitude
Pollution degree 2
Installation category II
Power supply rating
b
100 V to 240 V (50 Hz/60 Hz)
maximum input power 20 VA
a. Measured in 0 °C to 31 °C (32 °F to 87.8 °F) range, decreasing linearly to 50 % at 40 °C (104 °F).
b. Not exceeding ± 10 % of the nominal voltage.
The following label is located on the back panel of the unit:
10 PSO-100
Page 19

3 Getting Started with Your
Optical Sampling Oscilloscope
Host Computer Minimum Requirements
Your host computer must meet the minimum requirements below to
display the values properly:
³ Microsoft Windows XP, Vista (32 bits), or Windows 7 (32 bits)
³ USB 2.0 connection
³ CPU: 2 GHz or faster recommended
³ 2Gb of RAM
³ 600 Mb of disk space on the host computer
You can use either a desktop or a laptop computer, as long as it meets the
requirements.
Note: The faster the computer, the higher the refresh rate will be on-screen.
Optical Sampling Oscilloscope 11
Page 20
Getting Started with Your Optical Sampling Oscilloscope
Installing the Matlab Runtime, USB Drivers and Optical Sampling Oscilloscope Software
Installing the Matlab Runtime, USB Drivers
and Optical Sampling Oscilloscope Software
Before using your application, you must install the corresponding Matlab
Runtime and USB drivers.
The user software is created in Matlab code, which has been compiled into
an executable file. To be able to run this software on your computer, you
must install the Matlab Component Runtime software. Afterwards, the
installation for the Optical Sampling Oscilloscope application will start by
itself.
To install Matlab Runtime and Optical Sampling Oscilloscope
software:
1. Make sure that you have Administrator privileges on your computer.
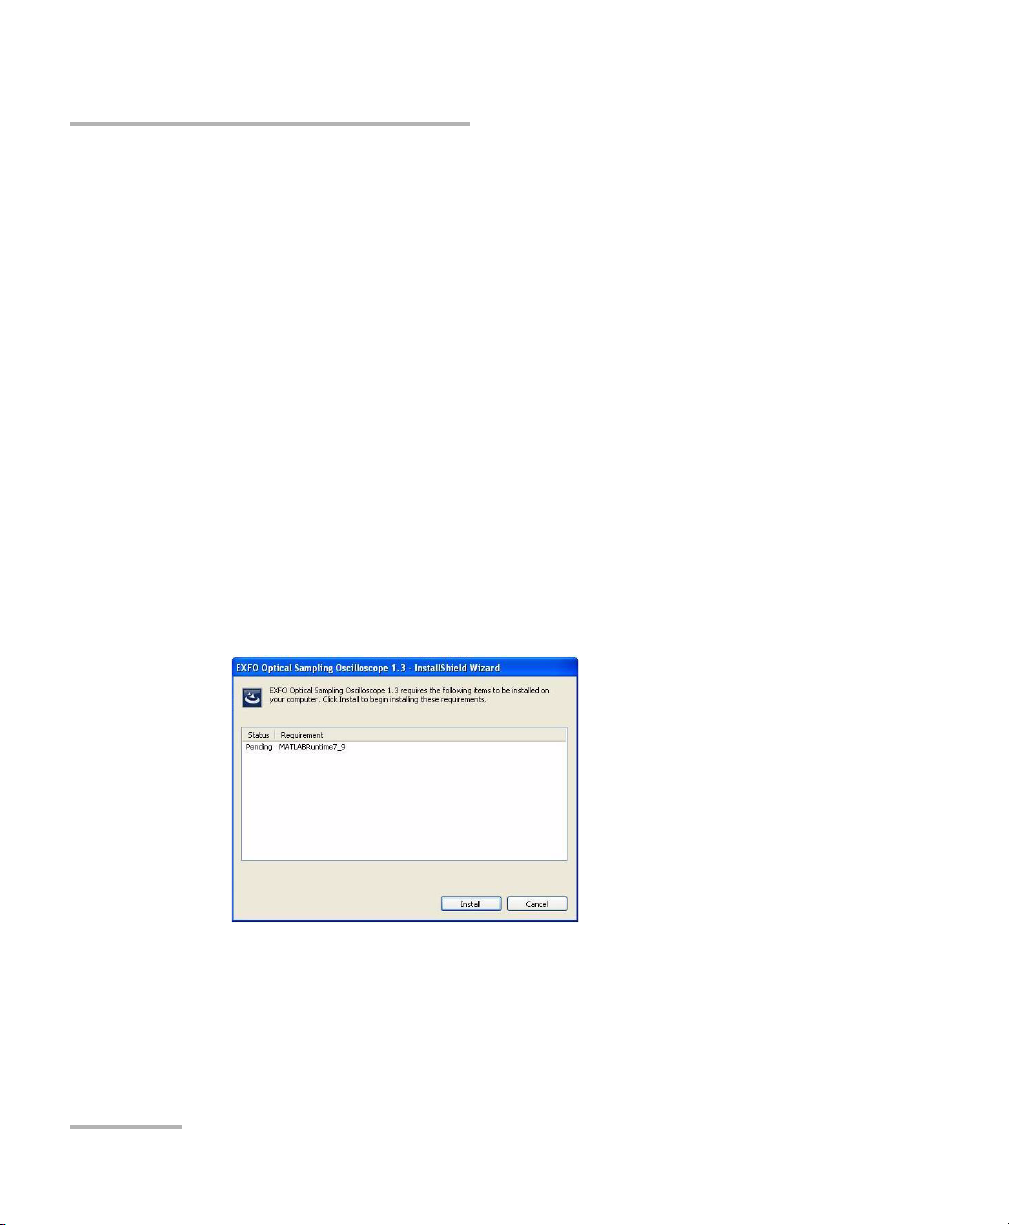
2. Put your CD in the CD ROM drive. If the installation does not start
automatically, locate Setup.exe, and double-click it.
A list of the components to install appears.
3. Click Install to start the process.
12 PSO-100
Page 21
Getting Started with Your Optical Sampling Oscilloscope
Installing the Matlab Runtime, USB Drivers and Optical Sampling Oscilloscope Software
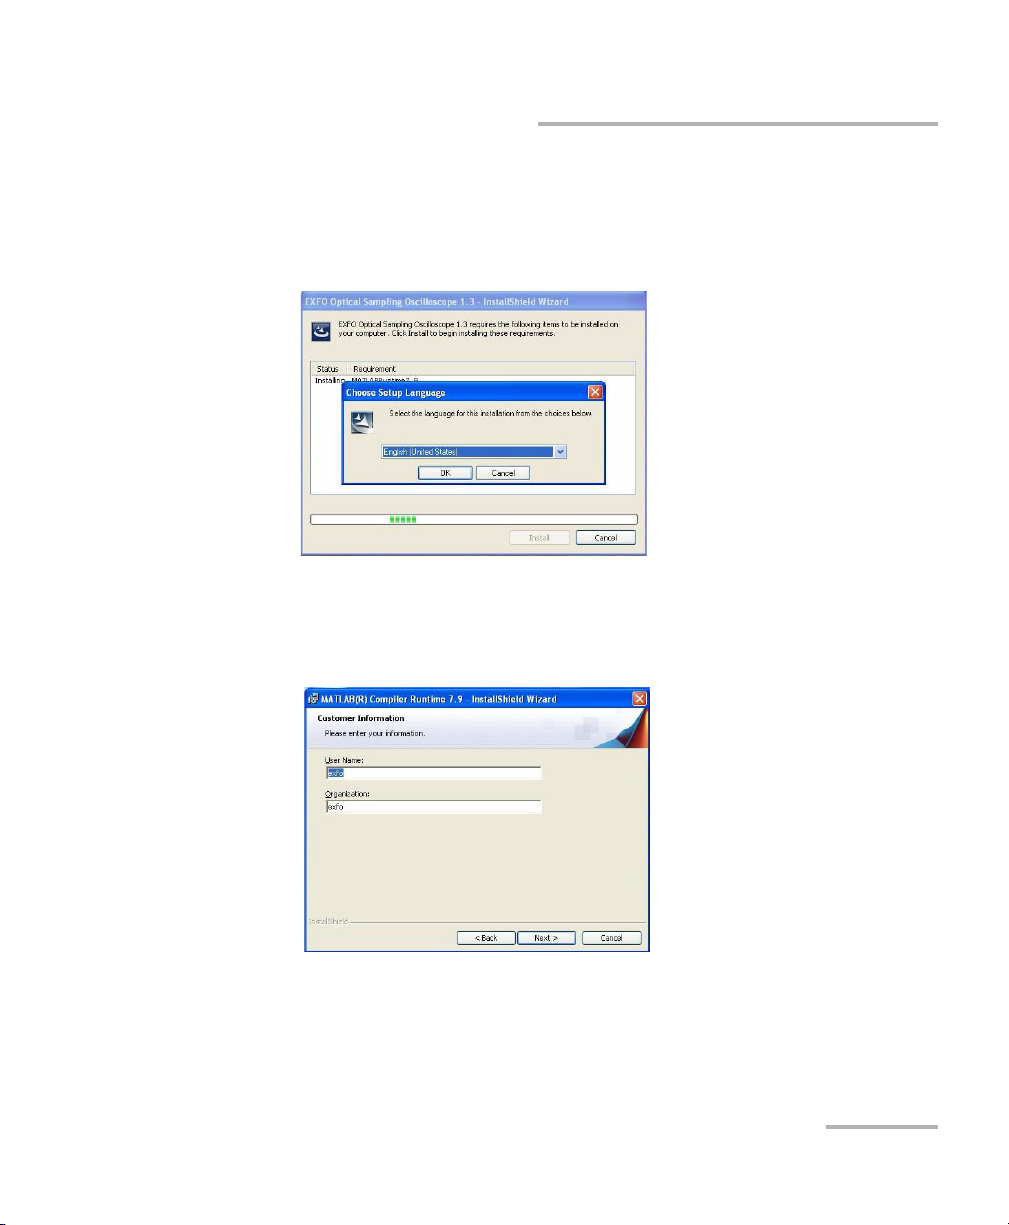
4. Select the language to use for the installation, then click OK.
Note: This setting is for the installation only. The applications themselves are in
English only.
5. When the list of Matlab components appears, click Install again, then
Next to start the installation.
6. Enter your user name and organization information, then click Next.
Optical Sampling Oscilloscope 13
Page 22
Getting Started with Your Optical Sampling Oscilloscope
Installing the Matlab Runtime, USB Drivers and Optical Sampling Oscilloscope Software
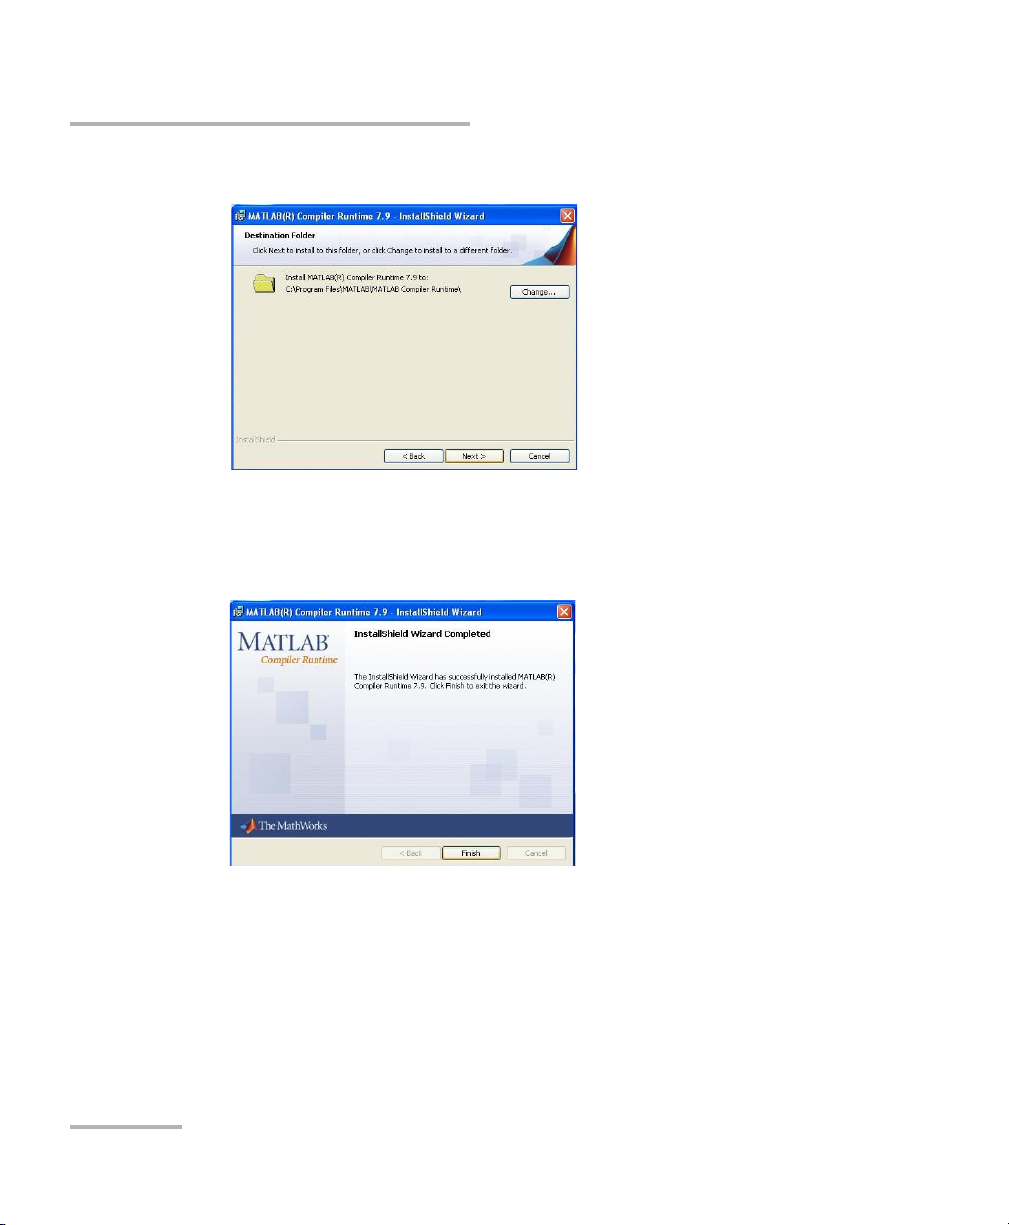
7. Select a destination folder, then click Next.
8. You are now ready to install the program. Click Install.
9. The installation of the Matlab Compiler Runtime is now complete, click
Finish.
14 PSO-100
Page 23
Getting Started with Your Optical Sampling Oscilloscope
Installing the Matlab Runtime, USB Drivers and Optical Sampling Oscilloscope Software
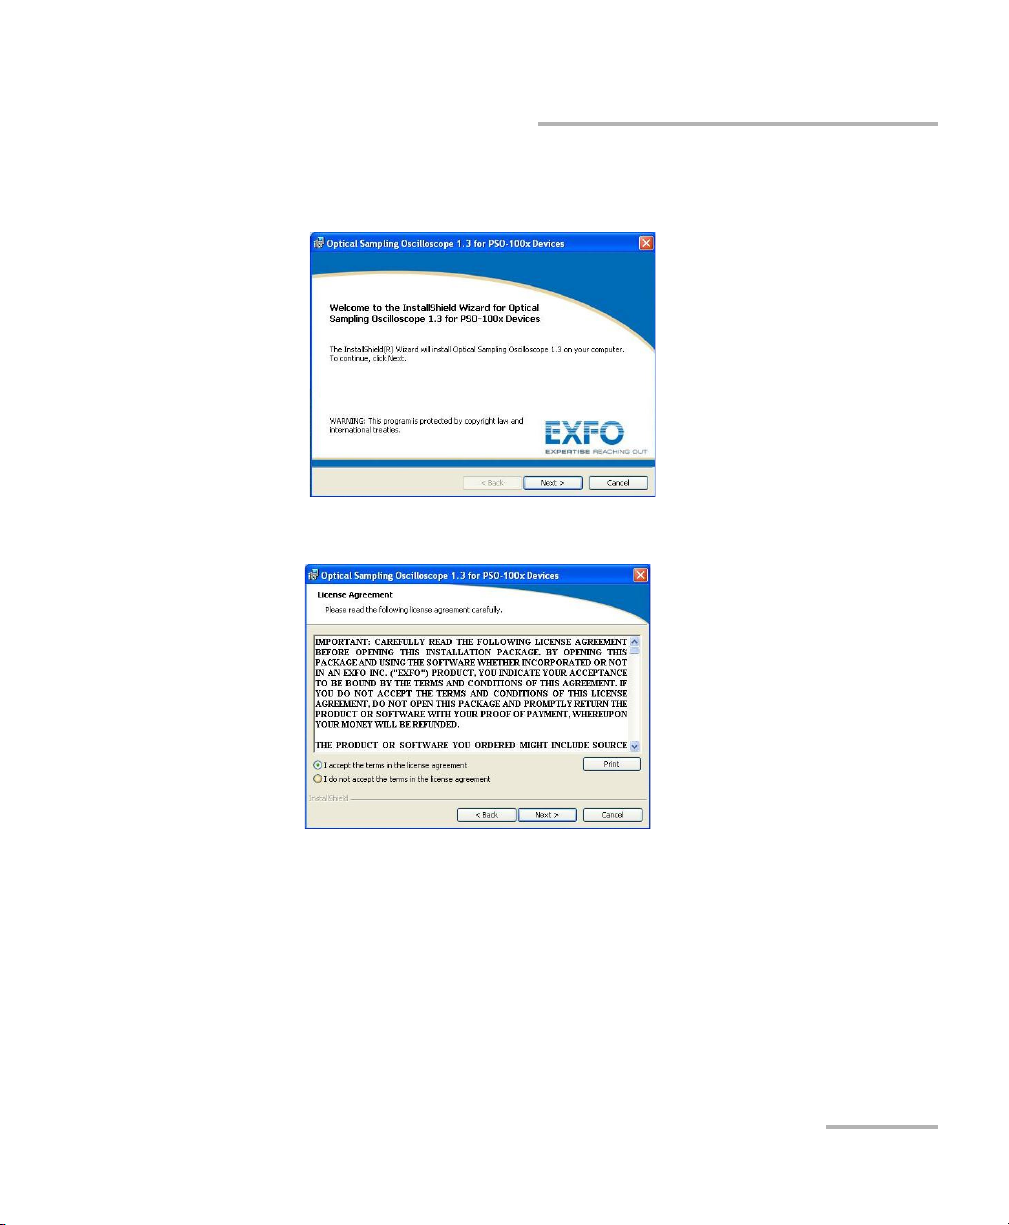
10. When the Optical Sampling Oscilloscope wizard appears, click Next to
start the installation.
11. Read and accept the licence agreement, then click Next.
Optical Sampling Oscilloscope 15
Page 24
Getting Started with Your Optical Sampling Oscilloscope
Installing the Matlab Runtime, USB Drivers and Optical Sampling Oscilloscope Software
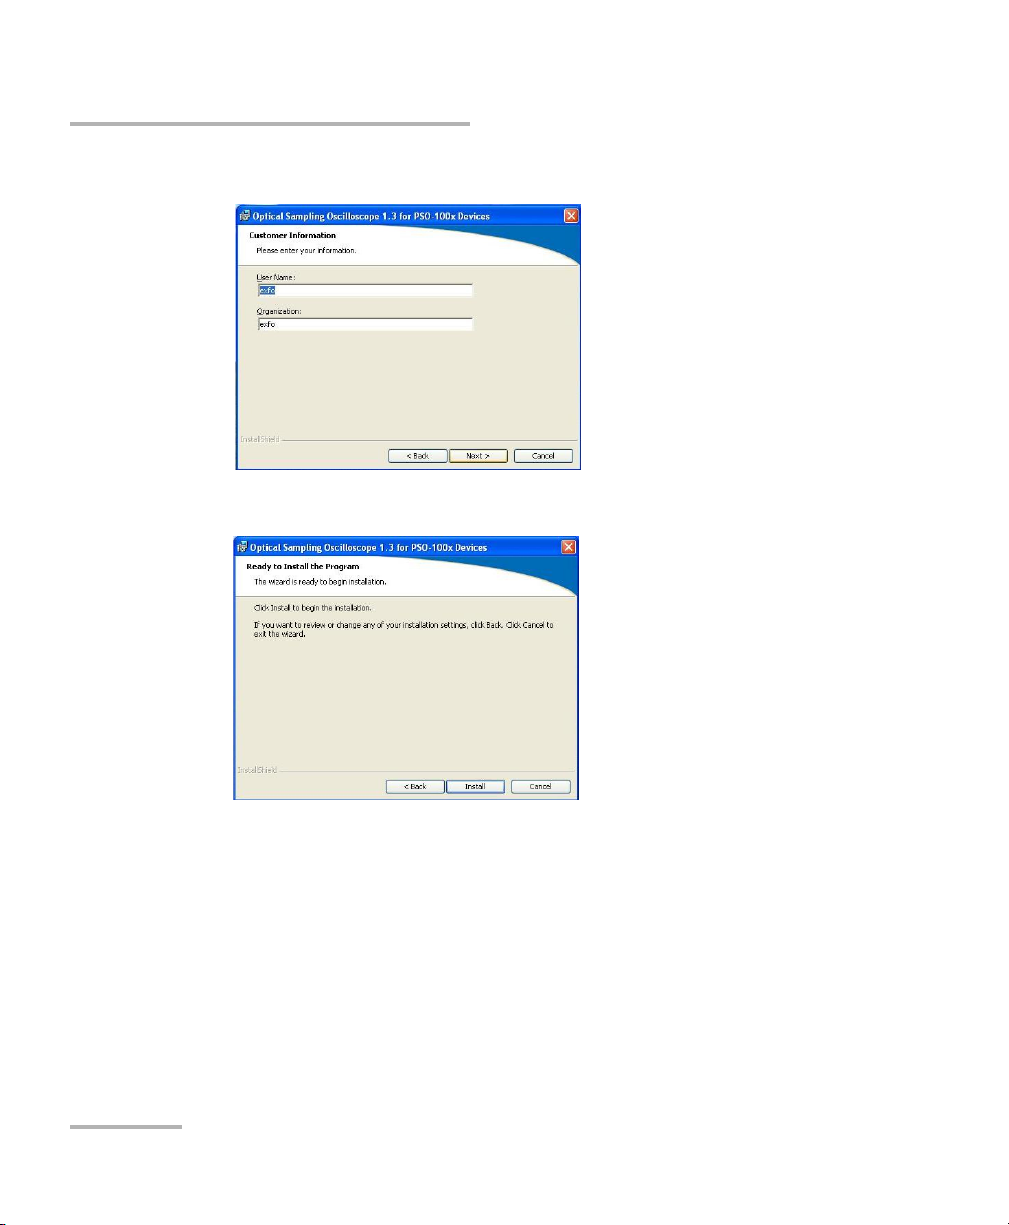
12. Enter your user name and organization information, then click Next.
13. You are now ready to install the program. Click Install.
16 PSO-100
Page 25
Getting Started with Your Optical Sampling Oscilloscope
Installing the Matlab Runtime, USB Drivers and Optical Sampling Oscilloscope Software
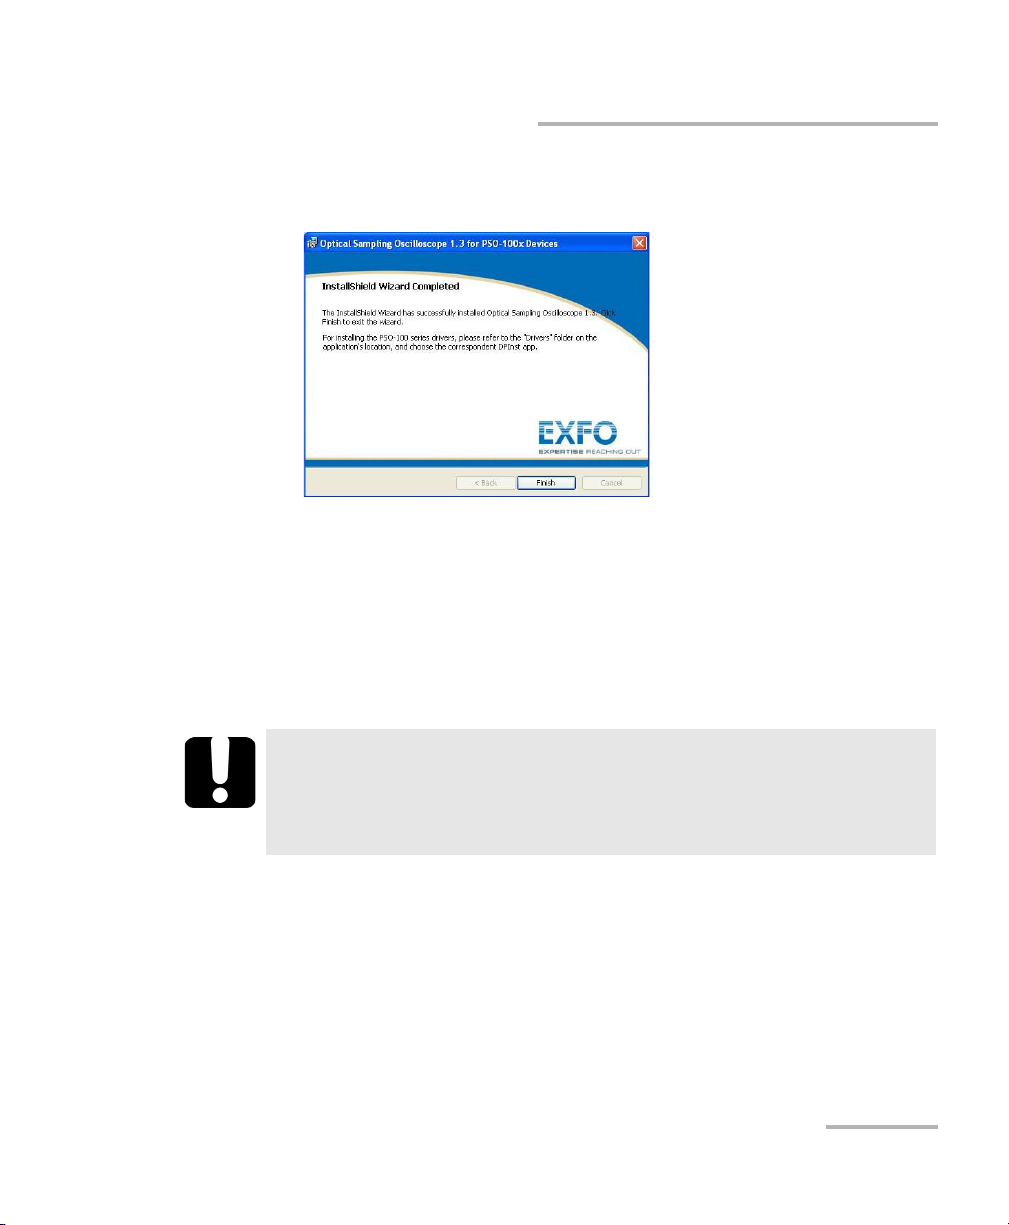
14. The installation of the Optical Sampling Oscilloscope is now complete,
click Finish.
If any version of Matlab is installed on your computer, the system path must
be adjusted to prioritize the Runtime over the Matlab software.
Note: If you have an old version of the Optical Sampling Oscilloscope application
that was compiled with an old version of Matlab, and you want to update
to the EXFO application, you need to uninstall the older versions first, then
install a new version of MCR (follow the procedure above).
IMPORTANT
You must remove the HKEY_LOCAL_MACHINE\SOFTWARE\MATLAB
registry key after uninstalling the older versions to make sure that
the new version is installed correctly.
Optical Sampling Oscilloscope 17
Page 26
Getting Started with Your Optical Sampling Oscilloscope
Installing the Matlab Runtime, USB Drivers and Optical Sampling Oscilloscope Software
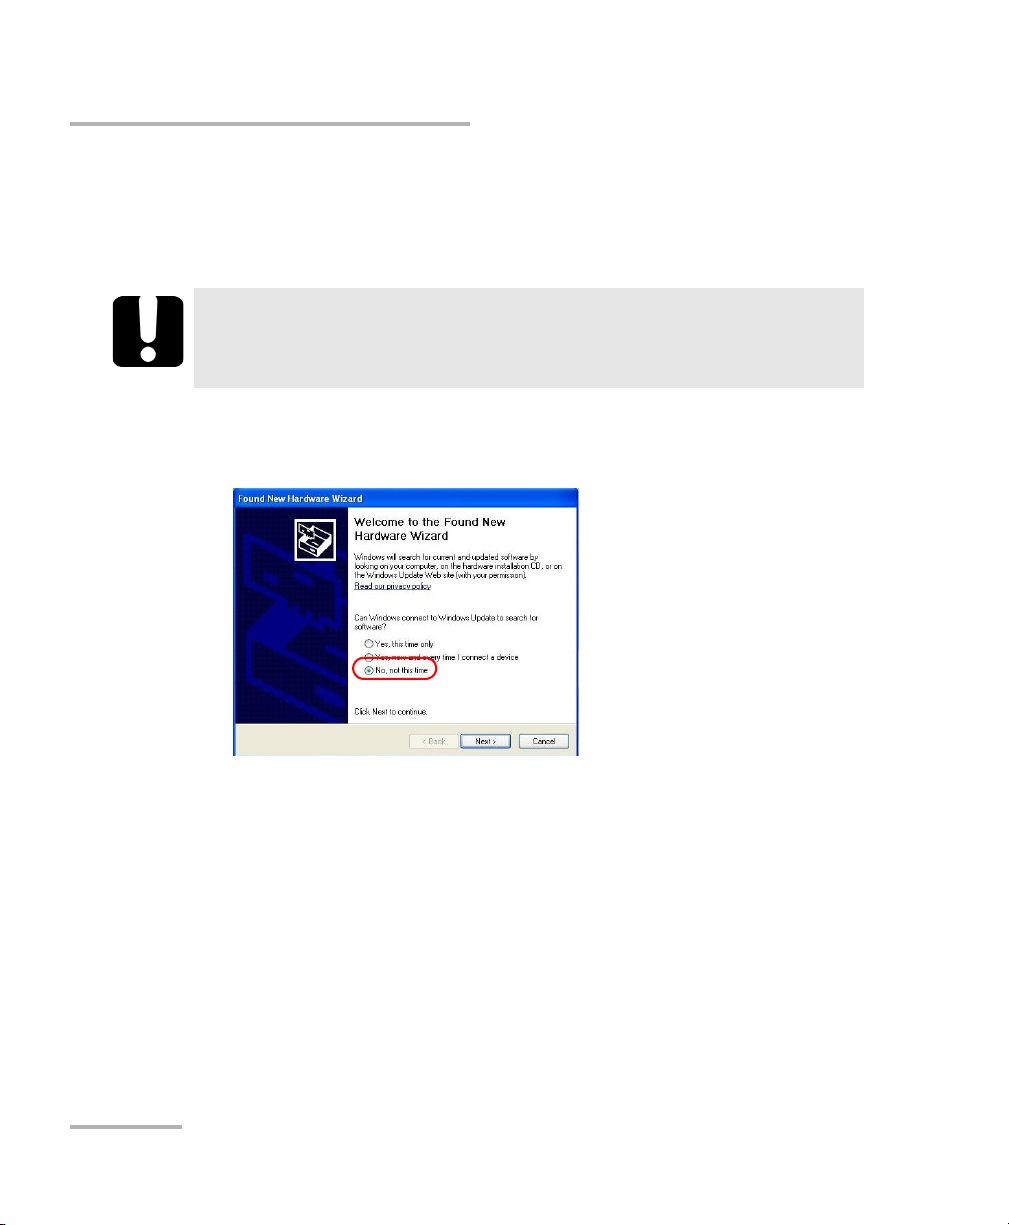
To install the USB driver on your computer:
1. Connect the unit using a USB connection. When the instrument is
connected to a USB port of the computer for the first time, Windows
will find the new hardware and ask you to install the USB driver.
IMPORTANT
Make sure that you use a USB 2.0 port and not a USB 1.1, since this
will affect the refresh rate.
2. Windows Update should not search for updates. Select No, not this
time, and then click Next (Windows XP installation only).
18 PSO-100
Page 27
Getting Started with Your Optical Sampling Oscilloscope
Installing the Matlab Runtime, USB Drivers and Optical Sampling Oscilloscope Software
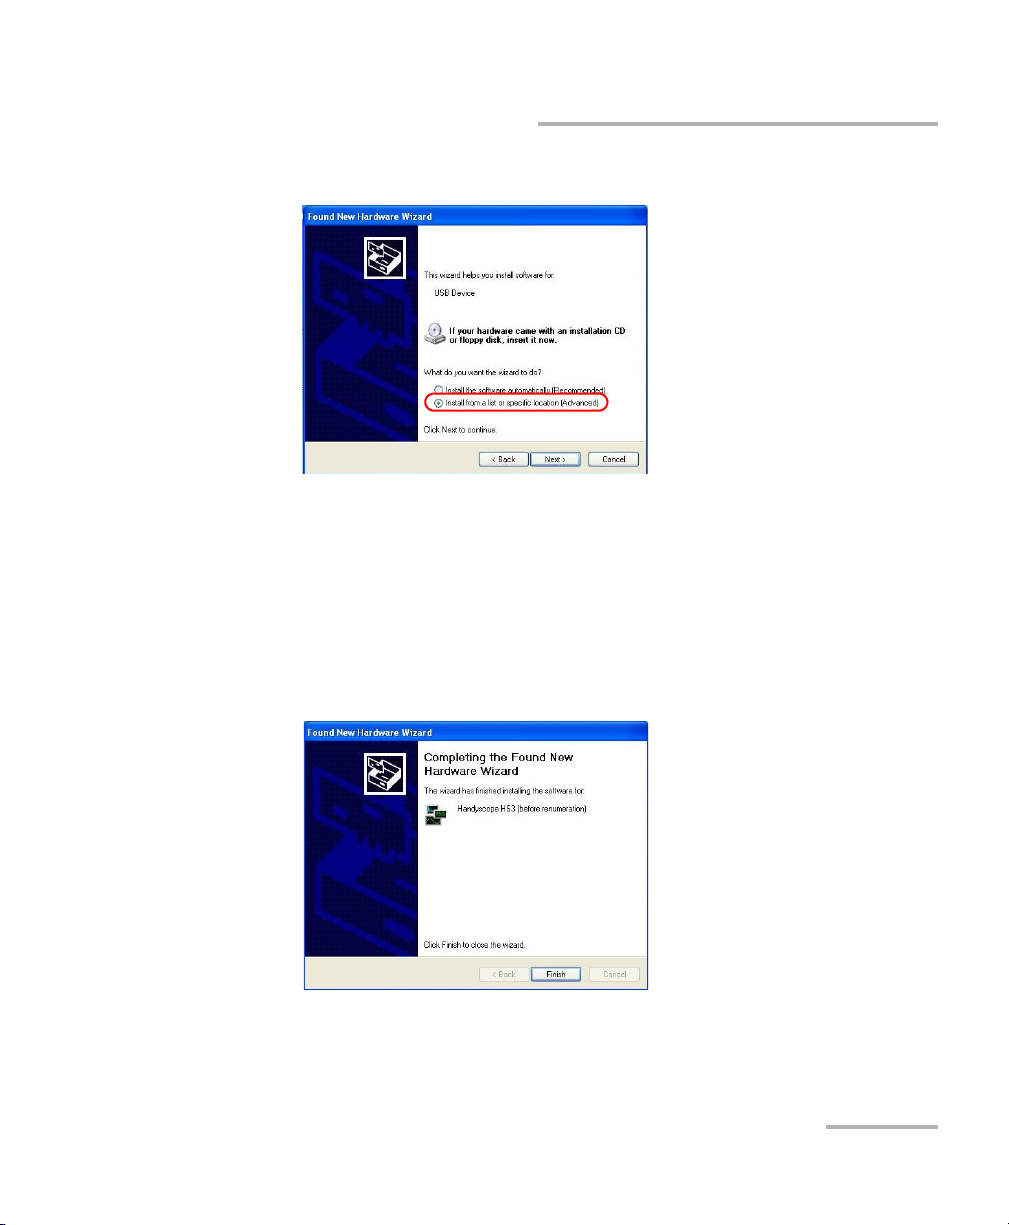
3. Select Install from a specific location, and then click Next.
The USB driver is found in your folder under "…\drivers"; indicate it in
the corresponding box. The installation will not pass Windows Logo
testing to verify compatibility with Windows XP.
4. Click Continue anyway to install the driver and complete the process.
5. Click Finish. Windows indicates that it has found new hardware but
recognizes the USB device. A loader was installed at step 2. In a second
step, the real driver is installed by following step 2 and on once more.
Note: The exact appearance of the windows differ slightly depending on which
version of Windows you are using.
Optical Sampling Oscilloscope 19
Page 28
Getting Started with Your Optical Sampling Oscilloscope
Installing and Starting the Optical Sampling Oscilloscope
Installing and Starting the Optical Sampling
Oscilloscope
Before you turn on the instrument, follow the procedure below.
To install and start the instrument:
1. Connect the included AC adapter to the input on the rear panel and to
the wall socket.
2. If you have not already done so, link the unit and the host computer
together using a USB cable.
Note: The first time you do this you are asked to install the USB driver on your
computer. Follow the instructions in Installing the Matlab Runtime, USB
Drivers and Optical Sampling Oscilloscope Software on page 12. If you are
working in Windows XP, make sure that you use the same USB port every
time afterwards. If not, you will have to install the USB driver again.
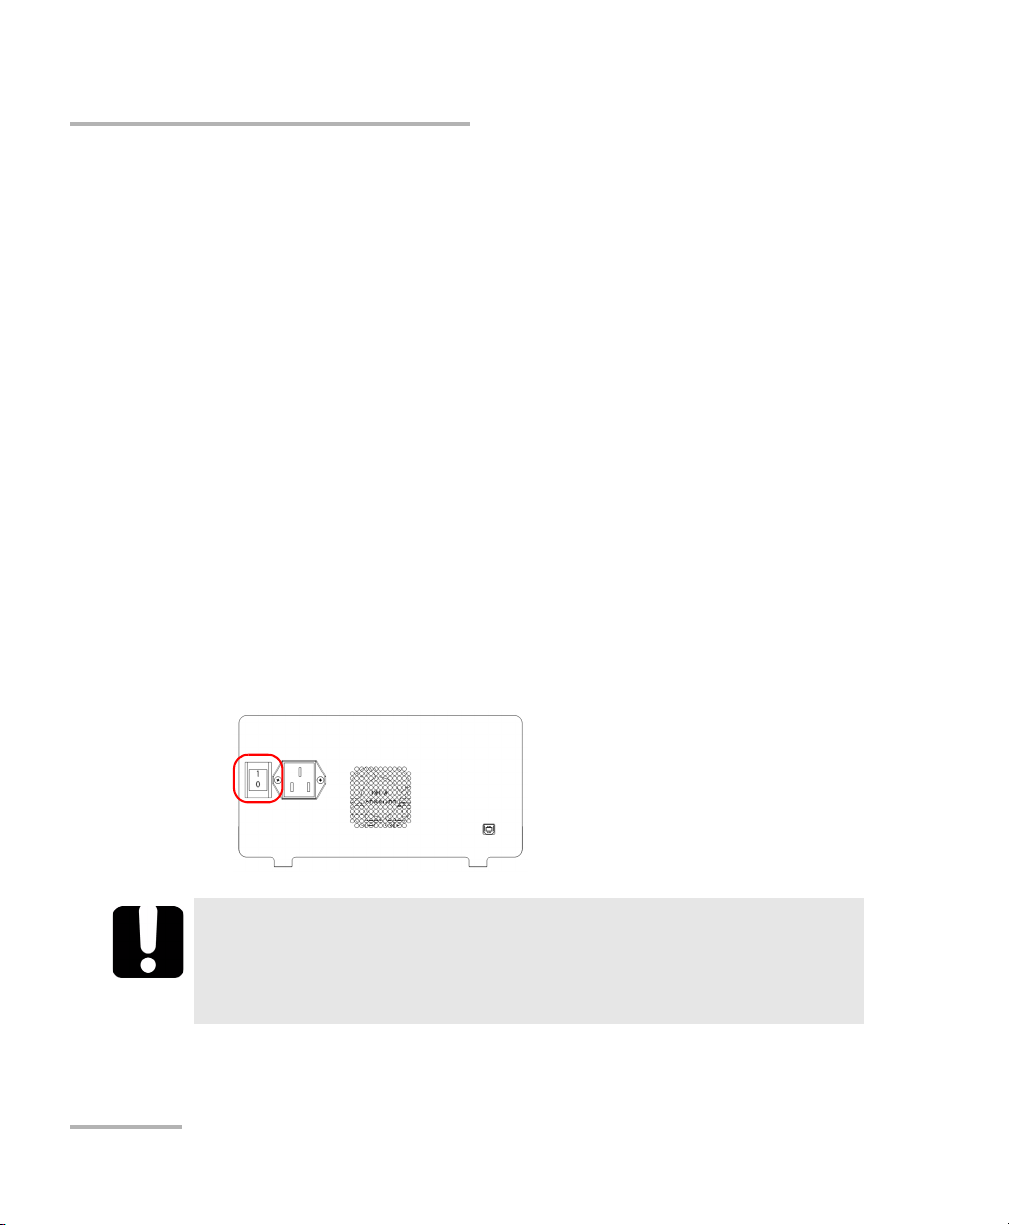
3. Turn on the instrument using the control on the rear panel. The blue
LED indicator on the front panel should be on. Wait 5 minutes and let
the instrument warm up.
IMPORTANT
Do not turn off the instrument unnecessarily, for example if you
change the host computer. If the instrument is turned off, it may
need to cool down for five minutes before it can be started again.
20 PSO-100
Page 29

Getting Started with Your Optical Sampling Oscilloscope
Installing and Starting the Optical Sampling Oscilloscope
4. Start the application on your computer by selectin the start menu, then
Programs > EXFO > Optical Sampling Oscilloscope.
IMPORTANT
The Optical Sampling Oscilloscope must be turned on before
starting the application.
IMPORTANT
EXFO recommends that you put the synchronization type to Freerun
before starting your tests. This ensures that you have an adequate
signal with an appropriate amplitude.
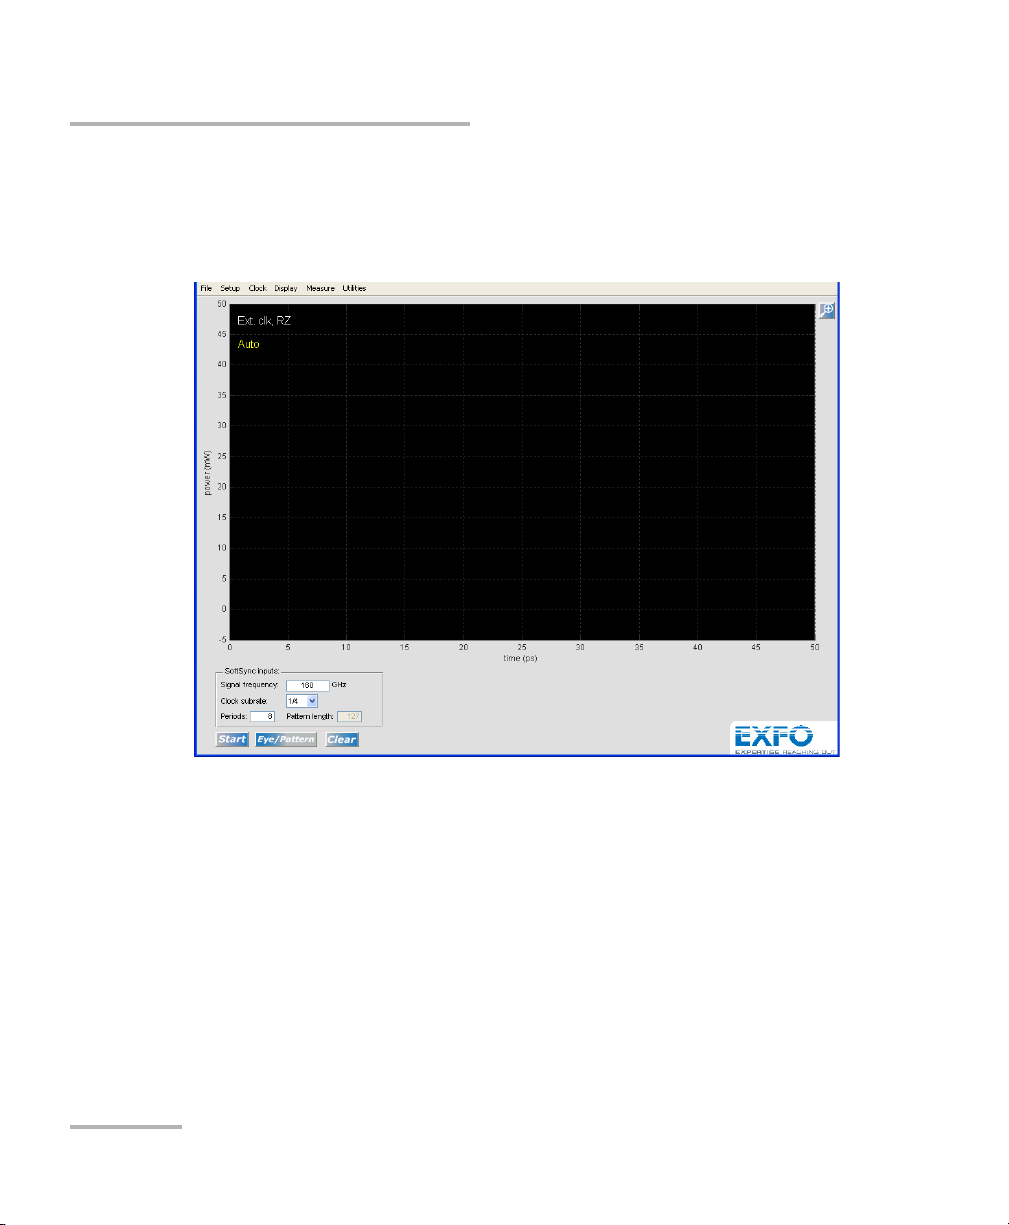
First a DOS window opens where the version number is shown. Then
the USB connection OK message should appear. If it does not, the USB
communication with the instrument is not functioning properly. If the
initial test is passed the application appears on-screen.
Optical Sampling Oscilloscope 21
Page 30
Getting Started with Your Optical Sampling Oscilloscope
Installing and Starting the Optical Sampling Oscilloscope
The first time you start the application, the screen will show the default
setting. However, if you make changes to these settings while working, the
unit will retain those changes and display them again the next time you
start the application.
22 PSO-100
Page 31

Getting Started with Your Optical Sampling Oscilloscope
Installing and Starting the Optical Sampling Oscilloscope
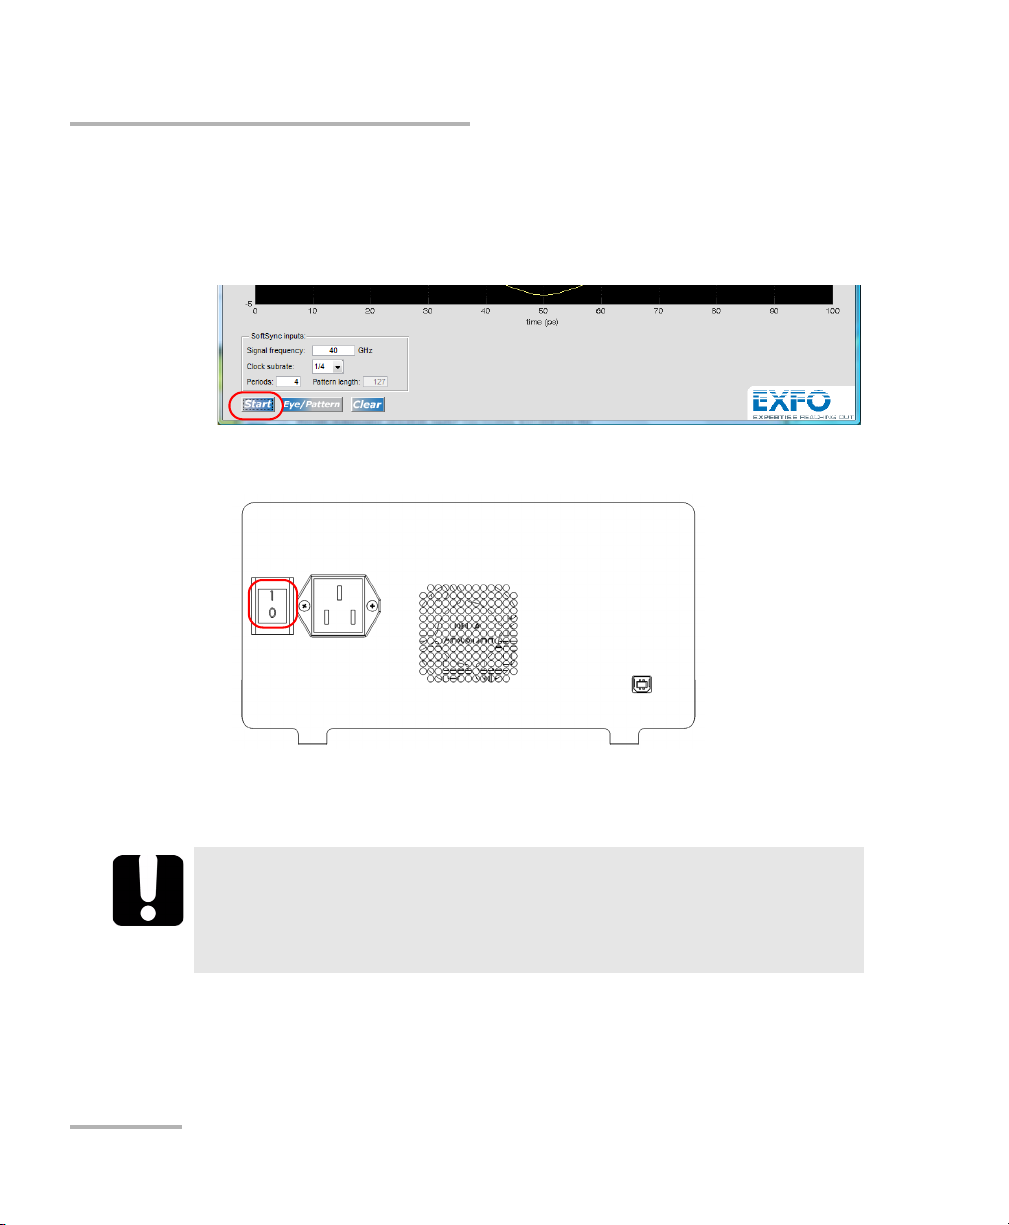
5. From the Setup menu, select Sync Format, then Freerun, and click
the Start button at the left bottom corner to check for the signal quality.
The instrument should now start to measure and samples should appear at
the zero level. The instrument will need some time to warm up before the
samples attain the correct DC level. The DC level is somewhat temperature
dependent.
Optical Sampling Oscilloscope 23
Page 32
Getting Started with Your Optical Sampling Oscilloscope
Turning off the Optical Sampling Oscilloscope
Turning off the Optical Sampling Oscilloscope
To turn off the instrument:
1. Stop the sampling with the Stop button in the application.
2. Turn off the instrument using the control on the rear panel.
Note: If you do the opposite, the application may freeze.
IMPORTANT
Do not turn off the instrument unnecessarily, for example if you
change the host computer. If the instrument is turned off, it may
need to cool down for five minutes before it can be started again.
24 PSO-100
Page 33

Getting Started with Your Optical Sampling Oscilloscope
Cleaning and Connecting Optical Fibers
Cleaning and Connecting Optical Fibers
IMPORTANT
To ensure maximum power and to avoid erroneous readings:
³ Always inspect fiber ends and make sure that they are clean as
explained below before inserting them into the port. EXFO is
not responsible for damage or errors caused by bad fiber
cleaning or handling.
³ Ensure that your patchcord has appropriate connectors. Joining
mismatched connectors will damage the ferrules.
To connect the fiber-optic cable to the port:
1. Inspect the fiber using a fiber inspection microscope. If the fiber is
clean, proceed to connecting it to the port. If the fiber is dirty, clean it as
explained below.
2. Clean the fiber ends as follows:
2a. Gently wipe the fiber end with a lint-free swab dipped in isopropyl
alcohol.
2b. Use compressed air to dry completely.
2c. Visually inspect the fiber end to ensure its cleanliness.
Optical Sampling Oscilloscope 25
Page 34

Getting Started with Your Optical Sampling Oscilloscope
Cleaning and Connecting Optical Fibers
3. Carefully align the connector and port to prevent the fiber end from
touching the outside of the port or rubbing against other surfaces.
If your connector features a key, ensure that it is fully fitted into the
port’s corresponding notch.
4. Push the connector in so that the fiber-optic cable is firmly in place,
thus ensuring adequate contact.
If your connector features a screwsleeve, tighten the connector
enough to firmly maintain the fiber in place. Do not overtighten, as this
will damage the fiber and the port.
Note: If your fiber-optic cable is not properly aligned and/or connected, you will
notice heavy loss and reflection.
26 PSO-100
Page 35
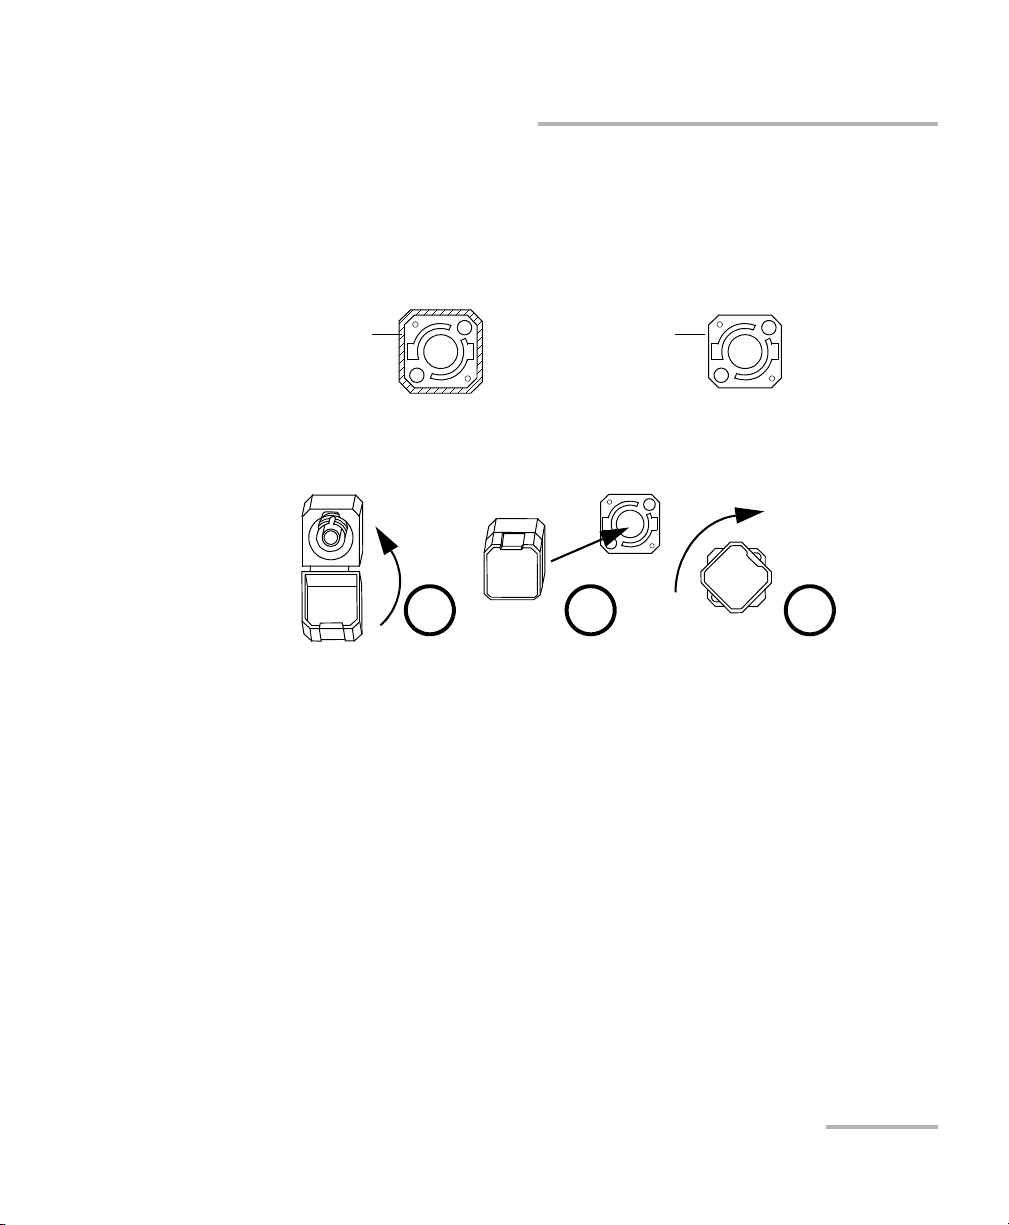
Getting Started with Your Optical Sampling Oscilloscope
Bare metal
(or blue border)
indicates UPC
option
Green border
indicates APC
option
2 3 4
Installing the EXFO Universal Interface (EUI)
Installing the EXFO Universal Interface (EUI)
The EUI fixed baseplate is available for connectors with angled (APC) or
non-angled (UPC) polishing. A green border around the baseplate
indicates that it is for APC-type connectors.
To install an EUI connector adapter onto the EUI baseplate:
1. Hold the EUI connector adapter so the dust cap opens downwards.
2. Close the dust cap in order to hold the connector adapter more firmly.
3. Insert the connector adapter into the baseplate.
4. While pushing firmly, turn the connector adapter clockwise on the
baseplate to lock it in place.
Optical Sampling Oscilloscope 27
Page 36

Page 37
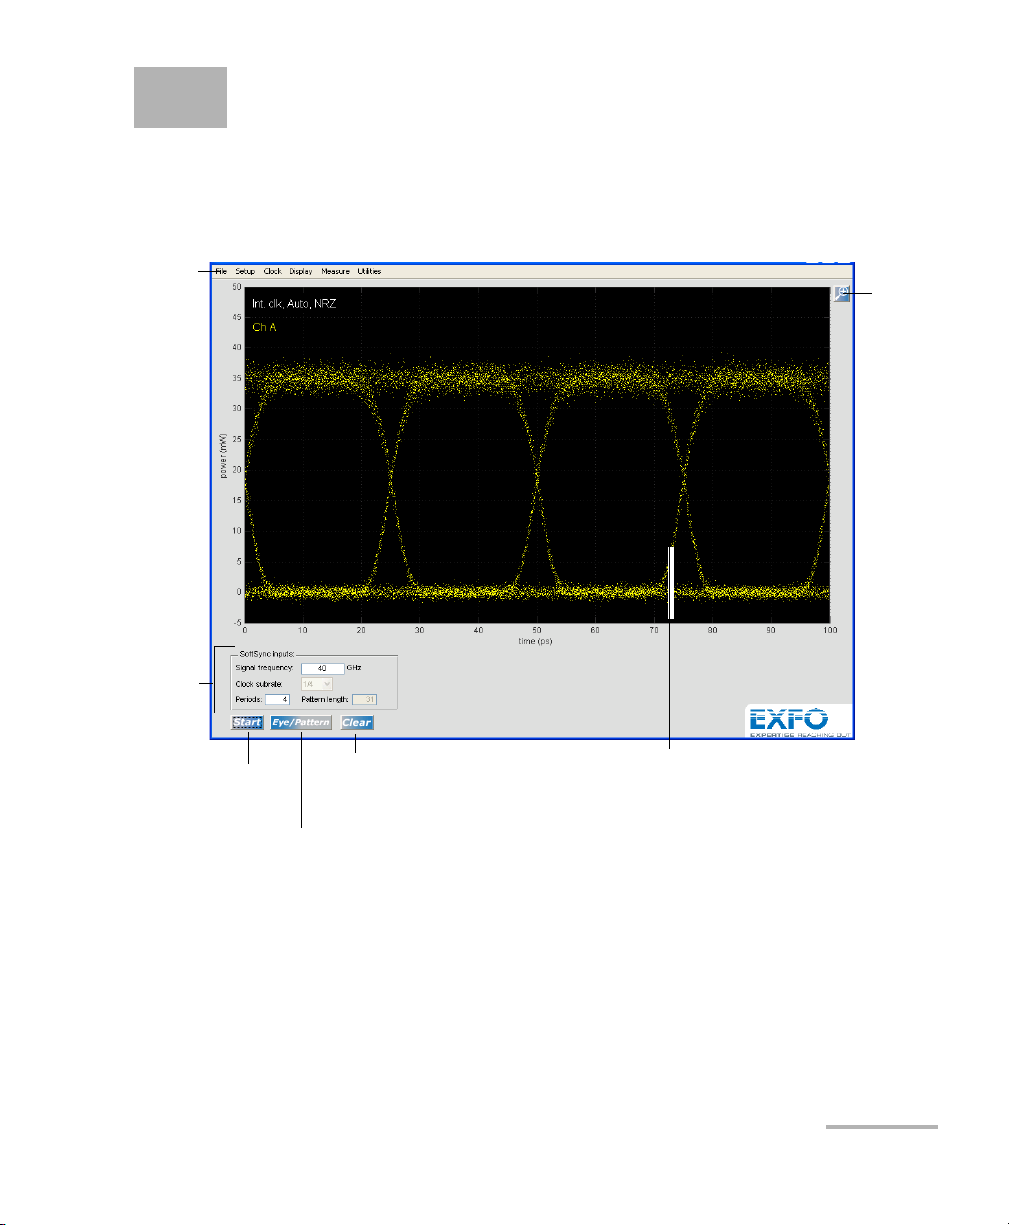
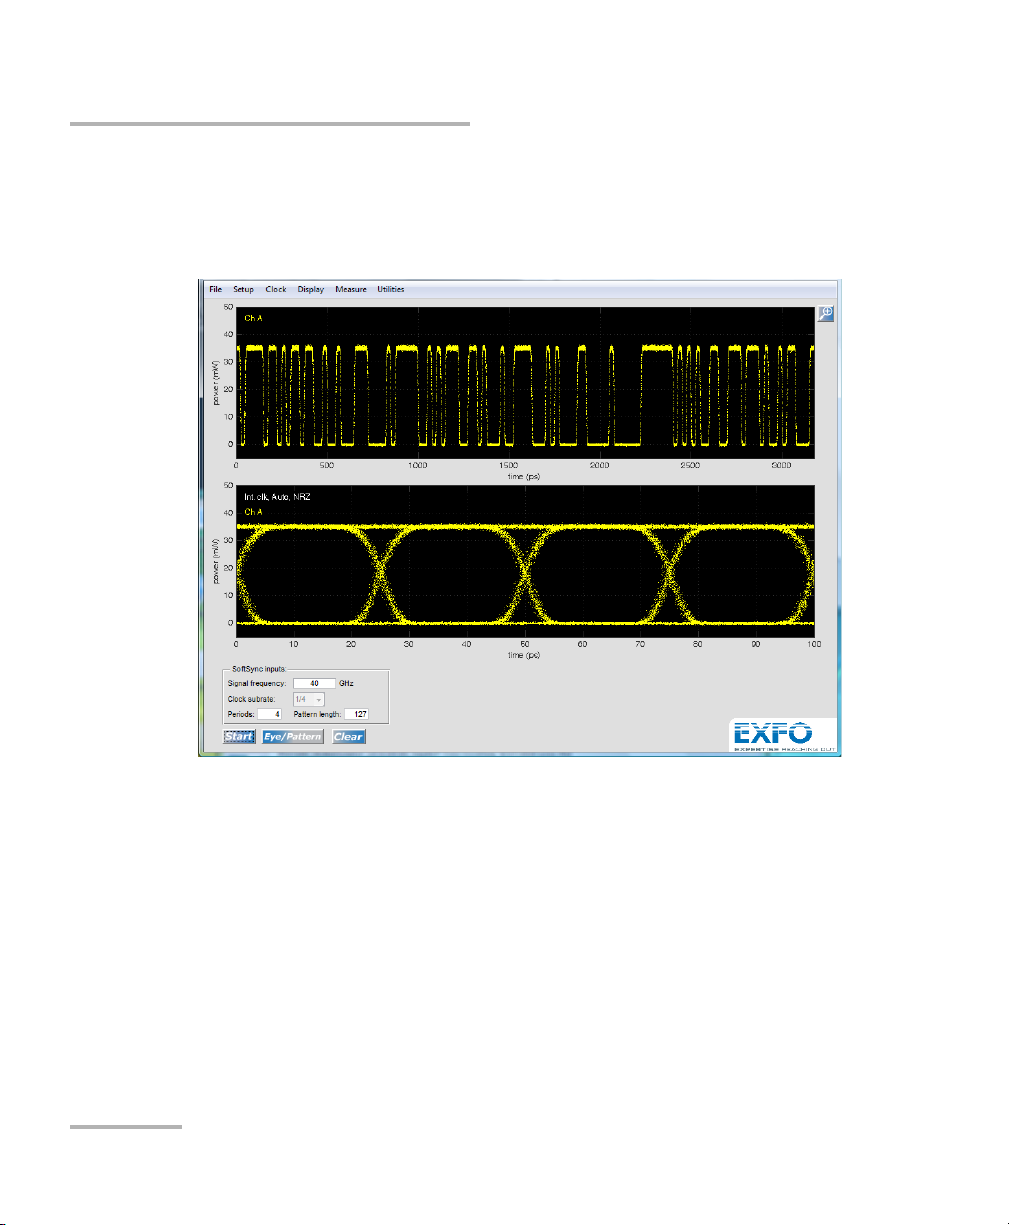
Menu
bar
Sample
screen
Input
controls
Zoom
controls
Starts/Stops
sampling
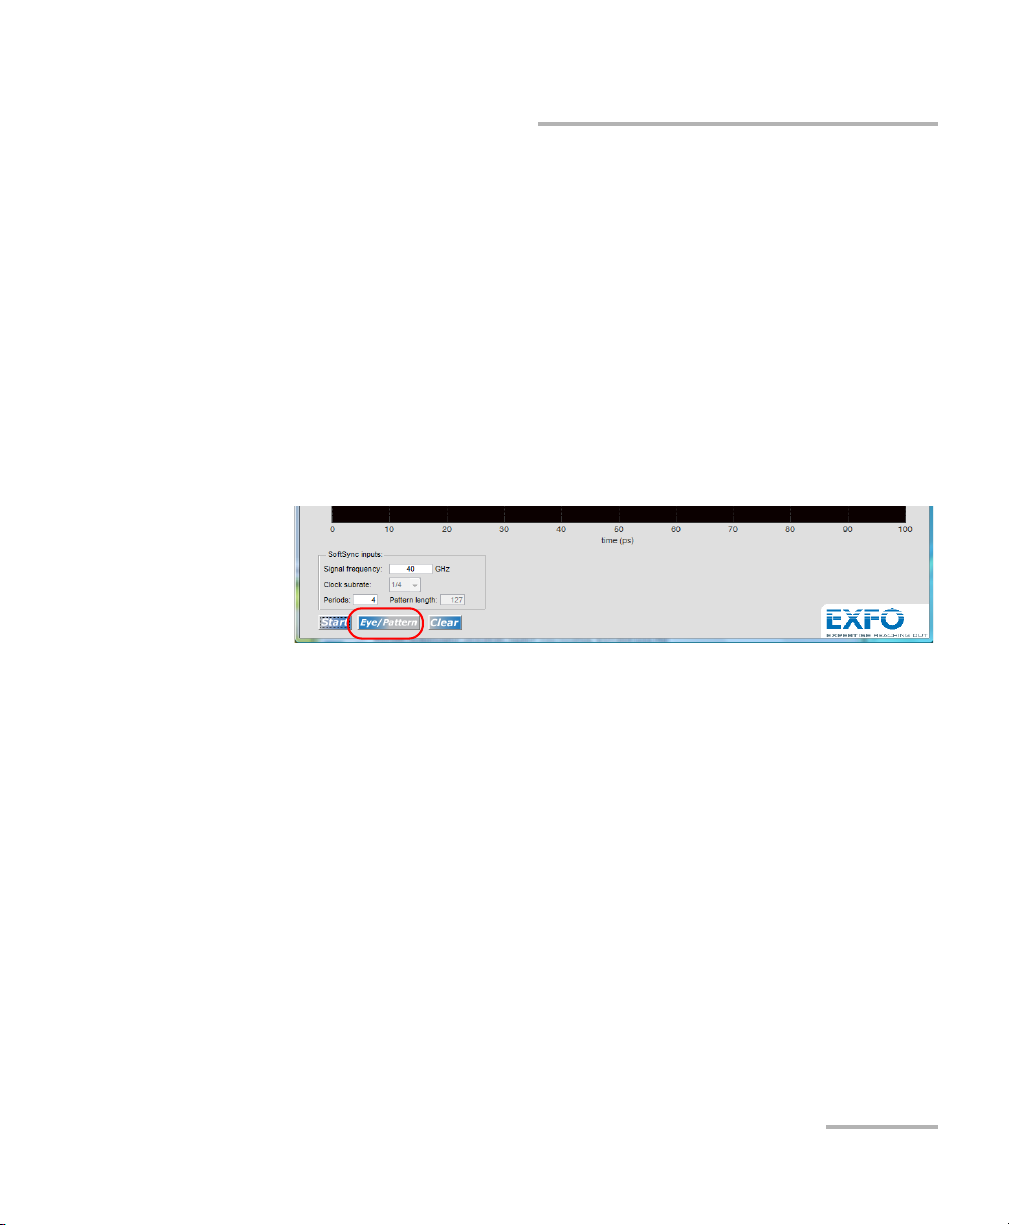
Switches between eye diagram view and pattern
view (you can also select the display mode in the
Setup > Display Mode menu.
Clears sample screen
4 Setting up and Using the
Optical Sampling Oscilloscope
Once the unit and application are started, you can begin using the Optical
Sampling Oscilloscope.
Optical Sampling Oscilloscope 29
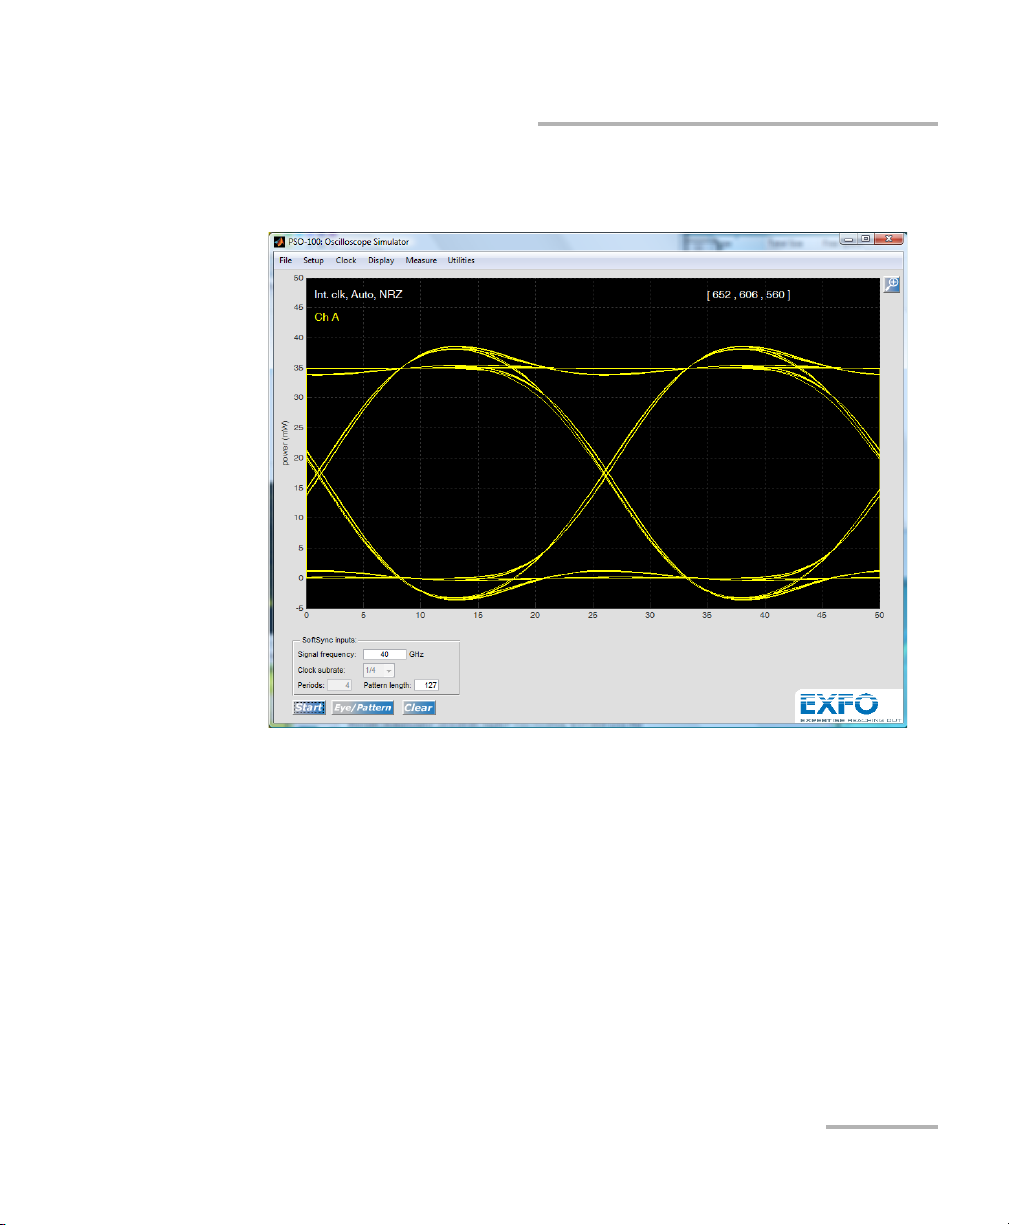
Page 38

Setting up and Using the Optical Sampling Oscilloscope
³ From the menu bar you can select different functions, for example to
save samples, to select the waveform format, and clock settings.
³ From the Setup menu, you can select the method used to synchronize
the channel(s), the synchronization format, as well as the color settings
and the display modes. This is also where you will set the dual window
settings.
³ The Clock menu allows you to enable the optional external and gated
clocks.
³ From the Display menu you can select the number of samples,
persistence layers, averaging, histograms, and color grade, etc.
³ In the Measure menu, you can select a number of parameters to
measure in eye diagrams or waveforms.
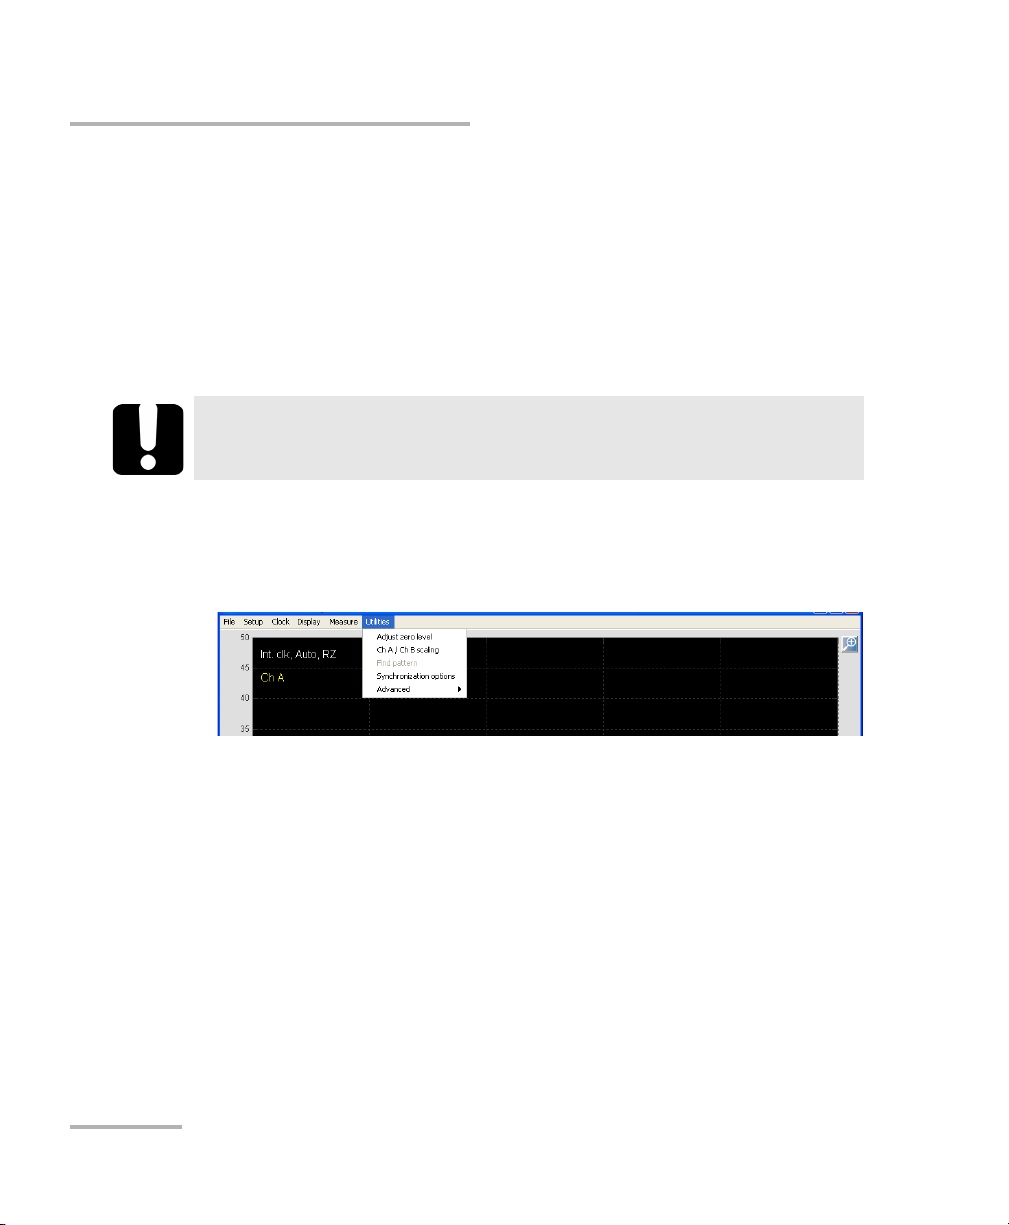
³ In the Utilities menu, you can perform actions such as synchronizing
the signals, adjusting the zero level (nulling the signal) or find a pattern
for your sampling.
³ Under SoftSync inputs you can insert the signal frequency, how many
periods/eye-diagrams to visualize on the sample screen, pattern
length, and clock sub rate if the external clock option is used.
³ The zoom controls feature functions for zooming in x- or y directions.
You can also use the pan function to view a particular part of the time
or power scales.
³ At the bottom there are three buttons: Start/Stop, a switch button
between eye-diagram and pattern, and a Clear button for clearing
measurements, histograms, averaging and color grades.
By clicking the right mouse button you can place markers and introduce a
time delay between the data and the external clock.
Note: The controls for the dual window display function exactly in the same way
as their single-window counterparts. For details on the features you can use
in the dual display, please see the corresponding section for single display.
30 PSO-100
Page 39

Setting up and Using the Optical Sampling Oscilloscope
Optional 10 GHz clock
Pattern Generator
Laser 1550
nm
Driver
Amplifier
EDFA
Mach-Zender
Modulator
Optical
Bandpass Filter
10 GHz clock
40 Gb/s Output
10log10P2σ2⁄()=()
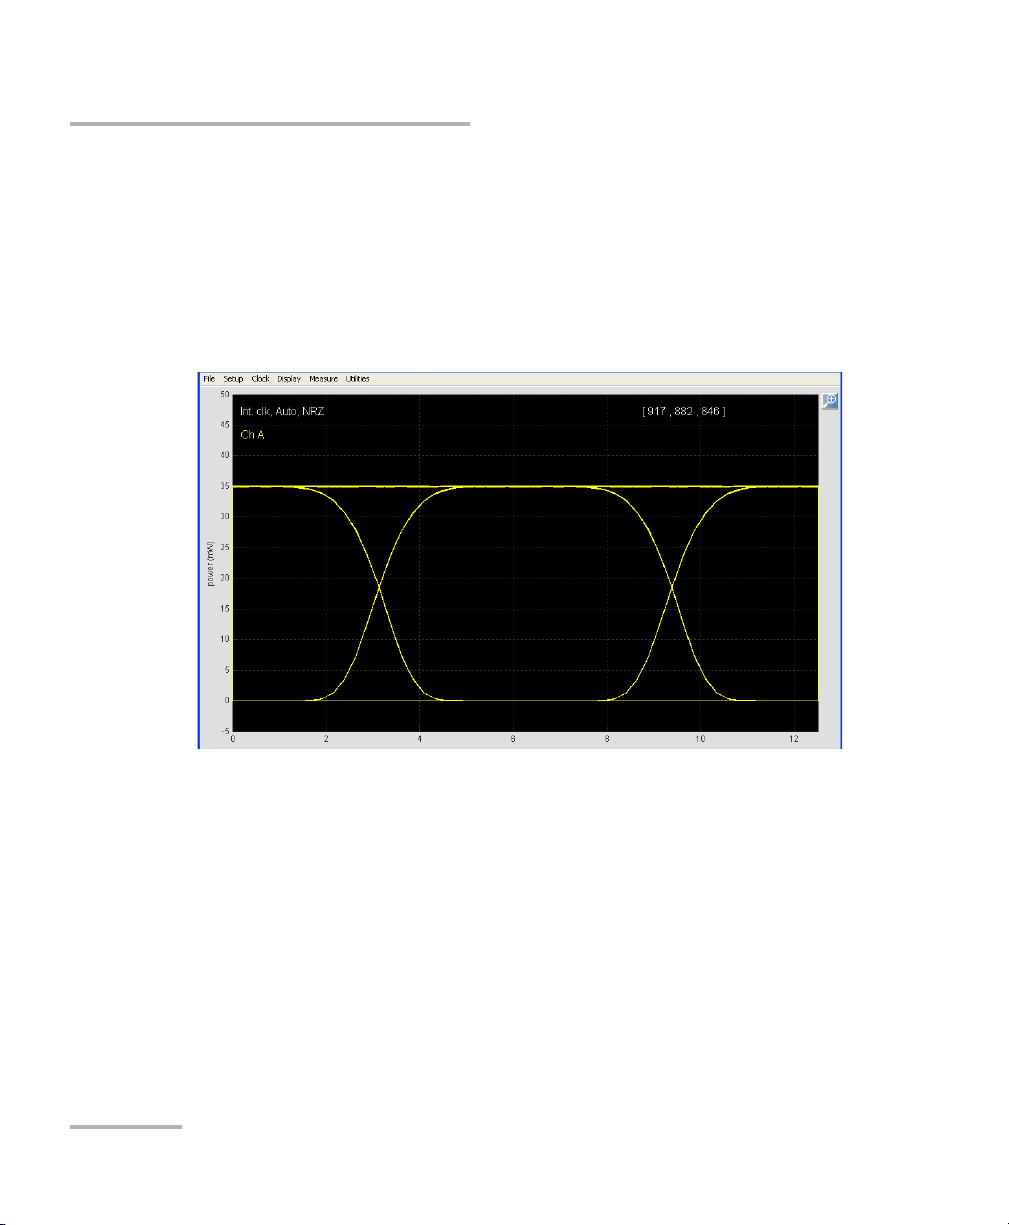
For the examples in this documentation, we have tested an optical 40 Gb/s
NRZ transmitter, which consists of a laser source modulated by a pattern
generator and a Mach-Zender modulator according to the figure below.
The average input power to the sampling oscilloscope was approximately
15 mW after amplification and filtering. Since the signal sensitivity that is
the peak power required to get 20 dB SNR , is
approximately 1 mW, you may need to amplify an NRZ signal to measure a
clear eye diagram. Short RZ pulses on the other hand, for example from a
ring laser with comparable average power, and hence high peak power, do
not need amplification. An optical band-pass filter is recommended to filter
out ASE noise from the EDFA. The input signal could, of course, be of
various types of optical amplitude modulated signals at any bit rate from
DC to 1.28 Tb/s or short pulses without data.
Optical Sampling Oscilloscope 31
Page 40
Setting up and Using the Optical Sampling Oscilloscope
Adjusting the Zero Level (Nulling Offsets)
Adjusting the Zero Level (Nulling Offsets)
Temperature and humidity variations affect the performance of electronic
circuits and optical detectors, which can offset measurement results. To
compensate for this offset, the PSO-100 is equipped with an offset nulling
function.
EXFO recommends performing a nulling of the electrical offsets whenever
environmental conditions change.
IMPORTANT
Light must not reach the detector when nulling offsets.
To adjust the zero level:
1. From the main window, select the Utilities menu, then Adjust Zero
Level.
2. Remove the input signals from the unit, then click on the screen to start
the process.
The unit will set the average level to zero, then continue to measure.
Once the process is complete, you can turn on the input signal again and
continue the measurements.
32 PSO-100
Page 41

Setting up and Using the Optical Sampling Oscilloscope
Signal
frequency
Number of eye periods to display
on-screen (available in eye diagram mode)
Data symbol rate (for example,
1/4 for a signal frequency of
40 GHz and a clock frequency of
10 GHz).
Pattern length of the input signal
(available in pattern mode)
...
...
Signal frequency
8 MHz
Even Intervals
Odd intervals
Correct interval
Managing SoftSync Input
Managing SoftSync Input
The SoftSync inputs section the bottom left is used for input of parameters
important for the software synchronization algorithm to correctly
synchronize the data.
In order to obtain the correct time scale, an estimate of the signal
frequency should be inserted since there is no other way for the software
to know the bit rate. The signal frequency should be accurate within the
correct 8 MHz (sampling frequency divided by two) interval, according to
the figure below.
Optical Sampling Oscilloscope 33
Ensuring that the correct values are entered ensures appropriate
measurements.
Page 42

Setting up and Using the Optical Sampling Oscilloscope
Managing SoftSync Input
³ If you select an incorrect interval, you will still see an eye-diagram, but
with an incorrect time scale; it will actually show a reversed time scale
for odd intervals.
³ If you select an incorrect interval in pattern mode, you will notice that
you see numerous eye diagrams instead of a pattern. Although this is
not the expected result, this can be used to determine the correct
interval or signal frequency by selecting a value untils you see a
pattern.
IMPORTANT
Different signal generators may have different calibrations. The
sampling frequency also drifts slightly with temperature. Therefore,
a 40 GHz setting in SoftSync inputs is not guaranteed to fully match
a signal generator set to 40.000 GHz. You may have to tune the
signal frequency in SoftSync to find the correct interval.
You can also calibrate the sampling frequency in the Utilities menu,,
using the Find pattern feature.
³ When the external clock (option) is selected from the Clock menu,
Clock subrate becomes active. You can then select the correct clock
sub rate from the list. For example, if a 10 GHz clock and 40 Gb/s data is
used, a ¼ sub rate clock should be used. If an incorrect value is chosen
from the list, the time scale will be incorrect.
34 PSO-100
Page 43

Setting up and Using the Optical Sampling Oscilloscope
Scaling Channel 1 to Channel 2 (PSO-102 Models)
Scaling Channel 1 to Channel 2 (PSO-102
Models)
If, for some reason, the power calibration has shifted (the signal is not of
the same value on both channels), you can re-calibrate this ratio. for the
two channels.
To enter a ratio for channel 1 vs. channel 2:
1. From the main window, select the Utilities menu.
2. Select Ch A / Ch B scaling.
3. Enter the ratio you want to use for channel A compared to channel B.
4. Click OK to close the window.
Optical Sampling Oscilloscope 35
Page 44

Setting up and Using the Optical Sampling Oscilloscope
Finding a Pattern in a Sampling
Finding a Pattern in a Sampling
If for some reason the pattern does not show up in your measurement, but
numerous eye diagrams instead, you can find the pattern using your unit.
Note: It will only work if you have a repetitive pattern, not random data or
SONET/SDH framed data.
Before you do this, make sure that you have inserted the correct pattern
length. Also insert the approximate signal frequency (and clock subrate if
using the external clock). For example you may not know the signal
frequency exactly, which results in incorrect time scale. But if you still want
to see the pattern use the find pattern function.
To find the pattern in your sampling:
1. Make sure that you are in pattern display mode, and that the sampling
is running.
2. From the main window, select the Utilities menu, then Find pattern.
The pattern is displayed automatically.
36 PSO-100
Page 45

Setting up and Using the Optical Sampling Oscilloscope
Reverts to default zoom values
Zooms according to the time or power
axis (the upper part of the zoom tools is
updated accordingly)
Closes zoom tool menu
Lets you select a specific
area where to zoom
In dual- window mode, to use
the zoom tool on both windows
Time or power unit settings
(automatically updated on-screen)
Time or power units
Moves to other sections of the
window when zoom is applied
Zooms in/out automatically
Focuses the zoom function
on top or bottom window
Focal point for zoom function. The
reference is on the horizontal axis for
time, and vertical axis for power
Using the Zoom Functions
Using the Zoom Functions
The zoom functions are located on the right hand side of the window. You
can decide to show or hide the zoom menu at any time.
To display the zoom controls:
Click at the top right hand corner of the window.
To use the zoom controls:
Once you have activated the zoom tools, use the feature that suits your
situation best:
Note: The blue portion of the button indicates which option is currently selected.
Note: Each time that you change the view type for a window, the zoom factor
Optical Sampling Oscilloscope 37
reverts to the default value.
Page 46

Setting up and Using the Optical Sampling Oscilloscope
Synchronizing the Input to a Specific Channel
Synchronizing the Input to a Specific Channel
You might want to synchronize your input signal with a specific channel (A
or B), or let the Optical Sampling Oscilloscope pick the best signal
automatically.
To select a channel for input synchronization:
1. From the main window, select the Setup menu, then Sync. Channel.
2. Select which channel you want to use, or select the automatic mode.
Your choice will be indicated on the top lefthand part of the screen.
Selecting Sync Format
The Optical Sampling Oscilloscope features several synchronization
formats so that the software and data are correctly matched. If you use an
unconventional data format, the existing format selections may fail to
provide you with an accurate measurement. For testing unconventional
data formats, EXFO recommends using the optional external clock.
³ In Freerun mode, the raw data is shown without synchronization.
³ The NRZ mode is optimized for NRZ, but can also be used, for
example, in duo-binary transmission.
³ The RZ mode is preferable for all RZ formats (for example RZ, chirped
RZ (CRZ), carrier suppressed RZ (CSRZ), etc.). It also works for RZ
pulses (no data). There is also a selection for inverse RZ data, which
can be used for example in NRZ-DPSK or NRZ-DQPSK data, before
demodulation..
38 PSO-100
Page 47

Setting up and Using the Optical Sampling Oscilloscope
Selecting Sync Format
³ The DPSK (differential phase-shift keying) formats selection (PSO-102
model only) allow you to measure either RZ-DPSK or NRZ-DPSK
formats after a delay interferometer that is used to demodulate the
phase encoded data.
You can also select the balanced detection type for the two outputs
from the delay interferometer, with a manual delay on channel B to
make sure that the sampling occurs simultaneously on both channels.
This selection also applies to NRZ-DQPSK and RZ-DQPSK.
Note: In the case of the PSO-101, it is of course possible to look at a single-ended
detection of DPSK and DQPSK by measuring one output from the
demodulator, and then use the NRZ format for NRZ-DPSK (and
NRZ-DQPSK) and the RZ format for RZ-DPSK (and RZ-DQPSK).
To select a data format:
1. From the main window, select the Setup menu, then Sync Format.
2. From the list, select the desired format.
Optical Sampling Oscilloscope 39
Page 48

Setting up and Using the Optical Sampling Oscilloscope
Selecting the Channels (PSO-102 Only)
Selecting the Channels (PSO-102 Only)
You can view either channel A, B, or both in either the top or bottom
window. You can also set your Optical Sampling Oscilloscope to
automatically detect which channel is active and display it accordingly.
To select the channel to display:
1. From the main window, select the Setup menu, then View.
2. Select which channel configuration you want to view.
You can also display a balanced signal, A-B or B-A. It is almost
mandatory in DPSK and DQPSK receivers to perform balanced
detection. Here we can do the balanced detection in software and
visualize a balanced detected eye diagram with very high bandwidth.
40 PSO-100
Page 49
Setting up and Using the Optical Sampling Oscilloscope
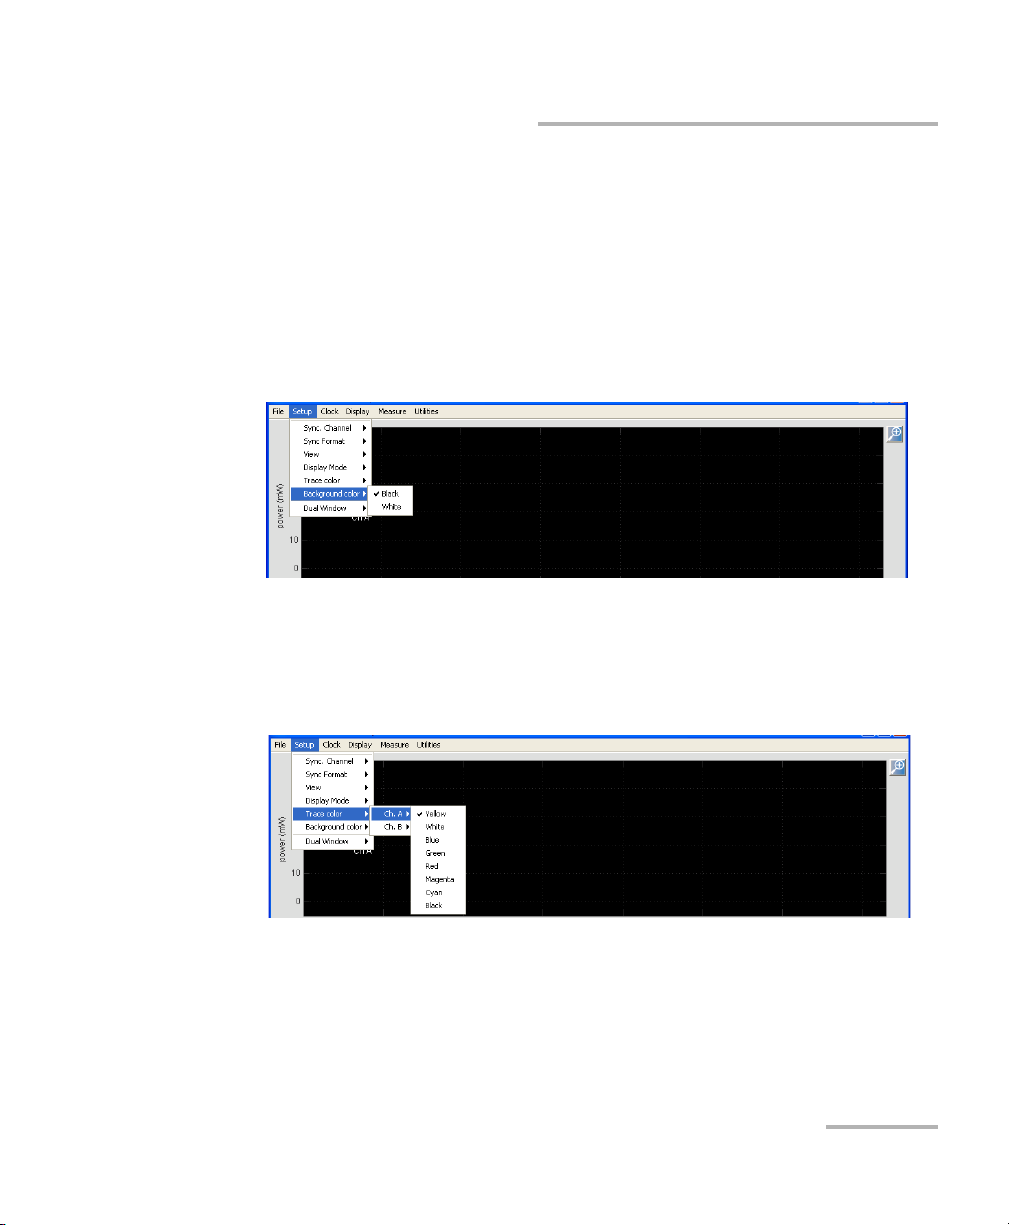
Selecting Trace and Background Colors
Selecting Trace and Background Colors
Depending on your work environment, you may find that some display
colors are better to view the samplings. You can change the background
color, and the sampling trace color for each viewing window.
To change the background color:
From the Setup menu, select Background Color, then select either black
or white.
To select a trace color:
1. From the Setup menu, select Trace Color.
2. Select the channel for which you want to change the color, then select
a color in the list.
Optical Sampling Oscilloscope 41
Page 50
Setting up and Using the Optical Sampling Oscilloscope
Using the Dual Window View
Using the Dual Window View
The dual window view allows you to open a second window to
simultaneously visualize the eye, the pattern, or the Freerun trace.
Note: The controls for the dual window display function exactly in the same way
as their single-window counterparts. For details on the features you can use
in the dual display, please see the corresponding section for single display.
42 PSO-100
Page 51
Setting up and Using the Optical Sampling Oscilloscope
Using the Dual Window View
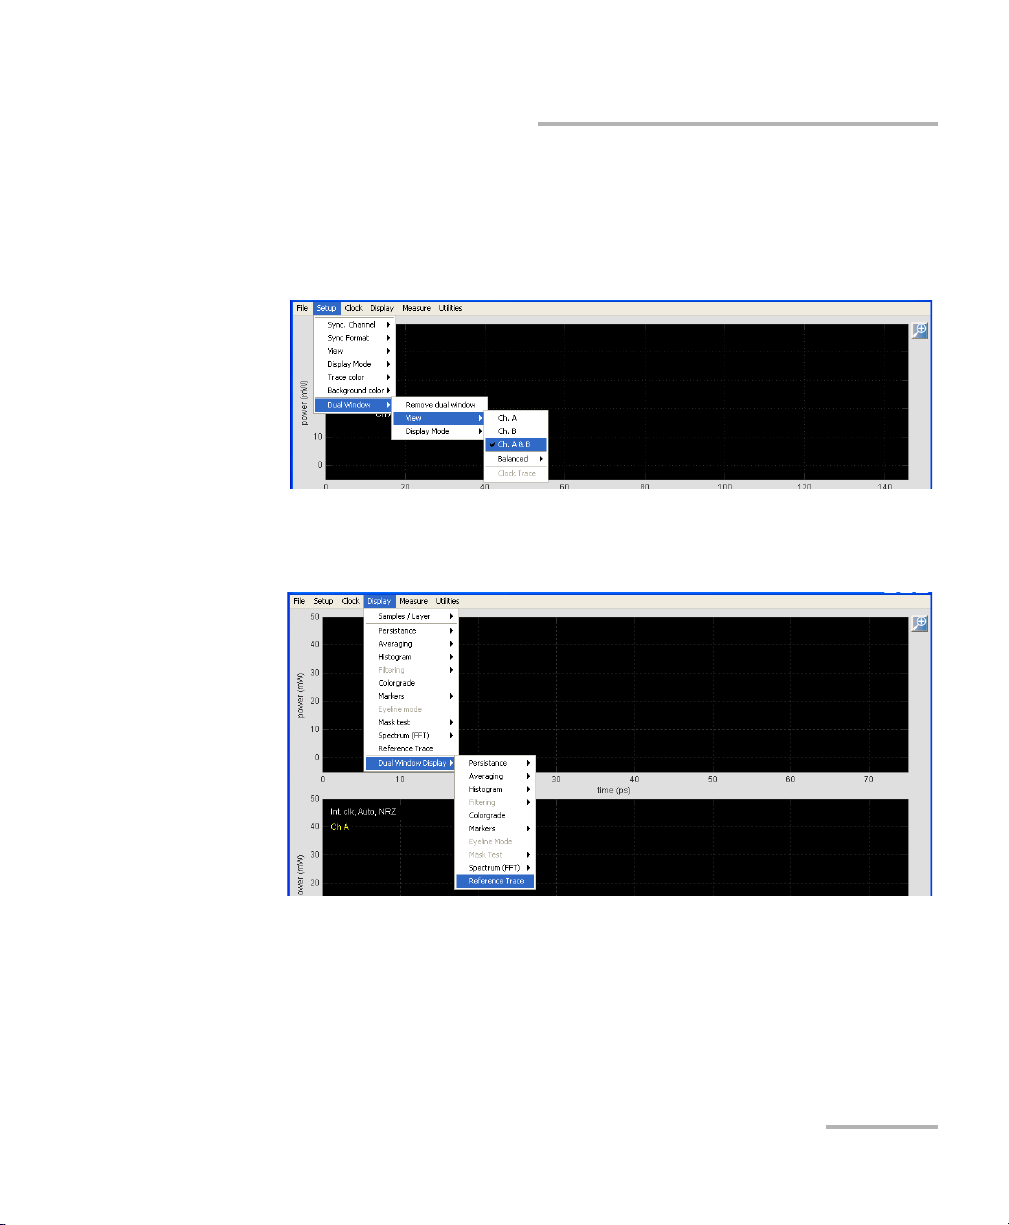
To select the dual view and its options:
1. From the main window, select the Setup menu, then Dual Window.
2. Select the channel to display in the window under View, and the type
of display (eye diagram or pattern) for it.
3. From the main window select the Display menu.
4. Select Dual window, then select which option you wish to view.
Optical Sampling Oscilloscope 43
Page 52

Setting up and Using the Optical Sampling Oscilloscope
Using the Clock Input
Using the Clock Input
In some situations, you cannot fully rely on the software synchronization of
the input signal alone, for example when sampling very noisy or distorted
signals, or when using unconventional data formats or setting up OTDM
data. In such situations, the external clock option is very useful.
You can work using different types of clocks for your testing.
³ Internal clock (default): the signal is software synchronized without an
external clock.
³ External clock (optional): the clock signal determines the time scale,
which should be synchronous with the signal.
The external clock is useful in a number of measurement situations
where the internal synchronization may fail, for example with very
noisy or distorted signals, unconventional modulation formats, and
sub-optimally multiplexed signals. In the external clock selection you
can select either an absolute or adaptive time scale, where the
absolute time scale is the standard selection and the adaptive is
recommended for an external clock with large timing jitter.
³ Gated clock (optional): for burst measurements, for example in
circulating loop- or packet- switching experiments, you can use the
gated clock mode. A window then opens where you can customize
parameters such as the burst period and duty cycle.
Note: The external clock option must be installed for the gated clock to be
available.
To activate the internal clock:
1. From the main window, select the Clock menu.
2. Select Internal.
44 PSO-100
Page 53
Setting up and Using the Optical Sampling Oscilloscope
Using the Clock Input
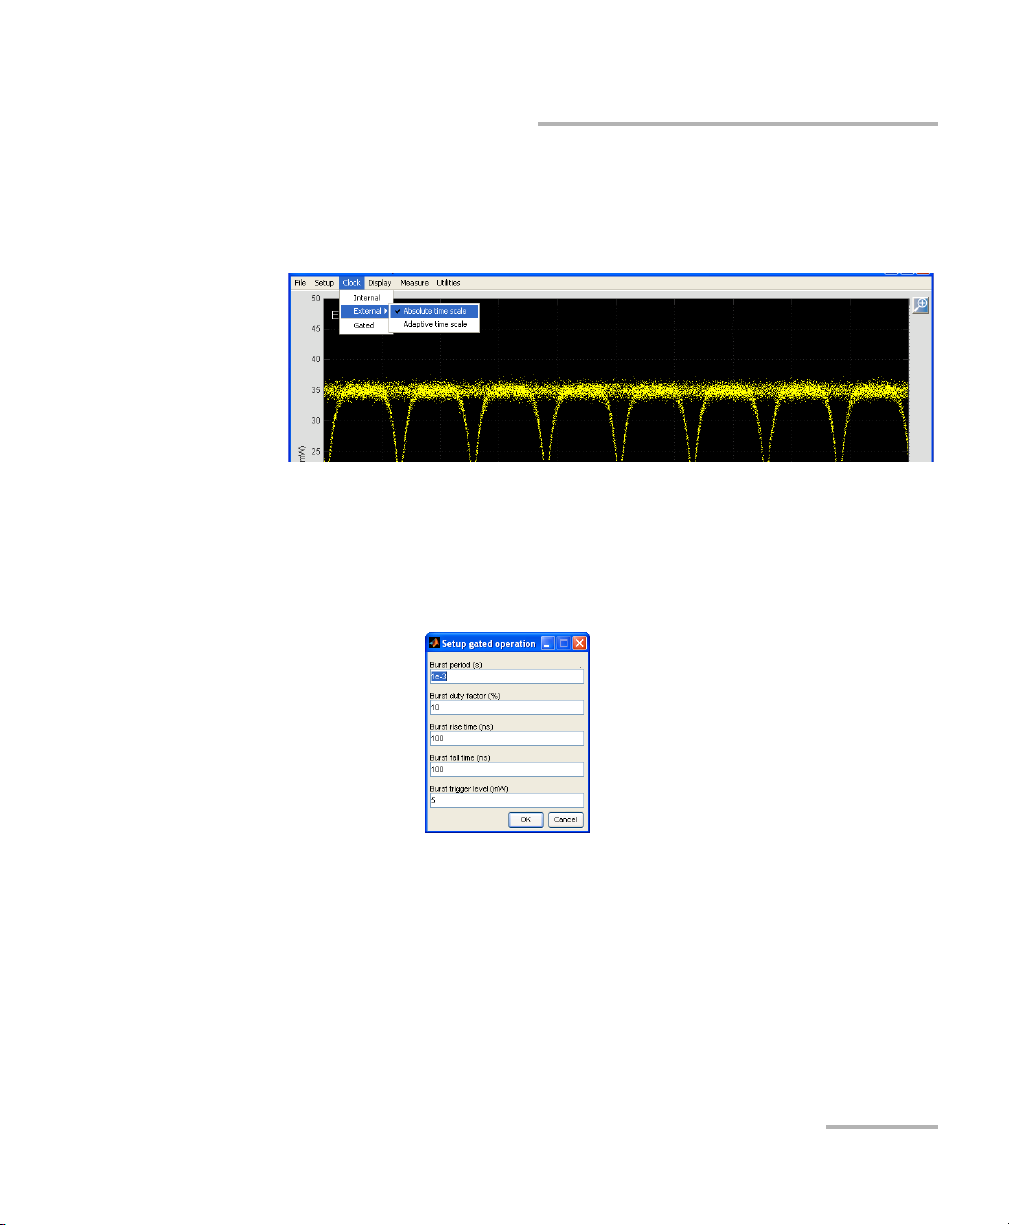
To activate the external clock:
1. From the main window, select the Clock menu.
2. Select External, then select either the absolute or adaptive time scale.
To activate the gated clock:
1. From the main window, select the Clock menu.
2. Select Gated.
3. Enter the settings for using the gated clock in the corresponding boxes.
4. Click OK to confirm your choice and close the window.
Optical Sampling Oscilloscope 45
Page 54

Setting up and Using the Optical Sampling Oscilloscope
Using the Clock Input
To use the external clock input:
1. Connect an external electrical clock to the front panel.
The clock should have a peak-to-peak voltage between 0.8 and 2 volts
for clock frequencies up to 12.5 GHz. It will work also for lower
voltages, but with a slightly worse timing jitter. For clock frequencies up
to 25 GHz, higher voltages are required, between 1.5 and 3 V.
2. Select External from the Clock menu (constant time scale is
recommended for a high quality clock with low timing jitter). The
figure below shows an example using a 10 GHz sub-rate clock and a
40 Gb/s NRZ data signal, that is a ¼ clock sub-rate.
The clock signal itself is shown above the data signal.
Note: If the clock signal on the sample screen turns red, this indicates that the
clock signal is too low, and should be increased; or it may happen in a
measurement situation with frequency holes. It goes away after a while
(read more about frequency holes in Frequency Holes on page 120).
46 PSO-100
Page 55

Setting up and Using the Optical Sampling Oscilloscope
Using the Clock Input
In this example, we have chosen to view two clock periods at 10 GHz,
which makes eight eyes at 40 Gb/s. You can also view patterns in external
clock mode, just switch to Pattern. Again, make sure that the pattern
length, the signal frequency, and also the sub-rate clock are correct. By
clicking the right button and select Signal/clock delay, you can introduce a
delay between the data and the clock, which is useful for centering eye
diagrams on the screen and perform measurements on a specific eye
diagram, since all measurements are performed on the first eye diagram as
shown in Eye Mode Measurement Example on page 73.
To display the clock trace on-screen:
1. From the main window, select the Setup menu, then View.
2. Select Clock trace.
To introduce a time delay between the data and the external
clock:
Right-click when in the main window, then select Signal/Clock delay.
Optical Sampling Oscilloscope 47
Page 56
Setting up and Using the Optical Sampling Oscilloscope
Selecting the Number of Samples per Layer of Display
Selecting the Number of Samples per Layer of
Display
You can choose to have more or less samples per layer of display. More
samples will make a more precise measurement, but it takes longer to
achieve. The refresh rate will change depending on the number of samples
selected.
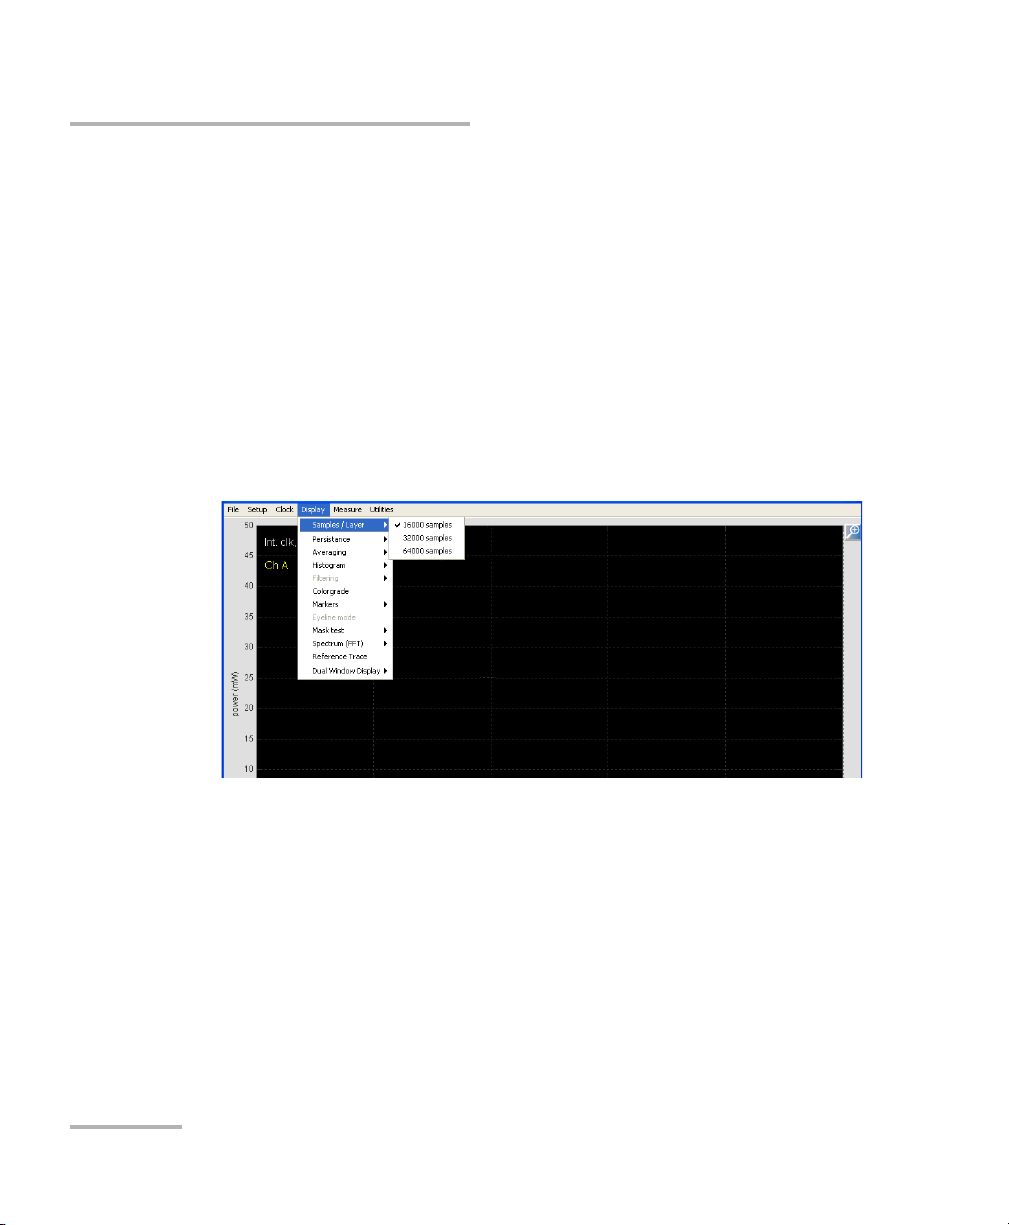
To select the number of samples:
1. From the main window, select the Display menu, then Samples /
Layer.
2. Select the number of samples to use.
48 PSO-100
Page 57
Setting up and Using the Optical Sampling Oscilloscope
Changing the Persistence Time
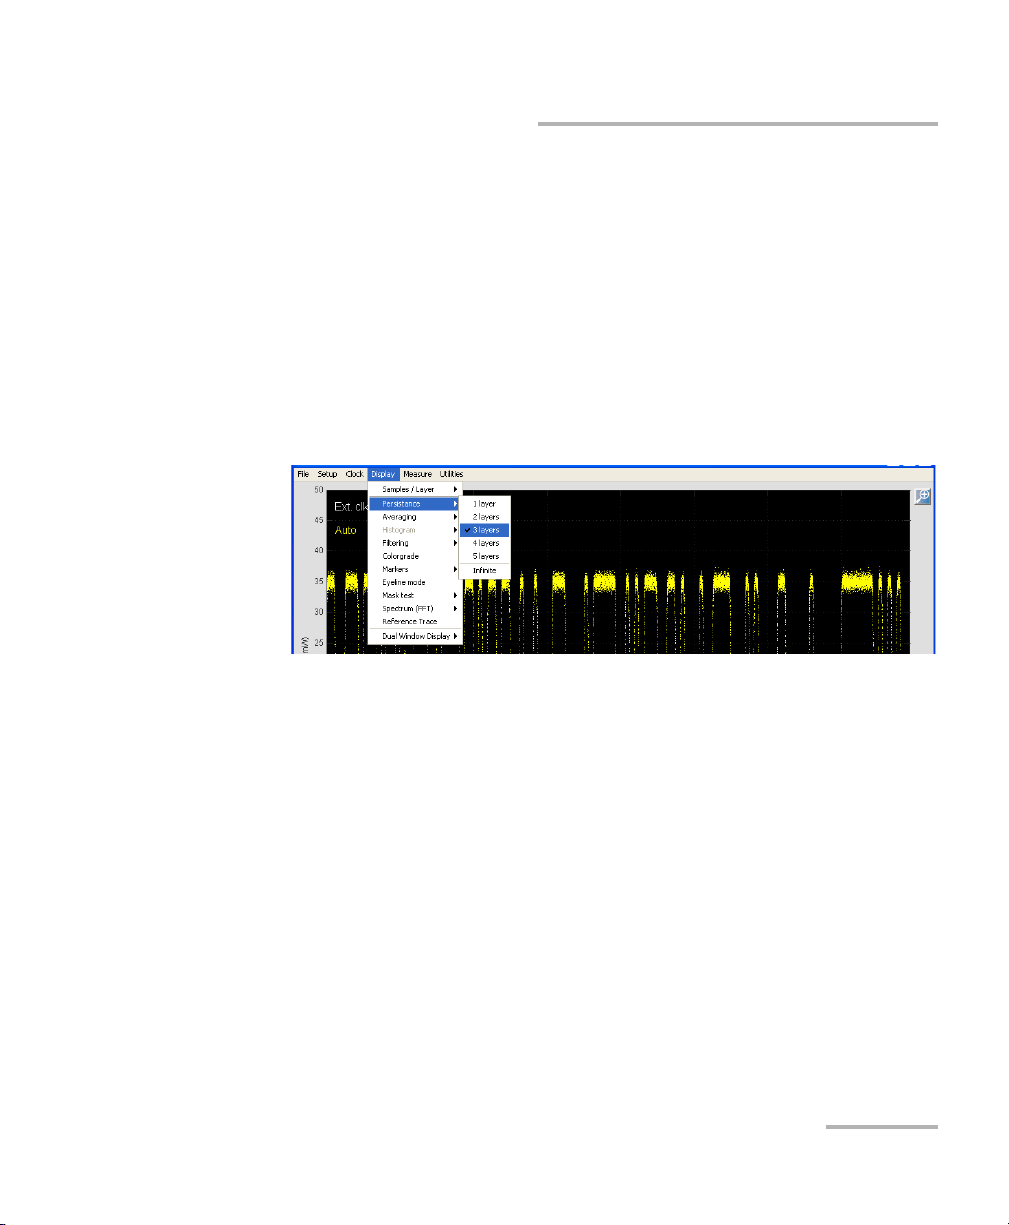
Changing the Persistence Time
In the Display menu you can change the persistence time by choosing a
number of layers and the number of samples per layer. In this way you can
determine the total number of samples on the screen. Since the
persistence time depends on the speed of the host computer, this allows
for a selection better adapted for each user.
To change the persistence time:
1. From the main window, select the Display menu.
2. Select Persistence, then select the number of layers to use.
Optical Sampling Oscilloscope 49
Page 58

Setting up and Using the Optical Sampling Oscilloscope
Changing the Averaging Value
Changing the Averaging Value
The averaging value is where noise can be averaged out from a waveform,
pulse or pattern. The number of averages can be between 1 and 64, and
infinite.
In the figure below, the 127-bit pattern is averaged and the noise is
removed. Note that this works for patterns, pulses and waveforms, not
eye-diagrams, since it does not represent a continuous curve. The number
of averages can be set from 1 to 64 and infinite.
The averaging function uses the pixel information to calculate the average.
This means that a higher resolution in pixels/ps is achieved in a zoomed
window compared to the default window.
50 PSO-100
Page 59

Setting up and Using the Optical Sampling Oscilloscope
Changing the Averaging Value
To change the averaging value:
1. From the main window, select the Display menu.
2. Select Averaging, then select the number of averages to use.
To average from the beginning:
From the main window, click Clear.
Optical Sampling Oscilloscope 51
Page 60

Setting up and Using the Optical Sampling Oscilloscope
10*log10mean2std2⁄()=()
Displaying Histograms
Displaying Histograms
You can view either a horizontal or a vertical histogram of the data to help
you better see the distributions in the time or power direction. For
example, you can select a vertical histogram to measure the SNR, or a
horizontal histogram to measure the RMS timing jitter.
In the figure below, we have selected a vertical histogram, and selected a
window using the mouse. A red square shows the histogram window. The
histogram is shown to the left and the mean, the standard deviation, the
SNR values, and the number of histogram hits are
shown in the measurement box at the bottom of the application.
52 PSO-100
Page 61

Setting up and Using the Optical Sampling Oscilloscope
Displaying Histograms
In the figure below, we have instead selected a horizontal histogram at a
rising slope in the pattern. The histogram is shown at the bottom of the
sample screen. The mean time in the histogram window, the standard
deviation, and the number of histogram hits are shown under Histogram
results.
Optical Sampling Oscilloscope 53
Page 62

Setting up and Using the Optical Sampling Oscilloscope
Displaying Histograms
To display a histogram of the data:
1. From the main window, select the Display menu, then Histogram.
2. Select the type of histogram to view (horizontal or vertical).
3. Select a histogram window using the mouse by clicking-dragging the
mouse cursor to select the desired area.
Note: You can clear the histogram by clicking the Clear button at the bottom of
the application.
If you want to select a new histogram window, first deselect the present
window in the histogram menu.
54 PSO-100
Page 63

Setting up and Using the Optical Sampling Oscilloscope
Managing Filters
Managing Filters
Software defined filters can be applied to emulate a measurement
situation with lower bandwidth, or to obtain filter characteristics that are
theoretically perfect instead of hardware filters that change with time and
from unit to unit. On the Optical Sampling Oscilloscope, you can use the
following filters:
³ Bessel
³ Butterworth
³ Chebychev
You can set the order of the filter, and customize a bandwith over which
the filter is applied.
Note: The Chebychev filter is of Type 1, with a 1-dB ripple in the passband.
Note: You must be in pattern mode and use a repetitive sequence to use filters.
To add a filter to the sampling:
1. From the main window, select the Display menu, then Filtering.
2. Select the type of filter to apply. You can select only one type at a time.
Optical Sampling Oscilloscope 55
Page 64

Setting up and Using the Optical Sampling Oscilloscope
Managing Filters
To set the order for the filter:
1. From the main window, select the Display menu, then Filtering.
2. Under Filter order, select the rank for your filter.
To set the bandwidth for the filter:
1. From the main window, select the Display menu, then Filtering.
2. Select Filter bandwidth.
3. Enter a value in GHz for the bandwidth.
4. Click OK to confirm your choice.
56 PSO-100
Page 65
Setting up and Using the Optical Sampling Oscilloscope
Managing Filters
The figure below shows an example of a filtered 127-bit, 40 Gb/s, NRZ
signal with a 40 GHz, 5
th
order Butterworth filter.
Optical Sampling Oscilloscope 57
Page 66

Setting up and Using the Optical Sampling Oscilloscope
Using Colorgrade
Using Colorgrade
Colorgrading the sampling can let you see which parts of the graph are
displayed more often and which are displayed less often. The more often
the parts are displayed, the brighter the corresponding color will be. The
longer you let the sampling run, the more data is accumulated and the
more precise the results.
The color grade function uses the pixel information to calculate the 2-D
histogram. This means that a higher resolution in pixels/ps is achieved in a
zoomed window compared to the default window.
In the figure below you can see colorgrade in eye-mode.
To activate the color grade mode:
In the Display menu, select Colorgrade.
To restart the color grade accumulation:
Click Clear.
58 PSO-100
Page 67
Setting up and Using the Optical Sampling Oscilloscope
Using Markers
Markers are quick and easy ways to take precise measurements.
To place markers:
1. Make sure that the sampling is running.
2. Right-click on the sample screen, then select Marker 1.
3. Click on the location where you want to put the marker.
4. Repeat steps 2 and 3 for the other marker.
Note: You can also select the markers from the Display menu.
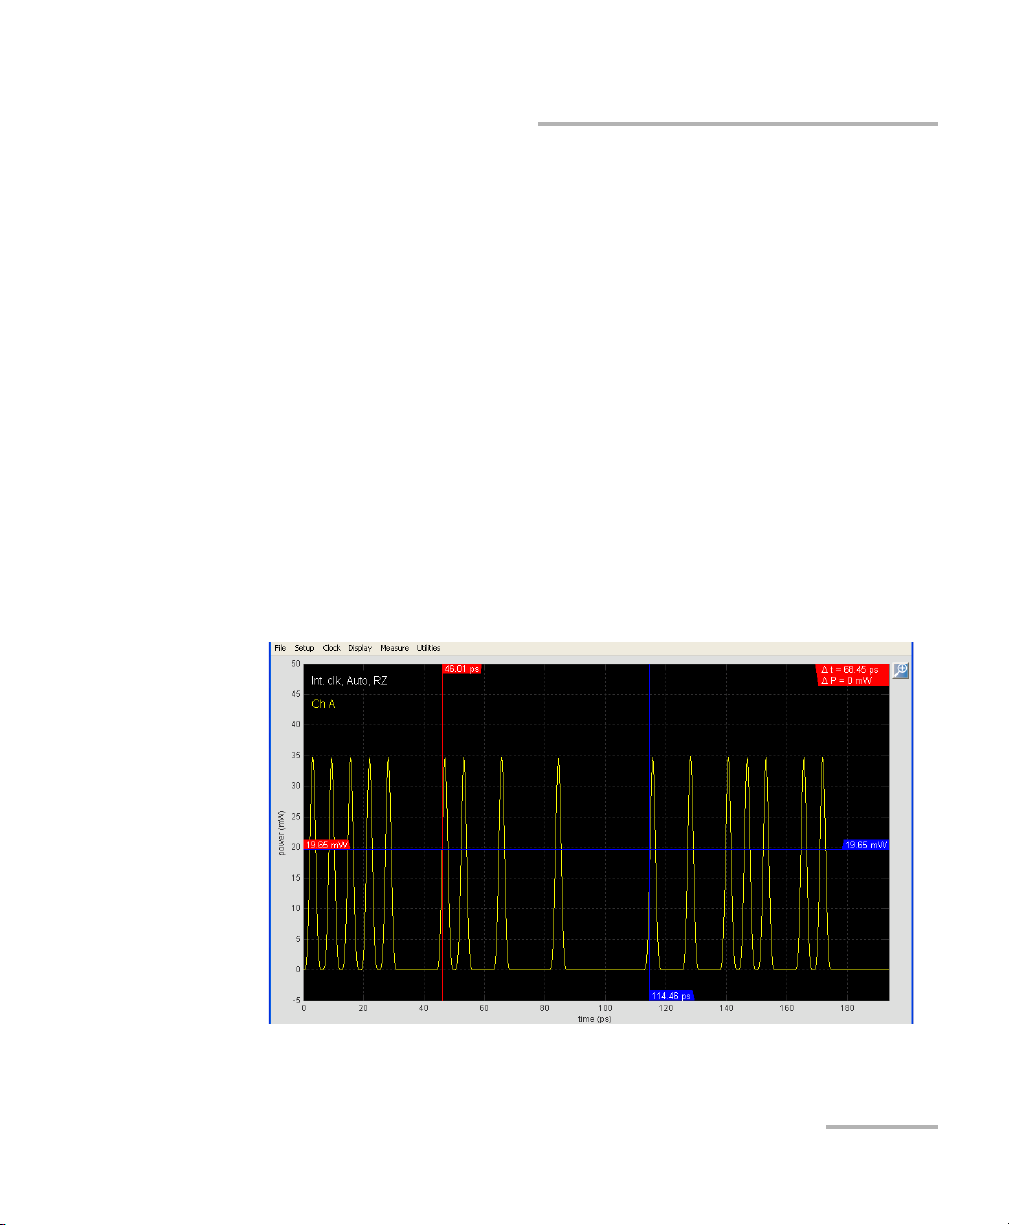
The figure below shows an example where we have placed two markers in
a 160 Gb/s pattern to measure the spacing between two slopes. The
difference in time and power is shown at the top right corner of the sample
screen. The red and blue indicators will give you the power and time
values for each marker.
Using Markers
Optical Sampling Oscilloscope 59
Page 68

Setting up and Using the Optical Sampling Oscilloscope
Using Markers
To move markers:
When the appropriate marker is selected, click on the screen where you
want to put it.
To switch between the markers:
Right-click on the screen and select Toggle marker.
OR
Select the Display menu, then Markers.
To remove the markers:
Right-click on the screen, then click on the marker to remove the check
mark.
OR
Select the Display menu, then Markers to select the marker and remove
the check mark.
60 PSO-100
Page 69
Setting up and Using the Optical Sampling Oscilloscope
Using the Eyeline Mode
Using the Eyeline Mode
The eyeline mode is mainly used for noise reduction in eye diagrams.
When a periodic pattern is sampled it is possible to average over several
patterns in a similar way as in normal averaging mode. An eyeline trace is
obtained when the averaged pattern is folded back into an eye diagram. In
order to produce a full eyeline trace several samples must be recorded
from all bits in the pattern. Hence, the longer the pattern the more time it
will take to acquire all samples.
To use the eyeline mode:
1. Select the pattern view mode using the button at the bottom of the
screen.
Optical Sampling Oscilloscope 61
Page 70
Setting up and Using the Optical Sampling Oscilloscope
Using the Eyeline Mode
2. In the Display menu, select Eyeline mode.
The figure below shows an eyeline trace from a normal 40 Gb/s, NRZ 127,
bit pattern. Before the eyeline trace appears all bins (separated with 1 ps)
must be filled with at least one sample. During this process, the maximum
number of samples in any bin, the average number of samples per bin, and
the minimum number of samples in any bin are shown in the sample
window. This will be noticed first when the pattern is relatively long.
62 PSO-100
Page 71

Setting up and Using the Optical Sampling Oscilloscope
Using Masks
Using Masks
Mask testing is a procedure commonly used to verify that a transmitter
complies with certain standards. The test is done in an eye diagram, where
masks are placed in three regions: in the center of the eye, above the logic
one, and below the logic zero level. Samples in these regions are
unacceptable and referred to as mask hits or mask violations.
You can also activate a mask margin, which is slightly larger (a certain
percentage) than the original mask to see the tolerance area within the eye
diagram.
You can see at the bottom of the application the results from the mask test,
including the total number of samples, the number of hits in the mask and
in the margin, etc.
The mask is only placed in one eye period, so if for example four eyes
periods are shown in the application, it will take longer time to acquire a
certain number of samples in the mask test. Therefore, EXFO recommends
to visualize one eye period.
Optical Sampling Oscilloscope 63
Page 72
Setting up and Using the Optical Sampling Oscilloscope
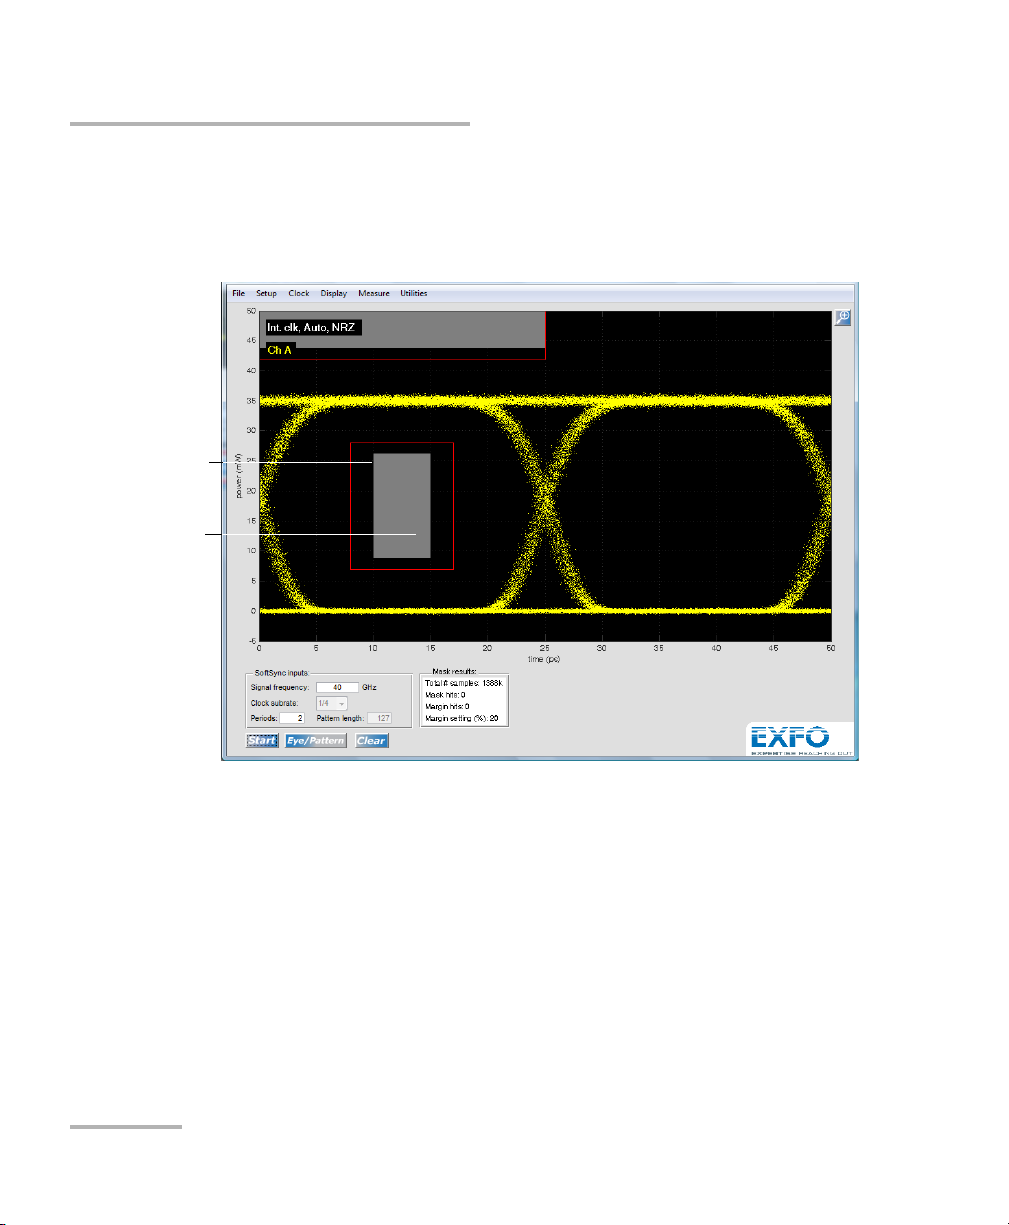
Mask
Margin
Using Masks
The figure below shows the result from a mask test on 40 Gb/s NRZ data.
The mask that is centered to the eye diagram is a standard square shaped
mask with a height of 50 % of the eye amplitude (P
of 20 % of the eye period.
one-Pzero
), and a width
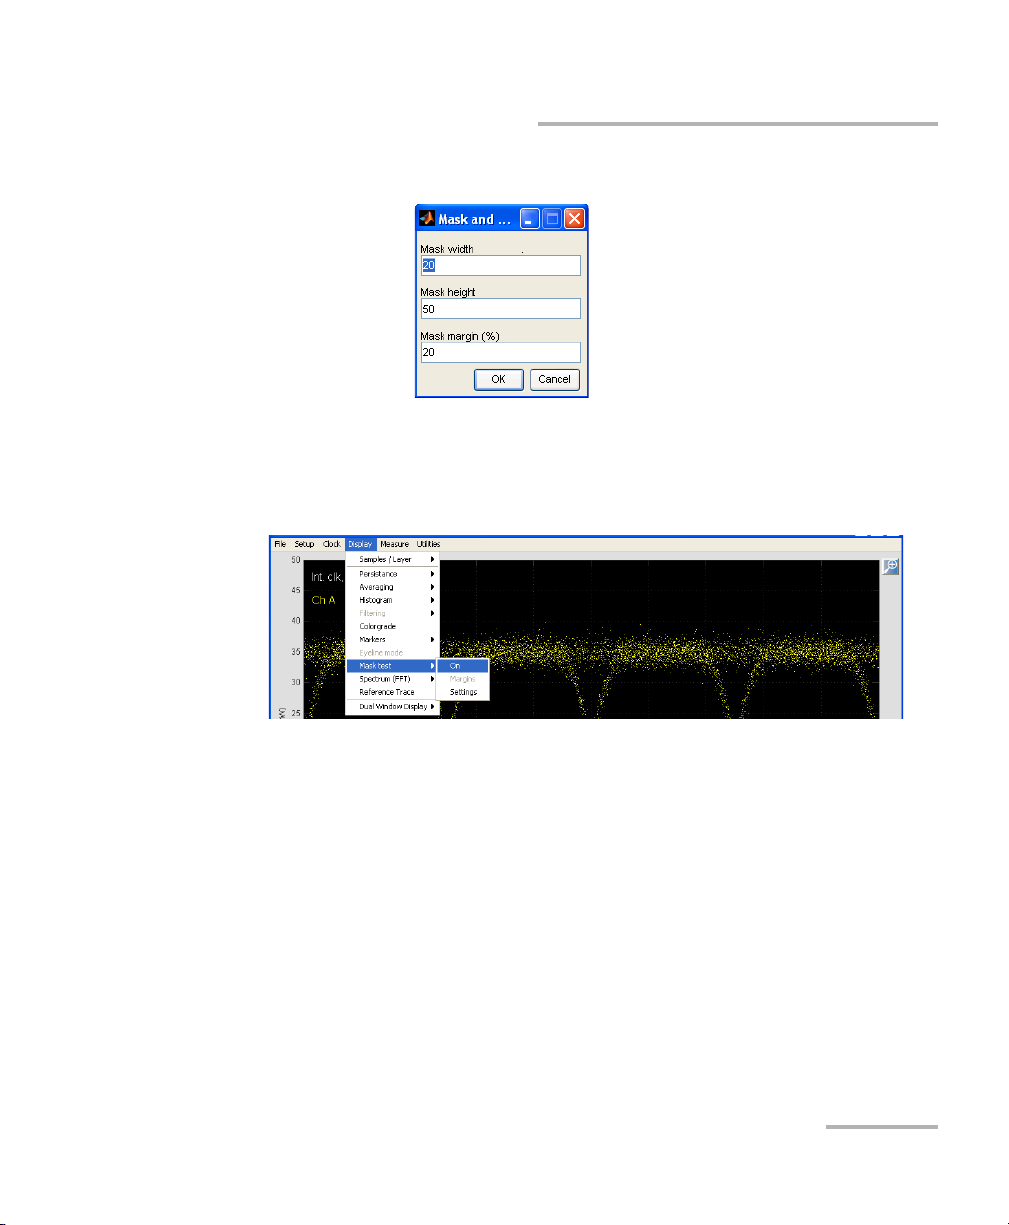
To set up the mask parameters:
1. From the main window, select the Display menu.
2. Select Mask test, then Settings.
64 PSO-100
Page 73
Setting up and Using the Optical Sampling Oscilloscope
Using Masks
3. Enter values for the width, the height and the margin value of the mask.
4. Click OK to close the window.
To activate the mask testing option:
From the main window, select the Display menu, then Mask test and On.
The mask is automatically aligned and shown as grey areas that appear in
the eye diagram.
To view the margins of the mask:
When the mask mode is activated, go in the Display menu, then select
Mask test and Margins.
The margin will appear as a red outline arount the mask.
Optical Sampling Oscilloscope 65
Page 74

Setting up and Using the Optical Sampling Oscilloscope
Displaying the FFT Spectrum of a Sampled Signal
Displaying the FFT Spectrum of a Sampled
Signal
Your Optical Sampling Oscilloscope can be used as an FFT spectrum
viewer as well.
To look at the spectral content of a signal is useful in many situations. For
example, you might want to see the bandwidth of the signal, or look at
specific frequency harmonics that you want to maximize or minimize.
You can choose between two spectrum types:
³ Batch: The FFT of each batch is taken separately.
³ Averaged: Several batches are taken together to accumulate an
averaged FFT.
To display an FFT spectrum:
1. From the main window, select the Display menu, then Spectrum
(FFT).
2. Select which type of spectrum to view.
66 PSO-100
Page 75

Setting up and Using the Optical Sampling Oscilloscope
Displaying the FFT Spectrum of a Sampled Signal
3. Start the sampling session.
Here is an example of a spectrum of an NRZ 40Gb/s signal. You can see the
characteristic dips in the spectrum at 40 GHz, 80 GHz, and so forth.
Optical Sampling Oscilloscope 67
Page 76

Setting up and Using the Optical Sampling Oscilloscope
Displaying a Reference Trace for your Measurements
Displaying a Reference Trace for your
Measurements
You can display a reference trace for your sampling to better see how your
sampling relates to the desired result. The reference trace will appear in
white on the display as you activate the sampling.
To display the reference trace:
From the main window, select the Display menu, then Reference Trace.
To save the reference trace and display it on-screen for the
current session:
While the reference trace is activated, select the File menu, then Save
data > Save setup > Bottom, then select the reference trace.
The reference trace appears in the background of the window in white.
68 PSO-100
Page 77

Setting up and Using the Optical Sampling Oscilloscope
Managing Measurement Parameters
Managing Measurement Parameters
In the Measurement menu you can select one or more parameters to
measure from an eye diagram, pattern or waveform.
You can display up to three measured parameters simultaneously in the
sample screen. When a fourth parameter is selected, the first one is
automatically deselected. The indicators on-screen always pertain to the
most recent measurement type you have selected.
The measurements are based on a number of histograms, so the longer
time you wait, the more accurate the parameters will become. As long as
at least one parameter is selected, all histograms are accumulated and all
parameters are measured even though not shown. By removing all
measurements, the histograms are cleared.
If you want to clear the histograms without removing the measurements,
use the Clear button in the main window.
Optical Sampling Oscilloscope 69
Page 78

Setting up and Using the Optical Sampling Oscilloscope
Managing Measurement Parameters
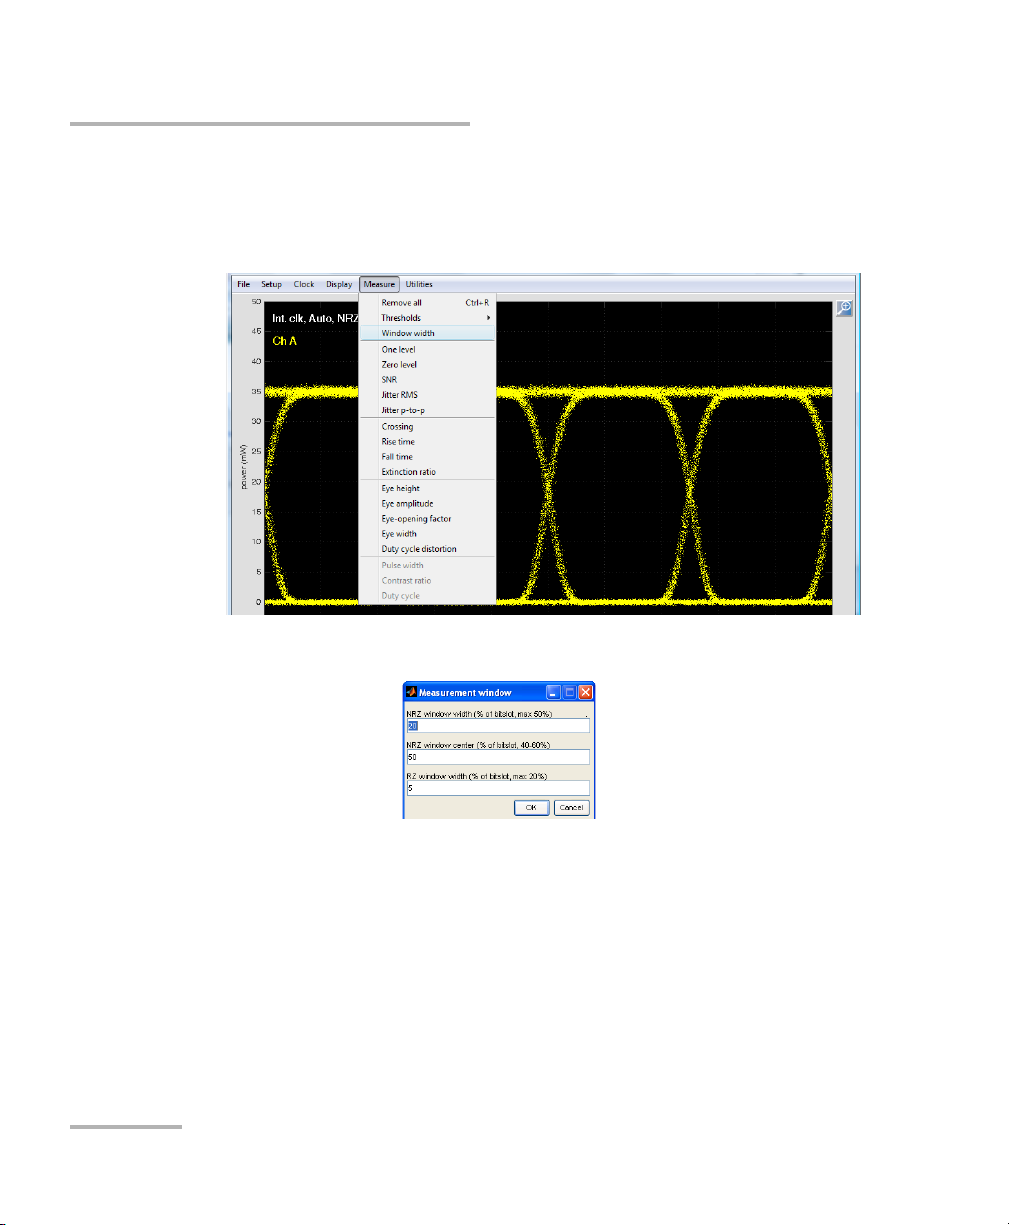
To select a measurement type:
From the main window, select the Measure menu, then the measurement
type you want.
Note: For more details, see Measurement Definitions on page 109.
70 PSO-100
Page 79

Setting up and Using the Optical Sampling Oscilloscope
Managing Measurement Parameters
To set the thresholds for rise and fall times:
1. From the main window, select the Measure menu.
2. Select Thresholds, then the desired value (10-90 % or 20-80 %).
Optical Sampling Oscilloscope 71
Page 80
Setting up and Using the Optical Sampling Oscilloscope
Managing Measurement Parameters
To set the histogram window width for NRZ and RZ formats:
1. From the main window, select the Measure menu.
2. Select Window width.
3. Enter the desired values for the window.
Note: In the case of short RZ pulses with a low duty cycle, you must decrease the
RZ window width to a small value. For example, if the duty cycle is only
10%, EXFO recommends that the window width is set to 1 %; if the duty
cycle is only 1 %, the window width should be set to 0.1%.
4. Click OK to close the window.
To remove all measurements from the window:
From the main window, select the Measure menu, then Remove all.
72 PSO-100
Page 81

Setting up and Using the Optical Sampling Oscilloscope
Managing Measurement Parameters
Eye Mode Measurement Example
In the figure below, we have selected to show the measures of fall time,
crossing and extinction ratio, which are shown under Measurement
results at the bottom of the application. Markers associated with the
parameter that was chosen last (here the 3rd in the list - the ER) indicate
where the measurement was taken and what were the one and zero levels
from which the ER was calculated.
Note: You can also use the dual window function in the display menu to view
both the eye and pattern simultaneously.
Optical Sampling Oscilloscope 73
Page 82
Setting up and Using the Optical Sampling Oscilloscope
Managing Measurement Parameters
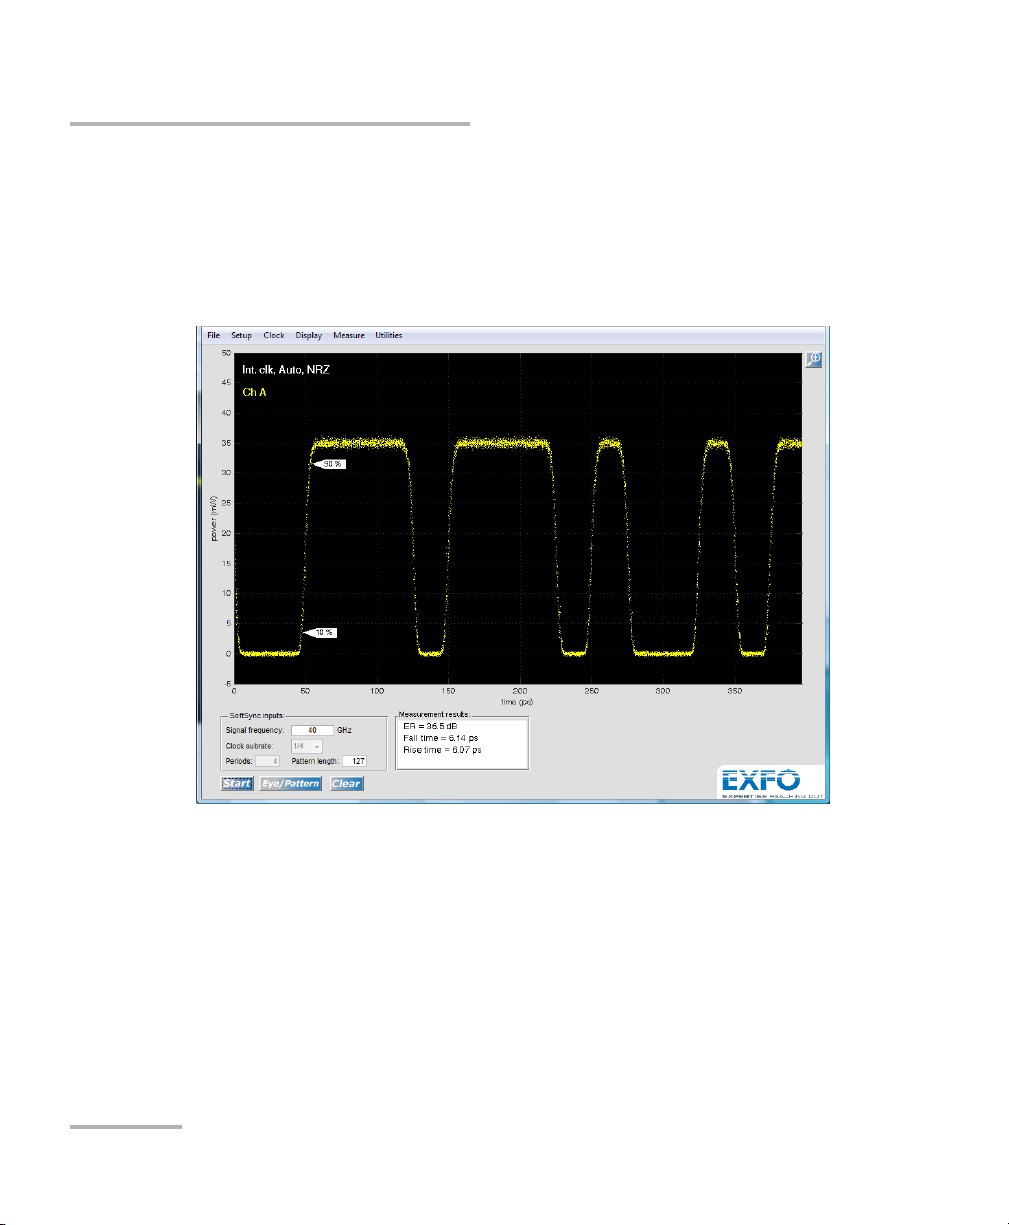
Pattern Measurement Example
Instead of an eye diagram you can choose to visualize the pattern
procedure. Switch from Eye to Pattern at the bottom left. The figure below
shows a part of a 127 bit, 40 Gb/s, NRZ pattern with measurements of ER,
fall time and rise time..
74 PSO-100
Page 83
Setting up and Using the Optical Sampling Oscilloscope
Managing Synchronization
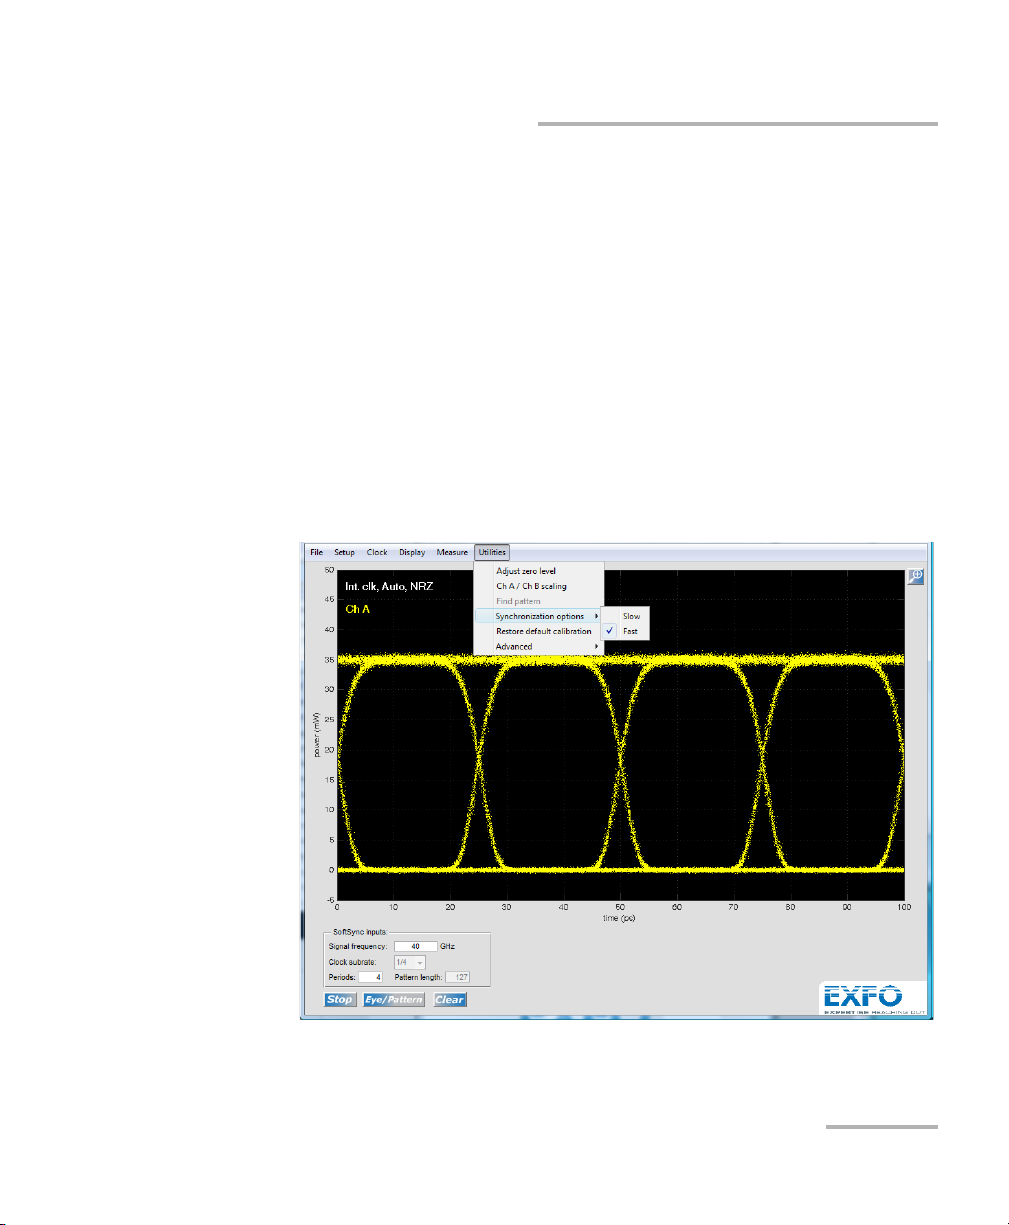
Managing Synchronization
There are two synchronization methods used for measurements:
³ The fast sync, which implies that only a fine-tuning is done from the
last measurement. This is the default method.
³ If the fast sync is switched off, the software performs a coarse sync
every time, which takes more time, but is convenient when tuning the
signal frequency continuously during the measurement, for example
when optimizing the signal frequency of a ring laser.
To activate the fast sync option:
1. From the main window, select the Utilities menu.
2. Select Synchronization options.
3. Specify whether you want fast or slow sync.
Optical Sampling Oscilloscope 75
Page 84
Setting up and Using the Optical Sampling Oscilloscope
Setting the Data Phase Tracking Algorithm
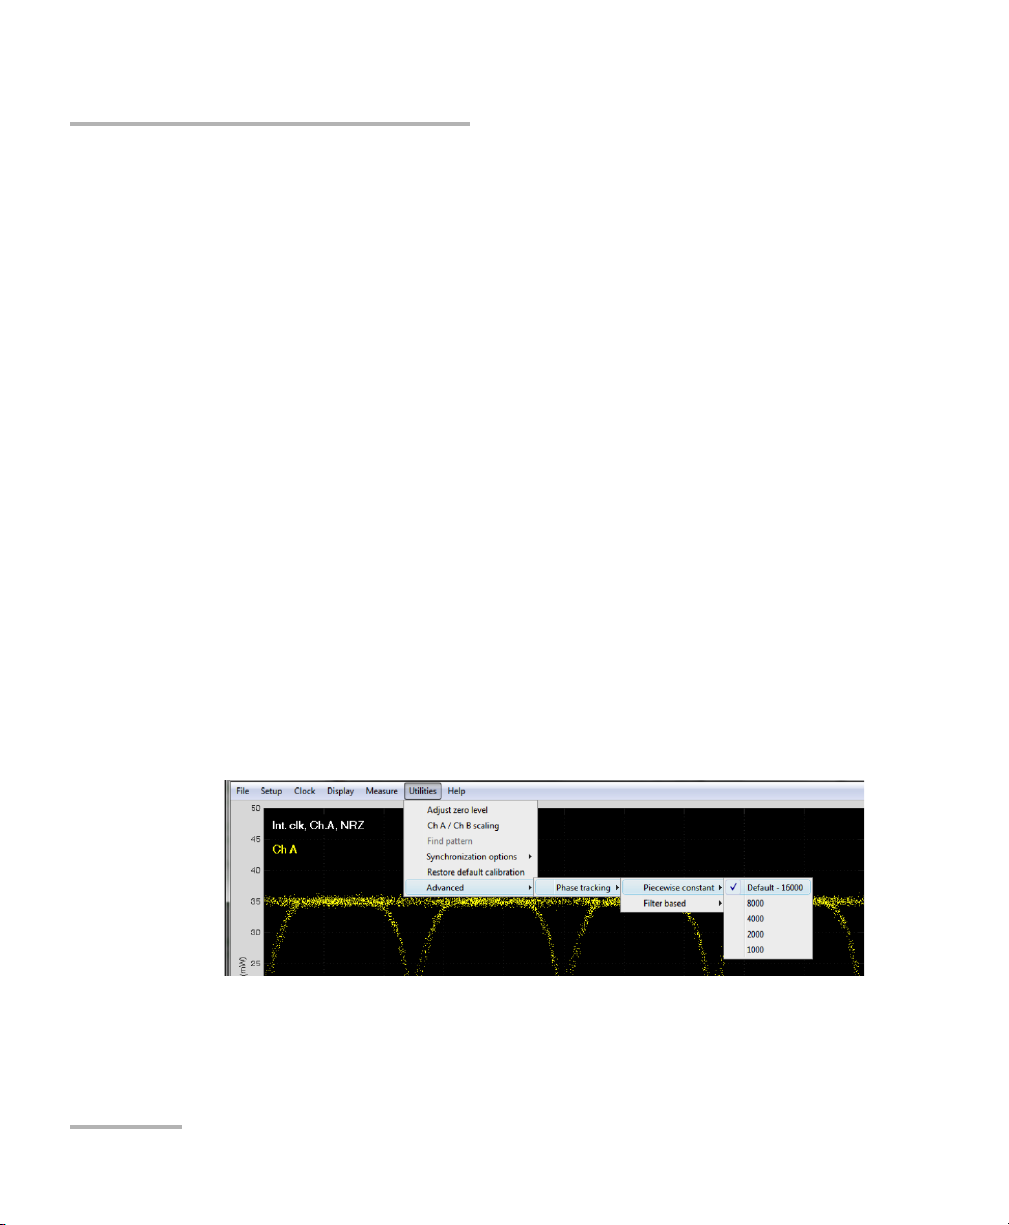
Setting the Data Phase Tracking Algorithm
Data phase noise lead to timing jitter. To counter this, you can optimize the
phase tracking algorithm settings. There are two different algorithms; piece
wise constant, or filter-based. In the piece wise constant setting, you can
shorten the batch length from the default value of 16000 to a smaller value.
This will divide the whole batch into smaller subbatches, and since the
synchronization is performed on each of the batches, the data phase is
tracked in a faster manner.
For high performance signal generators, there is usually no need to reduce
the batch length at all. For line card transmitters however, there is
sometimes needed to reduce the batch length. Use the highest batch
length possible, since a short batch length normally leads to larger
problems with frequency holes.
In some cases, there may be even more phase noise and the algorithm
must be faster. If the eye diagram looks jittery even with a batch length of
1000, EXFO recommends to select the filter-based phase tracking
algorithm.
To set the phase tracking value:
1. From the main window, select the Utilities menu, then Advanced >
Phase tracking.
2. Under Piecewise constant, select the value you want to use.
The rate is updated automatically.
76 PSO-100
Page 85
Setting up and Using the Optical Sampling Oscilloscope
Filter-Based Phase Tracking
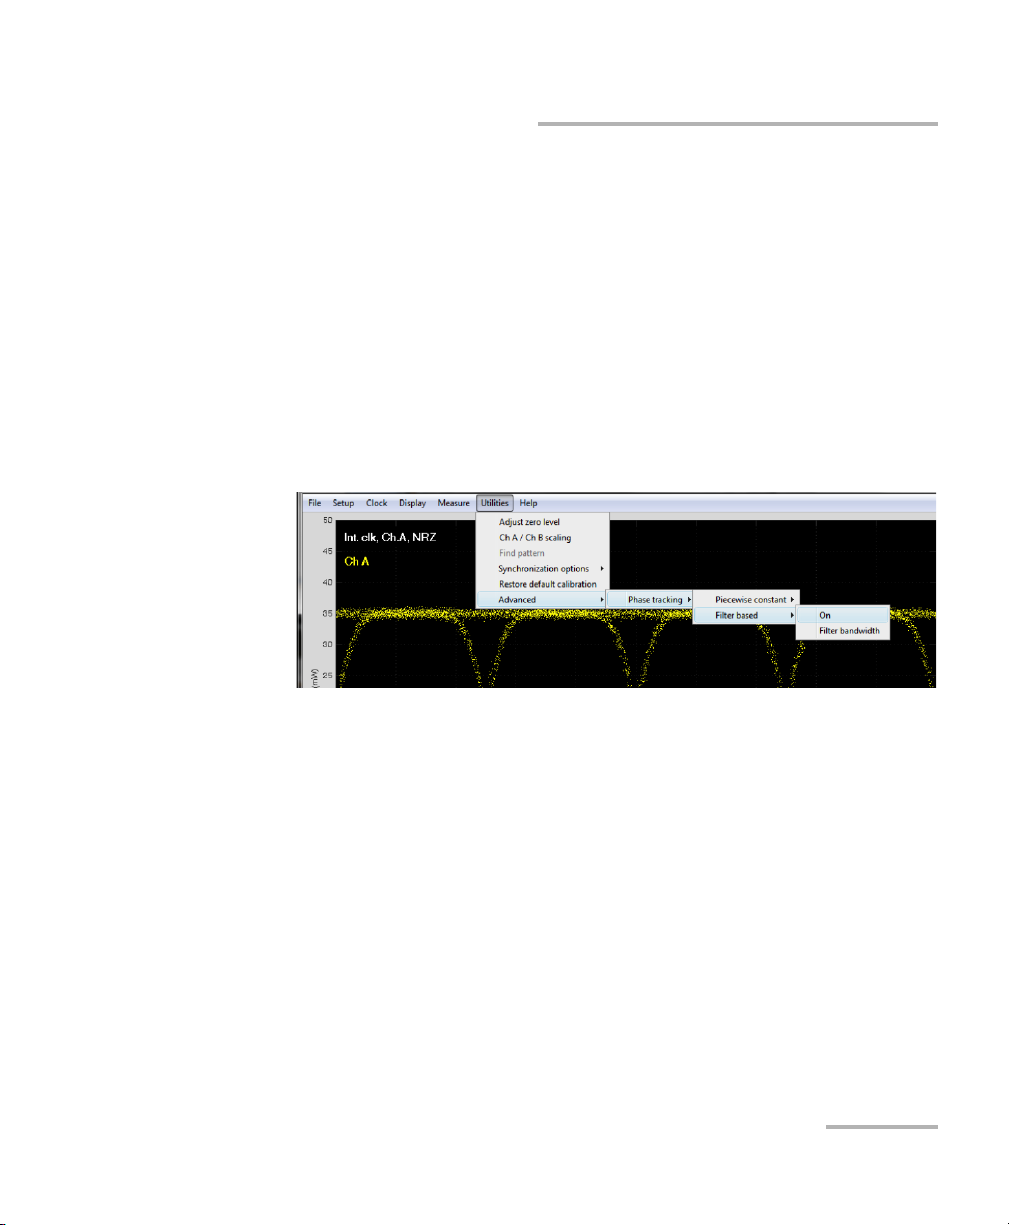
Filter-Based Phase Tracking
If the piecewise constant algorithm cannot handle the timing jitter, and a
faster algorithm is required in order to track the phase, use the Filter based
phase tracking algorithm. It is typically needed in some transponder line
cards with relatively large phase noise.
You can set a software-defined filter bandwidth, which corresponds to a
hardware clock recovery circuit with the same bandwidth.
To activate the filter-based phase tracking:
1. From the main window, select the Utilities menu, then Advanced >
Phase tracking.
2. Select Filter based, then On.
Optical Sampling Oscilloscope 77
Page 86
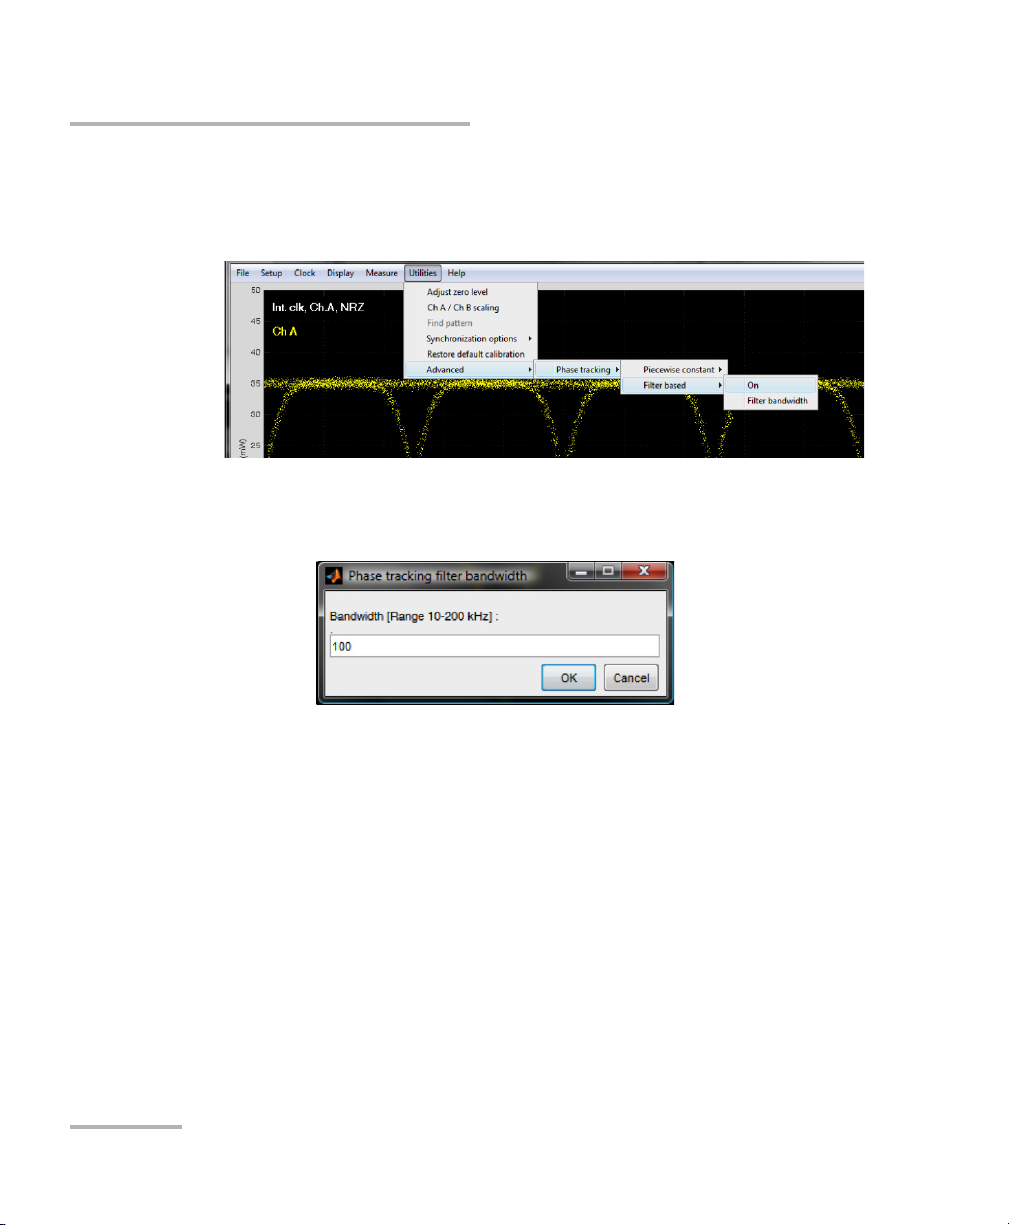
Setting up and Using the Optical Sampling Oscilloscope
Filter-Based Phase Tracking
To set the filter bandwidth:
1. From the main window, select the Utilities menu, then Advanced >
Phase tracking.
2. In Filter based, select Filter bandwidth.
3. Enter the bandwidth value to use, in kHz.
4. Click OK to validate your choice.
78 PSO-100
Page 87
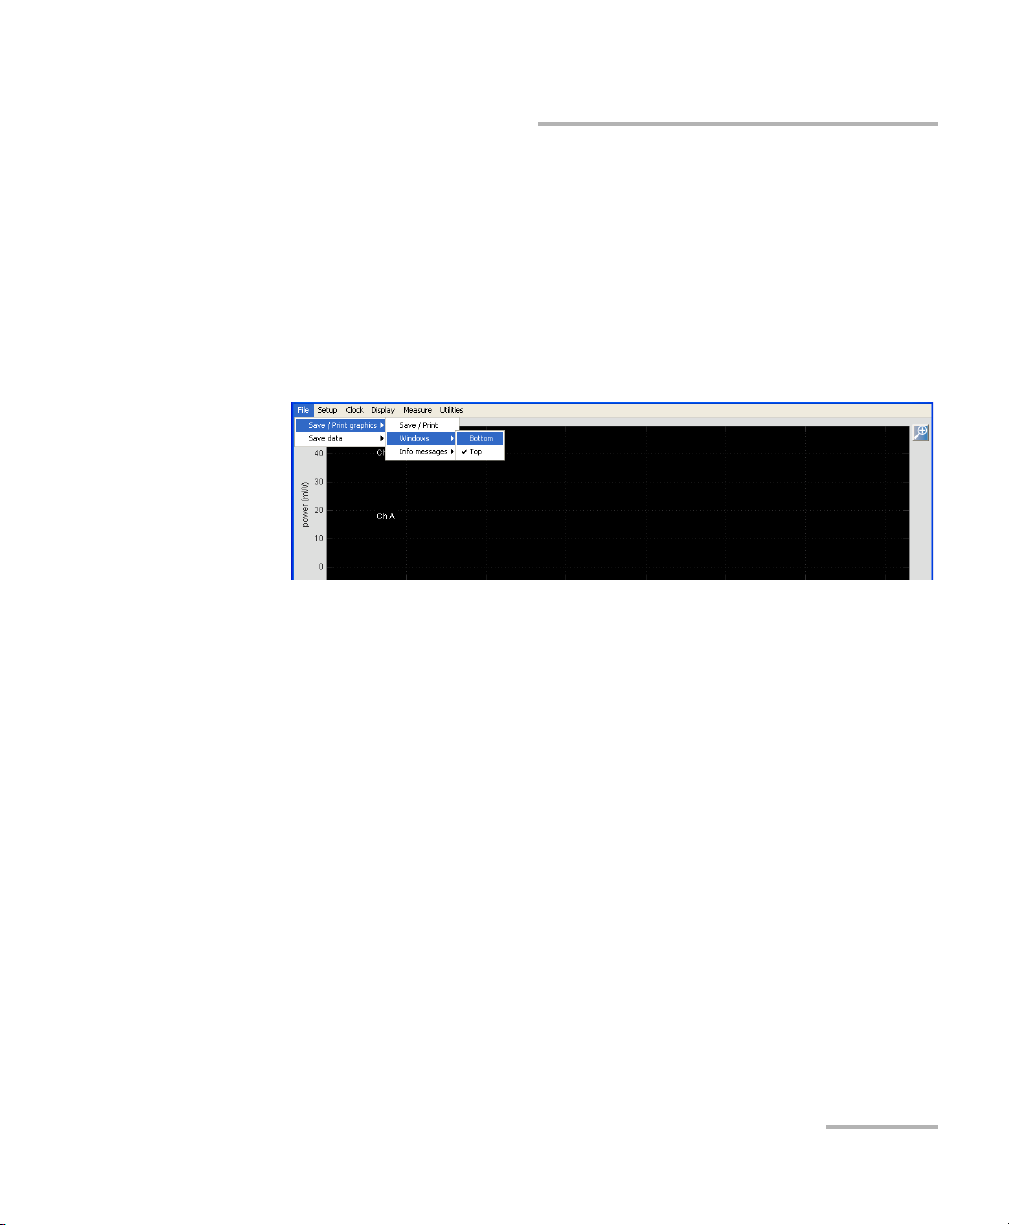
Setting up and Using the Optical Sampling Oscilloscope
Saving Sample Files
Saving Sample Files
You can save the samples on the screen in a number of different formats,
as a picture or as data samples. The saved pictures only show the sample
screen with the same axis proportions as in the application.
To save or print a sample as a graph:
1. From the main window, select the File menu, then Save / Print
graphics.
2. In the Windows submenu, select whether you want to save or print the
top or the bottom window.
3. In the Info messages submenu, select whether you want the
messages displayed in the graph or not.
Note: These settings will remain as you have selected them until you change
them again.
Optical Sampling Oscilloscope 79
Page 88
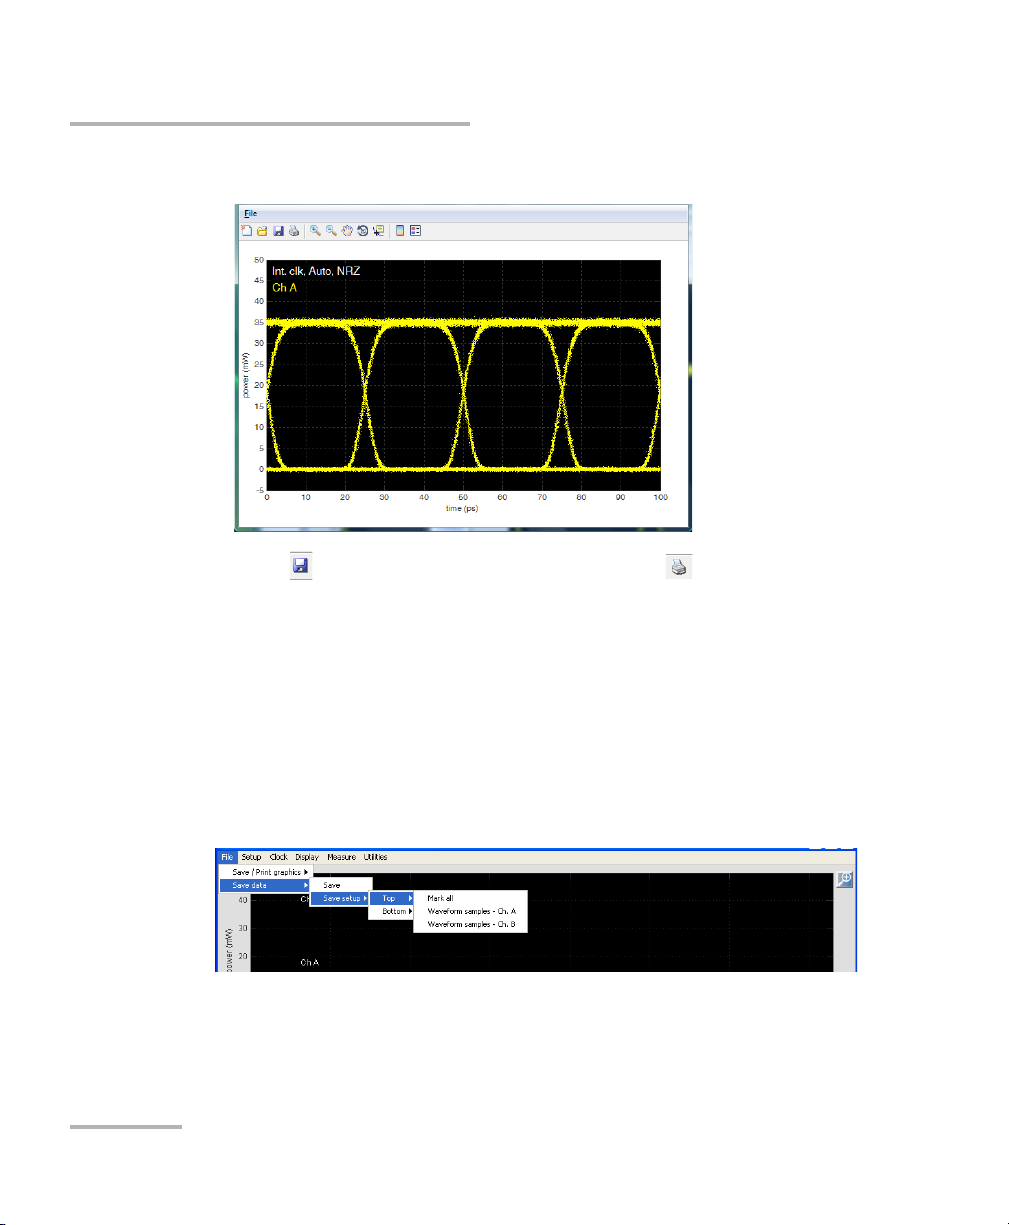
Setting up and Using the Optical Sampling Oscilloscope
Saving Sample Files
4. Click Save / print.
5. Select to save the file to the desired folder, or to print it.
To save the sample as data:
1. From the main window, select File, then Save data.
2. Under the Save setup menu, select if you want to include the
waveform samples for channel A and/or B for the top and bottom
window
Note: If you are not using the dual window setting, or if only channel A or B are
active, you will have fewer choices.
3. Click Save. Confirm the location and format for the resulting file (.csv
for Excel format, or .mat for Matlab format).
80 PSO-100
Page 89

5 Maintenance
To help ensure long, trouble-free operation:
³ Always inspect fiber-optic connectors before using them and clean
them if necessary.
³ Keep the unit free of dust.
³ Clean the unit casing and front panel with a cloth slightly dampened
with water.
³ Store unit at room temperature in a clean and dry area. Keep the unit
out of direct sunlight.
³ Avoid high humidity or significant temperature fluctuations.
³ Avoid unnecessary shocks and vibrations.
³ If any liquids are spilled on or into the unit, turn off the power
immediately, disconnect from any external power source and let the
unit dry completely.
Use of controls, adjustments, and procedures for operation and
maintenance other than those specified herein may result in
hazardous radiation exposure.
WARNING
There are no operator serviceable parts inside the unit. Please refer all
servicing to EXFO personnel.
³ The unit has a fan for active cooling. Make sure there is sufficient
airflow to cool the device, any objects that cover the ventilation holes
must be removed.
³ Do not apply too large torque when connecting the clock input. Use a
torque wrench.
³ The instrument is somewhat temperature sensitive during the start
procedure. Avoid placing the unit in a hot cabinet.
Optical Sampling Oscilloscope 81
Page 90

Maintenance
Push
Tur n
Pull
3
4
5
Cleaning EUI Connectors
Cleaning EUI Connectors
Regular cleaning of EUI connectors will help maintain optimum
performance. There is no need to disassemble the unit.
If any damage occurs to internal connectors, the module casing will
have to be opened and a new calibration will be required.
To clean EUI connectors:
1. Remove the EUI from the instrument to expose the connector
baseplate and ferrule.
IMPORTANT
2. Moisten a 2.5 mm cleaning tip with one drop of isopropyl alcohol
(alcohol may leave traces if used abundantly).
3. Slowly insert the cleaning tip into the EUI adapter until it comes out on
the other side (a slow clockwise rotating movement may help).
4. Gently turn the cleaning tip one full turn, then continue to turn as you
withdraw it.
82 PSO-100
Page 91

Cleaning EUI Connectors
5. Repeat steps 3 to 4 with a dry cleaning tip.
Note: Make sure you don’t touch the soft end of the cleaning tip.
6. Clean the ferrule in the connector port as follows:
6a. Deposit one drop of isopropyl alcohol on a lint-free wiping cloth.
IMPORTANT
Isopropyl alcohol may leave residues if used abundantly or left to
evaporate (about 10 seconds).
Avoid contact between the tip of the bottle and the wiping cloth,
and dry the surface quickly.
6b. Gently wipe the connector and ferrule.
6c. With a dry lint-free wiping cloth, gently wipe the same surfaces to
ensure that the connector and ferrule are perfectly dry.
6d. Verify connector surface with a portable fiber-optic microscope
(for example, EXFO’s FOMS) or fiber inspection probe (for
example, EXFO’s FIP).
Maintenance
WARNING
Verifying the surface of the connector WHILE THE UNIT IS ACTIVE
WILL result in permanent eye damage.
7. Put the EUI back onto the instrument (push and turn clockwise).
8. Throw out cleaning tips and wiping cloths after one use.
Optical Sampling Oscilloscope 83
Page 92

Maintenance
Fuse holder
Fuse
Fuse holder
Replacing Fuses
Replacing Fuses
The unit contains two fuses (T2.5A L, 5 mm x 20 mm (0.197 in x 0.787 in),
slow-blow, low-breaking capacity, 250 V). The fuse holder is located at the
back of the unit, just below the power inlet.
To replace a fuse:
1. Turn off the unit and unplug the power cord.
2. Using a flat-head screwdriver as a lever, pull the fuse holder out of the
unit.
3. Check and replace the fuses, if necessary.
4. Insert the new fuse into the fuse holder.
5. Make sure the fuses are placed firmly in the holder prior to reinsertion.
6. Firmly push the fuse holder into place.
84 PSO-100
Page 93

Maintenance
Recycling and Disposal (Applies to European Union Only)
Recycling and Disposal
(Applies to European Union Only)
Recycle or dispose of your product (including electric and
electronic accessories) properly, in accordance with local
regulations. Do not dispose of it in ordinary garbage receptacles.
This equipment was sold after August 13, 2005 (as identified by
the black rectangle).
³ Unless otherwise noted in a separate agreement between EXFO and a
customer, distributor, or commercial partner, EXFO will cover costs
related to the collection, treatment, recovery, and disposal of
end-of-lifecycle waste generated by electronic equipment introduced
after August 13, 2005 to an European Union member state with
legislation regarding Directive 2002/96/EC.
³ Except for reasons of safety or environmental benefit, equipment
manufactured by EXFO, under its brand name, is generally designed to
facilitate dismantling and reclamation.
For complete recycling/disposal procedures and contact information, visit
the EXFO Web site at www.exfo.com/recycle.
Optical Sampling Oscilloscope 85
Page 94

Page 95

6 Troubleshooting
Solving Common Problems
Problem Cause Possible Solution
Nothing happens when you
start sampling, but you can use
the Start/Stop button.
The application freezes and you
cannot use the Start/Stop
button.
The application does not start
at all
³ The samples are
outside the
sampling screen.
³ The input power
is too high.
³ The unit was
turned off while
the application
was sampling.
³ The MCR is not
installed
³ The system path
is incorrect
³ The MCR version
is incorrect
³ Zoom out or pan
to find the
samples.
³ Reduce input
power.
³ Tur n on t he un it
again, then restart
the application on
the host
computer.
³ Install the MCR
using the
MCRinstaller
³ See Installing the
Matlab Runtime,
USB Drivers and
Optical Sampling
Oscilloscope
Software on
page 12.
³ When receiving a
new software
update from
EXFO, make sure
that you use the
correct MCR
version.
Optical Sampling Oscilloscope 87
Page 96

Troubleshooting
Solving Common Problems
Problem Cause Possible Solution
The application was just
started, but you can see a
message that indicates "USB
connection failed" .
³ The USB cable is
not connected.
³ The USB
communication
is broken and
does not resume
in a hot-swap
situation.
³ The USB driver is
not correctly
installed.
³ Connect the USB
cable to the
computer in the
correct USB port,
and restart the
application.
³ Disconnect the
USB cable and
connect it again.
Restart the
application.
³ Install the USB
driver.
88 PSO-100
Page 97

Troubleshooting
Solving Common Problems
Problem Cause Possible Solution
The application was just
started. In the DOS window
"USB connection OK" is shown.
When you click Start in the
application nothing happens
and in the DOS window
TriggerTest is not passed.
USB connection is up,
but the instrument is
not triggering.
³ Make sure the
unit is turned on.
³ If it does not help,
the internal pulse
source has not
started correctly.
Make sure that
the surrounding
temperature is
within
specifications.
³ If the unit was
recently turned
off, let it cool
down for a few
minutes before
you turn it on
again.
³ If the problem
persists, contact
EXFO.
Optical Sampling Oscilloscope 89
Page 98

Troubleshooting
Solving Common Problems
Problem Cause Possible Solution
No signal is shown in the
application, only samples at the
zero level.
Windows indocates that it
found new hardware when you
insert the USB cable
³ Pow er is t oo low.
³ Wavelength is not
appropriate.
³ Dirty contacts.
³ You are using a
new USB port
(Windows XP).
³ Increase signal
power.
³ Use the
1520-1565 nm
wavelength
region.
³ Clean the input
contacts. If you
send in a lot of
power and the
contacts are dirty,
the input contact
may be damaged
and must be
repaired.
³ Use the correct
USB port (the one
you used when
the USB driver
was installed) or
install the driver
on the new port.
³ The USB driver is
not installed.
90 PSO-100
³ Install the USB
driver.
Page 99

Troubleshooting
Solving Common Problems
Problem Cause Possible Solution
The update rate is very slow,
even in Freerun mode and with
16 k samples.
The power level shown in the
application is much lower than
expected.
³ You are using a
USB 1.1 port.
³ Your computer is
slow .
³ You have several
other applications
running.
³ Signal
wavelength is
outside the
1525-1565 nm
span.
³
Dirty contacts.
³ If you have a
USB 2.0 port on
your computer
connect the USB
cable to that port
and reinstall the
USB driver.
³ Install the
application on a
faster computer.
³ Close some
applications,
restart the
computer if
necessary.
³ Use the
1525-1565 nm
span.
³ Clean the
contacts.
Optical Sampling Oscilloscope 91
Page 100

Troubleshooting
Solving Common Problems
Problem Cause Possible Solution
The sampled data looks very
noisy, jittery or distorted. The
software does not seem to be
able to synchronize the data.
³ The input signal is
too low.
³ The signal has
very poor OSNR
or suffers from
dispersion.
³ The waveform
format is
incorrect.
³ There are
frequency holes.
³ The data signal
suffers from large
phase noise.
³ The signal
wavelength is in
the 1567-1570 nm
span.
³ The internal
sampling pulse
source has not
locked yet.
³ Increase the
signal power
³ Try to use the
external clock
³ Set the
appropriate
waveform format
or use the
external clock.
³ Click clear.
³ Change the phase
tracking
algorithm
(Utilities >
Advanced
menu), or use the
external clock in
adaptive mode.
³ Use
1525-1565 nm.
³ Turn off the
optical input
signal. Wait and
let the unit warm
up until it locks.
My OTDM data jumps around
on the screen.
It is difficult to
synchronize a
sub-optimally
Use the external
clock with a subrate
clock.
multiplexed data
signal.
92 PSO-100
 Loading...