

Page 1
Operating Instructions
OAKTON
¨
35710-series
OaktonLog Temperature and
Temperature/Humidity
Data Loggers
mode/send
MAX
Min/Max
Day(s)
Contents
Contents .......................................................................... 1
Introduction...................................................................... 1
Principles of Data Logging..................................................... 1
The OaktonLog Device ...................................................1
Keys and Connections...........................................................1
Battery Replacement .............................................................1
OaktonLog Factory Settings ..................................................1
The OaktonLogÕs Buttons ......................................................1
Viewing Min/Max Values in the Last 1 to 24 Hours ..........1
Viewing Min/Max Values in the last 1 to 30 Days............. 2
Viewing the OaktonLogÕs Status....................................... 2
Downloading Data to a computer via IRDA Port ..............2
The MicroLab Software...................................................2
Introduction ............................................................................2
Installation.............................................................................. 2
Windows 3.X Installation................................................... 2
Windows 95 Installation....................................................2
The MicroLab Software: Overview......................................... 2
Communication Setup............................................................ 3
Hardware Connection .......................................................3
ÒWake upÓ the OaktonLog................................................. 3
Software Connection ........................................................3
Setting up the OaktonLog ......................................................3
Data-Recording Setup ...................................................... 3
Stopping the OaktonLog...................................................3
Starting the Logging Run..................................................4
Downloading and Viewing Data............................................. 4
File management ..............................................................4
Viewing the Data: The Markers ........................................4
Viewing the Data: Zooming............................................... 4
Viewing the Data: Display Options ...................................4
Viewing the Data: Scaling................................................. 4
Viewing the Data: Window information............................. 4
Viewing the Data: Windows Arrangement........................4
Viewing the Data: Output Options ....................................4
Extended Functions of the OaktonLog ..................................5
Technical Specifications ........................................................5
Warranty ................................................................................5
Return of items....................................................................... 5
Introduction
Principles of Data Logging
Before working with a data logger, you need to be familiarized
with a few basic terms:
Sensor Ð A component that transforms physical data to electronic
data recorded by the OaktonLogÕs processor.
Selected Sensors Ð As a user, you can decide which of the
sensors will participate in the data recording. You select the
sensors by using the MicroLab software.
OAK ON
TempLog
Min/Max
%RH
Hour(s)
Sample Ð A single measurement taken by the data-logging
device, and stored in its memory. In this manual, we refer to a
sample as a single measurement from each of the selected
sensors.
Memory Ð The OaktonLog's memory is where the recorded data
are stored. The OaktonLog has 16,000 bytes of memory capacity
and can therefore store up to 16,000 different measurements. A
sample can take 1-3 cells of memory (depending on how many
sensors were sampled). The OaktonLog Device
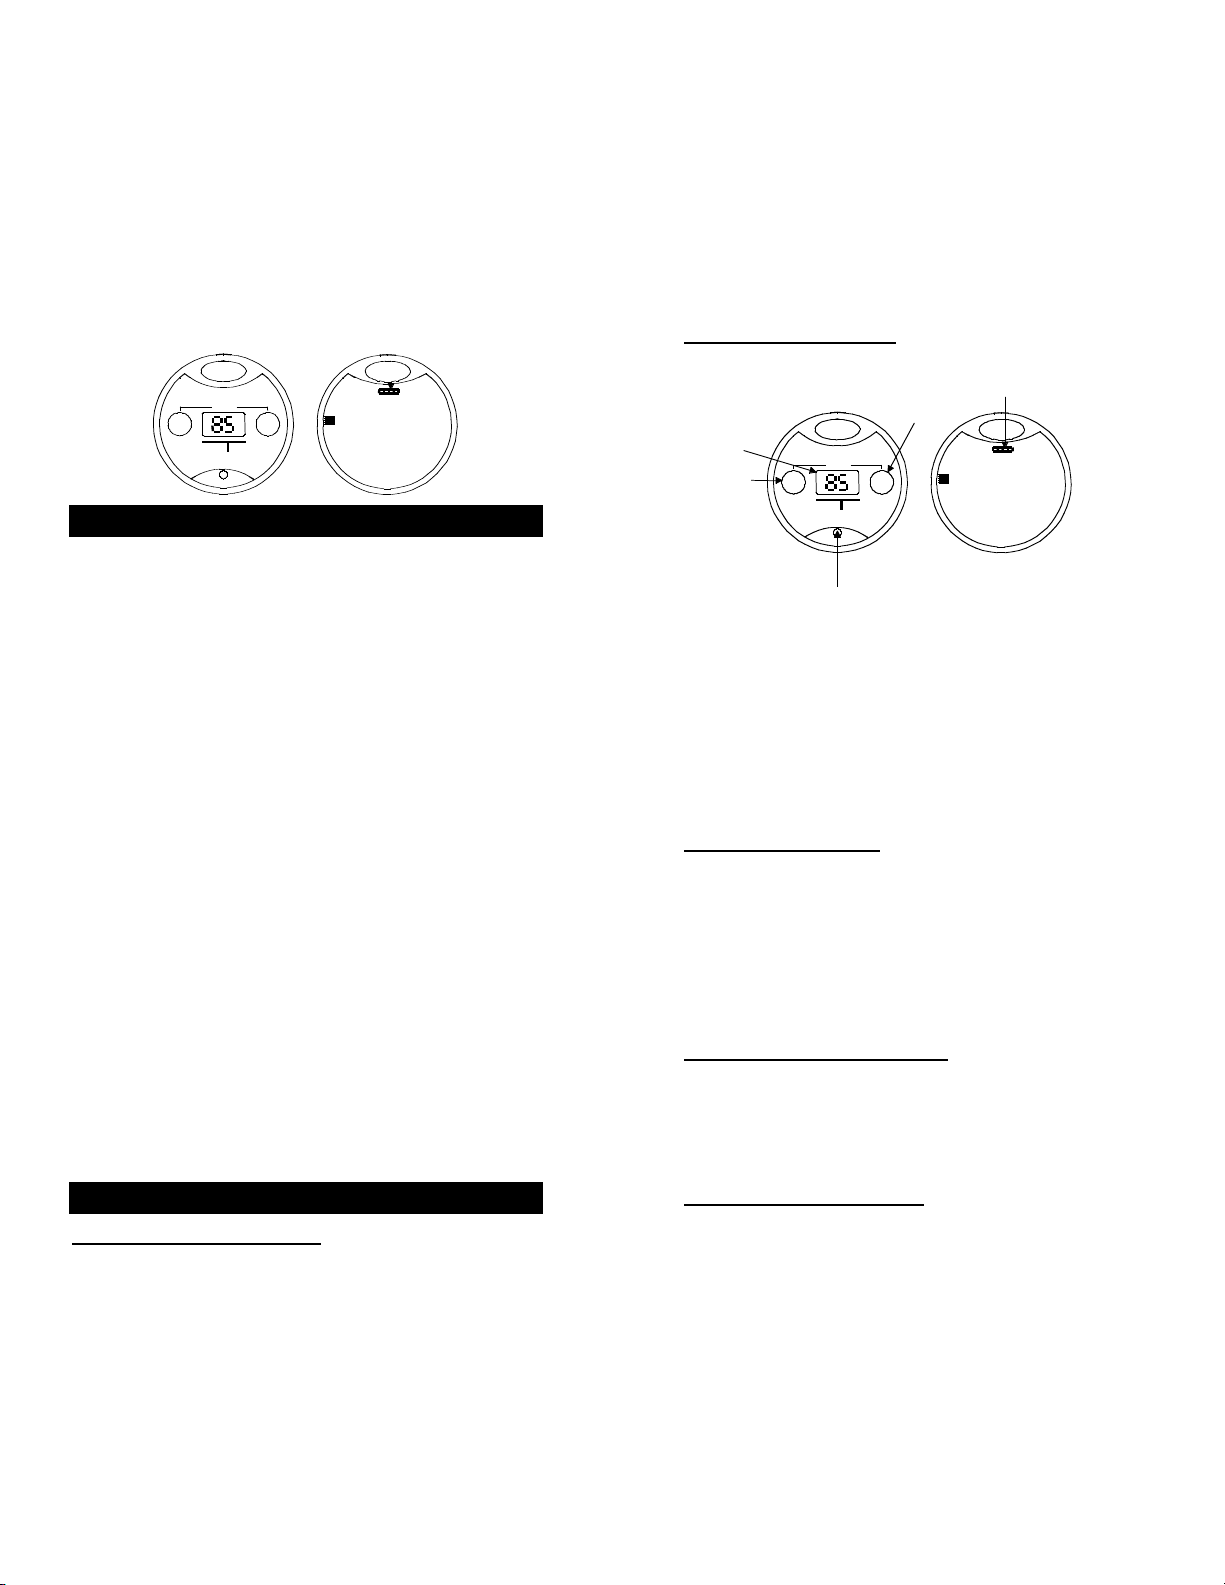
Keys and Connections
External sensor/PC
communica tion port
Right Key
LCD disp lay
Left Key
mode/send
MAX
Min/Max
Day(s)
%RH
OAK ON
TempLog
Infra-red transmitter
Min/Max
Hour(s)
The LCD display is used for viewing data without downloading
them to a PC. The left and right keys are used to view the Min
and Max values of the OaktonLogÕs measurements and to
download recorded data to a computer via a cable or the IRDA
port.
The infrared LED transmits data to a portable printer or a
computer via an IRDA port.
The external sensor/communication port is designed to connect
an external temperature sensor or a computer. The computer
connection cable and external sensor cable are sold separately in
the OaktonLog PC kit.
Battery Replacement
A 1/2AA 3.6V lithium battery powers the OaktonLog and should
last for 1.5 years. If you use an external sensor, or transmit often
via the IRDA port, this period is shortened. To replace the battery,
simply open the 4 screws in the back of the OaktonLog, replace
the battery, and reassemble the OaktonLog. Make sure that you
place the positive (+) pole towards the + sign on the OaktonLog
circuit board.
NOTE: BEFORE REPLACING BATTERIES,
MAKE SURE YOUR HANDS ARE CLEAN AND DRY.
OaktonLog Factory Settings
The OaktonLog is initially configured to work in a Cyclic Run
mode, taking a sample every 6 minutes from each sensor. The
Cyclic Run mode means that the OaktonLog continuously
records data until its memory is full, and to overwriting then the
oldest samples. To change the initial configuration you have to
use the MicroLab software (see page 3).
The OaktonLogÕs Buttons
The OaktonLog device has 2 keys used to display and transmit its
data and status. The following pages deal with the functions of
these 2 keys:
Viewing Min/Max Values in the Last 1 to 24 Hours
You can view the minimum and maximum values measured
during a specific time period up to 24 hours by using the
OaktonLog's right key. To view those values, you need to perform
the following 3 steps:
Page 2
mode/send
Min/Max
Min/Max
Day(s)
Hour(s)
OAKON
TempLog
Press right key and hold
to select between
1-24 hours
mode/send
Min/Max
Min/Max
Day(s)
Hour(s)
When released, point towards
IR printer to p rint report
MAX
MIN
The LCD will also display
the min. and max.values
of the selected period
¡F
%RH
1. Select a time period Ð when you press OaktonLogÕs right
button, the LCD will start displaying the number of hours.
When you reach the desired time period (ranging from 1 to 24
hours), release the right key.
2. After releasing the right key, the OaktonLog will display the
Min and Max values of the selected sensors, for the selected
time period.
3. (Optional) After releasing the right key, the OaktonLog will
send an IR signal of the Min and Max values for the time
period selected in step 1. To receive a printout for these data,
point the OaktonLog to the IR printer (HP portable printer Ð
model No. 82240B).
NOTE: You cannot enter a time period greater than the time
elapsed since entering Run mode.
Viewing Min/Max Values in the last 1 to 30 Days
You can view the minimum and maximum values measured
during a specific time period up to 30 days by using the
OaktonLog's right key. To view those values, you need to perform
the following 3 steps:
1. Select a time period Ð When you press the OaktonLogÕs left
key, the LCD will start displaying the number of days. When
you reach the desired time period (ranging from 1 to 30 days)
release the left key.
2. After releasing the left key, the OaktonLog will display the Min
and Max values of the selected sensors, for the selected time
period.
3. (Optional) After releasing the left key, the OaktonLog will send
an IR signal of the Min and Max values for the time period you
selected in step 1. To receive a printout for these data, point
the OaktonLog to the IR printer (HP portable printer Ð model
No. 82240B).
You can also find a scheme of this procedure on your minimanual reference card.
NOTE: You cannot enter a time period greater than the time
elapsed since entering Run mode.
Viewing the OaktonLogÕs Status
The OaktonLog is always in one of the 4 possible modes:
Stop Ð The OaktonLog is idle and not recording.
mode/send
Min/Max
Day(s)
ON
OAK
TempLog
Press both keys
and release
Min/Max
Hour(s)
Cycle run Run
Stop Timer run
The LCD displays
the current status of
the OaktonLog
Run Ð The OaktonLog is recording data. It will stop recording
when the memory is full.
Cyclic Run Ð Same as Run, but the OaktonLog overwrites the
old measurements (starting with the oldest one) when the
memory is full.
Timer Run Ð You can configure the OaktonLog to start recording
at a predetermined time. When the OaktonLog is set for such a
delayed run, the OaktonLogÕs status will is set to Timer Run.
Once the OaktonLog starts recording, the status changes to either
Run or Cyclic Run, depending on your configuration. The
following diagram indicates how to view the status of the
OaktonLog:
When you press both keys simultaneously, the OaktonLogÕs LCD
will display the status of the OaktonLog. It will also Òwake upÓ the
OaktonLog device for communication with a computer.
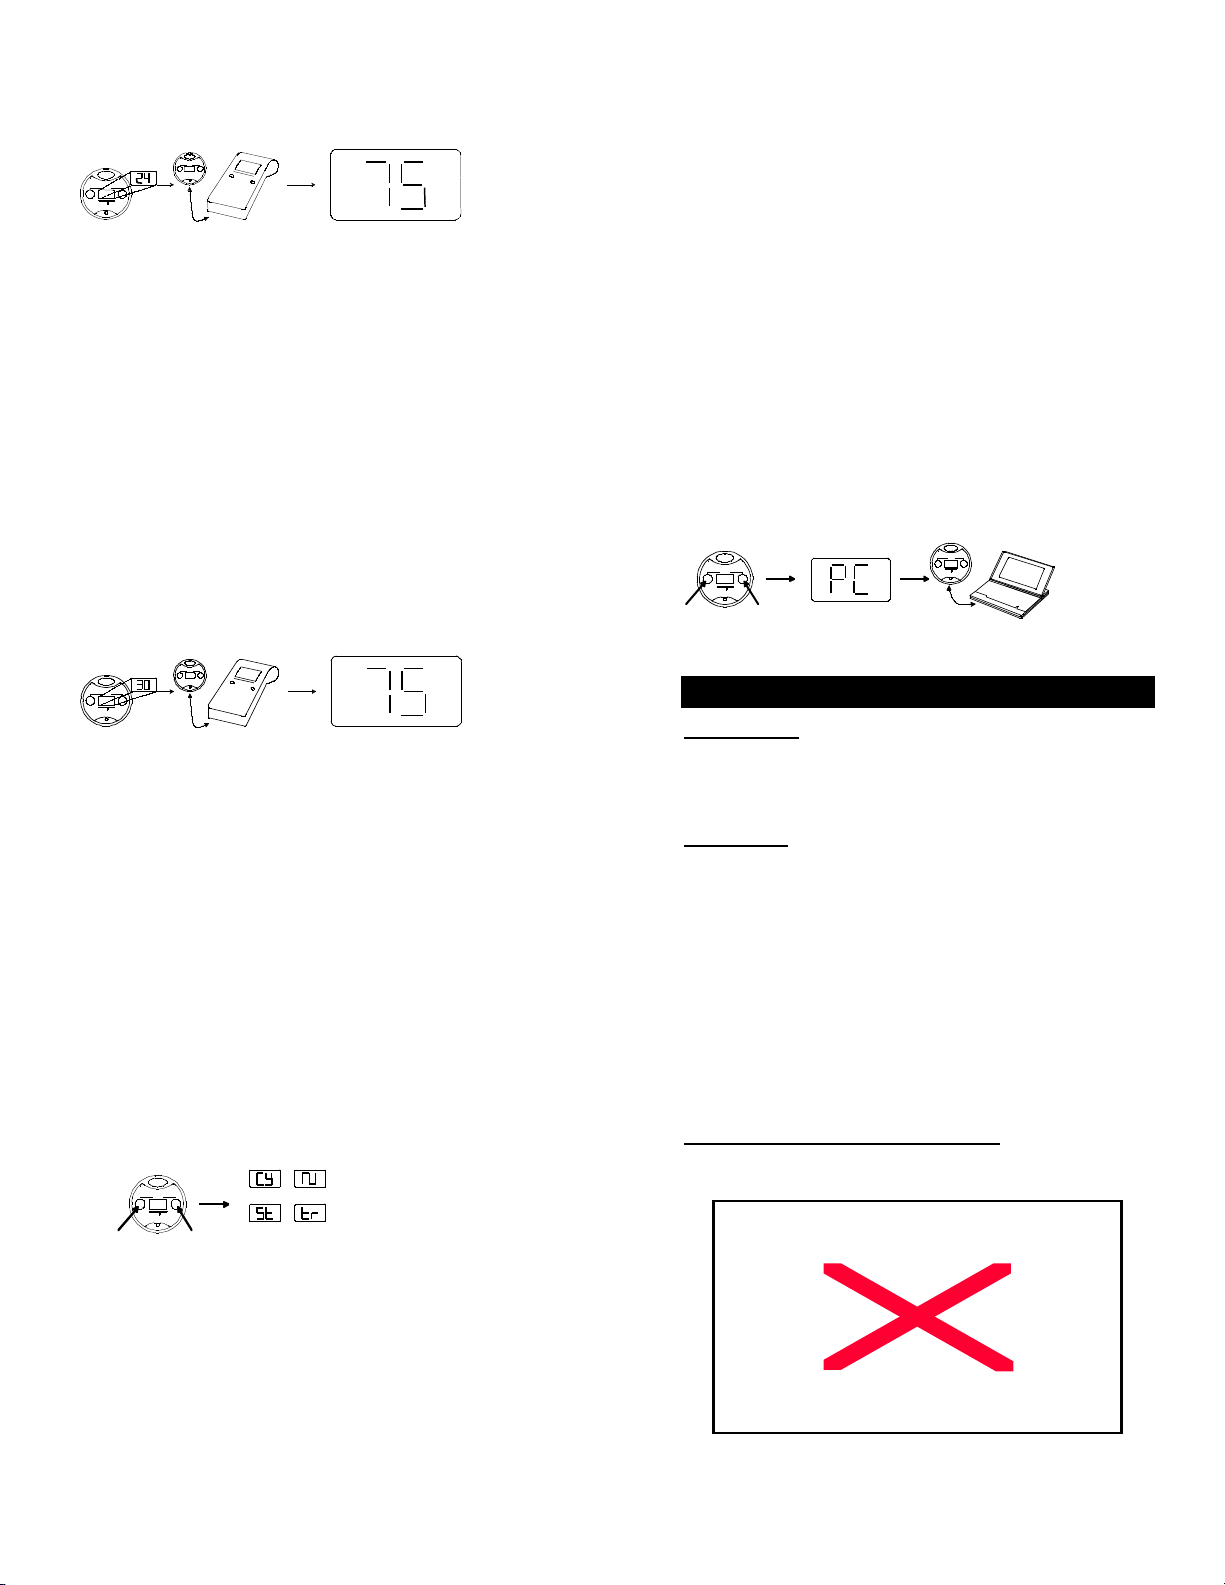
Downloading Data to a computer via IRDA Port
The OaktonLog is equipped with an infrared transmitter. Using the
OaktonLogÕs keys you can transmit the data stored in the
OaktonLogÕs memory to your computerÕs IRDA port. To perform
this function you need to perform the following 4 steps:
1. Open the MicroLab software on your computer.
2. Point the OaktonLog towards the computerÕs IRDA port.
3. Hold both keys down for 2 seconds. The OaktonLogÕs LCD
will change to PC.
4. The OaktonLog downloads all the data to the computer and
displays a graph of them.
The following scheme shows how to download the data:
The MicroLab Software
Introduction
To set the OaktonLog up for recording data, you have to use the
MicroLab software. The MicroLab software is also required for
downloading, viewing and saving recorded data. This section
provides you with a detailed guideline for the MicroLab.
Installation
Windows 3.X Installation
1. Insert the MicroLab diskette into your 3.5" drive.
2. From the File menu in the Program Manager, choose Run.
3. Type in the full path to the installation program in the
command line Ð setup.exe (e.g., a:\setup), and press Enter.
4. Follow the simple instructions outlined in the setup program.
Windows 95 Installation
1. Insert the MicroLab diskette into your 3.5" drive.
2. Choose Run from the START menu.
3. Type the full path to the installation program in the command
line Ð setup.exe (e.g., a:\setup), and press E
4. Follow the simple instructions outlined in the setup program:
The MicroLab Software: Overview
The following diagram provides you a brief description of
MicroLab's screen:
NTER.
Page 3

Communication Setup
You set the OaktonLog up for recording, saving, downloading,
and viewing the data from your computer. Connecting the
OaktonLog to the computer is a 3-step operation:
1. Hardware connection Ð Connect the OaktonLog to the
computer.
2. ÒWake upÓ the OaktonLog Ð Open the OaktonLogÕs COM
port for computer communication.
3. Software Connection Ð Establish a connection using
MicroLab.
Hardware Connection
In your OaktonLog PC connection kit you will find a serial cable.
One end of this cable connects to an empty serial port on the
back of your computer. Note that you may need to use a 9/25-pin
adapter (this applies mostly to non-Pentium computers).
Connect the other end of this serial cable to the computer
connection socket on the back of your OaktonLog device.
ÒWake upÓ the OaktonLog
Since communication depletes battery life, the OaktonLog device
is not generally open for communication. If you wish to transfer
data to and from the OaktonLog, you have to first open the
computer connection port manually by pressing both of the
OaktonLogÕs keys simultaneously. The OaktonLogÕs LCD displays
the status of the device, and from that moment the PC connection
port is open for transmission. The port remains open for 4
minutes. Please find the scheme of this procedure at page 12.
Note: Communication between the PC and the OaktonLog
device requires a free serial port.
Software Connection
In most cases, the OaktonLog will automatically connect to the
software. You should be able to proceed to setting up the
OaktonLog parameters (page 3) or downloading data (page 4).
If there has been a communication
problem or you have changed ports
click the Connect icon on the left
toolbar. The Comm Setup dialog
box opens. This dialog box
indicates which of the four possible
serial ports on your computer are
available for communication. Note
that in the dialog box above COM 1, 2 and 4 are available for
communication.
If none of the four boxes in the Comm Setup dialog box is
checked, you must open a serial port in your BIOS configuration.
If you do not know how to open a serial port on your computer,
refer to your computer vendor.
By clicking the Try to connect button, MicroLab establishes a
connection with the OaktonLog. The Connected window opens.
Click OK - the OaktonLog is now ready to communicate with the
computer. Once a connection is established
with the OaktonLog, you can perform all
operations from the MicroLab software. The
following section provides additional
information regarding various MicroLab
features.
Setting up the OaktonLog
Data-Recording Setup
All data recording parameters are configured from the right panel
of the MicroLab software.
Stopping the OaktonLog
Before setting up the OaktonLog, you must stop the
current recording run.
To stop recording data, make sure the OaktonLog is connected
to the cable, and that its communication channel is open. Click
the Stop icon on the left toolbar. The OaktonLog stops recording
data.
Sensor selection Ð The upper part of the right
tool bar is used to select the sensors to be
used in the next recording. These are
temperature, humidity, and external
temperature sensor. Click the button at left of
temperature icon to select °F or °C.
Clicking one of the sensor icons with the left
mouse button selects the corresponding sensor for the next data
logging. A selected sensor shows a red light next to it. Otherwise
the circle next to the icon will appear black. To the right you see
only the internal temperature sensor selected, while the two other
ones are not.
Some models do not include the humidity sensor. In those cases
the Humidity sensor icon is
disabled. When you select the
humidity sensor, you may
calibrate it through the Microlab
software as follows:
Click the arrow to the left of the
Humidity sensor icon. The
Calibrate dialog box opens.
Make sure that the OaktonLog
has been stopped (i.e. it
measures, but doesnÕt save the result in its memory).
Measure the humidity in two known values (e.g. 23% and 75%).
Fill in those values together with the values the OaktonLog is
showing.
Click Calibrate. The OaktonLog takes about five seconds to
calculate the new linear conversion for the relative humidity. After
the OaktonLog finished the calculation, the Calibration dialog box
closes.
Sample interval Ð This digital display
is used to determine the amount of
time between every two samples taken
by the OaktonLog. To change the
sample interval, simply click on the
digit that you wish to change. A click
on the left mouse button makes the digit rise by one unit. A click
on the right mouse button lowers it accordingly. The largest
sample interval is 120 minutes and the smallest one 10 seconds.
The picture to the right shows a sample interval of 10 seconds.
Start Time Ð You may set the
OaktonLog to start the data recording
at a predetermined date and time. This
is done by changing the Start Time
display. By default, the start time is set
to your current time and date. A click
on the left or right mouse button on
time and date changes it to the start time of your choice. If you
want to return to the default time and date, click on the small reset
button. In the picture above, the starting time was set to 7:49 PM
on February 14th, 2001. The number 01 refers to the year 2001.
Cyclic Run Ð A cyclic run means that
when the OaktonLogÕs memory is full, it
overwrites older samples starting with
the oldest one. Click the Cyclic run
indicator with the left mouse button to
select a cyclic run for the next data recording. This picture shows
that the Cyclic run has been selected for the next data recording.
Send Ð After setting recording parameters you must send these
settings to the OaktonLog using the Send Icon. The arrow of the
Send icon is empty (wire) by default to indicate that no changes
Page 4

have been entered. If you have changed the recording
parameters, the arrow will flash yellow-green. After you finish
setting all the parameters in the panel, press the flashing Send
icon.
If the settings are downloaded properly to the OaktonLog device,
the Send arrow stops flashing and returns to the default wireframe mode. If the icon changes to a broken red arrow, the
settings have not been saved in the OaktonLog. Make sure the
OaktonLog is communicating with your PC (refer to page 3) and
that it is stopped (refer to page 3).
3 modes of the Send button
No update
needed
Starting the Logging Run
After you finish setting up the OaktonLog, it is
time to start the data recording.
Click the Run icon on the left toolbar. Once you
click it, The OaktonLog starts recording data,
based on the pre-programmed parameters.
Click to update
OaktonLog
No
communication
Downloading and Viewing Data
Downloading is done by clicking the Data
Download icon on the left toolbar. Make sure that
the OaktonLog's communication port is open.
File management
The three top icons on the left toolbar of MicroLab
are used for file management. Clicking the Open
icon opens saved files. Clicking the Save icon
saves the file you are currently working on. If you
save your results the first time, you have to enter
a file name into a dialog box opening up. The file
name cannot consist of more than 8 characters.
The extension of the data files used by MicroLab
is *.SMP.
The Save AsÉ icon is used to save an already
saved data file under a different name.
Viewing the Data: The Markers
The MicroLab software supplies you with a helpful marker tool.
The marker is used to view the data at a specific moment, or to
measure the difference between two points in the graph.
To place a marker on the graph, double-click on the desired place
on the graph. A black arrow appears on the graph, and at the
bottom of the graph window the Y and t values represented by the
marker appear. You can move the marker by placing the mouse
pointer on it, holding the left mouse button, and dragging the
marker to the left or right. You can also place the mouse pointer
on the marker, left-click once, and then move the marker by using
the left and right Arrow keys on your keyboard.
Placing a second marker is done the same way. When you place
the second marker, the data at the bottom of the window include
the values for ∆X, ∆t. ∆ refers to the difference values between
the markers.
To remove a marker, click on it with the right mouse button.
Viewing the Data: Zooming
Zooming in is done by clicking the Zoom icon on the
left tool bar. Once clicked, the mouse pointer changes
to a magnifying glass. Place it on the beginning of the
section you wish to zoom in, press and hold the left
mouse button, and drag the mouse pointer over the section you
wish to zoom in. Once released, the window displays only the
zoomed data. Pressing the right mouse button will zoom the plot
out to the previous position. If you wish to view the original data,
click the Full view icon. Clicking anywhere outside the graph
window will turn the mouse pointer back to
its normal mode.
Viewing the Data: Display Options
On the left tool bar you can see a screen
icon. When the mouse pointer is placed on
it, the Display options sub-menu opens.
You can select one of three options
Window Appearance Ð Your mouse pointer changes to a brush.
Placing the brush on one of the graphs or on the background of
your data window and clicking there with the left mouse button
opens a color dialog box, in which you can select a different color
for graphs or background.
Clicking on one of the data graphs with the right mouse button
opens the Line preferences dialog box, where you can select line
type, line width, and a symbol to be placed where the data points
were recorded.
Placing the brush on the X or Y-axis of your graphs, or on the
graph title, opens the Font dialog box, in which you can select the
font type, size and color for the axis and
the main title.
Viewing the Data: Scaling
Scaling means changing the minimum and
maximum values of your graphÕs Y-axis.
Clicking the Scale icon with the left mouse
button opens the Scaling dialog box. Select the graph you wish to
scale, and enter then the new Min and Max values. Click OK to
apply the scaling on the graph.
Viewing the Data: Window information
Clicking the Window information icon with
the left mouse button will turn the mouse
pointer into a notepad. Placing it on a graph
and clicking it opens the Information window
of that graph, where you can see or change the graph's name, or
enter a title for the graphÕs Y-axis, and view the applied sensor
and start time for that graph.
Placing the notepad mouse pointer clicking on the window title
with the left mouse button opens the Information window, where
you can change the title of the window, enter a title for the X-axis,
and view the sensor and the total number of samples taken. In
both of the dialog boxes, the mouse pointer returns to its normal
mode upon clicking OK. If you wish to continue using the notepad
mouse pointer, click ÒSee More InfoÓ.
Viewing the Data: Windows
Arrangement
On the bottom of the left toolbar, you
find the Windows submenu. Place the
mouse pointer on the icon to see the
options for arranging the windows:
Tile Ð Displays all open windows next to each other so that they
fill the MicroLabÕs work area.
Cascade Ð Alters all open windows so that they all have the same
size, and arranges them in a cascading fashion on the top at the
left side of the screen.
Close all Ð Closes all open windows.
Exit Ð Exits MicroLab.
Viewing the Data: Output Options
Placing the mouse pointer on the output icon in the
left toolbar displays the output options of the MicroLab software.
There are 3 output options:
Page 5

1. Output to printer Ð prints the active
graph.
2. Output to CSV file Ð A CSV (Comma
Separated Values) file is a standard
spreadsheet data file, compatible with
Excel, Lotus, and many other spreadsheet programs.
3. Output to Excel Ð Saves the data as a CSV file and
automatically opens the file in Excel (if it is installed on your
computer).
Extended Functions of the OaktonLog
The OaktonLog has a few unique features extending its
functionality and making it much easier to use.
Enter Comment Ð On the left toolbar of
MicroLab you find the Send Comment icon.
Clicking it opens the following dialog box, in
which you can enter a text message of up to
32 characters. This text message can be used
to identify the OaktonLog, the cargo it monitors, or any other text
you want to enter. After typing the text, click the Send button
(make sure that the Comm port of the OaktonLog is open and that
the OaktonLog is in Standby mode). The comment will be saved
in the OaktonLogÕs memory and displayed as the main title of the
data graph after the data are downloaded.
Alarm Level Ð In the left toolbar you find the
Alarm icon. The alarm function enables the
user to select a specific alarm level for
internal and external temperature sensor and
the humidity sensor. When this level is
crossed upwards, the display of the
OaktonLog starts flashing on and off. The display continues
flashing even if the measurement that set the alarm off returns to
its normal state. To cancel the flashing of the OaktonLogÕs display
and to view the Min and Max values, which triggered the alarm,
press one of the OaktonLogÕs keys. Upon displaying these values,
the OaktonLog continues the data recording and the flashing
stops.
To select the alarm levels, click the alarm icon in MicroLab. The
Alarm Levels dialog box opens. Note that the set default values
displayed for the alarm levels are the max. values possible for
each sensor. Change the levels of internal and external
temperature and humidity sensor. Click the Send button to send
the alarm data to the OaktonLog (make sure that the OaktonLog
is open for communication and in Standby mode). The RESET
button changes the levels back to their default values.
Technical Specifications
Input
Two Built-in sensors:
Temperature: -22.7¡F - 121.7¡F (-30¡C - 50¡C), Resolution 0.9¡F
(0.5¡C), accuracy ±1.08¡F (±0.6¡C).
Humidity: 0-90% (resolution 0.5%, accuracy ±3%
@ 77¡F).
One ext. temperature sensor: -57.6¡F - 211.7¡F
(-50¡C Ð 100¡C), accuracy ±2.7¡F (±1.5¡C).
Model:
35710-00: Temperature + External Input
35710-10: Temperature + Humidity + External Input
Output
Two digits 7-segment LCD
IRDA Interface to Portable HP-Printer or PC Host
RS-232 Cable connection to the PC (additional to IRDA port)
Power Supply
Internal Lithium Battery Ð 3.6 V TL5101
Battery Life Ð About two years, replaceable (Might change when
connecting external sensors)
Sampling Rate
User defined: from every 10 sec to every 2 hours
Dimensions
Thickness Ð 22.9 mm Width - 72 mm diameter
Weight Ð 55 gr.
CP650 Ð Dust proof IP60 standard compliance.
CP600 Ð Water and Dust proof IP65 standard.
Year 2000 compatible Ð4 digit year. CE, FCC compliance
Software
Windows 3.x, Windows 95/98 compatible, Export to common
spreadsheets
Warranty
OAKTON warranties this product to be free from significant
deviations in material and workmanship for a period of one year
from date of purchase. If repair or adjustment is necessary and
has not been the result of abuse or misuse within the warrantied
time period, please return Ð freight pre-paid Ð and correction will
be made without charge. OAKTON alone will determine if the
product problem is due to deviations or customer misuse.
Out-of-warranty products will be repaired on a charge basis.
Return of items
Authorization must be obtained from our customer Service
Department before returning items for any reason. When applying
for authorization, please include data regarding the reason the
items are to be returned. For your protection, items must be
carefully packed to prevent damage in shipment and insured
against possible damage or loss. We will not be responsible for
damage resulting from careless or insufficient packing. A
restocking charge will be made on all unauthorized returns.
Note: We reserve the right to make improvements in design,
construction, and appearance of products without notice.
Memory Capacity
16000 recording samples
 Loading...