

Page 1
CyberComm 5000 Version 1.0.0
gyM
sy...
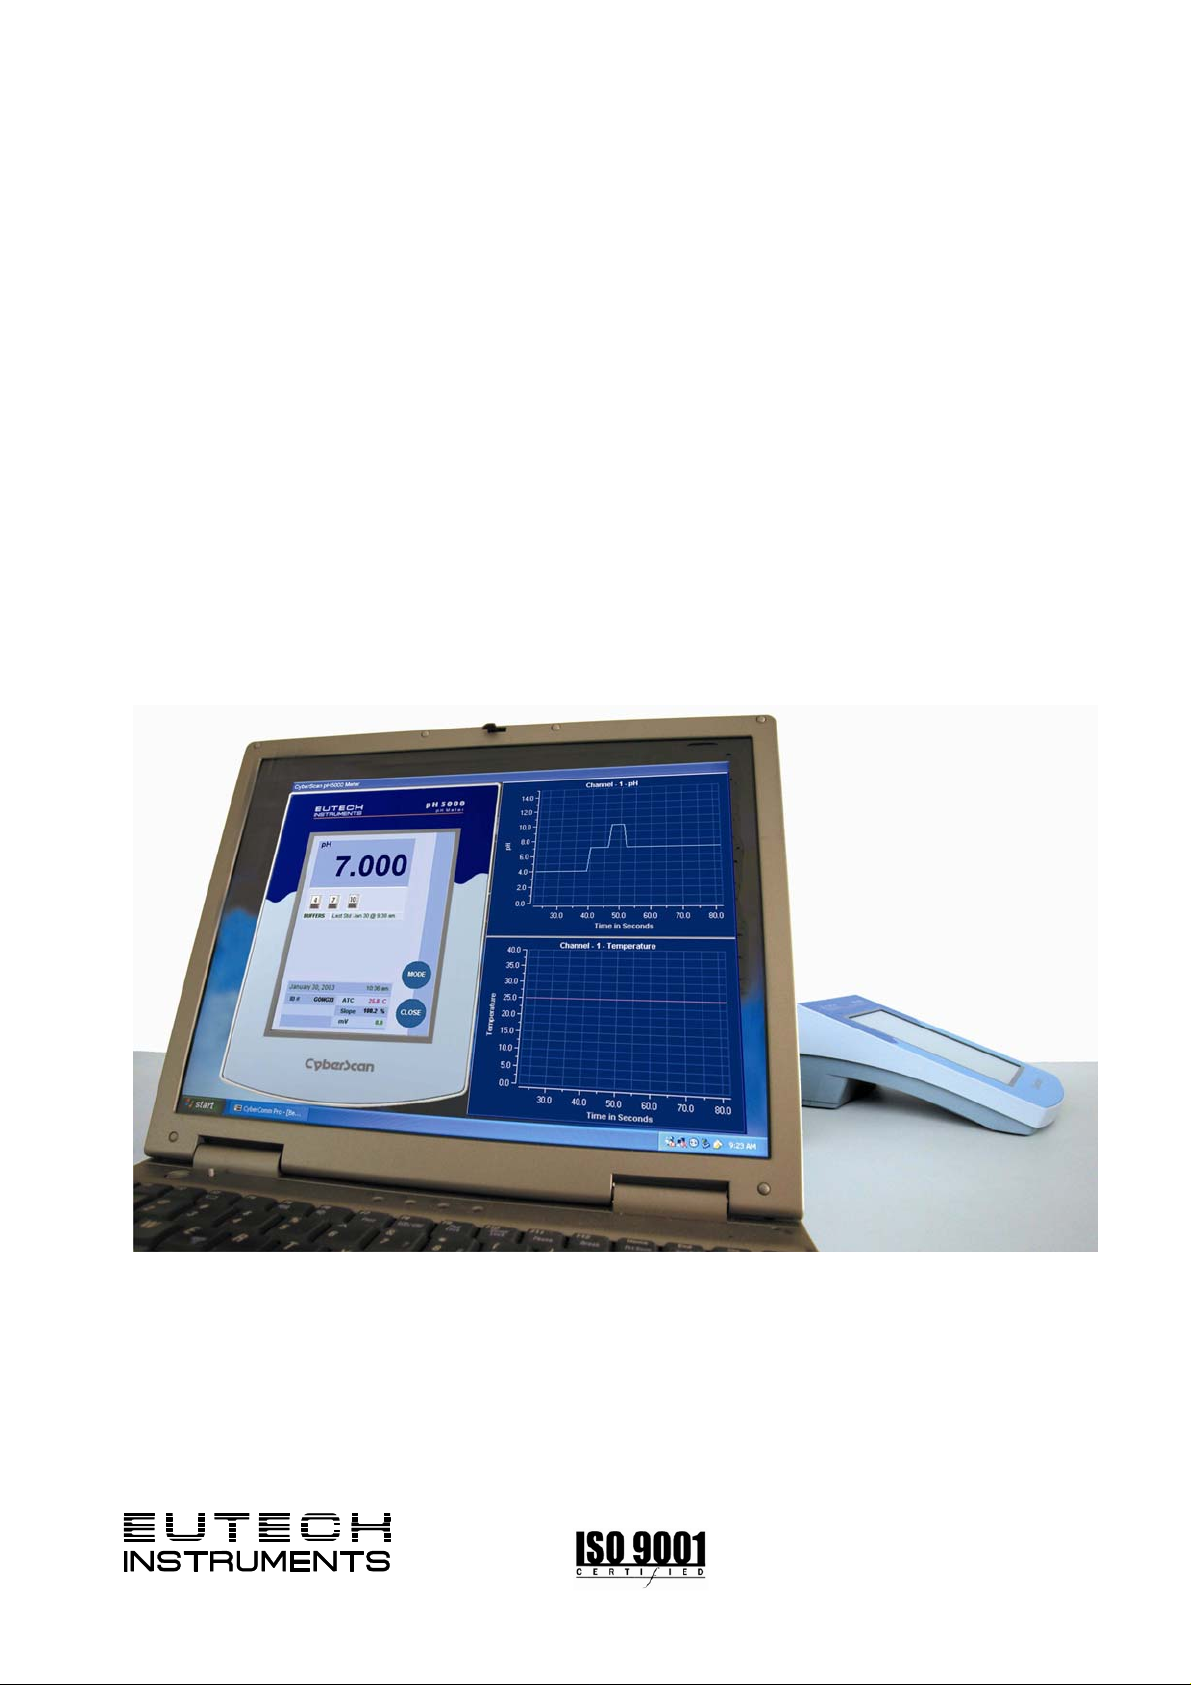
Data Acquisition Software
Installation & User Guide
CyberScan pH 5000/ 5500
CyberScan PC 5000/ 5500
CyberScan DO 5000/ PCD 5500
68X292334
Rev. 1 10/03
Technolo
adeEa
Page 2

PREFACE
Thank you for selecting a CyberScan Series 5000 touch screen meter. This meter comes with the
CyberComm 5000 Data Acquisition Software which allows you easy access and communication via a
computer with connection to the meter.
The instruction manual serves to explain the use of the CyberComm 5000 step-by-step installation and user
guide to help you familiarize with the software’s features and functions. It is structured sequentially with
illustration of active software screens and diagrams that explains the various functions and menus available.
This manual is written to cover as many anticipated applications and uses of the CyberComm 5000 software
along with CyberScan Series 5000 bench meters only. If there are doubts in the use of the software, please
do not hesitate to contact Technical Support at techsupport@eutechinst.com
assistance.
CyberComm 5000 software update is available to all customers who have purchased the Series 5000
meters. Please download the latest CyberComm 5000 version via our website at
www.eutechinst.com/cybercomm-software.htm
Eutech Instruments reserves the rights to change, make improvement and modify specifications without prior
notice and cannot accept any responsibility for damage or malfunction to the instrument caused by improper
use.
Copyright
Eutech Instruments Pte. Ltd.
Rev 1, 10/03.
©
2003 All rights reserved.
or call us at (65) 6778-6876 for
Page 3

TABLE OF CONTENTS
1 DATA ACQUISITION IN WINDOWS VERSION 4
1.1 The CyberComm 5000 Data Acquisition Software 4
1.2 System Requirements 4
1.2.1 Setting the Communication Parameters 4
2 INSTALLATION OF CYBERCOMM 5000 5
2.1 Loading of CD-ROM 5
2.2 User Name and Organisation Entry 6
2.3 Choose Destination Location 6
2.4 Setup Type 7
2.5 Select Program Folder 7
2.6 Start Copying Files 8
2.7 Setup Completion 8
3 GETTING STARTED 9
3.1 Welcome Screen 9
3.2 Print Configuration 10
3.3 Confirmation Prompt 11
3.4 File Options 12
3.5 Data File Information 13
3.6 Mode Selection 14
4 METER CONNECTED (SINGLE CHANNEL) 15
5 EXPORT DISSOLVED OXYGEN MEASUREMENT RESULTS
(FOR CYBERSCAN DO 5000 & PCD 5500 ONLY) 17
5.1 To export BOD Results to CyberComm 5000 17
5.2 To export OUR Results to CyberComm 5000 20
5.3 To export SOUR Results to CyberComm 5000 22
6 MENU BAR 24
6.1 Data Results Recording 25
7 COPY & PRINT PLOTS 26
7.1 Copy Plot 26
7.2 Print Plot 27
8 METER CONNECTED (DUAL CHANNEL) 28
8.1 Channel Configuration (For Dual Channel meters only) 28
8.2 Functions from Menu Bar 28
8.3 Data Results Recording 29
8.4 Copy & Print Plot 30
9 MEASUREMENT MODE OVERVIEW 31
10 RETRIEVE SAVED DATA 32
10.1 Display data in Notepad program 32
10.2 Import Data Readings into Microsoft Excel© 33
10.2.1 Steps to import data readings from a Microsoft Excel © worksheet: 33
10.2.2 Text Import Wizard- Step 1 of 3 34
10.2.3 Text Import Wizard- Step 2 of 3 35
10.2.4 Text Import Wizard- Step 3 of 3 36
11 ERROR MESSAGES AND PROMPTS 38
11.1 Communication Error 38
11.2 Print Configuration Settings Error 38
11.3 No Model Detected 38
11.4 Save Settings 38
12 PRINT READINGS 39
12.1 Printing using a serial printer 39
12.2 Setting Up the Printer 39
12.3 Connecting the Cable to the Computer 39
Page 4
1 DATA ACQUISITION IN WINDOWS VERSION
1.1 The CyberComm 5000 Data Acquisition Software
The CyberComm 5000 Data Acquisition Software (DAS) package is a user-friendly data acquisition package
that provides a convenient way to capture data for future analysis. This CyberComm 5000 is only able to run
on Windows
your meter and PC is bi-directional as the meter functions can be remotely controlled by the DAS. Data type
stored is in the ASCII format.
©
Windows is the registered trademark of Microsoft Corporation
1.2 System Requirements
To run the CyberComm 5000 Data Acquisition Software, the following items are required:
©
Operating System (refer to 1.2 System Requirements for details). Communication between
1 IBM Compatible PC Pentium and above
2 Windows Operating Systems 95 and above
3 VGA/SVGA Monitor with minimum 800 X 600 resolution
4 RS232C Serial Communication Cable
1.2.1 Setting the Communication Parameters
The meter is capable of different communication configurations for baud rate, parity and stop bits. The
values chosen for these parameters of the meter must match those chosen for the computer, same goes for
the serial printer if it is connected.
Page 5
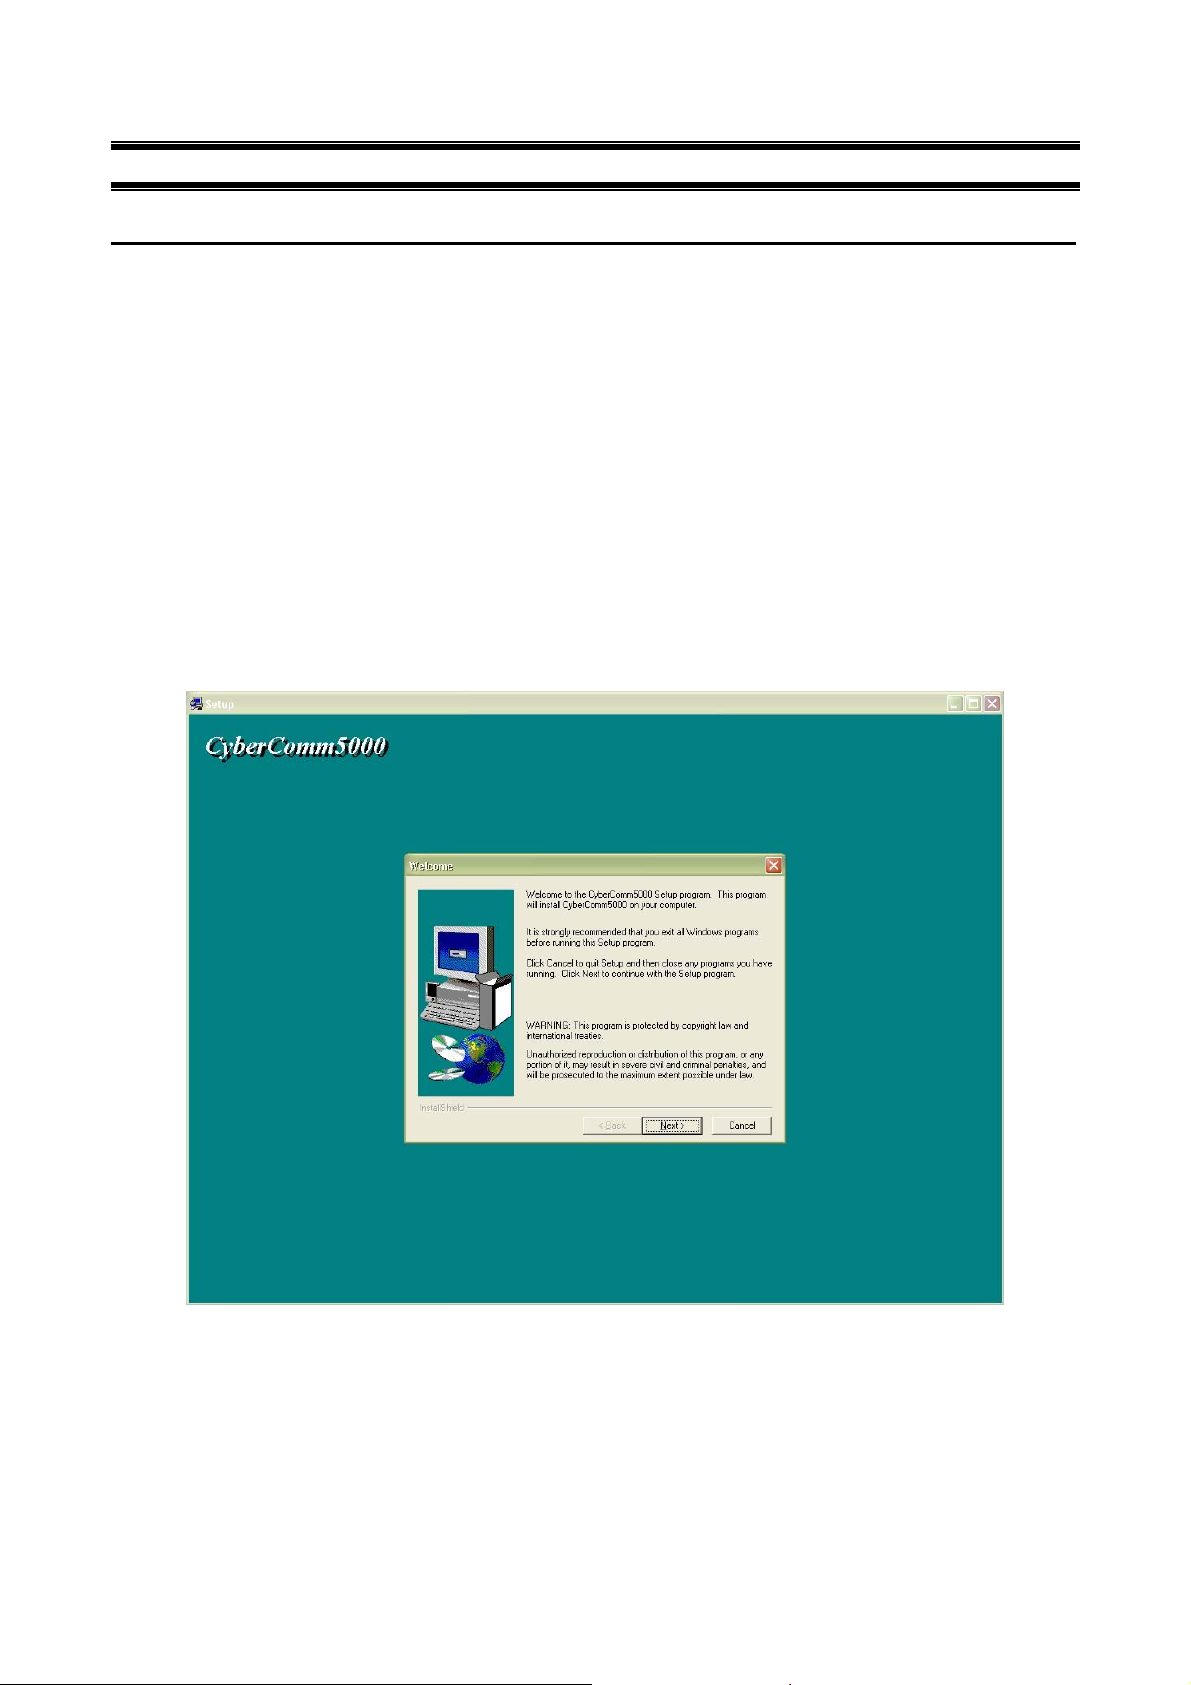
2 INSTALLATION OF CYBERCOMM 5000
2.1 Loading of CD-ROM
See Figure 1.
Before running the program, check that the CyberScan Series 5000 meter is properly connected to the
computer. It is preferable to connect to either one of the COM (serial) ports available on a computer. Note
the number of the COM port that you have connected to the meter as this will be required in setting up the
CyberComm DAS later.
a) Turn on the computer (PC).
b) Insert the CD-ROM provided into a CD-ROM drive of your PC.
c) To install the DAS, use the My Computer to view the file contents in your CD_ROM drive. Locate and
click onto the SETUP file under the CyberComm directory. Double-click again on this file and the
program automatically starts installation. Alternatively you can use the Add/Remove Programs feature in
Control Panel to install the CyberComm and follow the instruction accordingly. If in doubt, please refer to
your Microsoft Operating Manual for further details.
d) See Figure 1: Main Setup, click Next to continue setup process.
Figure 1: Main Setup
5
Page 6
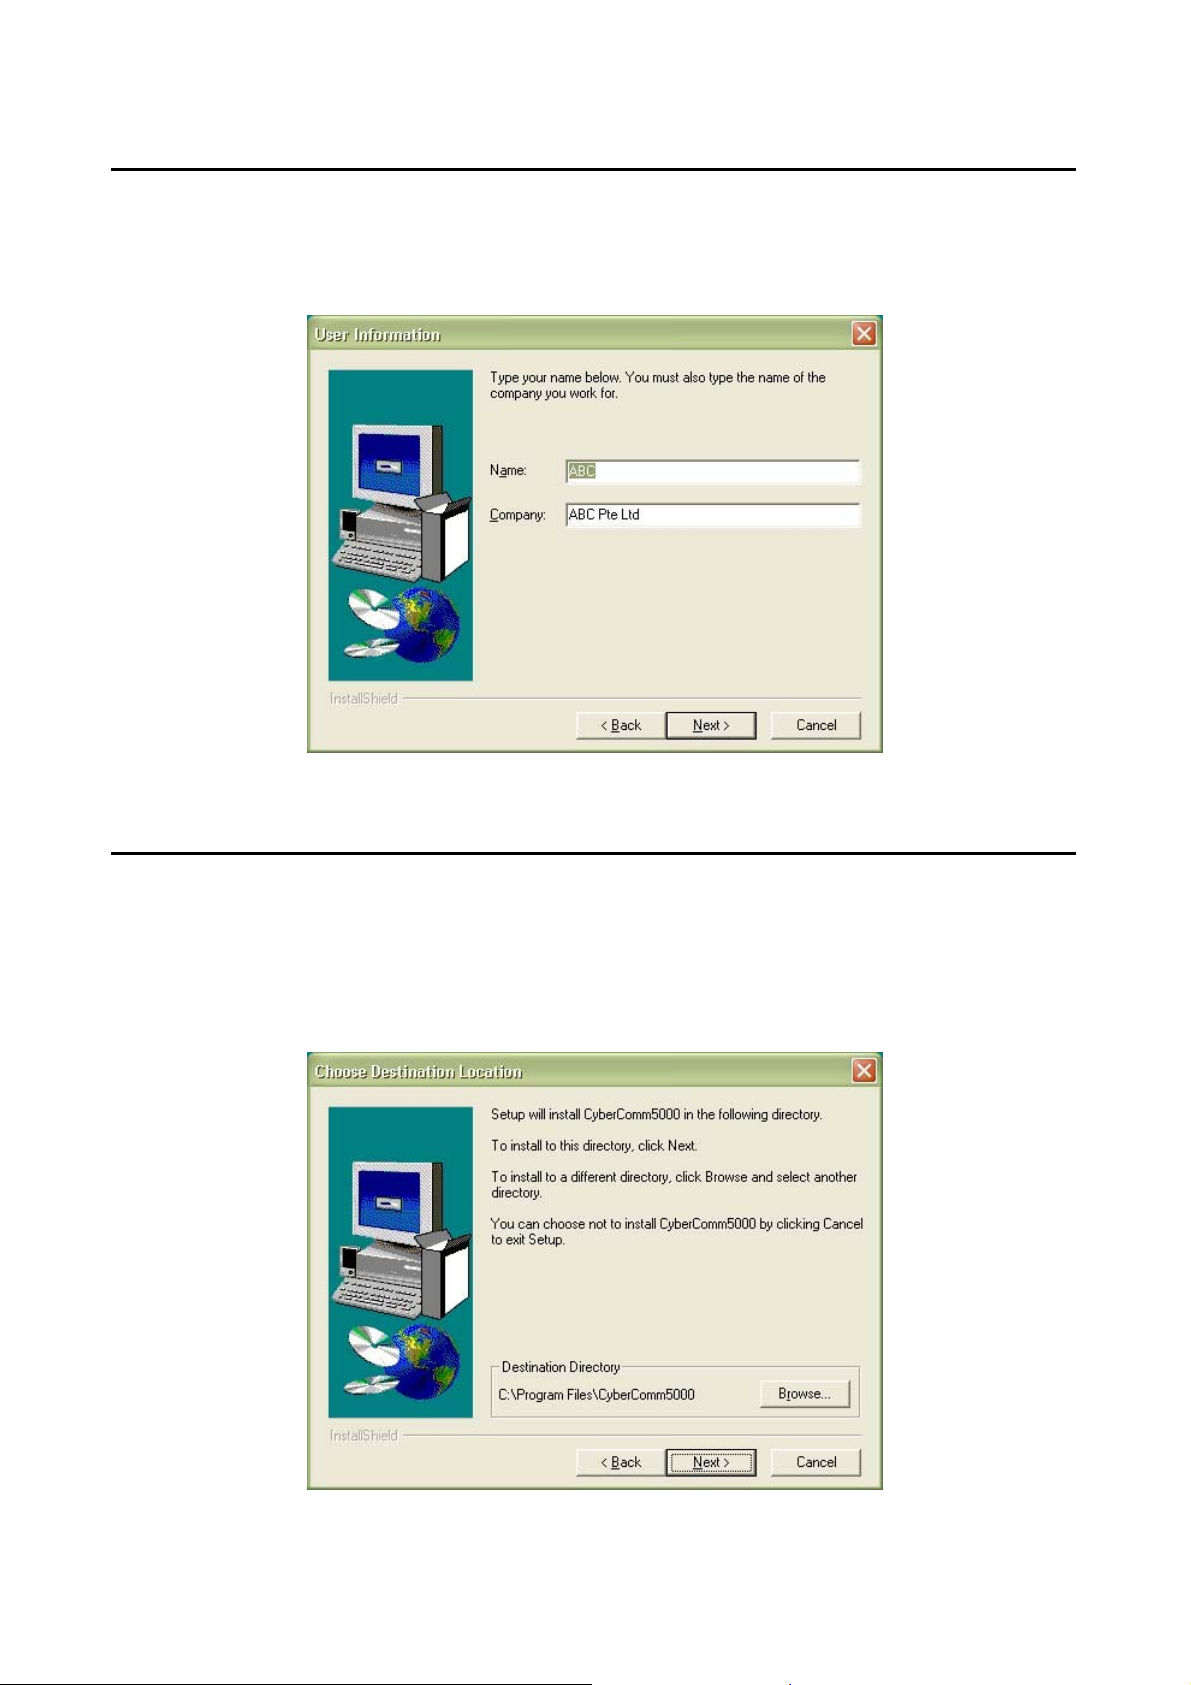
2.2 User Name and Organisation Entry
The CyberComm program (as below) prompts you to enter the name of the user and organization. See
Figure 2: User Information.
a) Key in the information in the respective fields.
b) Click Next to continue setup process. Click Back make changes to previous setup option.
Figure 2: User Information
2.3 Choose Destination Location
This setup option will install the CyberComm 5000 after the destination location is selected. See Figure 3:
Choose Destination Location.
a) Click Browse to select destination location.
b) Click Next to continue setup process. Click Back make changes to previous setup option.
Figure 3: Choose Destination Location
6
Page 7
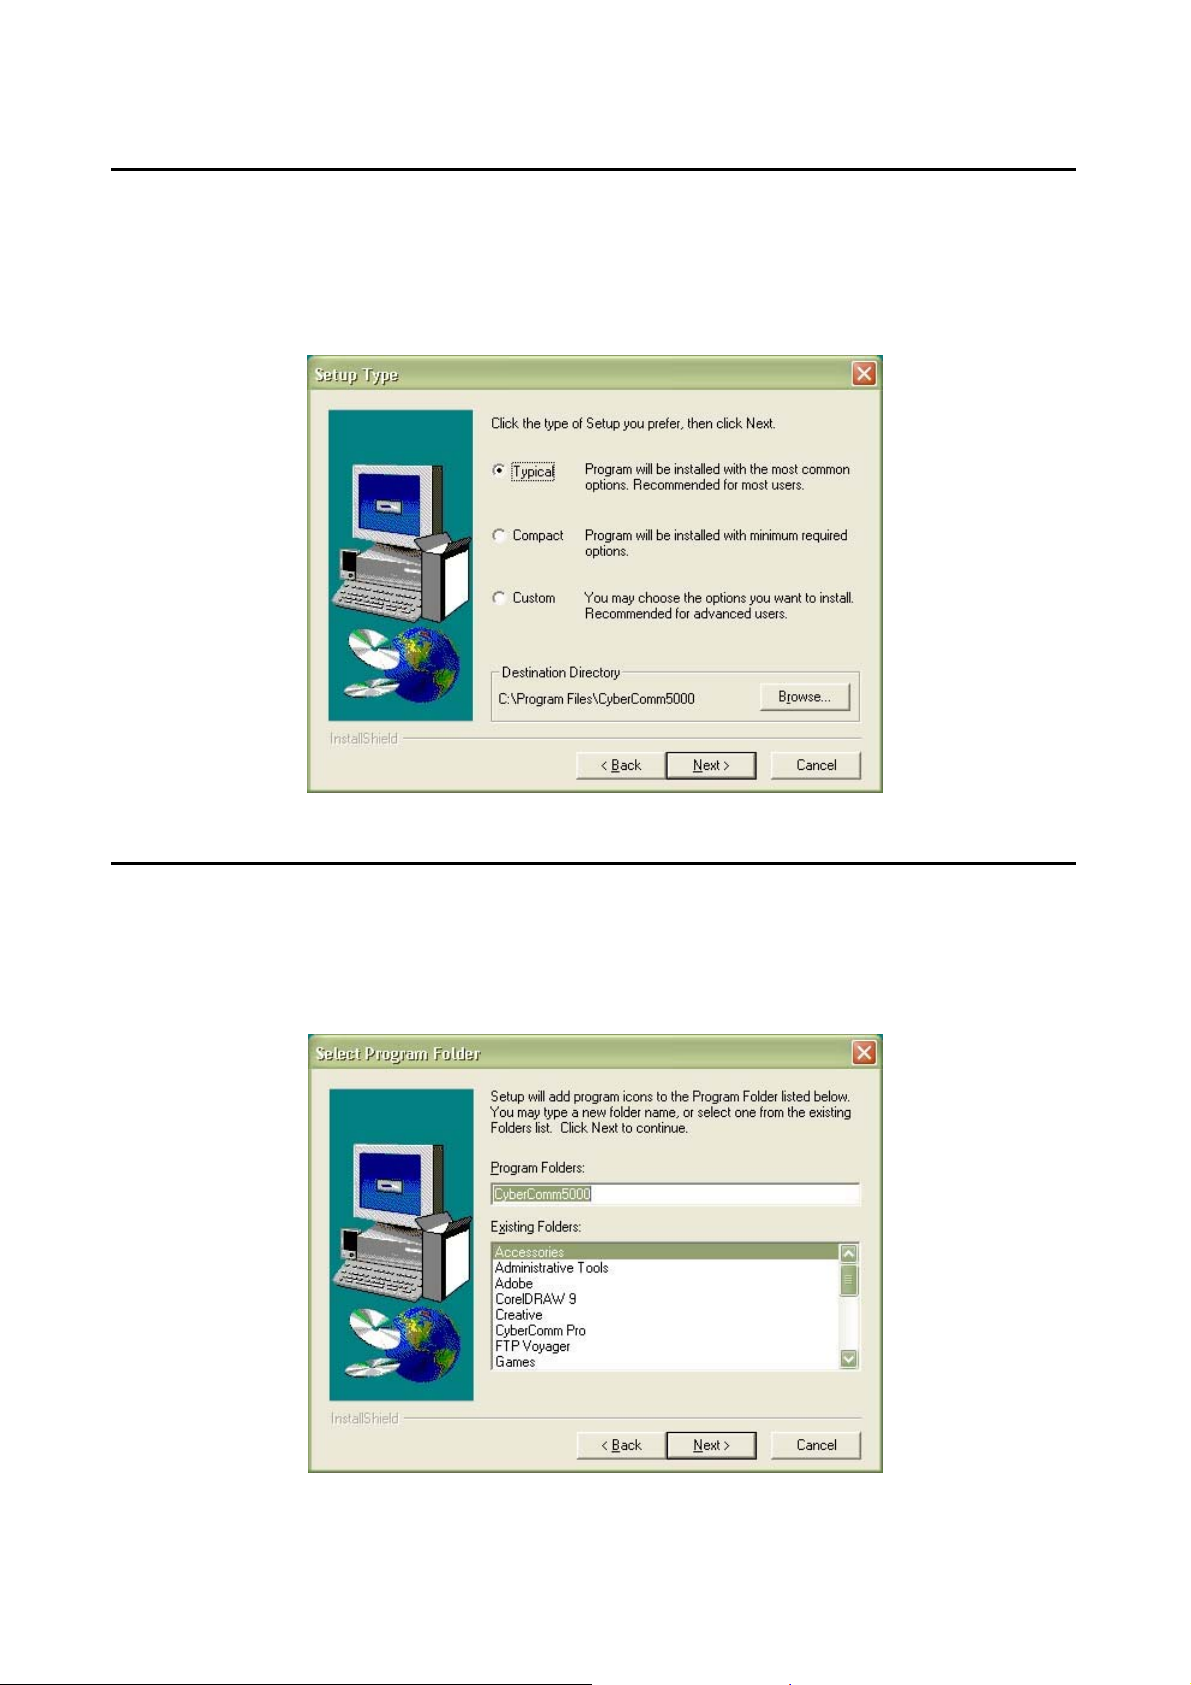
2.4 Setup Type
Select the setup type of the CyberComm 5000 preferred. Default is set as Typical. The destination directory
for the software to be located must be specified as well. See Figure 4: Setup Type.
a) Select Typical from the list of setup types.
b) Click Browse to select destination location.
c) Click Next to continue setup process. Click Back make change s to previous setup option.
Figure 4: Setup Type
2.5 Select Program Folder
Choose to have a new Program Folder or select one from the list of existing folders in which the CyberComm
5000 is to be located. Default is set as CyberComm 5000 to be named as a new Program Folder. See Figure
5: Select Program Folder.
a) Select to create a New Folder (e.g.: CyberComm 5000) or utilise an existing folder.
b) Click Next to continue setup process. Click Back make changes to previous setup option.
Figure 5: Select Program Folder
7
Page 8

2.6 Start Copying Files
This setup option displays the current settings selected in the previous setup options. See Figure 6: Start
Copying Files.
a) Click Next to continue setup process. Click Back make changes to previous setup option. Click Cancel
to terminate setup process.
Figure 6: Start Copying Files
2.7 Setup Completion
“Launch the program file” if you wish to use it instantaneously. Note: The file is now stored in your
designated hard-disk location. A shortcut of CyberComm 5000 will be created automatically on your desktop
upon setup completion. See Figure 7: Setup Complete.
a) Select to launch program file: CyberComm 5000.
b) Click Finish to complete setup process.
Figure 7: Setup Complete
8
Page 9
3 GETTING STARTED
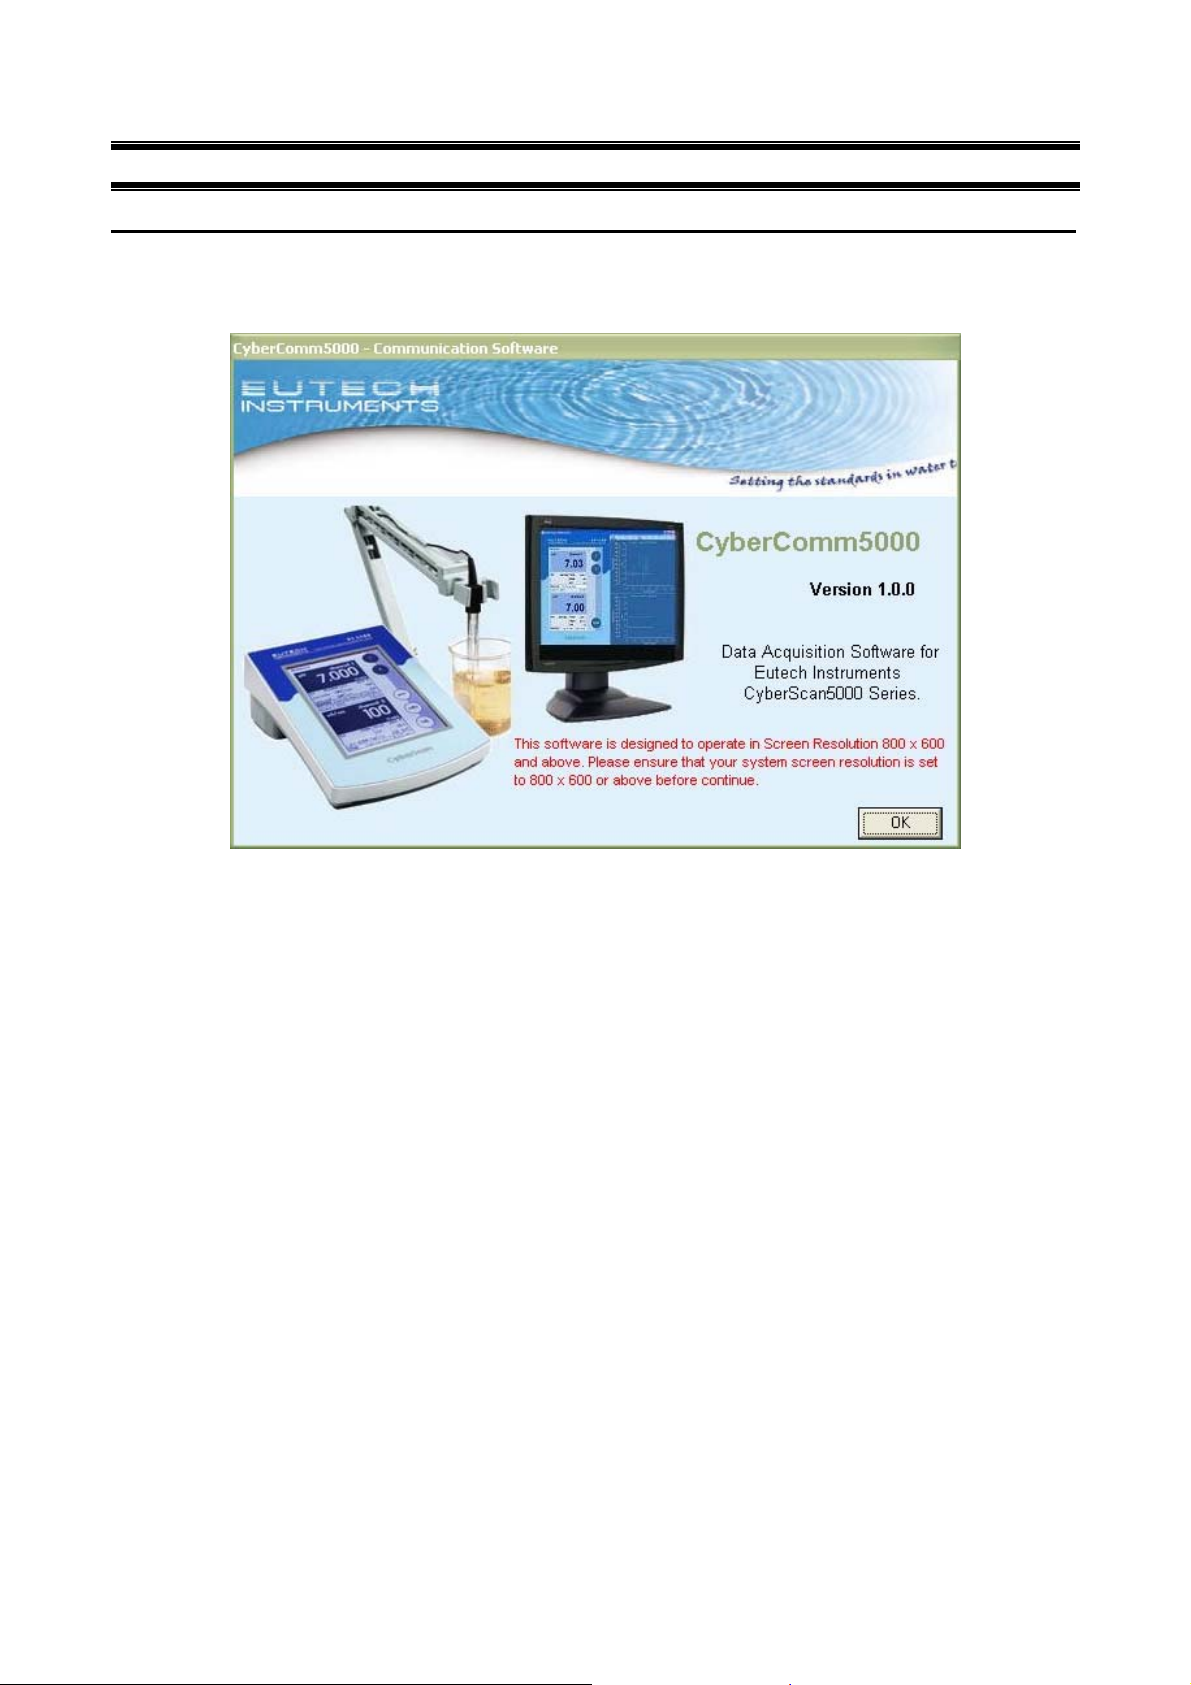
3.1 Welcome Screen
See Figure 8: Welcome Screen.
a) Click OK after assessing the information provided.
Figure 8: Welcome Screen
9
Page 10
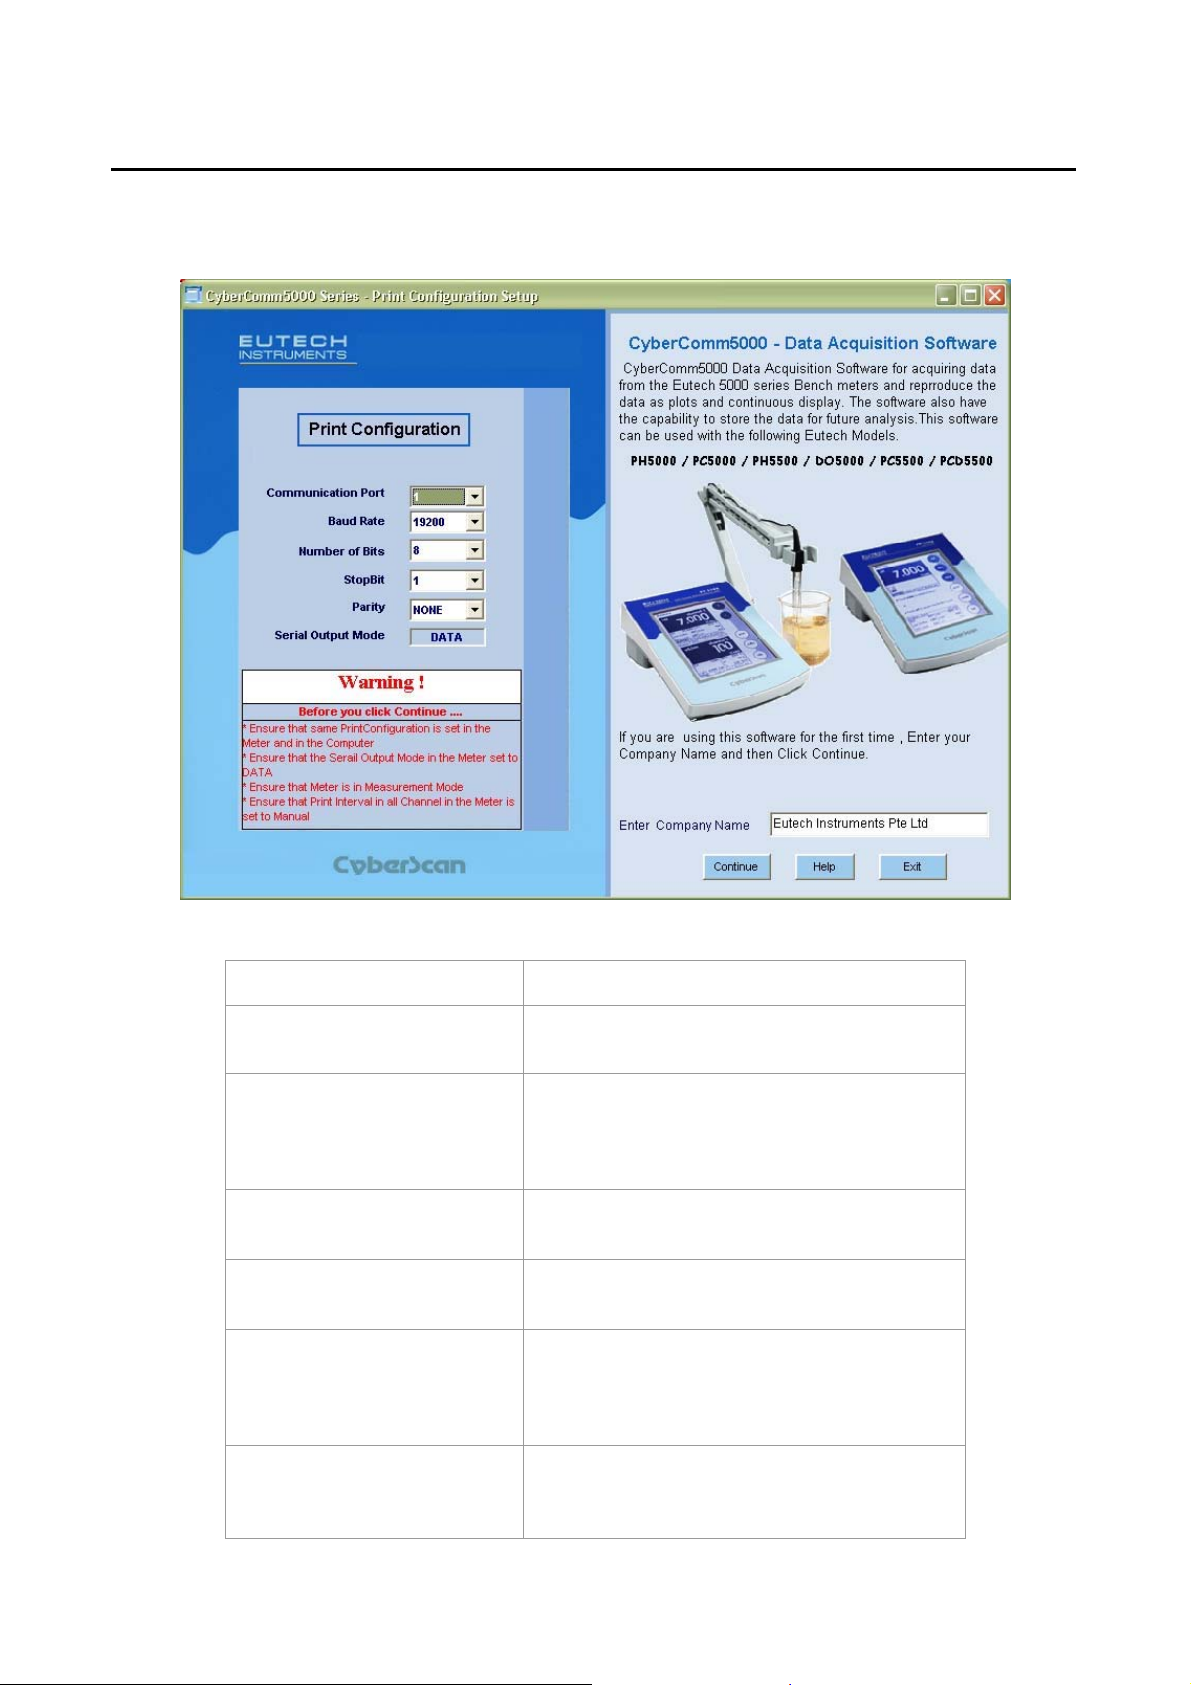
3.2 Print Configuration
See Figure 9: Print Configuration Setup.
Set the appropriate requirements for Print Configuration before connecting the meter.
Figure 9: Print Configuration Setup
Print Configuration Option Description
Communication Port
Connect using the preferred connection port
from the drop down menu; 1 or 2. Default is 1.
Baud Rate
Select preferred baud rate from the drop down
menu: 9600, 19200 and 38400. Default is
19200.
Number of Bits
Stop Bits
Select preferred Stop Bits from the drop down
menu; 7 or 8. Default is 8.
Select preferred Stop Bits from the drop down
menu; 1 or 2. Default is 1.
Parity
Select preferred parity from the drop down
menu: None (0), Odd (1) or Even (2). Default is
None (0).
Serial Output mode
Software default is set at DATA. Ensure meter
serial output mode is set at DATA.
10
Page 11
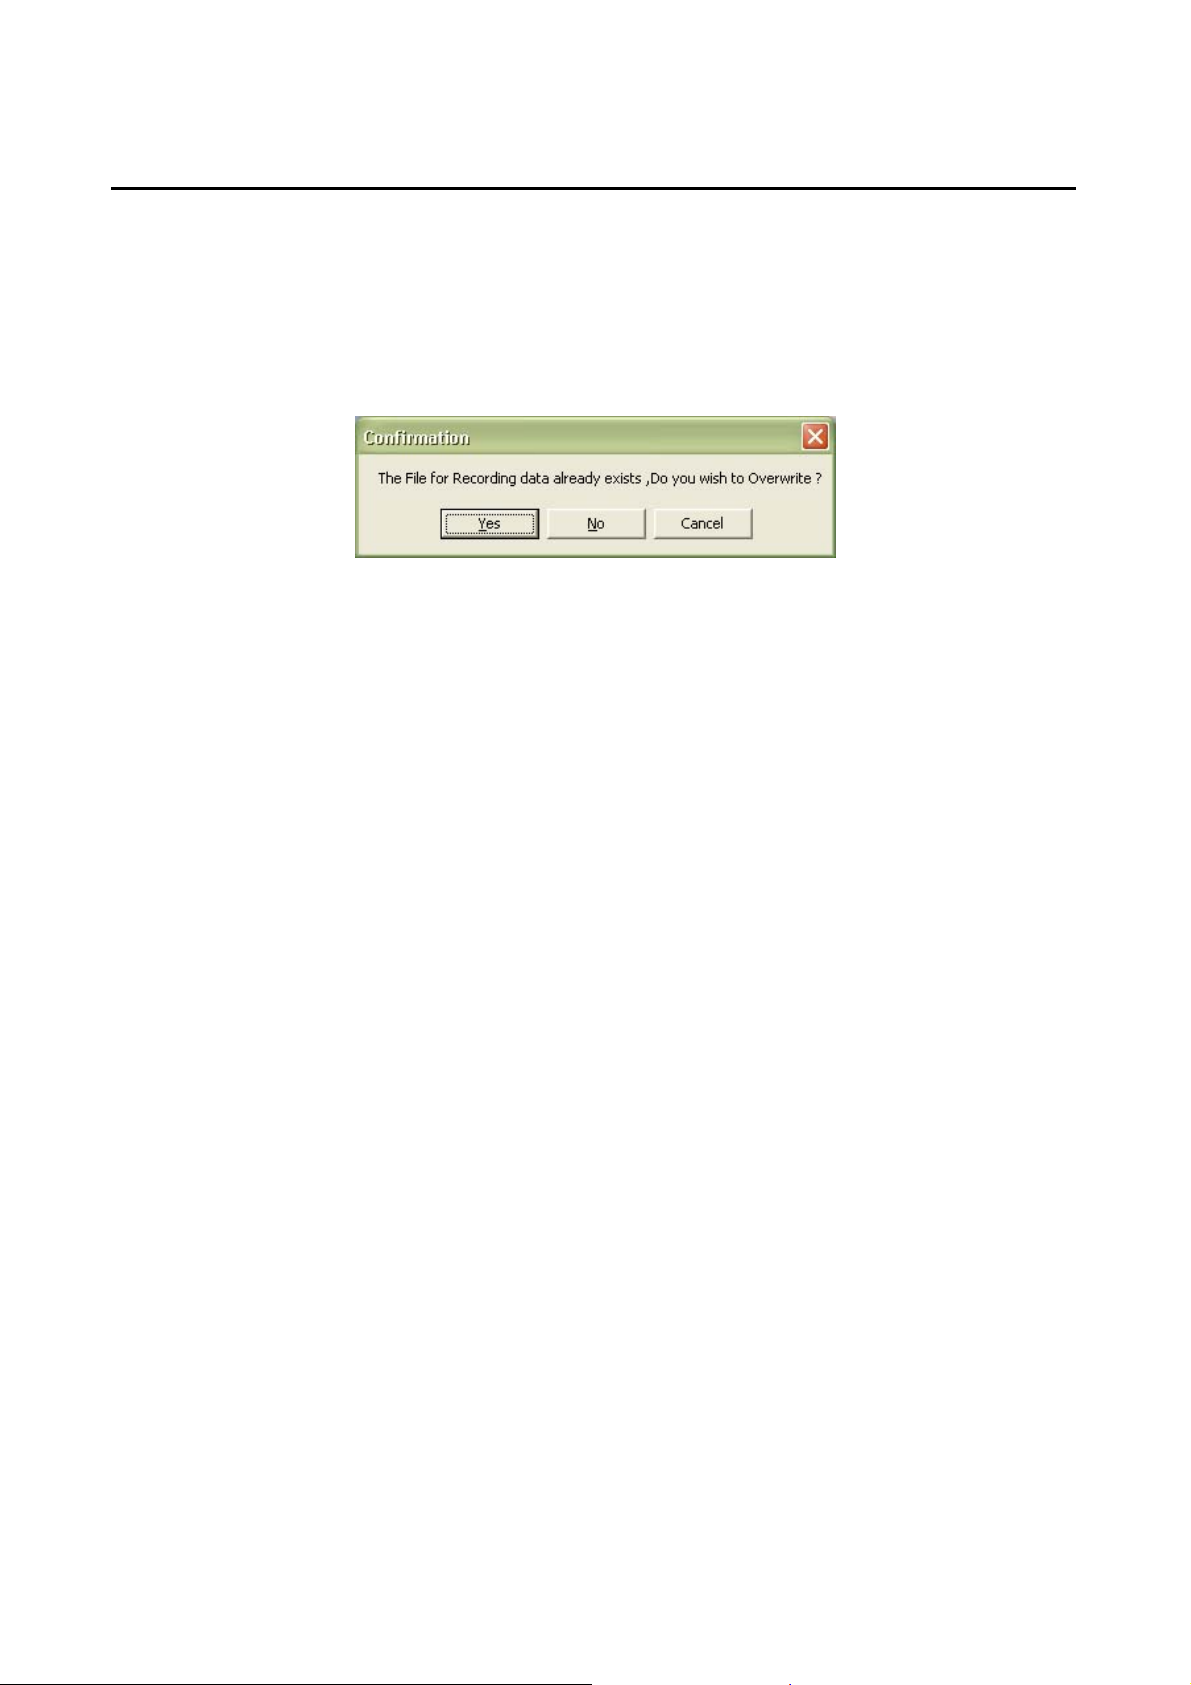
3.3 Confirmation Prompt
This Dialog box appears if from second DAS operation onwards, prompting user to overwrite on saved
measurement data or create another in the destinated directory. See Figure 10; Confirmation Prompt.
a) Click NO to create new measurement data. Go to Section 3.4: File Options, Page 12.
b) Click YES if you want to overwrite current saved data. Go to Section 3.5: Data File Information, Page
13.
c) Click Cancel if you do not want data to be saved.
Figure 10; Confirmation Prompt
11
Page 12
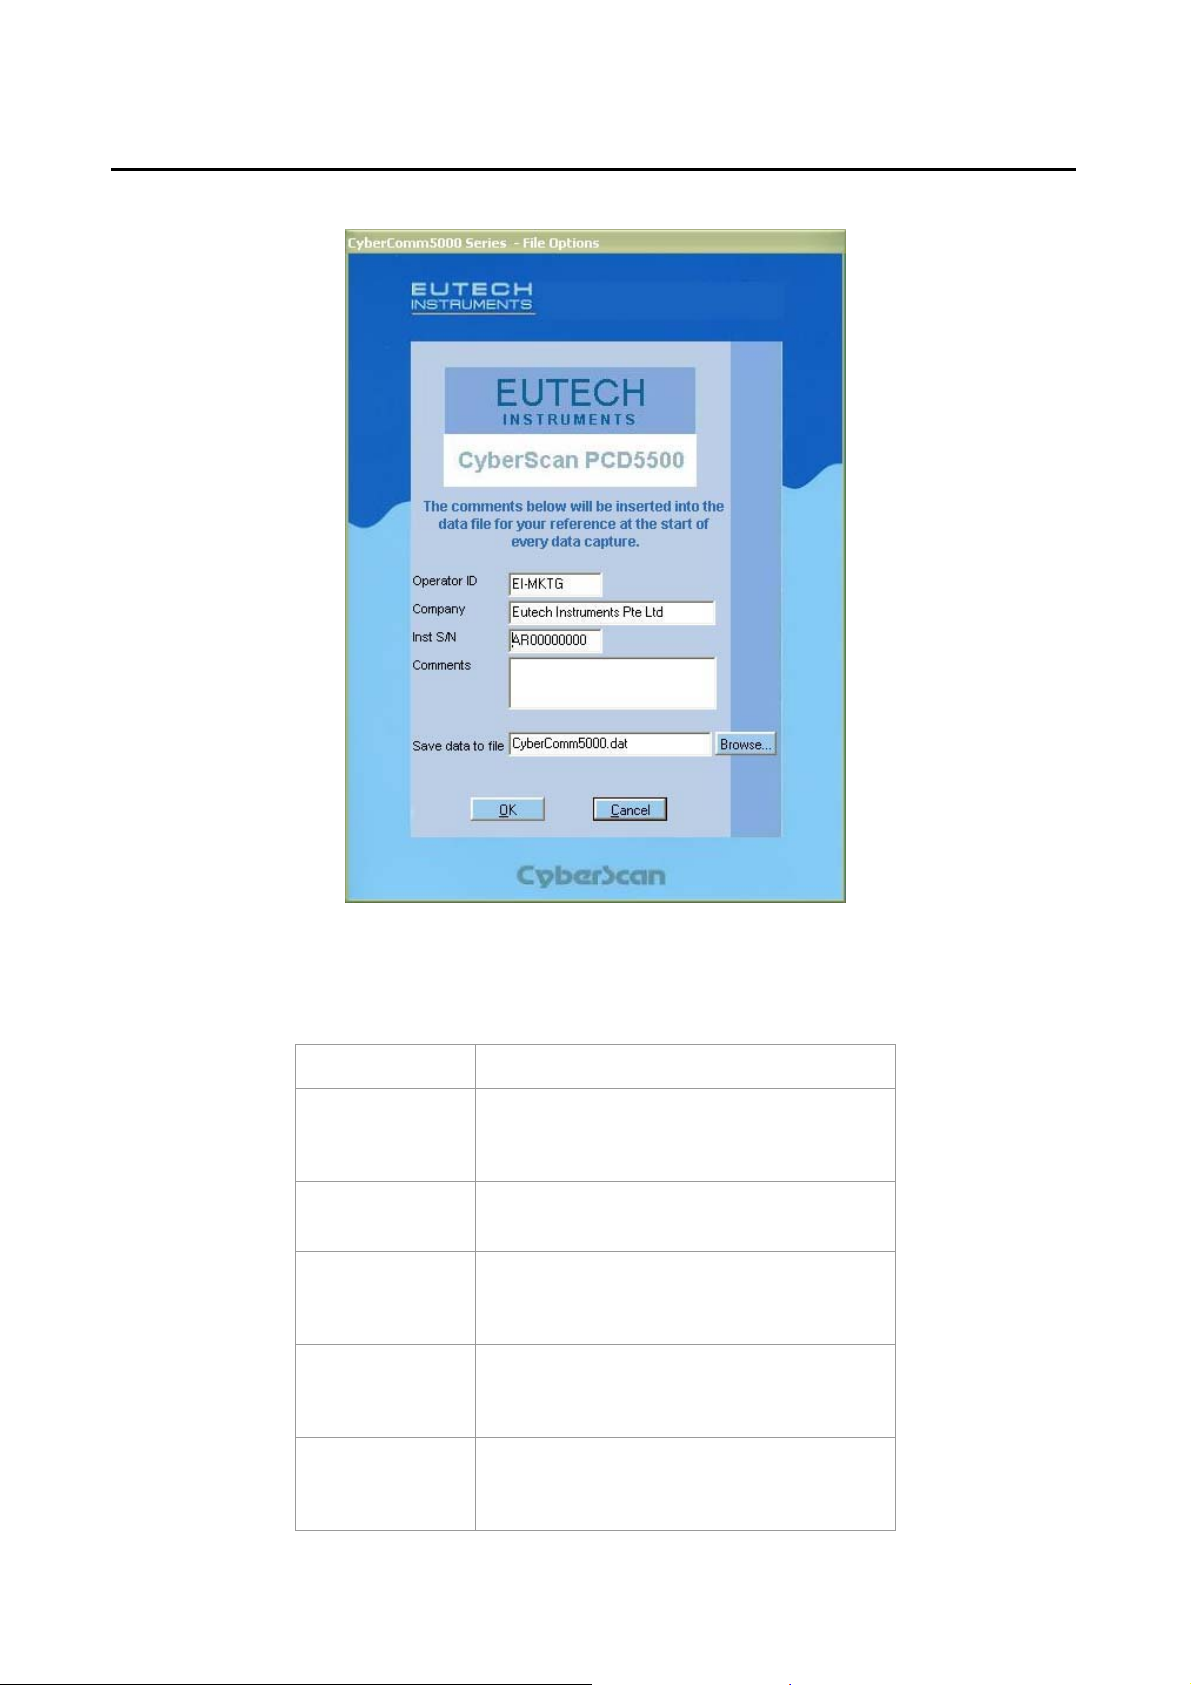
3.4 File Options
Clicking NO in Section 3.3: Confirmation Prompt will bring you to the File Options Screen.
Figure 11: File Options
This screen prompts user to enter information which will be inserted to the data file for reference at the start
of every data capture. See Figure 11: File Options.
Field Description
Operator ID
Identifies the user for every measurement
being conducted.
Company
Identifies the organisation of the user.
Inst S/N
The instrument’s serial number will be
reflected in reports generated.
Comments
Will be inserted to the data file for reference
at the start of every data capture.
Save Data to File
Assign the DAS to save data in the selected
destinated directory.
12
Page 13

3.5 Data File Information
Clicking YES in Section 3.3: Confirmation Prompt will bring you to the Data File Information Screen.
Figure 12: Data File Information
This screen displays the destination folder that eventual data will be saved as .dat format. See Figure 12:
Data File Information.
Single Channel Mode
This screen displays one channel’s data to be saved in the destination folder.
Dual Channel Mode
This screen displays both channels’ destination folders respectively.
13
Page 14

3.6 Mode Selection
See Figure 13: Standby Mode with Parameter Selection. The CyberScan PCD 5500 (as shown below)
allows you to select from several parameters (pH and Conductivity mode: pH, mV, Conductivity and Ion) (DO
mode selection: DO, BOD, OUR and SOUR). The selection of parameter modes depend on the meter
connected:
Meter Model
pH 5000 pH, mV
pH 5500 pH, mV, Ion
PC 5000 pH, mV, Conductivity
PC 5500 pH, mV, Conductivity, Ion
DO 5000 Dissolved Oxygen, BOD, SOUR, OUR
PCD 5500 pH, mV, Conductivity, Ion, Dissolved Oxygen, BOD, SOUR, OUR
Parameter Modes Available
Mode Selection
Dual Channel Selection
(For CyberScan pH 5500,
PC 5500 and PCD 5500
only)
Click to close/end DAS
operation
Figure 13: Standby Mode with Parameter Selection
14
Page 15

4 METER CONNECTED (SINGLE CHANNEL)
For CyberScan pH 5000, PC 5000 and DO 5000 which are single channel instruments, the DAS screen will
display a single parameter mode at one time. Select mode (Section 3.6: Mode Selection, Page 14) and the
current reading will be displayed respectively.
See
Figure 14: pH Measurement Mode- Single Channel.
Plot 1 shows Current Mode (pH, mV, conductivity, ion etc.) measurement graph on Channel 1 and Plot 2
shows Current measurement graph (Temperature).
Figure 14: pH Measurement Mode- Single Channel (pH 5000/5500, PC 5000/5500)
15
Page 16

Figure 15: Dissolved Oxygen Measurement mode- Single Channel (DO 5000, PCD 5500)
16
Page 17

5 EXPORT DISSOLVED OXYGEN MEASUREMENT RESULTS (FOR CYBERSCAN
DO 5000 & PCD 5500 ONLY)
5.1 To export BOD Results to CyberComm 5000
Select to go to DO mode on CyberComm 5000 (See Figure 16 ), click on BOD button to display screen as
shown in Figure 17.
Figure 16: Dissolved Oxygen (DO) Standby Mode
Figure 17: BOD Mode
17
Page 18

From the meter
Press BOD button during the BOD measurement mode on the meter. A screen on the meter will prompt to
enter a Bottle ID number that was saved previously. BOD Results will be shown as below on the meter. See
Figure 18.
BOD Results
mg/L
5
Seed ID: E1
Predilution:
Seed Volume:
NA
80 ml
Bottle Volume:
Initial DO:
Final DO:
Delta DO:
Figure 18: BOD Results screen displayed on meter
Press print to export BOD results to CyberComm 5000.
OK
150 ml
8.47 mg/L
5.86 mg/L
2.60 mg/L
print
18
Page 19

BOD Results information will be displayed on the CyberComm 5000 screen as shown below. See Figure 19.
Figure 19: BOD Results on CyberComm 5000
19
Page 20

5.2 To export OUR Results to CyberComm 5000
Select to go to DO mode on CyberComm 5000 (See Figure 16 ), click on OUR button to display screen as
shown in Figure 17.
Figure 20: OUR Mode
From the meter
Press OUR button from the DO mode main screen to go to OUR measurement mode. Press start to start
OUR measurement. See Figure 21. Press print to export OUR results to CyberComm 5000.
Measure - OUR (RUNNING)
mg/L/hr
0.00
1:35
STND
Not Standardized
z
Touch to begin measurement
stop
or
Touch to access stan dardize mode
std
z
August 12, 2002 9.32am
ID# ATC
autocal Salinity
mg/L mmHg
ON 0.0 ppt
1.28 732
STABLE
25.0°C
stop
Figure 21: OUR Measurement mode on meter
20
Page 21

OUR Results information will be displayed on the CyberComm 5000 screen as shown below. See Figure 22.
Figure 22: OUR Results on CyberComm 5000
21
Page 22

5.3 To export SOUR Results to CyberComm 5000
Select to go to DO mode on CyberComm 5000 (See Figure 16 ), click on SOUR button to display screen as
shown in Figure 23.
Figure 23: SOUR Mode
From the meter
Press SOUR button from the DO mode main screen to go to SOUR measurement mode. Press start to start
SOUR measurement. See Figure 21. Press print to export SOUR results to CyberComm 5000.
Measure - SOUR (RUNNING)
mg/hr/g
0.00
1:35
STND
Not Standardized
z
Touch to begin measurement
stop
or
Touch to access standardize mode
std
z
August 12, 2002 9.32am
ID# ATC
autocal salinity
mg/L mmHg
ON 0.0 ppt
1.28 732
STABLE
25.0°C
stop
Figure 24: SOUR Measurement mode on meter
22
Page 23

SOUR Results information will be displayed on the CyberComm 5000 screen as shown belo w. See Figure
25.
Figure 25: SOUR Results on CyberComm 5000
23
Page 24

6 MENU BAR
Figure 26: Menu Bar- Same for Single and Dual Channel Meters
Menu Button Description
Start/ Stop tracking
To stop current measurement and the DAS will immediately stop the data
recording. The button will change to ‘Start Tracking’ when Stop Tracking
mode is ON.
You are able to toggle between start and stop at any point of the
measurement to record data.
Zoom In/Out
These two buttons are for optimised view of the measurement graphs.
Click on the respective button to execute task.
Default
Click to have the display go to original settings.
Show Data
Click to view recorded data values in table format. The button will be
inactive when ‘Graph Value’ is ON.
Graph Value
Click to view recorded data values in graph format. The button will be
inactive when ‘Show Data’ is ON.
Copy Plot 1/ Plot 2 Click to copy the selected plot and paste it in other compatible application.
Print Plot1/ Plot 2
Click to print the selected plot via connected printer.
24
Page 25

6.1 Data Results Recording
When Show Data menu button is active, the display shows the values recording from the measurement
along with other information (time, temperature, slope etc) in a tabular format. See Figure 27: Data ResultsSingle Channel.
Data is captured approximately every 1 second upon start of measurement by default.
NOTE: Never touch the meter when the DAS is in operation.
Figure 27: Data Results- Single Channel
25
Page 26

7 COPY & PRINT PLOTS
7.1 Copy Plot
Select from the menu bar the function to be carried out. Select to Copy Plot 1 or Copy Plot 2.
See Figure 28: Copied plot in Word doc.
The figure below shows an example of copying a plot and pasting in a Microsoft word (.doc) document.
Figure 28: Copied plot in Word doc.
The DAS is capable of transferring the copied information to compatible applications.
Note:
Only one plot can be copied at a time.
26
Page 27

7.2 Print Plot
Select from the menu bar the function to Print Plot 1 or Print Plot 2.
See Figure 29: Print plot information. The figure below shows an example of printing a selected plot and the
print screen generated after this command. The selected information will be sent to the default printer on
your system for printing.
Note:
Only one plot can be printed at a time.
Figure 29: Print plot information
27
Page 28

8 METER CONNECTED (DUAL CHANNEL)
8.1 Channel Configuration (For Dual Channel meters only)
See Figure 30: Measurement mode: Dual Channel. Two display screens for respective parameters can be
viewed when dual channel selection is made on the meter. Select from the CyberComm 5000 screen for
Single OR Dual channel display.
a) Click 1 to display Channel 1 only.
(Plot 1 shows Channel 1 parameter readings and Plot 2 shows temperature readings)
b) Click 2 to display Channel 2 only.
(Plot 1 shows Channel 2 parameter readings and Plot 2 shows temperature readings)
c) Click Dual to display both channels (Dual button appears only in Mode Selection screen, page 14).
(Plot 1 shows Channel 1 parameter and temperature readings and Plot 2 shows Channel 2 parameter
readings and temperature readings)
8.2 Functions from Menu Bar
The current readings and data plots will be displayed whilst measurement is con ducted.
Select the functions to be executed from the menu bar same for the single channel mode of this program.
Figure 30: Measurement mode: Dual Channel
28
Page 29

8.3 Data Results Recording
See Figure 31: Data Results- Dual Channel. When Show Data menu button is active, the display shows the
values recording from the measurement along with other information (time, temperature, slope etc) in a
tabular format.
Data is captured approximately every 1 second upon start of measurement by default.
NOTE: Never touch the meter when the DAS is in operation.
Figure 31: Data Results- Dual Channel
29
Page 30

8.4 Copy & Print Plot
See Section 7: COPY & PRINT PLOTS, Page 26.
Select from the menu bar the function to be carried out. Select to Copy/ Print Plot 1 or 2.
The DAS is capable of transferring the copied information to compatible applications.
Note:
Only one plot can be copied/ printed at a time.
30
Page 31

9 MEASUREMENT MODE OVERVIEW
Plot 1
Graph Value
Use cursor to drag value line to show
the value at any point of
Menu Bar
Click respective button to execute the task.
measurement.
For Chann el 1
Title of Graph
Plot 2
For Ch an nel 2
Measurement Readings
only)
Channel Selection
12
Select or to switch screens
between Channel 1 and 2. Click
(Available in Dual Channel Meters
Figure 32: Measurement mode Overview
Last Calibration Done
to show both channels.
Dual
Current Date and Time
Current Measurement Value
Close Button
Click this button to
end DAS operation.
Perfor med
information
Sample ID & other
Scrolling Text Box
Last Standardization
to ease DAS operation.
Displays prom pts and information
31
Page 32

10 RETRIEVE SAVED DATA
10.1 Display data in Notepad program
a) Open up the Notepad program.
b) Go to File menu
c) Select Open
d) Select Program Files folder from the hard disk drive
e) Select CyberComm 5000 folder
f) Select CyberComm 5000
g) Select the ”.dat” file which you have saved your data readings.
See Figure 12: Data File Information
h) Double click on the selected “.dat” file
i) Data saved will be shown as per Figure 33: Data Results Report in Notepad .txt below.
Figure 33: Data Results Report in Notepad .txt
32
Page 33

10.2 Import Data Readings into Microsoft Excel©
You are able to view the Data Readings in a Microsoft
Excel© spreadsheet.
10.2.1 Steps to import data readings from a Microsoft Excel
In Microsoft Excel,
a) Go to File menu
b) Select Open
c) Select Program Files folder from the hard disk drive
d) Select CyberComm 5000 folder
e) Select CyberComm 5000
f) Select the ”.dat” file which you have saved your data readings
g) Double click on the selected “.dat” file
NOTE: The ‘Files of Type’ should be selected at ‘All Files (*.*)’.
See Figure 34.
©
worksheet:
Figure 34: Excel- File Open
33
Page 34

10.2.2 Text Import Wizard- Step 1 of 3
Once you open a “.dat” file from the CyberComm 5000 folder, a screen will appear. See Figure 35.
Fields
Delimited/ Fixed width
Default: ‘Delimited’
Select between delimited and fixed width for the preferred output layout of the file.
Start import at row
Default = ‘1’
Select the row of data to start importing into the Microsoft Excel
©
worksheet
File Origin:
Default: ‘Windows (ANSI)’
Figure 35: Step 1 of 3
34
Page 35

10.2.3 Text Import Wizard- Step 2 of 3
See Figure 36.
Fields
Delimiters
Default: ‘Tab’
Select ‘Comma’
Treat consecutive delimiters as one
Default: ‘Unchecked’
Text qualifier
Default: ‘*’
Figure 36: Step 2 of 3
35
Page 36

10.2.4 Text Import Wizard- Step 3 of 3
See Figure 37.
Fields
Column data format
Default: ‘General’
Advanced Text Import Wizard
See Figure 38.
Fields
Decimal Separator
Default: ‘.’
Thousands Separator
Default: ‘,’
Click OK to confirm and exit.
Figure 38: Advanced Text Import Settings
Click Finish to end the Text Import Wizard.
Figure 37: Step 3 of 3
36
Page 37

Figure below shows CyberComm data presented on a Microsoft Excel
©
worksheet. See Figure 39.
Figure 39: Excel Worksheet with imported “.dat” data
37
Page 38

11 ERROR MESSAGES AND PROMPTS
11.1 Communication Error
This error message appears when
a) An incompatible meter is connected
b) RS232 Cable is not connected
c) Mismatch in the communication settings
d) Meter not in measurement mode.
Figure 40: Communication Error
11.2 Print Configuration Settings Error
Meter’s print configuration’s serial output must be set at DATA. DATA is set as default for the CyberComm
5000.
Figure 41: Print Configuration Error
11.3 No Model Detected
This error message appears when an incompatible instrument is connected to the computer.
Figure 42: No model detected
11.4 Save Settings
Screen prompts to save the current settings or not.
Figure 43: Save Settings
38
Page 39

12 PRINT READINGS
12.1 Printing using a serial printer
Connect the CyberScan Series 5000 meter to the serial printer via RS232C cable (refer to the list of
accessories). The configuration of the RS232C port is as shown below.
Pin Number Description
1 2 Transmit Data
3 Receive Data
4 DSR (Data Send Ready)
5 GND (Ground)
6 7 8 RTS (Request to Send)
9 -
12.2 Setting Up the Printer
If the printer has a 25-pin connector, a 25-pin to 9-pin converter will have to be used. Use the following
configuration:
Pin of Meter Pin Number of Printer
2 (TXD) 3 (RXD)
4 (DSR) 20 (DTR)
5 (GND) 7 (GND)
12.3 Connecting the Cable to the Computer
a) If the computer has a 9-pin connector, insert the cable (EC-CA01M09F09) provided into the socket of the
computer, taking note of the gender of the two connectors.
b) If the computer has a 25-pin connector, use a 9-pin to 25-pin, male/ female converter with 9 pins and 25
holes for connection. This converter can be obtained from any computer store.
39
Page 40

For more information on Eutech Instruments products, contact your nearest distributor or visit our website
listed below:
Eutech Instruments Pte Ltd.
Blk 55, Ayer Rajah Crescent,
#04-16/24 Singapore 139949
Tel: (65) 6778 6876
Fax: (65) 6773 0836
E-mail: marketing@eutechinst.com
Web-site: http://www.eutechinst.com
Distributed by:
 Loading...