

Page 1
Circuit Protection & Control
Flow Meter FC01-LQ
User handbook
M_FC01_LQ_0408_eM_FC01_LQ_0408_e
Page 2

Please follow these installation and adjustment instructions carefully. Failure to comply with
these instructions or misuse of this equipment will void your warranty coverage.
The instructions cover software version 1.00.
Equipment installation, connection and adjustment by qualified personnel only!
Page 3

Table of content
1 Description . . . . . . . . . . . . . . . . . . . . . . . . . . . . . . . . . . . . . . . . . . . . . . . . . . . . . . . . . . . . 1
1.1 Calorimetric monitoring procedure . . . . . . . . . . . . . . . . . . . . . . . . . . . . . . . . . . . . . . . 2
1.2 System description . . . . . . . . . . . . . . . . . . . . . . . . . . . . . . . . . . . . . . . . . . . . . . . . . . . 3
1.2.1 User interfaces . . . . . . . . . . . . . . . . . . . . . . . . . . . . . . . . . . . . . . . . . . . . . . . . 4
2 Installation . . . . . . . . . . . . . . . . . . . . . . . . . . . . . . . . . . . . . . . . . . . . . . . . . . . . . . . . . . . 6
2.1 Selection of material . . . . . . . . . . . . . . . . . . . . . . . . . . . . . . . . . . . . . . . . . . . . . . . . . . 6
Stainless steel 1.4571 / AISI 316 Ti . . . . . . . . . . . . . . . . . . . . . . . . . . . . . . . . 6
Nickel-based alloy (Hastelloy 2.4610) . . . . . . . . . . . . . . . . . . . . . . . . . . . . . . 6
2.2 Installation of the monitoring heads . . . . . . . . . . . . . . . . . . . . . . . . . . . . . . . . . . . . . . 7
2.2.1 Insertion head CSP-11 for sensor adapter TP-.. and ball valve BV-.. . . . . . . 7
2.2.1.1 Sensor adapter TP-.. . . . . . . . . . . . . . . . . . . . . . . . . . . . . . . . . . . . 8
2.2.1.2 Mounting instructions for monitoring head CSP-.. with
sensor adapter TP-.. . . . . . . . . . . . . . . . . . . . . . . . . . . . . . . . . . . . . 8
2.2.1.3 Ball valve BV-.. . . . . . . . . . . . . . . . . . . . . . . . . . . . . . . . . . . . . . . . . 9
2.2.2 Monitoring head CSF-11 with adjustable immersion depth . . . . . . . . . . . . . 10
2.2.2.1 Mounting instructions for monitoring head CSF-11 . . . . . . . . . . . 11
2.2.3 Electrical connection . . . . . . . . . . . . . . . . . . . . . . . . . . . . . . . . . . . . . . . . . . . 13
2.3 Installation of electronic control unit FC01-LQ . . . . . . . . . . . . . . . . . . . . . . . . . . . . . 14
2.3.1 Mechanical installation
2.3.1.1 Rail-mounted version FC01-LQ-U1... . . . . . . . . . . . . . . . . . . . . . . 14
2.3.1.2 Surface mounted version FC01-LQ-FH-U1... . . . . . . . . . . . . . . . . 15
2.3.1.3 Front panel mounted version FC01-LQ-ST-U1... . . . . . . . . . . . . . 16
2.3.2 Electrical connection . . . . . . . . . . . . . . . . . . . . . . . . . . . . . . . . . . . . . . . . . . . 17
2.3.2.1 Circuit diagram FC01-LQ 24 V (relay outputs) . . . . . . . . . . . . . . . 20
2.3.2.2 Circuit diagram FC01-LQ 24 V (transistor outputs) . . . . . . . . . . . 21
2.3.2.3 Electrical connection - frequency output
(version FC01-LQ-U1T4) . . . . . . . . . . . . . . . . . . . . . . . . . . . . . . . . 22
3 Operating system . . . . . . . . . . . . . . . . . . . . . . . . . . . . . . . . . . . . . . . . . . . . . . . . . . . . . 24
Keypads MODE, UP and DOWN
. . . . . . . . . . . . . . . . . . . . . . . . . . . . . . 24
Menu paging . . . . . . . . . . . . . . . . . . . . . . . . . . . . . . . . . . . . . . . . . . . . . . . . . . . . . . . 25
Calling a menu option . . . . . . . . . . . . . . . . . . . . . . . . . . . . . . . . . . . . . . . . . . . . . . . . 25
Entry of numerals . . . . . . . . . . . . . . . . . . . . . . . . . . . . . . . . . . . . . . . . . . . . . . . . . . . . 25
Transfer of entries . . . . . . . . . . . . . . . . . . . . . . . . . . . . . . . . . . . . . . . . . . . . . . . . . . . 25
Deleting data . . . . . . . . . . . . . . . . . . . . . . . . . . . . . . . . . . . . . . . . . . . . . . . . . . . . . . . 25
M
▲
▼
Page 4

4 Operation and main menu . . . . . . . . . . . . . . . . . . . . . . . . . . . . . . . . . . . . . . . . . . . . 26
4.1 Switch-on performance . . . . . . . . . . . . . . . . . . . . . . . . . . . . . . . . . . . . . . . . . . . . . . 26
4.2 Measuring cycle . . . . . . . . . . . . . . . . . . . . . . . . . . . . . . . . . . . . . . . . . . . . . . . . . . . . . 26
4.2.1 Operating data . . . . . . . . . . . . . . . . . . . . . . . . . . . . . . . . . . . . . . . . . . . . . . . 27
4.2.1.1 Measured value(s) . . . . . . . . . . . . . . . . . . . . . . . . . . . . . . . . . . . . . 27
4.2.1.2 Peak values (PEAK VALUE MIN / PEAK VALUE MAX.) . . . . . . . . . 28
4.2.1.3 Last error (LAST ERROR) . . . . . . . . . . . . . . . . . . . . . . . . . . . . . . . 28
4.2.1.4 Main menu . . . . . . . . . . . . . . . . . . . . . . . . . . . . . . . . . . . . . . . . . . . 29
5 Configuration (CONFIGURATION) . . . . . . . . . . . . . . . . . . . . . . . . . . . . . . . . . . . . . . 30
5.1 Selection of monitoring head (SENSOR SELECT) . . . . . . . . . . . . . . . . . . . . . . . . . . 30
5.2 Monitoring head data (SENSOR CODE) . . . . . . . . . . . . . . . . . . . . . . . . . . . . . . . . . . 30
5.3 Limit switch combination (LIMIT SWITCHES) . . . . . . . . . . . . . . . . . . . . . . . . . . . . . . 31
5.4 Flow rate unit (FLOW UNIT) . . . . . . . . . . . . . . . . . . . . . . . . . . . . . . . . . . . . . . . . . . . . 32
5.5 Medium temperature unit (TEMP. UNIT) . . . . . . . . . . . . . . . . . . . . . . . . . . . . . . . . . . 32
5.6 Display (DISPLAY SELECT) . . . . . . . . . . . . . . . . . . . . . . . . . . . . . . . . . . . . . . . . . . . . 32
5.7 Bar graph (BARGRAPH) . . . . . . . . . . . . . . . . . . . . . . . . . . . . . . . . . . . . . . . . . . . . . . 33
5.8 Pipe diameter (PIPE SIZE) . . . . . . . . . . . . . . . . . . . . . . . . . . . . . . . . . . . . . . . . . . . . . 34
5.9 Frequency output and totalizer (FREQUENCY OUTPUT) . . . . . . . . . . . . . . . . . . . . . 34
5.10 Analogue output - flow rate (ANA OUT FLOW) . . . . . . . . . . . . . . . . . . . . . . . . . . . . . . 35
5.11 Analogue output - medium temperature (ANA OUT TEMP.) . . . . . . . . . . . . . . . . . . . 35
5.12 Quitting the configuration menu . . . . . . . . . . . . . . . . . . . . . . . . . . . . . . . . . . . . . . . . 35
5.13 Configuration menu . . . . . . . . . . . . . . . . . . . . . . . . . . . . . . . . . . . . . . . . . . . . . . . . . . 37
5.14 Configuration submenus . . . . . . . . . . . . . . . . . . . . . . . . . . . . . . . . . . . . . . . . . . . . . . 38
6 Parameter selection (PARAMETERS) . . . . . . . . . . . . . . . . . . . . . . . . . . . . . . . . . . . 41
6.1 Measuring time (MEAS. TIME) . . . . . . . . . . . . . . . . . . . . . . . . . . . . . . . . . . . . . . . . . . 41
6.2 Limit switch 1 ON/OFF value (LS1 ON, LS1 OFF) . . . . . . . . . . . . . . . . . . . . . . . . . . . 41
6.3 Limit switch 2 ON/OFF value (LS2 ON, LS2 OFF) . . . . . . . . . . . . . . . . . . . . . . . . . . . 42
6.4 Scaling factor (FLOWSCALE) . . . . . . . . . . . . . . . . . . . . . . . . . . . . . . . . . . . . . . . . . . 42
6.5 Quitting the parameter menu . . . . . . . . . . . . . . . . . . . . . . . . . . . . . . . . . . . . . . . . . . . 43
6.6 Parameter selection menu . . . . . . . . . . . . . . . . . . . . . . . . . . . . . . . . . . . . . . . . . . . . . 44
7 Errors . . . . . . . . . . . . . . . . . . . . . . . . . . . . . . . . . . . . . . . . . . . . . . . . . . . . . . . . . . . . . . . .45
7.1 Test and diagnosis . . . . . . . . . . . . . . . . . . . . . . . . . . . . . . . . . . . . . . . . . . . . . . . . . . . 45
7.1.1 Priority group I . . . . . . . . . . . . . . . . . . . . . . . . . . . . . . . . . . . . . . . . . . . . . . . . 45
7.1.2 Priority group II . . . . . . . . . . . . . . . . . . . . . . . . . . . . . . . . . . . . . . . . . . . . . . . 45
7.1.3 Priority group III . . . . . . . . . . . . . . . . . . . . . . . . . . . . . . . . . . . . . . . . . . . . . . . 45
7.2 Potential errors . . . . . . . . . . . . . . . . . . . . . . . . . . . . . . . . . . . . . . . . . . . . . . . . . . . . . . 46
Page 5

8 Technical data . . . . . . . . . . . . . . . . . . . . . . . . . . . . . . . . . . . . . . . . . . . . . . . . . . . . . . . . 48
8.1 Ambient conditions . . . . . . . . . . . . . . . . . . . . . . . . . . . . . . . . . . . . . . . . . . . . . . . . . . 48
8.2 Electrical characteristics . . . . . . . . . . . . . . . . . . . . . . . . . . . . . . . . . . . . . . . . . . . . . . 48
8.2.1 Power supply . . . . . . . . . . . . . . . . . . . . . . . . . . . . . . . . . . . . . . . . . . . . . . . . 48
8.2.1.1 DC voltage supply . . . . . . . . . . . . . . . . . . . . . . . . . . . . . . . . . . . . . 48
8.3 Analogue outputs . . . . . . . . . . . . . . . . . . . . . . . . . . . . . . . . . . . . . . . . . . . . . . . . . . . . 49
8.3.1 Voltage output V1 - 5 V FS . . . . . . . . . . . . . . . . . . . . . . . . . . . . . . . . . . . . . . 50
8.3.2 Voltage output V2 - 10 V FS . . . . . . . . . . . . . . . . . . . . . . . . . . . . . . . . . . . . . 50
8.3.3 Current output C1 - 20 mA FS . . . . . . . . . . . . . . . . . . . . . . . . . . . . . . . . . . . 50
8.4 Signal outputs . . . . . . . . . . . . . . . . . . . . . . . . . . . . . . . . . . . . . . . . . . . . . . . . . . . . . . 50
8.4.1 Relay outputs . . . . . . . . . . . . . . . . . . . . . . . . . . . . . . . . . . . . . . . . . . . . . . . . 50
8.4.2 Transistor outputs (DC) . . . . . . . . . . . . . . . . . . . . . . . . . . . . . . . . . . . . . . . . . 51
8.5 Metrological data . . . . . . . . . . . . . . . . . . . . . . . . . . . . . . . . . . . . . . . . . . . . . . . . . . . . 53
8.5.1 Flow rate measurement . . . . . . . . . . . . . . . . . . . . . . . . . . . . . . . . . . . . . . . . 53
8.5.1.1 Monitoring head CSP-11 - with sensor adapter type TP-.. . . . . . 53
8.5.1.2 Monitoring head CSF-11 . . . . . . . . . . . . . . . . . . . . . . . . . . . . . . . 53
8.5.2 Temperature measurement . . . . . . . . . . . . . . . . . . . . . . . . . . . . . . . . . . . . . 54
8.5.3 Electronic control unit FC01-LQ . . . . . . . . . . . . . . . . . . . . . . . . . . . . . . . . . 55
8.6 Sensor interface . . . . . . . . . . . . . . . . . . . . . . . . . . . . . . . . . . . . . . . . . . . . . . . . . . . . . 56
8.6.1 Electrical data of the terminal for calorimetric monitoring heads . . . . . . . . . 56
9 Accessories . . . . . . . . . . . . . . . . . . . . . . . . . . . . . . . . . . . . . . . . . . . . . . . . . . . . . . . . . . 57
Index
Appendix
1 Performance of the digital and analogue outputs during the operating and error modes
2 Menu structure of the FC01-LQ (operator dialogue)
Page 6

Page 7

1 Description
The Flow Meter FC01-LQ is designed to detect flow speed, flow volume and medium temperature
of water (other liquids upon request).
These quantities are made available to the user as analogue electrical signals, physically isolated,
as current or voltage output and may be monitored by means of a limit monitor.
As relay outputs or transistor outputs the digital signals enable the user to integrate the FC01-LQ
into a control and monitoring system.
The transistor outputs enable the user to additionally process fault, status and volume pulse
indications in the control system.
The Flow Meter FC01-LQ may be used with calorimetric monitoring heads type CSx
(CSP, CSF).
Page 8
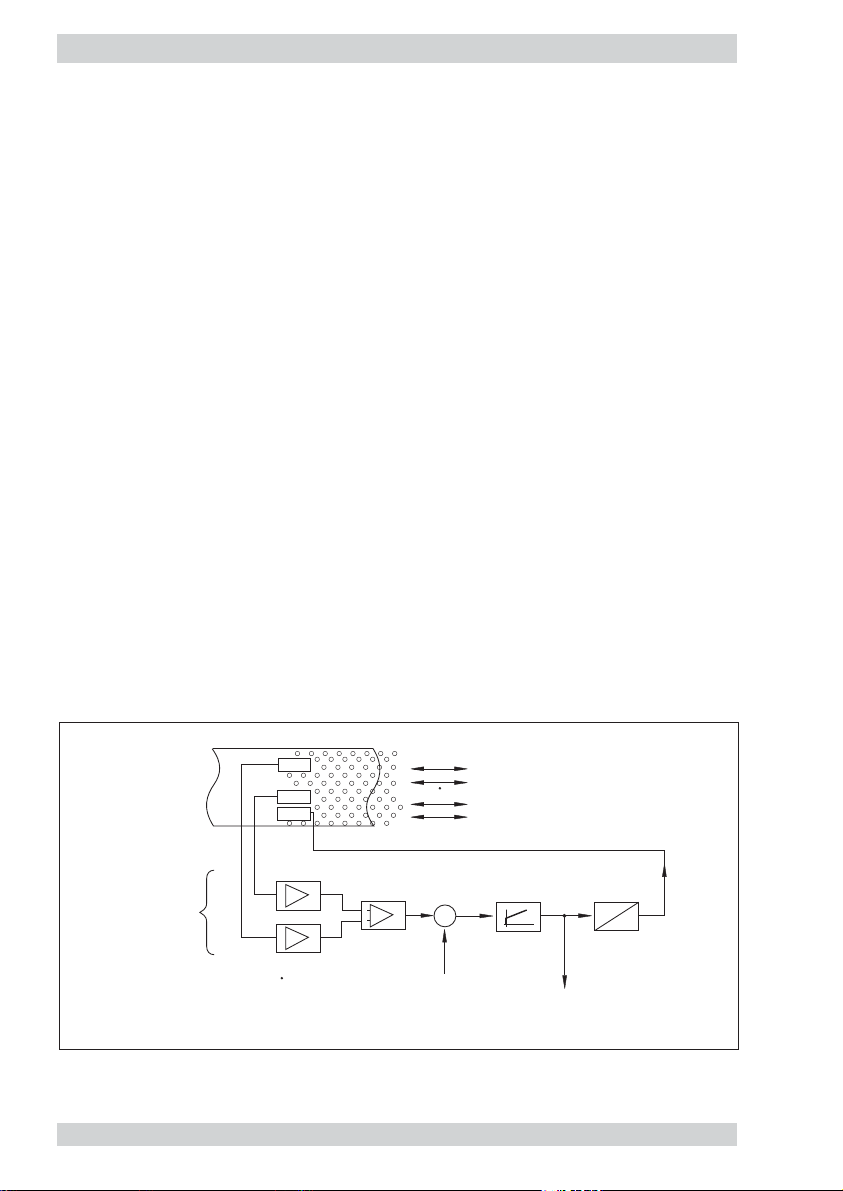
1.1 Calorimetric monitoring procedure
The calorimetric measuring procedure is based on the physics of heat dissipation.
A body with a temperature higher than its surroundings supplies a medium flowing past that
body with energy in the form of heat. The amount energy supplied is a function of temperature
difference ∆ϑ and mass flow.
The thermal measuring method CTD (Constant-Temperature-Difference) is based on following
principle:
The temperature difference ∆ϑ between the two sensors is kept constant and the mass flow is
determined by measuring the calorific power.
Fig. 1 is a schematic diagram of a CTD method based sensor.
Two temperature-sensitive resistors (sensor elements RS and RM) are immersed in the medium.
Sensor RM assumes the temperature of the medium ϑ
M
whilst heater resistor RH heats element
RS to temperature ϑ
S
. As a function of the medium, the temperature differential ∆ϑ = ϑS- ϑMis
preselected as a reference variable by the CTD control and is kept constant. The r equir ed heater
current I
H
is a function of mass flow so that the control variable y of the control can be used for
evaluation.
Major benefits of this method are:
● Fast response, particularly to sudden flow standstill.
● Medium temperature measurement, providing optimum temperature compensation.
● Increased safety because the sensor cannot be overheated during flow standstill.
The flow rate is determined by mass flow.
fig. 1
control loop
RM
RS
RH
K
p
ϑ
S
K
p
K
p
m: mass flow
w: reference variable ( )
x : actual value (S-M)
−
+
ϑ
M
Δ
ϑ
ϑ
m
-x xd
w
xd: system deviation
y : control variable
ϑ
IH: heater current
medium
Kp,T
I
n
y
y
H
U
I
Page 9
1.2 System description
The system comprises the following hardware functional modules:
1 Input voltage DC supply (terminal XV)
2 User interfaces: 2.1 signal outputs 2-way or 4-way signal outputs (terminal XAH)
2.2 analogue outputs 1 and 2 (terminal XAO)
3 Keyboard and display: keypads
liquid crystal display
4 Sensor interfaces: calorimetric monitoring had type CSx_ (terminal XSK)
5 Micro controller system: signal processing and monitoring
fig. 2
Power supply DC/DC
Sensorinterface
calorimetric
monitoring
head CSx_
4
1
Micro controller
system
5
Keyboard and Display
3
2.1
User
interface 1
User
interface 2
2.2
1 Input voltage:
2.1 User interface 1
2.2 User interface 2
3 Keyboard/Display:
4 Sensor interface
5 Controller system:
DC 19 … 32 V
relay outputs: 2 limit values
transistor outputs: 2 limit values +
analogue outputs
current or voltage
keypads
LC display
2 x 16 digits
calorimetric monitoring head type CSx_
signal processing
I/O - controlling
monitoring
parameter memory
1 error indication +
1 busy signal or
frequency output
(software selected)
Page 10

The power supply is physically isolated between power supply input and system power
supply output. This also applies to the analogue and signal outputs which are physically
isolated from each other as well as from the other electronics.
There is no electrical isolation between monitoring head and central electronic unit.
Connection of the monitoring heads is by means of precut cable links.
Cables and user interface connections are shown in para. 2.3.2 and circuit diagram 2.3.2.1/ 2.3.2.2.
System configuration and parameter setting are by means of the keyboard if default values
need to be changed. (paras. 5 and 6)
This mainly applies to monitoring head selection, signal outputs (switch point setting) and
analogue outputs (zero point setting and scaling).
1.2.1 User interfaces
Signal outputs: 1. R2 - Relays outputs (2 limit values)
(optional) Two-channel physical isolation, relay change over contact
The channels may be assigned in menu “CONFIGURATION”, either
individually or in pairs, to the physical quantities of temperature or
flow. The switch on and off values can be set as desired in menu
“PARAMETERS” (yet within the measuring range) for each contact.
Please see para. 8.4.1 for electrical connection.
2. T4 - Transistor outputs (2 setpoints + 2 status outputs or 2 setpoints +
1 status output + frequency output)
Four-channel physical isolation, transistor output - collector/emitter
(NPN) freely connectable
Channel 1: common error signal
Channel 2: busy signal or frequency output
Channels 3 and 4: Both channels may be assigned individually or in
pairs to the physical quantities of temperature or flow. The switch on
or off values of each transistor output can be set as desired.
Please see para. 8.4.2 for electrical connection.
Analogue outputs: Two-channel physical isolation, current or voltage output
(optional) Please see the ordering number to find out whether it is a current or
voltage output.
Output quantities: 0/1 - 5 V FS (option V1)
0/2 - 10 V FS (option V2)
0/4 - 20 mA FS (option C1)
These FS (full scale) output quantities apply to both channels (flow and
temperature) as standard.
20% zero elevation and FS value can be programmed. (See para. 5.11)
Shield connections are ungrounded.
The shields of the signal cables should be applied on one side only.
Page 11

Power supply: DC 24 V supply
Internal switch mode power supply with physical isolation of the
primary and secondary side.
Noise emission on the connection cable is limited by circuit design
and filter.
A PTC resistor provides protection from overcurrent. The element
automatically resets upon removal of the disturbance or after
disconnection of the supply voltage of the FC01-LQ for approx. 1 s
(e.g. remove terminal XV).
Please see para. 8.2.1 for technical characteristics.
Page 12

2 Installation
These are general directions for the application of calorimetric measuring heads which from
application to application should be reviewed by the user in accordance with individual
requirements.
2.1 Selection of material
Stainless steel 1.4571 / AISI 316 Ti
The standard monitoring head material is stainless steel 1.4571/AISI 316 Ti, an austenitic, acidresisting stainless steel that is commonly used throughout industry. Manufacturers claim it also
withstands oxidizing organic and anorganic acids, and partly even reductive media.
The resistance of this stainless steel should however be verified by the user, particularly when it
is used in medium mixtures that may from time to time be exchanged with cleansing agents. Its
chemical resistance also depends on temperature, flow rate and concentration of the medium.
Stainless steels owe their resistance to rust mainly to their alloy combination with chromium, the
formation of chromic oxide on the steel surface resulting in a passive state. Contamination,
deposits on the surface, or foreign rust may however neutralize the passivity. Therefore care
should be taken to keep the surfaces clean.
Stainless steel heads must not get in contact with steel parts other than stainless steel or with
chemically dissimilar metals, as this would cause electrolytic corrosion.
Nickel-based alloy (Hastelloy 2.4610)
Hastelloy 2.6410 is a material with a chemical resistance generally exceeding that of stainless
steel and copper-based alloys. They are particularly suitable for alkaline media (pH > 7). They
should however be examined for suitability for each specific application using resistance tables
and pragmatical values.
Page 13
2.2 Installation of the monitoring heads
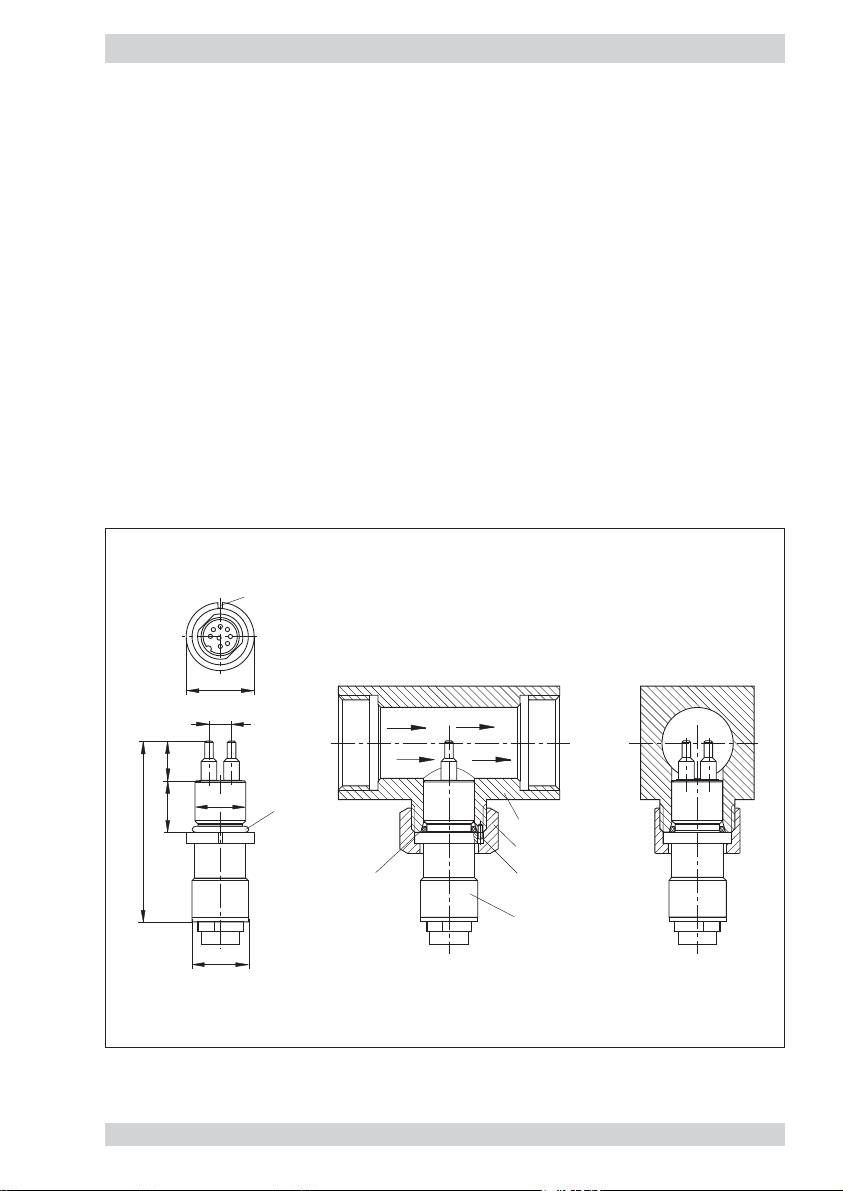
2.2.1 Insertion head CSP for sensor adapter TP-.. and ball valve BV-..
Application: general industry and installation
Style: insertion-type for sensor adapter and ball valve
Installation: sensor adapter TP-.. (fig. 4)
ball valve BV-.. (fig. 5)
Material of the area
exposed to medium: stainless steel 1.4571/AISI 316 Ti, electropolished
O ring viton
fig. 3
ø24
retention slot
8
14
ø18
18.2
64
ø20
O ring
O ring
sensor adapter TP-…
union nut
retention pin
monitoring head CSP-11..
Page 14
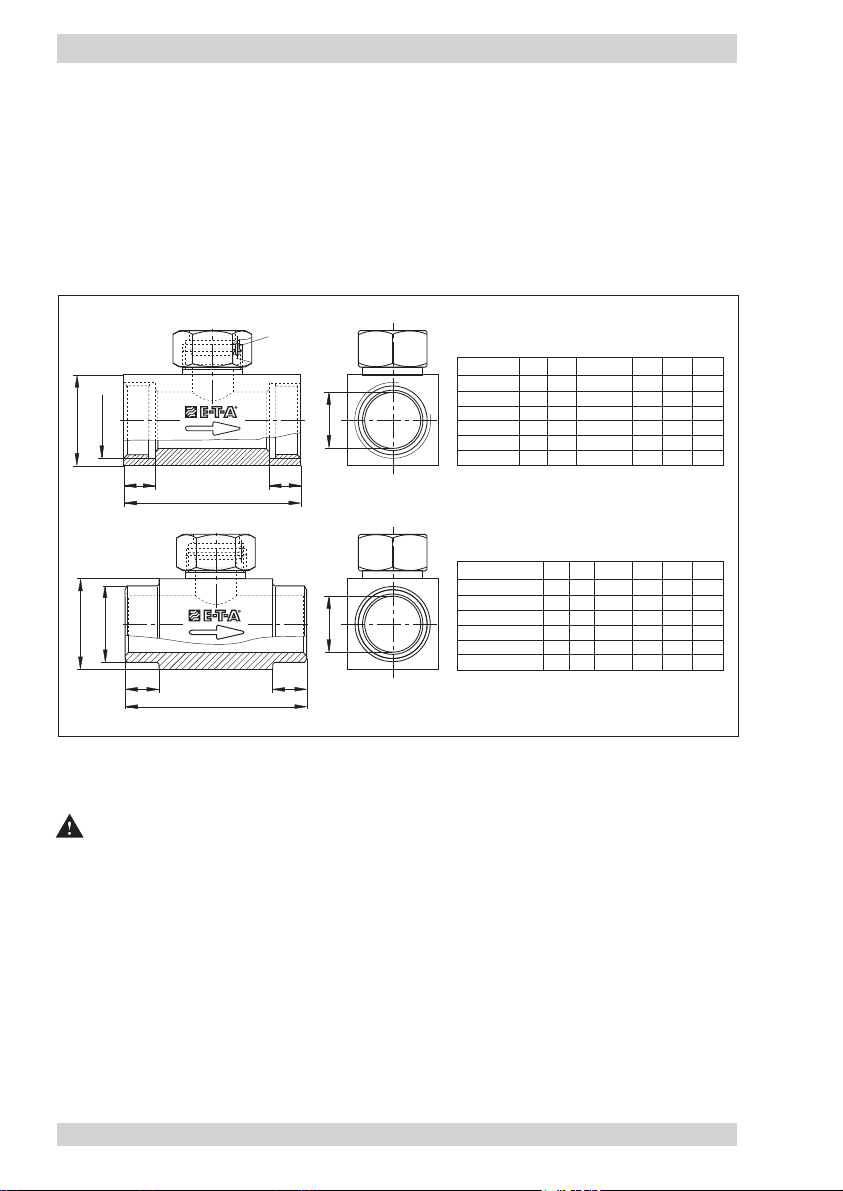
2.2.1.1 Sensoradapter TP-..
The sensor adapter TP-.. is available in 6 pipe diameters from 1/2" to 2".
Sensor adapter is available as screw-in (fig. 4 top) or welding type (fig. 4 bottom).
Material of the area exposed to medium:
- brass or
- stainless steel 1.4571/AISI 316 Ti
fig. 4
2.2.1.2 Mounting instructions (monitoring head CSP-.. with sensor adapter TP-.. )
Caution!
The monitoring head should only be installed or removed when the pipes are unpressurised.
To ensure the safety label is clearly visible, it should be affixed on to or close to the measuring point.
● Insert the monitoring head with the O ring into the sensor adapter and tighten the union
nut (observe correct retention).
The retention pin ensures correct alignment of the monitoring head after the union nut has
been tightened.
Correct immersion depth of the monitoring head is ensured by the stop provided.
Sealing of the monitoring head in the sensor adapter is by means of the O ring provided (fig. 3).
● Screw the sensor adapter into the pipe, using hemp or teflon tape for sealing.
retention pin
SW
Ty pe
DN
TP-01 …
TP-02 …
G
t
L
ødød
t
TP-03 …
TP-04 …
TP-05 …
TP-06 …
15
20
25
32
40
50
G
1/2"
16
3/4"
20
1"
25
11 /4"
32
11/2"
40
2"
50
SW
tød
L
27
50
11
32
64
12
40
78
14
50
94
15
55
110
15
70
138
19
SW
Ty pe
TP-01M1-SA
TP-02M1-SA
øD
t
L
t
TP-03M1-SA
TP-04M1-SA
TP-05M1-SA
TP-06M1-SA
DN
15
16
21.3
20
20
26.9
25
25
33.7
32
32
42.4
40
40
48.3
50
50
60.3
SW
tød
LøD
27
50
15
32
70
15
40
80
15
50
100
15
55
110
15
70
140
15
Page 15
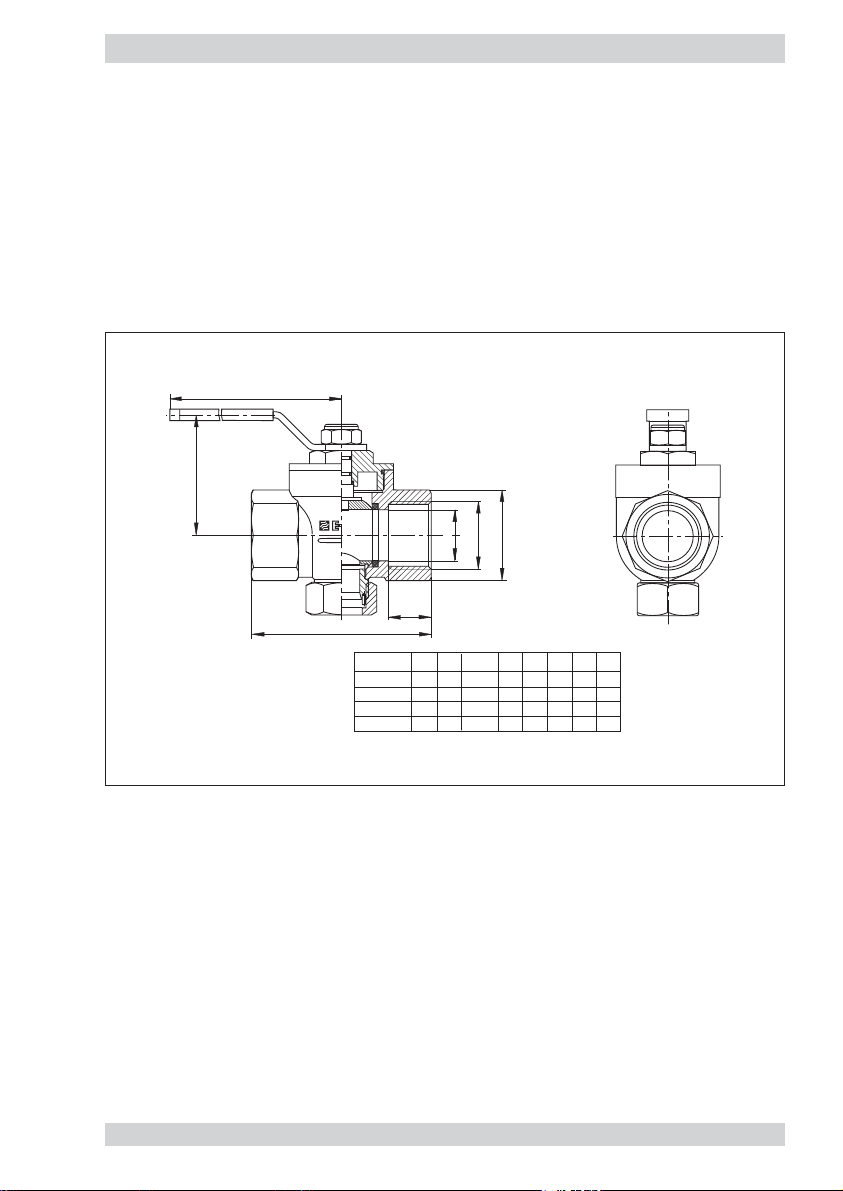
Ball valve BV-…
The ball valve of Postberg GmbH at D-63485 Bruchköbel is available in 4 nominal diameters
from 1" to 2". The ball valve ensures the sensors are fully immersed in the medium.
The monitoring head may also be replaced in pressurised pipe systems on duty.
Note:
❑ Please see the applicable drawing of Postberg GmbH for mounting instructions and
dimensions, if necessary.
fig. 5
A
H
G
ød
SW
L
BV-03M3
BV-04M3
BV-05M3
BV-06M3
Type
t
G
L
SW
1"
11/4"
11/2"
2"
tød
21
24
24
28
100
110
131
H
A
41
88
59
115
50
65
115
54
77
150
70
85
150
DN
25
25
32
32
40
40
50
50
Page 16
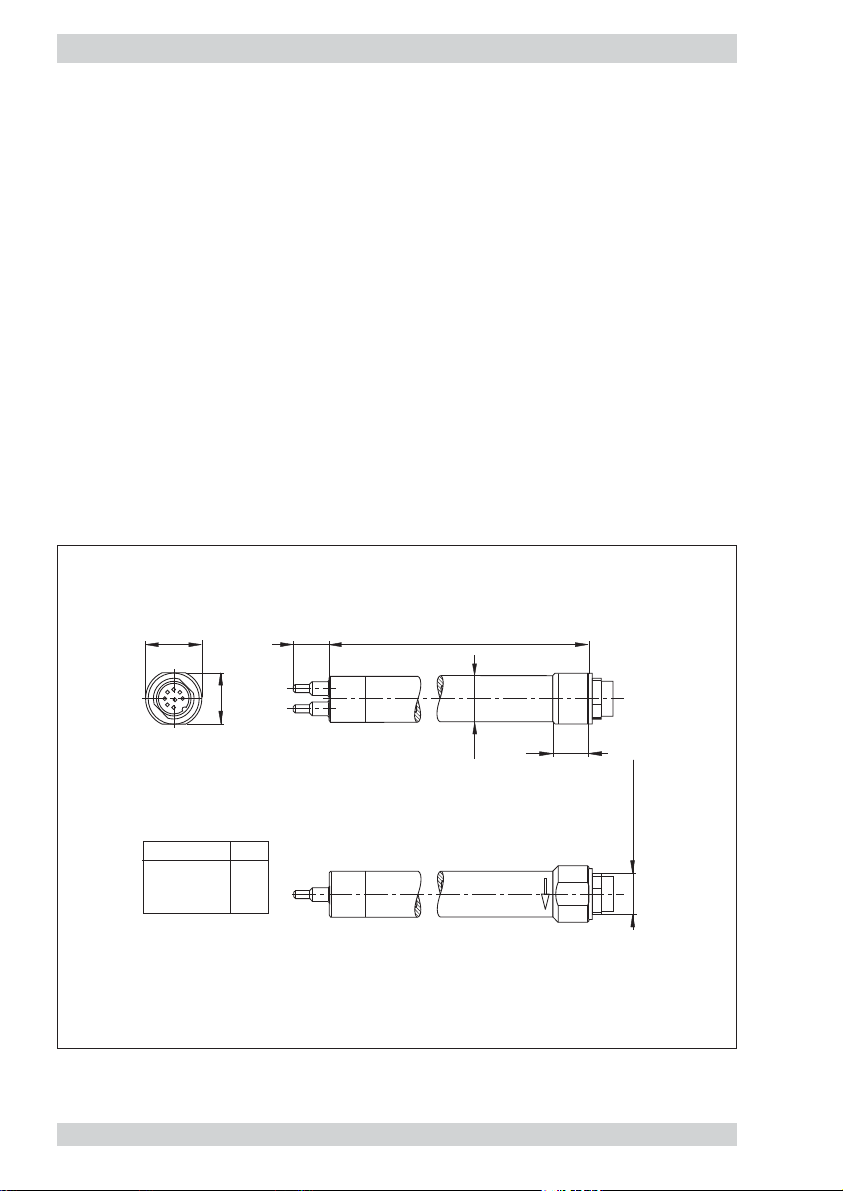
2.2.2 Monitoring head CSF-11 with adjustable immersion depth
Application: pipelines with nominal pipe diameters > DN50
Medium: liquids
Style: smooth shank, 18 mm dia., immersion depth adjustable within
the PG16 cable gland (accessory) or mounting in the stainless steel
cutting ring gland
Material of the area exposed to medium:
- M1 sensor and shank stainless steel 1.4571 /AISI 316 Ti (sensor)
- M7 sensor stainless steel 1.4571 /AISI 316 Ti, shank aluminium
Accessories:
- cable gland PG16 nickel-plated brass (see fig. 7)
- threaded installation bush stainless steel 316 (cutting ring) (see fig. 7)
fig. 6
ø22
SW20
Typ e
CSF-…L43… 190
CSF-…L30… 300
CSF-…L40… 400
14
L
L
ø18
monitoring head should be aligned
in direction of flow (see arrow)
14
16x0.75
M
ound connector
r
Page 17
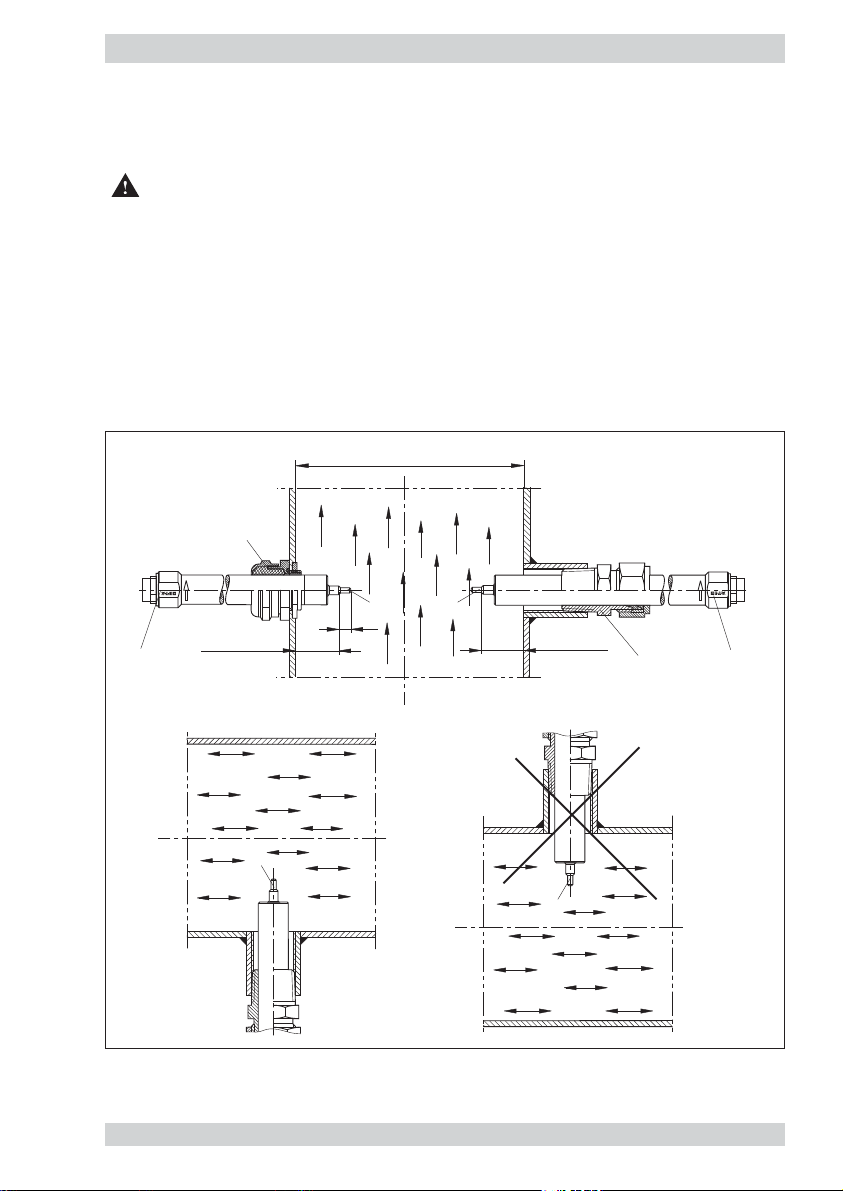
2.2.2.1 Mounting instructions for monitoring head CSF-11
Caution!
The two sensors (M) should be screwed into the pipeline far enough to ensure that they
are aligned side by side directly across the direction of flow. The sensors are correctly
positioned when the wrench flats (S) are aligned parallel with the pipeline.
The shoulder of the sensor (7 mm from the tip) must be at the position 1/8 from dia. i.
● In the case of vertical pipelines the monitoring head should be installed where the flow is
rising, if possible.
● For horizontal pipelines the monitoring head should be mounted on the underside of the
line (suspended).
V
fig. 7
ertical pipeline
PG16
(nickel-plated brass)
S
1/8 from dia.i
dia. i (internal pipe diameter)
M
7
M
monitoring head should be aligned
in direction of flow (see arrow)
1/8 from dia.i
threaded installation brush
(stainless steel-cutting ring)
S
Horizontal pipeline
M
M
Page 18
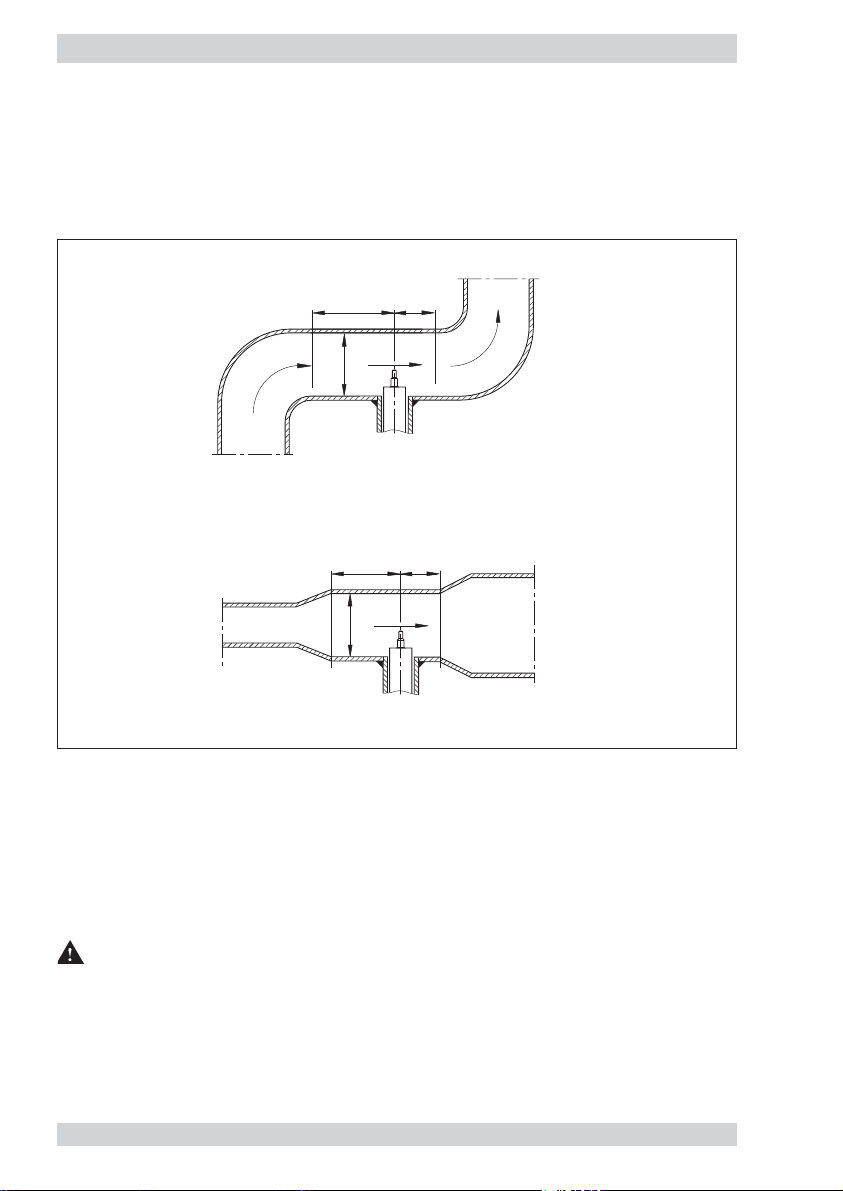
● The monitoring head should be installed only in a straight section of piping. There should be
a distance of at least 20 pipe diameters before the monitoring head, and 5 pipe diameters
after the monitoring head before or after bends and changes in pipe diameter, to avoid any
effects of turbulence.
fig. 8
● When installing the monitoring head, please observe that the arrow corresponds to the
flow direction.
● Fit monitoring head with locking set as follows (fig. 9):
- Fix first link of chain (1) into the clip (3) (tightening torque 10 Nm).
- Put chain catch (2) into link and fasten with the tight chain.
Caution!
Check locking system with regard to strength!
The locking chain must be mounted as tightly as possible.
5 x D20 x D
D
D = nominal pipe diameter
5 x D20 x D
D
D = nominal pipe diameter
Page 19
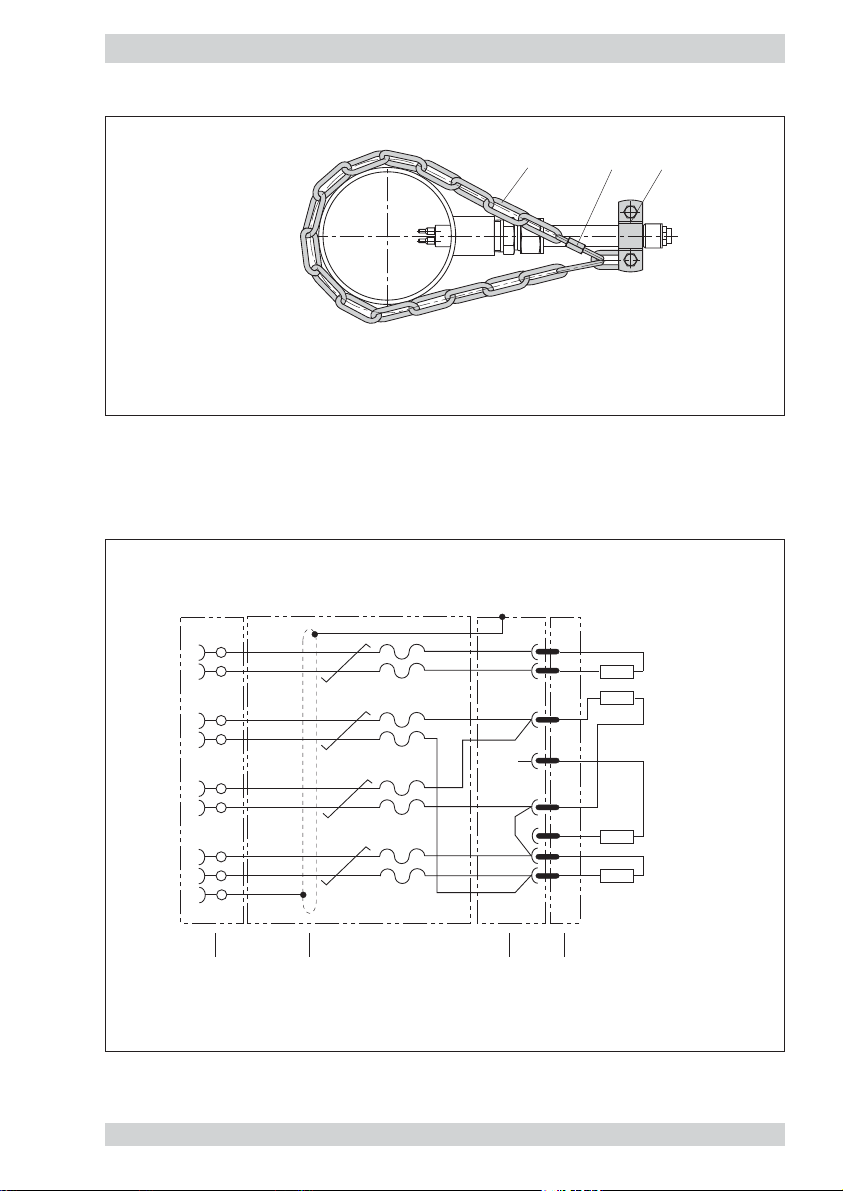
Locking set 01
2.2.3 Electrical connection2.2.3 Electrical connection
fig. 10
1 chain 4 x 32 DIN 5685 (approx. 1 m)
2 catch for chain NG 5
3 clip with screws and nuts DN15 to DIN 11850
(tightening torque 10 Nm)
Cable Do + Ka type xx
(depends on FC01-LQ version and sensor-type used - see figs. 15 and 16)
321
2
1
6
5
10
9
3
4
7/8
XSK
FC01-LQ
green
yellow
red
blue
pink
grey
brown
white
black
shield
cable
Kabel-Union
LifYCY 4 x 2 x 0,2 mm
or equivalent cable
green 7 7
yellow
3
red 4 4
pink
88
grey
1
5
6
brown
white
2
blue
round plug
2
X221 368 01
R(HEIZ)
3
R(Tdiff)
1
R(HEIZ)
5
6
2
R(Tref)
flange plug
X221 369 01
monitoring head
Page 20
2.3 Installation of electronic control unit FC01-LQ
2.3.1 Mechanical installation
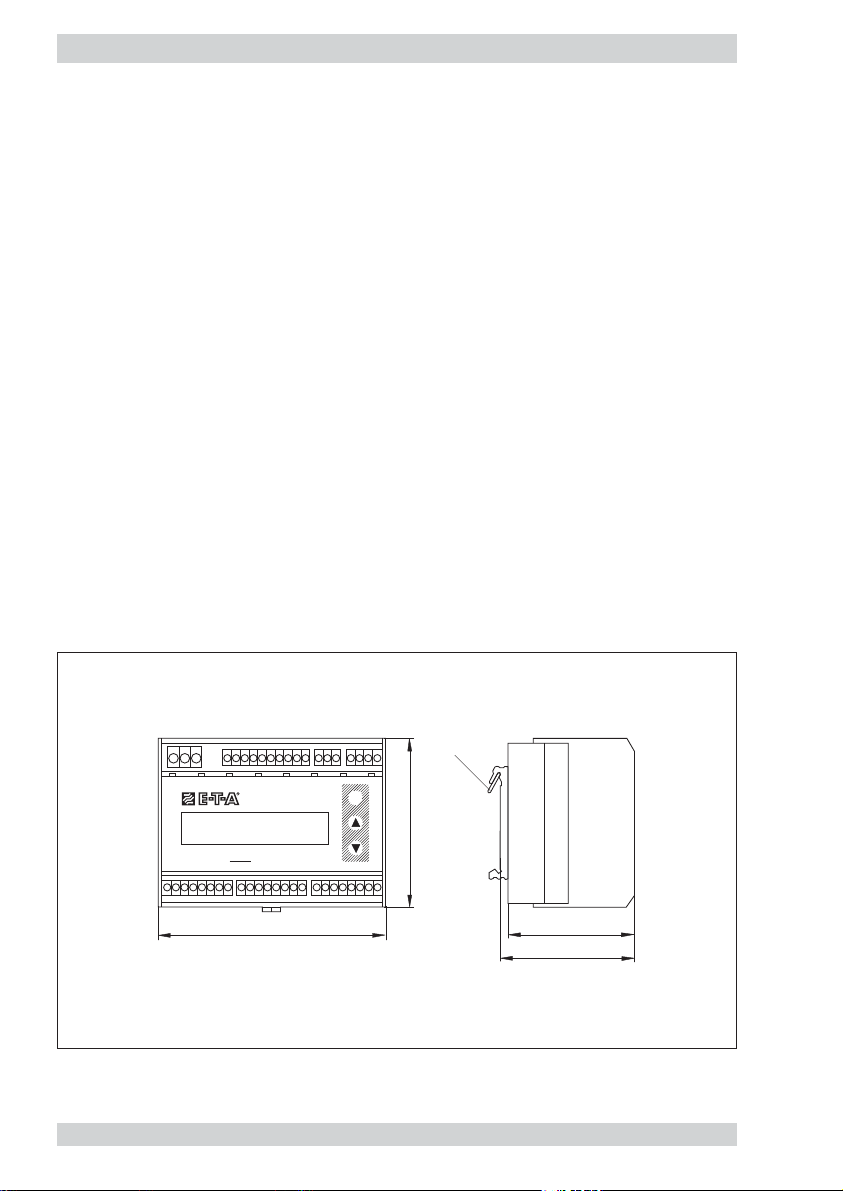
2.3.1.1 Rail-mounted version FC01-LQ-U1...
● The electronic housing is mounted on a symmetric rail to EN 50022.
● For thermal reasons, the modules should be spaced by at least 10 mm.
● Removal is by releasing the spring catch.
fig. 11
FC01-LQ
Flow Controller
100
spring catch
M
75
56
60
Page 21
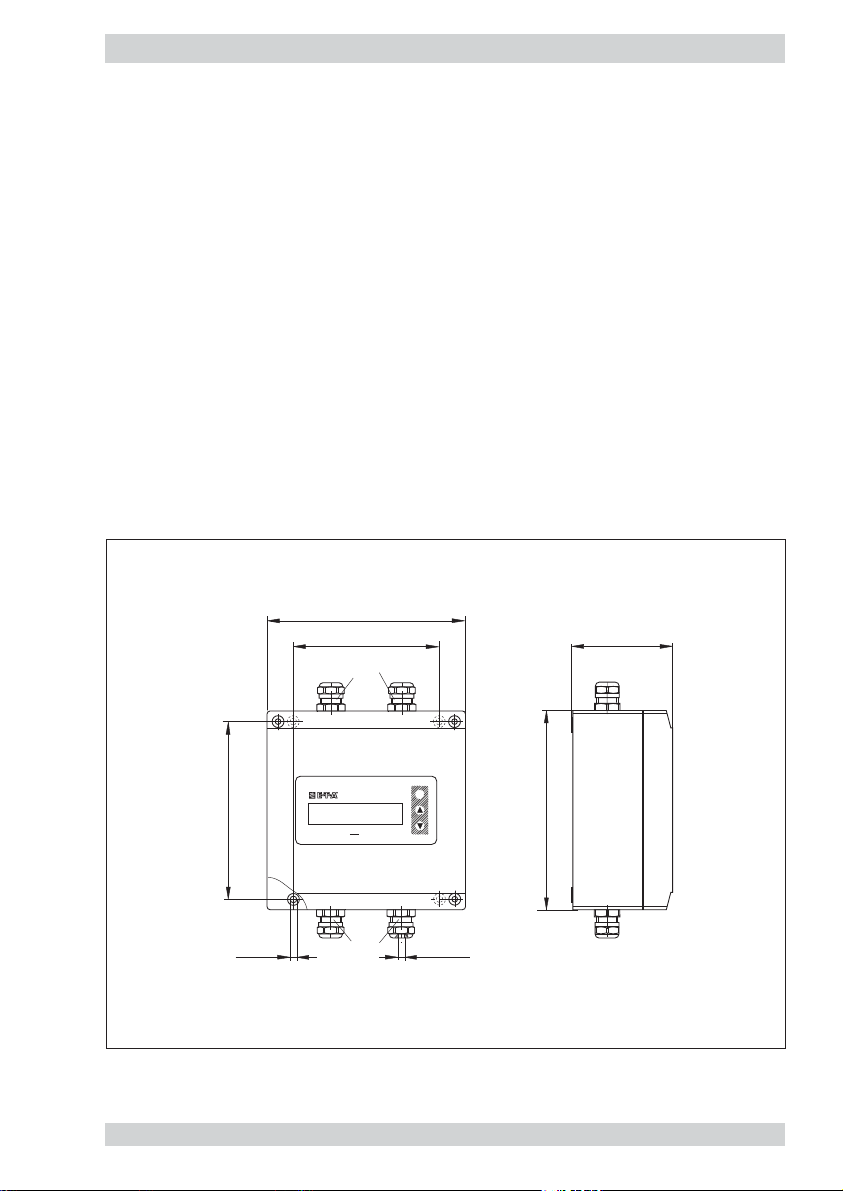
2.3.1.2 Surface mounted version FC01-LQ-FH-U1...
● Remove the cover of the housing.
● Install the housing in place using the 4 self-taping screws M4 (see fig. 12).
● Replace the cover and tighten the retaining screws.
fig. 12
140
103
M16
71
125
ø4.5
mounting holes
FC01-LQ-FH
Flow Controller
M16
M
140
ø5 to ø8
Page 22

2.3.1.3 Front panel mounted housing FC01-LQ-ST-U1...
● Insert housing in the front of mounting hole and fix with 4 screws (see fig. 13) from the rear.
fig. 13
96
482
144
mounting hole
DIN 43700
M
92
140
Page 23
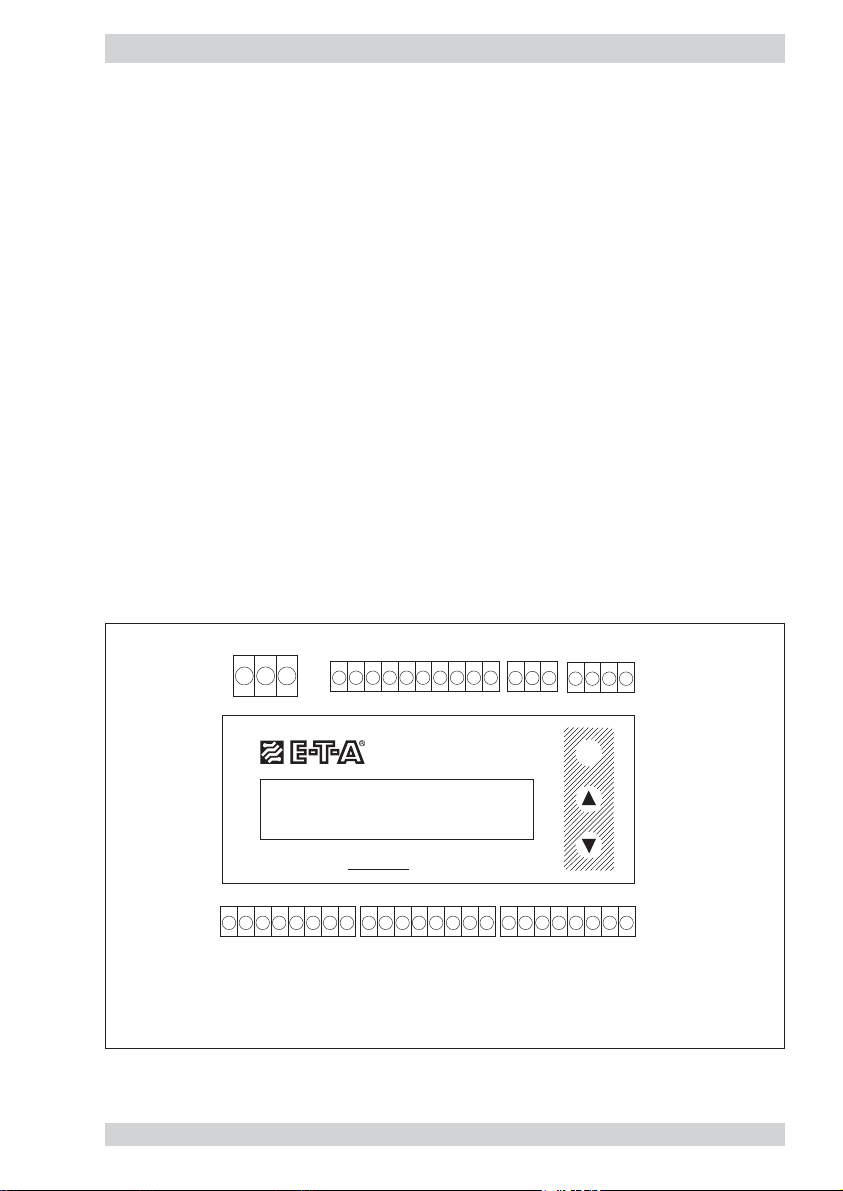
2.3.2 Electrical connection
Valid for all plug-in screw terminal strips:
Cable size: 0.14 mm
2
to 1.5 mm2, single or stranded conductor
Stripping length: 6.5 mm
Clamping screw: M2 (nickel-plated brass)
Contact material: pre-tinned tin bronze
XV - Power supply
Connection by 3 pole connector; max. 1.5 mm
2
; 3 x 0.75 mm2cable recommended
Pin No. Signal name Function
1 SGND general reference ground/shield ground
2+U
V
positive pole of supply voltage
3-U
V
negative pole of supply voltage
XTF - Keyboard release
Connection by 3 pole connector; factory-wired
Bridge 2-3 inserted = keyboard blocked
X
X
X
fig. 14
123
2345678910
123
1
XV XSK XTF
1234
M
FC01-LQ
(XAS) XAO XAH
8
7654321
V - power supply
SK - calorimetric monitoring head
TF - keyboard release
Flow Controller
8
7654321
(XAS) - nor released for user
XAO - analogue outputs
XAH - signal outputs
8
7654321
Page 24

XAO - - Analogue outputs
Connection by 8 pole connector; max. 1.5 mm
2
; LiYCY 2 x 0.25 mm2cable recommended
for each analogue output
Pin selection for analogue outputs (option: V1, V2, C1)
Pin No. Signal name Function
1 NC none
2 ANAO1 analogue output 1 - flow
3 ANA1GND reference potential for analogue output 1
4 SGNDA1 shield ground for analogue output 1 (ungrounded) *
5 SGNDA2 shield ground for analogue output 2 (ungrounded) *
6 ANAO2 analogue output 2 - temperature
7 ANA2GND reference potential for analogue output 2
8 NC none
* Apply shield on one side only.
XAH - Limit switch signal outputs - relay outputs - change over contacts
Connection by 8 pole connector; max. 1.5 mm
2
; LiYCY 3 x 0.38 mm2cable recommended
for each signal output
Pin No. Signal name Function
1 SGNDL1 shield ground 1
2 LIM1 non-inverted signal output 1 (N/O)
3 LIM1COM common change over input 1
4 /LIM1 inverted signal output 1 (N/C)
5 SGNDL2 shield ground 2
6 LIM2 non-inverted signal output 2 (N/O)
7 LIM2COM common change over input 2
8 /LIM2 inverted signal output 2 (N/C)
XAH - Limit switch signal outputs - transistor outputs NPN, freely connectable as emitter (-)
and collector (+) have been brought out separately.
Connection by 8 pole connector; max. 1.5 mm
2
; LifYCY 4 x 2 x 0.2 mm2 cable recommended
Pin No. Signal name Function
1 /ERROR E summarized error indication - emitter terminal
2 /ERROR C summarized error indication - collector terminal
3 /BUSY/PULSE E availability signal or frequency output -
emitter terminal
4 /BUSY/PULSE C availability signal or frequency output -
collector terminal
Page 25

5 LIM2 E limit value 2 - emitter terminal
6 LIM2 C limit value 2 - collector terminal
7 LIM1 E limit value 1 - emitter terminal
8 LIM1 C limit value 1 - collector terminal
XSK - Connection of calorimetric monitoring head type CS_x
Pre-sized connecting cable Do+Ka type 15 or Do+Ka type 18 with plug-in screw terminal strip
(see 2.2.3).
(XAS - secondary current supply)
Only for connection of cable shield (not released for user)
Pin No. Signal name Function
3 SGND /shield ground
Page 26

2.3.2.1 Circuit diagram FC01-LQ
Version: 24 V, relay outputs
fig. 15
recommended: 3x0.75 mm2LifYCY 4x 2x0.2 mm
power supply
0 V
+24 V
yellow/green
brown
blue
123
XV XSK XTF
2
calorimetric monitoring head
R(HEIZ) -LO
R(HEIZ) -HI
R(Tref) -HI
R(Tref) -LO
AGNDISSGND
yellow
green
brown
white
blue
red
1
2345678910
black
R(Tdiff)-LO
R(Tdiff)-HI
grey
pink
123
1234
M
* recommended
** SGNDA1
SGNDA2
ungrounded
}
Apply shield one side only.
FC01-LQ
Flow Controller
(XAS) XAO XAH
8
7654321
**
ANAO1
ANA1GND
SGNDA1
2 *
LiYCY 2x0.25 mm
}
C1, V1, V2
8
7654321
SGNDA2 **
ANAO2
ANA2GND
SGNDL1
2 *
LiYCY 2x0.25 mm
LIM1
LIM1COM
/LIM1
2 *
LiYCY 3x0.38 mm
}
signal outputsanalogue outputs **
8
7654321
SGNDL2
LIM2
LIM2COM
/LIM2
2 *
LiYCY 3x0.38 mm
Page 27

2.3.2.2 Circuit diagram FC01-LQ
Version: 24 V, transistor outputs (NPN)
fig. 16
2
2
yellow/green
123
E/ - emitter terminal
C/+ collector terminal
* recommended
** SGNDA1
SGNDA2
ungrounded
}
Apply shield one side only.
recommended: 3x0.75 mm
power supply
0 V
+24 V
R(HEIZ) -LO
brown
blue
yellow
1
LifYCY 4x 2x0.2 mm
calorimetric monitoring head
R(HEIZ) -HI
R(Tref) -HI
R(Tref) -LO
AGND
IS
SGND
R(Tdiff)-LO
green
brown
white
blue
red
black
grey
2345678910
R(Tdiff)-HI
pink
123
XV XSK XTF
FC01-LQ
Flow Monitor
(XAS) XAO XAH
8
SGND
7654321
**
ANAO1
ANA1GND
SGNDA1
*
2
}
LiYCY 2x0.25 mm
C1, V1, V2
8
7654321
E/ -
SGNDA2 **
ANAO2
ANA2GND
/ERROR
2 *
LiYCY 2x0.25 mm
C/+
/ERROR
signal outputsanalogue outputs **
1234
M
7654321
E/ -
C/ +
E/ -
C/ +
E/ -
/BUSY/PULSE
/BUSY/PULSE
LIM2
LIM2
LIM1
2 *
LifYCY 4x2x0.2 mm
8
C/ +
LIM1
Page 28
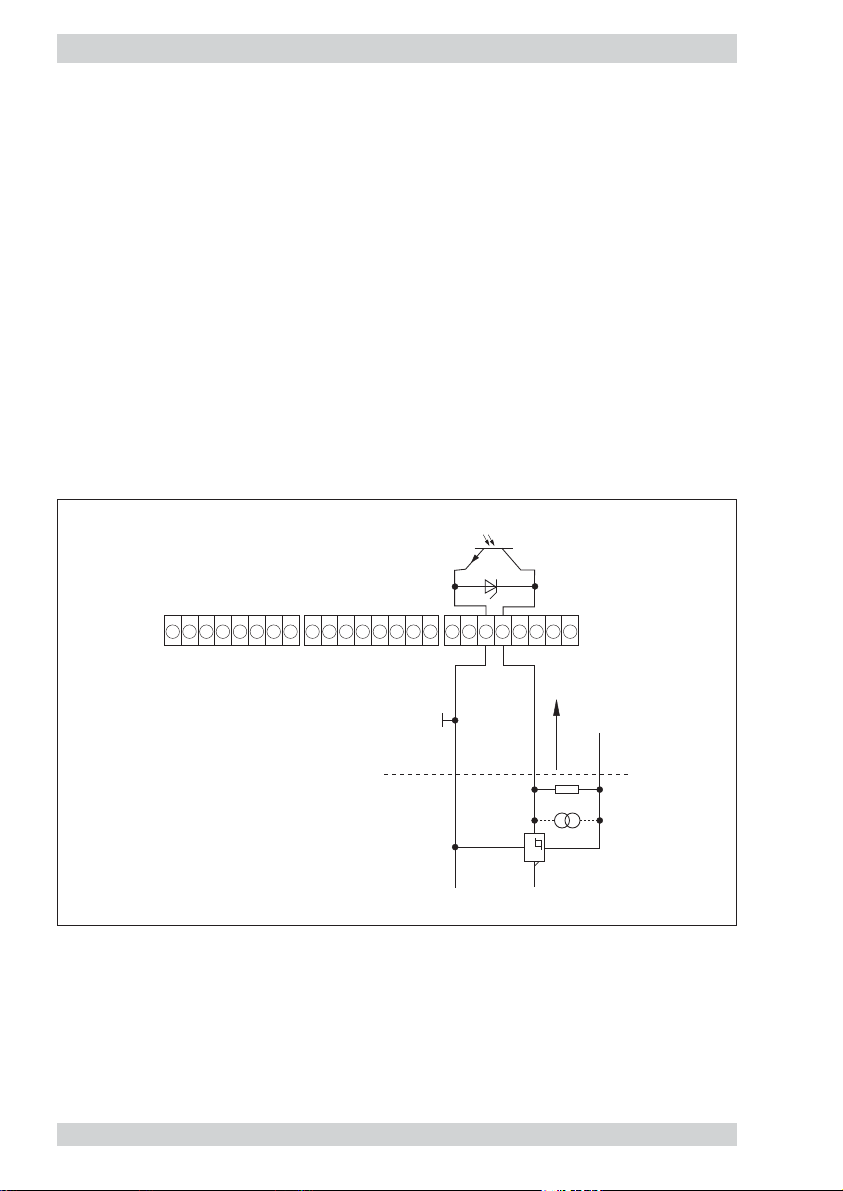
2.3.2.3 Electrical connection - frequency output (version FC01-LQ-U1T4)
The quantity-dependent pulse may be selected in the menu item “DISPLAY SELECT”. A square
pulse signal is available for driving a counter or a primary control at the plug XAH /BUSY E/- and
/BUSY C/+ (pins 3 and 4) (see fig. 16 - circuit diagram FC01-LQ - transistor outputs).
Signal ground shall be connected to pin 3 (BUSY E/-) and the driving load to pin 4 (BUSY C/+).
The pulse length is 50 ms (±1%) continuously.
Select cable size ≤1.5 mm
2
to make the connections.
The shield cables can be connected to connector XAS, pin 3.
Electronic signal processing (fig. 17)
If the frequency output of the FC01-LQ is connected to an electronic counter, computer or PLC,
the load current should not exceed 10 mA so as to ensure low level is 0.8 V. The max. admissible
voltage level of 48 V is irrelevant in this connection.
Typical circuit (example 1)
fig. 17
XAS XAO
8
7654321
XAH
8
7654321
7654321
≤ 10 mA
L
i
8
V
U
CD
Page 29
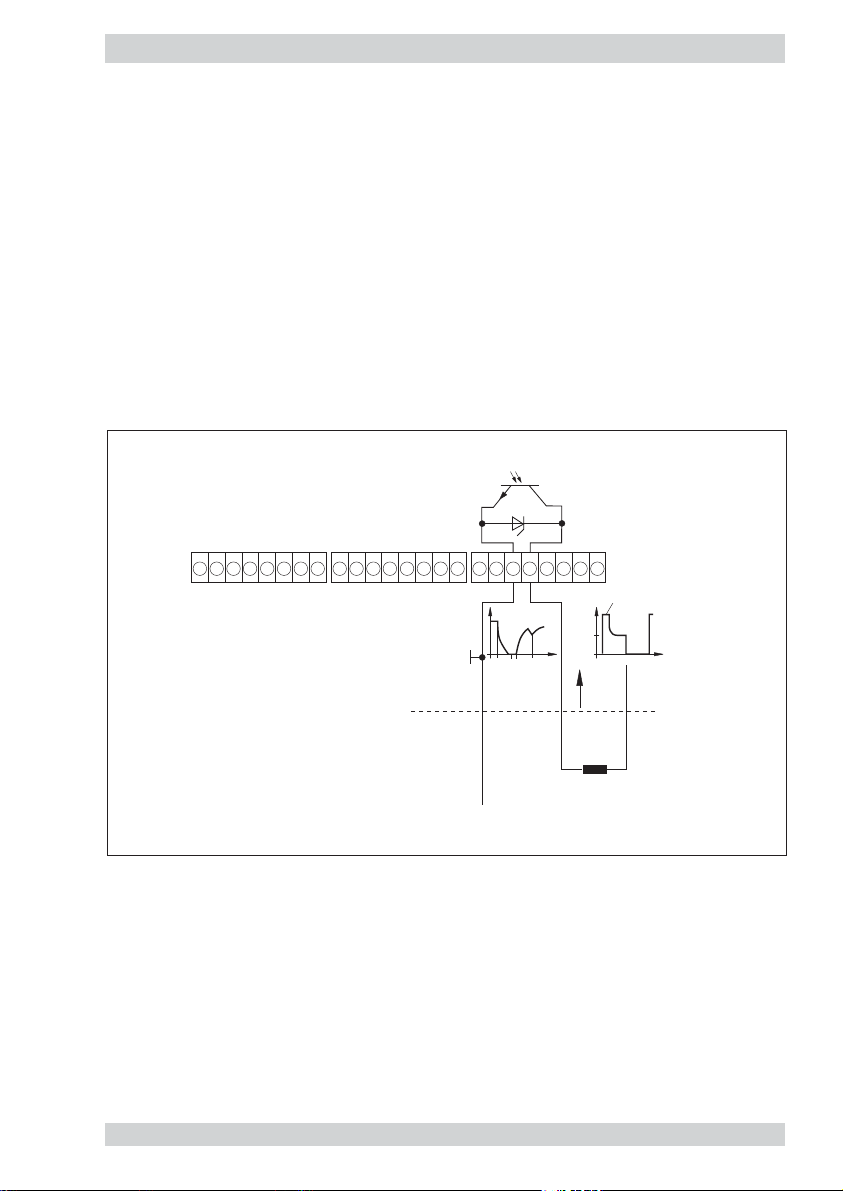
Electromechanical pulse counter (fig. 18)
The FC01-LQ driver output comprises an integral safety circuit which when isolating the counter
operating coil will limit overvoltages caused by inductance and convert the energy stored.
The counter should be able of processing a counting frequency of ≥10 Hz, as the puls e length
is 50 ms (±0.1%) constinuously.
It should therefore be ensured that the counter can be increased by one during the time available.
If a separate relief network is preferred to the integral network, care should be taken when
processing the max. frequency of 10 Hz to ensure the energy stored in the operating coil has
dissipated by the time the counter output is reset. The time to do this should be below 40 ms,
making due consideration to switching times and pulse variations.
Typical circuit (example 2)
Note:
❑ As there will be a reset pulse available at the output in the moment the supply voltage of
the FC01-LQ is applied, make sure that the counter is switched on delayed or set to zero
after it has been switched on
fig. 18
XAS XAO
8
7654321
t
- switch-on time
ON
tL - time constent of switch-off current
8
7654321
i
C
tLtONt
XAH
8
7654321
zener voltage
U
C
U
V
C
U
<36 V
C
i
U
Inductance of the
counter drive
t
V
Page 30

3 Operating system
Clear menu-driven control, via keyboard and display, enables easy definition of parameters and
configuration. This provides high system flexibility, making the FC01-LQ the optimum solution
for a wide variety of measuring, monitoring and display tasks.
All functions are distributed on the three following menu levels:
See Appendix 2 listing all functions available.
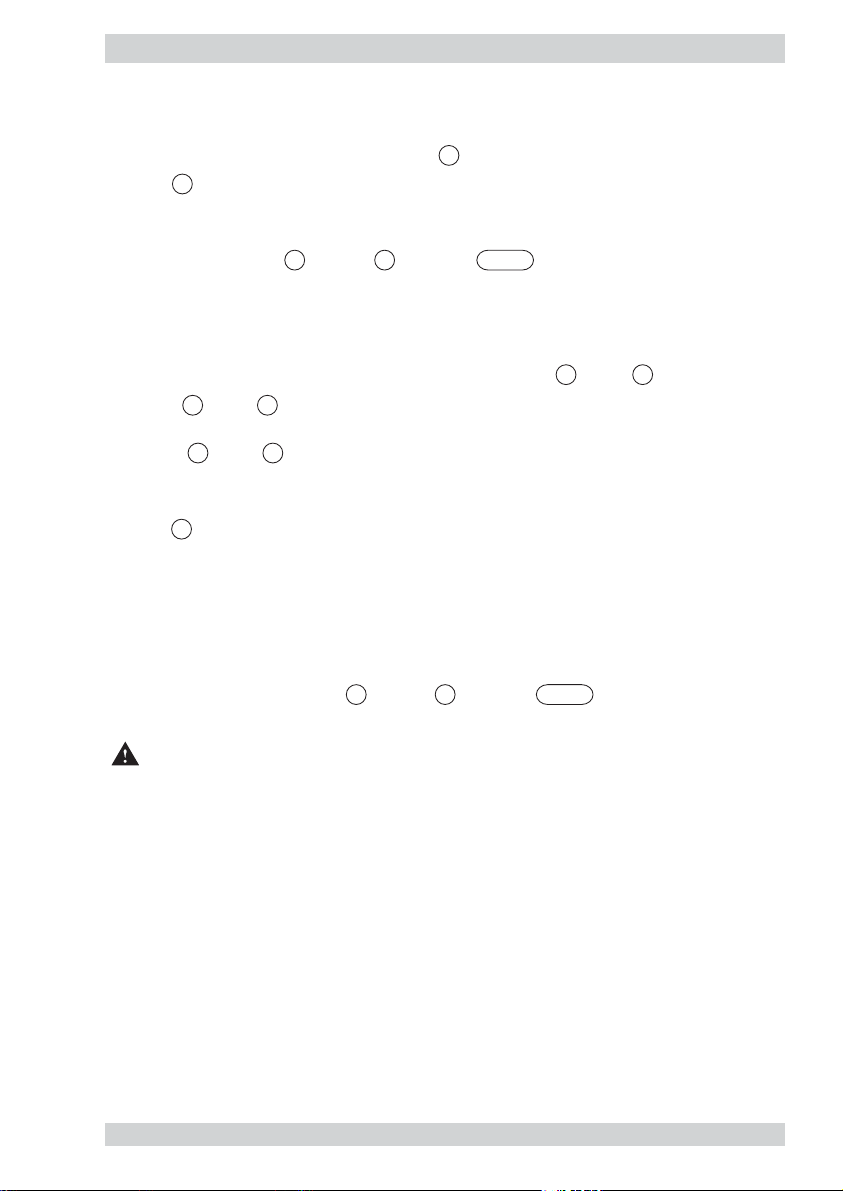
Keypads MODE, UP and DOWN
Setting and configuration is by means of three front keypads MODE, UP and DOWN.
It is also required for setting the unit to simultaneously press UP and DOWN =
.
Caution!
The FC01-LQ can only be set or operated when connector XTF (keyboard release) is
removed!
fig. 19
MAIN LEVEL (MENU)
CONFIGURATION LEVEL (MENU)
PARAMETER SELECTION (MENU)
M
▲
▼
M
▲
▲
▼
▼
▲ + ▼
MODE
M
UP
FC01-LQ
Flow Controller
DOWN
Page 31
Menu paging
The next menu option is selected by pressing MODE (forward paging)
.
Pressing MODE after the last menu option will cause skipping to the first option of the menu.
Calling a menu option
Simultaneously pressing UP and DOWN = calls the selected menu option, or
causes skipping to the selected submenu.
Entry of numerals
Some menu options require numerical values to be entered. After selecting the appropriate
menu option, the value indicated can be changed by pressing UP or DOWN.
Each time UP or DOWN are pressed, the value indicated will be increased and reduced
respectively, by one numeral skip.
The longer UP or DOWN are pressed, the faster the increase or reduction.
Transfer of entries
Pressing MODE transfers the set value or the selected menu option to a volatile memory.
A permanent transfer of settings and values is only effected when quitting the menu, after a
plausibility check of all entries.
Afterwards the data are still available even after switching the FC01-LQ repeatedly on and off.
Deleting data
Selected data such as MIN, MAX values, totalized quantity or LAST ERROR can be deleted or
reset by simultaneously pressing UP and DOWN = .
Caution!
After configuration and parameter selection re-connect plug XTF (keyboard release) to
protect the system against unauthorised access!
M
M
▲
▲
M
▲
▼
▼
▼
▲
▲ + ▼
▲
▼
▲ + ▼
▼
Page 32

4 Operation and main menu
4.1 Switch-on performance
Upon power application POWER ON TEST will be shown on the display for approx. 1 sec., with
the software version number being indicated in the second line.
During this period, the integral controller will conduct test routines (see para. 7.1, Test and diagnosis).
If during the test no error was found, the display will indicate HEATING UP. The FC01-LQ will
then be in the heating up period required for the measuring procedure.
4.2 Measuring cycle
Upon completion of the heating up period and availability of the first measured value, the display
will change to measuring cycle, and the user interfaces such as analogue outputs or limit
switches will be up-dated.
Note:
❒ It is not possible to configure or select parameters of the system during the measuring
operations!
All options of the main menu may be addressed without affecting the measuring and monitoring
function.
Menu option values
PEAK VALUE MIN
PEAK VALUE MAX
LAST ERROR
TOT ALISATOR
may be deleted simultaneously operating the UP and DOWN = switches without
affecting the measuring operations.
Over limits of the measuring range
Theoretically established measuring values will be used when the measuring range of
calorimetric monitoring heads is exceeded (0.05 … 3 m/s for water). The FM-LQ 1 can thus be
operated beyond the measuring values defined (up to 4 m/s for water).
This feature will not affect the accuracy specified for the measuring ranges defined whilst no
accuracy information can be given for conditions where the measuring ranges are exceeded.
Analogue output, limit switches etc. can be set beyond the measuring range. When per cent display
is selected, the defined measuring range will correspond to 0 ... 100% (>100% when the defined
range is exceeded).
The following operating data may be retrieved in the main menu during the measuring cycle: (see
para. 4.2.1).
▲
▼
▲ + ▼
Page 33

4.2.1 Operating data
4.2.1.1 Measured value(s)
Flow rate and medium temperature are indicated by the units selected in the upper line of the
LC display.
The lower line of the display will optionally show the switching condition of the limit switches and
an analogue bar with a 10-segment resolution, or the flow volume/time unit pertinent to the
indicated flow rate or the totalized flow volume (totalizer function).
The analogue bar has different meanings, depending on its configuration (see para. 5.7 - menu
option BARGRAPH).
fig. 20
flow rate temperature
Bar graph
indication
5.0 m/s -13.5 °C
TFF
Flow volume
indication
Flow volume
indication
Flow volume
indication
Totalizer
Totalizer
Totalizer
5.0 m/s -13.5 °C
1332.4 m3/h
5.0 m/s -13.5 °C
370.1 l/s
5.0 m/s -13.5 °C
22206.9 l/min
5.0 m/s -13.5 °C
F
37004567.9 l
5.0 m/s -13.5 °C
3704.6 m
5.0 m/s -13.5 °C
37044.9 m
TF
TF
TF
T
Temperature, active
(invers representation)
T
3
3
TF
TF
P
„switch-on condition“
Flow rate, passive
F
Frequency output selected
(invers representation)
P
„switch-on condition“
Page 34

The limit switches are identified according to their physical assignment, i.e. by F for flow rate and
T for medium temperature, at the first or last place of the second line on the display.
If F and T are shown reversed, the limit switch is in the switch-on condition.
Limit switches lying within the analogue bar range are also represented at the appropriate place
of the analogue bar (see para. 5.7).
The following figures show the display variants under menu option “Measured value(s)” (para. 5.6 -
menu option DISPLAY SELECT and 5.9 - menu option FREQUENCY OUTPUT).
4.2.1.2 Peak values (menu option: PEAK VALUE MIN / PEAK VALUE MAX)
The FC01-LQ comprises four specific measured-values memories.
They store the lowest and highest value of flow rate and medium temperature.
fig. 21
After switch-on or NOT-BUSY indication, the minimum and maximum values are deleted and will
be continuously updated (non-return pointer principle).
The peak values may be retrived in the main menu and are deleted by simultaneously pressing
UP and DOWN = .
Caution!
Power failure or disconnection of the power supply will delete the contents of the four
measured-values memories.
4.2.1.3 Last error (menu option: LAST ERROR)
The last main menu option to be called is the error memory.
This error memory comprises the number of the last error (see section 7). It may be very helpful
when commissioning the FC01-LQ.
Other than the peak value memories described above, the contents of this memory will be
retained even upon power failure.
The user may purposely delete the error memory in the condition selected by simultaneously
pressing UP and DOWN = .
▲
MIN VALUE
flow rate
MAX VALUE
flow rate
▲
▼
▲ + ▼
▼
▲ + ▼
MIN VALUE
medium temperature
MAX VALUE
medium temperature
Page 35

power-on
HEATING UP *
12.5 m/s -13.5 °C *
M
TFF
TFF
See section 5
See section 6
10.8 m/s -19.5 °C *
PEAK VALUE MIN
M
14.8 m/s -105.6 °C *
PEAK VALUE MAX
M
12.5 m/s -13.5 °C *
CONFIGURATION
M
12.5 m/s -13.5 °C *
PARAMETERS
M
12.5 m/s -13.5 °C *
LAST ERROR 20
M
▲ + ▼
▲ + ▼
▲ + ▼
HEATING UP * PARAMETERS
▲ + ▼
HEATING UP * LAST ERROR
▲ + ▼
delete
minimum values
delete
maximum values
menu Configuration
menu Parameter Selection
delete errors
stored
* not available with turbine-type sensor
Page 36

5 Configuration (menu option: CONFIGURATION)
The CONFIGURATION menu serves to adjust the FC01-LQ to the application within the entire
system. During system configuration, measuring operations are not possible (see appendix 1).
Configuration possibilities are:
5.1 Selection of monitoring head (menu option: SENSOR SELECT)
This menu option comprises all monitoring heads that can be used with the FC01-LQ (issue 07.2003).
The appropriate sensor can be selected from the following menu (for type designation see type
label or CPI catalogue).
• TYPE CSP11WM1 (insertion head for water with sensor adapter TP-..)
• TYPE CSP11WM1BV (insertion head for water with ball valve BV-..)
• TYPE CSF11WM1 (monitoring head for water with adjustable immersion depth)
• TYPE S-No. xxx (custom designed monitoring head for special liquids)
The monitoring head programme is continuously extended - please enquire.
Caution!
Menu option SENSOR SELECT may influence data in the parameter selection menu (see
para. 5.12, Quitting the configuration menu).
5.2 Monitoring head data (menu option: SENSOR CODE)
To operate the FC01-LQ with a calorimetric monitoring head, it is necessary to set sensorspecific characteristics.
These characteristics are specified by the sensor code which together with the monitoring head
type number is marked on the monitoring head housing.
Enter the following characteristics when selecting a CSF monitoring head. The setting is menu
driven:
1. SENSOR CODE C value characteristics range: 700 … 1300
2. SENSOR CODE T value characteristics range: 01 … 99
Caution!
Take care to repeat these settings after replacing the monitoring head or electronic control
unit FC01-LQ, as the accuracy of measurements is determined by the sensor code.
Enter the following characteristics when selecting a CSP monitoring head:
1. SENSOR CODE C value characteristics range: 700 … 1300
2. SENSOR CODE value characteristics range: 01 … 99
The nominal diameter of the ball valve is selected in menu option BV SIZE SELECT.
Available sizes are:
• DN25 (1 in), DN32 (1 1/4 in), DN40 (1 1/2 in) und DN50 (2 in).
Page 37

Enter the following characteristics when selecting a CSP monitoring head with sensor adapter TP-..:
1. SENSOR CODE C value characteristics range: 700 … 1300
2. SENSOR CODE T value characteristics range: 01 … 99
The internal diameter of the sensor adapter is selcted in menu option TYPE SELECT.
Available sizes are:
• TP01 (1/2 in) • TP04 (1 1/4 in)
• TP02 (3/4 in) • TP05 (1 1/2 in)
• TP03 (1 in) • TP06 (2 in)
5.3 Limit switch combinations (menu option: LIMIT SWITCHES)
The FC01-LQ comprises two limit switches (LS1 and LS2) which are assigned to the physical
quantity/quantities to be monitored in submenu LIMIT SWITCHES.
The following combinations are available:
• LS1 F and LS2 F
limit switch 1 flow rate
limit switch 2 flow rate
• LS1 T and LS2 T
limit switch 1 medium temperature
limit switch 2 medium temperature
• LS1 F and LS2 T
limit switch 1 flow rate
limit switch 2 medium temperature
• LS1 T and LS2 F
limit switch 1 medium temperature
limit switch 2 flow rate
Mode of operation, limit value and hysteresis of the limit switches are set in menu PARAMETER
SELECTION.
Caution!
Menu option LIMIT SWITCHES may influence data in the parameter selection menu (see
para. 5.12, Quitting the configuration menu).
Page 38

5.4 Flow rate unit (menu option: FLOW UNIT)
At these point (1st line top left) the requested unit for the flow velocity will be set.
This menu option is used to set the desired flow rate unit:
• METRE/SEC [m/s] • FEET/SEC [FPS]
• PERCENT [%] • BLANK [no unit]
Any further entries relating to flow rate (e.g. limit value, analog ue output etc.), refer to that unit.
Standard percent is displayed when BLANK (no unit) is selected.
When the flow rate unit is changed, all configuration and parameter data relating flow rate will
automatically be converted!
5.5 Medium temperature unit (menu option: TEMP. UNIT)
This submenu is used to select the medium temperature unit (1st line top left).
Options are:
• GRAD CELSIUS [°C]
• GRAD FAHRENHEIT [°F]
• KELVIN [K]
All other entries relating to the medium temperature (limit value, analogue output, etc.) refer to
the unit selected there. When the temperature unit is changed, all configuration and parameter
data relating to medium temperature will automatically be converted.
5.6 Display (menu option: DISPLAY SELECT)
The FC01-LQ enables the user to define the 2nd line of the display 2 in certain points.
When the first line of the LC display in the main menu indicates the flow rate in the unit selected
as well as the medium temperature in °C, °F or K, it is possible to select the second line from
the following menu options (see para. 5.14).
• BARGRAPH Totalizer:
• LITRE/SECOND [l/s] • LITRE [l]
• LITRE/MINUTE [l/min] • METRE
3[m3
]
• METRE
3
/ HOUR [m3/h] • GALLONS° [° = US-GALLONS]
• GALLONS°/MINUTE
Where totalizer function has been selected, the totalizer will start at zero counting in the unit
selected (litre, m
3
or gallons).
When the display changes from m
3
to litre or gallons, or from litre or gallons to m3, the value
already counted will be converted.
The content of the totalizer is deleted by simultaneously pressing UP and DOWN =
, or when the max. display value (99999999.9 l, m
3
or gallons) is reached.
In both cases the totalizer will restart from zero.
▲ + ▼
▲
▼
Page 39

Caution!
The content of the totalizer is deleted in the event of power failure or disconnection of the
power supply!
Skipping to the submenu BARGRAPH or PIPE SIZE is effected depending on the selected menu
option.
5.7 Bar graph (menu option: BARGRAPH)
This menu option allows the user to set the bar graph as desired. The following settings should
be made:
• FLOW / TE MP = (bar graph assignment: flow rate/me dium temperature)
• ZERO = (initial value of the bar graph)
• FS = (final value of the bar graph)
Independent of its assignment, the bar graph has a constant resolution of 10 segments.
When entering the initial or final value, the user should observe reasonable resolution!
The bar graph also comprises the representation of the limit switch(es) as far as they can be
indicated in the bar range selected.
The representation of the limit switches in the bar graph depends on the switch-on value of the
limit switch.
For representation details see para. 4.2.1 (Operating data).
Example:
Limit switch assignment: LS1 F and LS2 T
Switch-on value LS2: 23 °C
Switch-off value LS2: 29 °C
Analogue bar graph assignment: medium temperature
Initial value - analogue bar graph: 20 °C
Final value - analogue bar graph: 30 °C
Instantaneuous temperature value: 25 °C
resulting in the analogue bar graph display shown below:
fig. 22
20 °C 21 °C 25 °C 29 °C 30 °C
23 °C
T T
LS2 ON
Page 40

5.8 Pipe diameter (menu option: PIPE SIZE)
If flow volume/time unit display has been selected, it is necessary to indicate the pipe diameter
to calculate mass flow.
This is provided by selecting the pipe diameter in menu option PIPE SIZE comprising pipe
diameters from 10.0 … 999.9 mm.
5.9 Frequency output (menu option: FREQUENCY OUTPUT)
The totalizer function of the FC01-LQ has been expanded by the output of proportional quantity
pulses. The function can only be displayed by version FC01-LQ-U1T4 (transistor outputs).
The proportional quantity pulses have been determined as follow:
Example: 1 pulse / 10.0 [litre]
The frequency output will supply 1 pulse per 10 litres (totalized quantity).
When the quantity-proportional pulses are assigned, the frequency of the frequency output must
no exceed 10 Hz. The limits that can be displayed are determined by the flow velocity range and
the pipe diameter.
Potential setting range of the frequency output: 1 pulse per 0.1 … 999.9 [litre], [m
3
], [gallons]
Behaviour of the frequency output when the max. frequency is exceeded
The max. frequency being exceeded will not cause the measurement to stop but will rather
cause the error output to signal error 60 on the display. This error is included in priority group III.
If a combination of priority III errors occurs simultaneously, they are indicated or stored in the
error memory observing the following sequence:
Error No. 20, 30, 60, 40, 41.
Behaviour of the frequency output when the measurement is stopped
When the measurement is stopped (as caused by priority II error and calling the configuration or
parameter selection menus), the pulses for the quantity already counted will be available.
Thereafter the output of pulses will be stopped, with the frequency output becoming highresistive until the measurement is restarted.
Behaviour of the frequency output when the content of the totalizer is deleted
The content of the totalizer may be deleted by simultaneously pressing UP and DOWN
= in the main menu.
As the frequency output refers to the content of the totalizer, although its operation is not
dependent on the content of the totalizer, a totalized quantity that is smaller than that set per
pulse will not be lost.
This means that only the content of the totalizer is deleted.
1 pulse / quantity (totalizer unit selected)
▲ + ▼
▲
▼
Page 41

5.10 Analogue output - flow rate (menu option: ANA OUT FLOW)
This menu option allows adjustment of the flow rate analogue output specifically to the
requirement of the entire system.
Options are:
• OFFSET = 0%/20% FS (0/4 … 20 mA, 0/1 … 5 V, 0/2 … 10 V)
• ZERO = (initial value 0(20) % corresponds to a flow rate of _ [m/s] [%] [FPS])
• FS = (final value 100% corresponds to a flow rate of _ [m/s] [%] [FPS])
When entering the initial or final value, the user should observe a reasonable resolution!
With a flow volume/time unit selected in menu DISPLAY SELECT and when setting the initial and
end values, the pertinent flow volumes will also be indicated.
5.11 Analogue output - medium temperature
(menu option: ANA OUT TEMP.)
In conformance with the configuration “Flow rate analogue output” it is possible to adjust the
medium temperature analogue output to the requirements of the entire system.
Options are:
• OFFSET = 0%/20% FS (0/4 … 20 mA, 0/1 … 5 V, 0/2 … 10 V)
• ZERO = (initial value 0(20) % corresponds to a medium temperature of … [°C] [°F] [K])
• FS = (final value 100% corr e sponds to a med ium te mperat ure o f … [°C] [°F] [K])
When entering the initial or final value, the user should observe a reasonable resolution!
5.12 Quitting the configuration menu
Upon configuration of the analogue outputs, the menu may be quitted or re-set to the start
(SENSOR SELECT).
To quit the configuration menu, the controller will check the data entered for plausibility.
“CONFIG. OK!” is indicated when the data are found correct. The menu may than be quitted by
pressing MODE.
Errors found during the plausibility check are indicated in the following sequence of priority.
Priority of entry errors in the CONFIGURATION menu:
• ERR. A-OUT FLOW OUT OF RANGE
(flow analogue output outside measuring range)
• ERR. A-OUT FLOW ZERO ≥ FS
(initial value ≥ final value with flow analogue output)
• ERR. A-OUT TEMP. OUT OF RANGE
(temperature analogue output outside measuring range)
• ERR. A-OUT TEMP. ZERO ≥ FS
(initial value ≥ final value with temperature analogue output)
M
Page 42

• ERR. BARGRAPH OUT OF RANGE
(bar value outside measuring range)
• ERR. BARGRAPH ZERO ≥ FS
(bar initial value ≥ bar final value)
The menu can only be quitted after correction of the error(s). To do this, return to the beginning
of the configuration menu by pressing UP or DOWN and select the menu option with
the incorrect entry for correction.
Caution!
If during the configuration data are affected which are accessible in the parameter
selection menu, (which may be the case for the options Sensor Selection, Medium
Selection and Limit Switch Assignment), the option “PARAMETERS” in the main menu will
be flashing.
In this event it is imperative to branch into parameter selection menu to set the data in
conformance with the desired application.
Example: Changing the limit switch assignment from LS1 → F / LS2 → T to
LS1 → F / LS2 → F
Effects on
parameter data: LS2 ON = 0.00
LS2 OFF = end of measuring range (depending on the medium selected)
Reason: Changing the physical assignment of limit switch 2 will adjust its switch-on and
switch-off values to the new assignment (flow rate).
An overview of the configuration menu and a summary of the measuring ranges and menus
available for the sensor type selected are shown on the following pages.
▲
▼
Page 43
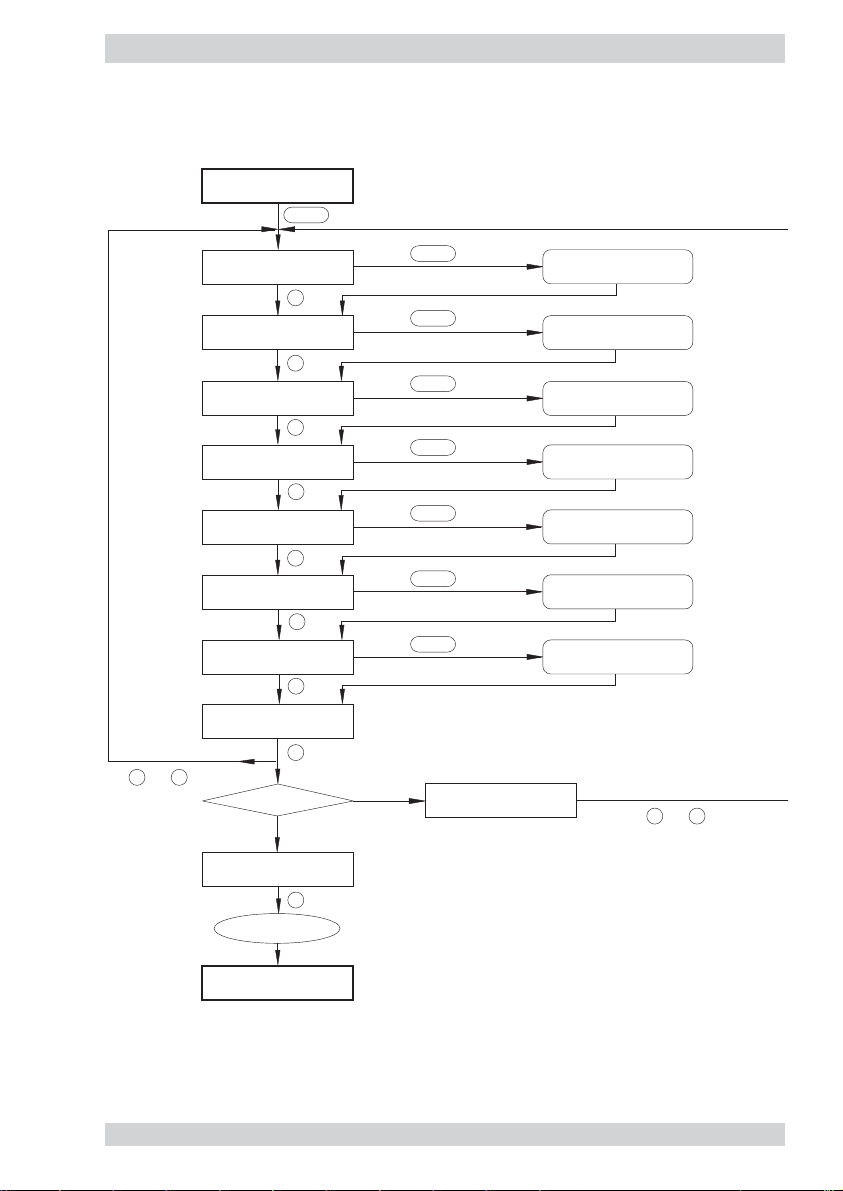
5.13 Configuration menu
Config. plausible?
yes
submenu
temperature unit
submenu
LS combination
submenu
sensor select
END OF CONFIG.?
M→yes ▲ or ▼ → no
CONFIGURATION
ANA OUT TEMP.
CONFIGURATION
ANA OUT FLOW
CONFIGURATION
DISPLAY SELECT
CONFIGURATION
TEMP. UNIT
CONFIGURATION
FLOW UNIT
M
CONFIGURATION
LIMIT SWITCHES
CONFIGURATION
ERROR CONFIG.
CONFIG. OK!
PUSH M
M
CONFIGURATION
SENSOR SELECT
M
M
M
M
M
M
M
▲ + ▼
▲ + ▼
▲ + ▼
▲ + ▼
▲ + ▼
▲ + ▼
▲ + ▼
▲ + ▼
PARAMETERS
A
B
C
D
E
F
G
submenu
flow unit
submenu
display selection
submenu
analogue temperature
submenu
analogue flow
no
return to main menu
See:
or
▲
▼
or
▲
▼
Page 44
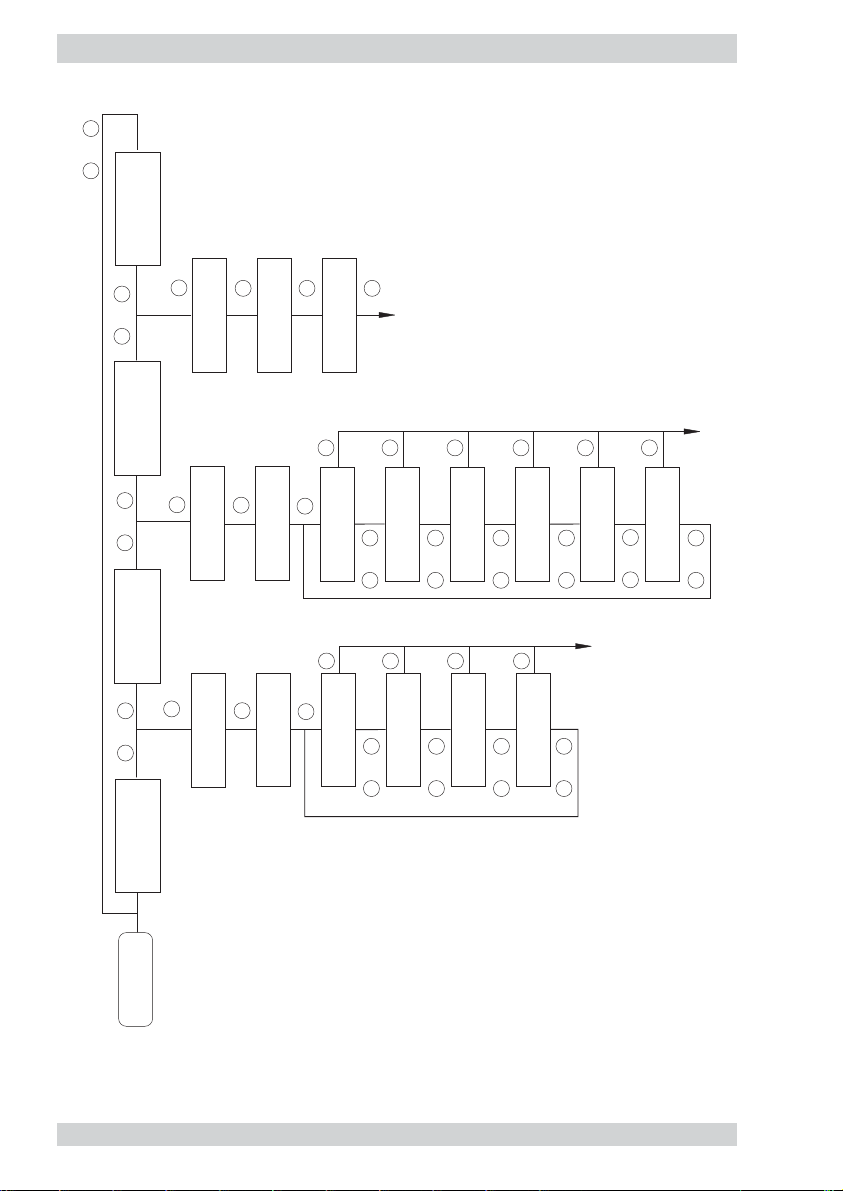
A
▼
or
▲
TYPE S-No. xxx
SENSOR SELECT
M
▼
or
▲
SENSOR SELECT
TYPE CSF-11WM1
▼
M
or
▲
SENSOR SELECT
TYPE CSP-11WM1
M
▼
or
▲
M
C xxx
SENSOR CODE
SENSOR CODE
SENSOR CODE
SENSOR CODE
M
C xxx
SENSOR CODE
M
C xxx
SENSOR CODE
T xxx
T xxx
T xxx
M
PIPE SIZE
DIAM. = xxx.x mm
M
M
TP01 (1/2 in)
TYPE SELECT
M
M
DN25 (1 in)
BV SIZE SELECT
M
Conf.
M
▼
TP02 (3/4 in)
TYPE SELECT
or
▲
M
▼
DN32 (1.1/4 in)
or
BV SIZE SELECT
▲
M
▼
TP03 (1 in)
TYPE SELECT
or
▲
M
▼
DN40 (1.1/2 in)
or
BV SIZE SELECT
▲
M
▼
TP04 (1.1/4 in)
TYPE SELECT
or
▲
M
▼
DN50 (2 in)
or
BV SIZE SELECT
▲
M
▼
TYPE SELECT
or
▲
▼
or
▲
M
▼
TP05 (1.1/2 in)
TYPE SELECT
or
▲
Conf.
Conf.
▼
TP06 (2 in)
or
▲
Conf.→ return to configuration menu
SENSOR SELECT
TYPE CSP-11WM1BV
submenu
sensor select
5.14 Configuration submenus
Page 45

Conf.
M
▼
or
▲
M
Conf.
▼
or
▲
Conf.
Conf.
Conf.
→ T LS2 → F
LIMIT SWITCHES
LS1
M
→ F LS2 → T
LIMIT SWITCHES
LS1
M
T
→
T LS2
→
LIMIT SWITCHES
LS1
M
F
→
F LS2
→
LIMIT SWITCHES
LS1
FLOW UNIT
BLANK (no unit)
▼
or
▲
▼
or
▲
▼
or
▲
M
Conf.
Conf.
Conf.
FLOW UNIT
M
FLOW UNIT
M
FLOW UNIT
▼
or
▲
FEET/SEC. (FPS)
▼
or
▲
PERCENT (%)
▼
or
▲
METRE/SEC (m/s)
Conf.
Conf.
Conf.
M
M
M
▼
or
▲
KELVIN (K)
TEMP. UNIT
▼
or
▲
TEMP. UNIT
FAHRENHEIT (°F)
▼
or
▲
°C)
TEMP. UNIT
CELSIUS (
Conf.→ return to configuration menu
Configuration submenus (cont’d)
submenu
limit switch
combination
B
flow unit
submenu
C
submenu
temperature unit
D
Page 46
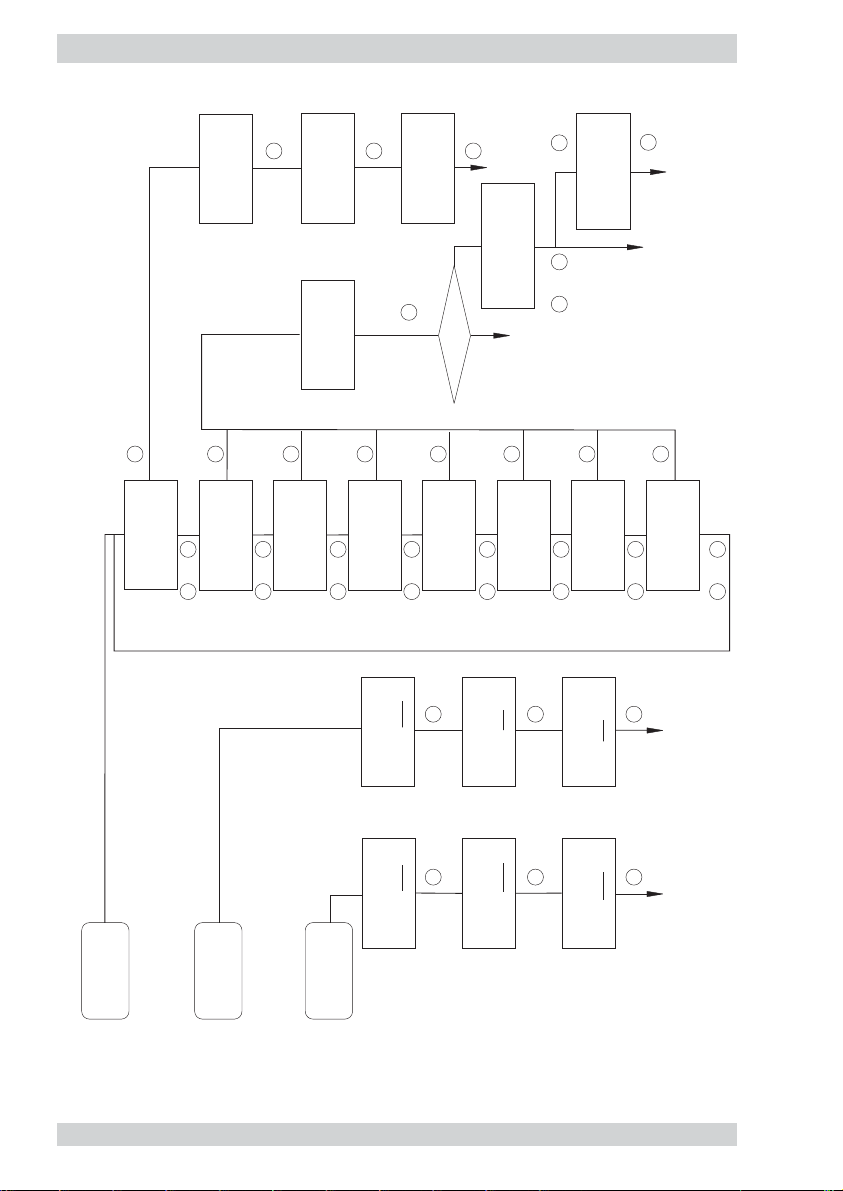
submenu
display selection
Totalizer function?
or
▲
▼
FREQUENCY OUTPUT?
M → yes other → no
FREQUENCY OUTPUT
PULSE/..........(unit)
M
M
DISPLAY SELECT
METRE
3
/HOUR
DISPLAY SELECT
LITRE/SECOND
DISPLAY SELECT
GALLONS°/MINUTE
DISPLAY SELECT
BARGRAPH
ANA OUT FLOW
ZERO = 0.5 m/s
Conf.
M
M
M
M
DISPLAY SELECT
LITRE
DISPLAY SELECT
METRE
3
BARGRAPH
ZERO = 10.0 m/s
BARGRAPH
FS = 20.0 m/s
ANA OUT FLOW
OFFSET =
(FS)
ANA OUT TEMP.
OFFSET = (FS)
PIPE SIZE
52.5 mm
ANA OUT TEMP.
ZERO = -10.0
°
C
ANA OUT TEMP.
FS = 85.0 °C
M
M
Conf.
BARGRAPH
TYP=FLOW or TEMP
M
ANA OUT FLOW
FS = 3.5 m/s
M
DISPLAY SELECT
LITRE/MINUTE
M
M
M
M
M
DISPLAY SELECT
GALLONS
°
° US-GALLONS
Conf.
M
M
Conf.
Conf.
Conf.
M
MM
E
F
G
Conf.
→
return to configuration menu
or
▲
▼
or
▲
▼
or
▲
▼
or
▲
▼
no
yes
submenu
analogue flow
submenu
analogue
temperature
or
▲
▼
or
▲
▼
or
▲
▼
or
▲
▼
Page 47

6 Parameter selection (menu option: PARAMETERS)
After configuration of the FC01-LQ in conformance with its application (configuration menu), it
is possible to set parameters (e.g. limit values).
During parameter setting, measuring operations are not possible (see Appendix 1).
The following parameters may be set in the Parameter selection menu:
6.1 Measuring time (menu option: MEAS. TIME)
The measuring time may be set between 1 and 30 sec., referring both to flow rate and medium
temperature.
The effect of the measuring time may be compared to that of a filter; it is used to determine the
average of the last measured values (measuring time 100 ms) after each measurement.
The set measuring time does not influence the measuring rate and display up-date.
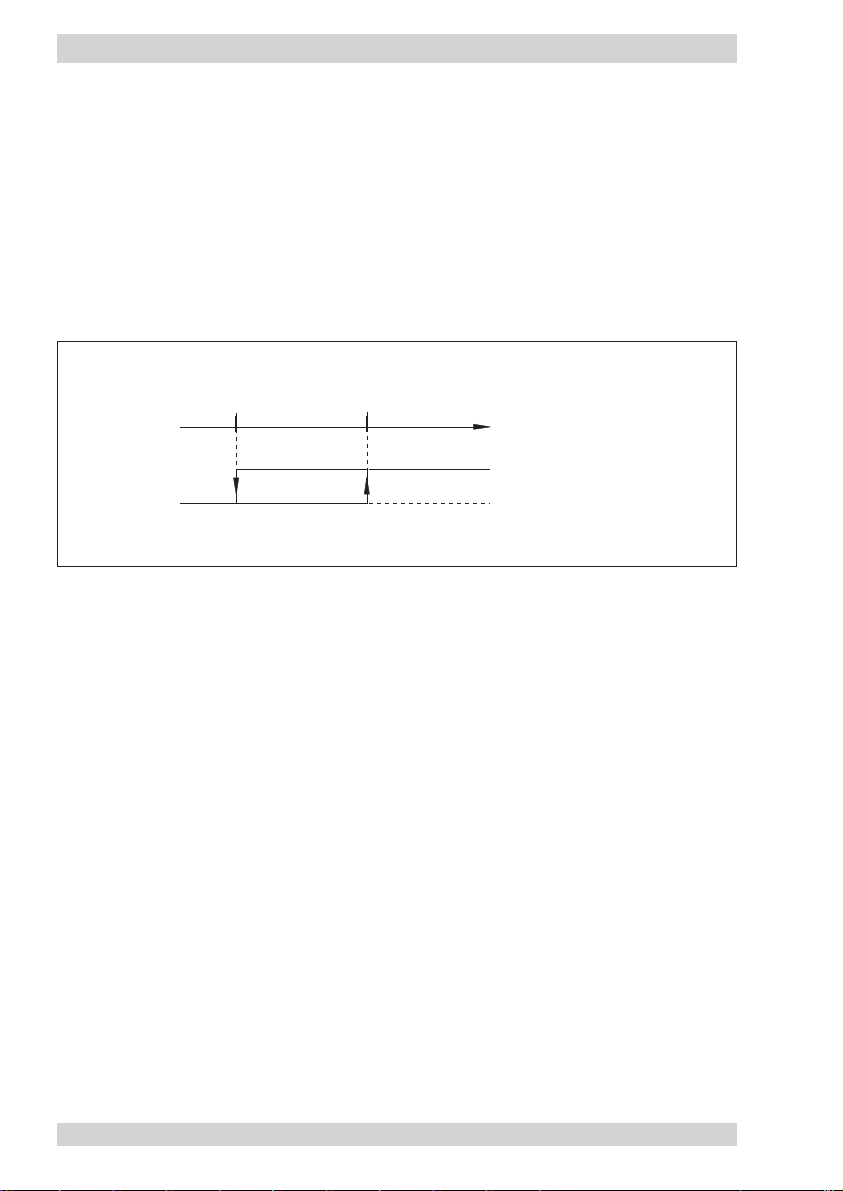
6.2 Limit switch 1 - switch-on value (menu option: LS1 ON = ......)
Limit switch 1 - switch-off value (menu option: LS1 OFF = ......)
Depending on the configuration (see configuration menu) limit value 1 may be set either for flow
rate or medium temperature.
The limit value may be set over the entire measuring range and is always related to the display
value.
Limit switch up-date is by measuring rate, independent of the set measuring time.
The hysteresis is determined by entering different switch-on and switch-off values. Its magnitude
should be reasonably adjusted to current operating conditions.
A specific definition of the operation (closed-current or open-circuit principle) may be dropped
by separately entering the switch-on and switch-off value of the limit switch, because the
definition is deducted from the switch-on and switch-off value..
fig. 23
Example 1: Switch-on value lower than switch-off value
switch-on value
0
ON
switch-off value
hysteresis
OFF
measured value
(flow/temperature)
∞
switching condition ON
switching condition OFF
Page 48
Example for ON:
FC01-LQ with relay outputs (option R2):
• LIM1 - LIM1COM = closed
/LIM1 - LIM1COM = open
FC01-LQ with transistor outputs (option T4):
• LIM1E - LIM1C = switched
Example 2: Switch-on value higher than switch-off value
Example for ON: as described in example 1 (fig. 23)
With limit switch 1 set for flow rate and a flow volume/time unit selected in menu DISPLAY
SELECT, and when setting the switch-on and switch-off value, the pertinent flow volumes will
also be indicated.
6.3 Limit switch 2 - switch-on value (menu option: LS2 ON = ......)
Limit switch 2 - switch-off value (menu option: LS2 OFF = ......)
See limit switch 1!
6.4 Scaling factor (menu option: FLOWSCALE)
The scaling factor influences flow rate indication.
The factor, which may be set between 0.01 and 9.99, allows flow rate indication changes
(increasing or reducing the measured value in the display).
For example, the scaling factor may be used to indicate the average flow rate in the pipeline
rather than that available at the sensor.
fig. 24
ON
OFF
switch-off value
0
hysteresis
switch-on value
measured value
(flow/temperature)
∞
switching condition ON
switching condition OFF
Page 49

6.5 Quitting the parameter selection menu
Before the parameter selection menu can be quitted, the controller will conduct a plausibility
check of the data entered.
“PARAMETERS OK!” is indicated when the data are found to be correct. The menu may then be
quitted by pressing MODE.
Errors found during the plausibility check are indicated in the following sequence of priority.
Priority of entry errors in the PARAMETER SELECTION menu:
• ERROR LS1 OUT OF RANGE
switch-on and/or switch-off value for limit switch 1 outside measuring range
• ERROR LS2 OUT OF RANGE
switch-on and/or switch-off value for limit switch 2 outside measuring range
• ERROR LS1 ON = OFF
switch-on value for limit switch 1 equals switch-off value for limit switch 1
• ERROR LS2 ON = OFF
switch-on value for limit switch 2 equals switch-off value for limit switch 2
The menu can only be quitted after correction of the error(s). To do this, return to the beginning
of the parameter selection menu by pressing UP or DOWN and select the menu option
with the incorrect entry for correction.
An overview of the parameter selection menu is shown on the following page.
M
▲
▼
Page 50

END OF PARAM.?
M→yes ▲ or ▼ → no
PARAMETERS OK!
PUSH M
no
return to main menu
yes
▲
▼
or
▲
▼
or
PARAMETERS
FLOWSCALE 1.12
PARAMETERS
LS2 OFF = 68.5 °C
PARAMETERS
LS2 ON = 73.0 °C
PARAMETERS
PARAMETERS
MEAS. TIME = 3 sec
ERROR PARAMET.
Paramet. plausible?
PARAMETERS
LS1 ON = 1.24 m/s
PARAMETERS
LS1 OFF = 1.50 m/s
▲ + ▼
LAST ERROR
MM
M
M
M
M
M
M
M
Page 51

7 Errors
7.1 Test and diagnosis
The FC01-LQ is provided with extensive test and diagnosis functions which may be classified
as follows:
7.1.1 Priority group I
Priority group I comprises the switch-on test routines (FC01-LQ self-test) which are carried out
when the system is switched on.
Their implementation is indicated.
Errors No. 1 to 5 do not allow system operation.
The test routines may be repeated by pressing any of the switches.
If even after several trials the switch-on test cannot be conducted without error indication, the
system should be returned to the supplier for rectification, indicating the error number.
Priority I errors cannot be rectified by the user!
7.1.2 Priority group II
These test functions are continuously carried out during operation. The occurrence of errors
No. 10 and 21 will cause measurements to stop, indicating the error and monitoring the source
of the error. Upon rectification of the error, the system will automatically return to measuring
operation.
7.1.3 Priority group III
These test routines are also continuously carried out during operation.
Other than the above priority groups, errors No. 20, 30, 60, 40 and 41 will not cause
measurements to stop; the error output will indicate and the number of the error will be shown
on the display.
Page 52

7.2 Potential errors
Independent of the priority group, all errors found are indicated with their relevant number.
In order to facilitate operation, the last error is stored in a non-volatile memory. The stored error
may be retrieved and deleted in the main menu.
If a combination of errors occurs simultaneously, they are indicated or stored in the error memory
observing the following sequence.
Priority group I
Error Cause Rectification
No. 1 No system parameter available Return to supplier.
No. 2 Incorrect test sum of parameter Return to supplier.
memory
No. 3 Incorrect test sum of program Return to supplier.
memory
No. 4 Incorrect test sum of data memory Return to supplier.
No. 5 Internal controller error Return to supplier.
Priority group II
Error Cause Rectification
No. 10 Sensor not connected; or cable Check cable or replace sensor.
between FC01-LQ and sensor
defective; or defective sensor
Sensor selected (configuration) Correct sensor selection in
differs from sensor connected configuration menu
No. 21 Medium temperature too high
Page 53

Priority group III
Error Cause Rectification
No. 20 Medium temperature too low
No. 30 Over limits of flow rate
No. 60 Assignment of quantity per pulse
too low *
No. 40 Controller error (oscillator-watchdog)
Admissible EMC levels may have
been exceeded
No. 41 Controller error (watchdog timer)
Admissible EMC levels may have
been exceeded
* Error No. 60 can only occur with version FC01-U1T4.
Page 54

8 Technical data
8.1 Ambient conditions
rail-mounted surface mounted front panel mounted
Storage temperature: -20 … +70 °C -20 … +70 °C -20 … +70 °C
Ambient temperature: * +10 … +50 °C ** +10 … +50 °C +10 … +50 °C
Degree of protection: IP20 IP65 IP65
* Only if the modules are spaced by at least 10 mm.
** The max. ambient temperature of +40 °C applies to all systems fitted with current output C1.
8.2 Electrical characteristics
8.2.1 Power supply
DC supply
Pin selection: Signal name Pin XV
shield 1
+U
V
2
-U
V
3
8.2.1.1 DC voltage supply
Supply voltage: U
VN
= DC 24 V *
Input voltage range: U
V
= DC 19 V to DC 32 V
(ripple incl.)
Admissible ripple: max. 20 % U
V
Rated current consumption: I
vnk
= 170 mA with zero flow
I
vnk
= 200 mA with max. flow (end of measuring range)
Power consumption may be up to 300 mA±10 % when analogue output C1 is fitted.
* DC 12 V possible if the FC01-LQ is used whithout option C1 (analogue outputs).
Page 55

Inrush current: Ip= typ. 3 A (20 µs)
Switch-off current: I
kipp
= typ. 0.75 A
Rated power consumption: P
n
= 4.1 W with zero flow, voltage outputs
P
n
= 4.8 W max. flow (end of measuring range),
voltage outputs
Insulation voltage: supply input - central electronic unit ≥ DC 500 V
8.3 Analogue outputs
The analogue outputs are physically isolated from each other as well as from the electronic
control unit FC01-LQ.
Pin selection for analogue outputs V1, V2 and C1
Signal name Pin XAO
NC 1
analogue output 1 - flow rate 2
reference ground 1 3
shield 1 * 4
shield 2 * 5
analogue output 2 - temperature 6
reference ground 2 7
NC 8
NC - not used
Analogue output 1 - ANA OUT FLOW (flow output)
Analogue output 2 - ANA OUT TEMP. (temperature output)
* Shield ungrounded - apply on one side only.
The output is reverse polarity protected.
Insulation voltage: analogue output - analogue output DC 500 V
analogue output - central electronic unit DC 500 V
Page 56

8.3.1 Voltage output V1 - 5 V FS
Signal voltage range: US= 0 V (1 V) to 5 V ±2% FS
Max. signal rippl: dU
S
= 5% FS
Min. admissible load resistance: R
l
= 1 kΩ
Max. admissible load capacity: C
l
= 1 nF
Max. admissible load inductance: L
l
= 100 nH
Short circuit proof: yes (XAO - between all terminals)
8.3.2 Voltage output V2 - 10 V FS
Signal voltage range: US= 0 V (2 V) to 10 V ±2% FS
Max. signal ripple: dU
S
= 5% FS
Min. admissible load resistance: R
l
= 1 kΩ
Max. admissible load capacity: C
l
= 1 nF
Max. admissible load inductance: L
l
= 100 nH
Short circuit proof: yes (XAO - between all terminals)
8.3.3 Current output C1 - 20 mA FS
Signal current range: IS= 0 mA (4 mA) to 20 mA ±2% FS
Max. signal ripple: dI
S
= 5% FS
Min. admissible load resistance: R
l
= 0Ω
Max. admissible load resistance: R
l
= 250Ω
8.4 Signal outputs
The signal outputs are physically isolated from each other as well as from the electronic
control unit FC01-LQ.
8.4.1 Relay outputs R2 (DC or AC)
Pin selection: Signal name Pin XAH
Limit Switch 1 / shield 1
Limit Switch 1 / N/O 2
Limit Switch 1 / common 3
Limit Switch 1 / N/C 4
Limit Switch 2 / Schirm 5
Limit Switch 2 / N/O 6
Limit Switch 2 / common 7
Limit Switch 2 / N/C 8
Page 57

Resistive load
Max. admissible switching capacity: 50 W
Max. admissible switching current: 1 A
Max. admissible continuous current: 1 A
Max. admissible switching voltage: 50 V
Contact life at 1 A: 3 x 10
5
cycles
Inductive load - with safety circuit - AC voltage
Max. admissible switching capacity: 125 VA
Max. admissible switching current: 1.25 A
Max. admissible continuous current: 1.25 A
Max. admissible switching voltage: 100 V
Contact life cos = 0.5: 2.4 x 10
5
cycles
Insulation voltage: signal contact - central electronic unit DC 500 V
signal contact - signal contact DC 500 V
8.4.2 Transistor outputs (DC)
Pin selection: Signal name Pin XAH Polarity
/ ERROR emitter 1 -
/ ERROR collector 2 +
/ BUSY / PULSE emitter 3 -
/ BUSY / PULSE collector 4 +
Limit Switch 2 emitter 5 -
Limit Switch 2 collector 6 +
Limit Switch 1 emitter 7 -
Limit Switch 1 collector 8 +
Voltage level
Low level - active: U
ce
< 0.8 V at IC< 10 mA
U
ce
< 1 V at IC< 100 mA
High level - passive: U
ce
< 48 V
U
ce max
= 60 V
max. leakage current ≤ 25 µA
Reverse polarity protection: yes
Short circuit protection: yes
Page 58

Resistive load
Max. admissible switching capacity: 1.5 W
Max. admissible switching current: 150 mA
Max. admissible switching voltage: 36 V
Inductive load - L < 100 mH
(DC voltage - without external safety circuit)
Max. admissible switching capacity: 1.5 VA
Max. admissible switching current: 40 mA
Max. admissible switching voltage: 36 V
Capacitive load - C < 20 µF
Max. admissible switching capacity: 1.5 VA
Max. admissible switching current: 1.5 A
Max. admissible switching voltage: 36 V
Insulation voltage: signal contact - central electronic unit DC 500 V
signal contact - signal contact DC 500 V
Page 59

8.5 Metrological data
8.5.1 Flow rate measurement
Measuring is possible up to the flow rates indicated in the display range. However , the indi cated
accuracy is no longer guaranteed. The repeatability value remains valid.
8.5.1.1 Monitoring head CSP- with sensor adapter type TP-..
Flow rate measurement:
Sensor adapter Measuring range Display range
type in m3/h in m3/h
TP01 0.02 … 2.2 2.9
TP02 0.04 … 3.4 4.5
TP03 0.05 … 5.3 7.1
TP04 0.1 … 8.7 11.6
TP05 0.14 … 13.6 18.1
TP06 0.2 … 21.2 28.3
8.5.1.2 Monitoring head CSF
Flow measurement ranges:
The flow measurement range is determined by the inner pipe diameter (see table). It can be
calculated with the following equation:
Q = V
N
x A
R
Q [m3/h] - flow quantity
V
N
[m/h] - average standard velocity
A
R
[m2] - inner pipe cross-section
Page 60

Inner pipe diamater Measuring range Display range
D in mm in m3/h in m3/h
50 21 28
80 55 70
100 85 110
150 190 250
200 340 450
250 530 700
350 1040 1380
500 2120 2830
Setting range for internal pipe diameter: 50.0 mm … 999.9 mm
Measuring range: 0.05 … 3 m/s
Display range: 0 … 4 m/s
Response delay: 2.5 s
Repeatability: 1% MW **
(5% MBE to 100% MBE)
Accuracy: ±1% MBE * at 2 m/s
see failure ddiagram)
Failure diagram for water
8.00
6.00
4.00
2.00
0.00
0.20 0.40 0.60 0.80 1.00 1.20 1.40 1.60 1.80 2.00 2.20 2.40 2.60 2.80 3.000
-2.00
f (% of upper range value)
-4.00
-6.00
-8.00
+f max
calibration point at 2 m/s: ±1% of upper range value
-f max
v (m/s)
Page 61

8.5.2 Temperature measurement:
Measuring range: -40 °C … +130 °C
Accuracy: ±1% MB ***
8.5.3 Electronic control unit FC01-LQ
Temperature drift: 0.1%/K/MBE *
Heating up period until full
accuracy is reached: 15 min.
* MBE - of final value
** MW - measured value
*** MB - measuring range
Page 62

8.6 Sensor interface
8.6.1 Electrical data of the terminal for calorimetric monitoring heads
Terminal Mnemonics Data
XSK1 R(HEIZ)-LO Function: terminal for negative pole of heater element
Drain output of heating current control
Max. sink current: I
sink
= 88 mA
Dielectric strength: -0.5 V … +20 V DC
XSK2 R(HEIZ)-HI Function: terminal for positive pole of heater element
Hi-potential of heater source
Output voltage range (load dependent)
U
a
= 21 V … 24 V DC
Max. current output: I
max
= 100 mA
Not short-circuit proof
XSK3 R(Tref)-HI Function: terminal for positive RTD * pole for medium
temperature measurement
Input resistance: > 1 GΩ
Dielectric strength: -17 V … +30 V DC
XSK4 R(Tref)-LO Function: terminal for negative RTD * pole for medium
temperature measurement
Input resistance: > 1 GΩ
Dielectric strength: -17 V … +30 V DC
XSK5 AGND Function: analogue ground
Reference potential of exitation current source for
RTD * operation
XSK6 IS Function: output of exitation current source for
RTD * operation
Exitation current: 1 mA ± 1%
Admissible load range: R
load
= 0 … 2 k
Dielectric strength: ±15 V DC
XSK7 SGND Function: shield ground
XSK8 Terminals for sensor cable shielding
XSK9 R(Tdiff)-LO Function: terminal for negative pole of the heated RTD *
Input resistance: > 1 GΩ
Dielectric strength: -17 V … +30 V DC
XSK10 R(Tdiff)-HI Function: terminal for positive pole of the heated RTD *
Input resistance: > 1 GΩ
Dielectric strength: -17 V … +30 V DC
* RTD = Resistive Temperature Device
Page 63

9 Accessories
No. Accessory Ordering configuration
1 surface mounted housing FC01-LQ-FH
2 front mounted housing FC01-LQ-ST
3 connecting cable for calorimetric monitoring head
cable type LifYCY 4 x 2 x 0.2 mm
2
Do+Ka
- Typ 15/ -10 °C … +80 °C highly flexible/paired
- Typ 18/ -60 °C … +200 °C non-halogenuous/highly flexible/paired
4 calorimetric monitoring heads CSP / CSF
5 sensor adapter (screw-in or welding type) TP
6 ball valve BV
7 locking set 01 (for monitoring head CSF-11) 0Z122Z00024
Page 64

Page 65

Index
A
ANA OUT FLOW . . . . . . . . . . . . . . . . . . . . . . . . . . . . . . . . . . . . . . . . . . . . . . . . . . . . . . 35, 40
ANA OUT TEMP . . . . . . . . . . . . . . . . . . . . . . . . . . . . . . . . . . . . . . . . . . . . . . . . . . . . . . 35, 40
Analogue outputs . . . . . . . . . . . . . . . . . . . . . . . . . . . . . . . . . . . . . . . . . . . . . . . . . 3, 4, 18, 49
B
Ball valve . . . . . . . . . . . . . . . . . . . . . . . . . . . . . . . . . . . . . . . . . . . . . . . . . . . . . . . . . . . . . . . . 9
BARGRAPH . . . . . . . . . . . . . . . . . . . . . . . . . . . . . . . . . . . . . . . . . . . . . . . . . . . . . . . . . 33, 40
C
Configuration . . . . . . . . . . . . . . . . . . . . . . . . . . . . . . . . . . . . . . . . . . . . . . . . . . . . . . . . 30, 37
D
DISPLAY SELECT . . . . . . . . . . . . . . . . . . . . . . . . . . . . . . . . . . . . . . . . . . . . . . . . . . . . 32, 40
E
Error . . . . . . . . . . . . . . . . . . . . . . . . . . . . . . . . . . . . . . . . . . . . . . . . . . . . . . . . . . . . . . . . . 45
F
FLOW UNIT . . . . . . . . . . . . . . . . . . . . . . . . . . . . . . . . . . . . . . . . . . . . . . . . . . . . . . . . . 32, 39
FLOWSCALE . . . . . . . . . . . . . . . . . . . . . . . . . . . . . . . . . . . . . . . . . . . . . . . . . . . . . . . . 42, 44
FREQUENCY OUTPUT . . . . . . . . . . . . . . . . . . . . . . . . . . . . . . . . . . . . . . . . . . . . 3, 4, 22, 34
Front panel mounted version FC01-LQ-ST-U1... . . . . . . . . . . . . . . . . . . . . . . . . . . . . 16, 48
I
Insertion monitoring head CSP-11 . . . . . . . . . . . . . . . . . . . . . . . . . . . . . . . . . . . . . . . . 7, 53
K
Keypads . . . . . . . . . . . . . . . . . . . . . . . . . . . . . . . . . . . . . . . . . . . . . . . . . . . . . . . . . . . . . . . 24
L
LAST ERROR . . . . . . . . . . . . . . . . . . . . . . . . . . . . . . . . . . . . . . . . . . . . . . . . . . . . . . . . 28, 29
LIMIT SWITCHES . . . . . . . . . . . . . . . . . . . . . . . . . . . . . . . . . . . . . . . . . . . . . . . . . . . . 31, 39
LS1 OFF . . . . . . . . . . . . . . . . . . . . . . . . . . . . . . . . . . . . . . . . . . . . . . . . . . . . . . . . . . . . 41, 44
LS1 ON . . . . . . . . . . . . . . . . . . . . . . . . . . . . . . . . . . . . . . . . . . . . . . . . . . . . . . . . . . . . 41, 44
LS2 OFF . . . . . . . . . . . . . . . . . . . . . . . . . . . . . . . . . . . . . . . . . . . . . . . . . . . . . . . . . . . . 42, 44
LS2 ON . . . . . . . . . . . . . . . . . . . . . . . . . . . . . . . . . . . . . . . . . . . . . . . . . . . . . . . . . . . . 42, 44
Page 66

M
Main menu . . . . . . . . . . . . . . . . . . . . . . . . . . . . . . . . . . . . . . . . . . . . . . . . . . . . . . . . . . 26, 29
MEAS. TIME . . . . . . . . . . . . . . . . . . . . . . . . . . . . . . . . . . . . . . . . . . . . . . . . . . . . . . . . 42, 45
Monitoring head with adjustable immersion depth CSF-11 . . . . . . . . . . . . . . . . . . . . 10, 54
P
PARAMETERS, parameter selection . . . . . . . . . . . . . . . . . . . . . . . . . . . . . . . . . . . . . . 41, 44
PEAK VALUE MAX . . . . . . . . . . . . . . . . . . . . . . . . . . . . . . . . . . . . . . . . . . . . . . . . . . . . 28, 29
PEAK VALUE MIN . . . . . . . . . . . . . . . . . . . . . . . . . . . . . . . . . . . . . . . . . . . . . . . . . . . . 28, 29
PIPE SIZE . . . . . . . . . . . . . . . . . . . . . . . . . . . . . . . . . . . . . . . . . . . . . . . . . . . . . . . . . . 34, 40
Power supply . . . . . . . . . . . . . . . . . . . . . . . . . . . . . . . . . . . . . . . . . . . . . . . . . . . . . . 5, 17, 48
R
Rail-mounted version FC01-LQ-U1... . . . . . . . . . . . . . . . . . . . . . . . . . . . . . . . . . . . . . . 14, 48
Relay outputs . . . . . . . . . . . . . . . . . . . . . . . . . . . . . . . . . . . . . . . . . . . . . . . . . . 4, 18, 20, 50
S
SENSOR CODE . . . . . . . . . . . . . . . . . . . . . . . . . . . . . . . . . . . . . . . . . . . . . . . . . . . . . . 30, 38
SENSOR SELECT . . . . . . . . . . . . . . . . . . . . . . . . . . . . . . . . . . . . . . . . . . . . . . . . . . . . 30, 38
Sensor adapter TP-... . . . . . . . . . . . . . . . . . . . . . . . . . . . . . . . . . . . . . . . . . . . . . . . . . . . 8, 53
Signal outputs . . . . . . . . . . . . . . . . . . . . . . . . . . . . . . . . . . . . . . . . . . . . . . . . . . . . . 4, 18, 50
Surface mounted version FC01-LQ-FH-U1... . . . . . . . . . . . . . . . . . . . . . . . . . . . . . . . 15, 48
T
TEMP. UNIT . . . . . . . . . . . . . . . . . . . . . . . . . . . . . . . . . . . . . . . . . . . . . . . . . . . . . . . . . 32, 39
TOTALISATOR . . . . . . . . . . . . . . . . . . . . . . . . . . . . . . . . . . . . . . . . . . . . . . . . . . . . . . . . . .32
Transistor outputs . . . . . . . . . . . . . . . . . . . . . . . . . . . . . . . . . . . . . . . . . . . . . . . 4, 18, 21, 51
X
XAH - signal outputs . . . . . . . . . . . . . . . . . . . . . . . . . . . . . . . . . . . . . . . . . . . . . . . . . . . . . 18
XAO - analogue outputs . . . . . . . . . . . . . . . . . . . . . . . . . . . . . . . . . . . . . . . . . . . . . . . . . . 18
XAS - secondary current supply . . . . . . . . . . . . . . . . . . . . . . . . . . . . . . . . . . . . . . . . . . . . 19
XSK - Connection of calorimetric monitoring heads CS_x . . . . . . . . . . . . . . . . . . . . . . . . . 19
XTF - Keyboard release . . . . . . . . . . . . . . . . . . . . . . . . . . . . . . . . . . . . . . . . . . . . . . . . . . . 17
XV - Power supply . . . . . . . . . . . . . . . . . . . . . . . . . . . . . . . . . . . . . . . . . . . . . . . . . . . . . . .17
Page 67

MAX
TEMP.
ANA OUT
MAX
FLOW
ANA OUT
MIN
MIN
MIN
MIN
MIN
MIN
MIN
MIN
MIN
MIN
MIN
MIN
MIN
MIN
X
X
X
X
MIN
MIN
MINXMIN
X
MIN
MIN
MINXMIN
X
X
X
X
X
ON
OFF
OUTPUT
FREQUENCY
NOT BUSY and
ON
OFF
NO ERROR
ON
LIMIT
LIMIT
Duty-/
OFF
SWITCH 2
ON
OFF
SWITCH 1
Error status
OFF
OFF
OFF
OFF
OFF
OFF
OFF
OFF
OFF
OFF
OFF
OFF
OFF
OFF
OFF
OFF
OFF
OFF
OFF
OFF
OFF
ON
OFF
OFF
ON
ON
X
X
OFF
ON
OFF
OFF
OFF
OFFONOFF
ON
OFF
OFF
OFFXOFF
OFF
OFFXOFF
OFF
ONFAON
OFF
OFF
X
X
OFF
X
X
ON
Y
Y
X
X
* When frequency output has been selected.
Note: The occurence of error No. 40/41 will always cause an internal reset.
X
X
Status of the outputs prior to the error status described → see start-up (reset)
Appendix 1 - Performance of the digital and analogue outputs during the operating and error modes
Start-up (reset)
Start-up test active
Error No. 1
Error No. 2
Error No. 3
Error No. 4
Error No. 5
Heating period active
Normal duty
Configuration active
Parameter selection active
Error No. 10
Error No. 20
Error No. 21
Error No. 30
Error No. 60 *
Error No. 40
Error No. 41
X = standard performance
Y = OFF pulse
FA = frequeny output 10 Hz
Page 68

Page 69

Flow Meter FC01-LQ
Appendix 2
Appendix 2 - Menu structure of the FC01-LQ (operator dialog)
not available with sensor type CSP
nur bei gewählter Totalisatoreinheit
return to configuration menu
action
Menus
page up
page down
select and return to configuration menu
call menu or delete function
yes
Totalizer function?
▲
▼
or
▲
▼
or
yes
Param. plausible?
▲
▼
or
▲
▼
or
DELETE
MIN VALUE
DELETE
totalized quantity
DELETE
MAX VALUE
M
M
CODE T xxx
M
CODE C xxx
BARGRAPH
LITRE/SEC (l/s)
LITRE/MIN (l/min)
m
3
/HOUR (m3/h)
GALLONSϒ/MINUTE (GPM)
LITRE (l)
METRE
3
(m3)
GALLONS° (G)
▲ + ▼
*
**
TYPE CSP-11 WM1
TYPE CSP-11 WM1BV
TYPE CSF-11 WM1
TYPE S-No. xxx
▲ + ▼
▲
▼
M
M
M
M
M
M
M
M
M
M
M
M
M
M
M
M
M
M
M
M
M
M
M
M
M
M
M
POWER ON!
HEATING UP
CONFIGURATION
PEAK VALUE MAX
PEAK VALUE MIN
12.5 m/s -13.5°C
END OF CONFIG.?
Config. plausible?
ERROR CONFIG.
CONFIG. OK!
no
FLOW UNIT
LIMIT SWITCHES
TEMP. UNIT
DISPLAY SELECT
ANA OUT FLOW
ANA OUT TEMP.
FS
ZERO
OFFSET
FS
ZERO
OFFSET
LS1 ON
MEASURING TIME
END OF PARAM?
FLOWSCALE
LS2 OFF
LS2 ON
LS 1 OFF
PARAMETERS
ERROR PARAM.
PARAM. OK!
no
M
LAST ERROR
M
M
CODE T xxx
M
CODE C xxx
M
SENSOR SELECT
M
ZERO
FS
M
M
→
TYPE
PERCENT (%)
METRE/SEC (m/s)
FEET/SEC (FPS)
BLANK (no unit)
LS1 → F / LS2 → F
LS1 → T / LS2 → F
LS1 → F / LS2 → T
LS1 → T / LS2 → T
M
M
▲ + ▼
▲
+
▼
▲
+
▼
▲ + ▼
▲ + ▼
DELETE
LAST ERROR
▲ + ▼
▲ + ▼
▲ + ▼
▲ + ▼
CELSIUS (°C)
FAHRENHEIT (°F)
KELVIN (K)
▲ + ▼
▲ + ▼
▲ + ▼
M
PIPE SIZE
FREQUENCY OUTPUT?
M →yes other → no
M
▲
▼
or
**
*
FREQUENCY OUTPUT
PULSE/..........(unit)
M
M
M
M
CODE T xxx
M
CODE C xxx
DN25 (1 in)
DN32 (1.1/4 in)
DN40 (1.1/2 in)
DN50 (2 in)
TP01 (1/2 in)
TP02 (3/4 in)
TP03 (1 in)
TP04 (1 1/4 in)
TP05 (1 1/2 in)
TP06 (2 in)
M
CONFIGURATION MENU
MAIN MENU
yes
PARAMETER SELECTION MENU
no
 Loading...