


Users manual FA845 version 1.5
Envionic
1
Field Analyzer FA845
Users Manual
Also for the FA720, FA725, FA730 and FA735
www.envionic.com

Users manual FA845 version 1.5
Envionic
2
Contents
Contents ........................................................................................................................................ 2
Introduction .................................................................................................................................. 4
Accessories delivered with the device ...................................................................................... 6
Chapter 1 General ........................................................................................................................ 7
1.1 Switching ON or OFF .................................................................................................... 7
1.2 Micro-SD memory card ................................................................................................. 8
1.3 Choosing what to measure ............................................................................................. 9
1.4 Speaker ........................................................................................................................ 10
1.5 Batteries ....................................................................................................................... 11
1.6 Changing or charging batteries .................................................................................... 12
1.7 Setting time and date ................................................................................................... 13
1.8 Installing a new software version ................................................................................ 13
Chapter 2 RF High frequency electromagnetic field ................................................................. 14
2.1 Measurement with LogPer antenna ............................................................................. 14
2.2 Measurement with omni-directional antenna .............................................................. 15
2.3 Display ......................................................................................................................... 16
2.4 Frequency measurement .............................................................................................. 17
2.5 Hold function ............................................................................................................... 18
2.6 Choosing the measurement unit ................................................................................... 18
2.7 Display signal pulsation ............................................................................................... 19
2.8 Safe values ................................................................................................................... 20
Chapter 3 RF SCAN mode ........................................................................................................ 21
3.1 Spectrum analyzer introduction ................................................................................... 21
3.2 SCAN Display ............................................................................................................. 22
3.3 SCAN Frequency bands .............................................................................................. 23
3.4 SCAN Peak display ..................................................................................................... 24
3.5 Other functions in SCAN mode ................................................................................... 25
3.6 Single frequency measurement .................................................................................... 26
3.7 SCAN mode Hold function ......................................................................................... 27
3.8 Define a list of frequency bands .................................................................................. 28
Chapter 4 RF Expert mode ........................................................................................................ 30
4.1 XPRT Display ............................................................................................................. 30
4.2 XPRT functions .......................................................................................................... 31
4.3 Frequency control ........................................................................................................ 33
4.4 Directly enter Center Frequency .................................................................................. 34
4.5 Changing the SPAN ..................................................................................................... 35
4.6 Directly enter START and STOP frequency ............................................................... 36
Chapter 5 Low frequency electric field ..................................................................................... 37
5.1 Orientation ................................................................................................................... 37
5.2 Measurements .............................................................................................................. 38
5.3 Safe values ................................................................................................................... 39
5.4 Orientation for older devices ....................................................................................... 39
Chapter 6 Low frequency magnetic field .................................................................................. 40
6.1 Measurement ................................................................................................................ 40
6.2 Safe values ................................................................................................................... 41
Chapter 7 Displaying logged measurement results ................................................................... 42
7.1 Display logged measurements on the device itself ...................................................... 42
7.2 Connecting the Micro-SD card to your PC.................................................................. 44

Users manual FA845 version 1.5
Envionic
3
7.3 View measurements with your computer .................................................................... 45
Appendices ................................................................................................................................. 46
Appendix 1 Specifications FA845 .................................................................................... 46
Appendix 2 Conversion from microwatt /m² to milliVolt /meter. .................................... 47
Appendix 3 More information .......................................................................................... 48
Appendix 4 Abbreviations ................................................................................................ 48

Users manual FA845 version 1.5
Envionic
4
Introduction
This manual is intended for the FA845, and also for the FA720, FA725, FA730 and FA735.
But these last four devices do not have all features of the FA845.
The features of the devices can be found in the next table:
FA720 FA725 FA730 FA735 FA845
RF measurement up to 6 GHz ● ● ● ● ●
Spectrum analyzer up to 3.7 GHz ●
Low frequency electric field measurement ● ● ●
Low frequency magnetic field measurement ● ● ●
Data logging on micro-SD memorycard ● ● ●
Software upgrade through micro-SD card ● ● ●
Carrying case included ● ●
For the RF measurement mode, not only the strength, but also the frequency can be measured.
The RF mode can also measure pulsed signals. The pulsation can be heard via the build in
speaker. In the ‘time’ mode, you can view these pulses on the screen.
The spectrum analyzer can measure very low field strengths (and their frequency).
The figures measured are displayed on a clear graphic LCD display.
The low frequency fields are also audible on the speaker, and their waveform is visible on the
screen.
After every 10 second time interval, the maximum measured value in this interval is
determined, and the result is written to a micro-SD memory card. The current time and date are
written together with these measurements. The recorded data can be viewed on the device
itself, or on your PC (as an Excel spreadsheet).
The internal software can be upgraded through the micro-SD card.
Software versions below 2.0 can not be upgraded to versions 2.0 or higher, because the newer devices
have a slightly different internal construction. All devices delivered after september 2015 have the
newer construction and have version 2.0 or higher installed.

Users manual FA845 version 1.5
Envionic
5
The FA845 is a sensitive measurement device that measures three kinds of fields.
The fields measured are:
1) High frequency electromagnetic fields that are emitted by:
- GSM mobile telephones and their base station/ broadcasting masts
- UMTS mobile telephones and their base station/ broadcasting masts
- DECT cordless phone base stations (they emit regardless in use or not)
- DECT cordless telephones
- WLAN (or WIFI) wireless computer networks
- WIMAX wireless network
- wireless video systems
- microwave ovens
- bluetooth wireless systems
- television transmitters
2) Low frequency electric fields (FA 730/735/845 only) that are emitted by:
- Home supply power lines
- 110 or 230 volt wall sockets and connected appliances (also when switched off)
- Out door electric power lines
3) Low frequency magnetic fields (FA 730/735/845 only) that are emitted by:
- Power adapters
- Many 110 / 230 volt appliances
- Alarm clocks
- Transformers of halogen incandescent lamps
- outdoor electric power lines
- electric motors/ engines
Picture: The FA845 or FA735 in its carrying case
Users manual FA845 version 1.5
Envionic
6
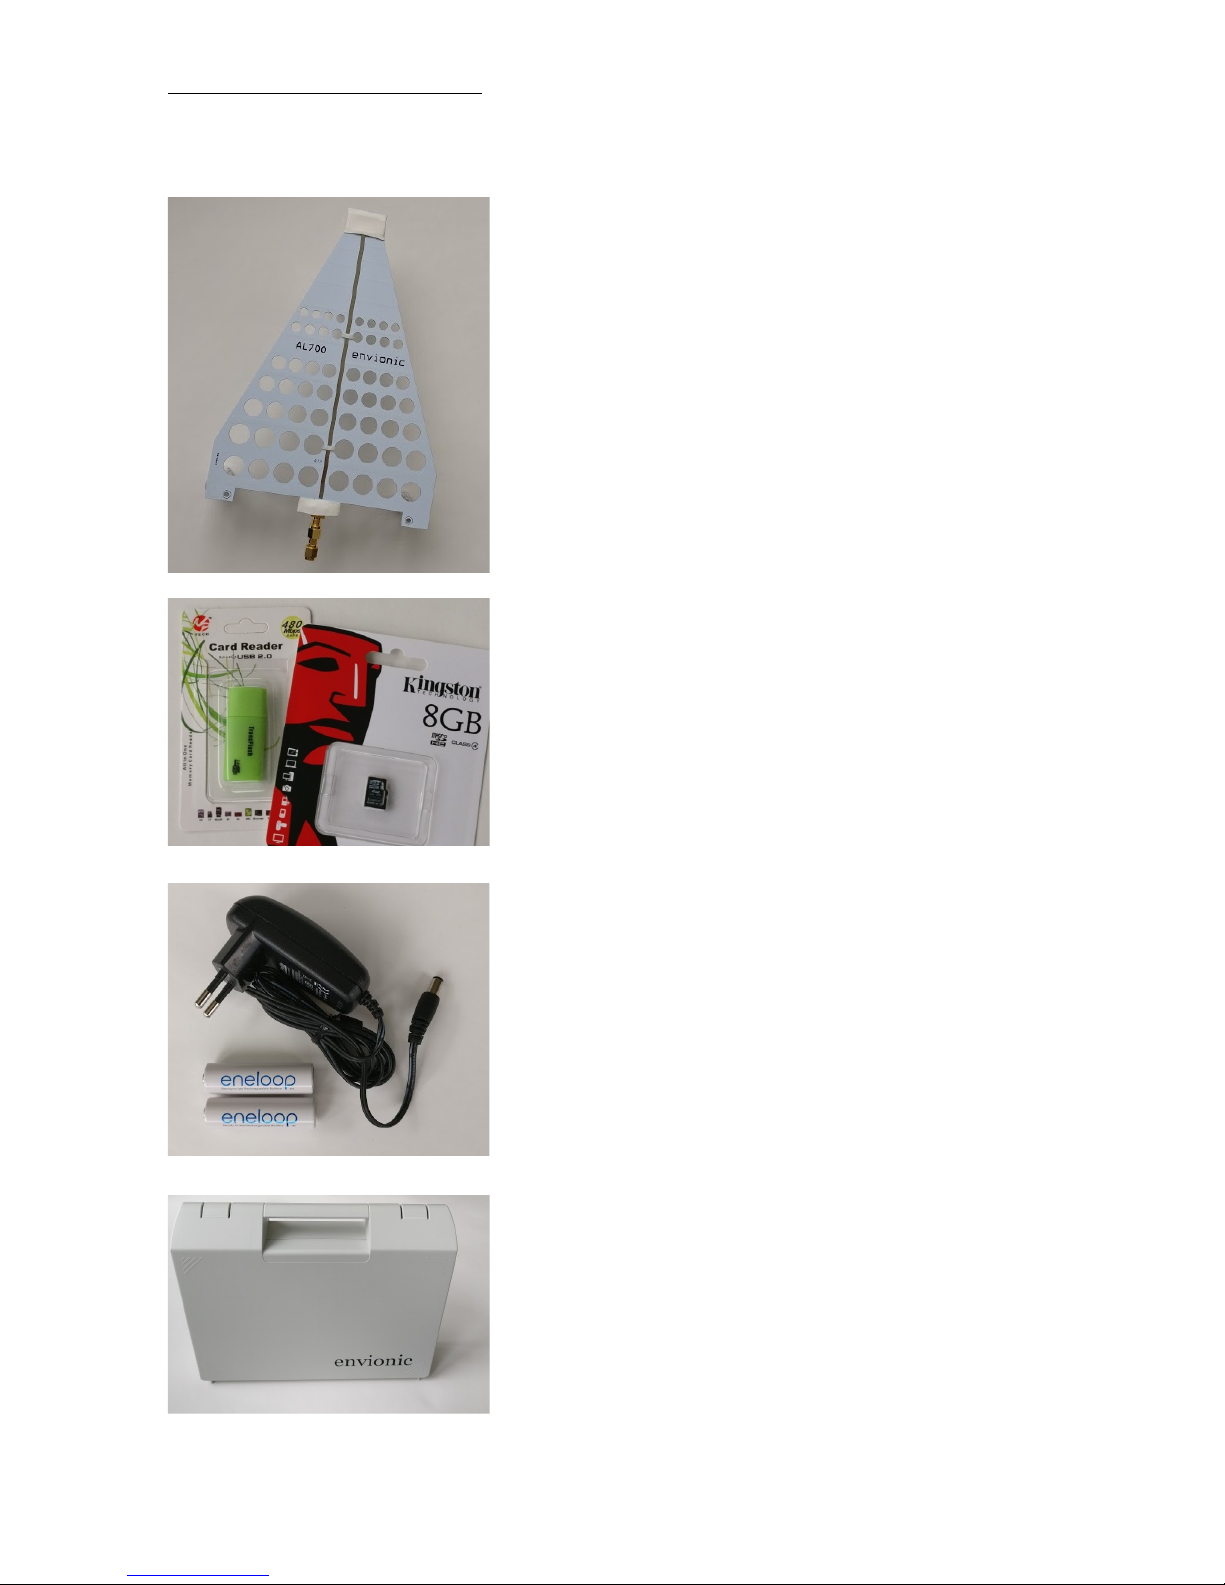
Accessories delivered with the device
AL700 LogPer directional
antenna for the range 700 MHz
to 6000 MHz (6 GHz )
Micro-SD memory card of 8
Gigabyte or more
Cardreader to connect the microSD card to the USB port of your
computer
The memory card and cardreader
are only delivered with the
FA725, FA735 and FA845
Two AA Alkaline batteries (or,
optional, two NiMH
rechargeable batteries)
Optional charger for the NiMH
rechargeable batteries. It is
available for several countries
(see Envionic website). The
European version is shown here.
Carrying case
Only delivered with FA735 and
FA845
For other devices it is available
separately.

Users manual FA845 version 1.5
Envionic
7
Chapter 1 General
1.1 Switching ON or OFF
The device is switched on by shortly pressing the little button that is located at the top side.
Pressing the same button again switches the device off.
On/Off switch
The function of the frontside buttons will be visible on the bottom of the screen as long as the
device is switched on.
On the screen you will see the model number (FA845, FA735, FA730, FA725 or FA720),
software version (Image: V 2.0) and serial number (0504) of the device. This manual describes
software version 2.3.
Screen after power-on ( Home )
The operating state of the meter is always visible at the left top of the screen. Immediately after
switching on, this is 'Home'.
You will also see the current date and time (for FA845, FA735 and FA725). When the date or
time is not correct, you can set these (see section 1.7).
Users manual FA845 version 1.5
Envionic
8
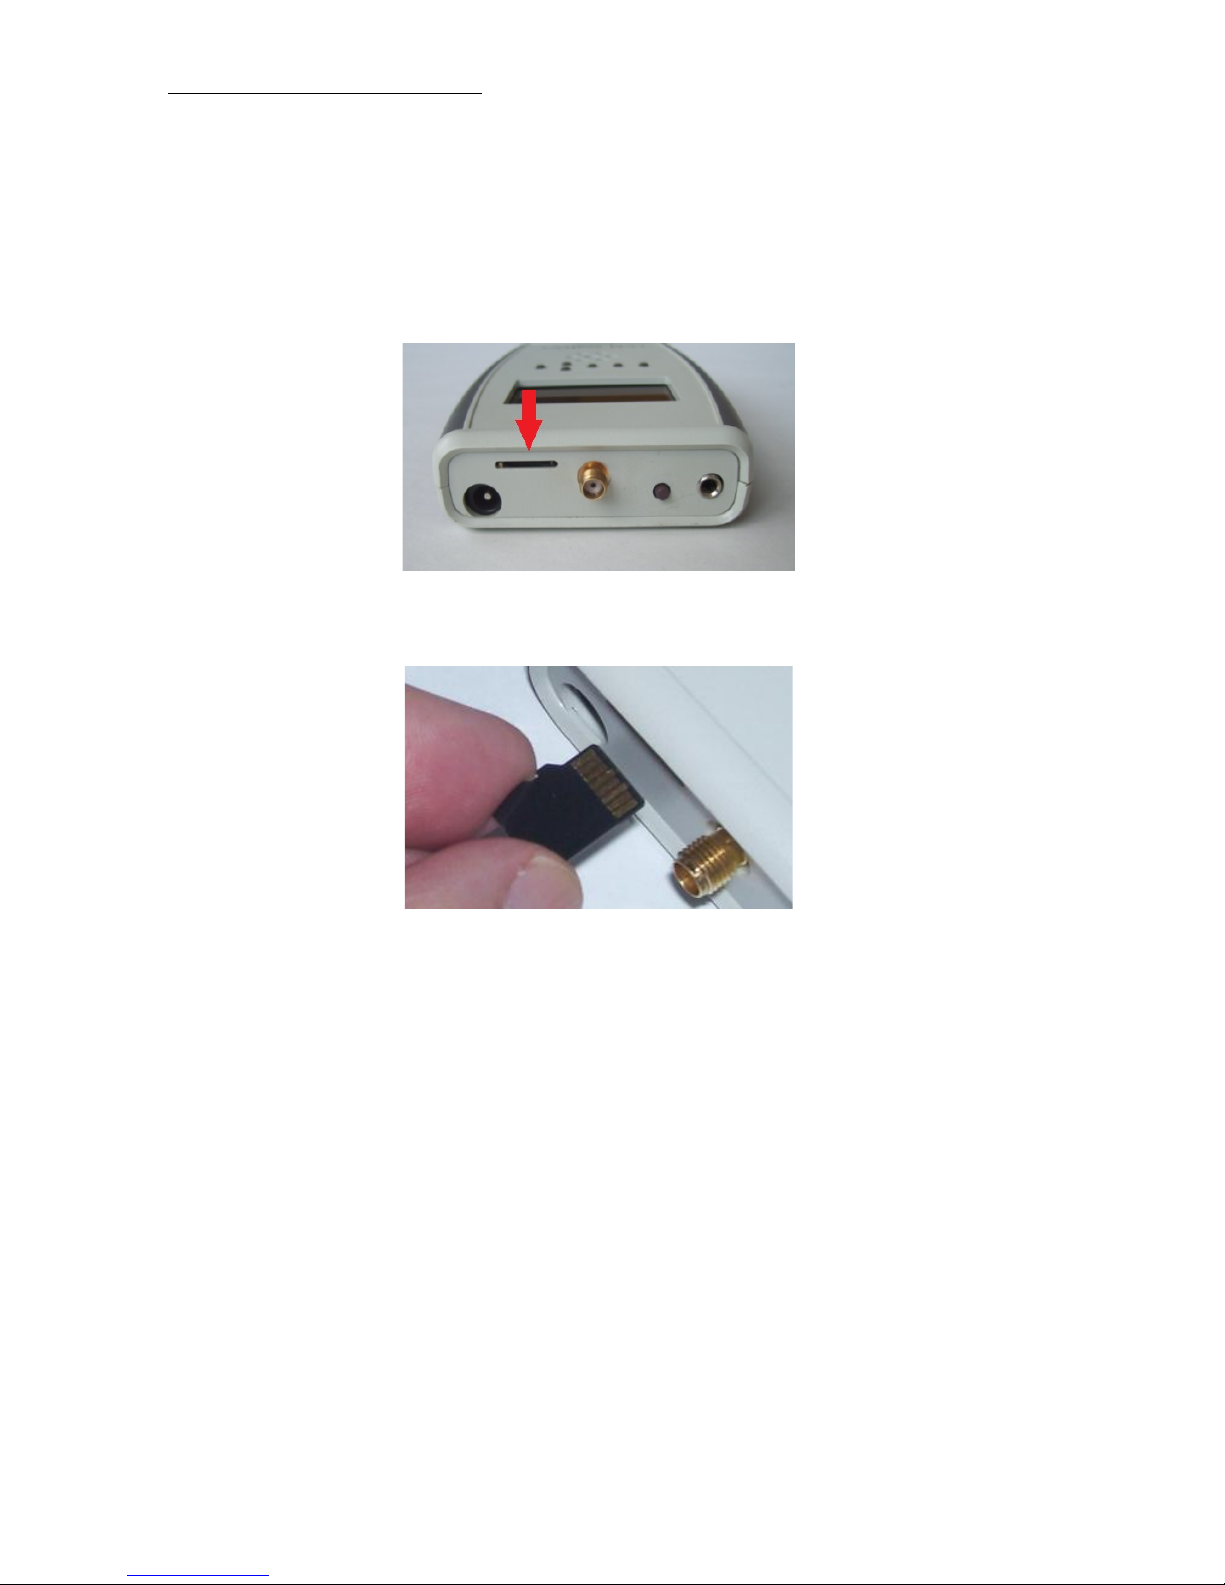
1.2 Micro-SD memory card
The micro-SD memory card should only be placed or removed when the device is switched
off. The card should be placed with its contacts pointing upwards to the top of the device .
You can use your nail to push it the last stretch until it clicks.
Position of the micro-SD memory card
Contacts of the card pointing upwards
Users manual FA845 version 1.5
Envionic
9
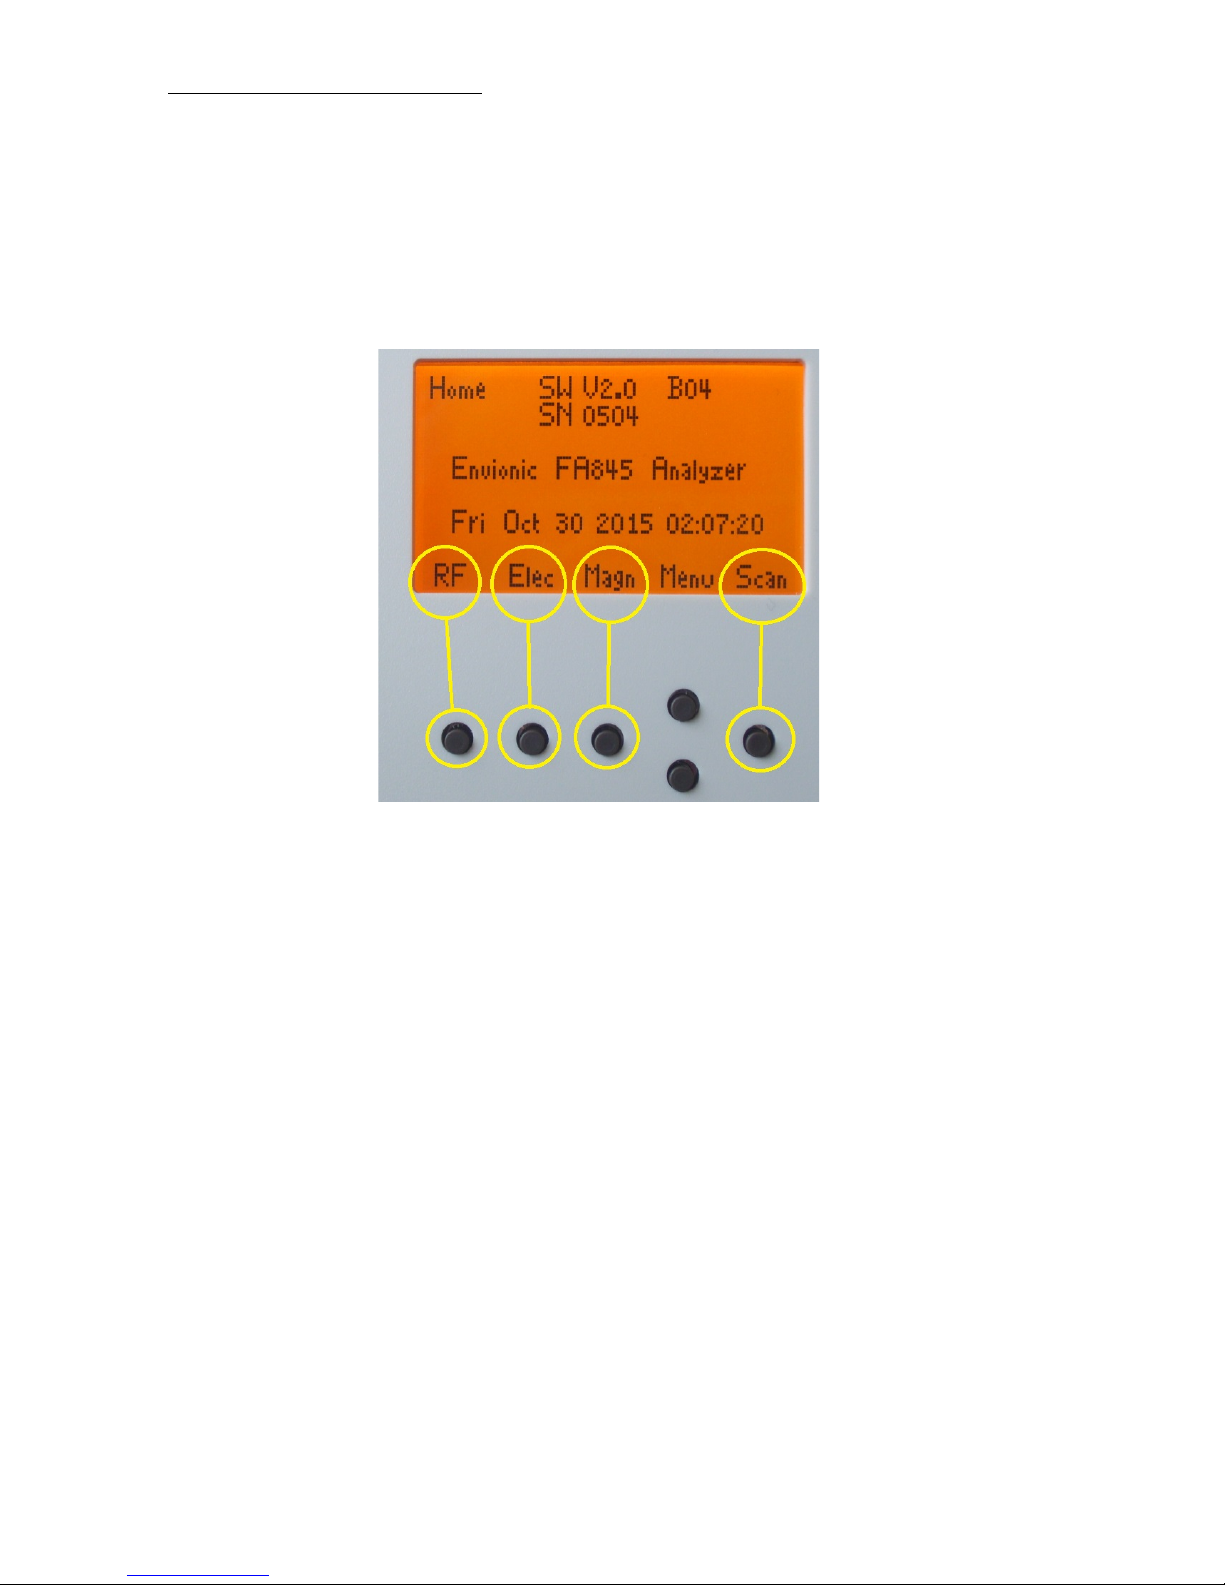
1.3 Choosing what to measure
The function of the frontside buttons will be visible on the bottom of the screen as long as the
device is switched on. Directly after switching on, you can choose what you want to measure:
Push the 1st button (“RF”) to measure the high frequency electromagnetic field (chapter 2).
Push the 2nd button (“Elec”) to measure the low frequency electric field (chapter 5).
Push the 3rd button (“Magn”) to measure the low frequency magnetic field (chapter 6).
Push the rightmost button (“Scan”) to start the RF Spectrum Analyzer (chapter 3).
After measuring, you can go back to this screen with the 1st button (“Home”).
Users manual FA845 version 1.5
Envionic
10
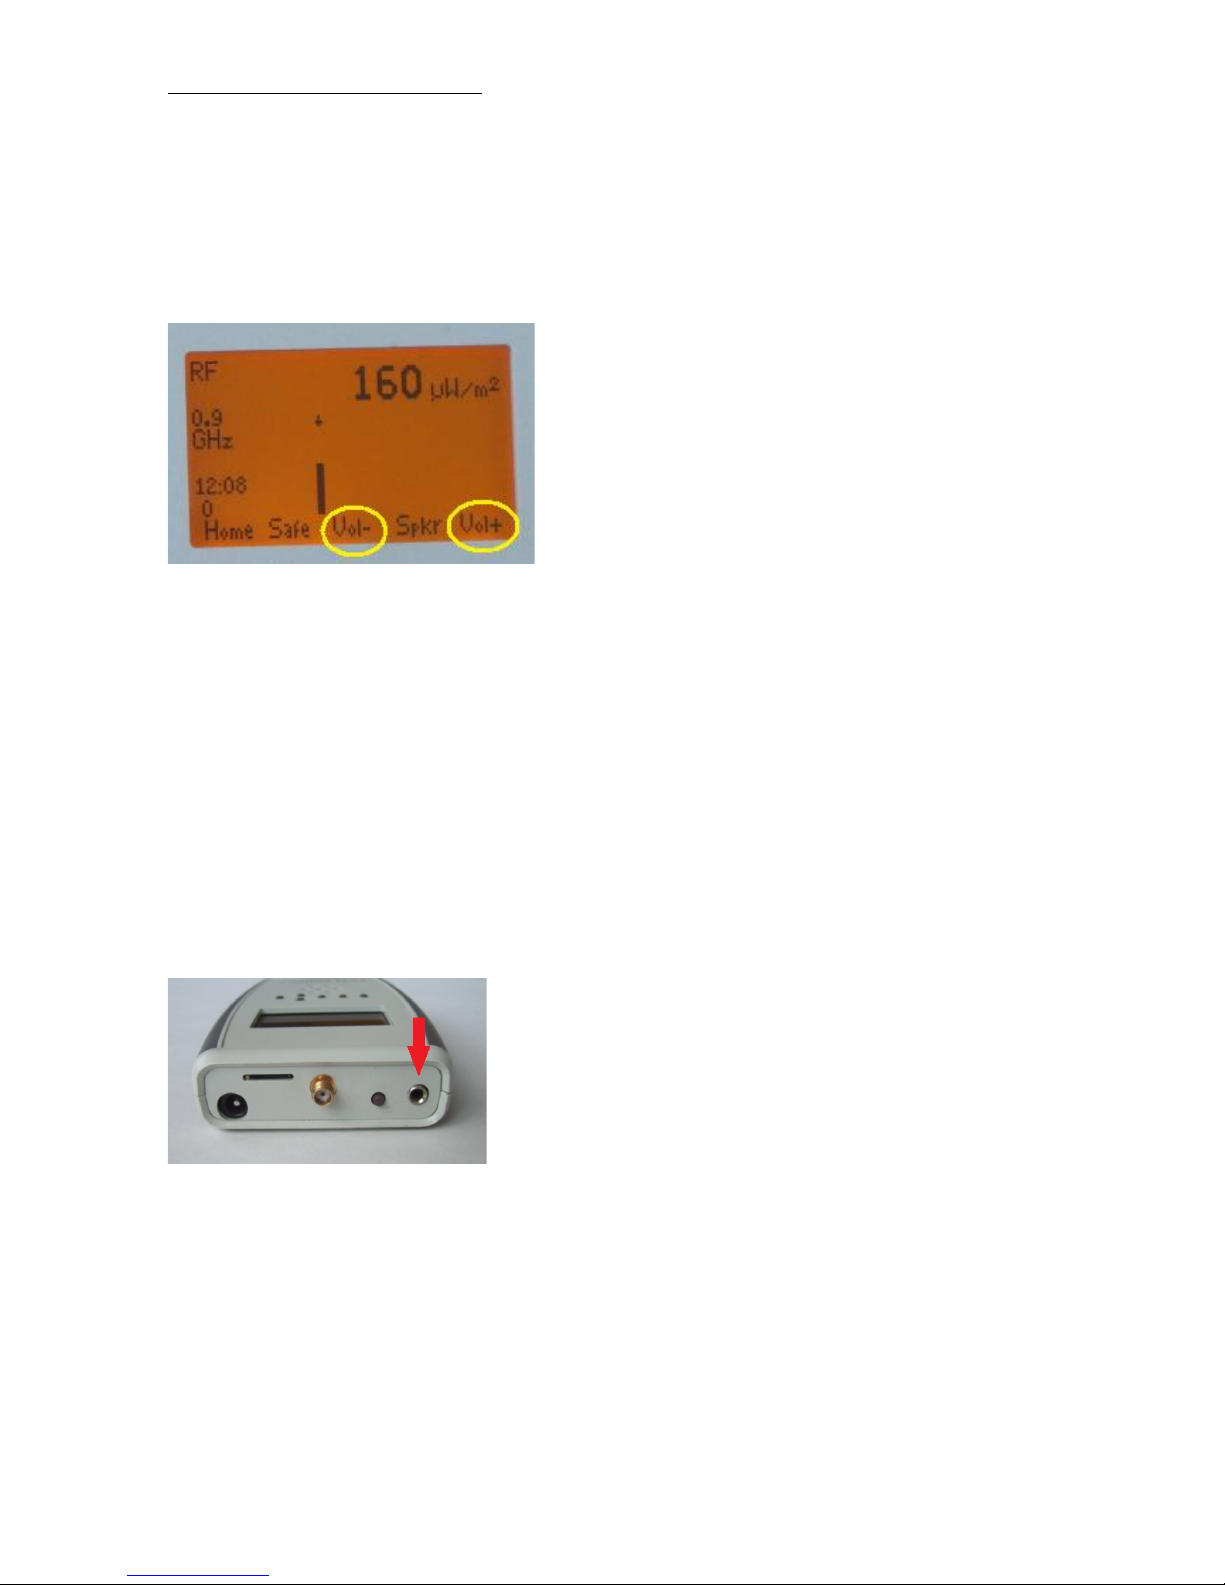
1.4 Speaker
After choosing what to measure, you can set the sound to a certain volume with the buttons
"Vol+" and "Vol-". (This does not apply to the SCAN and EXPERT modes.)
During setting of the volume, the volume setting is displayed. It can be set to a value on a scale
from 0 to 8.
For RF, this gives an audible impression of the pulse modulation of the radiation. After some
practice it is possible to identify the kind of radiation by the sound it produces. The strength of
the radiation has not much influence on the sound volume, unless the signals are very weak.
For the low frequency (Elec and Magn) measurements, the sound volume depends on the
strength of the signal.
To make low frequencies (50 or 60 Hz) audible, some higher harmonics are added to the
speaker signal.
Phones connection
One of the two channels of the stereo phones connection provides the sound signal to an
external device. The internal speaker will be switched off when this connection is used.
Users manual FA845 version 1.5
Envionic
11
1.5 Batteries
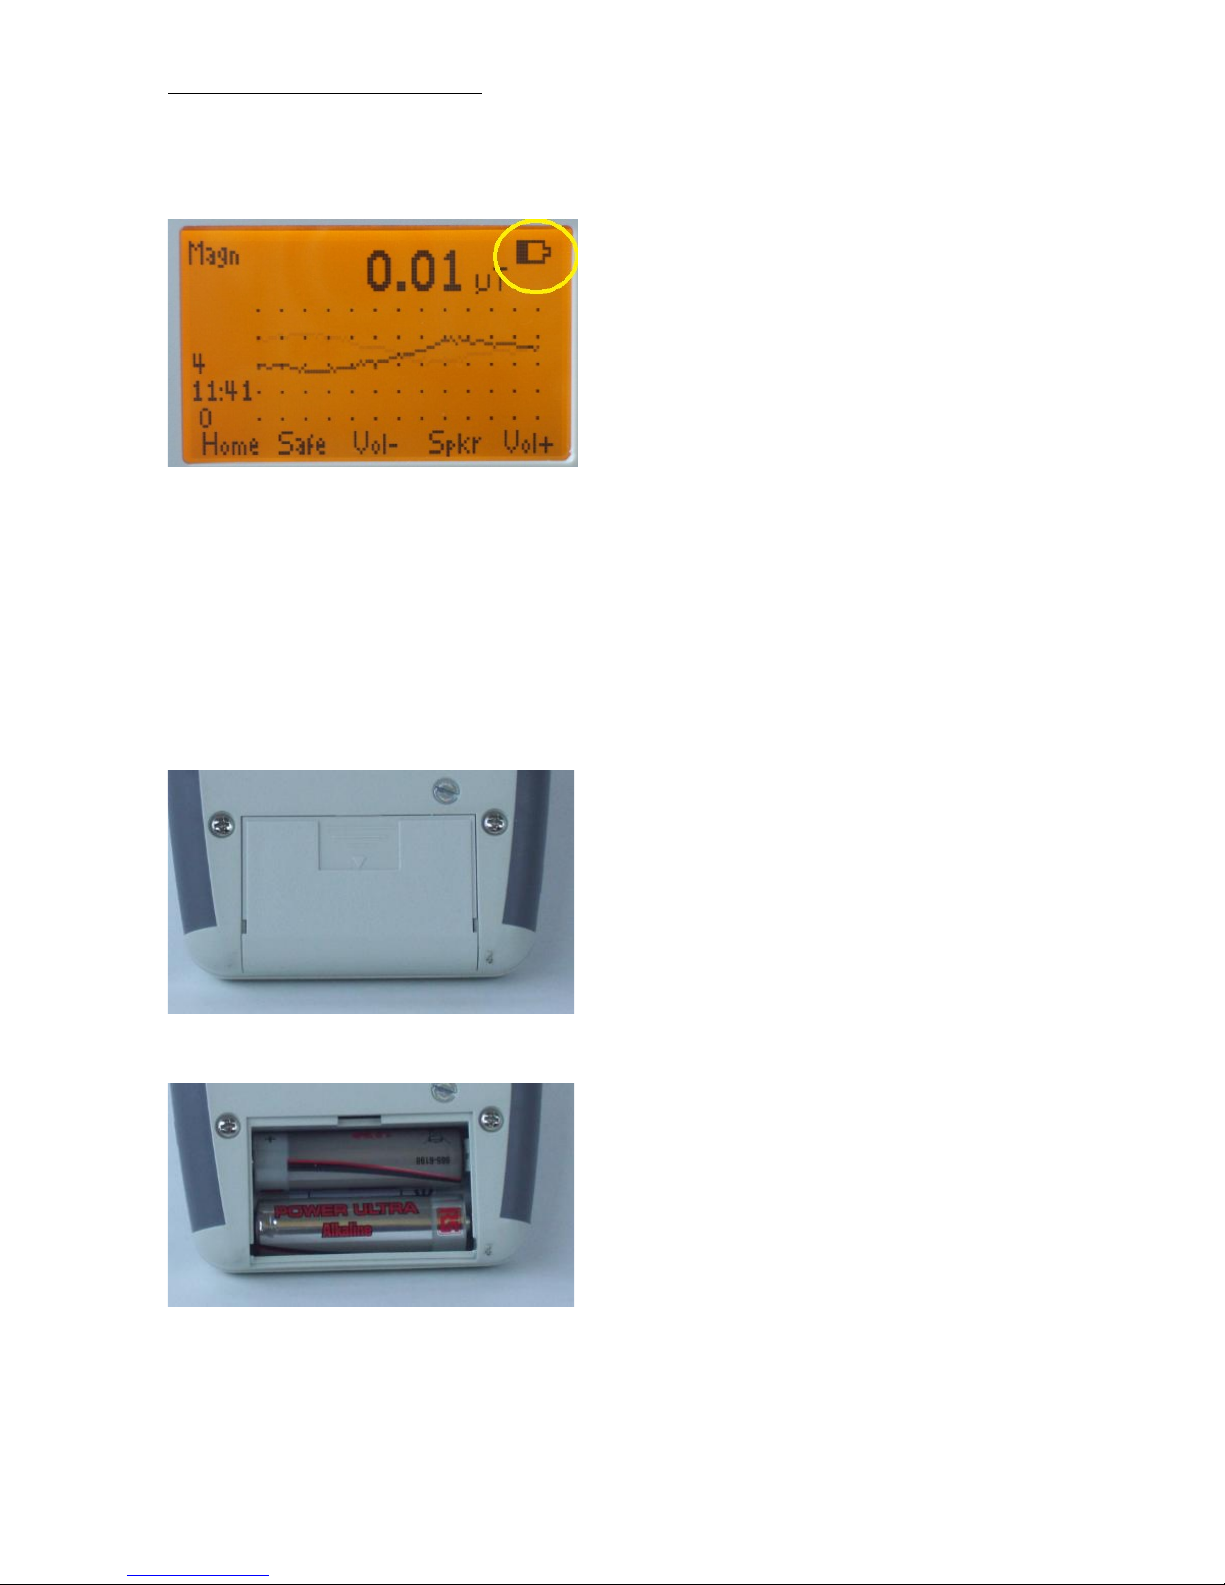
Battery condition
When the batteries are almost empty, this will be shown on the screen:
- At first, as a partly filled battery (see picture)
- After some time, the filling in the battery picture will blink
- When the battery can no longer be used, an empty battery symbol will blink. After that,
the device will switch itself off.
Two AA batteries can be found at the backside of the device
Battery compartment
Batteries
Users manual FA845 version 1.5
Envionic
12
1.6 Changing or charging batteries
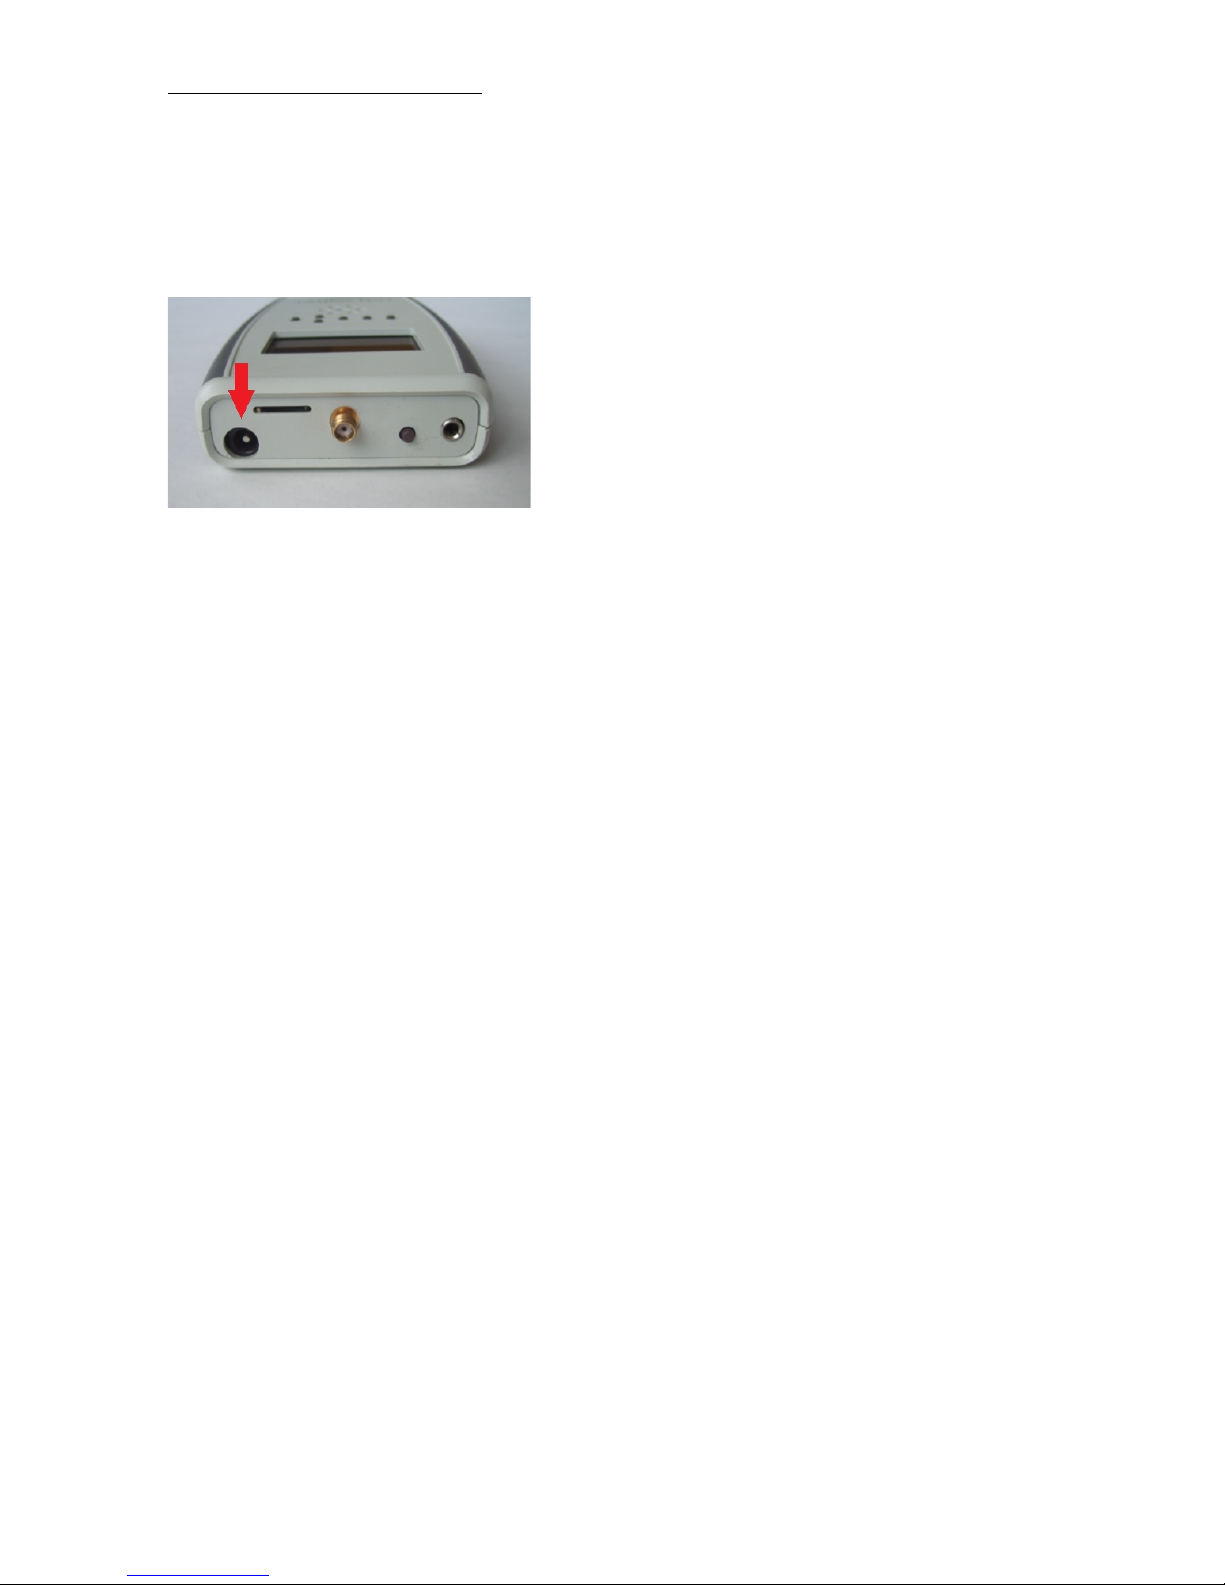
Mains adapter connection
If rechargeable batteries are used, you can charge them by connecting the delivered wall
adapter to the device and to an outlet. After 10 hours, the batteries will be charged completely.
The device should be switched off while the batteries are charged.
Caution:
- pay attention to the polarity ( + / - ) when you place the batteries
- only use 5 volts adapters (center terminal positive)
- do not charge non-rechargeable batteries
- used batteries should be handled as chemical waste
If you want to check if the batteries are being charged, then switch the device on. You will see
an animated picture of a battery that that is being filled. Then you can switch the device off
again. If you keep the meter on while the batteries are being charged, this will extend the
charging time, because a part of the charging current will be used to power the device.
When you change the batteries, then try to do that within one minute. After one minute, the
internal clock may lose the current time and date, and you will have to set these again.
Please be aware that most newly bought NiMH rechargeable batteries have to be charged
before the first use.
If you use ordinary (non-rechargeable) batteries, then Alkaline types are preferred.
The optional power adapter is suitable for mains voltages from at least 100 Volts up to 240
Volts AC.
Users manual FA845 version 1.5
Envionic
13
1.7 Setting time and date
At the home screen, press the ‘Menu’ (button 4) and then select ‘Time’ (button 4 and/or 5).
Then activate ‘Time’ with button 6.
Press the ‘OK’ button after setting time and date.
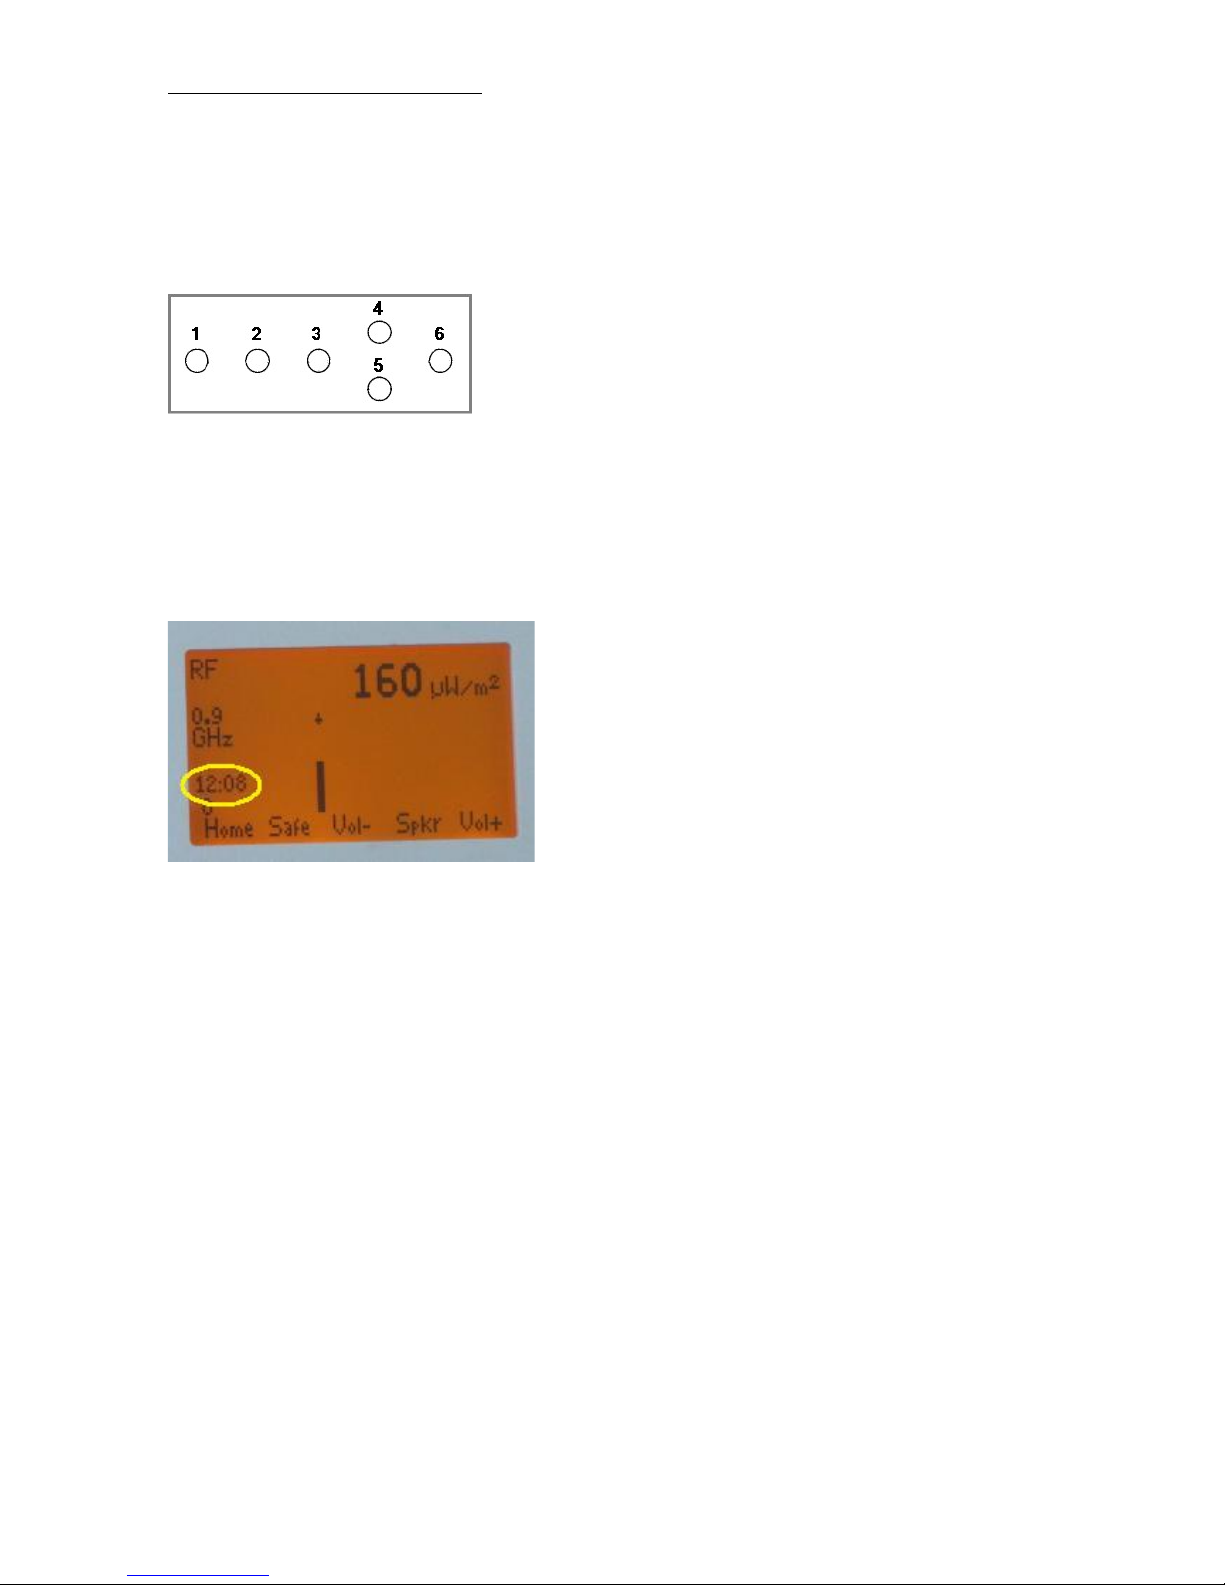
During measurements, the time will be shown at the left side of the screen, except in SCAN
and Expert modes.
Time at the left side of the screen
1.8 Installing a new software version
The micro-SD card can be used to load a new software version. If a new software version
becomes available, it can be sent to you by email. The following steps must be followed to
install new software:
1 Switch your device OFF and remove the memory card
2 Put your memory card in the cardreader and connect it to your PC
3 Copy the file with the new software to the memory card
4 Place the memory card in the envionic device again, and switch it on
5 On the device, select 'menu' and then 'card'
6 Use the arrow buttons to choose the file with the new software, and choose 'open'
7 The new software will now be installed automatically
8 Within 1 minute, you will see the start screen with the new SW version number
9 The installation is complete, the file with new software is not needed any more.
Users manual FA845 version 1.5
Envionic
14
Chapter 2 RF High frequency electromagnetic field
When this is selected, "RF" (Radio Frequency) will be visible at the upper left top of the
screen.
A suitable antenna must be connected. The AL700 antenna delivered together with the device
is a "LogPer" directional antenna, suitable for 700 MHz to 6000 MHz (6 GHz).
The measured value strongly depends on the position of the device i.e. its distance and angle to
the source of radiation, especially for indoor measurements. Radiation is generally not emitted
with the same strength in all directions.
In most indoor situation, the radiation is coming directly from the source but can also be
reflected by big objects (indoor or outdoor objects). The combination of direct and reflected
signals causes interference patterns. Due to interference the measured value can vary a lot,
even when the device is moved only about 10 or 20 cm. The interference pattern can also be
heard via the speaker.
The highest value measured is used to determine if the amount of radiation is acceptable. The
hold mode makes it easy to determine the highest value measured when moving the device
through the room.
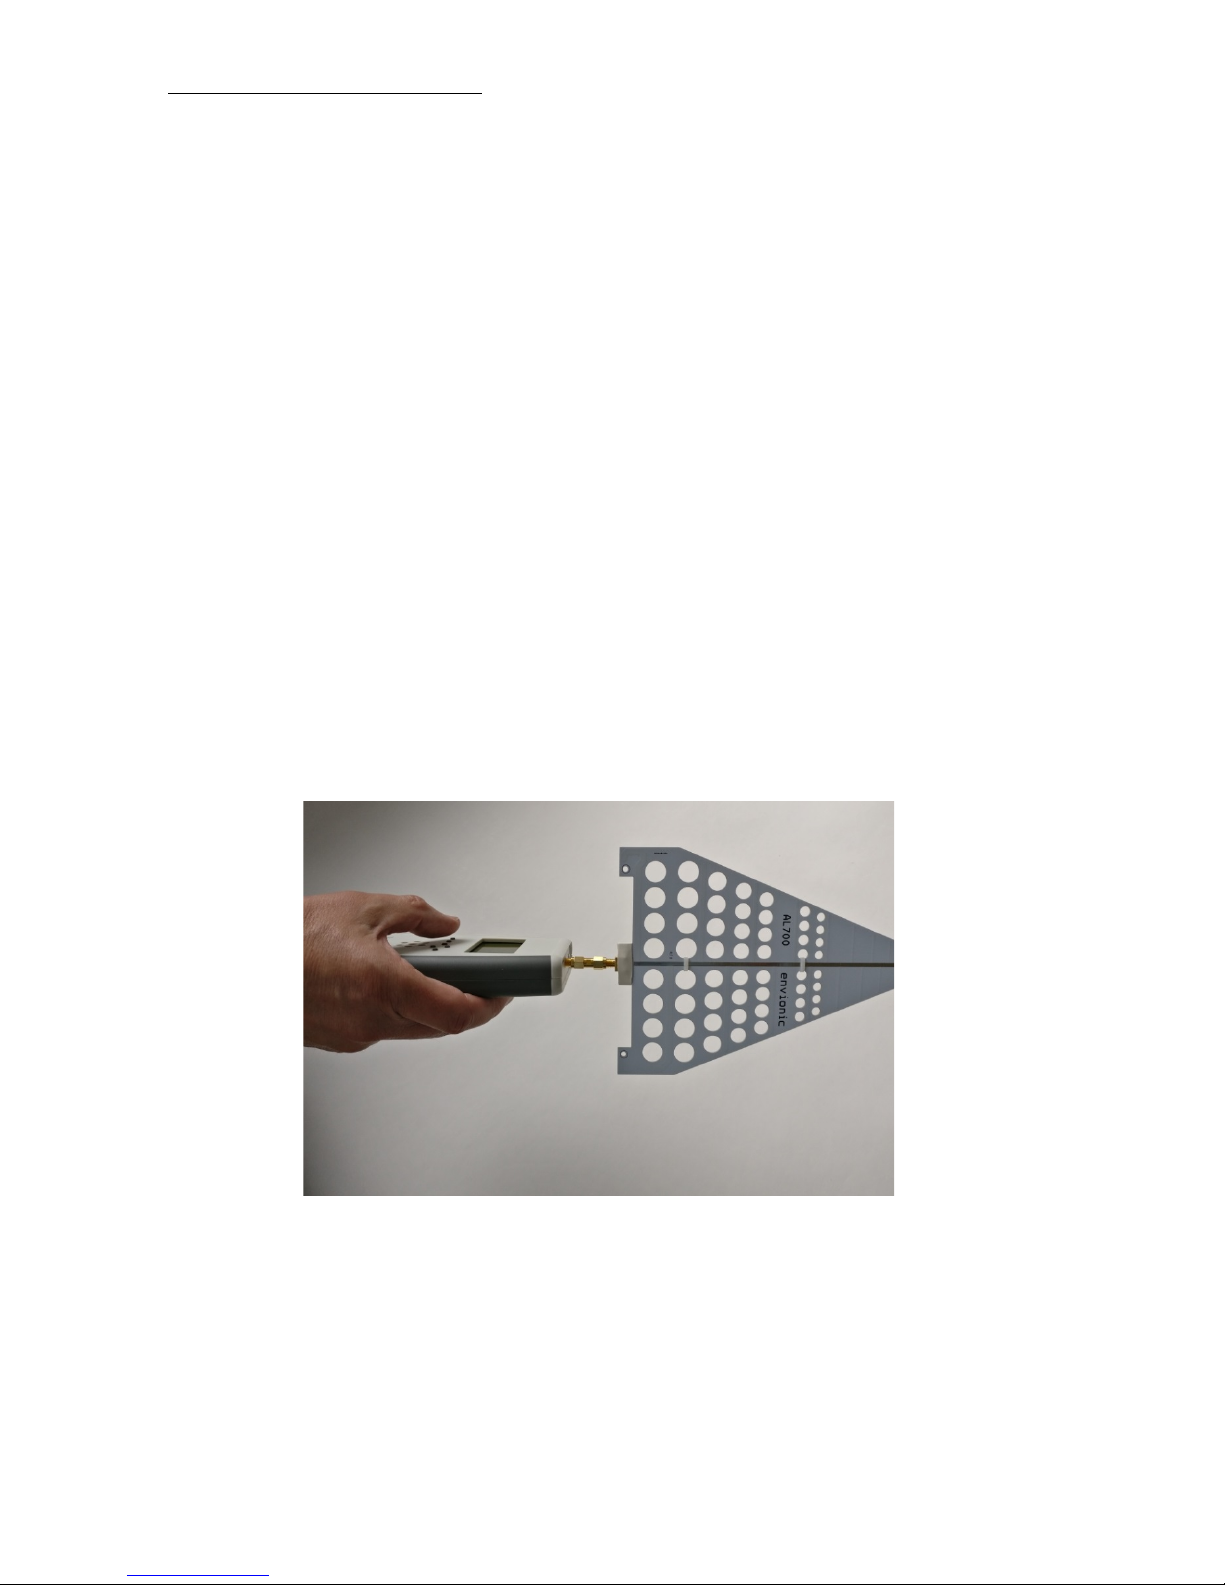
2.1 Measurement with LogPer antenna
Measurement position with LogPer antenna
This antenna is for the range 700 MHz to 6000 MHz (6 GHz).
The LogPer antenna should be pointed in the direction in which you want to measure.
In most cases, the 'triangle' of the antenna should be vertical, because most signals have
vertical polarization. The device itself will mostly be horizontal in these cases.
Users manual FA845 version 1.5
Envionic
15
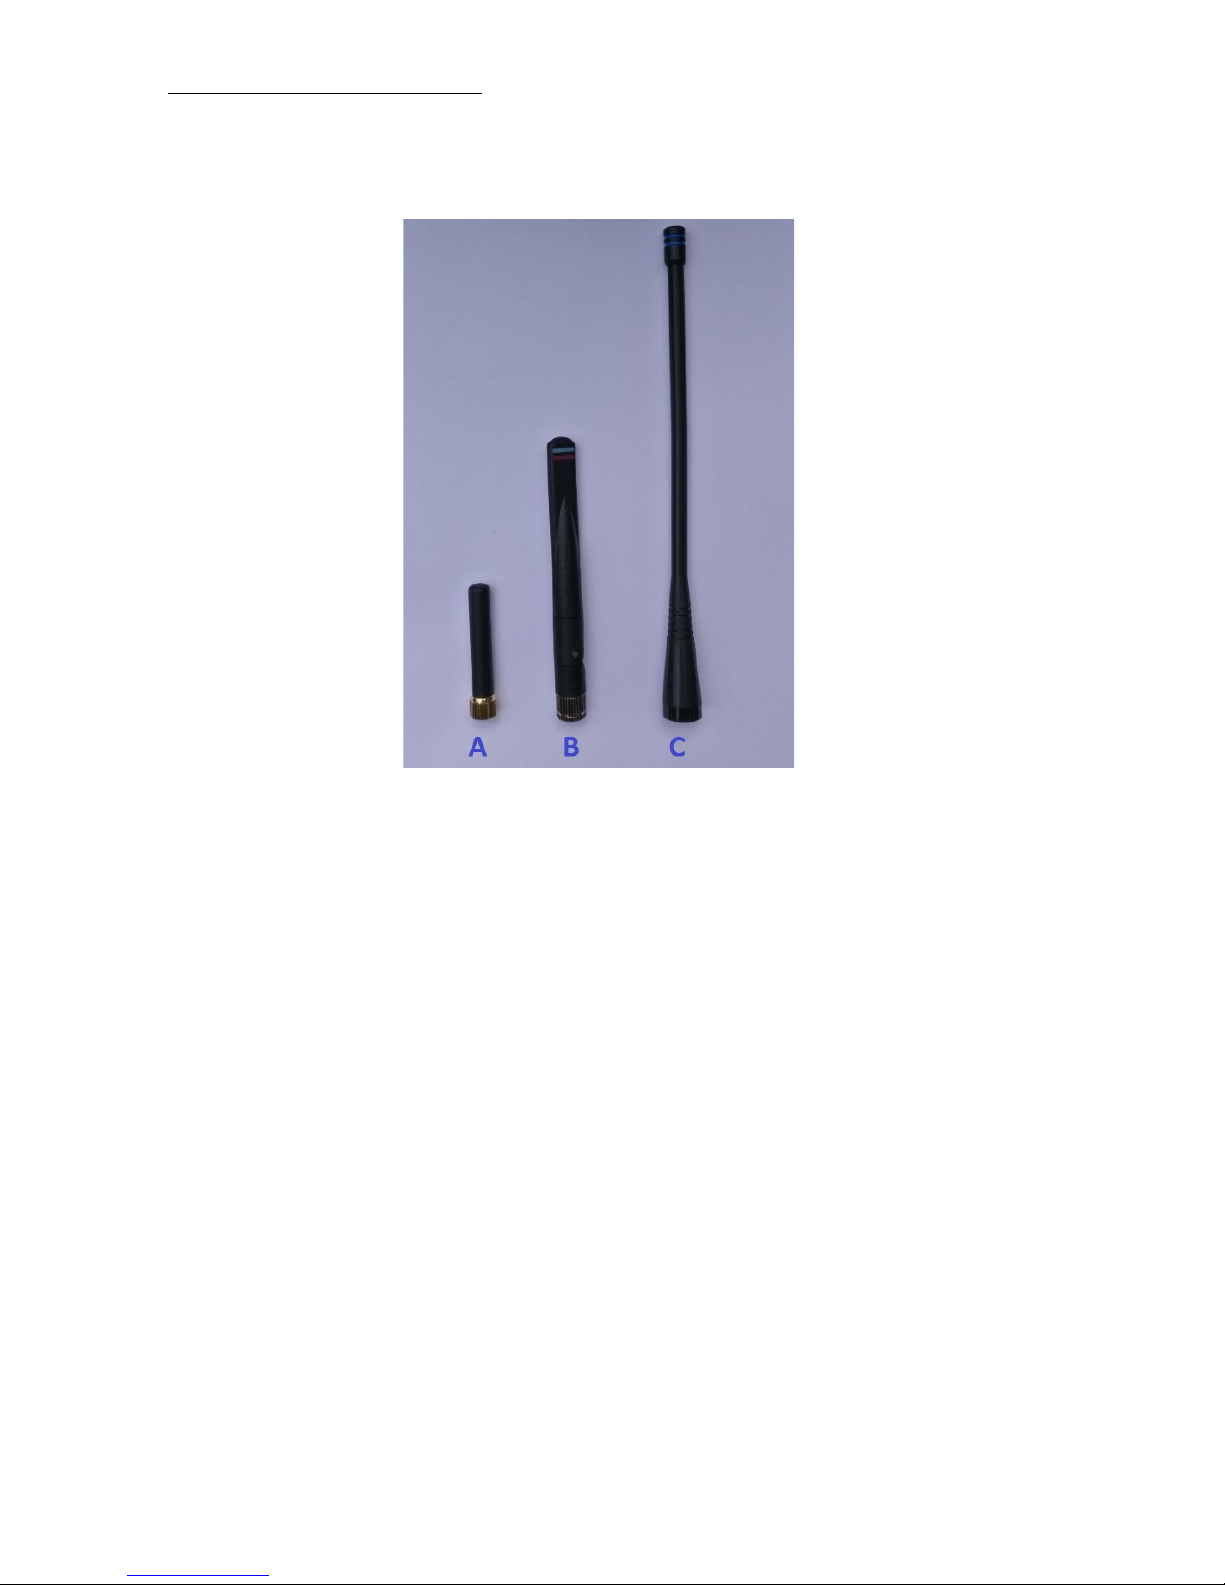
2.2 Measurement with omni-directional antenna
Omni-directional antennas
Several omni-directional antennas are available separately:
A ANT-800 GSM (824-960, 1710-1990 MHz) and UMTS (1920-2170 MHz)
B ANT-2400 WLAN (2400-2483 and 5150-5825 MHz)
C ANT-400 TETRA (380-450 MHz)
For a omni-directional antenna (not included), the device should be held in a vertical position,
with the antenna pointing upwards. This will receive signals from all around you. Signals that
come from the direction behind your back will be displayed less strong, because these are
attenuated while travelling through your body.
Most signals have a “vertical polarization”. Due to this, a vertical position of the device and
antenna is optimal when using the non-directional antenna. Signals with “horizontal
polarization” can be measured by holding the device in a horizontal position.
The polarization of radiation might change when it is reflected from a metal object. Also, the
polarization of a signal can be somewhere between horizontal and vertical.
The measured levels with the ANT-800 and ANT-2400 antenna will be lower than measured
with the AL700 antenna, because the device is calibrated to work with the AL700 antenna.
(For the same radiation strength, a non-directional antenna will generate a smaller electrical
signal than a direction sensitive antenna like the AL700).

Users manual FA845 version 1.5
Envionic
16
2.3 Display
On the screen you can now directly read the strength of the signal ( in microwatt per square
meter). When the signal is pulsed, the shown strength is the strength at the top of the pulse.
The frequency of all signals is measured (if possible) and the frequency of the strongest signal
is shown at the left side of the screen (here: 0.9GHz). See section 2.4.

Users manual FA845 version 1.5
Envionic
17
2.4 Frequency measurement
The frequency of all signals is measured, and the frequency is assigned to one of the following
categories:
from 0.3 up to 2.8 GHz, 26 categories, ascending per 0.1 GHz
from 3.0 up to 4.0 GHz, in category “3 - 4”
from 4.0 up to 5.0 GHz, in category “4 - 5”
from 5.0 up to 6.0 GHz, in category “5 - 6”
or the category “Any” if the frequency can not be measured.
On the screen you will see a bar chart, that shows the signal strength per category.
The bar display is logarithmic, this means that you can also see small signals while strong
pulses of another frequency are present.
Above the signal with the highest strength you will see a small arrow, and the corresponding
frequency category is visible at the left side of the screen, with a 'GHz' indication beneath it.
The frequency measurement does not work under all circumstances. The following conditions
apply:
The signal has to be strong enough
The signal must not be stronger than the device can measure
The signal must be sufficiently stronger than signals with another frequency that are present at
the same moment.
When one of these conditions is not met, then the signal will most likely change from category
when you move the device around.
Frequency of several radiation sources
Users manual FA845 version 1.5
Envionic
18
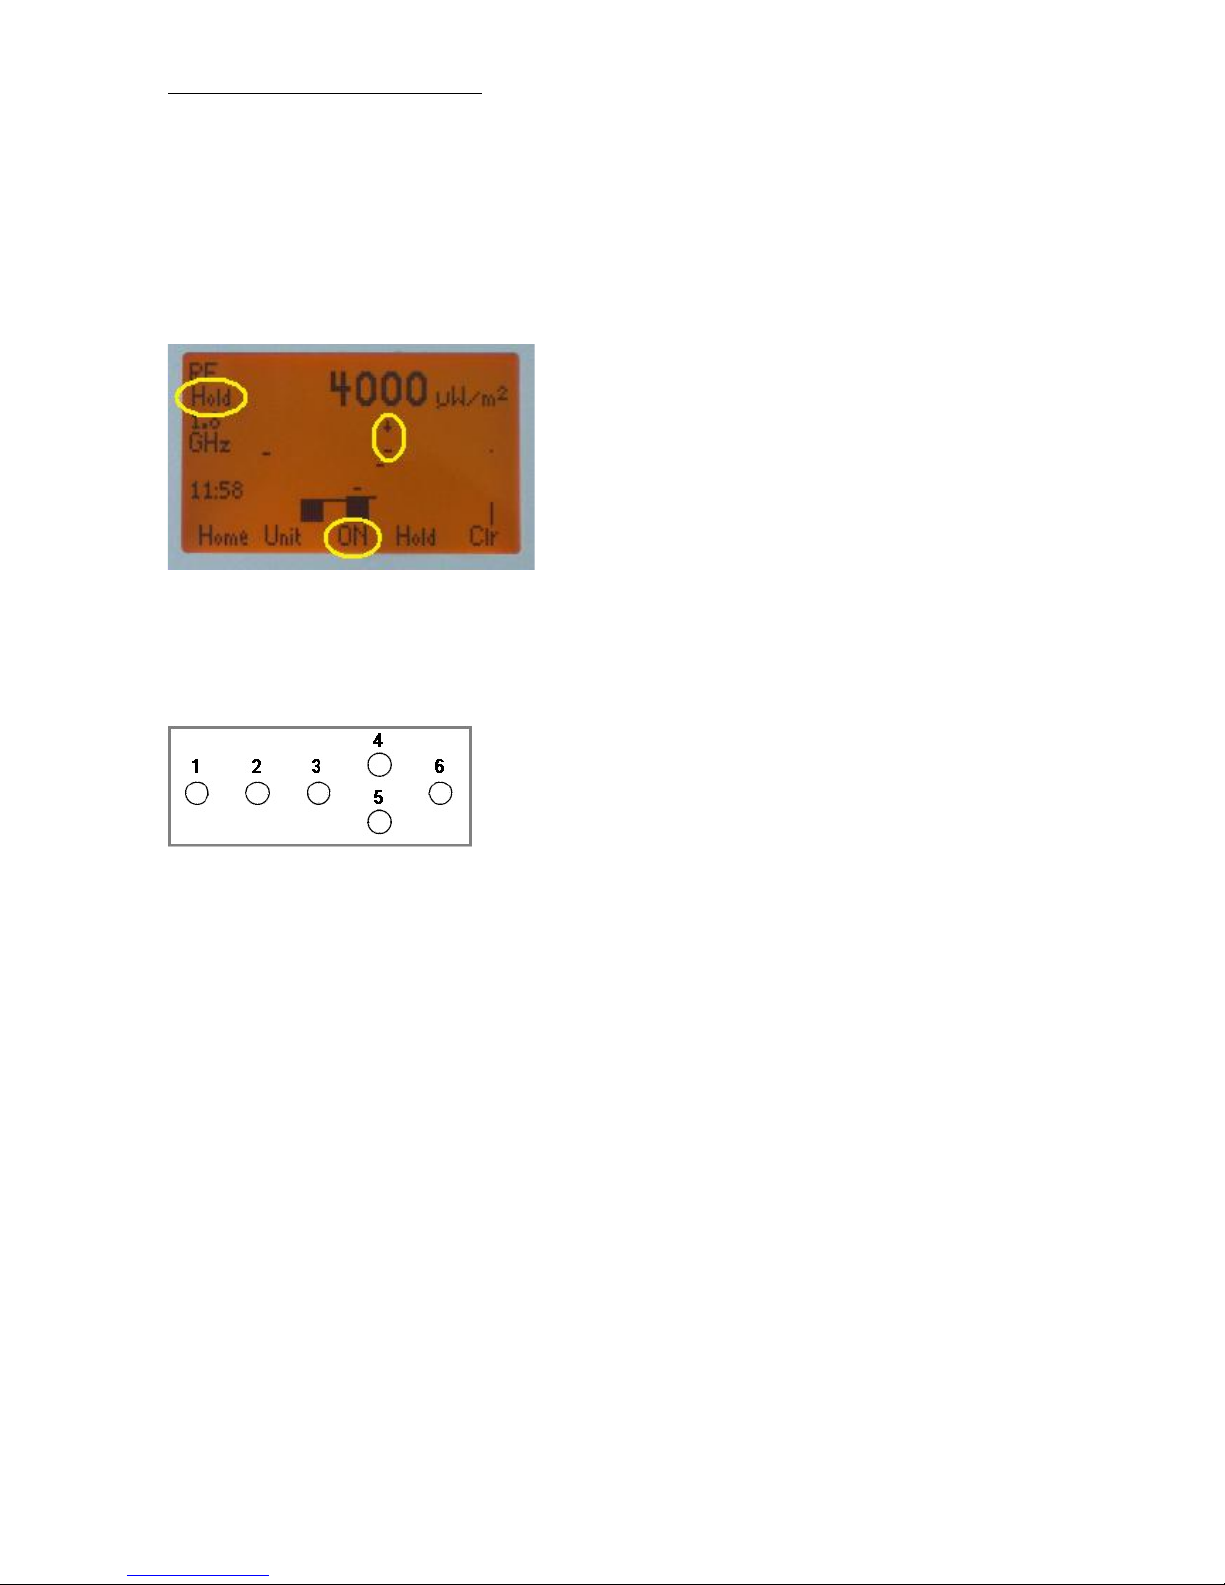
2.5 Hold function
The device will remember the highest measured value for every frequency category. This is
visible as a small dash above the bar of the category.
When HOLD is switched on, this highest measured value will be displayed instead of the
current value.
This is switched on as follows:
Use button 4 or 5 to switch to the 'Hold' function group. Now you can switch the "Hold"
function on or off with button 3. When hold is switched on, you will see "Hold" at the left side
of the screen. With button 6 ("Clr") you can reset the hold-values to the current actual value.
2.6 Choosing the measurement unit
Within the "Hold" function group you will als find the "Unit" button (button 2). Here you can
change the measurement unit of the device, you can choose between:
- microwatt per square meter
- millivolt per meter
- dBm (measures the energy level at the antenna connector)
Normally, the device will use the "microwatt per square meter" unit after switching on. If you
want another unit after switching on, this can be set automatically any time you switch the
device on, if you have a device with micro-SD card (FA725, FA735 or FA845).
In the "fa.ini" file (explained in the SCAN chapter), add the following line at the beginning
(before the first "#").
UNIT = MV/M for millivolt per meter, or
UNIT = DBM for dBm.
This can also be used on the FA725 and FA735, although these devices can of course not use
the list of bands.

Users manual FA845 version 1.5
Envionic
19
2.7 Display signal pulsation
Instead of a bar diagram that shows the signal strength as a function of the frequency category,
you can also show the signal strength as a function of time. If the signal is pulsed, this will
show the pulses of the signal.
Use button 4 or 5 to select functiongroup “Disp”. With button 2, you can now set the “Time”
display. At the left of the screen, you will now see “Time” instead of “GHz”.
Pressing button 2 again (it is now called “Freq”) will switch back to the normal display.
The following example shows the pulses of a DECT base station. (The dotted line is the
“Hold” value”). At the left of the screen you will also see the frequency (1.8 GHz). This is not
the impulse frequency !
Pulsed DECT signal
A non-pulsed (continuous) signal will be displayed as follows: (example: CT1 cordless
telephone ):
Non-pulsed signal
Within this functiongroup “Disp”, you can use button 3 (“Lt-“) en 6 (“Lt+”) to change the
backlight.
When there is direct sunlight, you get a good visibility by switching the backlight off.
Users manual FA845 version 1.5
Envionic
20
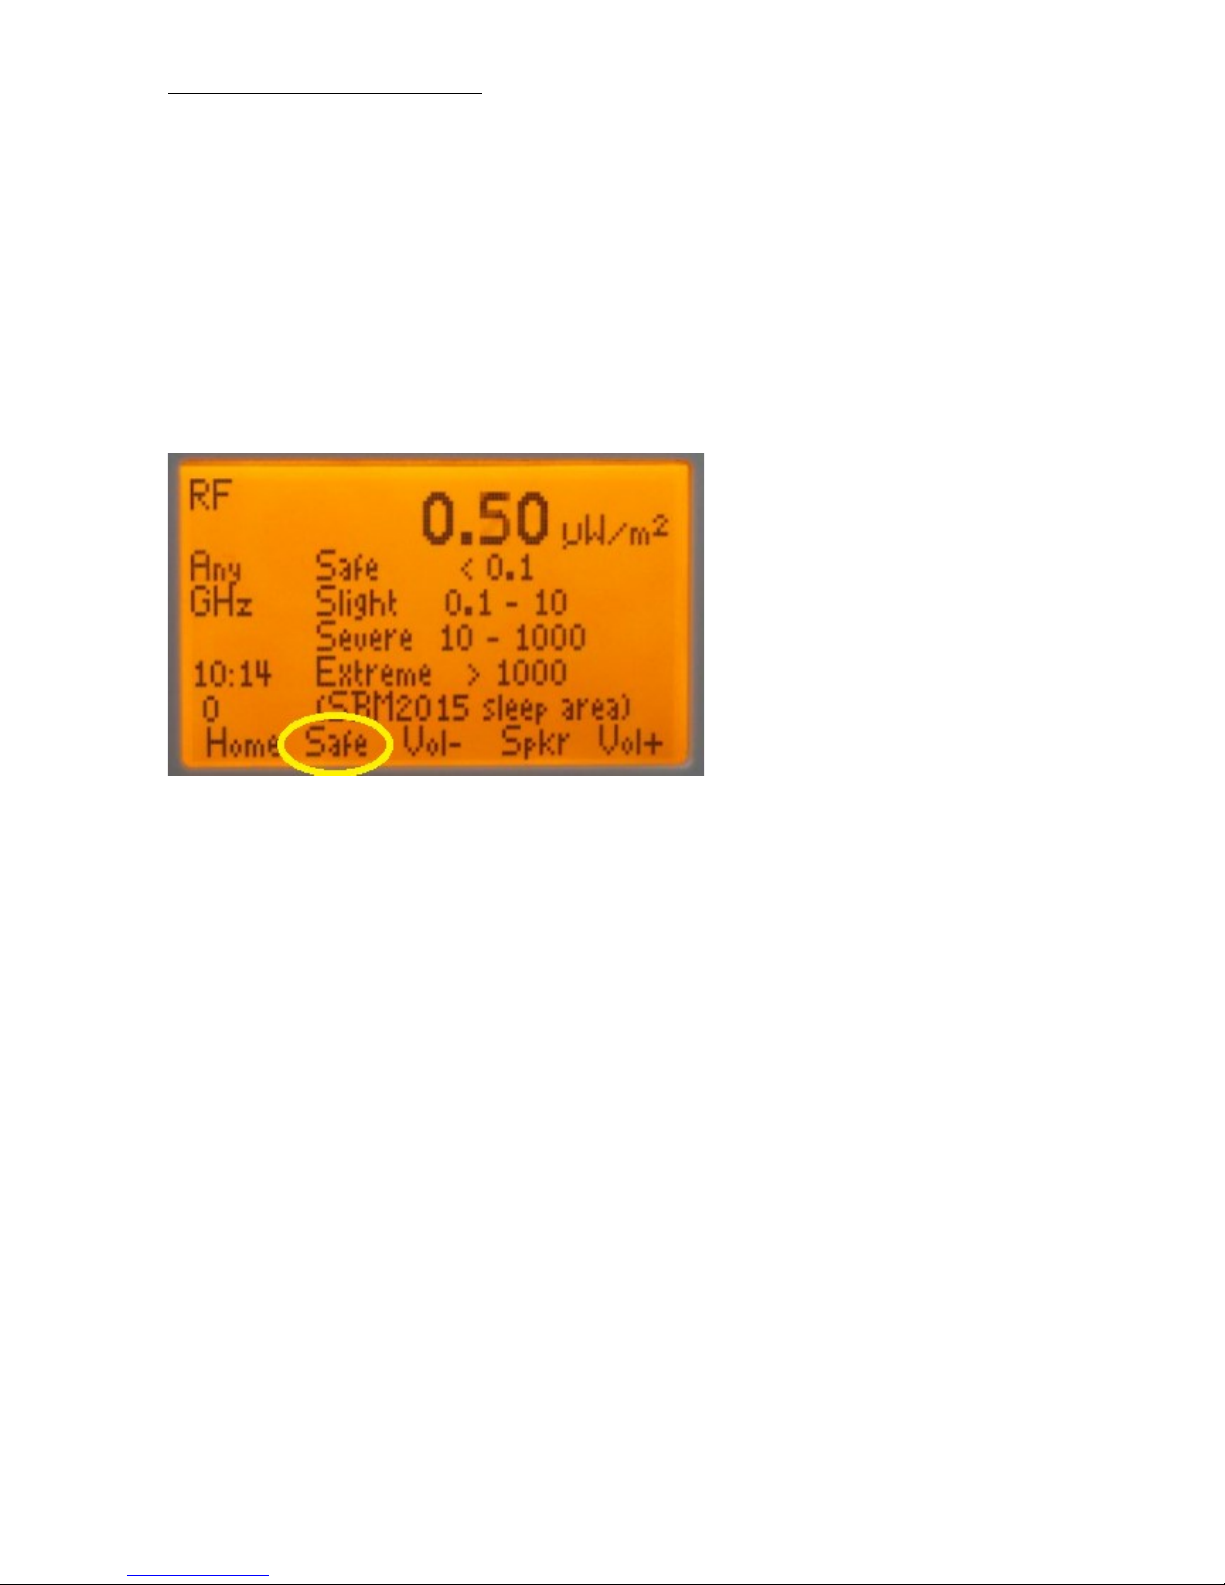
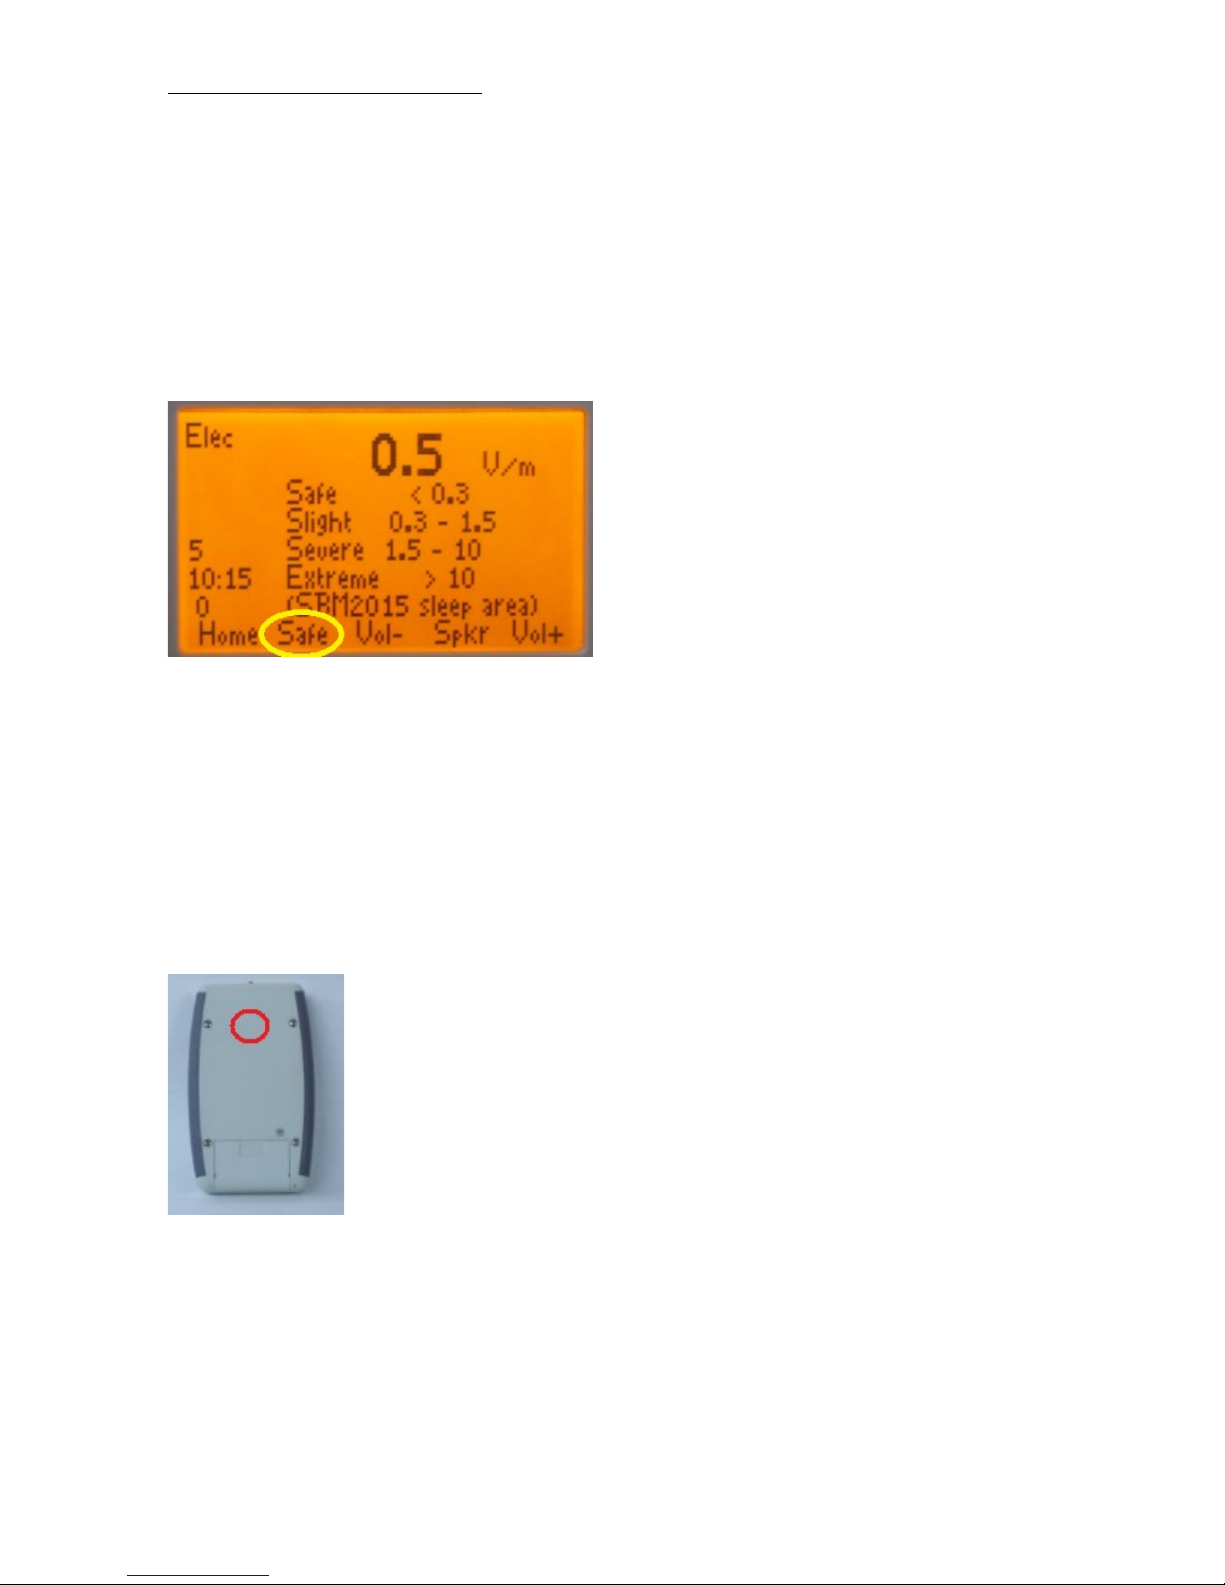
2.8 Safe values
When you choose "Safe", you will see (together with the measured value) what values are safe
for the RF electromagnetic field strength during sleep, according to the German SBM2015
standard. Also the values with qualification “slight concern”, “severe concern” and “extreme
concern” will be visible.
This only works in the microwatt per square meter setting.
Again pressing “Safe” will switch back to the normal display.
For indoor living or working areas, you can use values that are 10 times higher than the values
during sleep, that are shown here.

Users manual FA845 version 1.5
Envionic
21
Chapter 3 RF SCAN mode
3.1 Spectrum analyzer introduction
The spectrum analyzer in the FA845 measures only a single frequency at a time, but it can scan
through a range of frequencies (with a speed of 100 frequencies per second, for instance).
It starts scanning at the START frequency and stops at the STOP frequency. The values of the
start and stop frequencies are, of course, under control of the user.
The scanning speed is automatically selected by the device, based on the SPAN (difference
between start and stop) and the RBW (resolution bandwidth).
For the spectrum analyzer, you need the same antenna set-up as described in the previous
chapter (chapter 2).
To make the spectrum analyzer easy to use, it has been given two major operating modes:
1) SCAN (described in this chapter):
In the SCAN mode, the user selects the frequency band that he wants to measure. It is selected
from a fixed list of bands. The START and STOP frequency are then set automatically
according to the selected band. You can also define your own bands on the micro-SD card
(described at the end of this chapter).
2) EXPERT mode (described in the next chapter)
In the Expert mode, the user has full control over the spectrum analyzer. He can set START
and STOP frequencies, or the center frequency and SPAN, and the resolution bandwidth. This
can be slightly more difficult to use than the SCAN mode, but it gives more possibilities.
To switch from SCAN mode to EXPERT mode, select "Disp" with button 4 and then use
button 2 ("Xprt").
The SCAN and EXPERT modes are not also suitable to measure pulsed signals (like DECT).
When the signal is pulsed, the shown strength is the strength at the top of the pulse.

Users manual FA845 version 1.5
Envionic
22
3.2 SCAN Display
In the SCAN mode you will see the following screen:
A Information about the selected frequency band (here: GSM900)
B The frequency of the strongest signal in MHz
C Graphic area with Start and Stop frequencies (925 and 960 MHz for GSM900)
D The dotted line shows the position of the strongest signal
E Indicates that button 3 selects the previous frequency band
F Indicates that button 6 selects the next frequency band
G Indicates the maximum detected level ("Hold value") at each frequency
H Indicates the last measured level at each frequency
The strength of the strongest signal, 0.0005 µW/m² in this case, is shown at the top of the
screen.

Users manual FA845 version 1.5
Envionic
23
3.3 SCAN Frequency bands
The selected band will be shown at the left side of the screen (at position A, see previous
section), like this:
Shown on screen Meaning
01 Band number
GSM Band name (GSM 900)
900
↓ EU
Downstream, Europe
Downstream (indicated by down pointing arrow) means, that this is the signal that is sent from
the phone mast to a cell phone. The signal that a cell phone sends to the phone mast is called
upstream, and is shown as an arrow pointing upwards.
EU means, that this is a frequency band used in Europe (in the USA and some other countries,
the band frequencies are slightly different).
In the described software version, pre-programmed bands are:
1 GSM 900 downstream EU
2 GSM 1800 downstream EU
3 UMTS 2100 downstream EU
4 DECT 1880 EU
5 GSM 900 upstream EU
6 GSM 1800 upstream EU
7 UMTS 2100 upstream EU
8 WLAN
You can use button 6 or 3 to select the next or previous frequency band.
You can also define your own list of bands on the micro-SD card (explained in one of the next
sections).
It takes approx. 3 seconds to scan the GSM900 downstream band (with standard settings).

Users manual FA845 version 1.5
Envionic
24
3.4 SCAN Peak display
A dotted line (D) will show the position of the strongest signal (called Peak). The frequency of
the strongest signal is shown at the left side of the screen (B), and the strength is shown on top.

Users manual FA845 version 1.5
Envionic
25
3.5 Other functions in SCAN mode
The up- and down buttons make several other functions available:
A. Frequency band selection (as explained in section 3.3). Use the "Sngl" button for
continuously measuring at the peak frequency (see next section).
B. The marker function lets you control the dotted line by using ‘left’ and ‘right’ buttons.
The frequency at the marker position is shown at the left side of the screen, and the
strength at that frequency is shown on top. Use the "Sngl" button for continuously
measuring at the marker frequency (see next section).
C. Hold function, see one of the next sections
D. History function, to view the logged data
E. Switch to Expert mode, and adjust display brightness

Users manual FA845 version 1.5
Envionic
26
3.6 Single frequency measurement
After the "Sngl" button is used, the device will only measure at a single frequency.
Why is this useful ? Suppose a scan takes 3 seconds. If you want to keep the antenna in
different directions to see in which direction the signal is the strongest, you must wait 3
seconds in each direction before the same frequency is measured again. In the single frequency
mode, this waiting is not needed.
The single frequency button (called "Sngl") in SCAN BAND mode stops the scan and
continuously measures the frequency of the peak (the peak was detected during scanning). In
this way, the changes in signal level are displayed almost immediately.
If you use the "Sngl" button in the MKR (Marker) mode, you can continuously measure any
frequency in this band. By moving the marker (with the arrow buttons), you can freely choose
which frequency to measure.
If the measurement result changes strongly every second (in SNGL mode), this means that this
is a mirror image frequency. A mirror image frequency is an "unwanted" signal that is not
really present at the specified frequency.
The device acts as a "superheterodyne" receiver (see Wikipedia), which means you could see
mirror image frequencies.
In the FA845, the mirror frequencies are recognizable as follows: In SNGL mode, the device
uses two different intermediate frequencies ("IF" Intermediate Frequency). Every second, it
changes the IF frequency and the local oscillator between two values. This means that mirror
frequencies appear or disappear every second while the "real" frequency signals remain visible
all the time.
In XPRT mode, you can switch between the two intermediate frequencies with the IF-A, IF-B
function to check for mirror image frequencies.
The above section seems to imply that the intermediate frequency can be one of two fixed
values. However, these two frequencies are also dependent on the frequency that is received.
The single-frequency mode is switched off when you press "Sngl" again or when you switch to
another band. In SNGL mode, there is no data logging.
Users manual FA845 version 1.5
Envionic
27
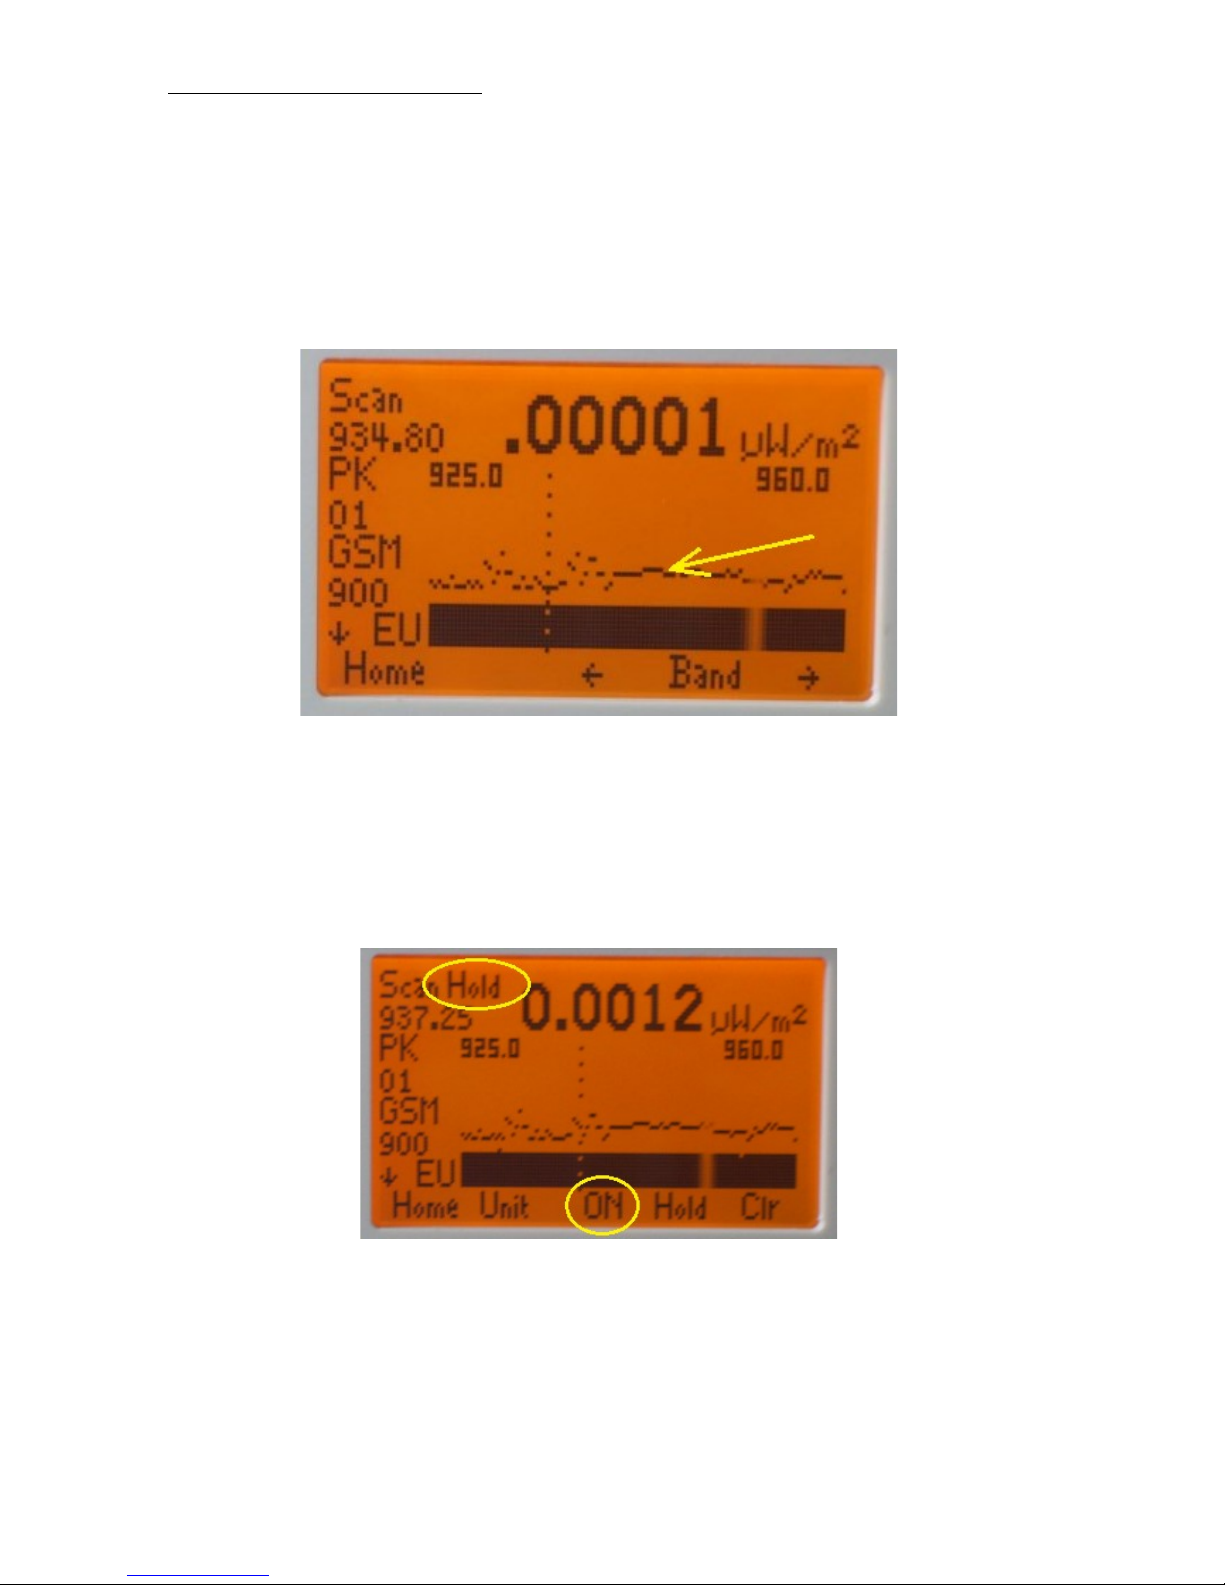
3.7 SCAN mode Hold function
The device remembers ("holds") the maximum value for each measured frequency. So, when
the input signal is removed, you only see the thin line of maximum measured values, as
illustrated in the next diagram (where the antenna has been disconnected to remove the signal):
You see that the display shows .00001, the actual level with disconnected antenna.
If you select HOLD and switch it from off to ON with button 3, the device will show the
remembered maximum level, 0.0012 in this case. The frequency of the remembered peak will
also be shown (937.25 MHz in this case).
With button 6 ("Clr") you can reset the hold-values to the current actual value.

Users manual FA845 version 1.5
Envionic
28
3.8 Define a list of frequency bands
You can define your own list of frequency bands. On your PC, create a file called "fa.ini".
You can edit the file with notepad or another suitable edit program (but not with "Word"). An
example band list is the following:
#S925; E960; (GSM 900 D EU)
#S1805;E1880;(GSM 1800 D EU)
#S2110;E2170;(UMTS 2100 D EU)
#S880; E915; (GSM 900 U EU)
#S1710;E1785;(GSM 1800 U EU)
#S1920;E1980;(UMTS 2100 U EU)
#S2410;E2520;(WLAN)
*
Every line that starts with "#" defines a single frequency band. After "#" you put:
"S" for the start frequency,
The start frequency in MHz, followed by ";"
"E" for the stop "End" frequency;
The stop frequency in MHz, followed by ";"
A description of the band between "("and ")".
After the last frequency band, the file must end with with "*".
The description will be shown on the screen of the device, as 3 rows of maximal 4 characters.
When a row starts with "U" or "D" followed by a space, this will be displayed as an arrow up
or down, to indicate if the band is upstream or downstream.
The device will also number the bands and show the number on the screen.
Shown on screen Meaning
01 Band number
GSM Band name (GSM 900)
900
↓ EU
Downstream, Europe
When the file is ready, copy it to the micro-SD memory card. (at the upper level, not in a
subdirectory). The "fa.ini" file will automatically be loaded after the device is switched on.
The new band list is stored within the device as long as the device is on. So when the device is
switched off and on again, the file will again be loaded from the memory card.
A band list file must not be longer than 1000 characters and the number of bands must be less
than 100.

Users manual FA845 version 1.5
Envionic
29
You can have multiple band list files. The name should be "xxxxxxx.ini" (xxxxxxxx can be
any name you want, max. 8 characters). If the file is not "fa.ini", it may also be located in a
subdirectory.
After switching the device on, the "fa.ini" will be loaded automatically. If you want to load
another band list file, select it from the "Home" screen by selecting “Menu” and then “Card”.
Then select the "xxxxxxx.ini" file and press "Open". This will load the file in the device. This
must be done each time after switching on.
Change the default unit:
Normally, the device will use the "microwatt per square meter" unit for RF, SCAN and Expert
modes after switching on. If you want another unit after switching on, add one of the following
lines at the beginning of the "fa.ini"file (before the first "#"):
UNIT = MV/M for millivolt per meter, or
UNIT = DBM for dBm.

Users manual FA845 version 1.5
Envionic
30
Chapter 4 RF Expert mode
The expert mode gives full control over the operation of the spectrum analyzer of the FA845.
To switch from SCAN mode to EXPERT mode, select "Disp" with button 4 and then use
button 2 ("Xprt").
4.1 XPRT Display
In the XPRT mode you will see the following screen:
At the left side of the screen, there is no band information (as in SCAN mode). Instead, the
SPAN (difference between start and stop frequency, here 35 MHz) and the RBW (resolution
bandwidth, here 100 KHz) are shown.
Do not confuse SPAN with SCAN !
Users manual FA845 version 1.5
Envionic
31
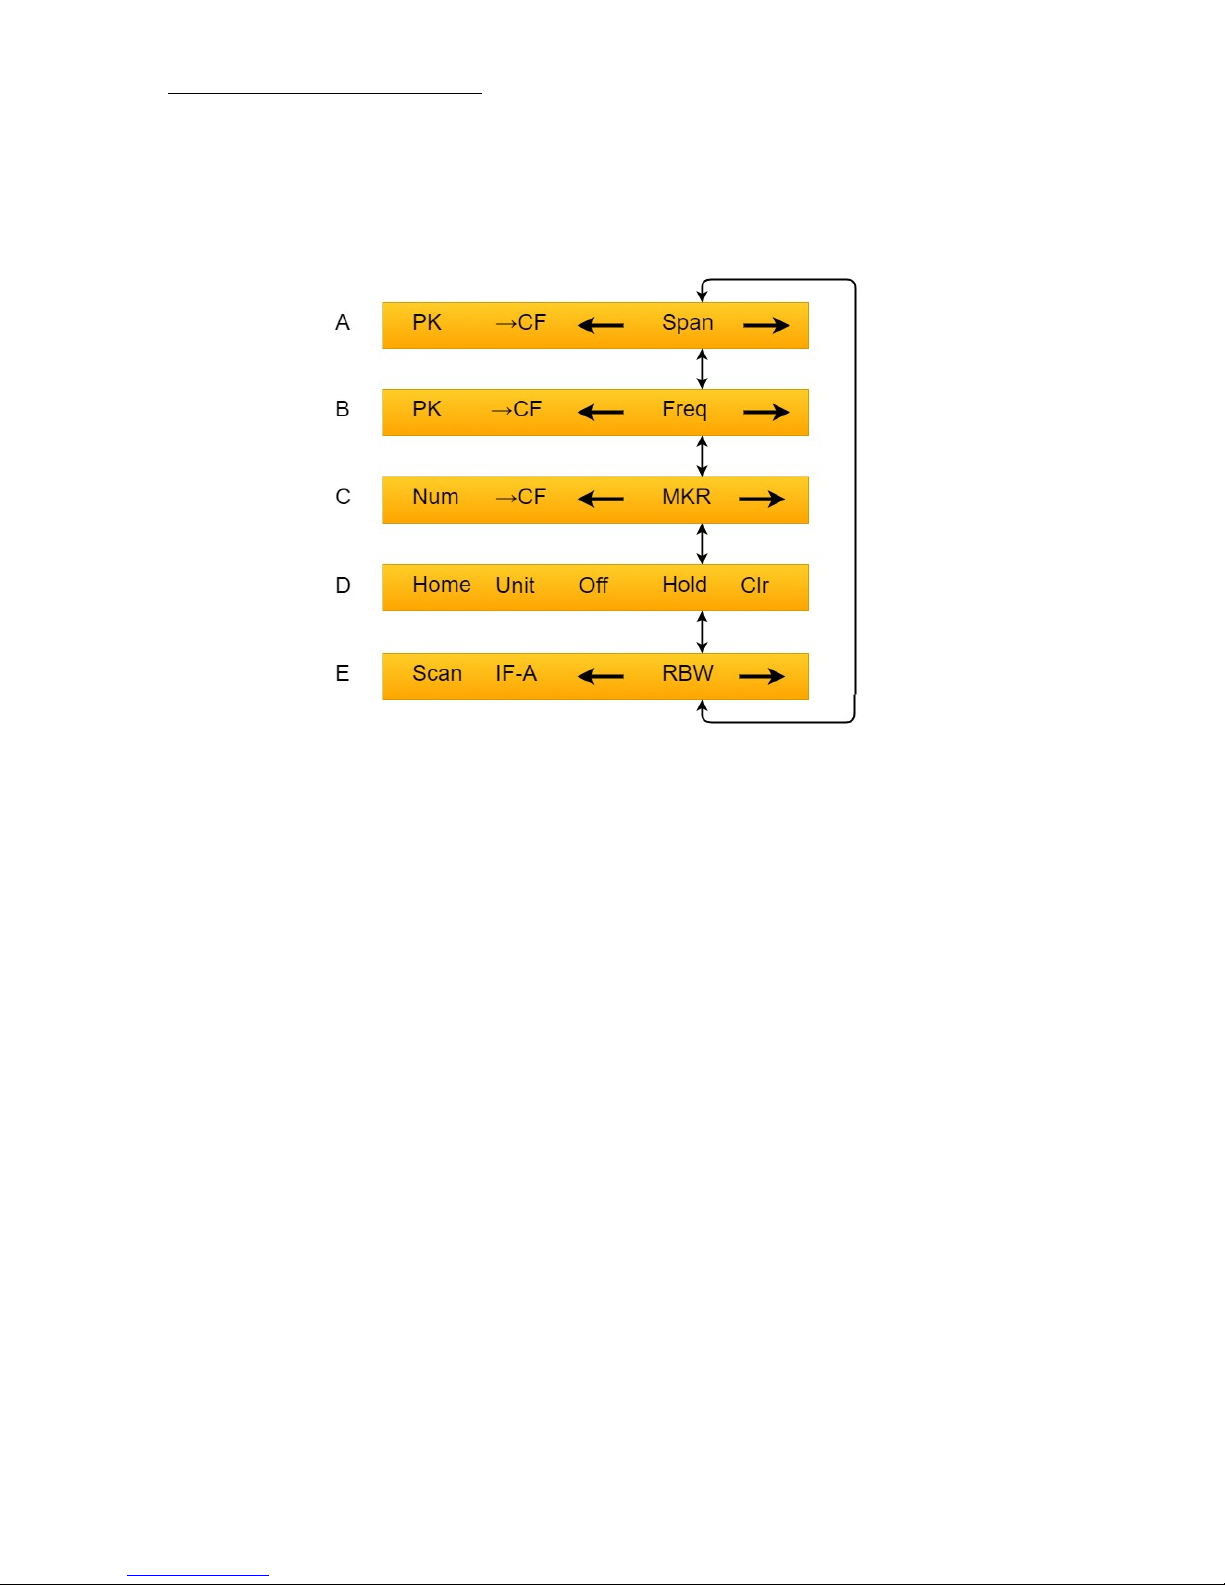
4.2 XPRT functions
The spectrum analyzer provides the following control functions, in several button modes
(button modes are selectable with the "up" and "down" buttons):
A. SPAN: Step up or down through a sequence of SPAN values (using ‘left’ and ‘right’
buttons). The Center Frequency stays the same when the SPAN changes.
Button 1: Select CF (center freq) mode or PK (peak freq) mode
Button 2: Set CF to PK frequency
B. FREQ: (See next section)
Step the center frequency up or down in half-SPAN steps (using ‘left’and ‘right’
buttons)
Button 1: Select CF (center freq) mode or PK (peak freq) mode
Button 2: Set CF to PK frequency
C. MKR: Move the dotted-line marker over the screen. Level and frequency at the marker
frequency are shown.
Button 1: "NUM" Numeric input of the marker frequency.
Button 2: You can bring the marker frequency to the middle of the screen with the
"→CF" button.
D. HOLD: Similar to Hold in SCAN mode.
E. RBW: Step up or down through a sequence of RBW (Resolution bandwidth, see next
page).
IF-A: This button toggles between two intermediate frequencies A and B. This is
useful to detect mirror image frequencies (see next page).

Users manual FA845 version 1.5
Envionic
32
The Resolution bandwidth (RBW) can be used to make a trade-off between sensitivity and measurement
time:
Low RBW: High sensitivity (low noise level), but slow measurement.
High RBW: Fast measurement, but lower sensitivity (high noise level)
Image frequency detection:
In XPRT mode, you can switch to another intermediate frequency with the IF-A function.
Pressing the same button again(it is now called IF-B) will switch back to the first intermediate
frequency.
A real signal will be visible (at the same frequency) for both values of the intermediate
frequency. But a mirror image will only be visible at one of both intermediate signals (or it
might also seem to change frequency).
For an explanation of mirror image frequencies, please consult Wikipedia on the subject
"superheterodyne" receiver (The spectrum analyzer is based on the superheterodyne principle).
The above section seems to imply that the intermediate frequency can be one of two fixed values. But in
fact, these two frequencies are also dependent on the frequency that is received.

Users manual FA845 version 1.5
Envionic
33
4.3 Frequency control
In FREQ mode, you can shift the frequency range up or down with the ‘left’and ‘right’ buttons
in "half SPAN" steps. The SPAN will not change.
So, if the setting was START = 600, STOP = 800 (so SPAN=200), after pressing the "right"
button you get START = 700, STOP = 900. The CF (center frequency) has changed from 700
to 800 MHz. (The frequencies in the picture do not match this example).
In FREQ and SPAN modes, you can use button 1 to toggle the indication between Peak (PK)
and Center Frequency (CF).
Peak selected
When PK (Peak) is selected, you can bring the peak to the middle of the screen with the
"→CF" (To Center Freq button 2).
Center Frequency selected
When CF (center frequency) is selected, the Center Frequency is shown (942.5 MHz in this
example, that is halfway 925 and 960 MHz).
Users manual FA845 version 1.5
Envionic
34
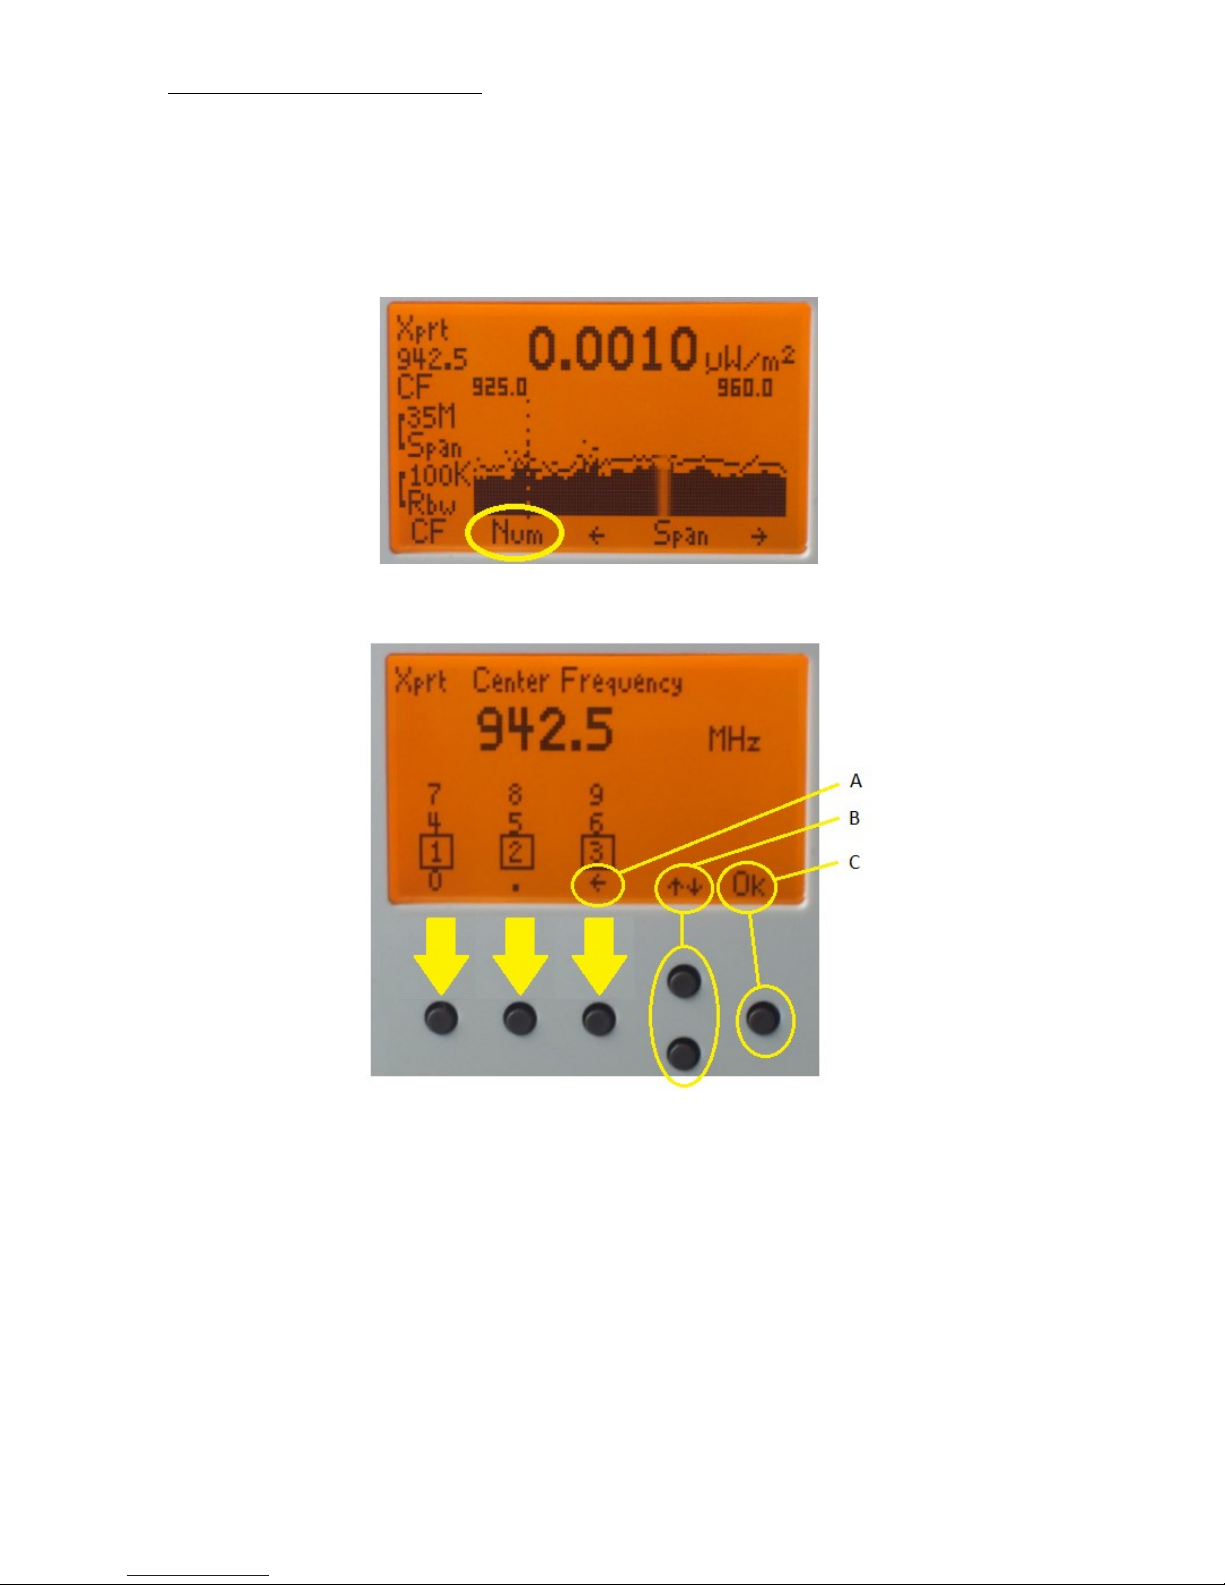
4.4 Directly enter Center Frequency
When CF "center frequency" is selected, you can directly enter a new center frequency.
Press "Num" (button 2). You get the following screen:
The first 3 buttons can be used to enter the digits that are in a box (1, 2 or 3 here).
A. The backarrow removes the last entered digit.
B. The up/down buttons move the row of boxes up or down, so 4, 5, 6 or other digits can
be entered.
C. Press OK when ready.
The entered frequency is always in MHz.
The SPAN will not change. The START and STOP frequencies will automatically change.

Users manual FA845 version 1.5
Envionic
35
4.5 Changing the SPAN
By changing the SPAN, you can increase or decrease the difference between the START and
STOP frequencies. The frequency in the middle (CF, center frequency) will stay the same.
Example:
Suppose START = 600, STOP = 800 (so SPAN=200). If you decrease the SPAN from 200 to
100 MHz, you will get :
START = 650, STOP = 750 (so SPAN=100).
The center frequency, 700 MHz, will not change.
When you use the arrow buttons to change the SPAN, the following fixed values for SPAN
will be used:
0, 100kHz, 200kHz, 500kHz,
1MHz, 2MHz, 5MHz,
10MHz, 20MHz, 50MHz,
100MHz, 200MHz, 500MHz

Users manual FA845 version 1.5
Envionic
36
4.6 Directly enter START and STOP frequency
It is also possible to directly enter a START and STOP frequency:
In FREQ or SPAN modes, press button 1 and keep it pressed during one second, this gives you
the following screen:
Now, pressing "Num" will let you enter the "From" START frequency.
After entering the start frequency, press button 1 again, giving the following screen:
Now, pressing "Num" will let you enter the "TO" STOP frequency (not shown).
After entering From and To frequencies, the SPAN will be set automatically.

Users manual FA845 version 1.5
Envionic
37
Chapter 5 Low frequency electric field
5.1 Orientation
Electric field sensor position
The sensor is internal, at the left side of the device. An antenna is not needed. The device
should be held in a vertical position, with the sensor pointing to the direction in which you
want to measure. (Devices with software version below 2.0 have the sensor at another position, see
the section at the end of this chapter).
Do not put your hand in front of the sensor, this will attenuate the electric field and result in a
measurement result that is much too low.
The device should be ‘grounded’ by placing one of your fingers at the grounding point at the
backside of the device.
Grounding point
The device responds to changes in the surrounding electric field. This means that it will respond to the
50 Hz changing field of the electric wiring and devices in the house, but it will also respond to a change
in the static electric field.
A static electric field can be as strong as 1000V/m and it will not be the same at every place in the
room. A small movement in this field can produce a high result on the screen. Thus the device should
not be moved during the measuring procedure.
The static electric field can change as well when someone else walks through the room and this also
can have an influence on the measurement result.

Users manual FA845 version 1.5
Envionic
38
5.2 Measurements
The display will show the strength of the electric field in V/m (Volts per meter). It will also
show the waveform. The vertical height of the waveform is automatically adjusted for optimal
visibility.
The range is 0.5 V/m up to 199 V/m.
After switching the device on, it will take 20 seconds before the electric field can be measured.
If you choose “Hold” (switch this on as described in chapter 1), the measurements will stop,
and the last measurement will be frozen on the screen, until “Hold” is switched off again.
The distance to the source of the field has a big influence on the measurement result.
Users manual FA845 version 1.5
Envionic
39
5.3 Safe values
When you choose "Safe", you will see (together with the measured value) what values are safe
for the electric field strength during sleep, according to the German SBM2015 standard. Also
the values with qualification “slight concern”, “severe concern” and “extreme concern” will be
visible.
Again pressing “Safe” will switch back to the normal display.
For indoor living or working areas, you can use values that are 10 times higher than the values
during sleep, that are shown here.
5.4 Orientation for older devices
In older devices (with software version below 2.0), the electric field sensor is at another
position. (The software version can be found in the home screen, on the top line).
Electric field sensor position
For these older devices, the sensor is at the back side of the device. The device should be held
in a vertical position, with the sensor pointing to the direction in which you want to measure.

Users manual FA845 version 1.5
Envionic
40
Chapter 6 Low frequency magnetic field
6.1 Measurement
The magnetic field sensor is placed at the right side of the device. An antenna is not needed.
The human body does not shield the magnetic field (as opposed to the electric field), so it is
not very important how the device is held in your hand.
The device should be hold in several position, because it is only sensitive to a single direction
of the magnetic field lines. The highest measured value should be used.
The device should not be moved during the measurement.
Magnetic sensor position
The display will show the strength of the magnetic field in microTesla. It will also show the
waveform. The vertical height of the waveform is automatically adjusted for optimal visibility.
The measurement range is from 0.01 µT up to 3.99 µT.
The distance to the source of the magnetic field has a big influence on the measured strength of
the magnetic field.
Users manual FA845 version 1.5
Envionic
41
If you choose “Hold” (switch this on as described in chapter 1), the measurements will stop,
and the last measurement will be frozen on the screen, until “Hold” is switched off again.
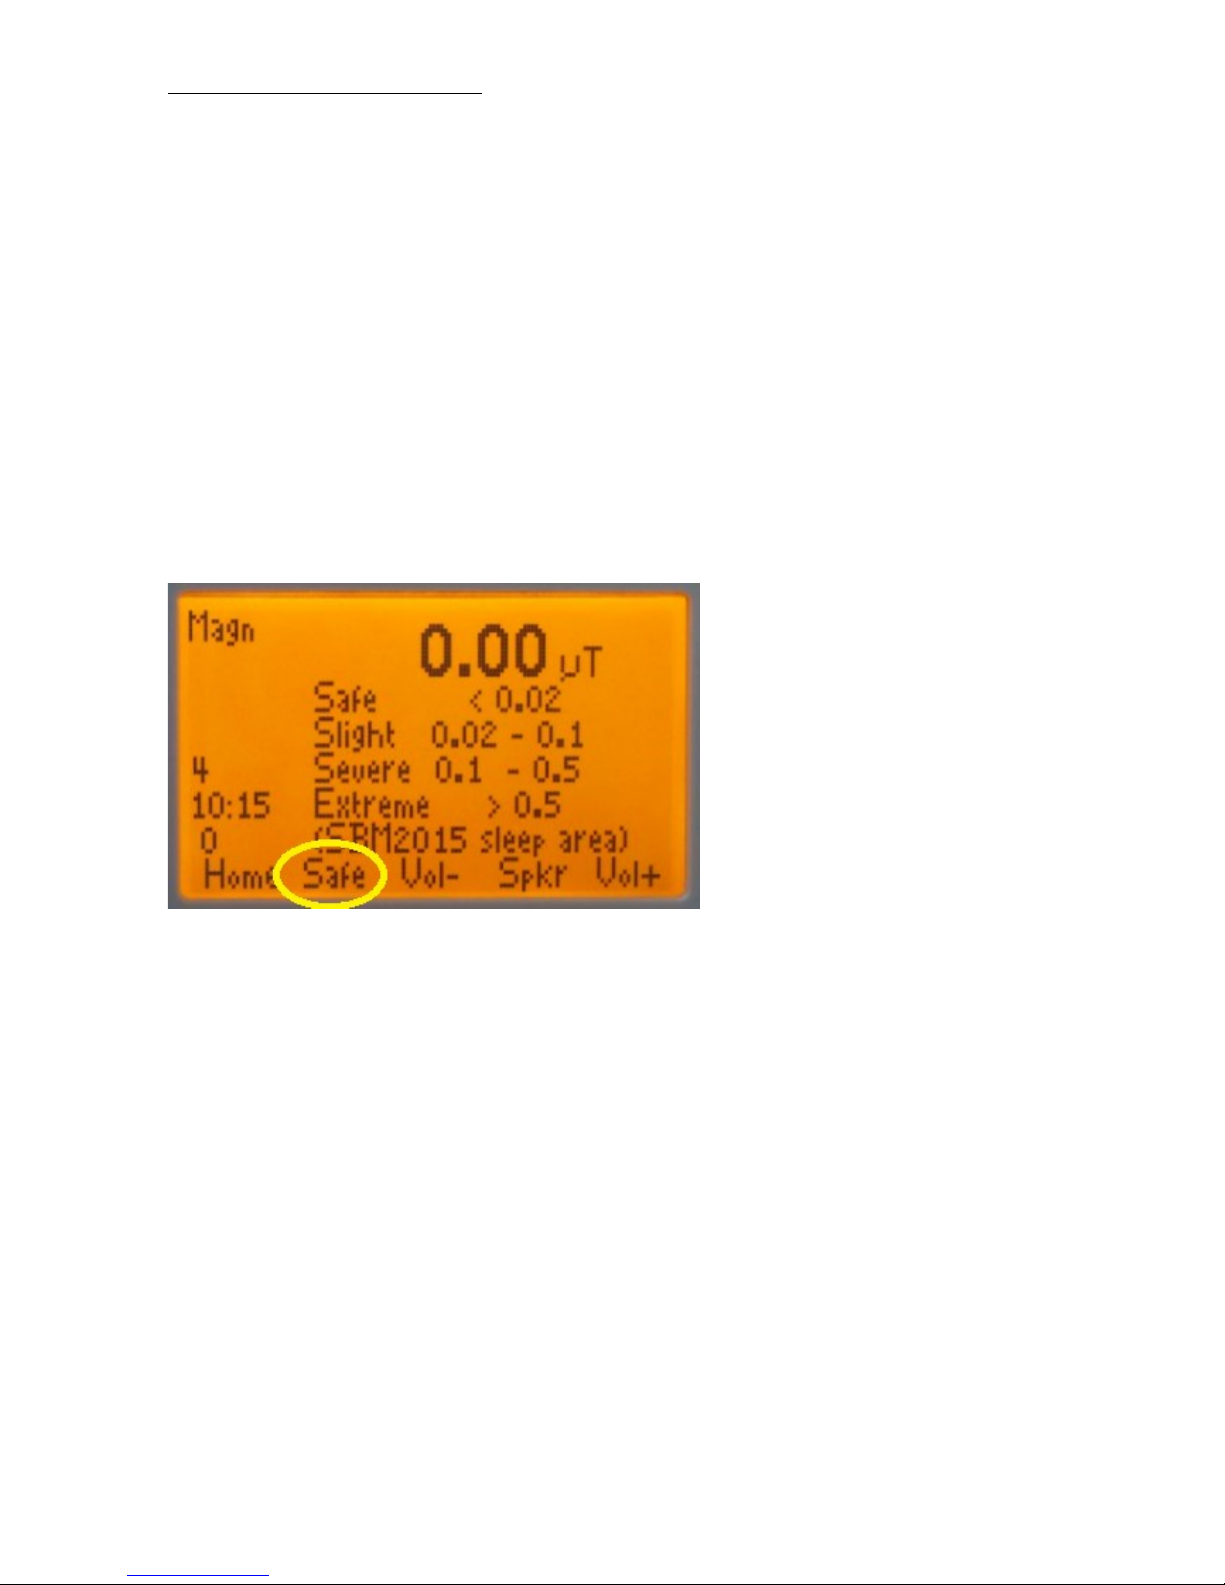
6.2 Safe values
When you choose "Safe", you will see (together with the measured value) what values are safe
for the magnetic field strength during sleep, according to the German SBM2015 standard. Also
the values with qualification “slight concern”, “severe concern” and “extreme concern” will be
visible.
Again pressing “Safe” will switch back to the normal display.
For indoor living or working areas, you can use values that are 10 times higher than the values
during sleep, that are shown here.

Users manual FA845 version 1.5
Envionic
42
Chapter 7 Displaying logged measurement results
7.1 Display logged measurements on the device itself
Every 10 seconds, the FA725, FA735 and FA845 devices store the measured value on their
micro-SD memory card.
You can examine all stored values. Press button 4 or 5 to choose the “Mem” functiongroup.
Then push button 3, “Hist” (History). An overview appears with measurements of the current
day.
Measurements of one day
In the top line you see the year, month, date and the day of the week.
Choose the kind of measurements that you want to see (with button 6), for instance
“RF uW/m²”. The logged RF measurements include logging in SCAN and EXPERT modes.
Use the upper option “..” to get an overview of all measurements of the current month. Again
choosing “..” gives an overview measurements of all months.
You can also get an overview of measurements of all months from the “Home” start screen.
Just select “Menu” and then “Card”and “Log”.
If the memory card is not present, you will get a warning directly after switching the device on.
Users manual FA845 version 1.5
Envionic
43
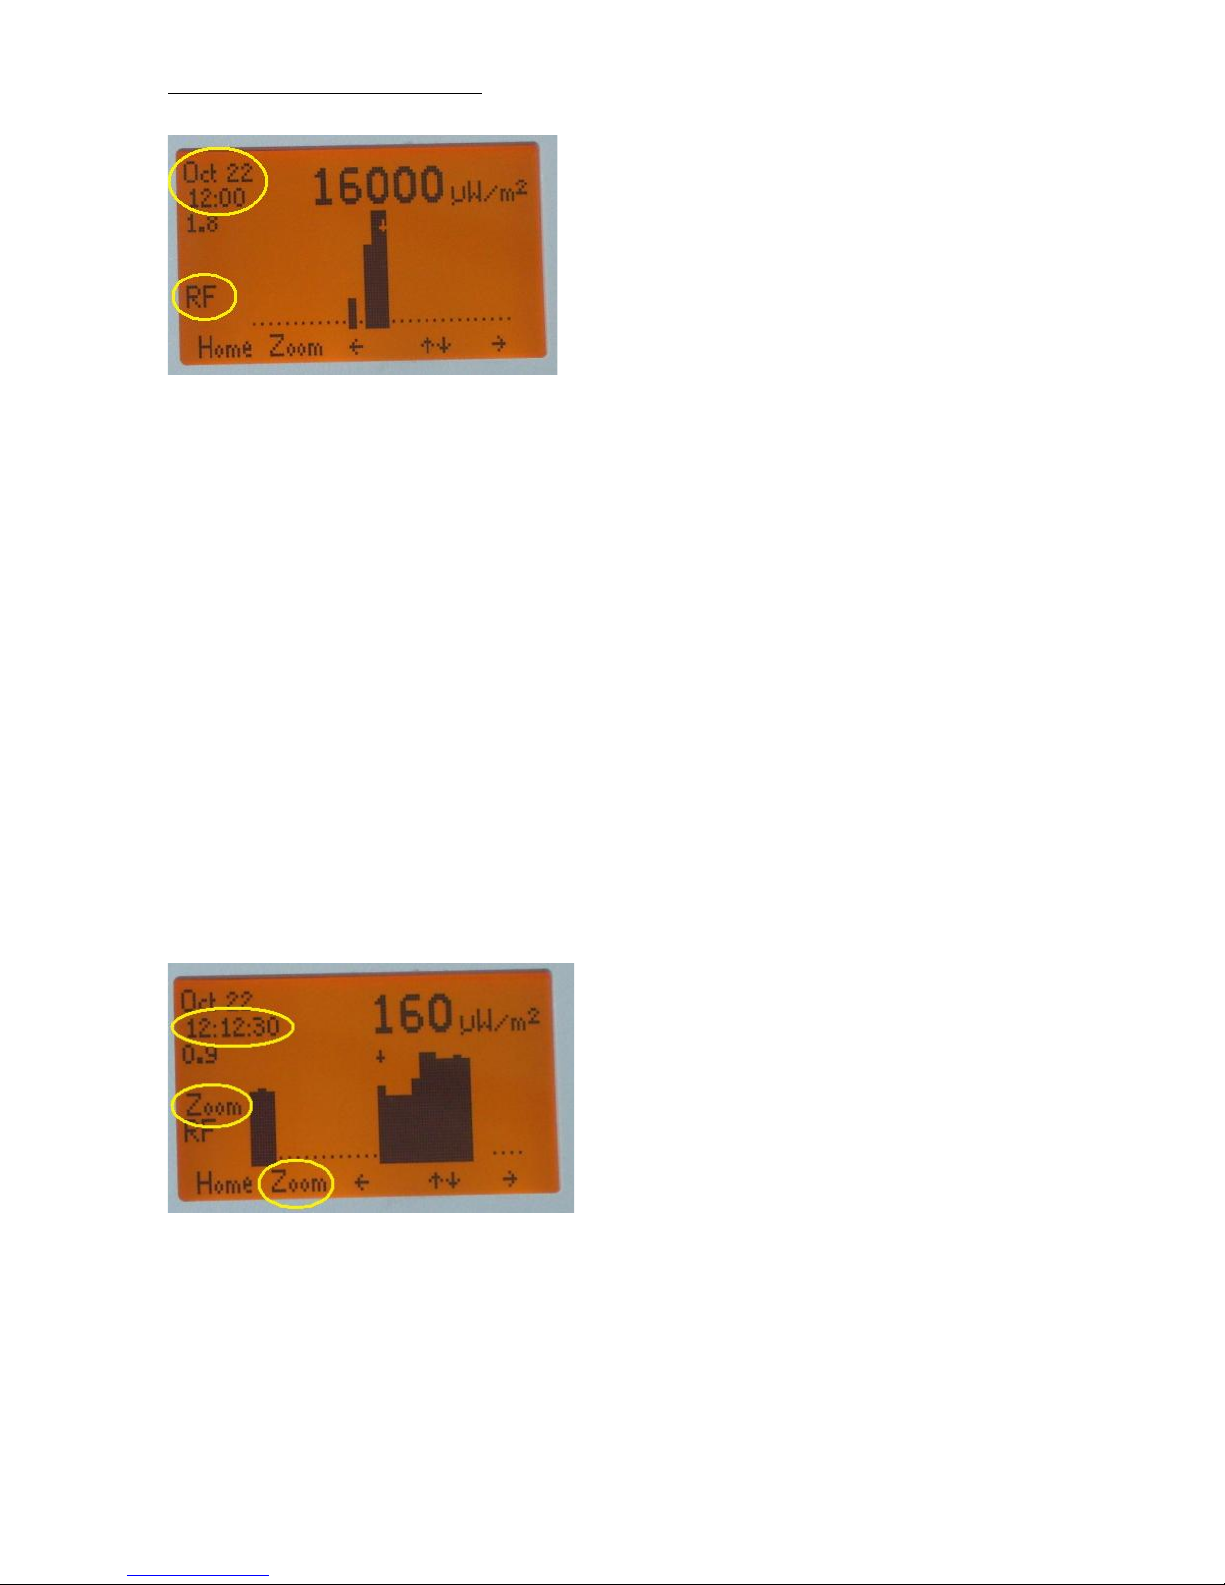
Signal strength per quarter of an hour
After selecting the measurement, you will see a bar diagram with the maximum strength of
every time period. Every bar in the diagram is a period of 15 minutes.
With the arrow buttons (3 and 6) you can move the little arrow on the screen to the left and to
the right, selecting a certain time period. Instead of a little arrow, a dotted line may be shown.
The maximal signal strength of the selected period will be shown at the top of the screen. In
the next example (signal strength per 10 sec) this little arrow is under the “1” of the value
“160”.
The starting time of the chosen time period is shown at the top left corner of the screen (in the
example: october 22, 12:00). The frequency category that belongs to the choosen time period,
is at the left side of the screen.
There are 32 time periods on screen, together this is 8 hours. The other hours of the day
become visible by moving the arrow to the side of the screen.
The arrow buttons have an auto-repeat function. The button function will repeat if the button is
pressed for longer than half a second.
Signal strength per 10 sec (zoom)
If you want a more detailed overview, you can press button 2 (“Zoom”). This will enlarge the
chosen 15 minutes to 90 bars of 10 seconds each. The Zoom state will be indicated at the left
side of the screen.
Pressing “Zoom” again will bring you back to the bars of 15 minutes.
Users manual FA845 version 1.5
Envionic
44
7.2 Connecting the Micro-SD card to your PC
You can also see the stored measurements as a spreadsheet on your PC with Microsoft Excel.
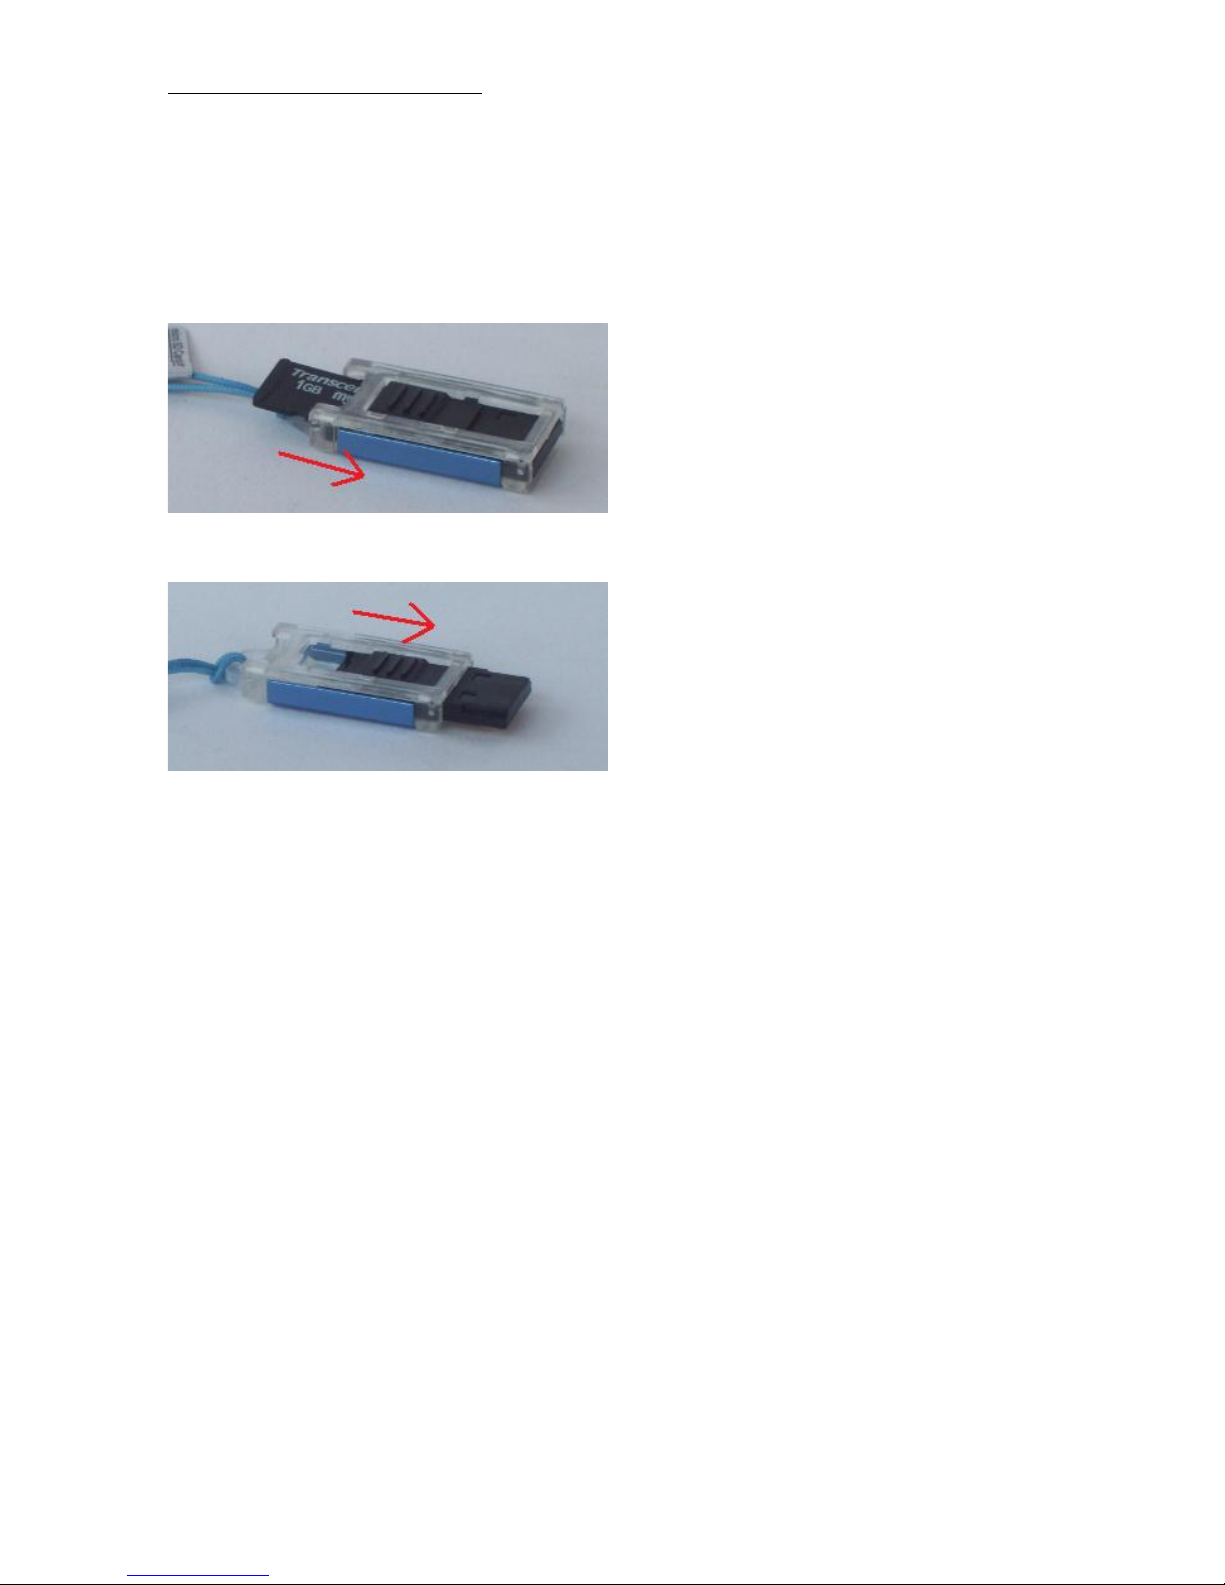
Switch the device off, and remove the micro-Sd card. Use your nail to press the micro-SD
card a little, the card will then be released and you can take it out.
Put the micro SD card in the cardreader
Push the slide of the cardreader
Use the cardreader (that is included with the FA725/735/845) to connect the micro-SD card to
a USB port of your computer. The cardreader should be placed with the blue side facing
upwards. (It will fit in two ways, but it will work in only one way).
As soon as the cardreader is attached to the PC, a window will pop up.
Choose “Open folder to view files”. Then choose the folder “Log”, and then select the month
and day of the measurements that you want to see.
In this folder you see a file xx-yyyzz.csv,
( xx = A..Z, yyy = month, zz=day), for example EJ-OCT22.CSV
When you click on this file, Microsoft Excel will open and show the measurements (see next
section).
If you want, you can copy this file to your PC to archive it. You can put the files of all days in
the same folder, the xx code in the name guarantees that the files will be sorted according to
their date. The first ‘x’is the year (A=2011) and the second ‘x’ is the month ( A=january ).
The cardreader can be another type than shown here.

Users manual FA845 version 1.5
Envionic
45
7.3 View measurements with your computer
At row 1 you see the software version, the date, and the serial number of the device.
Row 2 indicates the moment when the electrical field measurement is started. The values for
electric field measurement are in row 3 up to 5. De unit is in column E, and the value itself is
in column D.
Row 6 indicates the start of the magnetic field measurement. The values for magnetic field
measurement are in row 7 up to 9. De unit is in column E, and the value itself is in column D.
Row 10 ('RF') indicates the start of the electromagnetic field measurement, and indicates the
meaning of the cells in the following RF rows. Cell G10 up to R10 indicate the frequency
category of the cells below them. (In this example, several columns are deleted between
column H and I, to get a clearer picture). The first frequency category is “0.3 GHz” (300MHz)
and the last one is “5 to 6 GHz”. Frequencies of 2.9 GHz go into the 3-4 GHz range.
We will take row 14 as an example for the RF values. In this row, columns G, H, I etc.
indicate the values that belong to the frequency in the same column in row 10.
The frequency category with the highest value is in column F, this is 5-6 GHz. The value that
belongs to this frequency is in column D (in column “max”), this value is 2500 microwatt/m2
here. The same value is found in column R, that contains the values for 5-6 GHz.
The unit for RF measurement (column E) is the same as the unit used during the
measurements.
Devices with software version below 2.0 have columns D and F swapped.

Users manual FA845 version 1.5
Envionic
46
Appendices
Appendix 1 Specifications FA845
High frequency:
- High frequency RF Measurement:
300 Megahertz up to 6.0 Gigahertz (with frequency measurement)
Display in micro-Watt per square meter (µW/m²) , Volt per meter (V/m) or dBm.
Range 0.05 µW/m² up to 2000 µW/m²
- High frequency Spectrum analyzer:
10 Megahertz up to 3.7 Gigahertz (with frequency measurement)
Display in micro-Watt per square meter (µW/m²) , Volt per meter (V/m) or dBm.
Range approx. 0.0001 µW/m² up to 2000 µW/m²
Uses pre-defined or user-defined frequency bands
Adjustable start- and stop frequencies, and adjustable resolution bandwidth
- Display shows signal strength as a function of frequency or time
- Logaritmic scale can show weak signals in the presence of strong pulses of another frequency
- Displays the peak value of pulsed signals
- Hold function for remembering the highest peak value
- SMA connector for external antenna
- Antenna for 700 MHz - 6 GHz is included
Low frequency:
- Low frequency electric field from 0.5 V/m up to 199 V/m (Volt per meter). Internal sensor
- Low frequency magnetic field from 0.01 µT up to 3.99 µT (micro-Tesla). Internal sensor
- Shows the waveform of low frequency electric and magnetic fields
General:
- Automatic logging of measurement values on a micro-SD memory card
- Measurements are stored together with time and date
- Shows stored measurements on the display or as a spreadsheet on a PC (with Excel)
- Graphic display, 128x64 pixels, with adjustable backlight
- Speaker with volume control, to make the signals audible
- Connection for external speaker
- Internal software upgradeable through the micro-SD memory card
- Powered by 2 AA batteries (included) or NiMH rechargeable batteries (option).
- Indication for battery condition
- Connection for battery charger
- Dimensions 150 x 90 x 24 mm (excl antenna).
- weight 240 gram

Users manual FA845 version 1.5
Envionic
47
Appendix 2 Conversion from microwatt /m² to milliVolt /meter.
The screen displays the strength of the radiation in microwatt per square meter
(µW/m²). The unit ‘Volt per meter’ (V/m) is also frequently used, and can be calculated with
the following table.
display
mV/m µW/m²
4000 40.000
3500 32.000
3200 25.000
2800 20.000
2500 16.000
2200 12.500
2000 10.000
1800 8.000
1600 6.300
1400 5.000
1250 4.000
1100 3.200
1000 2.500
900 2.000
800 1.600
700 1.250
620
1.000
560 800
500 630
450 500
400 400
350 320
320 250
280 200
250 160
220 125
200 100
180 80
160 63
140 50
125 40
110 32
100 25
90 20
80 16
70 12,5
62 10,0
56 8,0
50 6,3
45 5,0
The value in the mV/m column should be
divided by 1000 to convert it to Volt per meter.
The conversion between these units is
quadratic. When the mV/m value doubles, the
µW/m² value quadruples.
.
40 4,0
35 3,2
32 2,5
28 2,0
25 1,6
22 1,25
20 1,00
18 0,80
16 0,63
14 0,50
12,5 0,40
11 0,32
10 0,25
9 0,20
8 0,16
7 0,125
6,2 0,100
5,6 0,080
5,0 0,063
4,5 0,050
4,0 0,040
3,5 0,032
3,2 0,025
2,8 0,020
2,5 0,016
2,2 0,0125
2,0 0,0100

Users manual FA845 version 1.5
Envionic
48
Appendix 3 More information
www.powerwatch.org.uk
www.mast-victims.org
www.tetrawatch.net
The SBM2015 can be found at:
http://www.baubiologie.de
Appendix 4 Abbreviations
Hz Hertz Unit for the number of cycles per second
KHz KiloHertz 1000 Hertz
MHz MegaHertz 1000000 Hertz
GHz GigaHertz 1000000000 Hertz
T Tesla Unit for strength of magnetic field
µT microTesla 0.000001 Tesla
nT nanoTesla 0.000000001 Tesla
V Volt Unit for electric potential difference
mV milliVolt 0.001 Volt
W Watt Unit for power (energy per second)
µW microWatt 0.000001 Watt
DECT Digital Enhanced Cordless Telephone
GSM Global System for Mobile Communications
TETRA Terrestrial Trunked Radio
UMTS Universal Mobile telecommunications system
WLAN Wireless local area network
------------------------------------------------------------------------------------------------------------------
Due to continuous improvements in the described devices, information contained in this manual is
subject to change without notice.
The device and the manual were assembled with great care. However, the seller or manufacturer can
not be held responsible if any direct or indirect damage occurs during or after the use of this device or
the information in this manual.
----------------------------------------------------------------------------------------------------------------------------
 Loading...