

Page 1

MicroMMAC-T User's Guide
Page 2

Page 3

Notice
Enterasys Networks reserves the right to make changes in specifications and other information
contained in this document without prior notice. The reader should in all cases consult Enterasys
Networks to determine whether any such changes have been made.
The hardware, firmware, or software described in this manual is subject to change without notice.
IN NO EVENT SHALL ENTERASYS NETWORKS BE LIABLE FOR ANY INCIDENTAL, INDIRECT,
SPECIAL, OR CONSEQUENTIAL DAMAGES WHATSOEVER (INCLUDING BUT NOT LIMITED
TO LOST PROFITS) ARISING OUT OF OR RELATED TO THIS MANUAL OR THE INFORMATION
CONTAINED IN IT, EVEN IF ENTERASYS NETWORKS HAS BEEN ADVISED OF, KNOWN, OR
SHOULD HAVE KNOWN, THE POSSIBILITY OF SUCH DAMAGES.
Virus Disclaimer
Enterasys has tested its software with current virus checking technologies. However, because no antivirus system is 100% reliable, we strongly caution you to write protect and then verify that the
Licensed Software, prior to installing it, is virus-free with an anti-virus system in which you have
confidence.
Enterasys Networks makes no representations or warranties to the effe ct that the Lice nsed Software is
virus-free.
Copyright April 2000 by Enterasys Networks. All rights reserved.
Printed in the United States of America.
Order Number: 9031583-04 April 2000
Enterasys Networks
P.O. Box 5005
Rochester, NH 03866-5005
Enterasys, NetSight, and Matrix E7 are trademarks of Enterasys Networks.
Cabletron Systems, SPECTRUM, BRIM, DNI, FNB, INA, Integrated Network Architecture,
LANVIEW, LANVIEW Secure, Multi Media Access Center , MiniMMAC , and TRMM ar e registered
trademarks, and Bridge/Router Interface Mo dules, BRIM-A100, CRBRIM-W/E, CRXMIM,
CXRMIM, Desktop Network Interface, Distributed LAN Monitoring, Distributed Network Server,
DLM, DNSMIM, E1000, E2000, E3000, EFDMIM, EMM-E6, EMME, EPIM, EPIM-3PS, EPIM-A,
EPIM-C, EPIM-F1, EPIM-F2, EPIM-F3, EPIM-T, EPIM-T1, EPIM-X, ESXMIM, ETSMIM, ETWMIM,
FDCMIM-04, FDCMIM-08, FDMMIM, FDMMIM-04, Flexible Network Bus, FOMIM, FORMIM,
HubSTACK, IRBM, IRM, IRM-2, IRM-3, Media Interface Module, Micro M MAC, MIM, MMAC,
MMAC-3, MMAC-3FNB, MMAC-5, MMAC-5FNB, MMAC-8, MMAC-8FNB, MMAC-M8FNB,
MMAC-Plus, MRX, MRXI , MRXI-24, MultiChannel, NB20E, NB25E, NB30, NB35, NBR-220/420/620,
RMIM, SecureFast Switch, SecureFast Packet Switching, SFS, SFPS, SPECTRUM Element
Manager, SPECTRUM for Open Systems, SPIM-A, SPIM-C, SPIM-F1, SPIM-F2, SPIM-T, SPIM-T1,
TPMIM, TPMIM-22, TPMIM-T1, TPRMIM, TPRMIM-36, TPT-T, TRBMIM, TRMM-2, TRMMIM,
and TRXI are trademarks of Cabletron Systems, Inc.
i
Page 4

AppleTalk, Apple, Macintosh, and TokenTalk are registered trademarks; and Apple Remote Access
and EtherTalk are trademarks of Apple Computer, Inc.
SmartBoost is a trademark of American Power Conversion
ST is a registered trademark and C++ is a trademark of AT&T
Banyan and VINES are registered trademarks of Banyan Systems, Inc.
cisco, ciscoSystems, and AGS+ are register ed trad emarks; and cBus, cisco Router, CRM, IGS, and MGS
are trademarks of cisco Systems, Inc.
GatorBox is a registered trademark; and GatorMail, GatorMIM, GatorPrint, GatorShare, GatorStar,
GatorStar GX-M, and XGator are trademarks of Cayman Systems, Inc.
CompuServe is a registered trademark of CompuServe Incorporated
X Window System is a trademark of Consortium, Inc.
CTERM, DECnet, and ULTRIX are registered trademarks; and DEC, DEC C++, DECnet-DOS,
DECstation, VAX DOCUMENT, VMA, and VT are trademarks of Digital Equipment Corporation
Fore Systems, ForeRunner, and ForeRunner ASX-100 are trademarks of Fore Sys tems, Inc.
PC/TCP is a registered trademark of FTP Software, Inc.
HP OpenView is a registered trademark of Hewlett-Packard, Inc.
AIX, IBM, OS/2, NetView, and PS/2 are registered trademarks; and AT, Micro Channel, PC, PC-DOS,
PC/XT, Personal Computer AT, Operating System/2, Personal System/2, RISC System/6000, and
Workplace Shell are trademarks of International Business Machines Corporation
i960 microprocessor is a registered trademark; and Intel and Multichannel are trademarks of Intel
Corporation
Microsoft, MS-DOS, and Windows are registered trademarks of Microsoft Corporation
Chameleon, ChameleonNFS, Chameleon 32, IPX/link, and NEWT are trademarks of
NETMANAGE, Inc.
NetWare and Novell are registered trademarks; and Internetwork Packet Exchange (IPX), IPX, and
Network File System (NFS) are trademarks of Novell, Inc.
Motif and MS are r egist ered tr ademarks; and Open Softwar e Fou ndation, OS F, OSF/1, and OSF/Moti f
are trademarks of The Open Software Foundation, Inc.
Silicon Graphics and IRIS are registered trademarks; and Indigo and IRIX are trademarks of Silicon
Graphics, Inc.
NFS, PC-NFS, SPARC, Sun Microsystems, and Sun Workstation are registered trademarks; and
OpenWi ndows, SPARCstation, SPARCstation IPC, SPARCstation IPX, Sun, Sun-2, Sun-3, Sun-4,
Sun386i, SunNet, SunOS, SunSPARC, and SunView are trademarks of Sun Microsystems, Inc.
OPEN LOOK and UNIX are registered trademarks of Unix System Laboratories, Inc.
Ethernet, NS, Xerox Network Systems and XNS are trademarks of Xerox Corporation
ANNEX, ANNEX-II, ANNEX-IIe, ANNEX-3, ANNEX-802.5, MICRO-ANNEX-XL, and MICRO-
ANNEX-ELS are trademarks of Xylogics, Inc.
MAXserver and Xyplex are trademarks of Xyplex, Inc.
ii
Page 5

Restricted Rights Notice
(Applicable to licenses to the United States Government only.)
1. Use, duplication, or disclosure by the Government is subject to restrictions as set forth in
subparagraph (c) (1) (ii) of the Rights in Technical Data and Computer Software clause at DFARS
252.227-7013.
Enterasys Networks, 35 Industrial Way, Rochester, New Hampshire 03867-0505.
2. (a) This computer software is submitted with restricted rights. It may not be used, reproduced, or
disclosed by the Government except as provided in paragraph (b) of this Notice or as otherwise
expressly stated in the contract.
(b) This computer software may be:
(1) Used or copied for use in or with the computer or computers for which it was acquired,
including use at any Government installation to which such computer or computers may
be transferred;
(2) Used or copied for use in a backup computer if any computer for which it w as acquired
is inoperative;
(3) Reproduced for safekeeping (archives) or backup purposes;
(4) Modified, adapted, or combined with other computer software, provided that the
modified, combined, or adapted portions of the derivative software incorporating
restricted computer software are made subject to the same restricted rights;
(5) Disclosed to and reproduced for use by support service contractors in accordance with
subparagraphs (b) (1) through (4) of this clause, provided the Government makes such
disclosure or reproduction subject to these restricted rights; and
(6) Used or copied for use in or transferred to a replacement computer.
(c) Notwithstanding the foregoing, if this computer software is published copyrighted computer
software, it is licensed to the Government, without disclosure prohibitions, with the minimum
rights set forth in paragraph (b) of this clause.
(d) Any other rights or limitations regarding the use, duplication, or disclosure of this computer
software are to be expressly stated in, or incorporated in, the contract.
(e) This Notice shall be marked on any reproduction of this computer software, in whole or in part.
iii
Page 6

iv
Page 7

Chapter 1 Introduction
Using This Guide .......................................................................................................... 1-2
Related Manuals............................................................................................................ 1-3
Software Conventions..................................................................................................1-3
Using the Mouse....................................................................................................1-3
Using Window Buttons.........................................................................................1-5
Common MicroMMAC-T Window Fields.........................................................1-5
Getting Help ............................................... ...... ..... ...... ...... ............................................1-7
Using On-line Help................................................................................................1-7
Getting Help from Enterasys Global Call Center..............................................1-7
Chapter 2 The MicroMMAC-T Chassis View
Viewing Chassis Information...................................................................................... 2-2
Front Panel Information........................................................................................2-3
Menu Structure....................................................................................................... 2-4
Port Status Displays...............................................................................................2-9
Selecting a Port Status View.......................................................................... 2-9
Ring Port Status .............................................................................................2-11
Port Status Color Codes............................... ...... ...........................................2-11
The Chassis Manager Window.......................................................................... 2-12
Viewing Hardware Types...................................................................................2-12
Device Type ...................................................................................................2-13
Module Type..................................................................................................2-13
Managing the Hub...................................................................................................... 2-13
Management Station Configuration........................ .......................................... 2-14
Accessing the TR Management Station Configuration Window...........2-14
Setting Station Name and Location........................................................... 2-15
Specifying Ring Management Functions.................................................. 2-16
Viewing Network Information .......................................................................... 2-18
Selecting the Ring......................................................................................... 2-18
Network Information Window Fields.......................................................2-19
Viewing Module Status....................................................................................... 2-20
Token Ring Board Status Window Fields..................................................2-20
Viewing Ring Port Status....................................................................................2-21
Accessing the Ring Port Status window................................................... 2-21
Ring Port Status Window Fields.................................................................2-22
Using the Media Type and Phantom Current Radio Buttons................2-23
Setting the Device Date and Time ..................................................................... 2-23
Using an Uninterruptable Power Supply (UPS).............................................2-24
Contents
v
Page 8

Contents
Accessing the UPS Window........................................................................2-25
Setting the UPS ID ........................................................................................2-27
Using the Test Option...................................................................................2-27
Using the Disconnect Option......................................................................2-27
Resetting the Device ............................................................................................2-27
Enabling and Disabling Port Mapping.............................................................2-28
Enabling and Disabling Link Traps...................................................................2-29
Enabling and Disabling Link Traps at the Board Level...........................2-30
Setting Token Ring Boards to Automode......................................................... 2-30
Enabling and Disabling Ports............................................................................. 2-31
Enabling and Disabling Station Ports........................................................2-31
Enabling and Disabling Ring Ports............................................................ 2-31
Ring Out Enable/Disable............................................................................2-32
Viewing I/F Summary Information.........................................................................2-32
Interface Performance Statistics/Bar Graphs...........................................2-34
Viewing Interface Detail ..............................................................................2-35
Chapter 3 Token Ring Statistics
Statistics Window Features..........................................................................................3-1
Setting Total, Delta, or Cumulative Counts ....................................................... 3-1
Viewing Elapsed, Average, and Peak Activity Levels......................................3-2
Setting the Statistics Poll Interval........................................................................ 3-3
Network Level Statistics...............................................................................................3-4
Accessing the Network Statistics Selections ......................................................3-4
The Network Statistics Window..........................................................................3-4
General Information Fields ...........................................................................3-4
Ring Status Fields ........................................................................................... 3-5
Beacon Statistics..............................................................................................3-6
Soft Error Fields ..............................................................................................3-6
Network Timer Statistics.......................................................................................3-9
Network Timer Statistics Window Fields....................................................3-9
Network Performance Graphs...........................................................................3-10
Network Performance Graph Statistics.....................................................3-11
Configuring the Network Performance Graph........................................3-11
The Frame Size Window .....................................................................................3-12
Total and Delta Graph Display ...................................................................3-12
Using the Pie and Bar Radio Buttons.........................................................3-13
The Protocol Statistics Window .........................................................................3-14
Total and Delta Graph Display ...................................................................3-14
Using the Pie and Bar Radio Buttons.........................................................3-15
Management Station Statistics .................................................... ...... ........................3-15
Accessing the Management Station Statistics Selection.................................3-15
Soft Errors Fields...........................................................................................3-16
Hard Errors Fields........................................................................................3-17
Port Level Statistics............................................................ ...... ...................................3-19
Accessing the Station Port Menu....................................................................... 3-19
The Station Statistics Window............................................................................3-19
The Station Statistics Window General Fields..........................................3-20
vi
Page 9

The Station Statistics Window Performance Fields.................................3-20
The Station Statistics Window Soft Error Fields ......................................3-21
The Station Timer Statistics Window................................................................3-22
Station Timer Statistics Window F ields..................................................... 3-23
Port Performance Graphs............ ...... .................................................................3-23
Port Performance Graph Statistics.............................................................3-24
Configuring the Port Performance Graph................................................3-25
Chapter 4 Token Ring Alarms
Ring-Level Alarm Limits .............................................................................................4-1
Accessing the Alarm Limits Window .................................................................4-2
Ring-Level Alarm Limits for Network Events.................................................. 4-2
Ring-Level Station Alarms ...................................................................................4-3
Setting Ring-Level Alarm Limits......................................................................... 4-4
Station-Level Alarm Limits .........................................................................................4-5
Accessing the Station Alarm Limits Window from the Port Menu................ 4-5
Accessing the Station Alarm Limits Window from the Station List...............4-6
Accessing the Station Alarm Limits Window from the Station Map............. 4-6
Setting Station-Level Alarm Limits..................................................................... 4-7
Contents
Chapter 5 The Station List and Station Map
The Station List Window..............................................................................................5-1
Station List Window Fields .................................................................................. 5-2
General Fields ................................................................................................. 5-2
Station Fields................................................................................................... 5-3
Viewing Station Statistics......................................................................................5-3
Viewing Station Timer Statistics.......................................................................... 5-4
Removing a Station from the Ring...................................................................... 5-4
Setting Station Alarms ..........................................................................................5-4
Viewing the Station Port Performance Graph...................................................5-5
Using the MAC/Canonical Button.....................................................................5-5
Printing the Station List........................................................................................5-5
Resetting Counters ................................................................................................ 5-6
The Station Map............................................................................................................5-6
Station Map Window Fields .................................................................................5-7
Viewing the Station Map ......................................................................................5-8
Station Pop-up Text Boxes....................................................................................5-8
The Station Command Menu.............................................................................5-10
Manipulating the Station Map............................................................................5-11
Index
vii
Page 10

Contents
viii
Page 11

Chapter 1
Introduction
How to use this guide; related guides; software conventions; getting help; MicroMMAC-T firmware
versions
Welcome to the NetSight Element Manager for the MicroMMAC-T User’s Guide.
We have designed this guide to serve as a simple reference for using NetSight
Element Manager for the MicroMMAC-22T/24T and MicroMMAC-42T/44T.
™
The MicroMMAC-22T/24T
Ring hubs that provide front panel ports for network connections, a rear-panel
HubSTACK
port for one optional Bridge Router Interface Module
MicroMMAC-T
conform to the IEEE 802.5 standards, and provide the flexibility to connect
networks using a variety of media via 12 or 24 active RJ45 ports for STP or UTP
lobe connections. All of the models are functionally identical; the only difference
among them is the configuration of the front panel ports: the MicroMMAC-22T
has 12 built-in active UTP RJ45 lobe po rts; the MicroMMAC-24T has 24 built-in
active UTP RJ45 lobe ports; the MicroMMAC-42T has 12 built-in active STP RJ45
lobe ports; and the MicroMMAC-44T has 24 built-in active STP RJ45 lobe ports.
Using the MicroMMAC-T’s external HubSTACK-IN and HubSTACK-OUT
connections on the rear of the unit, you can stack as many as four of Cabletron’s
STH Series non-intelligent Token Ring hubs with one MicroMMAC-T, and the
entire stack can be managed by the MicroMMAC-T as a single Token Ring. This
configuration allows you to expand the connectivity of the MicroMMAC-T to up
to 120 ports.
™
Interconnect Bus port for stackable connections, and a rear-panel
™
with bridging and routing capability. All the devices fully
and MicroMMAC-42T/44T™ are intelligent Token
™
(BRIM®) that provides the
NOTE
Since the devices covered in this User’s Guide are functionally identical, they will be
jointly referred to throughout the text as the MicroMMAC-T. Likewise, since the only
differences in the windows for each device will be the device name (MicroMMAC-24T,
MicroMMAC-44T, etc.) and the number of ports displayed, only the MicroMMAC-24T
windows will be shown.
1-1
Page 12

Introduction
NetSight Element Manager provides remote management for the MicroMMAC-T,
including:
• Front panel status display with administrative state, network load, and error
percentages available for each port.
• Management Station Configuration.
• Station List and Map Windows.
• Full statistics display for the hub and individual stations (with both numerical
and graphical display options).
• Alarm Limits based on frame counts, frame errors, or beacon frames.
You should read this manual thoroughly to understand NetSight Element
Manager for the MicroMMAC-T.
Using This Guide
Each chapter in this guide describes one major functionality or a collection of
several smaller functionalities of the MicroMMAC-T device module. This guide
contains information about software functions that are accessed directly from the
device icon; for information about management functions that are accessed via
the NetSight Element Manager platform, consult the NetSight Element Manager
User’s Guide and NetSight Element Manager Tools Guide.
Chapter 1, Introduction, provides a list of related documentation, describes
certain software conventions, and shows you how to contact the Enterasys
Networks Global C al l Cent er.
Chapter 2, The MicroMMAC-T Chassis View, describes the visual display of the
MicroMMAC-T’s front panel and explains how to use the mouse within the
Chassis View; the operation of several chassis-level management functions —
such as changing the port status displa y, enabling and disabling ports,
configuring the management station, and settin g device date and time — is also
described here.
Chapter 3, Token Ring Statistics, describes the Statistics, Timer Statistics,
Summary Statistics, and Performance Graph selections available at the Network,
Management Station, and Port levels. Each of these sele ct ions provides a slightly
different view of the network information being collected by the MicroMMAC-T.
Chapter 4, Token Ring Alarms, provides instructions on configuring and setting
ring-level alarms for network events, ring-level station alarms that apply to all
stations on a ring, or station-level alarms for individual stations on a ring.
Chapter 5, The Station List and Station Map, describes how to use these
windows to view your ring topology, either in list or graphical (map) format, and
how to access statistics and set alarm limits for your ring stations.
1-2 Using This Guide
Page 13

We assume that you have a general working knowledge of Token Ring IEEE 802.5
type data communications networks and their physical layer components.
Related Manuals
The MicroMMAC-T user’s guide is only part of a complete documen t set
designed to provide comprehensive information about the features available to
you through NetSight Element Manager. Other guides that include important
information related to managing the MicroMMAC -T in clude:
Enterasys’ NetSight Element Manager User’s Guide
Enterasys’ NetSight Element Manager Tools Guide
Enterasys’ NetSight Element Manager Remote Administration Tools User’s
Guide
Enterasys’ NetSight Element Manager Remote Monitoring (RMON) Gui de
Enterasys’ NetSight Element Manager Alarm and Event Handling User’s Guide
Introduction
Enterasys’ Network Troubleshooting Guide
Microsoft Corporation’s Microsoft Windows User’s Guide
For more information about the capabilities of the MicroMMAC-T, consult the
appropriate hardware doc u mentation.
Software Conventions
NetSight Element Manager’s device user interface contains a number of elements
that are common to most window s and that opera te the same regardless of which
window they appear in. A brief description of some of the most common
elements appears below; note that the information provided here is not repeated
in the descriptions of specific windows and/or functions.
Using the Mouse
This document assumes you are using a Windows-compatible mouse with two
buttons; if you are using a three button mouse, you should ignore the operation of
the middle button when following procedures in this document. Procedures
within the NetSight Element Manager document set refer to these buttons as
follows:
Related Manuals 1-3
Page 14

Introduction
Left Mouse Button
Right Mouse Button
Figure 1-1. Mouse Buttons
For many mouse operations, this document assumes that the left (primary) mouse
button is to be used, and references to activating a menu or button will not
include instructions about which mouse button to use.
However, in instances in which right (secondary ) m ouse button functionality is
available, instructions will explic itly refer to right mouse button usage. Also, in
situations where you may be switching between mouse buttons in the same area
or window, instru ctions may also explicitly refer to both left and right mouse
buttons.
Instructions to perform a mouse operation include the following terms:
• Pointing means to position the mouse cursor over an area without pressing
either mouse button.
• Clicking means to position the mouse pointer over the indicated target, then
press and release the appropriate mouse button. This is most commonly used
to select or activate objects, such as menus or b uttons.
• Double-clicking means to position the mouse pointer over the indicated
target, then press and release the mouse button two times in rapid succession.
This is commonly used to activate an object’s default operation, such as
opening a window from an icon. Note that there is a distinction made between
“click twice” and “double-click,” since “click twice” implies a slower motion.
• Pressing means to position the mouse pointer over the indicated target, then
press and hold the mouse button until the de scribed action is completed. It is
often a pre-cursor to Drag operations.
• Dragging means to move the mouse pointer across the screen while holding
the mouse button down. It is often used for drag-and-drop operations to copy
information from one window of the screen into another, and to highlight
editable text.
1-4 Software Conventions
Page 15

Using Window Buttons
The button that appears at the bottom of most windows allows you to
exit a window and terminate any unsaved changes you have made. You may also
have to use this button to close a window after you have made any necessary
changes and set them by clicking on an , , or button.
An , , or button appears in windows that have
configurable values; it allows you to confirm and SET changes you have made to
those values. In some windows, you may have to use this button to confirm each
individual set; in other windows, you can set several values at once and confirm
the sets with one click on the button.
The button brings up a Help text box with information specific to the
current window. For more information concerning Help buttons, see Getting
Help, page 1-7.
The command buttons, for example , call up a menu listing the windows,
screens, or commands available for that topic.
Any menu topic followed by ... (three dots) — for example Statistics... — calls up
a window or screen associated with that topic.
Introduction
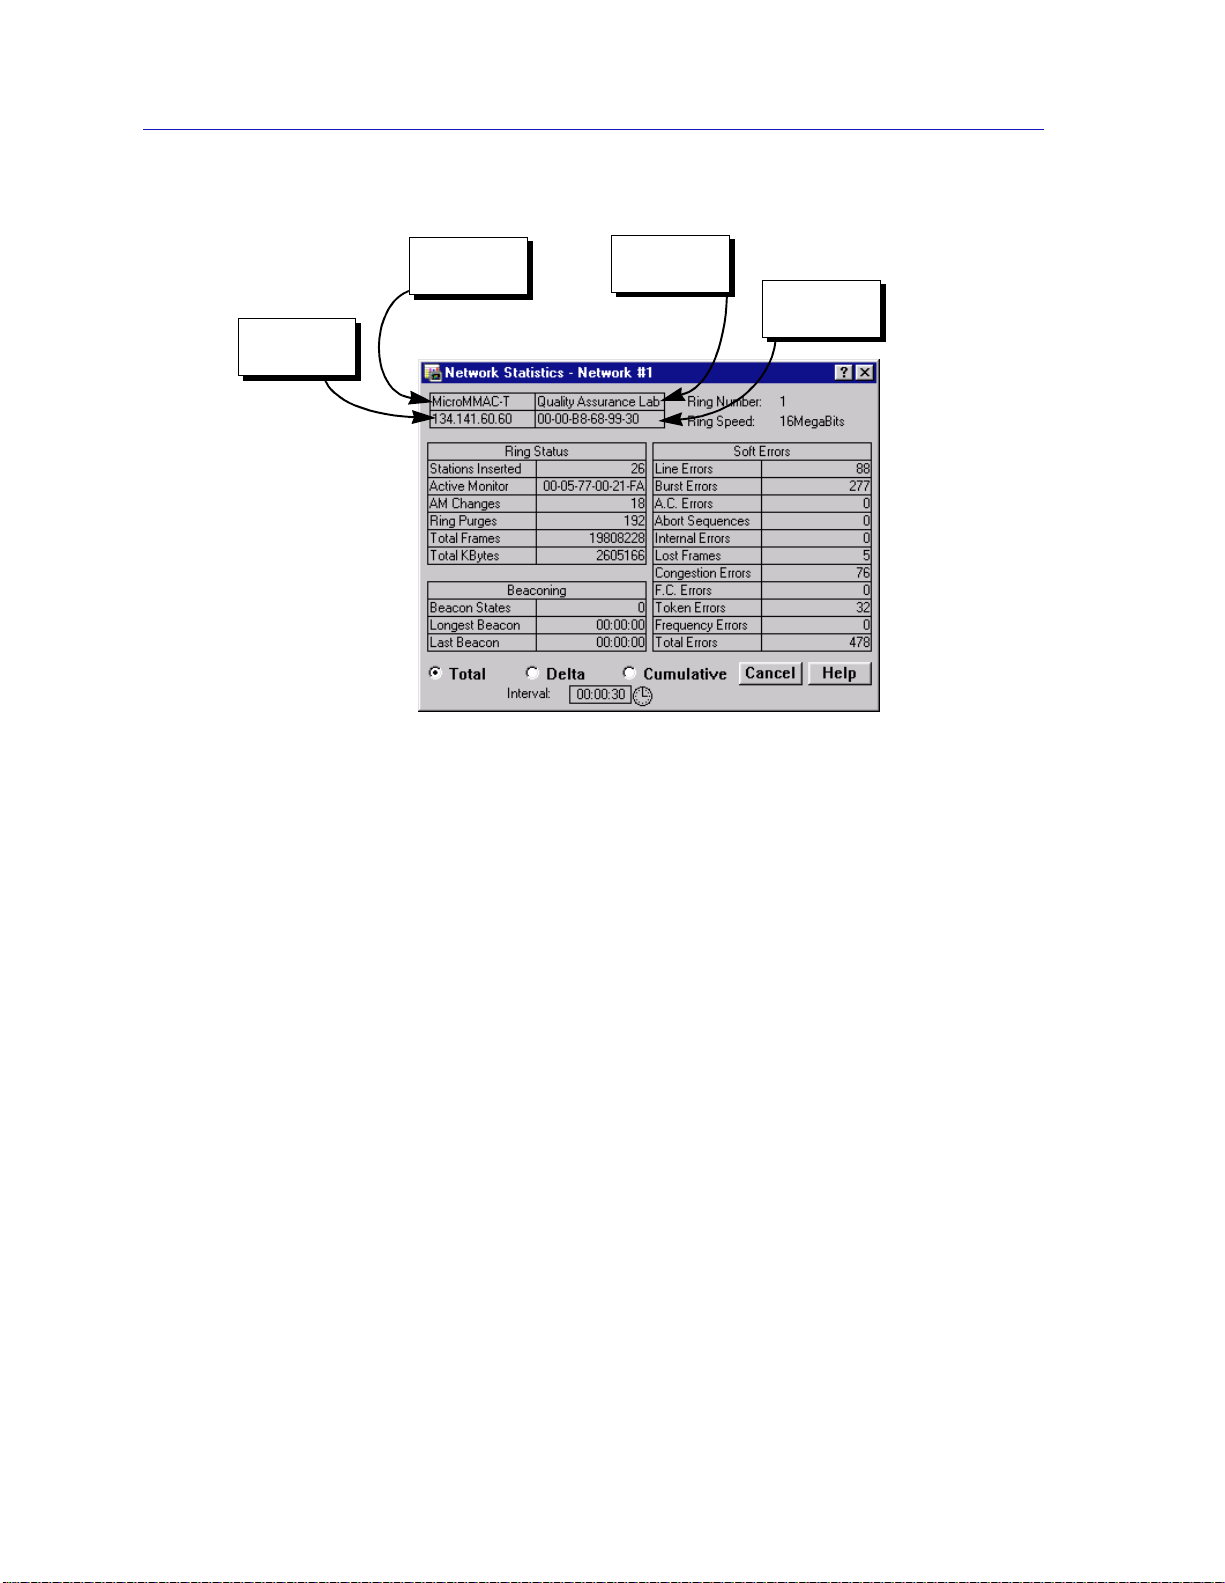
Common MicroMMAC-T Window Fields
Similar descriptive information is displayed in boxes at the top of most
device-specific windows in NetSight Element Manager, as illustrated in
Figure 1-2.
Software Conventions 1-5
Page 16
Introduction
IP Address
Figure 1-2. Sample Window Showing Informational Text Boxes
Device Name
Displays the user-defined name of the device. The device name can be changed
via the System Group window; see the Gener ic SNMP User’s Guide for details.
Device
Name
Location
MAC
Address
IP Address
Displays the device’s IP (Internet Protocol) Address; this will be the IP address
used to define the device icon. IP addresses are assigned via Local Management
for the MicroMMAC-T; they cannot be changed via NetSight Element Manager.
Location
Displays the user-defined location of the device. The location is entered through
the System Group window; see the Generic SNMP User’s Guide for details.
MAC Address
Displays t he manufa cturer-set MAC address associated with the IP ad dress used
to define the MicroMMAC-T icon. This address is factory-set and cannot be
altered via NetSight Element Manager. The device’s MAC address may be altered
using local management; if so, the locally administered MAC address will appear
in this field.
1-6 Software Conventions
Page 17

Getting Help
This section describes two different methods of getting help for questions or
concerns you may have while using NetSight Element Manager.
Using On-line Help
You can use the MicroMMAC-T window buttons to obtain information
specific to the device. When you click on a Help button, a window will appear
that contains context-sensitive on-screen documentation that will assist you in the
use of the windows and their associated command and menu options. Note that if
a Help button is grayed out, on-line help has not yet been implemented for the
associated window.
From the Help menu accessed from the Chassis View window menu bar, you can
access on-line Help specific to the Chassis View window, as well as bring up the
Chassis Manager window for reference . Refer to Chapter 2 for information on the
Chassis View and Chassis Manager windows.
Introduction
All of the Ne tSi ght El emen t Ma nage r he lp w in dows use the st andard Mic r oso ft W i ndow s
NOTE
help facility; if you are unfamiliar with this feature of Windows, you can select H
ow to Use Help from the Program Manager window, or consult your Microsoft
—>H
Windows User’s Guide.
Getting Help from Enterasys Global Call Center
If you need technical support related to NetSight Element Manager, contact the
Enterasys Global Call Center via one of the following methods:
By phone: (603) 332-9400
24 hours a day, 365 days a year
By mail: Enterasys Networks
Technical Support
Rochester, NH 03866-5005
By Internet mail: support@ctron.com
FTP: ftp.ctron.com (134.141.197.25)
Login anonymous
Password your email address
By BBS: (603) 335-3358
elp
Modem Setting 8N1: 8 data bits, 1 stop bit, No parity
Send your questions, comments, an d suggestions regarding NetSight
documentation to NetSight Technical Communications via the following address:
Getting Help 1-7
Page 18

Introduction
NOTE
Netsight_docs@enterasys.com
To locate product specific information, refer to the Enterasys Web site:
http://www.enterasys.com/.
For the highest firmware versions successfully tested with NetSight Element Manager
2.2.1, refer to the Readme file from the NetS ig ht Element Manager program gr oup. If you
have an earlier version of firmware and experience problems, contact the Global Technical
Assistanc e Ce nter.
1-8 Getting Help
Page 19

Chapter 2
The MicroMMAC-T Chassis View
Information displayed in the Chassis View window; the Chassis Manager window; Hub management
functions
The MicroMMAC-T Chassis View window is the main screen that immediately
informs you of the current configuration of your MicroMMAC-T via a graphical
display of the device’s front panel. The Chassis View displays the condition of
individual ports on the MicroMMAC-T. The Chassis View window serves as a
single point of access to all other MicroMMAC-T windows and screens, which are
discussed at length in this and the following chapters.
To access the MicroMMAC-T Chassis View window, use one of the following
options:
1. In any map, list, or tree view, double-click on the MicroMMAC-T you wish to
manage;
or
1. In any map, list, or tree view, click the left mouse button once to select the
MicroMMAC-T you wish to manage.
2. Select Manage —> Node from the primary window menu bar, or select the
Manage Node toolbar button.
or
1. In any map, list, or tree view, click the right mouse button once to select the
MicroMMAC-T you wish to manage.
2. On the resulting menu, click to select Manage.
2-1
Page 20
The MicroMMAC-T Chassis View
Viewing Chassis Information
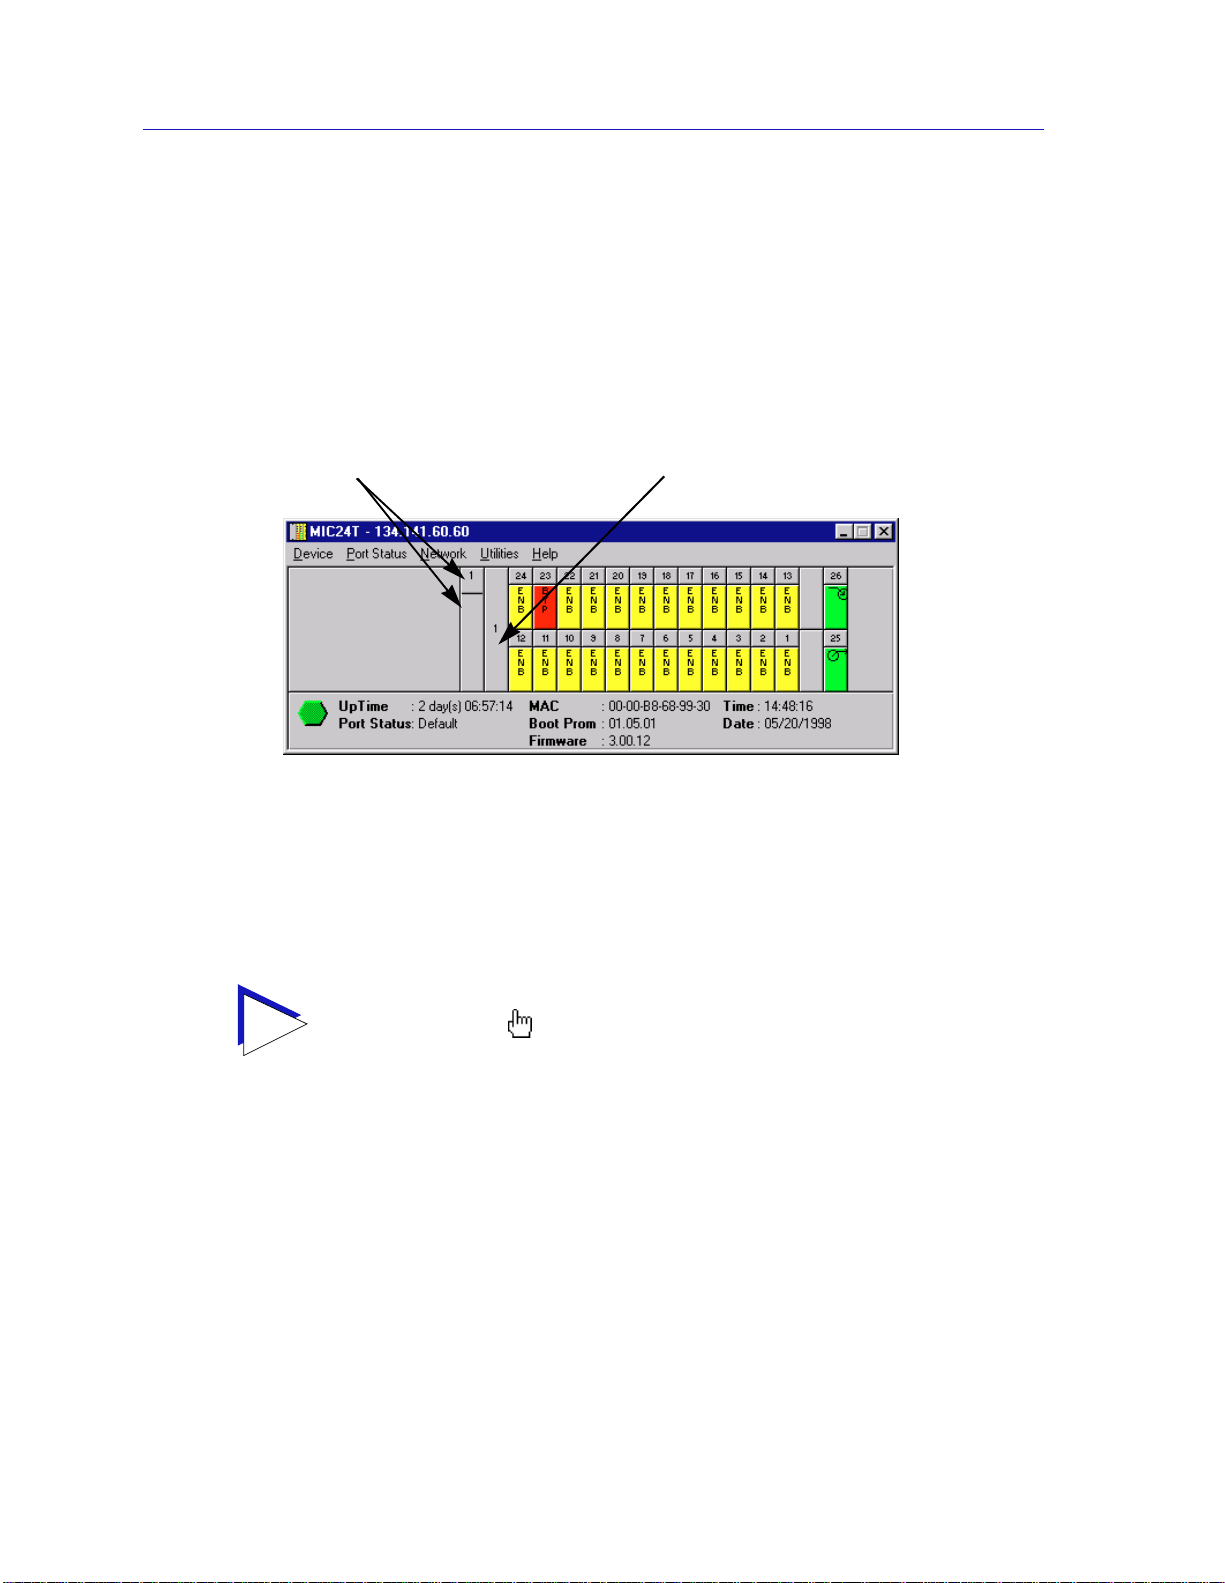
The MicroMMAC-T Chassis View window (Figure 2-1) provides a graphic
representation of the Mi croMMAC-T’s front panel, including a color-coded port
display which immediately informs you of the current configuration and status of
all station and ring ports on the device.
Click on the module number to
change the Chassis View to display
a different module in the
MicroMMAC-T controlled stack.
Figure 2-1. MicroMMAC-T Chassis View Wi ndow
By clicking in designated areas of the chassis graphical display (as detailed later
in this chapter), or by using the menu bar at the top of the Chassis View window,
you can access all of the menus that lead to more detailed device-, network-,
module-, and port-level windows.
The module index will change to reflect
which module in the stack is currently
displayed. Click here to view the menu
for the displayed module.
When you move the mouse cursor over a management “hot spot” the cursor icon will
TIP
2-2 Viewing Chassis Information
change into a “hand” ( ) to indicate that clicking in the current location will bring up a
management option.
Page 21

Front Panel Infor matio n
The areas around the main port display provide the following device information:
IP
The IP address assigned to the MicroMMAC-T appears in the title bar of the
Chassis View window; this field will display the IP address you have used to
create the MicroMMAC-T icon. IP addresses are assigned via Local Management.
Connection Status
This color-coded area i ndicates the current state of the MicroMMAC-T in
communicating with the NetSight Element Manager.
• Green indicates it is responding to device polls (valid connection).
• Magenta indicates it is in a temporary stand-by mode while it responds to a
physical change in the hub; note that port menus are inactive during this
stand-by state.
• Blue indicates an unknown contact status – poll ing has not yet been
established with the MicroMMAC-T.
The MicroMMAC-T Chassis View
• Red indicates it is not responding to device polls (device is off line, or device
polling has failed across the network for some other reason).
UpTime
The amount of time, in a day(s) hh:mm:ss format, that the MicroMMAC-T has
been running since the last start-up.
Port Status
If management for your device supports a variable port display (detailed in Port
Status Displays, page 2-9), this field will show the display currently in effect. If
only a single port display is available, or if the default view is in effect, this field
will state Default.
MAC
The physical layer address associated with the IP address used to define the
MicroMMAC-T icon. MAC addresses are hard-coded in the device, and are not
configurable via NetSight Element Manager. The device’s MAC address may be
altered using local management; if so, the locally administered MAC address will
appear in this field.
Boot Prom
The revision of BOOT PROM installed in the MicroMMAC-T.
Firmware
The revision of device firmware stored in the MicroMMAC-T’s FLASH PROMs.
Viewing Chassis Information 2-3
Page 22

The MicroMMAC-T Chassis View
Time
The current time, in a 24-hour hh:mm:ss format, set in the internal clock.
Date
The current date, in an mm/dd/yyyy format, set in the internal clock.
You can set the date and time by using the Edit Device Date and Edit Device Time
NOTE
options on the Device menu; see Setting the Device Date and Time, page 2-23 for
details.
In accordance with Year 2000 compliance requirements, NetSight Element Manage r now
displays and allows you to set all date s with four-digit ye ar values.
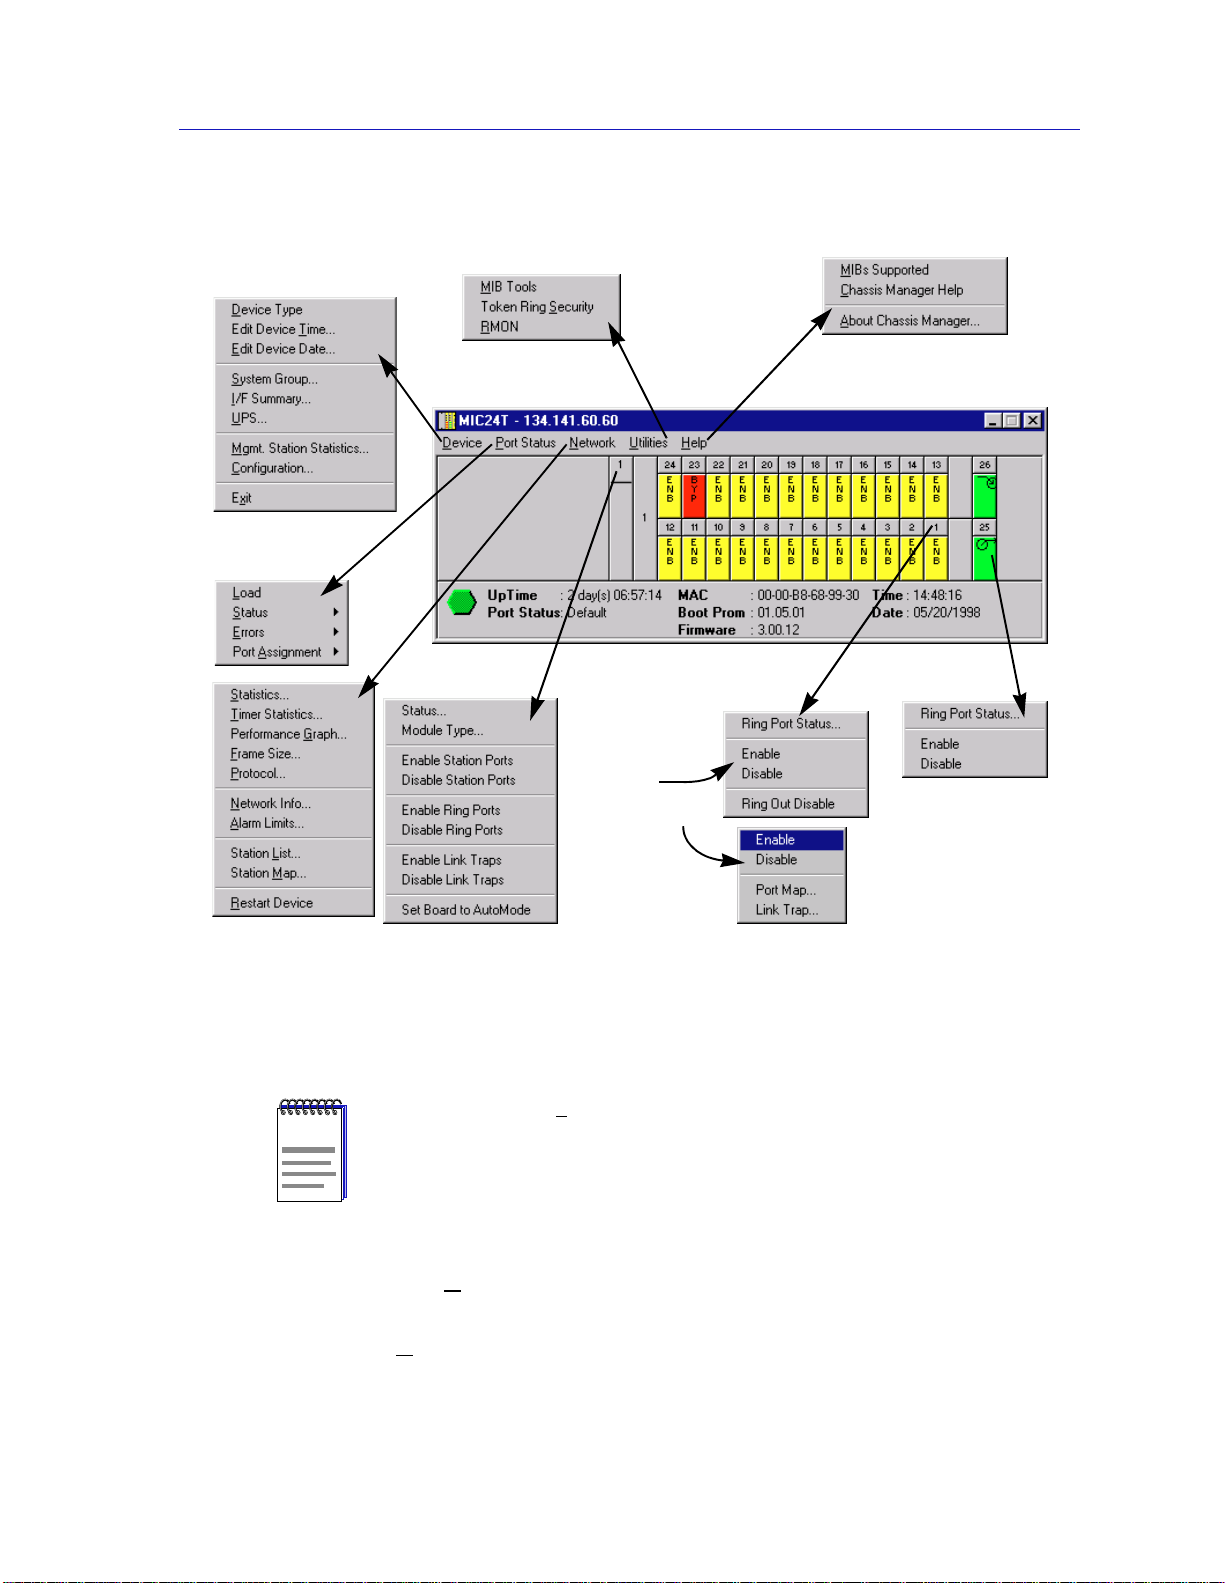
Menu Structure
By clicking on various areas of the MicroMMAC-T Chassis View display, you can
access menus with device-, network-, module-, and port-level options, as well as
utility applications that apply to the device. The follo wing illustration displays
the menu structure and indicates where to click to access the various menus.
2-4 Viewing Chassis Information
Page 23
The Device
Menu
The MicroMMAC-T Chassis View
.
The Port
Status Menu
The Utilities
Menu
The Station
Port Menus
(active)
(non-active)
The Help
Menu
The Ring Port
Menu
The Network
Menu
NOTE
The Module
Menu
Figure 2 -2. MicroMMAC-T Chassis View Menu Structure
Additional menus (e.g., FDDI) and/or menu options may be available from the Chassis
View if you have a BRIM installed in the MicroMMAC-T. These menu options are
discussed in the Bridge/Router Interface Module (BRIM) User ’s Guide included in
your documentation set.
The Device Menu
From the D
following selections:
• D
device being modeled; see Viewing Hardware Types, page 2-12, for details.
evice Menu at the Chassis View window menu bar, you can access the
evice Type..., which displays a window containing a description of the
Viewing Chassis Information 2-5
Page 24

The MicroMMAC-T Chassis View
• Edit Device Time... and Edit Device Date..., which allow you to set the
MicroMMAC-T’s internal clock. See Setting the Device Date and Time,
page 2-23, for details
ystem Group..., which allows you to manage the MicroMMAC-T via SNMP
• S
MIB II. Refer to the Generic SNMP User’s Guide for further information.
/F Summary, which lets you view statistics for the traffic processed by each
• I
SNMP MIB II interface on your device. See Viewing I/F Summary
Information, page 2-32, for details.
PS..., which brings up a window that allow s you to configure an
• U
Uninterruptable Power Supply attached to your MicroMMAC-T; see Using an
Uninterruptable Power Supply (UPS), page 2-24, for details.
gmt. Station Statistics..., allows you to view network statistics for the
• M
MicroMMAC-T’s on board ring management station. See Chapter 3, Token
Ring Statistics, for details.
onfiguration..., allows you to configure the ring management station,
• C
including setting a device name and location, setting the error report tim er
delay, enabling or disabling the automatic beacon recovery process (ABRP),
and inhibiting the active monitor. You can set up a ring management station
configuration for each MicroMMAC-T-managed ring network. See
Management Station Configuration, page 2-14, for details.
it, which closes the MicroMMAC-T Chassis View window.
• Ex
The Port Status Menu
ort Status menu allows you to select the status information that will be
The P
displayed in the port text boxes in the logical Chassis View window:
oad will display the portion of network load processed by each port as a
• L
percentage of the theoretical maximum load (4 or 16 Mbits/sec) of a Token
Ring network.
tatus allows you to select one of two status type displays: Admin/Link or
• S
Admin.
rrors allows you to display the percentage per port of the specific Error you
• E
select.
• Port A
For more information on the port display options available via this menu, see
Selecting a Port Status View, page 2-9.
ssignment displays either the current FNB connection status or the
Network association of each port.
2-6 Viewing Chassis Information
Page 25

The MicroMMAC-T Chassis View
The Network Menu
The first level of this menu lists the active ring network (Network 1
managed by the device; clicking on the Network 1
with the following selections:
tatistics..., which brings up the network-level Statistics windows; see
• S
Chapter 3, Token Ring Statistics, for more information.
imer Statistics..., which opens the network-level Timer Statistics windows;
• T
see Chapter 3 for more information.
selection brings up a menu
) that is
• Performance G
Chapter 3.
rame Size..., which allows you to see the actual sizes of the frames on the ring
• F
network controlled by your MicroMMAC-T; see Chapter 3.
rotocol..., which allows you to see how many frames received by the
• P
MicroMMAC-T are of a given protocol; see Chapter 3.
etwork Info..., which allows you to view status and configuration
• N
information for each ring in your MicroMMAC-T-controlled MMAC; see
Viewing Network Information, page 2-18, for details.
larm Limits..., which launches the network-level alarms window; see
• A
Chapter 4, Token Ring Alarms, for alarm configuration information.
• Station L
currently monitored ring network; see Chapter 5, The Station List and Stat ion
Map, for details.
• Station M
downstream neighbor order from the currently monitored MicroMMAC-T,
and provides address information for individual stations inserted into the
ring; see Chapter 5.
estart Device, which allows you to perform a software reset for the
• R
MicroMMAC-T; see Resetting the Device, page 2-27, for details.
raph..., which opens the Performance Graph windows; see
ist..., which allows you to view and configure the stations on the
ap..., which graphically illustrates the ring conf iguration in
The Utilities Menu
From the U
access to the MicroMMAC-T’s MIB information), Token Ring Security, which
allows you to configure security for Cabletron Systems new Dot 5 Token Ring
devices (like the MicroMMAC-T), and the RMON utility, a remote monitoring
feature that is supported by many of Cabletron Systems’ intelligent devices. These
selections are also available from the Utilities menu at the top of the NetSight
Element Manager map window. Refer to your Tools Guide, included in this
package, for a thorough explanation of the MIBTree, Token Ring Security, and
RMON utilities.
tilities menu you can select the MIBTree utility (providing direct
Viewing Chassis Information 2-7
Page 26

The MicroMMAC-T Chassis View
The Help Menu
elp Menu has three selections:
The H
IBS Supported, which brings up the Chassis Manager window. See The
• M
Chassis Manager Window, page 2-12.
hassis Manager Help, which brings up a help window with information
• C
specifically related to using the Chassis Manager and Cha ssis View windows.
bout Chassis Manager ..., which displays version information for the Chassis
• A
Manager application in use.
The Module Menus
Module menus for each module in the MicroMMAC-T controlled stack displayed
in the Chassis View window provide the following selections:
• Status..., which updates you on the condition of a selected module. See
Viewing Module Status,page 2-20, for details.
• Module Type..., which brings up a window containing a description of the
selected module; see Viewing Hardware Types,page 2-12.
• Enable/Disable St ation Ports, which allow you to enable or disable all station
ports on the selected module; see Enabling and Disabling Ports, page 2-31.
• Enable/Disable Ring Por ts, which allow you to enable or disable all ring ports
on the selected module. These selections will only appear in the Module menu
for modules which have ring-in/out ports. See Enabling and Disabling Ports,
page 2-31, for details.
• Enable/Disable Link T ra ps, which allow you to enable or disable link traps for
all ports on the selected board. See Enabling and Disabling Link
Traps,page 2-29.
• Set Board to Automode, which allows you to quickly configure a module in
the MicroMMAC-T controlled stack to operate according to its default settings.
See Setting Token Ring Boards to Automode, page 2-30, for details.
The Port Menus
The Port menu selections vary according to the port’s status. The menu for station
ports with an inserted station includes the following selections:
• Statistics..., which brings up the Station Statistics window showing
performance and error statistics for the selected port. See Chapter 3,
Token Ring Statistics, for details.
• Timer Statistics..., which invokes the Station Timer Statistics window. See
Chapter 3 for details.
• Alarm Limits..., which launches the station-level alarms window; see
Chapter 4, Token Ring Alarms, for alarm configuration information.
• Performance Graph..., which brings up the Station Port Performance Graph.
See Chapter 3 for details.
2-8 Viewing Chassis Information
Page 27

The MicroMMAC-T Chassis View
All Station Port menus, regardless of port status , conta in the following selections:
• Enable/Disable, which allow you to administratively enable or disable the
selected port. See Enabling and Disabling Ports,page 2-31, for details.
• Port Map..., which allows you to enable or disable port mapping for the
selected port. See Enabling and Disabling Port Mapping, page 2-28, for
details.
• Link Trap..., which allows you to enable or disable link traps for the selected
port. See Enabling and Disabling Link Traps, page 2-29.
• Ring Out Enable/Disable, which allow you to switch the function of a station
port to that of a ring-out port. See Ring Out Enable/Disable,page 2-32, for
details.
The Ring Port Menus
Clicking on a ring port ( ) on a module will display the ring port menu,
which allows you to view the status of the selected ring port, as well as enable or
disable the port. The ring port menu offers the following selections:
• Ring Port Status..., which invo kes the Ring Po rt Status w indo w. See Viewing
Ring Port Status,page 2-21, for details.
• Enable/Disable, which allow you to administratively enable or disable the
selected ring port. See Enabling and Disabling Ports,page 2-31, for details.
Additional menus (e.g., FDDI) and/or menu options may be available from the Chassis
NOTE
View if you have a BRIM installed in the MicroMMAC-T. These menu options are
discussed in the Bridge/Router Interface Module (BRIM) User ’s Guide included in
your documentation set.
Port Status Displays
When you open the Chassis View window, each port on the MicroMM AC-T will
display its Admin/Link status (defined below); to change this status display,
select one of the options on the Port Status menu, as described in the following
sections.
Selecting a Port Status View
To change the status view of your ports:
1. Click on P
the Port Status menu will appear.
ort Status on the menu bar at the top of the Chassis View window;
2. Drag down (and to the right, if necessary) to select the status information you
want to display. The port text boxes will display the appropriate status
information.
Viewing Chassis Information 2-9
Page 28

The MicroMMAC-T Chassis View
Port status view options are:
Load
If you choose L
load processed by each port during the last polling interval. This percentage
reflects the network load generated by devices con nected to th e po rt compared to
the theoretical maximum load (4 or 16 Mbits/sec) of a Token Ring network.
Status
You can view two S
Admin/Link or Admin status conditions:
dmin/Link — ENB (enabled), BYP (bypassed), LNK (linked), or INS
• A
(inserted)
oad, the port text boxes will display the percentage of network
tatus categories for your ports which reflect six possible
• Ad
If you have selected the A
• ENB (enabled) if the port has been enabled by management, but there is no
• BYP (bypassed) if the port has been disabled by management, and ther e is no
• LNK (linked) when the port has been disabled by management, and there is a
• INS (inserted) when the port h as been enabled by management, a nd ther e is a
If you have selected the Ad
• ON if the port is enabled.
• OFF if the port has been disabled by management.
Errors
If you choose the E
Errors Total Soft Errors, Line, Burst, AC, Abort Sequences,
min — ON or OFF
dmin/Link status mode, a port is considered:
station linked to that port.
station linked to that port.
station linked to that port.
station linked to that port.
min status mode, a port is considered:
rrors mode, an additional menu offers the following options:
Internal, Lost Frames, Congestion, FC, Token, or
Frequency
The port status boxes will display the percentage for each active port that
represents what portion of that port’s total traffic is of the specific error type that
you selected. See Chapter 3, Token Ring Statistics, for complete descriptions of
these error types.
Select one of t he E
by each active port during the last polling interval was of the error type you
selected. This percentage reflects the number of errors generated by devices
connected to that port in relation to the total number of frames processed by the
port (errors ÷ [errors + frames]).
rrors options to see what per centage of the total frames r eceived
2-10 Viewing Chassis Information
Page 29

NOTE
The MicroMMAC-T Chassis View
In NetSight Element Manager, the polling interval is set via the Tools—>Options
window available from the primary window menu bar.
Refer to the NetSight Element Manager User’s Guide for full information on setting
device polling intervals.
Port Assignment
You can view two Port A
ssignment categories for your ports:
• If yo u select F
• If you select R
Ring Port Status
For the Ring-In/Out ports, two status conditions are possible:
• Active ( ), when the port is active and passing data.
• Wrapped ( ), when there has been a termination o f data com munications at
Port Status Color Codes
The port display options incorporate the following color-coding scheme:
•For the S
•For the Port A
NB View, the port text boxes will display their current FNB
connection status. For single-ring devices like the MicroMMAC-T, the only
possible status conditio n is FNB 1.
ing V iew, the port text boxes will display their current network
association status. The status conditions are: R1 (ring 1) and ORPH (orph an).
the port, and data has been rerouted to the backup path.
tatus display options (Admin/Link or Admin) - green = INS/ON,
yellow = ENB, red = BYP/LNK/OFF, and blue = N/A (not available).
ssignment display options - magenta = FNB/R 1, and gray =
ORPH.
For the E
rrors Port Status selection, color codes will continue to reflect the most
recently selected mode which incorporates its own color coding scheme.
Viewing Chassis Information 2-11
Page 30
The MicroMMAC-T Chassis View
The Chassis Manager Window
Like most networking devices, Cabletron’s devices draw their functionality from
a collection of proprietary MIBs and IETF RFCs. In addition, Cabletron’s newer
intelligent devices – like the MicroMMAC-T – organize their MIB data into a
series of “components.” A MIB component is a logical grouping of MIB data, and
each group controls a defined set of objects. For example, MicroMMAC-T chassis
information is organized into its own component; network information resides in
another component. Note, too, that there is no one-to-one correspondence
between MIBs and MIB components; a single MIB component might contain
objects from several different proprietary MIBs and RFCs.
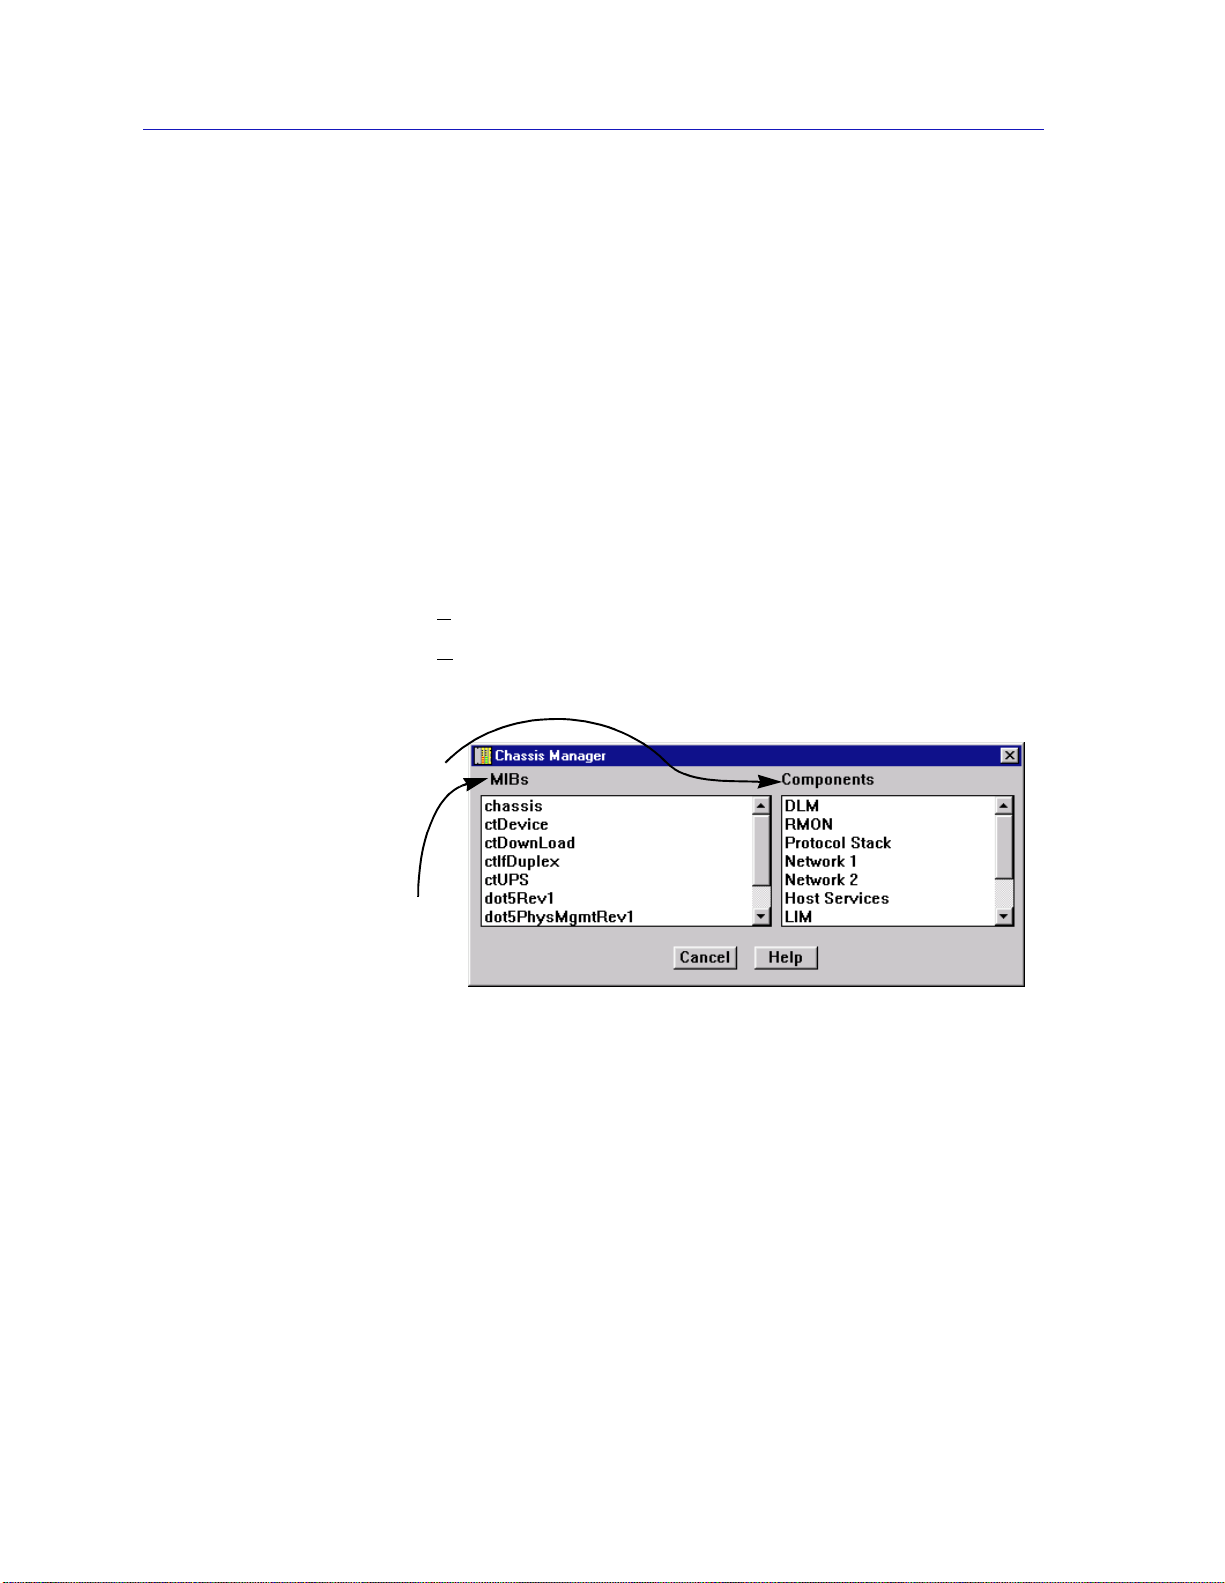
The Chassis Manager window, Figure 2-3, is a read-only window that displays the
MIBs and the MIB components — and, therefore, the functionality — supported
by the currently monitored device.
To view the Cha ssis Manager window:
1. Click on H
2. Click on M
MIB Components are listed here;
remember, there’s no one-to-one
correspondence between MIBs
and MIB Components
The MIBs which provide the
MicroMMAC-T’s functionality —
both proprietary MIBs and IETF
RFCs — are listed here
Figure 2-3. Sample Chassis Manager Window
elp on the menu bar at the top of the Chassis View window.
IBs Supported.
Viewing Hardware Types
In addition to the graphical displays described above, a menu option available at
the device-level provides specific information about the physical characteristics of
the MicroMMAC-T module.
2-12 Viewing Chassis Information
Page 31

Device T ype
The MicroMMAC-T Chassis View
Module Type
Choosing the D
that describes the management device being modeled:
By selecting the Module Type option from the Module menu on the
MicroMMAC-T Chassis View window, you can view a description of the module
types in your MicroMMAC-T-controlled HubSTACK.
To view a module type:
1. Click on the Module index of the desired module in the HubSTACK. The
Module menu will appear.
2. Drag down to Module Type.... A Module T ype text bo x, similar to the example
shown in Figure 2-5, will appear describing the module type. If Module T ype is
not supported by the selected module, “Unknown” will appear in the text box.
evice Type... option from the Device menu brings up a window
Figure 2-4. Sample Device Type Window
Figure 2-5. Sample Module Type Text Box
Managing the Hub
In addition to the performance and configuration information described in the
preceding sections, the Chassis V iew also provides you with the tools you need to
configure your hub and keep it operating properly. Hub management functions
include configuring the management station, viewing network information,
viewing ring port status, setting device date and time, resetting the device,
enabling and disabling port mapping and link traps, and enabling and disabling
station ports.
Managing the Hub 2-13
Page 32

The MicroMMAC-T Chassis View
Management Station Configuration
Selecting Configuration... from the Device menu will invoke the TR Management
Station Configuration window, where you can configure the module’s onboard
management station.
Accessing the TR Management Station Configuration Window
To access the TR Management Station Configuration window from the Chassis
Vi ew window.
1. Click on the D
manager window. The Device menu will appear.
2. Click to highlight the C
Configuration window will appear.
The TR Management St ation Configuration window (Figure 2-6) allows you to
specify the ring functions that the on -bo ard MicroMMAC-T management station
will perform for its associated ring: it allows you to enable or disable automated
beacon recovery, and allows you to inhibi t the station’s ability to become the
active monitor. You can also specify the management station name and physical
drop number (location), and the delay time between the recording and the
reporting of an error.
The upper left corner of the window contains the MicroMMAC-T name, location,
Physical (MAC) and IP addresses, and uptime.
evice menu selection on the menu bar at the top of the chassis
onfiguration... selection. The TR Management Station
Figure 2-6. The TR Management Station Configuration Window
2-14 Managing the Hub
Page 33

Setting Station Name and Location
The Station Name text box allows you to assign a name to your ring management
station. To set the management station name:
1. In the Network list in the upper right corner of the window, double-click on the
Network 1 selection.
2. Click on the I-bar cursor in the Station Name text box; the Station Name
Configuration window, Figure 2-7,will appear.
Figure 2-7. Sta tion Name Configuration Window
3. Type in the desired management station name.
The MicroMMAC-T Chassis View
4. Click on OK. The name will change in the text box, and then at the
MicroMMAC-T management station itself. Click on Cancel to close the
window.
The Station Location text box allows you to assign the management station’s
physical drop identifier. The station’s physical drop is an administratively
assigned numeric string that you can use to identify a station’s physical location.
If assigned, the drop will appear as a subvector in certain Token Ring MAC
frames (such as a new active monitor frame, report error frames, or the report
station address frame used in the neighbor notification process); it will also be
reported in the RMON Token Ring Station Configuration window (see theUser’s
Guide for details). A physical drop is a four-byte value expressed dotted decimal
notation, much like an IP address; each byte of the value can be any number from
0 to 255.
To alter the device location (physical drop identifier):
1. In the Network list in the upper right corner of the window, double-click on the
Network 1 selection.
2. Click on the I-bar cursor in the Station Location text box; the Station Location
Configuration window, Figure 2-8, will appear.
Figure 2-8. Sta tion Location Configuration Window
Managing the Hub 2-15
Page 34

The MicroMMAC-T Chassis View
3. Type in the desired management station location, being sure to use the
appropriate dotted decimal format.
4. Click on OK. The location will change in the text box, and then at the
MicroMMAC-T management station itself. Click on Cancel to close the
window.
Specifying Ring Management Functions
You can use the Host Error Report Timer Delay, Inhibit Active Monitor, and
Enable Beacon Recovery fields to control the way that the MicroMMAC-T’s
management station will handle certain ring management functions:
Host Error Report Timer Delay
The Error Report Timer Delay determines the delay time between the time an
error is detected and recorded and the time it is reported.
Inhibit Active Monitor
You can remove the Mic roMM AC-T’s manageme nt station from active monitor
contention by activating the Inhibit Active Monitor field. Checking this box will
remove the management station from active monitor contention, which occurs as
part of the recovery procedures initiated after certain ring error situations. If you
inhibit the active mo nitor function for a management station which is currently
serving as the active monitor, that station will continue as active monitor until the
next contention.
Enable Beacon Recovery
If the Automatic Beacon Recovery Process (ABRP) option is enabled, the selected
management station will automatically attempt to repair its ring when it detects
an unusually high concentration of hard errors that have not been corrected by
normal ring recovery procedur es. ABRP is a sequential process that is designed to
isolate the source of the errors as quickly as possible.
If a frequent occurrence of hard errors is detected, the management station first
determines if the problem is internal or external to the hub by turning each ring
port off to see if the error condition clears. If the beaconing goes away (because it
is external to the hub), the MicroMMAC-T enables the Ring In/Out ports at the
interval specified in the Retry Interval field for the number of times specified in
the # of Ring Port Retries field to see if the beacon condition on the network has
cleared. If the beaconing continues after the specif ied number of r etries, the f aulty
Ring In/Out ports remain disabled.
If the beaconing continues when the Ring In/Out ports are shut off, then the
problem is internal to the hub. The MicroMMAC-T individually bypasses each
module to isolate the one with the fault (as evidenced by ring recovery on
bypass). When the module with the fault is identified, the module is reinserted,
and that module’s ports are turned off one by one until the ring recovers again.
The last port turned off is considered the failing port. Once the failing port is
2-16 Managing the Hub
Page 35

The MicroMMAC-T Chassis View
identified, all ports which were previously turned off are turned back on. The
failing port will be retried once at a pre-determined interval; if beaconing
continues, the port will remain disabled.
Once ABRP is completed, the MicroMMAC-T generates traps to the remote
management workstation which will pinpoint the problem’s cause, including:
• the beaconing adapter’s address
• its NAUN address
•beacon type
• port(s) and/or module(s) bypassed
• duration that the ring beaconed
You must then enable the faulty module or port before it can be used again. This
prevents a user from r ebo otin g a problem station which may bring the ring down.
To configure the beacon recovery and active monitor settings:
1. In the Network list in the upper right corner of the window, double-click on the
Network 1 selection.
2. Click the mouse on the checkbox associated with the desired function. An X in
the checkbox means that the selected function is activated.
3. If you are activating beacon recovery , be sure to configure the # of Ring Port
Retries and the Retry Interval (in seconds) by clicking on the appropriate
I-bar cursor and entering the desired value in the resulting window. Allowable
values for # of Ring Port Retries are 0 - 100 and 999, where 0 will disable
retries, 1-100 will set the number of retries, and 999 will retry the port
indefinitely.
4. Click on OK.
To change the host error report timer delay:
1. In the Network list in the upper right corner of the window, double-click on the
Network 1 selection.
2. Click on the I-bar cursor in the Host Error Report Timer Delay text box.
3. In the resulting window, type in the desired delay time between the recording
and the reporting of an error.
4. Click on OK.
Enable Ring Poll Recovery
The Ring Poll Recovery option allows you to control the way each of the
MicroMMAC-T management stations will respond when one or more stations
stop participating in the ring polling process, which can prevent certain stations
from inserting into the ring. When this option is enabled, the MicroMMAC-T will
detect ring poll failures and remove the offending stations from the ring. Ring poll
failure detection is based on the Neighbor Notification MAC frame (NNI)
transmitted by the Active Monitor. Upon receipt of four consecutive NNI frames,
the MicroMMAC-T will compare the information in the NNI frame with the ring’s
Managing the Hub 2-17
Page 36

The MicroMMAC-T Chassis View
station list, and transmit a Re move Ring Station MAC frame to the offending
station. This option is enabled by default.
This feature is available for devices running firmware versions 3.00.09 and later only.
NOTE
Viewing N etwork Information
At the Network Infor mation window (Figure 2 -9), you can view status and
configuration information for each ring in your MicroMMAC-T-controlled hub.
You can identify each ring by name using the Network Name field.
To access the Network In formation window:
Selecting the Ring
1. At the MicroMMAC-T Chassis View window, click on the N
selection, then on the Network 1
selections.
2. Click on N
If there is more than one ring network residing in your hub, you can view
information for each ring by using the Previous and Next buttons. By default, the
rings are identified only by an index number: Ring 1 is the
MicroMMAC-T-managed ring; any additional rings are indexed in ascending
order.
The field to the left of the Previous and Next buttons displays the selected ring in
terms of total rings currently supported on the hub, in X (current ring) of X
(configured rings) format.
To view the next ring in sequence, click on the Next button. When yo u have
reached the last available ring, the Next button will be grayed out to indicate that
no more rings are available.
To return to a prior ring, click on the Previous button. The Previous button will be
grayed out when you reach the first ring detected by the MicroMMAC-T.
etwork Info.... The Network Information window will appear.
entry to display the Network menu
etwork menu
2-18 Managing the Hub
Page 37

Figure 2-9. The Ne twork Information Window
Network Information Window Fields
Network Name
This field allows you to assign a name to the selected ring network; to do so,
simply click on the I-bar cursor, and enter the desired name in the resulting
window.
The MicroMMAC-T Chassis View
Boards
This field indicates the number of modules that compose the selected ring
network.
Total Ports
This field indicates the number of available ports (including ring ports and station
ports) on the modules composing the currently selected ring network; note that
this count includes only those inserted stations physically present in the same hub
as the MicroMMAC -T, and only those which are part of the MicroMMAC-T’s
management doma in.
Ports Enabled
This field indicates the number of ports in the current ring network that are
enabled by network management; note that this count includes only those
inserted stations physically present in the same hub as the MicroMMAC-T, and
only those which are part of the MicroMMAC-T’s management domain.
Ports Inserted
This field indicates the number of ports in the current ring network that are
inserted and enabled by management; note that this count includes only those
inserted stations physically present in the same hub as the MicroMMAC-T, and
only those which are part of the MicroMMAC-T’s management domain.
Managing the Hub 2-19
Page 38
The MicroMMAC-T Chassis View
For a complete count on the total number of ports and the number of ports enabled and
NOTE
inserted — including those not physically residing in the hub — see Network Statistics
in Chapter 3.
X (Ring) of X (Configured Rings)
This field indicates the currently selected ring and the number of configured rings
in the hub.
Viewin g Module Status
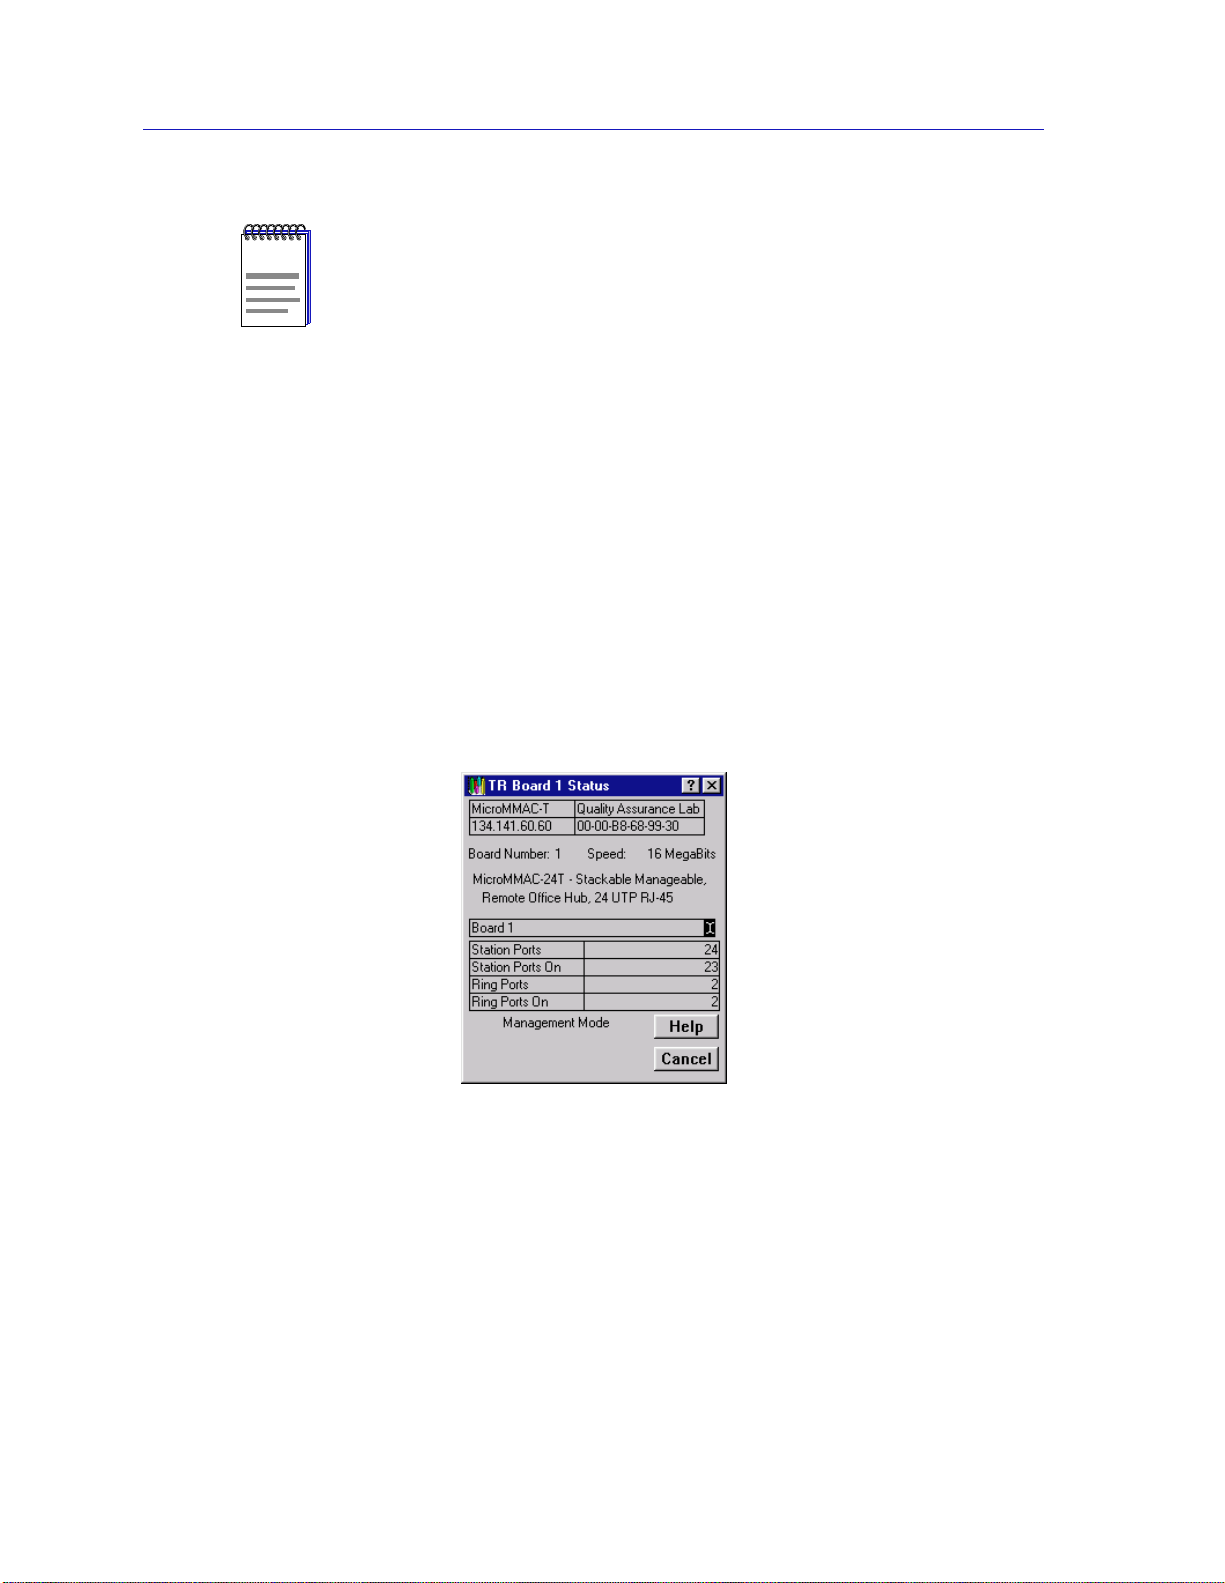
The Token Ring Board Status window (Figure 2-10) updates you on the condition
of a selected module in the HubSTACK. To access the Token Ring Board Status
window:
1. Click on the Module Index for the desired module. The Module menu will
appear.
2. Drag down to Status.... The Token Ring Board Status window will appear.
Figure 2-10. The Token Ring Board Status Window
Toke n Ring Board Status Window Fields
Board Number
The HubSTACK Interconnect Bus port number on the MicroMMAC-T occupied
by the currently selected module.
Speed
The ring speed (4 or 16 MBits/sec) for which the module is configured.
2-20 Managing the Hub
Page 39

The MicroMMAC-T Chassis View
Board Name
Displays the name assigned to the selected module; you can edit this name by
clicking on the I-bar cursor and entering a new name in the resulting window.
Station Ports
The number of station port connectors present on the selected module.
Station Ports On
The number of station ports on the module which are currently enabled by
management. Note that this count does not necessarily indicate the number of
stations that are actually connected and active.
Ring Ports
The number of Ring-in and Ring-out ports on the selected module. Note that this
will include any station ports that have been converted to ring-out ports.
Ring Ports On
The number of Ring-in and Ring-out ports that are currently enabled by
management. Note that this count does not necessarily indicate the number of
ring ports that are actually connected (not wrapped) and active.
Management Mode/AutoMode
This field indicates whether the module is in Management Mode (hardware
defaults have been altered through NetSight Element Manager), or is in
AutoMode (set to operate according to hardware defaults). See Setting Token
Ring Boards to Automode, page 2-30, for more information.
Ring Speed Fault
If the selected module is responsible for a ring speed fault – either because of its
own speed setting or the speed setting of a module connected through its ring
in/ring out ports – an error message will appear at the bottom of the board status
window. This is the only ring error that will be displayed here.
Viewing Ring Port Status
The Ring Port Status window (Figure 2-11) updates you on the configuration and
wire fault status of the selected ring port, and allows you to configure the media
type and phantom current settings on modules which support those features.
Accessing the Ring Port Status window
To access the Ring Port Status window:
1. Click on a ring port ( ). The Ring Port pull-down menu will appear.
2. Click on Ring Port Status.... The Ring Port Status window will appear. The
following section describes the window.
Managing the Hub 2-21
Page 40

The MicroMMAC-T Chassis View
Figure 2-11. The Ring Port Status Window
Ring Port Status Window Fields
The window contains the following fields:
Board Number
The HubSTACK Interconnect Bus port number on the MicroMMAC-T occupied
by the module containing the selected ring port.
Port
Displays the port index number and type (Ring In/Rin g Out) of the selected ring
port.
Last Wire Fault
This field displays either the last date and time the MicroMMAC-T was reset, or
the date and time that a wire fault on the selected port last occurred.
Media Type
This field allows you to select the media type of the ring port. This field does not
apply to the MicroMMAC-T, and is therefore grayed-out.
Phantom Current
This field allows you to activate or deactivate phantom current for the selected
ring port. Devices that support this feature — called the autowrap feature — use a
phantom current to act as a carrier sense between two connected ring ports. If the
carrier sense is broken (i.e., the wire is broken) the phantom current is lost and the
ports automatically wrap to maintain the continuity of the ring.
2-22 Managing the Hub
Page 41

If you are attaching a ring port on a module that supports autowrap to a ring port
on an older device that does not (or to a third party device that supports its own
proprietary autowrap feature), you must disable the phantom current on the
module that supports autowrap for the connection to be valid. Remember though,
once you have disabled the phantom current, the autowrap feature will not be
supported; if the cable connecting those two ports breaks, the entire ring will go
down— and stay down — until the broken cable is identified and either repaired
or disconnected from both ring ports.
If you are attaching a device that does not support autowrap (e.g., an older
TRMIM-10R or 20R or a TRC800 passive concentrator) to a module that s upports
autowrap, you must disable the phantom current to the module that supports
autowrap for the connection to be valid. Remember though, once you have
disabled the phantom current, the autowrap feature will not be supported if the
ring breaks.
Using the Media Type and Phantom Current Radio Buttons
To select the appropriate media type (fiber optic or shielded twisted pair) or
activate or deactivate the phantom current.
The MicroMMAC-T Chassis View
1. Click on the appropriate selection.
2. Click on OK.
Setting the Device Date and Time
The Device menu allows you to change the date and time stored in the device’s
internal clock by selecting the Edit Device T
from the menu.
To edit the device time:
1. Click on D
menu; drag down to Edit Device T
2. The Device Time change window, Figure 2-12, will appear.
evice on the Chassis View window menu bar to access the Device
ime and Edit Device Date options
ime..., and release.
Figure 2-12. Device Time Change Window
Managing the Hub 2-23
Page 42

The MicroMMAC-T Chassis View
3. Enter the new time in a 24-hour hh:mm:ss format by highlighting the field you
wish to change and using the up and down arrow buttons to change the time.
4. Click on OK to save your changes, or on Cancel to cancel.
To edit the device date:
NOTE
1. Click on D
menu; drag down to E
evice on the Chassis View window menu bar to access the Device
dit Device Date..., and release.
2. The Device Date change window, Figure 2-13, will appear.
Figure 2-13. Device Date Change Window
3. Enter the new date in a mm/dd/yyyy format by highlighting the field you wish
to change and using the up and down arrow buttons to change the date.
4. Click on OK to save your changes, or on Cancel to cancel.
In accordance with Year 2000 compliance requirements, NetSight Element Manage r now
displays and allows you to set all dates with four-di git year v a lues..
Using an Uninterruptable Power Supply (UPS)
Your MicroMMAC-T supports the use of a UPS (uninterruptable power supply)
through the COM 1 port. (For more information on the use of a UPS with the
MicroMMAC-T, consult the MicroMMAC-T Installatio n Man ual that was
included when you purchased the unit.) You can view or change the status of the
UPS connected to your MicroMMAC-T at the UPS window.
Please note that the UPS window will on ly be active if you currently have a UPS
attached to your MicroMMAC-T through the appropriate port, and you have
correctly set the SET UPS ID field.
Do not set the SET UPS ID field unless you have a UPS attached to the MicroMMAC-T,
WARNING
2-24 Managing the Hub
or you will disrupt your use of NetSight Element Manager.
Page 43

Accessing the UPS Window
At the UPS window, you can configure the UPS ID model type for the
uninterruptable power supply you have attached to the appropriate port on your
MicroMMAC-T.
You can also view information concerning the UPS connected to your
MicroMMAC-T including:
• The amount of time that your UPS has been running since the last start-up
• The line voltage and battery output
• The actual battery capacity of the UPS (dynamic bar graph)
You can also use a button at the bottom of the window to disconnect your UPS, or
you can use the Test option to initiate a self test of the un it.
To access the UPS window:
The MicroMMAC-T Chassis View
1. From the MicroMMAC-T Chassis View window, click on D
bar to access the Device menu.
2. Drag down to U
PS..., and release. The UPS window, Figure 2-14, will appear.
evice in the menu
Figure 2-14. The UPS Window
Managing the Hub 2-25
Page 44

The MicroMMAC-T Chassis View
UPS ID
Displays the manufacturer and model type code of the UPS attached to the
modem port of the MicroMMAC-T. You must assign this type code for the UPS
window to be active. (See Setting the UPS ID, below, for instructions for setting
the type code for your UPS.) The valid type codes are:
• Model 370
• Model 400
• Model 600
• Model 900
• Model 1250
• Model 2000
UPS Uptime
Displays the number of hours that the UPS has been operating since the last time
it was started up.
Line Voltage
Displays the voltage coming through the line attached to the MicroMMAC-T.
Battery Output
Displays the amount of battery output voltage.
Battery Capacity
Displays the percentage of remaining battery capacity (100% indicates a fully
charged battery).
Test Results
Displays the result of the last self-test performed by the UPS. The possible test
results are:
Unit OK The UPS unit is in working order.
Unit Failed The UPS unit has failed the self-test. Check the
unit for damage or consult your UPS User’s
Manual.
Bad Battery The UPS unit battery is bad.
No recent test No UPS self-test has been performed in the last
five minutes.
Unit in test... The UPS is currently in test mode.
Please standby
2-26 Managing the Hub
Page 45

Setting the UPS ID
You need to set the UPS ID typecode that indicates the manufacturer and model
of the UPS.
To set the UPS ID:
1. Click on the arrow next to the SET UPS ID text box. A Model number menu
2. Click on OK. The UPS ID you have chosen will appear in the text box, and the
If your UPS unit does not function after you have set this ID, check the manual
you received with the UPS to ensure that you have chosen the correct UPS ID. If
you need to change the ID, follow the directions given above.
Using the Test Option
You can use the test option to activate a self-test cycle for your unit. This self-test
will check the viability of your unit and its battery.
The MicroMMAC-T Chassis View
will appear. Scroll to highlight the appropriate UPS ID. (Consult the manual
that was included when you purchased your UPS for the correct Model ID
number.)
UPS window will be active.
To activate the test:
1. Click on the Test button. The unit will begin its self-test. The results of the test
will appear in the Test Result text box next to the Test button.
Using the Disconnect Option
You can disconnect the UPS attached to your MicroMMAC-T through its COM
port, as follows:
1. Click on the Disconnect button near the bottom of the UPS window. Your
UPS will now be disconnected.
To reconnect, simply click on OK, or else close, and then re-open the UPS
window.
Resetting the Device
You can use the Re s tart Device selection to perform a software reset of the
MicroMMAC-T. To reset the device:
1. Click on the N
Chassis View window. The Network pull-down menu will appear.
etwork menu selection on the menu bar at the top of the
2. Click on R
estart Device.
Managing the Hub 2-27
Page 46

The MicroMMAC-T Chassis View
A software reset will now be performed for the MicroMMAC-T. All counters for
the current MicroMMAC-T-managed ring return to their initial values, and the
device will re-insert into the ring.
Enabling and Disabling Port Mapping
Port Mapping enables the MicroMMAC-T to determine if station address
information can be matched to a specific module and port index. This ability is
important during the Automatic Beacon Recovery Process, when the
MicroMMAC-T needs to match address information contained in beacon frames
with physical port locations so it can determine the “fault region” and locate
failing ports.
When Port Mapping is enabled, the MicroMMAC-T can determine if a port is
physically linked to the hub without being mapped as part of the ring network —
that is, the device does not participate in neighbor notification. If a port in this
condition is detected, the MicroMMAC-T will physically shut dow n the po rt to
prevent ring problems. Port Mapping is enabled by default.
However, you may want to attach a device to the hub — such as a ring analyzer
— that does not participate in the normal operation of token ring protocol. In this
case, you will want to disable Port Mapping for the port to which that device will
be attached, to ensure that the MicroMMAC-T does not shut the port down.
!
CAUTION
If you wish to insert an analy z er on a ring, be sure you disable Port Mapping on the port
you use for insertion; if you don’t, the MicroMMAC-T will detect that a station which is
not participating in neighbor notification has been inserted, and will shut down the port.
Also, be sure you do not insert anything other than an analyzer into a port whose
mapping function has been disabled, since the MicroMMAC-T will not recognize the link
status of that port, and will therefore not be able to map ports correctly (since it detects
more stations than linked ports).
The Port Map window (Figure 2-15) allows you to view the current state of port
mapping for the selected port, and allows you to either enable or disable port
mapping for the port.
To enable or disable port mapping for a selected port:
1. Click on the desired Port index on a module display in the Chassis View
window. The Port pull-down menu will appear.
2. Click on Port Map.... The Port Map window, Figure 2-15, will appear.
2-28 Managing the Hub
Page 47

The MicroMMAC-T Chassis View
Figure 2-15. The Port Map Window
3. Click on the Port Map Enable radio button to activate port mapping for the
port, or the Port Map Disable radio button to turn off port mapping.
4. Click OK. Port mapping for the selected port will now be enabled or disabled
as desired.
Enabling and Disabling Link Traps
Link traps are generated to management stations in the MicroMMAC-T’s Trap
Table when stations insert into the ring (i.e., the port status on the MicroMMAC-T
changes from ENB to INS) or remove themselves from the ring (i.e., the port
status changes from INS to ENB). By default, these traps are disabled at a station
to reduce the amount of management traffic on your network. You can use
NetSight Element Manager to enable these traps for a selected station, so that you
can more fully view its network activity.
The Link Trap window (Figure 2-16) allows you to view the current state of link
traps for the selected port, and allows you to either enable or disable link traps for
the port.
To enable or disable link traps for a selected port:
1. Click on the desired Port index on a module display in the Chassis View
window. The Port pull-down menu will appear.
2. Click on Link Trap.... The Link Trap window, Figure 2-16, will appear.
Managing the Hub 2-29
Page 48
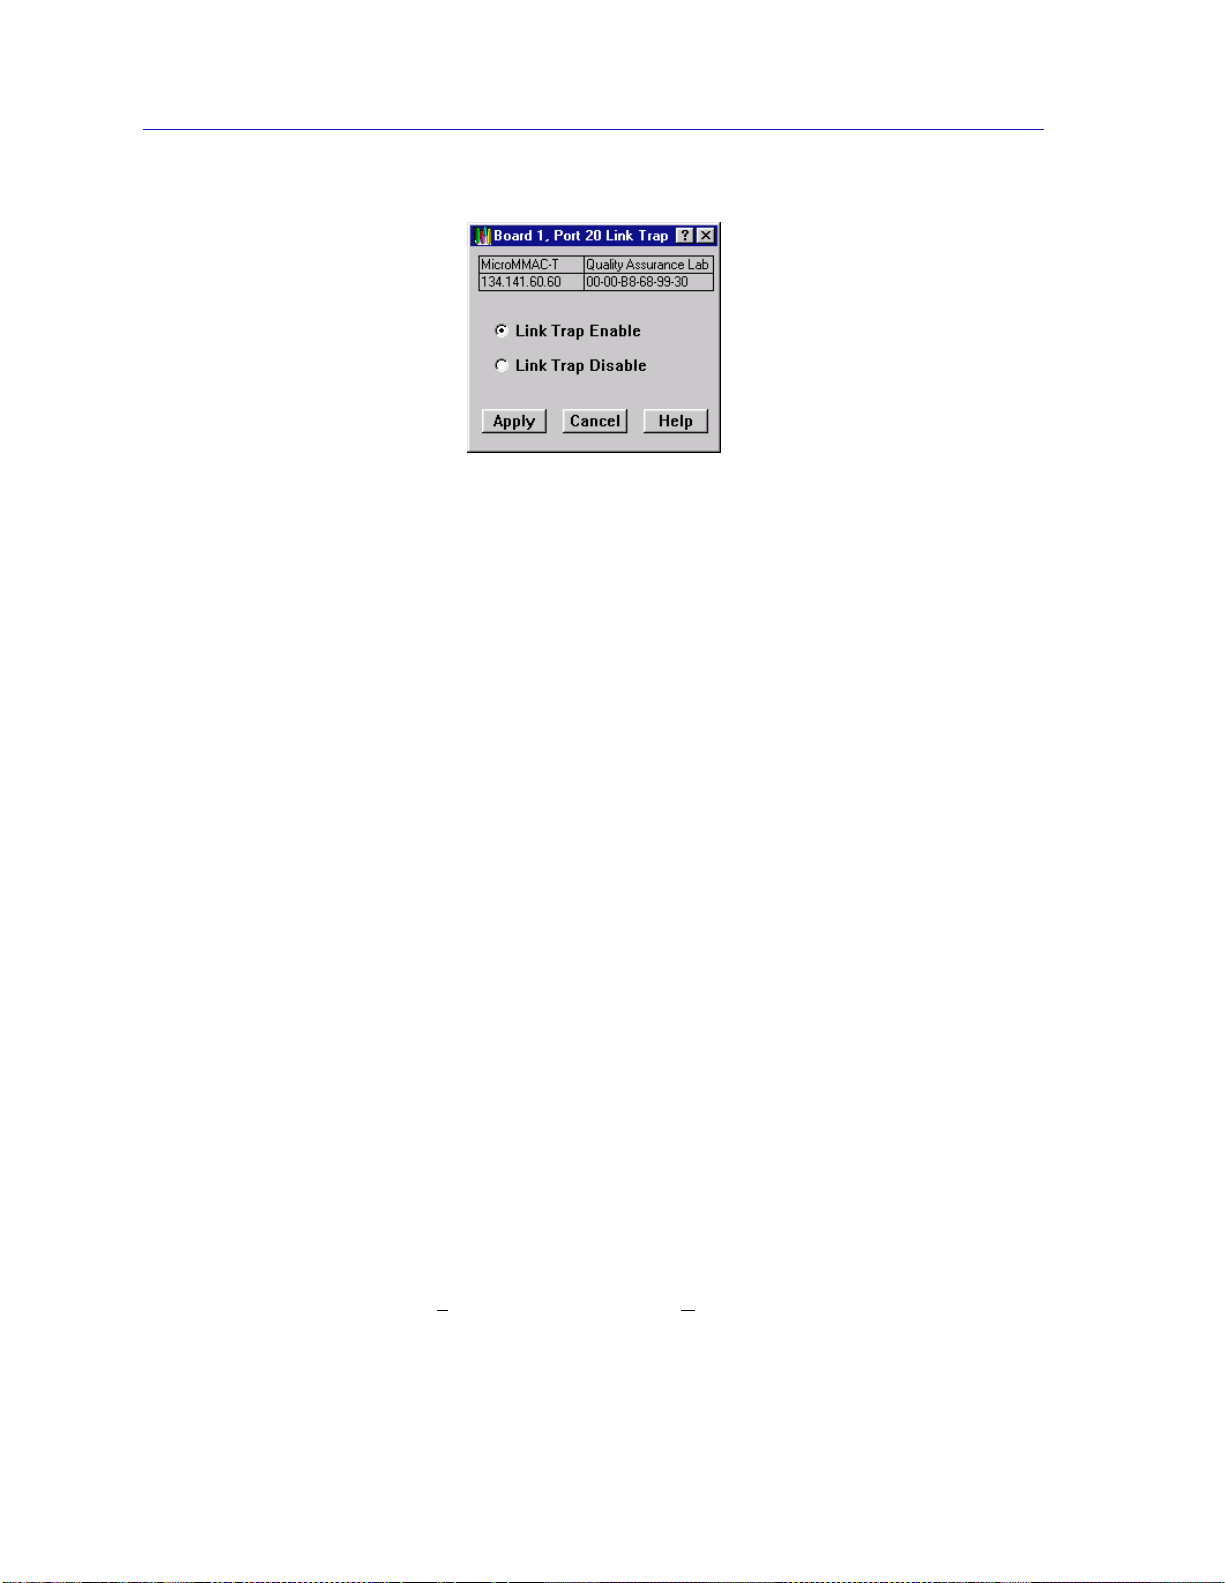
The MicroMMAC-T Chassis View
3. Click on the Link Trap Enable radio button to activate link traps for the port, or
the Link Trap Disable radio button to turn off link traps.
4. Click OK. Link traps for the selected port will now be enabled or disabled as
desired.
Figure 2-16. The Link Trap Window
Enabling and Disabling Link Traps at the Board Level
You can quickly enable or disable link traps for all ports on a board by selecting
Enable Link Traps or Disable Link Traps from the Board menu. To do so:
1. Click on the desired Board index in the Chassis View window. The Board
pull-down menu will appear.
2. Click on Enable Link Traps or Disable Link Traps, as desired.
Link traps will be enabled or disabled for all ports on the selected board.
Setting Token Ring Boards to Automode
By selecting Set Board to Automode from the Module menu, you can quickly
configure a module in the HubSTACK to operate according to its default
hardware settings. To set a module to AutoMode:
1. Click on the desired Module index in the Chassis View window. The Module
pull-down menu will appear.
2. Click on Set Board to AutoMod e to enable the AutoMode setting.
A pop-up window will appear, asking whether you wish to set the board to
AutoMode.
3. Click on Y
window.
es to select AutoMode, or No to return to the Chassis Status
2-30 Managing the Hub
Page 49

If you selected AutoMode, the module will now be configured to operate
according to its default hardware settings. Note that if a set is made to the module
using NetSight Element Manager, the module will automatically return to
management mode.
Enabling and Disabling Ports
Enabling and Disabling Station Ports
From the Module and Port menus on the MicroMMAC-T Chassis View window,
you can enable and disable all station ports on a selected module, as well as
individual station ports, respectively.
To enable or disable all station ports on a selected module:
1. Click on the Module Index for the desired module. The Module pull-down
menu will appear.
2. Click on Enable Station Ports to enable the ports, or Disable Station Ports
to disable the ports.
The MicroMMAC-T Chassis View
The module’s station ports will now be enabled or disabled as desired.
To enable or disable an individual station port:
1. Click on the Port Index for the desired port. The Port menu will appear.
2. Click on Enable to enable the port, or Disable to disable the port. The port will
now be enabled or disabled as desired.
Enabling and Disabling Ring Ports
From the Module and Ring Port menus on the MicroMMAC-T Chassis View
window , yo u can enable and disable a ll ring-in/out ports on a selected module, as
well as individual ring-in/out ports, respectively.
To enable or disable the Ring-in/Ring-out Ports on a selected module:
1. Click on the Module Index for the desired module. The Module pull-down
menu will appear.
2. Click on Enable Ring Ports to enable the ports, or Disable Ring Ports to
disable the ports.
The module’s Ring-in/Ring-out ports will now be enabled or disabled as desired.
Managing the Hub 2-31
Page 50

The MicroMMAC-T Chassis View
To enable or disable individual ring-in/out ports on the MicroMMAC-T:
1. Click on the Port Index for the desired ring-in/out port. The Ring Port menu
will appear.
2. Click on Enable to enable the port, or Disable to disable the port. The port will
now be enabled or disabled as desired.
Ring Out Enable/Disable
The MicroMMAC-T gives you the ability to switch the function of a station port to
that of a ring-out port using the Ring Out Enable and Ring Out Disable options
in the Port menu. Note that these options are not available for ports with an
inserted station.
To convert a station port to a ring-out port:
1. Click on the desired Port index. The Port pull-down menu will appear.
2. Click on Ring Out Enable to convert the station port into a ring-out port. The
converted port will assume the full functionality of a ring-out port, and will
reflect as such in the Chassis View window. The port status will now display as
that of a ring-out port, and the port menu will now assume ring port menu
properties.
To convert the ring-out port back into a station port:
1. Click on the converted port. A Ring Port pull-down menu will appear.
2. Click on Ring Out Disable to revert the functionality of the port back to a
station port.
Viewing I/F Summary Information
The I/F Summary menu option available from the Device menu lets you view
statistics for the traffic processed by each network interface on your device. The
window also provides access to a detailed statistics window that breaks down
Transmit and Receive traffic for each interface.
To access the I/F Summary window:
1. From the Module View, click on the Device option from the menu bar.
2. Click ag ain to select I/F Summary, and release. The I/F Summary window,
Figure 2-17, will appear.
2-32 Viewing I/F Summary Information
Page 51

The MicroMMAC-T Chassis View
Figure 2-17. I/F Summary Window
The I/F Summary window provides a variety of descriptive information about
each interface on your device, as well as statistics which display each interface’s
performance.
The following descriptive information is provided for each interface:
UpTime
The UpTime field lists the amount of time, in a days, hh:mm:ss format, that the
device has been running since the last start-up.
Index
The index value assigned to each interface on the device.
Type
The type of the interface, distinguished by the physical /lin k protoc ol( s) runni ng
immediately below the network layer.
Description
A text description of the interface.
Physical Status
Displays the current physical status — or operational state — of the interface:
Online or Offline.
Logical Status
Displays the current logical status — or administrative state — of the interface:
Up or Down.
Viewing I/F Summary Information 2-33
Page 52

The MicroMMAC-T Chassis View
Interface Performance Statistics/Bar Graphs
The statistical values (and, where available, the accompanying bar graphs) to the
right of the interface description fields provide a quick summary of interface
performance. Y ou can select the statistical value you want to display and the units
in which you want those values displayed by using the two menu fields directly
above the interface display area, as follows:
1. In the right-most menu field, click on the down arrow and select the unit in
which you wish to display the selected statistic: Load, Raw Counts, or Rate.
Bar graphs are only available when Load is the selected base unit; if you select Raw
NOTE
Counts or Rate, the Bar Graph column will be removed from the interface display.
2. Once you have selected the base unit, click on the down arrow in the left-most
field to specify the statistic you’d like to display. Note that the options available
from this menu will vary depending on the base unit you have selected.
After you select a new display mode, the statistics (and graphs, where applicable)
will refresh to reflect the current choice, as described below.
Raw Counts
The total count of network traffic received or transmitted on the indicated
interface since device counters were last reset. Raw counts are provided for the
following parameters:
In Octets Octets received on the interface, including framing
characters.
In Packets Packets (both unicast and non-unicast) received by the
device interface and delivered to a higher-layer protocol.
In Discards Packets received by the device interface that were
discarded even though no errors prevented them from
being delivered to a higher layer protocol (e.g., to free up
buffer space in the device).
In Errors Packets received by the device interface that contained
errors that prevented them from being delivered to a
higher-layer protocol.
In Unknown Packets received by the device interface that were
discarded because of an unknown or unsupported
protocol.
Out Octets Octets transmitted by the interface, including framing
characters.
2-34 Viewing I/F Summary Information
Page 53

The MicroMMAC-T Chassis View
Out Packets Packets transmitted, at the request of a higher level
protocol, by the device interface to a subnetwork address
(both unicast and non-unicas t ).
Out Discards Outbound packets that were discarded by the device
interface even though no errors were detected that
would prevent them from being transmitted. A possible
reason for discard would be to fr ee up buff er space in the
device.
Out Errors Outbound packets that could not be transmitted by the
device interface because they contained errors.
Load
The number of bytes processed by the indicated interface during the last poll
interval in comparison to the theoretical maximum load for that interface type.
Load is further defined by the following parameters:
In Octets The number of bytes received by this interface, express ed
as a percentage of the theoretical maximum load.
Out Octets The number of bytes transmitted by this interface,
expressed as a percentage of the theoretical maximum
load.
When you select this option, a Bar Graph field will be added to the interface
display area; this field is only available when Load is the selected base unit.
Rate
The count for the selected statistic during the last poll interval. The available
parameters are the same as those provided for Raw Counts. Refer to the Raw
Counts section, above, for a complete description of each parameter.
Viewing Interface Detail
The Interface Statistics window provides detailed MIB-II interface statistical
information — including counts for both transmit and re ceive packets, and error
and buffering information — for each individual port interface. Color-coded pie
charts also let you graphically view statis tics for both received and transmitted
Unicast, Multicast, Discarded, and Error packets.
To open the Interface Statistics window:
1. In the I/F Summary window, click to select the interface for which you’d like to
2. Click on Detail. The appropriate I/F Statistics window, Figure 2-18, will
view more detailed statistics.
appear.
Viewing I/F Summary Information 2-35
Page 54

The MicroMMAC-T Chassis View
Figure 2-18. I nterface Detail Window
TIP
You can also access this information via the I/F Statistics option available on the
individual port menus; see Chapter 3, Token Ring Statistics, for more informati o n.
Three informational fields appear in the upper portion of the window:
Description
Displays the interface description for the currently selected interface: Ethernet.
Address
Displays the MAC (physical) address of the selected interface.
Type
Displays the interface type of the selected port: ethernet-csmacd.
The lower portion of the window provides the following transmit and receive
statistics; note that the first four statistics are also graphically displayed in the pie
charts.
Unicast
Displays the number of packets transmitted to or received from this interface tha t
had a single, unique destination address. These statistics are displayed in the pie
chart, color-coded green.
2-36 Viewing I/F Summary Information
Page 55

The MicroMMAC-T Chassis View
Non-Unicast
Displays the number of packets transmitted to or received from this interface tha t
had a destination address that is recognized by more than one device on the
network segment. The multicast field includes a count of broadcast packets —
those that are recognized by all devices on a segment. These statistics are
displayed in the pie chart, color-coded dark blue.
Discarded
Displays the number of packets which were discarded even though they
contained no errors that would prevent transmission. Good packets are typically
discarded to free up buffer space when the network becomes very busy; if this is
occurring routinely, it usually m eans that network traffic is overwhelming the
device. To solve this problem, you may need to re-configure your bridging
parameters, or perhaps re-configure your network to add additional bridges or
switches.
These statistics are displayed in the pie chart, color-coded magenta.
Error
Displays the number of packets received or transmitted that contained errors.
These statistics are displayed in the pie chart, color-coded red.
Unknown Protocol
Displays the number of packets received which were discarded because they were
created under an unknown or unsupported protocol.
Packets Received
Displays the number of packets received by the selected interface.
Transmit Queue Size
Displays the number of packets currently queued for transmission from this
interface. The amount of device memory devoted to buffer space, and the traffic
level on the target network, determine how large the output packet queue can
grow before the MicroMMAC-T will begin to discard packets.
Packets Transmitted
Displays the number of packets transmitted by this interface.
Making Sense of Detail Statistics
The statistics available in this window can give you an idea of how an interface is
performing; by using the statistics in a few simple calculations, it’s also possible to
get a sense of an interface’s activity level:
To calculate the percentage of input errors:
(Received only)
(Received only)
(Transmit only)
(Transmit only)
Received Errors /Packets Received
To calculate the percentage of output errors:
Viewing I/F Summary Information 2-37
Page 56

The MicroMMAC-T Chassis View
Transmitted Errors /Packets Transmitted
To calculate the total number of inbound and outbound discards:
Received Discards + Transmitted Discards
To calculate the percentage of inbound packets that were discarded:
Received Discards /Packets Received
To calculate the percentage of outbound packets that were discarded:
Transmit Discards /Packets Transmitted
Unlike the Interface Detail window, which this window repl aces, the Interface Statistics
NOTE
window does not offer Disable or Test options. These options are available in the
Interface Group window, which can be accessed via the System Group window (select
ystem Group... from the Device menu). Refer to your Generic SNMP User’s Guide
S
for further information on the System Group and Interface Group windows.
2-38 Viewing I/F Summary Information
Page 57

Chapter 3
Token Ring Statistics
Using Statistics window features; monitoring ring-level statistics, timer statistics, and performance
graphs; monitoring management station statistics; monitoring port-level statistics, timer statistics, and
performance graphs
NetSight Element Manager provides valuable performance statistics from the
Network, Management Station, and Port levels. The statistics windows include
ring status information, beacon statistics, error counts, timer statistics, frame size
and protocol statistics, and performance graphs.
Statistics Window Features
Many of the token ring statistics windows allow you to measure and view
statistics according to different scales, and set a time interval after which statistics
are automatically updated. The following sections detail these features.
Setting Total, Delta, or Cumulative Counts
By using the radio buttons located at the bottom of the Network, TR Management
Station, and Station (Port) Statistics windows, you can change the time period
during which the statistics shown in the window are collected. An example of this
group of radio buttons is shown in Figure 3-1.
Figure 3-1. Sample Total, Delta, and Cumulative Radio Buttons
3-1
Page 58

Token Ring Statistics
Using these radio buttons, you can choose whether to view the statistics gathered
since the MicroMMAC-T was last restarted or (if you are monitoring port-level
statistics) since the station was first insert ed (Total), during the last polling
interval (Delta), or accumulated from zero at a user-defined point (Cumulative).
You set the interval to update information (from 1 second to 23 hours, 59 minutes,
59 seconds) by using the clock symbol at the bottom of the window (See Setting
the Statistics Poll Interval, below, for details on using the clock symbol).
To choose Total, Delta, or Cumulative:
• Click on the Total radio button. After the completion of the current polling
cycle plus one complete polling cycle, the screen will display the sum of
statistics processed since the MicroMMAC-T was last restarted or (if you are
monitoring port-level statistics) since the station was first inserted. These
totals are read from the device and updated at each subsequent polling
interval.
• Click on the Delta radio button. After the completion of the current polling
cycle plus two more polling cycles, the screen will display the count of
statistics processed during the last polling interval. These counts are refr eshed
after each polling cycle.
• Click on the Cumulative radio button. After the completion of the current
polling cycle, the screen will display the count of statistics processed during
the last polling interval, and then will accumulate statistics with each polling
cycle thereafter until another display option is chosen.
Viewing Elapsed, Average, and Peak Activity Levels
Timer S tatistics windows measure activity levels for dif ferent netw ork events on a
color-coded strip chart. An example of this chart is shown in Figure 3-2.
Figure 3-2. A Sample Timer Statistics Chart
The activity states and their colors are:
• Elapsed (Green) — Indicates the level of activity during the last time interval.
• Average (Blue) — Indicates the average level of activity over all time intervals
since the window was invoked.
3-2 Statistics Window Features
Page 59
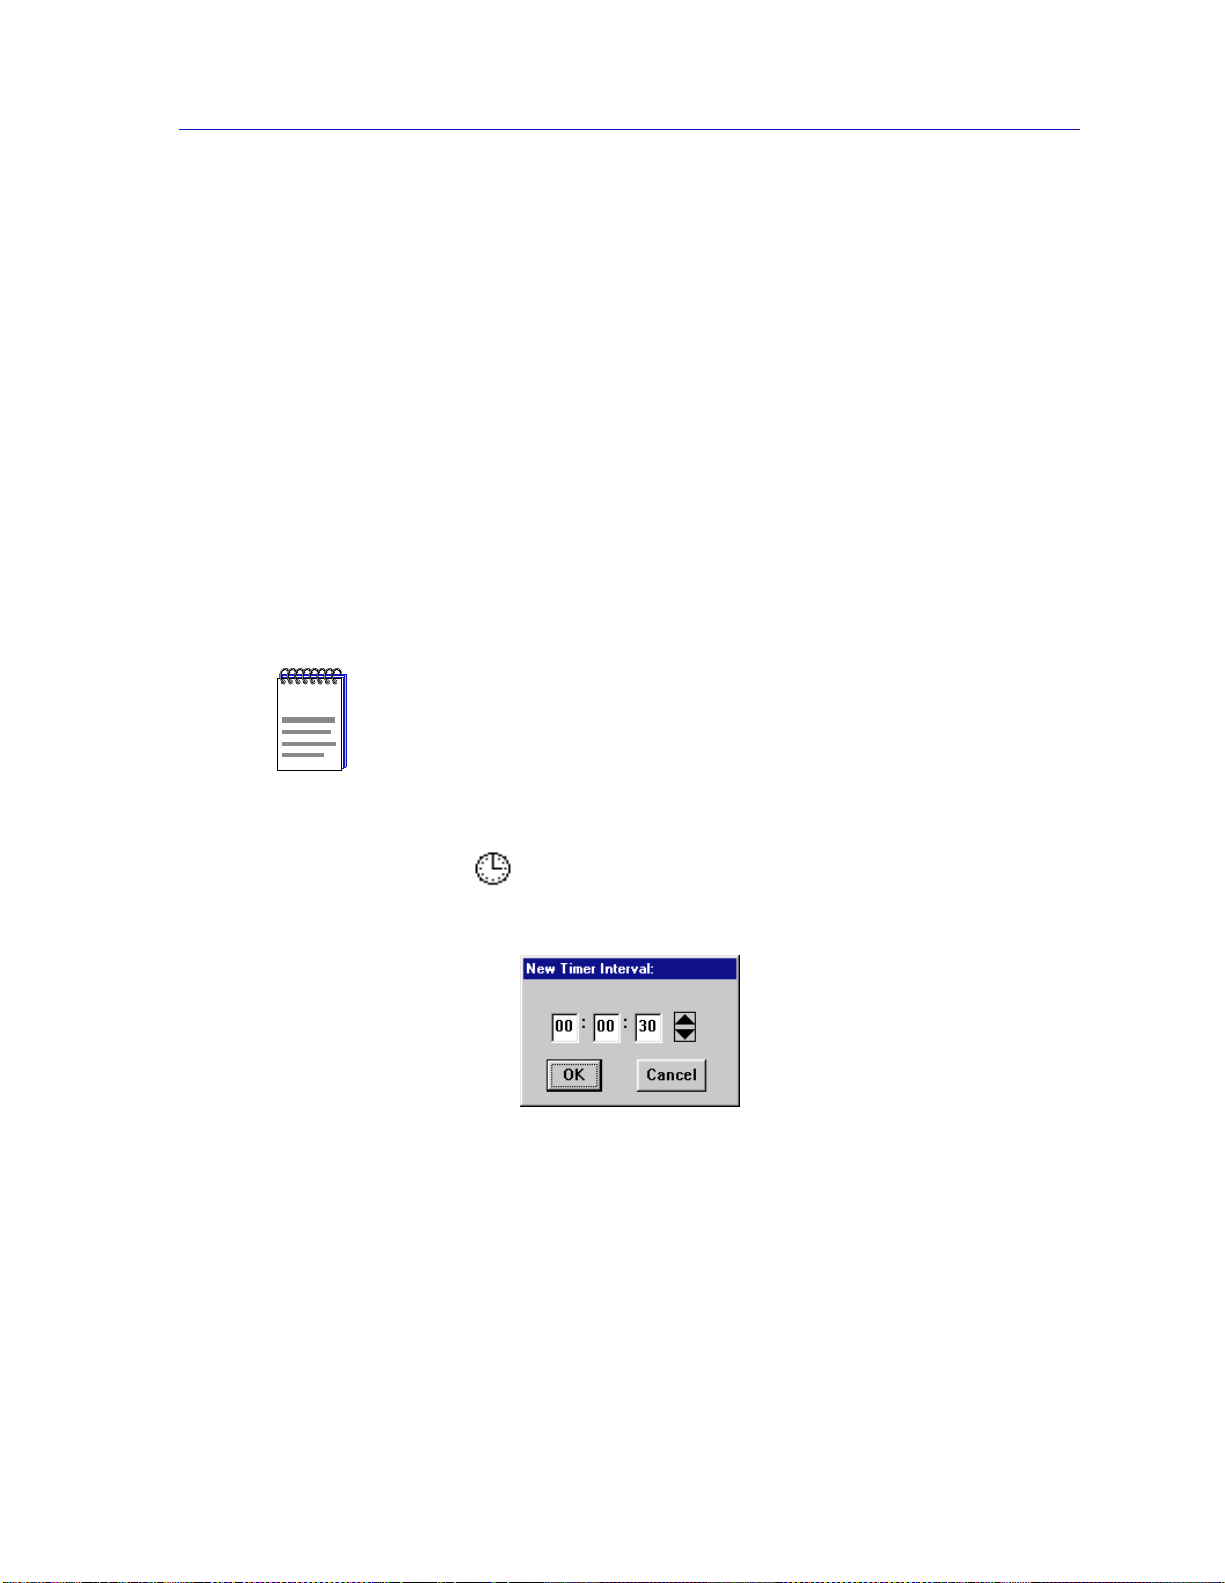
• Peak (Magenta) — Indicates the maximum level of activity over all time
intervals since the window was invoked.
Statistics displayed in the color-coded strip charts will automatically update
within the time interval you have set using the clock symbol at the bottom of th e
window (See Setting the Statistics Poll Interval, below, for details on using the
clock symbol).
Setting the Statistics Poll Interval
Information displayed in the Statistics and Timer Statistics windows is updated
after (or, for windows in Delta mode, displayed for) the time period defined by
the Interval field available in each window. Each statistics window collects and
displays data according to its default polling interval. You can re-configure this
interval for each instance of a statistics window by using the clock symbol found
in the Statistics and Timer Statistics windows. Note that the poll in terval returns
to its default value each time you close and then re-open a statistics window.
In NetSight Element Manager, the polling interval is set via the Tools—>Options
NOTE
available from the primary window menu bar.
Token Ring Statistics
Refer to the NetSight Element Manager User’s Guide for full information on setting
device polling intervals.
To set the Poll Interval:
1. Clic k on ne xt to th e Interv al inf ormati on bo x. T he Ne w Timer Interv al te xt
box will appear.
Figure 3-3. The New Timer Interval Text Box
2. Using the mouse, highlight the hour field; type in the desired number of hours
(using a 24 hour format), or use the arrow buttons to change the value. Valid
time values range from 1 second to 23 hours, 59 minutes, 59 seconds.
3. Following the same process, select the minutes and seconds fields and either
type in a new value or use the arrow buttons to change the value.
Statist ics Window Features 3-3
Page 60

Token Ring Statistics
4. Click on OK. The new Time Interval will take effect for the current instance of
the window in which you have set it. Remember, the poll interval returns to its
default value each time you close, and then re-open a statistics window.
Network Level Statistics
Using the Network pull-down menu, you can view performance statistics for the
MicroMMAC-T-managed ring. The MicroMMAC-T-managed ring is represented
by the Network 1
Windows which allow you to view performance information for a ring include:
• Statistics
• Timer Statistics
• Performance Gra phs
• Frame Size
•Protocol
Accessing the Network Statistics Selections
entry in the Network pull-down menu.
To access the Network Statistics selections:
1. At the MicroMMAC-T Chassis View window, click on the N
selection, then on the Network 1
selections:
tatistics...
•S
imer Statistics...
•T
•Performance G
rame Size...
•F
rotocol...
•P
2. Highlight your selection. Each selection has an associated window.
raph...
The Network Statistics Window
At the Network Statistics window (Figure 3-4), you can view Ring Status,
Beaconing, and Error fields for a MicroMMAC-T-managed ring.
General Information Fields
There are two general information fields in the Network Statistics Window:
Ring Number
This field displays the number provided by the Ring Parameter Server that is
used to identify the current ring. Possible values are 0001-0FFF (hexadecimal).
etwork menu
entry to access the following statistics
3-4 Network Level Statistics
Page 61

Token Ring Statistics
Ring Speed
The operating speed (4 Mbit/sec or 16 Mbit/sec) of the current ring.
Figure 3-4. The Network Statistics Window
Ring Status Fields
By using the radio buttons located at the bottom of the Network Statistics
window, you can choose whether to view the statistics gathered since the
MicroMMAC-T was last started up (Total), counted during the last polling
interval (Delta), or accumulated from zero at a user-defined point (Cumulative).
See Setting Total, Delta, or Cumulative Counts, page 3-1, for details.
Set the time interval to update information (from 1 second to 23 hours, 59
minutes, 59 seconds) by using the clock symbol at the bottom of the window. See
Setting the Statistics Poll Interval, page 3-3, for details.
Ring Status fields include:
Stations Inserted
Displays the total number of stations that are currently inserted on the ring. This
number indicates all stations, regardless of whether they are connected to the
MicroMMAC-T hub.
Active Monitor
Displays the MAC address of the active monitor on the ring.
AM (Active Monitor) Changes
Displays the number of times the active monitor has changed on the ring.
Network Level Statistics 3-5
Page 62

Token Ring Statistics
Beacon St atistics
Ring Purges
Displays the number of times the active monitor has purged the ring since the
network was created, or since the Micr oMMAC-T was last re set. This includes the
purge at the end of the active monitor selection process. The count is not reset
when the active monitor changes.
Total Frames
Displays the number of frames that have been transmitted on the ring.
Total KBytes
Displays the total number of kilobytes that have been transmitted on the ring.
This number is the sum of all data bytes in each frame.
A Beacon is transmitted when a hardwar e err or is detected on the ring, including:
wire faults, frequency errors, or ring signal loss.
Note that the Longest Beacon and Last Beacon fields are read from the device
(Total up date), and are not subject to Delta or Cumulative update options.
Soft Error Fields
Beacon States
This field lists the count of beaconing occurrences on the ring.
Longest Beacon
This field lists the duration of the longest beaconing occurrence (not subject to
Delta/Cumulative update).
Last Beacon
This field provides the duration of the last beacon (not subject to
Delta/Cumulative update).
Line Errors
Displays the total number of line errors that the management station has detected.
These are recorded when a receiving station detects a data corruption in a frame
that was initially transmitted as a good frame, with the E bit (error flag) set at
zero (0).
A power surge on the ring (line of transmission) may cause the data portion of a
frame or token to be corrupted. The frame or token then may contain a non-data
bit between the data start and end delimiters, or a Frame Check Sequence (FCS)
error.
3-6 Network Level Statistics
Page 63

Token Ring Statistics
The first station detecting the data corruption sets the E bit to 1 in the ending
delimiter of the frame and logs the error. This prevents other stations from
logging the error and isolates the portion of the line which is causing the data
corruption.
Burst Errors
Displays the total number of burst errors detected on the ring. These errors occur
when a station does not clock an incoming data signal correctl y.
Token ring protocol uses Differential Manchester Encoding for its signalling
format. Using this code, each bit time is halved, with a correct signal having a
transition at the center of the bit time (i.e., switching between 0 and 1, or vice
versa, in the middle of the bit time). Burst er rors occur when a station r eceives five
half-bits of Manchester encoded data without a change in phase from 0 to 1 (thus
indicating no change in data valu e).
These usually occur when there was a brief disruption on the cable, or a brief
electrical surge or electronic noise on the network.
A.C. Errors
The count of AC Errors detected on the ring. These indicate that the reporting
station’s Nearest Active Upstream Neighbor (NAUN) is faulty, because it is
unable to report its address during neighbor notification.
If a station receives more than one Active Monitor Present (AMP) or Standby
Monitor Present (SMP) frame with the Address Recognized Indicator (ARI) and
Frame Copied Indicator (FCI) bits set to 0 without receiving an intervening AMP
frame with these bits set to 1, it recognizes that its NAUN failed to set the
ARI/FCI bits.
The detecting station indicates the error to the active monitor, then ends the ring
poll process by not transmitting an SMP frame.
Abort Sequences
The count of abort delimiters transmitted on the ring. These are recorded when a
station detects a corrupted token while transmitting, then sends an abort
delimiter to halt frame transmission before the expected end-frame sequen ce.This
error will cause the active monitor to restore the ring through the ring purge
process. This error is somewhat uncommon, and often indicates a failing adapter.
A common cause of abort sequences is overheating by the adapter in an
overloaded system. Note that the adapter may also issue an Internal Error
simultaneously, which will cause the adapter to remove itself from the ring.
Internal Errors
Displays the total number of internal errors detected on the ring. These are
recorded when a station re cognizes a recoverable internal err or in its own adapter .
You can use this to detect a station in marginal operating condition, possibly with
an inoperable chipset, timers, or counters. A large number of internal errors can
indicate that one or more stations on the monitored ring ar e in marginal operating
condition.
Network Level Statistics 3-7
Page 64

Token Ring Statistics
Lost Frames
Displays the number of lost frame errors detected on the ring. These occur when a
station is transmitting and its TRR (Timer, Return to Repeat) timer expires. This
timer ensures that the station returns to the data repeat state.
Lost frames are usually caused by a station entering or leaving the ring as the
frame is circulating – since this often throws the ring temporarily out of
synchronization. Lost frames will cause the active monitor to initiate the ring
purge process and issue a new token.
Congestion Errors
Displays the total number of error conditions wh en a ring station recognizes a
frame addressed to it, but has no available buffer space; that is, the station is
receiving frames faster than its adapter can copy information from the buffers.
This indicates that the station is congested.
F.C. Errors
Displays the count of frame copied (FC) errors detected on the ring. These are
recorded when the management station recognizes a frame addressed to it and
detects that the Frame Status field’s Address bits are set to 1, in dicating a po ssible
line surge or duplicate address.
Note that it is virtually impossible to have a ring with duplicate addresses, since
most of the time the ring uses the hard-coded address on the adapter, and
duplicate addresses are checked for when a station inserts itself into the ring.
However, a system administrator can pass a locally assigned address to the
adapter, so it is possible to unintentionally administer a duplicate address while a
device is on the ring. This error is more commonly caused by transparent
bridging on a token ring network.
Token Errors
Displays the number of token errors detected on the ring. These occur when the
management station, as the active monitor, recognizes an error condition that
needs a token transmitted. This occurs when the TVX (Timer , Valid T ransmission)
timer expires. This timer records the time in which a valid transmission can occur.
As in lost frames, the major cause for token errors is the disruption of the ring as
stations enter or leave the ring. Note that token errors are only reported by an
active monitor . If you see a token err or r eported by another station, it was serving
as active monitor at some previous time.
Frequency Errors
A frequency error occurs when the ring clock frequency and the station’s internal
crystal clock frequency differ by an excessive amount. This type of error happens
more often on 16 Mbps rings than on 4 Mbps rings; it can also be a symptom of
too many stations on the ring.
Detection of a frequency error initiates the monitor contention process, since this
typically indicates that the active mo nitor is not present or is malfunctioning.
3-8 Network Level Statistics
Page 65

Total Errors
The sum of all errors currently recorded.
Network Timer Statistics
You can use the Network Timer Statistics window (Figure 3-5) to view the
number of frames, errors, and bytes processed by the ring over a user-defined
time interval (allowable time settings are 1 second to 23 hours, 59 minutes, 59
seconds). This allows you to quickly scan the display to obtain information
concerning the network activity.
Token Ring Statistics
Figure 3-5. Network Timer Statistics Window
Statistics are displayed in color-coded strip charts which automatically update
within the time interval you have set. See Viewing Elapsed, Average, and Peak
Activity Levels, page 3-2, for details about the Timer Statistics chart
measurements.
You can also refresh the statistics at any time by clicking on the Clear button. This
will refresh the Station Timer Stats window to collect new network statistics. (The
timestamp, indicating the last time that the Timer Stats box was cleared, will also
update.)
Set the time interval to update information (from 1 second to 23 hours, 59
minutes, 59 seconds) by using the clock symbol at the bottom of the window. See
Setting the Statistics Poll Interval, page 3-3, for details.
Network Timer Statistics Window Fields
The Timer Sta tistics window fields display the diffe rent network even ts measured
by the Timer Statistics chart. The following Timer Statistics window fields appear
for the network:
Network Level Statistics 3-9
Page 66

Token Ring Statistics
Frames
Displays the elapsed, average, and peak levels of good frames transmitted on the
network.
Errors
Displays the elapsed, average, and peak levels of errors received by the network.
KBytes
Displays the elapsed, average, and peak levels of kilobytes processed by the
network.
Network Perform a nce Graphs
The Network Performance Graphs (Figure 3-6) provide real-time statistics
reporting. The color-coded strip charts allow you to visually track the
performance of the entire network. Each strip chart graph shows you the amount
of traffic going through the network, as well as the number of network events
(errors, ring purges, or beacon states) it has experienced.
You select the ty pe of events to monitor by using the buttons at the bottom left of
this window, and their associated pull-down menus. Y ou can choo se to view total
errors, ring purges, beacon frames, or no network events. You can also choose to
view traffic in frames or percent load, or not view it at all. Each time you change
the parameters of the graph, it will refresh itself.
The graph has an x axis that indicates the 60 second interval over which charting
occurs continuously, while the y axis measures the amount of traffic or network
events that are processed by the network.
Figure 3-6. Network Performance Graph
3-10 Network Level Statistics
Page 67

Network Perf ormance Graph Statistics
The Network Perfo rmance Graph contains the following sta t istics:
Network Events (Red)
Total Errors The total number of soft errors of any kind processed by
Ring Purges The total number of times the ring’s active monitor has
Beacon States The number of beacon states on the ring which have been
Nothing The Network Events scale is not currently measuring any
Traffic (Blue)
Frames The total number of good frames transmitted and
Token Ring Statistics
the network.
issued a ring purge command.
corrected by the automatic beacon recovery process
(ABRP).
network events statistics coming through the network.
received by the network.
Percent Load Reflects the load generated by the network compared to
its theoretical maximum load (4 or 16 Mbits/sec).
Nothing The Traffic scale is not currently measuring th e traffic or
load processed by the network.
Configuring the Network Performance Graph
1. Using the mouse, click on the Network Events button (with the red square
marker to its left). The Network Events pull-down menu will appear.
2. Click on the desired mode (Total Errors, Ring Purges, Beacon States, or
Nothing). The mode you have chosen will appear in the button. The
Performance Graph will refresh and begin to measure, using the new mode.
3. Click on the Traffic button (with the blue square marker to its left). The Traffic
pull-down menu will appear.
4. Click on the desired mode (Frames, Percent Load, or Nothing). The mode
you have chosen will appear in the button. The Performance Graph will
refresh and begin to measure, using the new mode.
The Performance Graph will now monitor the network us ing the user-defined
modes. (Click on Cancel to stop monitoring and exit the screen.)
Network Level Statistics 3-11
Page 68

Token Ring Statistics
The Frame Size Window
At the Frame Size window, Figure 3-7, you can see th e actua l sizes of the frames
on the ring network controlled by your MicroMMAC-T.
The frame sizes and corresponding colors are:
• <<64 (Red)
• 64-127 (G reen)
• 128-255 (Rose)
• 256-511 (Yellow)
• 512-1023 (Gray)
• 1024-2047 (Cyan)
• 2048-4095 (Magenta)
• >>4095 (Orange)
Figure 3 -7. The Device Frame Sizes Window
These frame size statistics are presented in numerical, bar graph, and pie chart
form.
Total and Delta Graph Display
You can choose whether to view the total count of frame sizes (Total), or to view
the count of frame sizes during the last polling interval set for NetSight Element
Manager (Delta).
To choose Delta or Total:
• Click on the Delta radio button. The numbers to the left of the selected graph
display the count of frame sizes pr ocessed during the last polling interval. The
dynamic bar graph or pie chart to the right of the numbers gives a color-coded
real-time view of the numerical count.
3-12 Network Level Statistics
Page 69

• Click on the Total radio button. The numbers to the left of the selected graph
(in the color-coded boxes) display the total count of frame sizes processed
since the most recent start-up of the MicroMMAC-T. The dynamic bar graph
or pie chart to the right of the numbers reflects counts processed since the last
start-up.
Using the Pie and Bar Radio Buttons
You can use the Pie and Bar radio buttons to switch from the bar graph to the pie
chart to view the size of frames passing through the MicroMMAC-T. Both graph
types reflect the type of collection you have chosen: Total or Delta. See Figure 3-8
for a view of the Device Frame Sizes window with a pie chart displayed.
To display a pie chart or bar graph:
1. Click on the Pie or Bar radio button. The color-coded Pie chart or the Bar
graph will appear on the window, depending on your choice.
Token Ring Statistics
Figure 3-8. Frame Sizes Window with Pie Chart
Network Level Statistics 3-13
Page 70

Token Ring Statistics
The Protocol Statistics Window
At the Protocol Statistics window (Figure 3-9) you can see how many frames are
received by the MicroMMAC-T for a given protocol.
Figure 3-9. Protocol Statistics Window with Bar Graph
You can view sta tistics for the following protocols (note the corresponding
colors):
• SNA™ (Red)
• XNS™ (Green)
• TCP/IP (Rose)
• Banyan™ (Yellow)
• IPX™ (Blue)
• NetBios™ (Turquoise)
• LAN Net Manager™ (Magenta)
• All other protocols (Orange)
These protocol statistics are presented in numerical, bar graph, and pie chart
form.
Total and Delta Graph Display
You can choo se whether to view the total count of protocol types (Total), or to
view the count of protocol types during the last polling interval set for NetSight
Element Manager (Delta).
To choose Delta or Total:
• Click on the Delta radio button. The numbers to the left of the graphs will now
display the count of protocol types processed during the last polling interval.
The dynamic graphs to the right of the numbers give a color-coded real-time
view of the numerical count.
3-14 Network Level Statistics
Page 71

• Click on the Total radio button. The window will now display the total count
of protocol types processed since the most recent start-up of the
MicroMMAC-T. The dynamic bar graph or pie chart to the right of the
numbers reflects counts processed since the last start-up.
Using the Pie and Bar Radio Buttons
You can use the Pie and Bar radio buttons to switch from bar graph to pie chart.
With the pie chart or bar graph, you can view the traffic, broken into protocols,
that is passing through the MicroMMAC-T. Both graphs will reflect the type of
collection you have chosen: Total or Delta.
To display a pie cha r t or bar graph:
1. Click on the Pie or Bar radio button. The Pie chart or the Bar graph, as you
have selected, will appear on the window.
Management Station Statistics
Token Ring Statistics
Through the Device menu, you can view network statistics for the
MicroMMAC-T’s on board ring management station.
Accessing the Management Station Statistics Selection
To access the Int elligent Module pull-down menu from the MicroMMAC-T
Chassis View window:
1. Click on the D
Chassis View. The Device menu will appear.
2. Click to highlight the M
Management Station Statistics window will appear.
The upper left corner of the The TR Management Station Statistics window
(Figure 3-10) contains the module’s name, location, and MAC and IP addresses.
The window also lists the current ring speed set at the device.
evice menu selection on the menu bar in the MicroMMAC-T
gmt. Station Statistics... selection. The TR
Management Station Statistics 3-15
Page 72

Token Ring Statistics
Figure 3-10. The TR Management Station Statistics Window
Soft Errors Fields
This window also lists both soft and hard error conditions detected by the
MicroMMAC-T’s management station, as explained in th e following sections.
The Total Errors field indicates the sum of both soft and hard errors that the
management station has detected.
By using the radio buttons located at the bottom of the TR Manag e ment Station
Statistics window, you can choose whether to view the statistics gathered since
the MicroMMAC-T was last started up (Total), counted during the last polling
interval (Delta), or accumulated from zero at a user-defined point (Cumulative).
See Setting Total, Delta, or Cumulative Counts, page 3-1, for details.
Set the time interval to update information (from 1 second to 23 hours, 59
minutes, 59 seconds) by using the clock symbol at the bottom of the window. See
Setting the Statistics Poll Interval, page 3-3, for details.
Line Errors
The count of line errors that the management station has detected on the ring.
This error indicates a non-data bit between the starting and ending delimiters of
data, or a frame check sequence error.
Burst Errors
The count of burst errors that the management station has detected on the ring.
This error indicates a bit information-encoding error when there ar e no transitions
between 0 and 1 over five half-bit times.
3-16 Management Station Statistics
Page 73

Token Ring Statistics
A.C. Errors
The count detected by the management station of frames (Protocol Data Units or
PDUs) containing errors in the A or C bits.
Abort Sequences
The management station’s count of abort sequences detected on the ring, which
were issued by ring stations during transmission.
Internal Errors
The number of recoverable internal errors detected by the management station,
indicating a ring station in margina l operating condition.
Lost Frames
The number of frames detected by the management station that were transmitted
on the ring, but did not return to the transmitting station because the Timer
Return to Repeat (TRR) timer expired.
Congestion Errors
The number of times the management station has not been able to copy a PDU
addressed to it because of a lack of internal buffering.
Hard Errors Fields
FC Errors
The management station’s count of PDU detected on the ring with the A bits
already set to 1, which indicates a possible electrical line disturbance, or a
duplicate address on the ring.
Token Errors
The number of times the ring’s active monitor detected an error that required the
transmission of a token.
Frequency Errors
The number of times that the management station has detected that the incoming
frequency differs from the expected frequency by more than allowed.
Soft Errors
The total number of soft errors the management station has detected.
If a particular type of hard error is detected by the management station,
“Detected” will be displayed in the appropriate hard error field. If no hard errors
are detected, the field will display “None.”
Signals Lost
These errors occur if the management station has detected a loss of signal
condition, which can be the result of a broken ring, a faulty wiring concentrator,
or a receiver or transmitter malfunction.
Management Station Statistics 3-17
Page 74

Token Ring Statistics
Transmitted Beacons
Beacon frames are transmitted by ring stations when certain error conditions are
detected. These frames notify all ring stations that there is a problem, and causes
the stations in the fault domain (the beaconing station and its NAUN) to remove
themselves from the ring and perform a loopback test. If either station fails the
test, its removal should allow the ring to recover.
Recoveries
Indicates that claim tokens have been detected on the ring. Claim token frames
are issued during the active monitor contention process; their presence on the
ring indicates that the ring is recovering from the loss of the active monitor. This
counter is reset once the new active monitor is chosen and issues a ring purge to
reset the ring.
Lobe Wire Fault
Indicates that a station on the ring has detected a short or open condition on its
lobe wires. This condition is detected by the loss of the phantom current. A station
detecting this condition will remove itself from the ring.
Remove Frames
Indicates that a Remove MAC frame has been detected on the ring. A Remove
MAC frame forces the receiving station to remove itself from the ring. Once a
station has removed itself from the ring, its actions will depend upon its design:
some devices will automatically try to re-insert after a pre-determined timeout
period; as part of the re-insertion process, those devices will perform a loopback
test to verify that their MAC adapters are operating properly. Stations which do
not automatically attempt re-insertion will simply remain off the ring until they
are manually re-inserted.
Auto Removes
Indicates that one or more stations has failed a loopback test performed as a result
of a beaconing condition, and has therefore removed itself from the ring.
Single Station
This condition indicates that the management station has determined that it is the
only station on the ring.
Hard Errors
If the management station has detected hard errors on the ring, this field will
display “Detected.” If no hard errors were detected, this field will display
“None.”
3-18 Management Station Statistics
Page 75

Port Level Statistics
Through the Station Port pull-down menu, yo u can view statistics for a station
inserted into a ring, and graphically monitor the selected station via Timer
Statistics and the Performance Graph. The following sections detail how to access
the Station Port pull-down menu, and how to use the menu to view numerical
and graphical statistics for a station port.
Accessing the Station Port Menu
To access a Station Port menu:
In the Chassis View window, click on any inserted station port (i.e. ) on the
MicroMMAC-T port display.
The Station Port menu will appear, offering the following statistics selections:
• Statistics...
• Timer Statistics...
• Performance Graph...
Token Ring Statistics
3. Click the mouse to highlight your selection. The associated window will
appear.
Each window is described in the following three sections.
The Station Statistics Window
The Station Statistics window (Figure 3-11) contains fields which allow you to
configure the station port, and view performance and error statistics for the
selected port.
By using the radio buttons located at the right of the Station Statistics window,
you can choose whether to view the statistics gathered since the station was first
inserted (Total), counted during the last polling interval (Delta), or accumulated
from zero at a user-defined point (Cumulative). See Setting Total, Delta, or
Cumulative Counts,page 3-1, for details.
Set the time interval to update information (from 1 second to 23 hours, 59
minutes, 59 seconds) by using the clock symbol at the bottom of the window. See
Setting the Statistics Poll Interval, page 3-3, for details.
Port Level Statistics 3-19
Page 76

Token Ring Statistics
Figure 3-11. The Station Statistics Window
The Station Statistics Window General Fields
The Station Statistics window contains the following fields:
Station Name
Use this editable field to assign a name to the station attached to the selected port.
Location
Use this editable field to assign a drop number to the station attached to the
selected port.
Link Time
The length of time (in days, hours, minutes, and seconds) that the selected station
has been inserted into the ring.
The Station Statistics Window Performance Fields
The following fields give general performance information for the selected
station.
Total Frames
The total number of frames transmitted by the selected station port since its
attached station inserted into the ring.
Total KBytes
The total number of kilobytes transmitted by the selected station port since its
attached station inserted into the ring.
3-20 Port Level Statistics
Page 77

The Station Statistics Window Soft Error Fields
The following fields break down soft errors for the selected station.
Line Errors
The count of line errors detected by the selected station port. This error indicates a
non-data bit between the starting and ending delimiters of data, or a frame check
sequence error.
Burst Errors
The count of burst errors d etected by the selected station port. This err or in dicates
a bit information-encoding error when there are no transitions between 0 and 1
over five half-bit times.
A.C. Errors
The number of Protocol Data Units (PDUs) containing errors in the A or C bits
detected by the selected station port.
Abort Sequences
The number of times the selected port has transmitted abort sequences during
transmission.
Token Ring Statistics
Internal Errors
The number of recoverable internal errors detected by the selected port,
indicating that its attached statio n is in marginal operating condition.
Lost Frames
The number of frames that the selected port has transmitted that have not
returned because the Timer Return to Repeat (TRR) timer has expired.
Congestion Errors
The number of times the selected port has not been able to copy a PDU addressed
to it because of a lack of internal buffering.
F.C. Errors
The number of PDU addressed to the selected station that ha ve the A bits already
set to 1, which indicates a possible electrical line disturbance, or a duplicate
address on the ring.
Token Errors
The number of times the selected station, while acting as the active monitor, has
detected an error that required the transmission of a token.
Port Level Statistics 3-21
Page 78

Token Ring Statistics
Frequency Errors
The number of times the selected station has detected that the incoming signal’s
frequency differed from the expected frequency by more than allowed.
Total Errors
The total number of errors accounted for by the selected port.
The Station Timer Statistics Window
At the Station Timer Statistics window (Figure 3-12), you can view the number of
frames, errors, and bytes processed by the selected station port over a
user-defined time interval (allowable time settings are 1 second to 23 hours, 59
minutes, 59 seconds). The displayed statistics will a utomatically update within
the time interval you have set at the Interval text box at the bottom of the screen.
Figure 3-12. Station Timer Statistics Window
Two fields directly above the bar graphs identify the currently selected port by its
board and port number and its MAC address.
Bar charts graphically represent the elapsed, average, a nd peak times that frames,
bytes, and soft errors are passing through the por t. These charts are color-co ded to
allow you to quickly scan the display and obtain needed information concerning
the port’s activity level. See Viewing Elapsed, Average, and Peak Activity
Levels, page 3-2, for details about the Timer Statistics chart measurements.
You can also refresh the statistics at any time by clicking on the Clear button. This
will refresh the Station Timer Stats window to collect new network statistics. (The
time under the Clear button will also update, indicating the last time that the
Timer Stats box was cleared.)
3-22 Port Level Statistics
Page 79

The Timer Statistics chart automatically updates within the time interval you
have set. Set the time interval to update information (from 1 second to 23 hours,
59 minutes, 59 seconds) by usin g the clock symbol at the bottom of the window.
See Setting the Statistics Poll Interval, page 3-3, for details.
Station Timer Statistics Window Fields
The Timer Sta tistics window fields display the diffe rent network even ts measured
by the Timer Statistics chart. The following Timer Statistics window fields appear
for the network:
Frames
Displays the elapsed, average, and peak levels of good frames generated by the
station attached to the port.
Errors
Displays the elapsed, average, and peak levels of errors received by the station
port.
KBytes
Displays the elapsed, average, and peak levels of kilobytes processed by the
station port.
Token Ring Statistics
Port Performance Graphs
Port Performance Graphs (Figure 3-13) provide real-time statistics reporting. The
color-coded strip charts allow you to visually track the perform anc e of the
selected station. Each strip chart graph shows you the amount of traffic going
through the station port, as well as the number of errors experienced at the
particular port.
Directly above the graph, three fields identify the currently selected port by its
board and port index and its MAC address.
Port Level Statistics 3-23
Page 80

Token Ring Statistics
Figure 3-13. Station Port Performance Graph
The graph has an x axis that indicates the 60 second interval over which charting
occurs continuously, while the y axis measures the amount of traffic or errors that
are processed by the station port.
Using the Total Errors button (with the red square marker to its left) at the bottom
of this window, you can choose whether or not to monitor the total errors
detected at the station port (its pull-down menu offers Total Errors or Nothing Total Errors is selected by default). When you click on the Total Errors button, its
pull-down menu will appear. If you change the parameters, the Performance
Graph will refresh, and the button label will change to reflect the selection.
Using the Traffic button (with the blue square marker to its left) at the bottom of
this window, you can select the way you wish to view the traffic rate (Frames,
Percent Load, or Nothing - Frames is selected by default). When you click on the
Traffic button, its pull-do wn menu will appear. If you change the parameters, the
Performance Graph will refresh, and the button label will change to reflect the
selection.
Port Performance Graph Statistics
The Port Performance Graph contains the following statistics:
Total Errors (Red)
Total Errors The total number of soft errors of any kind processed by
the station port.
Nothing The Total Errors scale is not currently measuring the
number of errors coming through the station port.
3-24 Port Level Statistics
Page 81

Traffic (Blue)
Frames The total number of good frames transmitted and
Percent Load Reflects the network load generated by the station port
Nothing The Traffic scale is not currently measuring th e traffic or
Configuring the Port Performance Graph
1. Click on the Total Errors button (with the red square marker to its left). The
Total Errors pull-down menu will appear.
2. Click on the desired Total Errors mode (To tal Errors or Nothing). The mode
you have chosen will appear in the button. The Performance Graph will
refresh and begin to measure using the new mode.
3. Click on the Traffic button (with the blue square marker to its left). The Traffic
pull-down menu will appear.
Token Ring Statistics
received by the station port.
compared to the theoretical maximum load (4 or 16
Mbits/sec.) of a Token Ring Network.
load processed by the station port.
4. Click on the desired Traffic mode (Frames, Percent Load, or Nothing). The
mode you have chosen will appear in the button. The Performance Graph will
refresh and begin to measure using the new mode.
The Performance Graph will now monitor the station port using the user-defined
mode. (Click on Cancel to stop monitoring and exit the screen.)
Port Level Statistics 3-25
Page 82

Token Ring Statistics
3-26 Port Level Statistics
Page 83

Chapter 4
Token Ring Alarms
The ring-level Alarm Limits window; setting alarm limits for network events; accessing the Station
Alarm Limits window; setting station-level alarm limits
Alarms work in conjunction with NetSight Element Manager to inform you when
certain defined thresholds have been reached. Using the Chassis View Network
menu, you can configure and set ring-level alarms for network events, or
ring-level station alarms which apply to all stations on a ring. Through the
Chassis View Station Port menus, the Station List window, and the Station Map,
you can configure and set station-level alarms for individual stations on a ring.
Ring-Level Alarm Limits
When you access the Alarm Limi ts wi ndo w (Figure 4-1) from the Network menu,
you can configure and set alarms to be notified of ring errors and events in
NetSight Element Manager’s Alarm Log facility.
To receive alarms at your N etSight Element Manage r station, its IP address must be
NOTE
entered into the MicroMMAC-T’s Trap Table via local man agement. or the Remote
Administration Tools application. Please refer to the Remote Admini stration Tools
User’s Guide and/or the L ocal Management Guide for your device if you need further
information. For information on opening NetSight Element Manager’s alarm logging
facility, refer to the Alarm and Event Handling User’s Guide.
4-1
Page 84

Token Ring Alarms
Accessing the Alarm Limits Window
To access the Alarm Limits window from the Chassis View window:
1. Click to display the N
2. In the Network pull-down menu, click on the Network 1
and down to select A
appear.
3. Set the alarm limits as instructed in Setting Ring-Level Alarm Limits, below.
etwork pull-down menu.
entry, then drag right
larm Limits.... The Alarm Limits window (Figure 4-1) will
Figure 4-1. The Alarm Limits Window
Ring-Level Alarm Limits for Network Events
The following thresholds, listed in the section of the window labeled Ring Errors,
are based on the number of occurrences of the selected event on the ring within a
user-defined time interval.
Ring Purges The number of times (since the ring network was created
or the MicroMMAC-T was last reset) that the ring’s
active monitor can purge the ring (including purges at
the end of the active monitor selection process). Note that
the ring purge count is not reset when the active monitor
changes. The default value is 70.
AMP The number of times that a duplicate active monitor can
be detected on a ring within the alarm time base before
an alarm is triggered.
The default value is 1.
4-2 Ring-Level Alarm Limits
Page 85

Token Ring Alarms
Token Errors The threshold of errors requiring the management
station (while acting as the act ive monitor) to transmit a
token onto the monitored ring before it issues an alarm.
The default value is 10.
Claim Token The number of times that a claim token can be released
by ring stations within the given time base before an
alarm is triggered. A claim token is released by a ring
station when it detects that the active monitor is absent
or malfunctioning. Stations receiving the claim token will
participate in the monitor contention process to
determine a new active monitor. The default value is 5.
Lost Frame The number of lost frames that the management station
transmits onto the monitored ring before triggering an
alarm. Lost frames are frames that do not return before
the management station’s Timer Return to Repeat (TRR)
timer expires. These can be caused by stations entering or
leaving the ring during frame transmission. The default
value is 10.
Frame Count The number of frames that can be transmitted on the ring
within the time base before the alarm limit is reached.
Beacon The number of beacons that can be detected on the ring
Ring-Level Station Alarms
When you set a ring-level station alarm (using the fields in the section of the
window labeled Station Errors), the alarm threshold will be applied to all stations
inserted into the currently monitored ring network. These values will override
any pre-set station-level alarms, so these fields can be used to quickly apply one
set of station-level alarm limits to all stations on the ring.
For a network running at 16 Mbits/sec, the default value
is 33,890. This number represents the maximum
bandwidth used by 64 byte frames transmitted over the
network during the default 10 second alarm time bas e .
For a network running at 4 Mbits/sec, the default value
is 18,920 (of 64 byte frames).
within the time base before the alarm limit is reached. A
station transmits a beacon when its monitor contention
timer expires, indicating that an Active Monitor could
not be elected. Beaconing provides a method for the
beaconing station and its NAUN to check their lobe
wiring and to begin the monitor contention process if
necessary. The default value is 1 .
Ring-Level Alarm Limits 4-3
Page 86

Token Ring Alarms
NOTE
When the Alarm Limits window is invoked, the Station Errors fields do not present any
values. This is because it is possible that station-leve l alarm limits have been set at
individual stations (via the Station Alarm Limits window) that may differ from those set
at other individual stations or at the ring level. Refer to the Station Alarm Limits
windows for individual stations to view their current station-level alarm lim its.
The following thresholds, listed in the section of the window labeled Station
Errors, are based on the number of occurrences of the selected event detected by
the station within a user-defined time interval.
Line The threshold of line errors detected by the selected
station port. These indicate a non-data bit between the
starting and ending delimiters of data, or an FCS error.
The default value is 2.
Internal The threshold of recoverable internal errors detected by
the selected port, indicating that the Network Interface
Card of its attached station may be in marginal operating
condition. The default value is 1.
Burst The threshold of burst errors detected by the selected
station port. These signify a bit information-encoding
error (no tran sitions between 0 and 1 over five half-bit
times). The default value is 10.
A.C. The threshold of frames detected by the selected station
port that contain errors in the A or C bits. The default
value is 2.
Rx Congestion The threshold at which the port cannot copy a frame
addressed to it because of a lack of internal buffering .
The default value is 124.
Setting Ring-Level Alarm Limits
To set an alarm:
1. If you wish to alter the default threshold values, place the text cursor into the
desired alarm event field, and type in the threshold value.
2. To enable an alarm, click on the checkbox next to the desired alarm event
field. An X in the checkbox indicates that the alarm is enabled.
3. Click on the clock icon next to the Within: field. A New Alarm Timebase text
box will appear. In this text box, you enter the time interval for the specified
number of events to occur before the alarm is activated.
4-4 Ring-Level Alarm Limits
Page 87

NOTE
Token Ring Alarms
The time interval set using the New Alarm Timebase textbox will apply to all alarms set
in the Alarm Limits and Station Alarm Limits windows. The timebase needs only to be
set once to apply to all alarms. You do not need to set the timebase for each separate alarm.
4. Highlight the hour, minute, or second field, and type the desired interval in
each (or click the cursor in the desired field, and click on the appropriate arrow
to scroll the interval up or down). Note that the minimum possible time interval
is 10 seconds. Any lower time interval entered will default back to the last
acceptable time entered.
5. Click on OK to return to the Alarm Limits window.
6. To enable any ring-level alarms you have selected for the device, click on
Apply Ring Changes. To enable any ring-level station alarms selected for the
device, click on Apply Stn. Changes. Note that if you have set a ring-level
station alarm, pop-up messages will inform you as each station is set.
Click on Reset Defaults to restore the default alarm thresholds.
Your MicroMMAC-T alarm limits are now set. When an alarm threshold is
exceeded, an alarm will be generated. To view a list of the alarms, check NetSight
Element Manager’s alarm logging facility . Refer to the Alar m and Eve nt Hand ling
User’s Guide for more information on viewing the alarm logging facility.
Station-Level Alarm Limits
You may also set Station-level alarm limits for individual stations on the currently
monitored ring network via the Chassis View Station Port menus, the Station List
window, or the Station Map. Note that setting Station-level alarms using the
Station Alarm Limits window will override any pre-set station alarms. See
Chapter 5, The Station List and Station Map, for more information on the Stat ion
List window and the Station Map.
Accessing the Station Alarm Limits Window from the Port Menu
To access the Station Alarm Limits window via the Chassis View Station Port
menu:
1. In the Chassis View window, click on any inserted station port on one of the
board displays. The Port pull-down menu will appear.
2. Click on Alarm Limits.... The Station Alarm Limits window (Figure 4-2) will
appear.
3. Set the station alarm limits as instructed in the Setting Station-Level Alarm
Limits section, below.
Station-Level Alarm Limits 4-5
Page 88

Token Ring Alarms
Accessing the Station Alarm Limits Window from the Station List
To access the Station Alarm Limits window via the Station List window:
1. Click to display the N
2. In the Network pull-down menu, click on the Network 1
and down to select Station List. The Station List window will appear.
3. Click on the Alarm Limits radio button in the lower left of the window.
4. Double-click on the station for which you want to set alarms. The station will
be highlighted to show it is selected. The Station Alarm Limits window
(Figure 4-2) will appear.
5. Set the station alarm limits as instructed in the Setting Station-Level Alarm
Limits section, below.
etwork pull-down menu.
entry, then drag right
Accessing the Station Alarm Limits Window from the Station Map
To access the Station Alarm Limits window via the Station Map:
1. Click to display the N
2. In the Network pull-down menu, click on the Network 1
and down to select Station Map. The Station Map will appear.
3. Click on the station icon in the map representing the station for which you
wish to set station alarm limits. The Station Command menu will appear.
etwork pull-down menu.
entry, then drag right
4. In the Station Command menu, click on A
Limits window (Figure 4-2) will appear.
5. Set the station alarm limits as instructed in the Setting Station-Level Alarm
Limits section, below.
larm Limits.... The Station Alarm
4-6 Station-Level Alarm Limits
Page 89

Figure 4-2. The Station Alarm Limits Window
Token Ring Alarms
Setting Sta tion-Level Alarm Limits
To set an alarm for an individual station on the ring:
1. Place the text cursor into the desired alarm event field, and type in the
threshold value.
2. To enable an alarm, click on the checkbox next to the desired alarm event
field. An X in the checkbox indicates that the alarm is enabled.
3. Click on the clock icon next to the Within: field. A New Alarm Timebase text
box will appear. In this text box, you enter the time interval for the specified
number of events to occur before the alarm is activated.
The time interval set using the New Alarm Timebase textbox will apply to all alarms set
NOTE
in the Station Alarm Limits window. The timebase needs only to be set once to apply to all
alarms for the station. You do not need to set the timebase for each separate alarm.
4. Highlight the hour, minute, or second field, and type the desired interval in
each (or click the cursor in the desired field, and click on the appropriate arrow
to scroll the interval up or down). Note that the minimum possible time interval
is 10 seconds. Any lower time interval entered will default back to the last
acceptable time entered. Click on OK to return to the Alarm Limits window.
5. Click on OK to enable all selected alarms for the station.
Click on Reset Defaults to restore the default alarm thresholds.
Station-Level Alarm Limits 4-7
Page 90

Token Ring Alarms
Your station alarm limits are now set. When an alarm threshold is exceeded, an
alarm will be generated. To view a list of the alarms, check NetSight Element
Manager’s alarm logging facility. Refer to the Alarm and Event Handling User’s
Guide for more information on viewing the alarm logging facility.
4-8 Station-Level Alarm Limits
Page 91

Chapter 5
The Station List and Station Map
The Station List window and fields; viewing station statistics; removing a station from the ring; the
Station Map; the Station Command menu; manipulating the Station Map
The Station List window conveniently allows you to view statistics and configure
the stations on the currently monitored ring network.
The Station Map graphically illustrates the ring configuration in downstream
neighbor order from the currently monitored MicroMMAC-T, and provides
address information for individual stations inserted into the ring.
Both windows also allow you to access statistics, timer statistics, and performance
graphs for each inserted ring station (including the MicroMMAC-T’s onboard
management station), and also remove stations from the ring.
You can also set alarm limits for individual stations through the Station List and
Station Map wi ndows.
The Station List Window
At the MicroMMAC-T Station List window (Figure 5-1), you can view each
station on the ring network supported by the MicroMMAC-T (including stations
physically attached to another device that are on the ring) in ring order starting
from the MicroMMAC-T’s management station. Using this window , you can view
statistics for each station on the monitored ring, as well as temporarily remove a
station port from the ring network, and set alarm limits for individual stations.
To access the Station List window, select Station L
on the MicroMMAC-T Chassis View window.
ist... from the Network menu
5-1
Page 92

The Station List and Station Map
Figure 5-1. The Station List Window
Station List Window Fields
The Station List window contains the following fields:
General Fields
Active Monitor
The physical address of the current active monitor on the ring you are monitoring.
Note this address always displays in Canoni cal format.
Number of Nodes/Stations
The number of stations inserted into the ring that you are monitoring.
Address Mode
The Address Mode display of the listed stations, as selected by the MAC button at
the bottom of the window. This field displays either MAC (Ethernet format) or
Canonical (Token Ring format). Note that the label on the Address Mode button
will display the address mode not currently in use.
5-2 The Station List Window
Page 93

Station Fields
The Station List and Station Map
# (Station Number)
The numerical order of the station in downstream relation from the
MicroMMAC-T management station.
MAC Address
The address of the station in Token Ring (Canonical) or Ethernet (MAC) format.
Name
The name assigned to the station through remote management. You can assign
this name via the Station Statistics window, as described in the Token Ring
Statistics chapter of this guide.
Board
The board index to which the station is attached. If a station is not attached to the
MicroMMAC-T, this field will list “unknown,” since no link is detected to the
MicroMMAC-T itself.
Port
The port index into which the station is inserted. Note that if the station is not
attached to the MicroMMAC-T, this field will list “unknown,” since no link is
detected to the MicroMMAC-T itself.
Total Soft Errors
The total number of soft errors detected by the station.
Viewing Station Statistics
To view Sta tistics for a station:
1. Click on the Statistics radio button at the bottom left of the window.
2. Double-click on the station for which you want to view Statistics. The station
will be highlighted to show it is selected. The TR Management Station
Statistics window will appear if you have selected the MicroMMAC-T, or the
Station Statistics window will appear if you have selected a ring station.
For a complete explanation of these windows, refer to The TR Management
Station Statistics Wi ndow and The Station Statistics W indow, in the Token Ri ng
Statistics chapter of this guide.
The Station List Window 5-3
Page 94

The Station List and Station Map
Viewing Station Timer Statistics
To view Station Timer Statistics:
1. Click on the Timer Statistics radio button at the bottom left of the window.
2. Double-click on the station for which you want to view Timer Statistics. The
station will be highlighted to show it is selected, and the Station Timer
Statistics window will appear.
For a complete explanation of this window, refer to The Station Timer Statistics
Window, in the Token Ring Statistics chapter of this guide.
Note that you can also view Timer Statistics for the MicroMMAC-T Management
Station via this me thod.
Removing a Station from the Ring
When you use the Remove radio button, the MicroMMAC-T sends a Remove
MAC Frame to the selected station. Upon receiving this frame, the station will
perform a loopback test to verify that its MAC adapter is functioning correctly.
If the station fails the loopback test, it will stay off the ring. If it passes the test, its
actions will depend on the adapter ’s manufacturer. Cabletron DNI cards (and
some others) will reinsert into the ring automatically. IBM adapters (and others)
will remove themselves from the ring until the station is re-booted.
Note that you cannot remove the MicroMMAC-T Management Station from th e
ring.
To remove a station from the monitored ring:
1. Click on the Remove r adio button in the lower left of the window.
2. Double-click on the station which you want to remove from the ring. The
station will be highlighted to show it is selected. The selected station will be
removed from the ring network, and the port will switch to Link condition.
Setting Station Alarms
Using the Alarm Limits radio button you can invoke the Station Alarm Lim its
window, where you can configure and set alarms that will notify your
management station of specified levels of errors reported by individual stations
on your ring network.
5-4 The Station List Window
Page 95

To invoke the Station Alarm Limits window:
1. Click on the Alarm Limits radio button at the bottom left of the window.
2. Double-click on the station for which you want to set the alarm limits. The
station will be highlighted to show it is selected. The Station Alarm Limits
window will appear.
Refer to Chapter 4, Token Ring Alarms, for full information on setting station
alarm limits.
Viewin g the Station Port Performance Graph
Using the Performance Graph radio button you can invoke the Port Performance
Graph, which provides real-time statistics reporting. The color-coded strip charts
allow you to visually track the performance of the selected station. Each strip
chart graph shows you the amount of traffic going through the station port, as
well as the number of errors experienced at the particular port.
To view a station’s performance graph:
The Station List and Station Map
1. Click on the Performance Graph radio button at the bottom left of the
window.
2. Double-click on the station for which you want to view the performance graph.
The station will be highlighted to show it is selected. The Port Performance
Graph will appear.
Refer to Chapter 3, Token Ring Statistics, for full information on viewing the Port
Performance Graph.
Using the MAC/Canonical Button
To switch the station address display between MAC (Ethernet) and Canonical
(Token Ring) format, click on the MAC/Canonical button at the bottom of the
window. The address field of each listed station will reflect the current selection.
Note that the button itself will display the address mode not currently in effect.
Printing the Station List
To print the contents of the Station List, click on the Print button at the bottom of
the screen. An ASCII file containing the number, address, name, board and port
index, and error information will be spooled to the Microsoft Windows print
manager.
The Station List Window 5-5
Page 96

The Station List and Station Map
Resetting Counters
To reset all error and performance counters for the current ring managed by the
MicroMMAC-T, click on the # (Station Number) symbol atop the station index
number column. A dialog box will appear showing the last reset time (if any) and
“Reset All Counters Now?”. Click on OK to reset the counters. The error and
performance counters will be reset to their initial values.
This will reset all Network Statistics counters to zero (for statistics gathered from
all stations on the currently monitored ring that are attached to the
MicroMMAC-T-controlled hub). It will also reset individual stations’ error and
performance counters (seen in the Station Statistics windows) for stations
attached to the currently monitored ring.
Although statistics are only reset for the stations attached to the currently
monitored hub, the reset will be reflected in all station lists for a ring spanning
more than one hub.
Resetting the counters effectively “wipes” the error history of the MicroMMAC-T since it
!
CAUTION
was last reset. Be aware of others monitoring the ring.
The Station Map
The Station Map window (Figure 5-2) graphically illustrates the ring
configuration in downstream neighbor order with respect to the currently
monitored module, and displays address information for individual stations
inserted into the ring. It also allows you to access statistics or timer statistics for
each inserted ring station, including the MicroMMAC-T’s onboard management
station. You can also use the window to remove stations from the ring, and set
station alarm limits.
5-6 The Station Map
Page 97

The Station List and Station Map
Figure 5-2. The Station Map Window
Note that this map will update automatically to reflect a change in th e ring
network (e.g., a station removing itself from or inserting into the ring).
To access the Station Map, select Station M
MicroMMAC-T Chassis View window. The Station Map window will appear.
Station Map Window Fields
Active Monitor
Indicates the physical address of the Active Monitor on the ring. Note this address
always displays in Canonical format.
Number of Nodes
Indicates the number of stations currently inserted into the ring.
Address Mode
The Address Mode display of the map stations, as selected by the MAC button at
the bottom of the window. This field displays either MAC (Ethernet format) or
Canonical (Token Ring format). Note that the label on the Address Mode button
will display the address mode not currently in use.
ap... from the Network menu on the
The Station Map 5-7
Page 98

The Station List and Station Map
Viewing the Station Map
The Station Map window displays your ring in a sc rollable panel.
The ring is represented by a single ellipse, with arrows indicating the ring
direction. If the default size of the window is sufficient for the number of stations,
the ellipse is sized to fit within the panel. However, in a ring with many stations,
the size of the ellipse may exceed the window’s default size. In this case, you can
use the scroll bar to access stations which are out of view, or resize the window.
Each node is graphically represented, in ring order, by a square on the ring. The
squares are color coded, with the black square representing the MicroMMAC-T
management station, and green squares indicating inserted ring stations.
The selected MicroMMAC-T is initially presented in one of two positions.
• If the entire rin g fits in the display panel, the MicroMMAC-T is r epresented by
the topmost (12 o’ clock) station square.
• If the ring exceeds the panel size, the MicroMMAC-T is represented by the
rightmost (3 o’ clock) station square.
The MicroMMAC-T’s downstream neighbors are displayed in order, in a
clockwise rotation from the management module. Upstream stations are
displayed counterclockwise.
Using the mouse, you can access text boxes (see Figure 5-3) which display address
information for the selected station and its neighbors. The mouse also brings up a
command menu for the station.
Station Pop-up Text Boxes
Station pop-up text boxes display address information for stations on the
network. To activate a station text box, use the mouse as follows:
1. Move the mouse to position the cursor over the desired station.
2. Depress the left mouse button to activate a te xt box for the statio n. A line will
appear linking the text box to its station.
5-8 The Station Map
Page 99

The Station List and Station Map
Figure 5-3. Station Map with Text Boxes
3. To position the station text box in the ring map, drag the mouse while
depressing the left button. The station text box will reposition in the panel in
relation to the cursor drag.
Once you position the station text box as desired, release the left button to fix it in
place.
You can make an active text box disappear by positioning the cursor on the box,
and pressing the left mouse button.
Each station text box contains the following information:
Name
The name assigned to the station through remote management. This field will
appear empty if a name has not been assigned. You can assign this name via the
Station Statistics window , as described in the Token Ring Statistics chapter of this
guide.
Dn
The physical address of the selected node’s downstream neighbor, if available.
Node Address
The physical address of the selected node.
Up
The physical address of the selected node’s upstream neighbor, if available.
The Station Map 5-9
Page 100

The Station List and Station Map
The Station Command Menu
You can also use the mouse to bring up a command menu, whi c h will allow you
to access Statistics or Timer Statistics specific to the selected station, as well as
remove the station from the ring, and invoke the Station Alarm Limits window.
If you double-click the left mouse button with the cursor positioned over the
desired station, the pop-up command menu will appear with the following
options.
Statistics
Click on this option to bring up the Stati on Statistics window if a ring station is
selected, or the TR Mgmt Station Statistics window if the MicroMMAC-T
Management Station is selected. Refer to the Token Ring Statistics chapter for
information on these windows.
Timer Statistics
Click on this option to bring up the Stati on Timer Statistics Windo w if a ring
station is selected, or the Ti mer Statistics window for the MicroMMAC-T’s
onboard management station, if it is selected. Refer to the Token Ring Statistics
chapter for information on these windows.
Remove
Click on this option to remove the selected station from the ring so that it can
perform a loopback test. When you click this button, the MicroMMAC-T sends a
Remove MAC Frame to the selected station. Upon receiving this fram e, th e
station will perform a loopback test to verify that its MAC adapter is functioning
correctly.
If the station fails the loopback test, it will stay off the ring. If it passes the test, its
actions will depend on the manufacturer of the adapter car d. Cabletro n DNI cards
(and some others) will reinsert into the ring automatically. IBM adapter cards
(and others) will remove themselves from the ring until the station is re-booted.
Note that you cannot remove the MicroMMAC-T Management Station from th e
ring, so this option is grayed-out when the MicroMMAC-T is selected.
Alarm Limits
Click this selection to bring up the Stati on Alarm Limits window to set alarms at
individual ring stations. Refer to the Token Ring Alarms chapter for full
information on setting st ation alarm limits.
Performance Graph
Click this selection to invoke the Station Port Performance Graph, which allows
you to visually track the performance of the selected station. Refer to the Token
Ring Statistics chapter for details on the Station Port Performance Graph.
5-10 The Station Map
 Loading...