

Page 1

ATX User’s Guide
Page 2

Page 3

Notice
Enterasys reserves the right to make changes in specifications and other information contained in this
document without priornotice. The reader should in all cases consult Enterasys to determine whether
any such changes have been made.
The hardware, firmware, or software described in this manual is subject to change without notice.
IN NO EVENT SHALL ENTERASYS BE LIABLE FOR ANY INCIDENTAL, INDIRECT, SPECIAL, OR
CONSEQUENTIAL DAMAGES WHATSOEVER (INCLUDING BUT NOT LIMITED TO LOST
PROFITS) ARISING OUT OF OR RELATED TO THIS MANUAL OR THE INFORMATION
CONTAINED IN IT, EVEN IF ENTERASYS HAS BEEN ADVISED OF, KNOWN, OR SHOULD HAVE
KNOWN, THE POSSIBILITY OF SUCH DAMAGES.
Virus Disclaimer
Enterasys has tested its software with current virus checking technologies. However, because no antivirus system is 100% reliable, we strongly caution you to write protect and then verify that the
Licensed Software, prior to installing it, is virus-free with an anti-virus system in which you have
confidence.
Enterasys makes no representations or warranties to the effect that the Licensed Software is virus-free.
Copyright 2000 by Enterasys, Inc. All rights reserved.
Printed in the United States of America.
Order Number: 9031891-03 April 2000
Enterasys, Inc.
P.O. Box 5005
Rochester, NH 03866-5005
Enterasys, NetSight and Matrix E7 are trademarks of Enterasys. Cabletron Systems, SPECTRUM,
BRIM, DNI, FNB, INA, Integrated Network Architecture, LANVIEW, LANVIEW Secure, Multi
Media Access Center, MiniMMAC, and TRMM are registered trademarks, and Bridge/Router
Interface Modules, BRIM-A100, CRBRIM-W/E, CRXMIM, CXRMIM, Desktop Network Interface,
Distributed LAN Monitoring, Distributed Network Server, DLM, DNSMIM, E1000, E2000, E3000,
EFDMIM, EMM-E6, EMME, EPIM, EPIM-3PS, EPIM-A, EPIM-C, EPIM-F1, EPIM-F2, EPIM-F3,
EPIM-T, EPIM-T1, EPIM-X, ESXMIM, ETSMIM, ETWMIM, FDCMIM-04, FDCMIM-08, FDMMIM,
FDMMIM-04, Flexible Network Bus, FOMIM, FORMIM, HubSTACK,IRBM, IRM, IRM-2, IRM-3,
Media Interface Module, MicroMMAC, MIM, MMAC, MMAC-3, MMAC-3FNB, MMAC-5,
MMAC-5FNB, MMAC-8, MMAC-8FNB, MMAC-M8FNB, MMAC-Plus, MRX, MRXI, MRXI-24,
MultiChannel, NB20E, NB25E, NB30, NB35, NBR-220/420/620, RMIM, SecureFast Switch,
SecureFast Packet Switching, SFS, SFPS, SPECTRUM Element Manager, SPECTRUM for Open
Systems, SPIM-A, SPIM-C, SPIM-F1, SPIM-F2, SPIM-T, SPIM-T1, TPMIM, TPMIM-22,
TPMIM-T1, TPRMIM, TPRMIM-36, TPT-T, TRBMIM, TRMM-2, TRMMIM, and TRXI are
trademarks of Cabletron Systems, Inc.
i
Page 4

AppleTalk, Apple, Macintosh, and TokenTalk are registered trademarks; and Apple Remote Access
and EtherTalk are trademarks of Apple Computer, Inc.
SmartBoost is a trademark of American Power Conversion
ST is a registered trademark and C++ is a trademark of AT&T
Banyan and VINES are registered trademarks of Banyan Systems, Inc.
cisco, ciscoSystems, and AGS+ are registered trademarks; and cBus, cisco Router, CRM, IGS, and MGS
are trademarks of cisco Systems, Inc.
GatorBox is a registered trademark; and GatorMail, GatorMIM, GatorPrint, GatorShare, GatorStar,
GatorStar GX-M, and XGator are trademarks of Cayman Systems, Inc.
CompuServe is a registered trademark of CompuServe Incorporated
X Window System is a trademark of Consortium, Inc.
CTERM, DECnet, and ULTRIX are registered trademarks; and DEC, DEC C++, DECnet-DOS,
DECstation, VAX DOCUMENT, VMA, and VT are trademarks of Digital Equipment Corporation
Fore Systems, ForeRunner, and ForeRunner ASX-100 are trademarks of Fore Systems, Inc.
PC/TCP is a registered trademark of FTP Software, Inc.
HP OpenView is a registered trademark of Hewlett-Packard, Inc.
AIX, IBM, OS/2, NetView, and PS/2 are registered trademarks; and AT, Micro Channel, PC, PC-DOS,
PC/XT, Personal Computer AT, Operating System/2, Personal System/2, RISC System/6000, and
Workplace Shell are trademarks of International Business Machines Corporation
i960 microprocessor is a registered trademark; and Intel and Multichannel are trademarks of Intel
Corporation
Microsoft, MS-DOS, and Windows are registered trademarks of Microsoft Corporation
Chameleon, ChameleonNFS, Chameleon 32, IPX/link, and NEWT are trademarks of
NETMANAGE, Inc.
NetWare and Novell are registered trademarks; and Internetwork Packet Exchange (IPX), IPX, and
Network File System (NFS) are trademarks of Novell, Inc.
Motif and MS are registered trademarks; and Open Software Foundation, OSF,OSF/1, and OSF/Motif
are trademarks of The Open Software Foundation, Inc.
Silicon Graphics and IRIS are registered trademarks; and Indigo and IRIX are trademarks of Silicon
Graphics, Inc.
NFS, PC-NFS, SPARC, Sun Microsystems, and Sun Workstation are registered trademarks; and
OpenWindows, SPARCstation, SPARCstation IPC, SPARCstation IPX, Sun, Sun-2, Sun-3, Sun-4,
Sun386i, SunNet, SunOS, SunSPARC, and SunView are trademarks of Sun Microsystems, Inc.
OPEN LOOK and UNIX are registered trademarks of Unix System Laboratories, Inc.
Ethernet, NS, Xerox Network Systems and XNS are trademarks of Xerox Corporation
ii
Page 5

ANNEX, ANNEX-II, ANNEX-IIe, ANNEX-3, ANNEX-802.5, MICRO-ANNEX-XL, and MICROANNEX-ELS are trademarks of Xylogics, Inc.
MAXserver and Xyplex are trademarks of Xyplex, Inc.
Restricted Rights Notice
(Applicable to licenses to the United States Government only.)
1. Use, duplication, or disclosure by the Government is subject to restrictions as set forth in
subparagraph (c) (1) (ii) of the Rights in Technical Data and Computer Software clause at DFARS
252.227-7013.
Enterasys, Inc., 35 Industrial Way, Rochester, New Hampshire 03867-0505.
2. (a) This computer software is submitted with restricted rights. Itmay not be used, reproduced, or
disclosed by the Governmentexcept as provided in paragraph (b) ofthis Notice or asotherwise
expressly stated in the contract.
(b) This computer software may be:
(1) Used or copied for use in or with the computer or computers for which it was acquired,
including use at anyGovernment installation towhich such computer orcomputers may
be transferred;
(2) Used or copied for use in a backup computer if any computer for which it was acquired
is inoperative;
(3) Reproduced for safekeeping (archives) or backup purposes;
(4) Modified, adapted, or combined with other computer software, provided that the
modified, combined, or adapted portions of the derivative software incorporating
restricted computer software are made subject to the same restricted rights;
(5) Disclosed to and reproduced for use by support service contractors in accordance with
subparagraphs (b) (1) through (4) of this clause, provided the Government makes such
disclosure or reproduction subject to these restricted rights; and
(6) Used or copied for use in or transferred to a replacement computer.
(c) Notwithstanding the foregoing, if this computer software is published copyrighted computer
software, it is licensed to the Government, without disclosure prohibitions, with the minimum
rights set forth in paragraph (b) of this clause.
(d) Any other rights or limitations regarding the use, duplication, or disclosure of this computer
software are to be expressly stated in, or incorporated in, the contract.
(e) This Notice shall be marked on any reproduction of this computer software, inwhole or in part.
iii
Page 6

iv
Page 7

Chapter 1 Introduction
Using the ATX Switch User’s Guide.......................................................................... 1-2
Related Manuals............................................................................................................ 1-2
Software Conventions.................................................................................................. 1-3
Common ATX Switch Window Fields................................................................ 1-3
Using Window Buttons......................................................................................... 1-4
Getting Help .................................................................................................................. 1-5
Using On-line Help................................................................................................ 1-5
Getting Help from the Global Technical Assistance Center ............................1-5
Chapter 2 The ATX Switch Chassis View
Viewing Chassis Information......................................................................................2-2
Front Panel Information........................................................................................ 2-3
Menu Structure.......................................................................................................2-4
Port Status Displays............................................................................................... 2-7
Selecting a Port Status View.......................................................................... 2-8
Port Status Color Codes.................................................................................2-9
The Chassis Manager Window..........................................................................2-10
Viewing Hardware Types ................................................................................... 2-10
Interface Description.................................................................................... 2-11
Managing the Hub...................................................................................................... 2-12
IPX Routing........................................................................................................... 2-12
Configuring IPX Routing on a port............................................................ 2-13
Selecting the Frame Type for a Port...........................................................2-13
IP Routing ............................................................................................................. 2-14
Configuring the IP Address Table..............................................................2-15
Configuring IP Routing on a Port .............................................................. 2-15
Port Configuration...............................................................................................2-16
Bridge Port Configuration.................................................................................. 2-17
Setting the Bridge Mode.............................................................................. 2-18
Transmitting BPDUs..................................................................................... 2-19
Source Route Configuration........................................................................ 2-19
Spanning Tree Explorer Modes...................................................................2-19
Setting the Spanning Tree Explorer Mode......................................... 2-20
Token Ring Translation ................................................................................ 2-20
Using the Find Source Address Feature...........................................................2-23
Contents
v
Page 8

Contents
Viewing I/F Summary Information..................................................................2-23
Interface Performance Statistics/Bar Graphs...........................................2-25
Viewing Interface Detail..............................................................................2-26
Making Sense of Detail Statistics.........................................................2-28
Enabling and Disabling Ports.............................................................................2-29
Administratively Enabling and Disabling Ports......................................2-29
Chapter 3 Using ATX Trunking
The Port Trunking Window.........................................................................................3-2
Enabling and Disabling Trunking .......................................................................3-4
Chapter 4 Using ATX Port Filtering
Port Filters Table Information......................................................................................4-3
Editing the Port Filters Table....................................................................................... 4-4
Adding a New Filter..............................................................................................4-5
Deleting a Port Filter............................................................................................4-10
Viewing Filter Statistics..............................................................................................4-10
Chapter 5 Workgroup Configuration
Configuring a Workgroup............................................................................................5-4
Deleting a Workgroup...........................................................................................5-5
Chapter 6 ATX Port Mirroring
The Port Mirroring Window........................................................................................6-2
Configuring Port Mirroring..................................................................................6-3
If the port(s) being mirrored and the diagnostics port are both local.....6-4
If the port(s) being mirrored are remote......................................................6-4
From the device where the mirrored ports are located......................6-4
Chapter 7 IPX Routing Tables
IPX Statistics................................................................................................................... 7-2
IPX Interface............................................................................................................7-2
IPX Route.................................................................................................................7-3
IPX SAP ...................................................................................................................7-4
Index
vi
Page 9

Chapter 1
Introduction
How to use this guide; related guides; software conventions;getting help; ATXSwitch firmware version
information
Welcome to the NetSight Element Manager for the ATX User’s Guide. We have
designed this guide to serve as a simple reference for using NetSight Element
Manager for the ATX Switch.
The ATX Switch comprises a five-slot chassis along with a high-capacity Packet
Processing Engine (PPE), which occupies an additional top slot. The ATX Switch
is a multiprotocol LAN switch that enables high-bandwidth switching between
Ethernet, Token Ring, FDDI and 100Base-T LANs, with full connectivity to ATM.
The PPE uses a dual RISC processor design combined with specialized switching
hardware to provide wire-speed performance, the intelligence to manage the
bandwidth gained through switching, and the ability to perform core switching
functions (e.g., bridging, routing, programmable filtering, and statistics
gathering).
Up to five modules in any combination can be installed in the ATX Switch chassis,
including Ethernet, Token Ring, FDDI, Fast Ethernet, and ATM modules. The
individual modules, each with at least one RISC CPU of its own, handle interface
control and translation functions at the port level.
The ATX, with its 1.6 Gbps internal bandwidth, combined with each LAN
module’s 400 Mbps bandwidth, offers a total system bandwidth exceeding 3.6
Gbps.
1-1
Page 10

Introduction
Using the ATX Switch User’s Guide
Each chapter in this guide describes one major functionality or a collection of
several smaller functionalities of the ATXSwitch. This guide contains information
about software functions which are accessed directly from the device icon; for
information about functions which are accessed via the NetSight Element
Manager platform, consult the User’s Guide and Tools Guide both of which are
included in this package.
Chapter 1, Introduction, provides a list of related documentation, describes
certain software conventions, and shows you how to contact the Enterasys Global
Call Center.
Chapter 2, The ATX Switch Chassis View, describes the visual display of the ATX
Switch and explains how to use the mouse within the Chassis View;the operation
of enabling and disabling ports is also described here.
Chapter 3, Using ATX Trunking, describes the trunking table and how to enable
and disable trunking on each interface on your ATX.
Chapter 4, Using ATX Port Filtering, describes how to use the Port Filtering
window to create custom filters and discard or forward traffic based on the
specified criteria.
Chapter 5, Workgroup Configuration, describes how to set up virtual work
groups on your ATX.
Chapter 6, ATX Port Mirroring, provides instructions for setting up port
mirroring on your ATX; you can configure a diagnostic port as either a local port
or a remote port on another ATX in your network.
Chapter 7, IPX Routing Tables, describes the IPX Tables window,which contains
statistics about IPX Routing on your ATX.
Chapter 8, ATX Bridging, provides a comprehensive look at all management
options associated with the bridge portion of the ATX, including Spanning Tree,
and the Filtering Database.
We assume that you have a general working knowledge of Ethernet IEEE 802.3,
Token Ring, Fast Ethernet, and FDDI type data communications networks and
their physical layer components, and that you are familiar with general bridging
and switching concepts.
Related Manuals
The ATX Switch user’s guide is only part of a complete document set designed to
provide comprehensive information about the features available to you through
NetSight Element Manager. Other guides which include important information
related to managing the ATX Switch include:
1-2 Using the ATX Switch User’s Guide
Page 11
NetSight Element Manager User’s Guide
NetSight Element Manager Tools Guide
Network Troubleshooting Guide
Microsoft Corporation’s Microsoft Windows User’s Guide
For more information about the capabilities of the ATX Switch, consult the
appropriate hardware documentation.
Software Conventions
NetSight Element Manager’s device user interface contains a number of elements
which are common to most windows and which operate the same regardless of
which window they appear in. A brief description of some of the most common
elements appears below; note that the information provided here is not repeated
in the descriptions of specific windows and/or functions.
Introduction
Common ATX Switch Window Fields
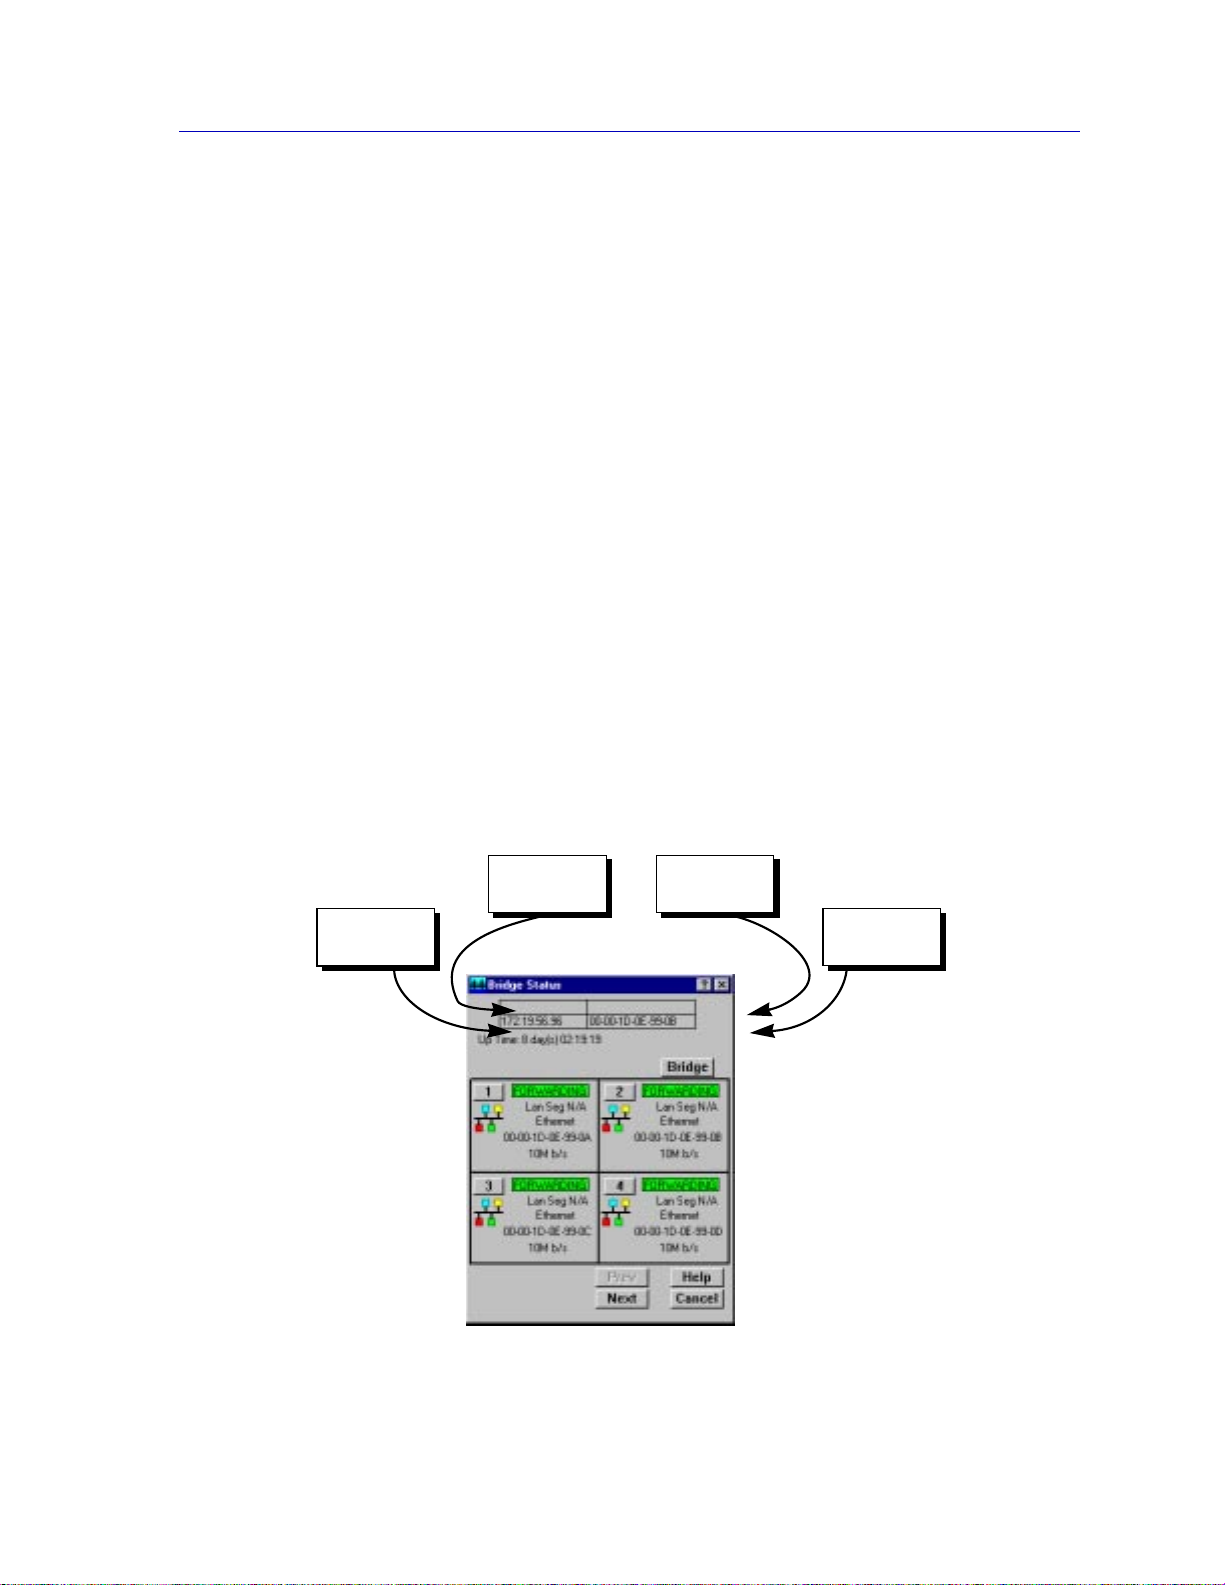
Similar descriptive information is displayed in boxes at the top of most devicespecific windows in NetSightNetSight Element Manager, as illustrated in
Figure 1-1, below.
Device
Name
IP Address
Location
MAC
Address
Software Conventions 1-3
Page 12

Introduction
Figure 1-1. Sample Window Showing Group Boxes
Device Name
Displays the user-defined name of the device. The device name can be changed
via the System Group window; see the Generic SNMP User’s Guide for details.
IP Address
Displays the ATX Switch’s IP (Internet Protocol) Address; this will be the IP
address used to define the ATX Switch icon. IP addresses are assigned via Local
Management for the ATX Switch; they cannot be changed via NetSight Element
Manager.
Location
Displays the user-defined location of the device. The location is entered through
the System Group window; see the Generic SNMP User’s Guide for details.
MAC Address
Displays the manufacturer-set MAC address of the channel through which
NetSight Element Manager is communicating with the ATX Switch. This address
is factory-set and cannot be altered.
Informational fields describing the boards and/or ports being modeled are also
displayed in most windows:
Port Number
Displays the number of the monitored port.
Uptime
Displays the amount of time, in a day(s) hh:mm:ss format, that the ATX Switch
has been running since the last start-up.
Using Window Buttons
The button that appears at the bottom of most windows allows you to
exit a window and terminate any unsaved changes you have made. You may also
have to use this button to close a window after you have made any necessary
changes and set them by clicking on an , , or button.
An , , or button appears in windows that have
configurable values; it allows you to confirm and SET changes you have made to
those values. In some windows, you may have to use this button to confirm each
individual set; in other windows, you can set several values at once and confirm
the sets with one click on the button.
The button brings up a Help text box with information specific to the
current window. For more information concerning Help buttons, see Getting
Help, page 1-5.
1-4 Software Conventions
Page 13

The command buttons, for example , call up a menu listing the windows,
screens, or commands available for that topic.
Any menu topic followed by ... (three dots) — for example Statistics... — calls up
a window or screen associated with that topic.
Getting Help
This section describes two different methods of getting help for questions or
concerns you may have while using NetSight Element Manager.
Using On-line Help
You can use the ATXChassis window Help buttons to obtain information specific
to the device. When you click on a Help button, a window will appear which
contains context-sensitive on-screen documentation that will assist you in the use
of the windows and their associated command and menu options. Note that if a
Help button is grayed out, on-line help has not yet been implemented for the
associated window.
Introduction
From the Help menu accessed from the Module View window menu bar, you can
access on-line Help specific to the Module View, as well as bring up the Chassis
Manager window for reference. Refer to Chapter 2 for information on the Module
View and Chassis Manager windows.
All of the NetSight Element Manager help windows use the standard Microsoft Windows
NOTE
help facility; if you are unfamiliar with this feature of Windows, you can select Help —
>How to Use Help from the Program Manager window, or consult your Microsoft
Windows User’s Guide.
Getting Help from the Global Technical Assistance Center
If you need technical support related to NetSight Element Manager, please
contact the Global Call Center via one of the following methods:
By phone: (603) 332-9400
24 hours a day, 365 days a year
By fax: (603) 337-3075
24 hours a day, 365 days a year
By mail: Enterasys Networks
Technical Support
35 Industria Way
Rochester, NH 03867
By e- mail: support@enterasys.com
Getting Help 1-5
Page 14

Introduction
NOTE
FTP: ftp.ctron.com (134.141.197.25)
Login anonymous
Password your email address
By BBS: (603) 335-3358
Modem Setting 8N1: 8 data bits, 1 stop bit, No parity
Send your questions, comments, and suggestions regarding NetSight
documentation to NetSight Technical Communications via the following e-mail
address:
Netsight_docs@enterasys.com
To locate product specific information, refer to the Enterasys Web site at the
following address:
http://www.enterasys.com
For the highest firmware versions successfully tested with NetSight Element Manager
2.2.1,refertotheReadmefileavailablefromtheNetSightElementManager2.2.1 program
group. If you have an earlier version of firmware and experience problems, contact the
Global Technical Assistance Center.
1-6 Getting Help
Page 15

Chapter 2
The ATX Switch Chassis View
Information displayed in the Chassis View window; the Chassis Manager window; Hub management
functions
The ATX Switch Chassis View window is the main screen that immediately
informs you of the current condition of individual ports on boards inserted in the
ATX Switch chassis via a graphical display. The Chassis View displays the ATX’s
Packet Processing Engine (PPE) and all the modules installed in your ATX Switch
chassis. The Chassis View window serves as a single point of access to all other
ATX Switch windows and screens, which are discussed at length in the following
chapter.
NOTE
In the ATX Switch Chassis View, the first module represents the Packet Processing
Engine (PPE) of the ATX Switch, which occupies the top slot in the ATX Switch chassis;
although the port menu options are available for the port that represents the PPE, the
options available from this module menu will apply to ATX Switch as a whole; the port
menu will only provide a description of the PPE port.
To access the ATX Switch Chassis View window, use one of the following options:
1. In any map, list, or tree view, double-click on the ATX Switch you wish to
manage;
or
1. In any map, list, or tree view, click the left mouse button once to select the
ATX Switch you wish to manage.
Figure 2-1. ATX Icon
2-1
Page 16
The ATX Switch Chassis View
2. Select Manage—>Node from the primary window menu bar, or select the
Manage Node toolbar button.
or
1. In any map, list, or tree view, click the right mouse button once to select the
ATX Switch you wish to manage.
2. On the resulting menu, click to select Manage.
3.
Viewing Chassis Information
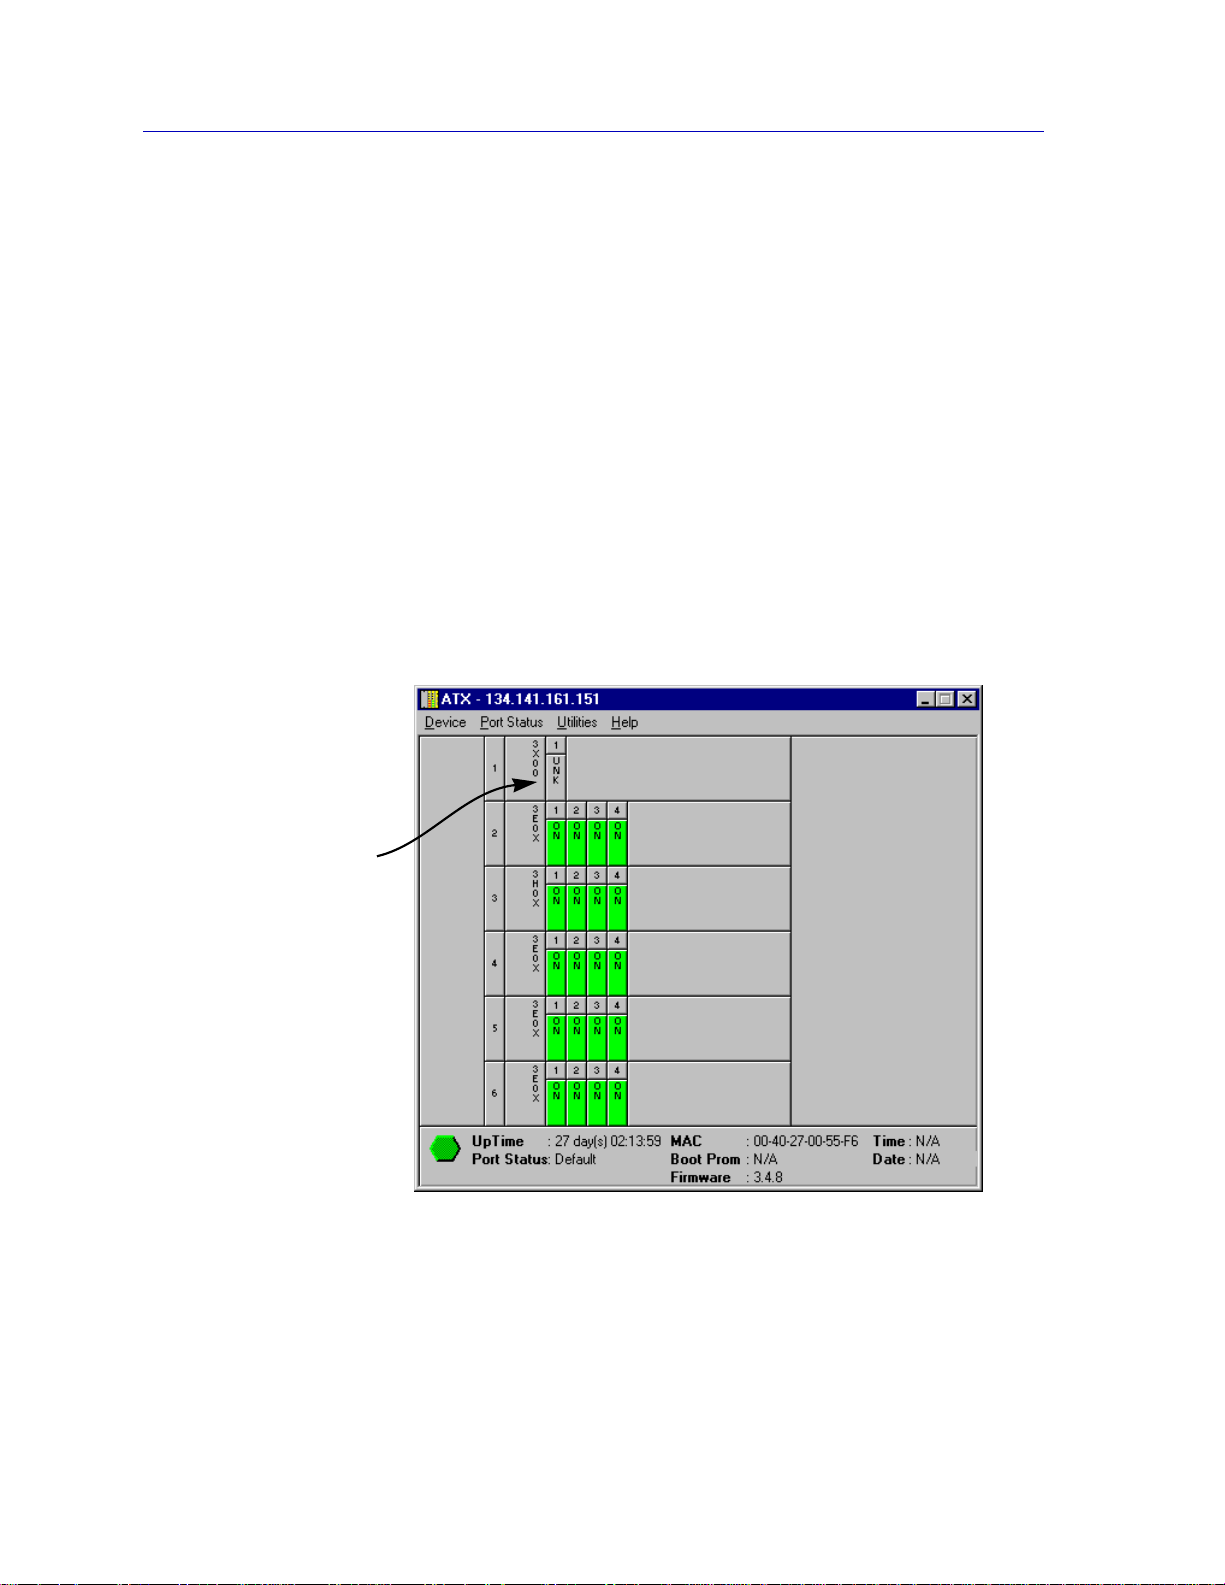
The ATX Switch Chassis View window (Figure 2-2) provides a graphic
representation of the ATX Switch, including a color-coded port display which
immediately informs you of the current status of all the ports residing on inserted
modules, and power supplies installed in the ATX Switch chassis.
PPE
RepresentstheATX’s
Packet Processing
Engine.
By clicking in designated areas of the chassis graphical display (as detailed later
in this chapter), or by using the menu bar at the top of the Chassis View window,
you can access all of the menus that lead to more detailed device-,module, and
port-level windows.
Figure 2-2. ATX Switch Chassis View Window
2-2 Viewing Chassis Information
Page 17

When you move the mouse cursor over a management “hot spot” the cursor icon will
TIP
change into a “hand” ( ) to indicate that clicking in the current location will bring up a
management option.
Front Panel Information
The areas below the main module display area provides the following device
information:
IP
The Internet Protocol address assigned to the ATX appears in the title bar of the
Chassis View window; this field will display the IP address you have used to
create the ATX icon. IP addresses are assigned via Local Management.
Connection Status
This color-coded area indicates the current state of communication between
NetSight Element Manager and the ATX.
The ATX Switch Chassis View
• Green indicates the ATX Switch is responding to device polls (valid
connection).
• Magentaindicates that the ATXSwitch is in a temporary stand-by mode while
it responds to a physical change in the hub (a board is inserted or removed or
a board’s connection has been reconfigured); note that board and port menus
are inactive during this stand-by state.
• Blue indicates an unknown contact status – polling has not yet been
established with the ATX Switch.
• Red indicates the ATX Switch is not responding to device polls (device is off
line, or device polling has failed across the network for some other reason).
UpTime
The amount of time, in a day(s) hh:mm:ss format, that the ATX has been running
since the last start-up.
Port Status
If management for your device supports a variable port display (detailed in Port
Status Displays, page 2-7), this field will show the display currently in effect. If
only a single port display is available — or if the default view is in effect — this
field will state Default.
MAC
Displays the physical-layer address associated with the IP address used to create
the device icon. MAC addresses are factory-set and cannot be altered.
Viewing Chassis Information 2-3
Page 18
The ATX Switch Chassis View
Boot Prom
The revision of BOOT PROM installed in the ATX.
Firmware
The revision of device firmware stored in the ATX’s FLASH PROMs.
The ATX Switch does not support Device Date or Time; therefore, these fields will display
NOTE
N/A.
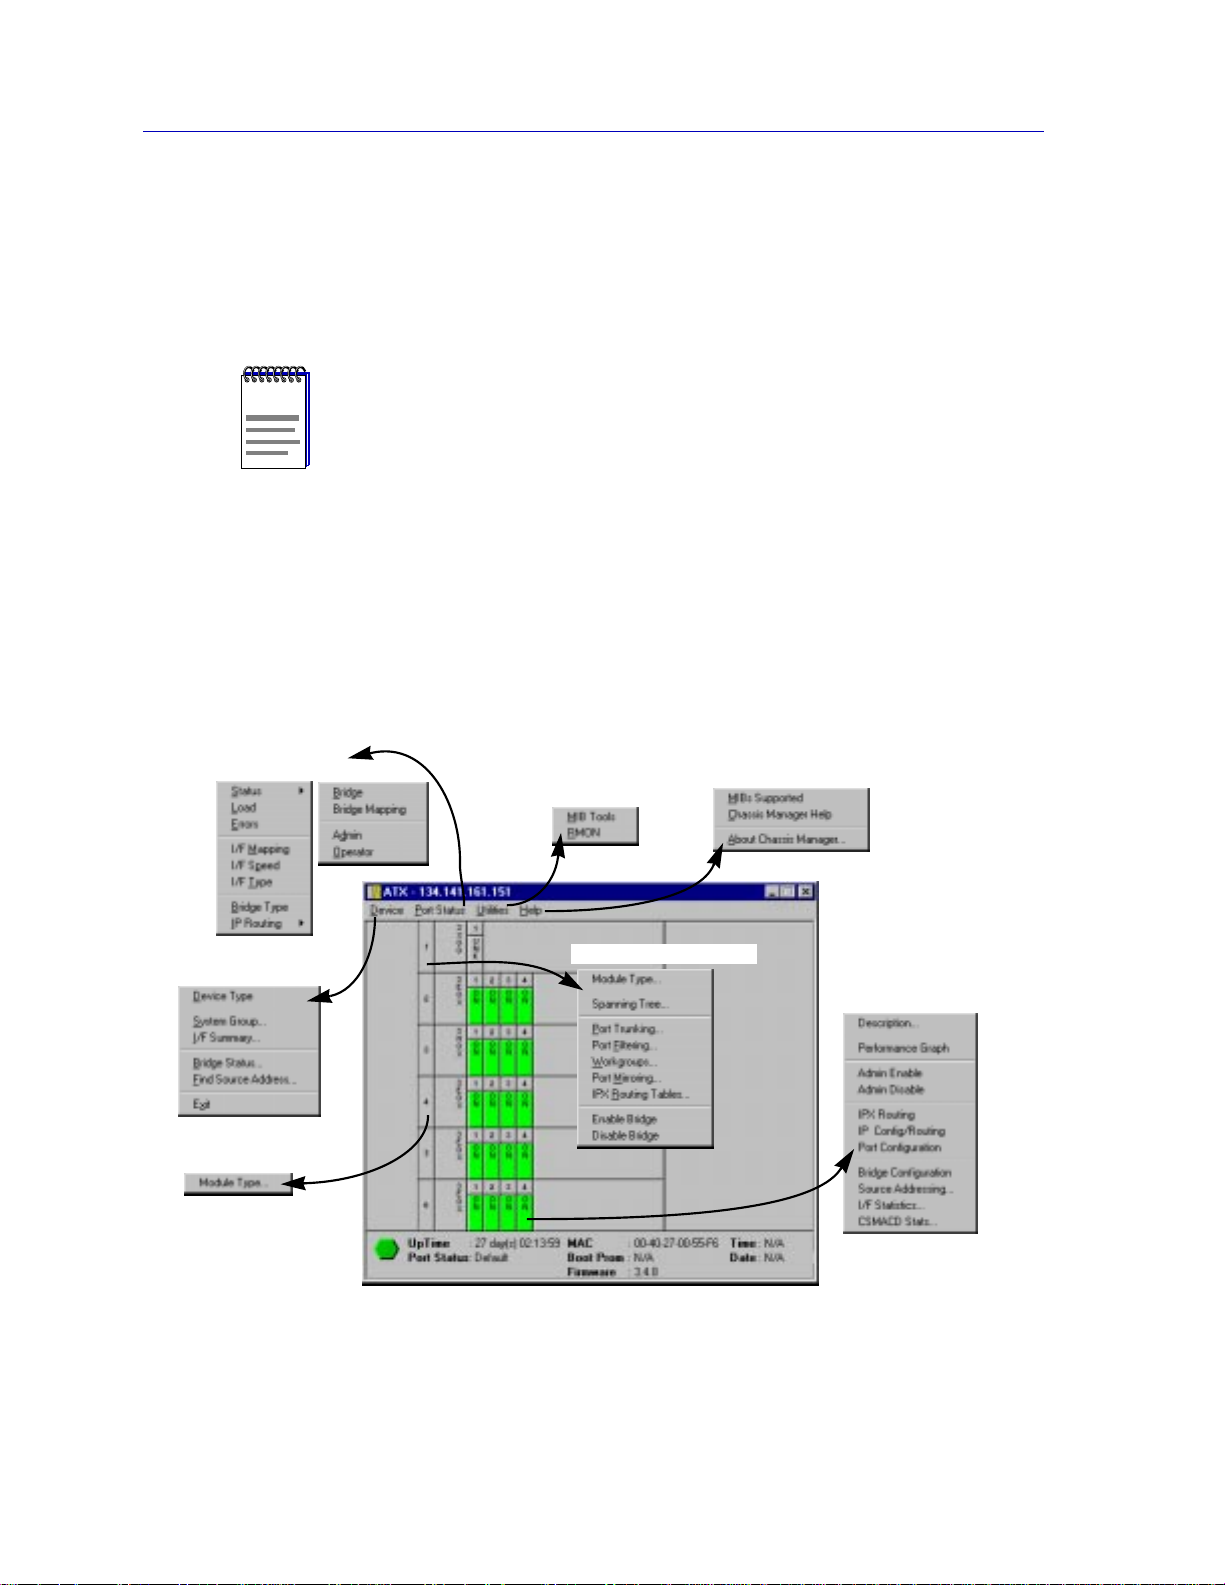
Menu Structure
By clicking on various areas of the ATX Switch Chassis View display, you can
access menus with device-, module-, and port-level options, as well as utility
applications which apply to the ATX Switch. The following illustration displays
the menu structure and indicates how to use the mouse to access the various
menus:
Port Status Menu
Device Menu
Module Menu
Utilities Menu
Help Menu
PPE Module Menu
Port Menu
Figure 2-3. ATX Switch Chassis View Menu Structure
2-4 Viewing Chassis Information
Page 19

The ATX Switch Chassis View
The Device Menu
From the Device Menu at the Chassis View window menu bar,you can access the
following selections:
• Device Type..., which displays a window containing a description of the
device being modeled.
• System Group..., which allows you to manage the ATX Switch via SNMP
MIB_II. Refer to the Generic SNMP User’s Guide for further information.
• I/F Summary, which lets you view statistics (displayed both graphically and
numerically) for the traffic processed by each network interface on your ATX.
• BridgeStatus..., whichopens a window thatprovidesan overview of bridging
information for each port, and allows you to access all other bridge-related
options. Refer to the Bridging Chapter in the Tools Guide, for more
information.
• Find Source Address..., which opens a window that allows you to search the
802.1d Filtering Database of the ATX Switch to determine which bridging
interface a specified MAC address is communicating through. If the MAC
addressisdetected as communicating through the switch,theport display will
flash to indicate the bridge interface of interest. This is described in Using the
Find Source Address Feature, page 2-23.
• Exit, which closes the ATX Switch Chassis View window.
The Port Status Menu
The Port Status menu allows you to select the status information that will be
displayed in the port text boxes in the Chassis View window:
• Statusallows you to selectone of threestatus type displays:Bridge, Admin, or
Operator.
• Load will display the portion of network load processed per polling interval
by each interface as a percentage of the theoretical maximum load (10 or 100
Mbits/sec).
• Errorsallows you to displaythe number of errors detected perpolling interval
by each interface as a percentage of the total number of valid packets
processed by the interface.
• I/F Mapping will display the interface (if) index associated with each port
your ATX switch.
• I/F Speed will display the speed (10 or 100 Mbits/sec for Ethernet and Fast
Ethernetports, 4 or16 Mbits/sec for Token Ringports) of the networksegment
attached to each port. The speed of the network management port will be
displayed in Kbits/sec.
• I/F Type will display the port type of each port in the ATX Chassis, e.g., Eth
(ethernet-csmacd), TR (token ring), or FDDI.
Viewing Chassis Information 2-5
Page 20

The ATX Switch Chassis View
For more information on the port display options available via this menu, see
Selecting a Port Status View, page 2-8.
The Utilities Menu
The Utilities menu provides access to the MIBTree utility, which provides direct
access to the ATX’s MIB information, and to the RMON utility, a remote
monitoring feature that is supported by many Cabletron and Enterasys intelligent
devices. These selections are also available from the Utilities menu at the top of
NetSight Element Manager’s main window. Refer to your Tools Guide for a
thorough explanation of the MibTree and RMON utilities.
The Help Menu
The Help Menu has three selections:
• MIBsSupported, which bringsup the Chassis Manager window,described in
The Chassis Manager Window section of this chapter.
• Chassis Manager Help, which brings up a help window with information
specifically related to using the Chassis Manager and Chassis View windows.
• About Chassis Manager..., which brings up a window with the version
number of the Chassis Manager application in use.
The PPE Module Menu
The Packet Processing Engine (PPE) has the following selections in its module
menu:
• Module Type..., which brings up a window containing a description of a
module inserted in the ATXSwitch; see ViewingHardwareTypes,later in this
chapter.
• PortTrunking...,which brings up a window containing the trunking table and
allows you to enable and disable trunking on each interface on your ATX; see
Chapter 3 for more information.
• Port Filtering..., which brings up the Port Filtering window from which you
can create custom filters and discard or forward traffic based on the specified
criteria; see Chapter 4 for more information.
• Workgroups..., which brings up the Virtual Workgroups window where you
can set up virtual workgroups on your ATX; see Chapter 5 for more
information.
• PortMirroring..., which bringsup the Port Mirroring window fromwhich you
can set up port mirroring on your ATX; you can configure a diagnostic port as
either a local port or a remote port on another ATX in your network. For more
information, see Chapter 6.
• IPXRouting Tables..., which displays the IPX Routing Tableswindow, which
contains statistics about IPX Routing on your ATX; see Chapter 7 for more
information.
2-6 Viewing Chassis Information
Page 21

The ATX Switch Chassis View
The Module Menu
There is one module menu selection:
• Module Type..., which brings up a window containing a description of a
module inserted in the ATX Switch; see Viewing Hardware Types, page 2-10.
The PPE Port Menu
The port representingthe ATX’s Packet ProcessingEngine (PPE) has the following
selections in its port menu:
• Description..., which brings up a window describing the selected port; see
Interface Description, page 2-11.
The Port Menu
The port menu selections are as follows:
• Description..., which brings up a window describing the selected port; see
Interface Description, page 2-11.
• I/F Stats..., which graphically displays the traffic passing between your
bridged networks; see Chapter 3.
• Admin Enable/Disable, which administratively turns the selected bridging
port on or off; see Administratively Enablingand Disabling Ports, page 2-29,
for more information.
• IPXRouting, which allows you to enable or disable IPX Routing on any of the
interfaces on the ATX; see IPX Routing, page 2-12, for more information.
• IPConfig/Routing, which allows you to enable any port in your ATXChassis
for IP routing; see IP Routing, page 2-14, for more information.
• Port Configuration, which allows you to configure each individual port for
broadcast protection, ring speed (for token ring ports only), and local
switching (for token ring and fast ethernet ports only); see Port Configuration
on page 2-16.
• BridgeConfiguration, which allows you to configure bridging parameters on
an individual port basis; see Bridge Port Configuration, page 2-17.
Port Status Displays
When you open the Chassis View window, each port on the ATX Switch will
display its Admin status (defined below); to change this status display, select one
of the options on the Port Status menu, as described in the following sections.
Viewing Chassis Information 2-7
Page 22

The ATX Switch Chassis View
Selecting a Port Status View
To change the status view of your ports:
1. Click on Port Status on the menu bar at the top of the Chassis View window;
a menu will appear.
2. Drag down (and to the right, if necessary) to select the status information you
want to display. The port text boxes will display the appropriate status
information.
Port status view options are:
Status
You can view three port status categories, as follows:
• Bridge — FWD, DIS, LRN, LIS, BLK, BRK, or UNK
• Admin — ON or OFF
• Operator — ON or OFF
If you have selected the Bridge status mode, a port is considered:
• FWD (Forwarding) if the port is on-line and forwarding packets across the
ATX Switch from one network segment to another.
• DIS (Disabled) if bridging at the port has been disabled by management; no
traffic can be received or forwarded on this port, including configuration
information for the bridged topology.
• LRN (Learning) if the Forwarding database is being created, or the Spanning
Tree Algorithm is being executed because of a network topology change. The
port is monitoring network traffic, and learning network addresses.
• LIS(Listening) if the port is not adding information to the filtering database. It
is monitoring Bridge Protocol Data Unit (BPDU) traffic while preparing to
move to the forwarding state.
• BLK (Blocking) if the port is on-line, but filtering traffic from going across the
ATX Switch from one network segment to another. Bridge topology
information will be forwarded by the port.
• BRK (Broken) if the physical interface has malfunctioned.
• UNK (Unknown) if the interface’s status cannot be determined.
If you have selected the Admin status mode, a port is considered:
• ON if the port is enabled by management and has a valid link.
• OFF if it has not been enabled or if it has been disabled through management
action.
If you have selected the Operator status mode, a port is considered:
2-8 Viewing Chassis Information
Page 23

NOTE
The ATX Switch Chassis View
• ON if the port is currently forwarding packets.
• OFF if the port is not currently forwarding packets.
Load
If you choose Load, the interface text boxes will display the percentage of
network load processed by each port during the last polling interval. This
percentage reflects the network load generated per polling interval by devices
connected to the port compared to the theoretical maximum load (10 or 100
Mbits/sec) of an Ethernet network.
Errors
If you choose the Errors mode, the interface boxes will display the percentage of
the total number of valid packets processed by each port during the last polling
interval that were error packets. This percentage reflects the number of errors
generated during the last polling interval by devices connected to that port
compared to the total number of valid packets processed by the port.
In NetSight Element Manager, the polling interval is set via the Tools—>Option
window available from the primary window menu bar.
Refer to the NetSight Element Manager User’s Guide for full information on setting
device polling intervals.
I/F Mapping
If you choose the I/F Mapping mode, the interface boxes will display the interface
number (IfIndex) associated with each port in the ATX Chassis.
I/F Speed
If you choose the I/F Speed mode, the port text boxes will display the speed (10 or
100 Mbits/sec) of the network segment connected to each port. The speed of the
network management port will be displayed in Kbits/sec.
I/F Type
If you choose the I/F Type mode, the interface boxes will display the interface
type of each port in the ATX Chassis (e.g., Eth, PPP, FDDI, or TR).
Port Status Color Codes
The Port Status display options —Bridge, Admin, and Operator— incorporate
color coding schemes. For the Admin and Operator Status display options,
green = ON, red = OFF, and blue = N/A (not available). For the Bridge Status
display option, green = forwarding, blue = disabled, magenta = learning and
listening, orange = blocking, red = broken, and gray = unknown.
For all other Port Status selections — Load, Errors, I/F Mapping, I/F Speed, and
I/F Type— color codes will continue to reflect the most recently selected mode
which incorporates its own color coding scheme.
Viewing Chassis Information 2-9
Page 24
The ATX Switch Chassis View
The Chassis Manager Window
Like most networking devices, Enterasys and Cabletron ATX Switch management
modules draw their functionality from a collection of proprietary MIBs and IETF
RFCs. In addition, many Enterasys and Cabletron intelligent devices – like the
ATX Switch – organize their MIB data into a series of “components.” A MIB
component is a logical grouping of MIB data, and each group controls a defined
set of objects. For example, ATX Switch bridging information is organized into its
own component. Note, too, that there is no one-to-one correspondence between
MIBs and MIB components; a single MIB component might contain objects from
several different proprietary MIBs and RFCs.
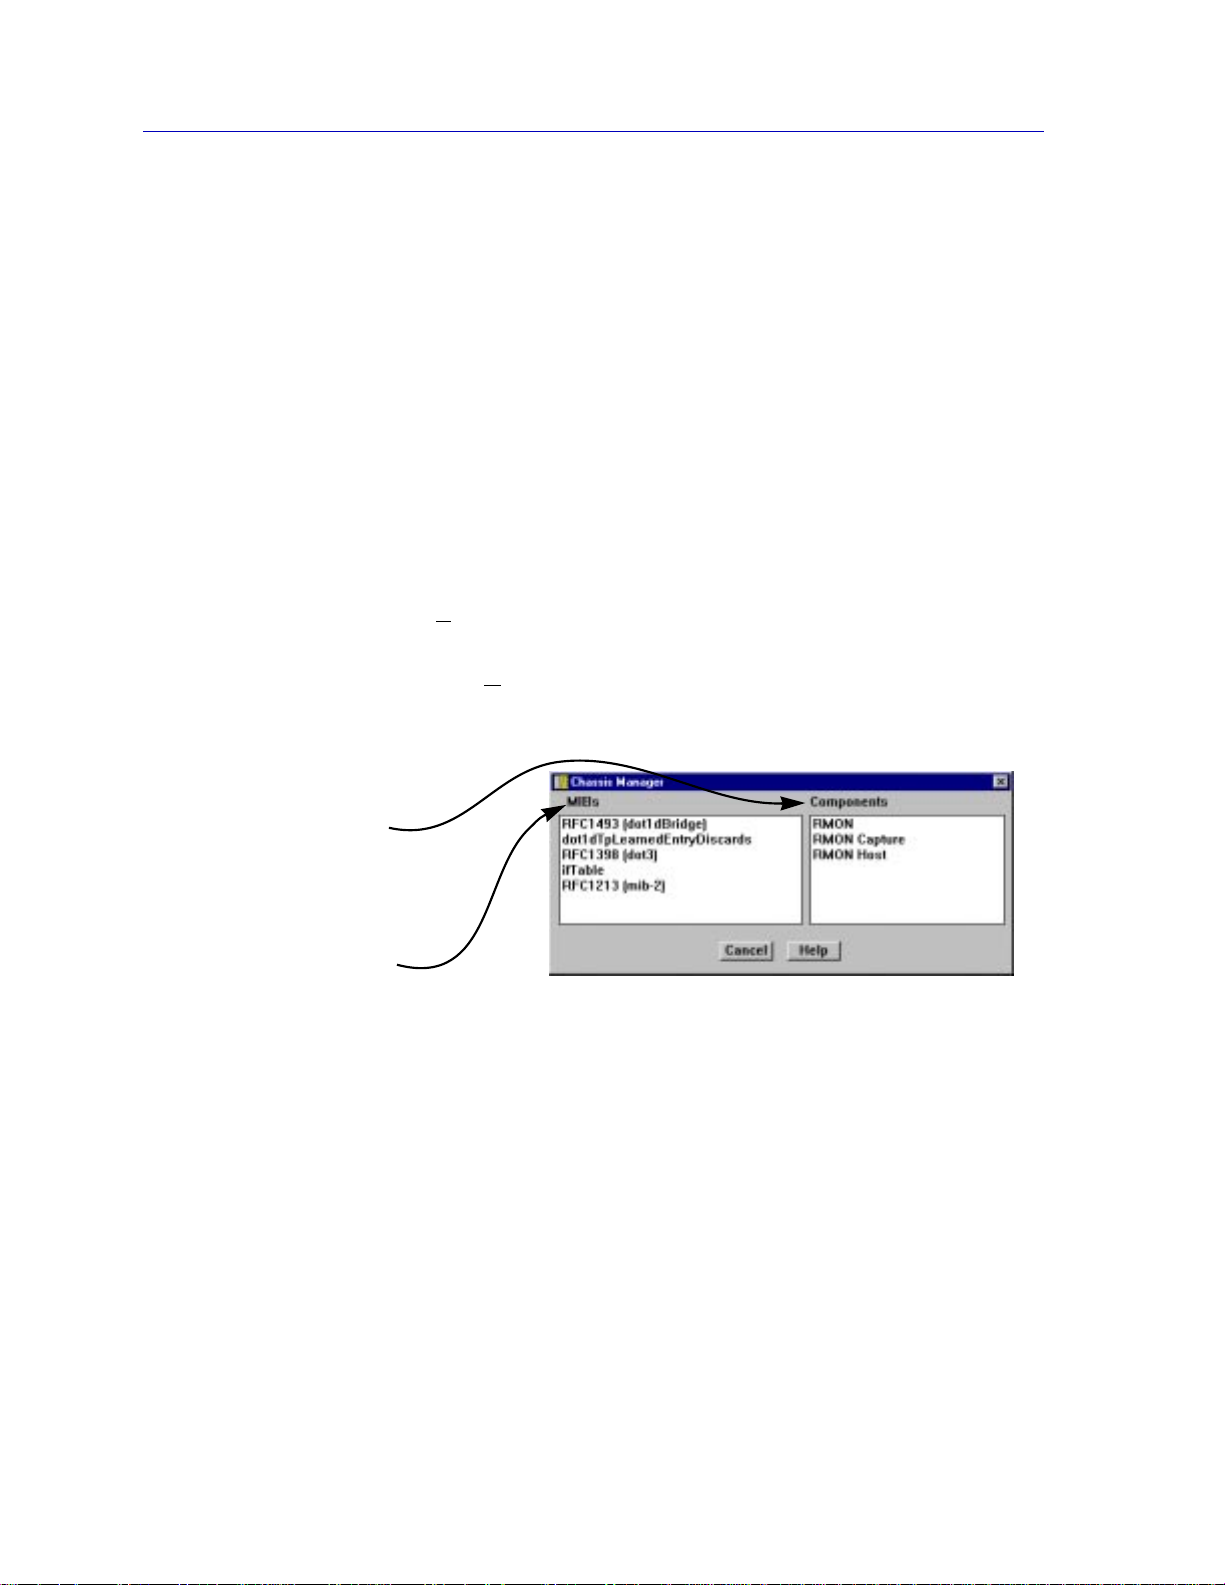
The Chassis Manager window, Figure 2-4, is a read-only window that displays
the MIBs and the MIB components — and, therefore, the functionality —
supported by the currently monitored ATX Switch management module.
To view the Chassis Manager window:
1. Click on Help on the far right of the menu bar at the top of the chassis
manager window.
2. Drag down to MIBs Supported, and release.
MIB Components are listed here;
remember, there’s no one-to-one
correspondence between MIBs
and MIB Components
The MIBs which provide the
ATX Switch’s functionality —
bothproprietaryMIBs and IETF
RFCs — are listed here
Figure 2-4. Chassis Manager Window
Viewing Hardware Types
In addition to the graphical displays described above, menu options available at
several levels provide specific information about the physical characteristics of
the boards and ports in the ATX Switch Chassis, as well as information about the
ATX Switch itself.
2-10 Viewing Chassis Information
Page 25
The ATX Switch Chassis View
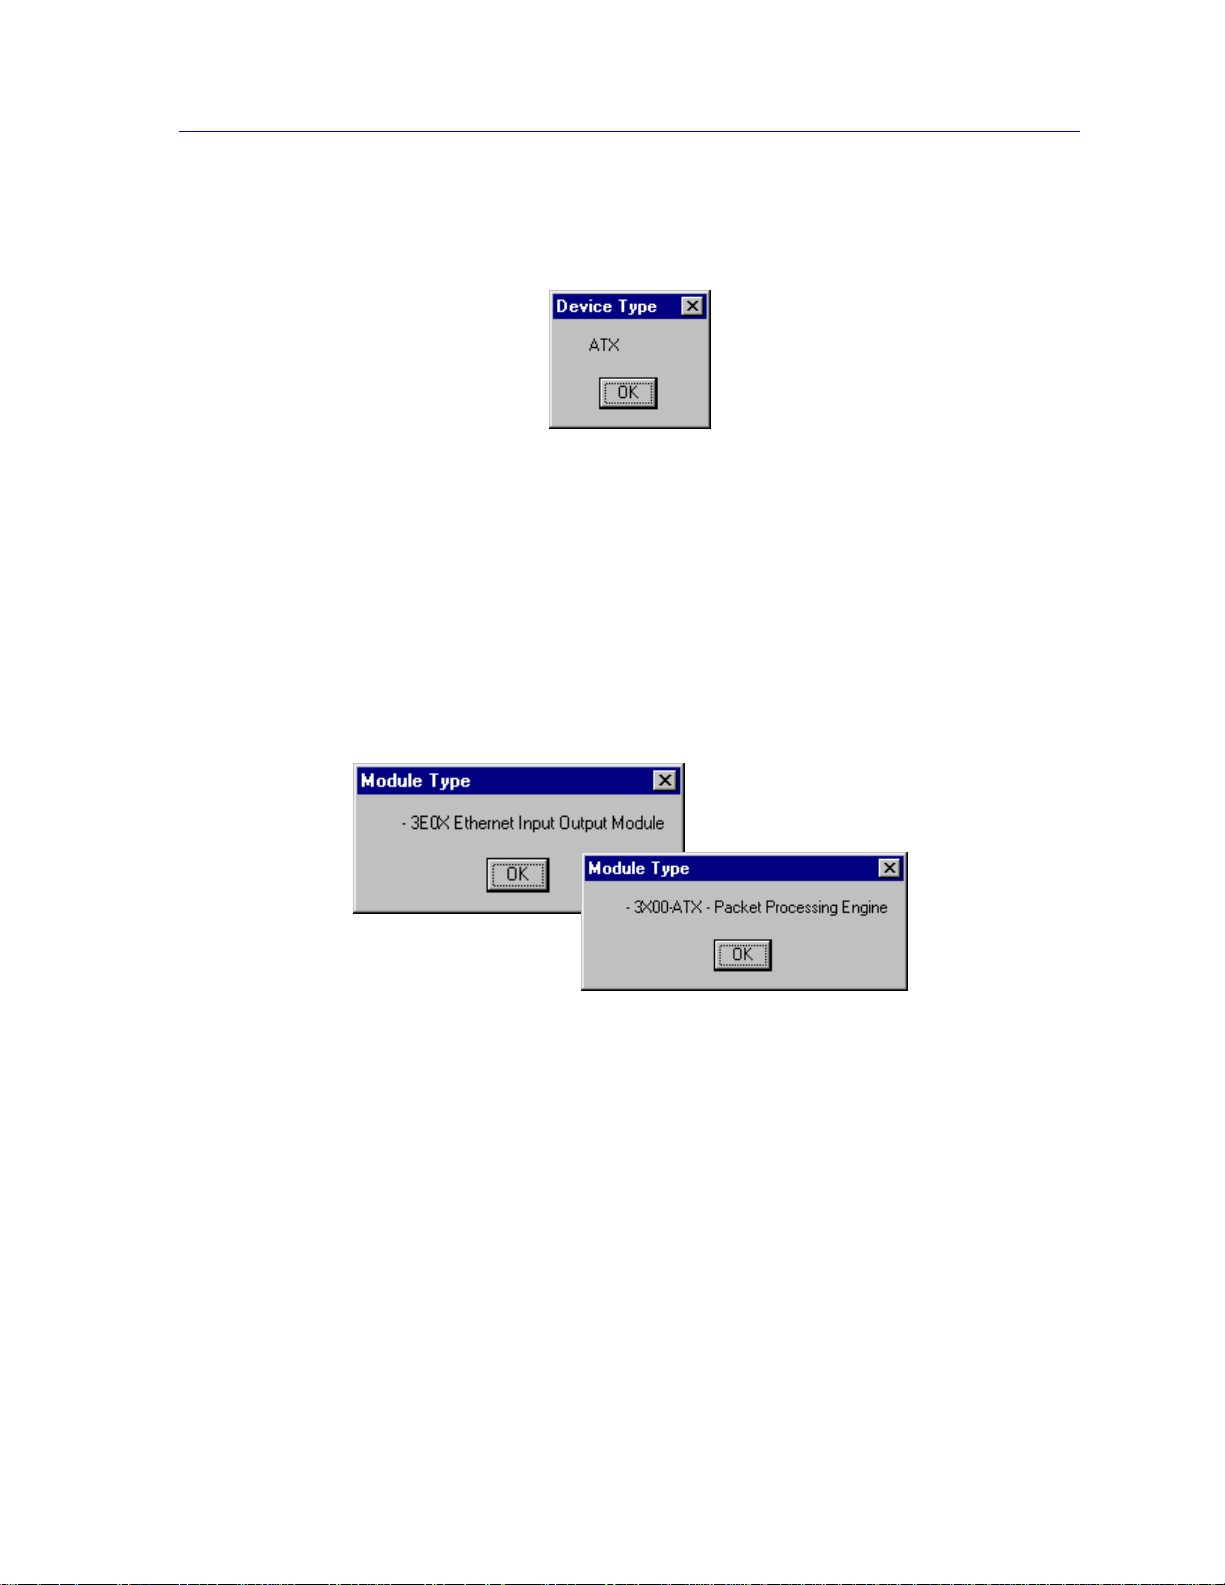
Choosing the Device Type option on the Device menu brings up a window that
tells you this is an ATX Switch.
Figure 2-5. Device Type Window
From the Module Menus in the Chassis View window, you can view a description
of the module type.
To view the module type:
1. Click on the module index. The Module menu will appear.
2. Drag down to Module Type.... A Module Type text box (Figure 2-6), will
appear, displaying the appropriate Module Type.
Figure 2-6. Module Type Text Boxes
Interface Description
You can view a brief description of the interface type for each port residing on
modules inserted in the ATX Switch.
To view a description of a port’s interface:
1. Click on the appropriate Port button. A menu will appear.
2. Drag down to Description.... An Interface Description text box, similar to the
samples shown in Figure 2-7, will appear with a description of the port
interface.
Viewing Chassis Information 2-11
Page 26

The ATX Switch Chassis View
Figure 2-7. Sample Interface Description Text Boxes
Managing the Hub
In addition to the performance and configuration information described in the
preceding sections, the Chassis View also provides you with the tools you need to
configure your ATX Chassis and keep it operating properly. Hub management
functions include IPX and IP Routing configuration, port configuration, bridge
configuration, locating source addresses, and enabling and disabling ports.
IPX Routing
IPX (Internetwork Packet Exchange) is the Novell proprietary protocol that
specifies how information is to be broken into separate packets, and how those
packets are addressed in order to be routed from one Novell Netware node to
another, and from one Novell Netware network to another.
You may enable any port in your ATX Chassis for IPX routing. To access the IPX
Routing window:
1. Click on the appropriate Port button. A menu will appear.
2. Drag down to IPX Routing and release. The IPX Routing window, Figure 2-8,
will be displayed.
2-12 Managing the Hub
Page 27
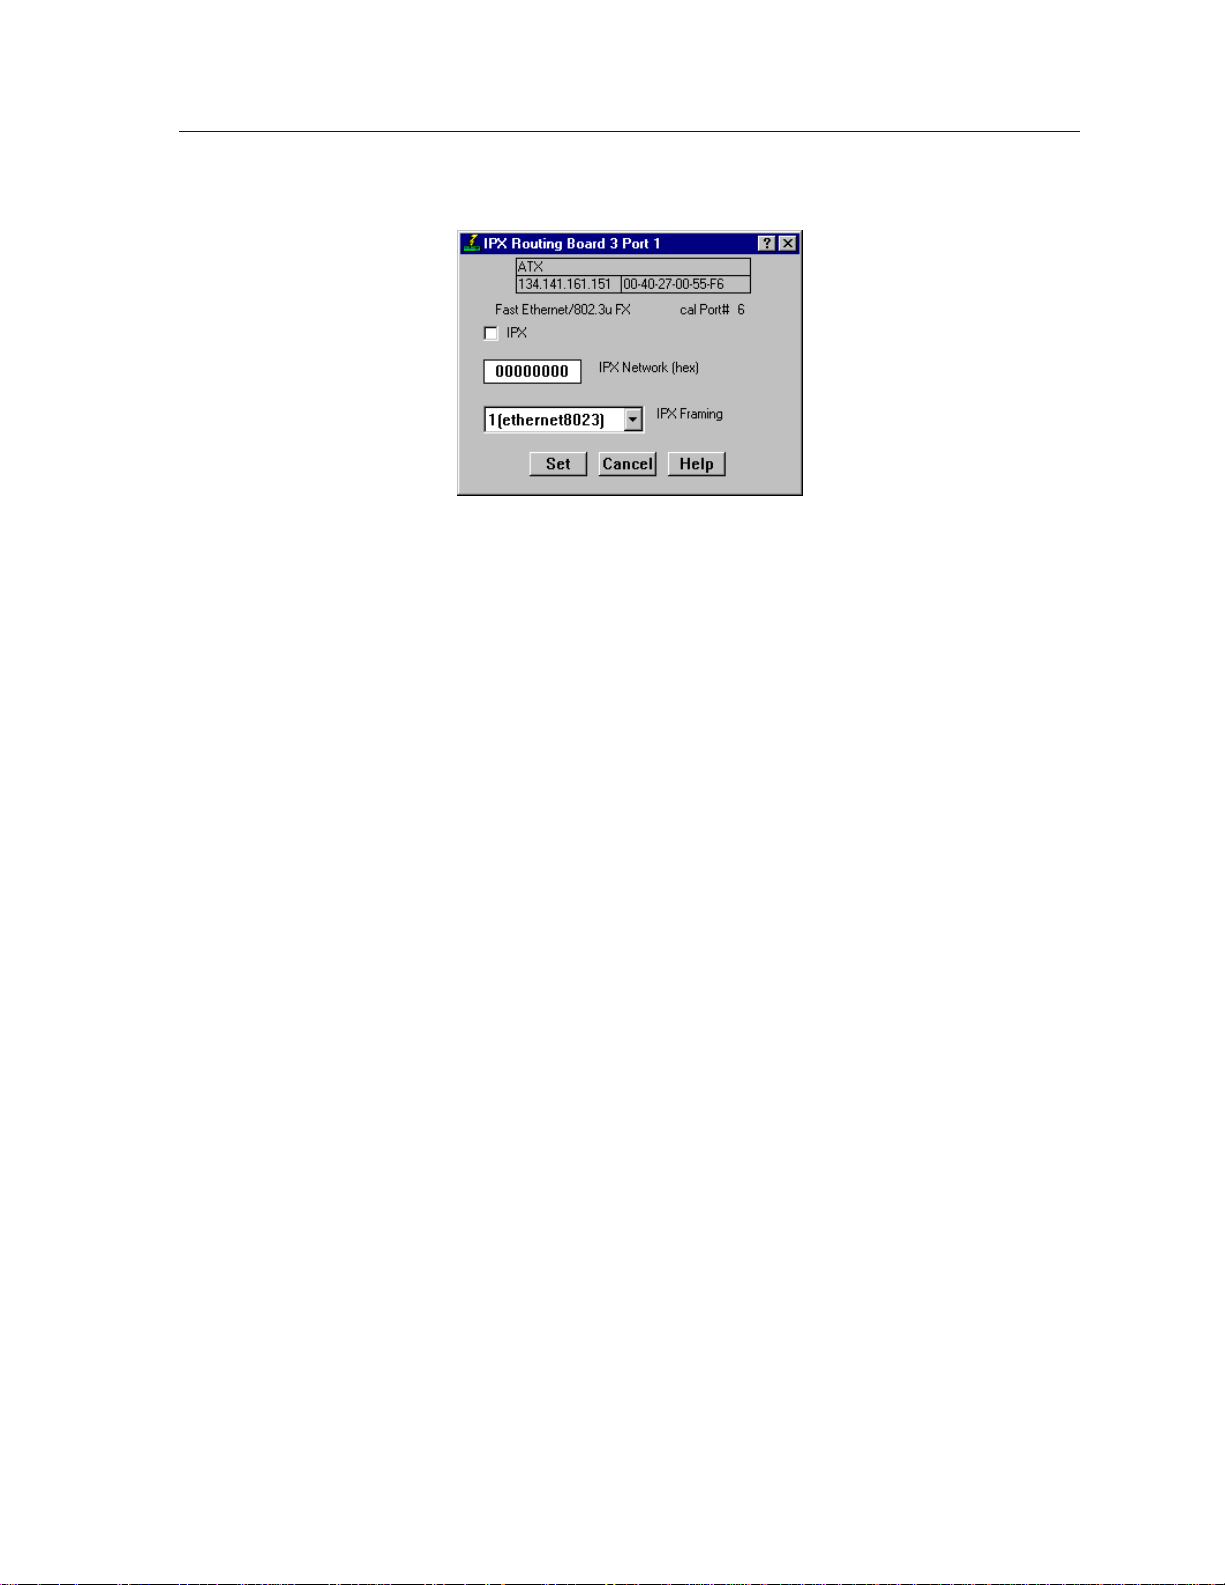
Figure 2-8. IPX Routing window
Configuring IPX Routing on a port
1. Click on the IPX selection box to enable IPX routing on the port.
2. Enter the (hexadecimal) Novell network number of the Novell network
connected to this port in the IPX Network field. The network number is a
4-byte LAN address. Each port with IPX routing enabled must have a unique
network number.
The ATX Switch Chassis View
3. Select a frame type for the port by choosing a frame type from the IPX
Framing pull-down menu. The availableoptions areethernet802.3,ethernet2,
ieee802.2, or snap. See the section following, Selecting the Frame Type for
a Port, page 2-13, for more information on selecting a frame type.
4. Click on Set to set the configuration on the port.
Selecting the Frame Type for a Port
Many IPX networks use a Novell proprietary type of framing instead of the
Ethernet Standard (IEEE 802.3) type of framing. The type of framing used
determines where information is positioned within an IPX packet. Each IPX
configured port in your ATX Chassis must know what framing format is being
used on each connected Novell segment, so that it will know where to look for
information in the IPX packets it receives and where to place information in the
packets it transmits. Once you set the IPX Framing in the IPX Routing window,
the port can form IPX packets that the Novell nodes on each connected Novell
network segment will recognize. You specify the frame type on a port-to-port
basis. The following frame types are supported by the ATX:
1(ethernet802.3) 802.3 frames are the default for Ethernet links. This type
of framing contains a 6-byte destination address, a 6-byte
source address, 802.3 length field in the third field of the
packet followed by the IPX header and the data.
Managing the Hub 2-13
Page 28

The ATX Switch Chassis View
2(ethernet2) Ethernet2 frames are the same as 802.3 frames, except
3(ieee802.2) 802.2 is the default for non-Ethernet links. 802.2 frames
4(snap) SNAP frame types use the SNAP encapsulation method
IP Routing
IP is the TCP/IP protocol that specifies how information is to be broken into
separate packets, and how those packets are to be addressed in order to be routed
over a TCP/IP network.
they use the third field (the length field in 802.3) to store
a value representing the type of transport packet that is
encapsulated within the Ethernet packet.
are the same as 802.3 frames, except they have Logical
Link Control (LLC) information encoded within them
immediately following the 802.3 length field.
within 802.3 or Ethernet2 frames. This frame type
contains higher level protocol information. This frame is
the same as 802.3 frames up to length field. The length
field is followed by SNAP information which contains
protocol information and an “ethertype” field.
You may enable any port in your ATX Chassis for IP routing. To access the IP
Routing window:
1. Click on the appropriate Port button. A menu will appear.
2. Drag downto IP Config/Routing and release. The IP Config/Routing window,
Figure 2-9, will be displayed.
Figure 2-9. IP Config/Routing window
2-14 Managing the Hub
Page 29

Configuring the IP Address Table
The IP Address Info section of this window displays the IP Addresses and the
subnet masks for each of the device’s interfaces that are configured for IP Routing.
You can enter the IP Address and IP Mask for the current interface from this
window.
The IP Address Table located in this window displays the Interface Number, IP
Address and IP Mask for each table entry. If there are more entries in the IP
Address Tablethan can fit in the display panel, a scroll bar will appear so that you
can scroll to view the remaining entries in the table.
Index Port
Displays the interface number (IfIndex) associated with the entry.
IP Address
The interface’s Internet Protocol address. A device with multiple interfaces, such
as a bridge or router, can have multiple IP addresses assigned to it.
IP Mask
A subnet mask identifies the portion of an interface’s IP address that identifies a
network and the portion that identifies a host.
The ATX Switch Chassis View
To add an entry to the IP Address Window:
1. Enter the Index Port number, IP Address, and IP Mask associated with the
entry you wish to add in the fields below the IP Address Table.
2. Click on the Add button. The new entry will be added to the IP Address Table.
To delete an entry from the IP Address Window:
1. Highlight the IP Address entry you wish to delete from the IP Address Table.
2. Click on the Delete button. The new entry will be deleted from the IP Address
Table.
Configuring IP Routing on a Port
1. Click on the IP selection box to enable IP Routing on the port.
2. Enable any of the protocols you wish to use with IP Routing on this port by
selecting them from the IP Protocols section in this window.The protocols you
can enable on a port that is using IP Routing are:
• RIP — when enabled specifies that the internet Routing Information
Protocol is to be used over this port. RIP is the most widely used routing
protocol. RIP uses routing tables to determine the best route for a packet.
• Proxy— when enabled specifies that the port will respond to internet ARP
requests for which the device is the next hop in a routed path.
Managing the Hub 2-15
Page 30

The ATX Switch Chassis View
• Bootp Relay — when enabled specifies that this port will relay BOOTP
• IP Multicast — when enabled specifies that the internet Multicast Routing
3. Click on Set to set the configuration.
Port Configuration
The Port Configuration window allows you to configure each individual port for
broadcast protection, ring speed (for token ring ports only), and local switching
(for token ring and fast ethernet ports only). You may configure these attributes
on an individual port basis through this window.
To access the Port Configuration window:
1. Click on the appropriate Port button. A menu will appear.
2. Drag down to Port Configuration and release. The Port Configuration
window, Figure 2-10, will be displayed.
packets.BootP requests and replies are encapsulated in UDP datagrams.
Protocol is to be used over this port. Multicast Routing enables you to
address a packet to multiple destinations.
Figure 2-10. Port Configuration window
Broadcast Protection
You can configurethe number of broadcast/multicast packets that will be allowed
through a port in a user-defined time interval in the Port Configuration window.
Once this threshold is reached any multicast packets received will be discarded
until the user-defined time interval has ended.
2-16 Managing the Hub
Page 31

The ATX Switch Chassis View
To set broadcast protection:
1. In the Thresh Number field enter the maximum number of multicast packets
that can be transmitted through the port during each time interval. The default
number of multicast packetsthat can be received in the specified time interval
is 600,000.
2. In the Thresh Time field enter number hours, minutes, seconds in which the
maximum number of multicast packets must be transmitted in order for the
threshold to be reached.The default time interval is 10 seconds.
Ring Speed
If the port is a token ring port, you can set the Ring Speed from this window.
Token Ring networks can operate at either 4 or 16 Mbps. All devices connected to
the same network must operate at the same speed. You can set the speed used on
this port by clicking on the appropriate Ring Speed selection button, either 4 or
16. If the port is not a token ring port, the ring speed options will be grayed out.
Local Switching
If the port is a token ring or fast ethernet port you can use local switching so that
the frames may be bridged between token ring ports on the same board at higher
throughput and lower latency than is otherwise possible. Address statistics will
not reflect any frames forwarded in this manner. This applies to only transparent
bridging and must be enabled on both the entry and exit port. The options for this
field are On or Off. Click on the appropriate Local Switching selection button to
select On or Off; the default value is Off. If the port is not a token ring port,
and/or does not support local switching, the local switching options will be
grayed out.
After you have configured all the fields in this window, click on Set to set the
configuration on the current port.
Bridge Port Configuration
The Bridge Configuration window allows you to configure bridging over an
individual port. You can configure the bridge mode that this port will use and
whether or not the port will transmit BPDUs. If the port is configured for source
route bridging or source route transparent bridging you can also configure source
routing for the port in the lower half of the window.
To access Bridge Port Configuration:
1. Click on the appropriate Port button. A menu will appear.
2. Drag down to Bridge Configuration and release. The Bridge Configuration
window, Figure 2-11, will be displayed.
Managing the Hub 2-17
Page 32

The ATX Switch Chassis View
Setting the Bridge Mode
Figure 2-11. Bridge Configuration window
Depending on the modules installed in your ATX chassis the ATX ports can
support up to three modes of bridging: Transparent, Source Routing, and Source
Route Transparent.
• Transparent — When the bridge port is set to Transparent mode, the bridge
will only transmit transparent frames. All port types (ethernet, fast ethernet,
fddi, and token ring) may be set to transparent mode.
• SourceRoute— When the bridge port is set to Source Route mode, the bridge
port will only transmit source route frames. Only token ring ports may be set
to source routing mode; therefore, this option will only be available on token
ring ports.
• SRT (Source Route Transparent) — When the bridge port is set to Source
Route Transparent, the bridge port will transmit both transparent and source
route frames. All port types (ethernet, fast ethernet, fddi, and token ring) may
be set to source route transparent mode. The frames received which have
source route information will be transmitted as source route, while frames
received that are transparent will be transmitted as transparent.
To set the bridge mode:
1. Click on the Bridge Mode selection button; a menu will appear.
2. Select the appropriate bridge mode from the window. This mode will now be
displayed on the button.
3. Click on to set this configuration on the bridge port.
2-18 Managing the Hub
Page 33

Transmitting BPDUs
NOTE
The ATX Switch Chassis View
You can configure whether or not this port will transmit BPDUs (Bridge Protocol
Data Units). BPDUs are used in the Spanning Tree process. Bridges communicate
Spanning Tree Algorithm information via BPDUs. With BPDUs, all network
bridges collectively determine the current network topology and communicate
with each other to ensure that the topology information is kept current.
1. Click in the Transmit BPDUs selection box to determine if the port will
transmit BPDUs.
• If the Transmit BPDUs option is selected, 802.1d and source-routing spanning
tree packets are transmitted as usual.
• If the Transmit BPDUs option is not selected, BPDU packets are not
transmitted.
Disabling the transmission of BPDUs is needed for interoperability with non-802.1d
spanning tree protocols (e.g., DEC LanBridge 100).
Source Route Configuration
If the bridge port is configured for Source Route or Source Route Transparent
bridging, you can configure some of the source route bridging parameters from
the Bridge Configuration window.
Ring Number
The Ring Number is the unique network number of the target network segment
that the bridge attaches to. Valid entries range from 0-fff (hexadecimal).
Individual ports within the ATX Chassis should each be assigned unique values
for this field.
Bridge Number
The Bridge Number uniquely identifies this bridge port. The Bridge Number you
enter should be between the range of 0 and f (hexadecimal).
Spanning Tree Explorer Modes
The Spanning Tree Explorer Span Mode determines how a bridge port behaves
when it receives a STE packet (also known as Single Route Explorer packet). You
can set the Spanning Tree mode to one of the three possible modes.
Auto The port will forward an STE packet when it is in the
Forwarding state; otherwise, it will discard the packet.
This mode can only be used by a bridge that implements
Managing the Hub 2-19
Page 34

The ATX Switch Chassis View
Manual — Enable The port will always accept and propagate STE packets,
Manual — Disable The port will not accept or send STE packets; any STE
Setting the Spanning Tree Explorer Mode
• To choose Auto as the Spanning Tree Explorer Mode on this port, click in the
Auto selection box.
• To choose Manual Enable as the Spanning Tree Explorer Mode on this port,
click in both the Manual selection box and the Enable selection box.
• To choose Manual Disable as the Spanning Tree Explorer Mode on this port,
click in both the Manual selection box and the Disable selection box.
the Spanning Tree Protocol and has it enabled on this
port.
regardless of its port state.
packets received will be discarded.
Token Ring Translation
The Translationwindow will allow you to configure bridging-translation between
Token Ring and other topologies for various protocols. The Translation window
will be available on Token Ring ports only.
To access the TR Translation window:
1. From the Bridge Configuration window, click on the Translation button to
display Figure 2-12, the TR Translation window.
Figure 2-12. TR Translation window
2-20 Managing the Hub
Page 35

The ATX Switch Chassis View
You can set the translation for the following protocols from this window:
IPX Framing
By selecting the option Enable IPX Translation you can specify whether, when
bridging Novell IPX frames, they are to be translated to Ethernet-like frame
format. When you initially select this option, the IPX Framing selection button
will be empty. This button’s pull-down menu allows you to choose the type of
framing to be used for IPX frames on 802.3 networks. You can choose from one of
the following selections:
ethernet802.3 (1) specifies that the 802.3 header is to be used without a
802.2 header.
ethernet2 (2) specifies that Ethernet-2 framing should be used.
ieee802.2 (3) specifies than an LLC header is to be used along with the
802.3 header
IPX Source Route
This selection will specify what will occur when bridging IPX packets that are
also source routing explorer frames. The source routing information can either be
stripped or forwarded. Choose one of the following options for this field:
pass-Rif (1) The IPX frame is bridged as is, with the route discovery
proceeding as expected.
stripRif (2) The routing information field will be stripped before it is
forwarded. This allows non-source routing (e.g.,
Ethernet) IPX hosts to communicate transparently.
passBoth (3) Both the original source-routed frame and the
transparent equivalent are forwarded. This provides the
maximum connectivity, but adds some network traffic.
none (4) No translation will be set and the IPX frame will be
bridged as is. This is the same as setting the translation to
pass RIF. None is the default value for this option.
ARP Translate
You can configure ARP Translation on the Token Ring port by choosing one of the
options from the ARP Translate pull-down menu. These options will designate
the way internet ARP packets are translated. There are two options for ARP
Translation.
none (1) indicates that the ARP packets will not be translated.
1 to 6 swap (6) specifies that received hardware type 6 (IEEE 802)
packets will be converted to type 1 (Ethernet, FDDI) and
that transmitted type 1 ARP packets will be converted to
type 6, with embedded addresses bitswapped.
Managing the Hub 2-21
Page 36

The ATX Switch Chassis View
ARP Source Route
This selection will specify what will occur when bridging ARP packets that are
also source routing explorer frames. The source routing information can either be
stripped or forwarded. Choose one of the following options for this field:
pass-Rif (1) The ARP frame is bridged as is, with the route discovery
stripRif (2) The routing information field will be stripped before it is
passBoth (3) Both the original source-routed frame and the
none (4) No translation will be set and the ARP frame will be
Netbios Source Route
This selection will specify what will occur when bridging Netbios packets that are
also source routing explorer frames. The source routing information can either be
stripped or forwarded. Choose one of the following options for this field:
proceeding as expected.
forwarded. This allows non-source routing (e.g.,
Ethernet) IP hosts to communicate transparently.
transparent equivalent are forwarded. This provides the
maximum connectivity, but adds some network traffic.
bridged as is. This is the same as setting the translation to
pass RIF. None is the default value for this option.
pass-Rif (1) The Netbios frame is bridged as is, with the route
discovery proceeding as expected.
stripRif (2) The routing information field will be stripped before it is
forwarded. This allows non-source routing (e.g.,
Ethernet) Netbios hosts to communicate transparently.
passBoth (3) Both the original source-routed frame and the
transparent equivalent are forwarded. This provides the
maximum connectivity, but adds some network traffic.
none (4) No translation will be set and the Netbios frame will be
bridged as is. This is the same as setting the translation to
pass RIF. None is the default value for this option.
To set the Token Ring Translation Parameters:
1. Select the appropriate parameters from the pull-down menu available for each
of the protocols.
2. Click on to set the translation parameters for the port.
2-22 Managing the Hub
Page 37

Using the Find Source Address Feature
You can select the Find Source Address option to discover which switching
interface a specified source MAC address is communicating through. When you
select the Find Source Address option, a search is made of the 802.1d Bridge
Filtering Database to discover the switch interface associated with the address
that you specify. If the search is successful, the corresponding Bridge port will
flash in the Chassis View window.For more information on the Filtering Database
and bridging in general, refer to Chapter 8, ATX Switch Bridging.
Us e the Find Source Address feature as follows:
1. Click to display the Device pull-down menu.
2. Drag down to Find Source Address.... The following window appears.
The ATX Switch Chassis View
Figure 2-13. The Find Source Address Window
3. In the text field in the middle of the window,enter a valid MAC address in Hex
format and then click OK.
If the address is found in the 802.1d Bridge Filtering Database, the port through
which the address is communicating will flash in the front panel Chassis View
port display.
If the address is not found in the Filtering Database, a separate window will
appear with a “Can’t Find Source Address” message.
Viewing I/F Summary Information
The I/F Summary menu option available from the Device menu lets you view
statistics for the traffic processed by each network interface on your device. The
window also provides access to a detailed statistics window that breaks down
Transmit and Receive traffic for each interface.
To access the I/F Summary window:
1. From the Chassis View, click on the Device option from the menu bar.
Managing the Hub 2-23
Page 38

The ATX Switch Chassis View
2. Drag down to I/F Summary and release. The I/F Summary window,
Figure 2-14, will appear.
Figure 2-14. I/F Summary Window
The I/F Summary window provides a variety of descriptive information about
each interface on your device, as well as statistics which display each interface’s
performance.
The following descriptive information is provided for each interface:
UpTime
The UpTime field lists the amount of time, in a days, hh:mm:ss format, that the
device has been running since the last start-up.
Index
The index value assigned to each interface on the device.
Type
The type of the interface, distinguished by the physical/link protocol(s) running
immediately below the network layer.
Description
A text description of the interface
Physical Status
Displays the current physical status — or operational state — of the interface:
Online or Offline.
Logical Status
Displays the current logical status — or administrative state — of the interface:
Up or Down.
2-24 Managing the Hub
Page 39

Interface Performance Statistics/Bar Graphs
The statistical values (and, where available, the accompanying bar graphs) to the
right of the interface description fields provide a quick summary of interface
performance. You can select the statistical value you want to display and the units
in which you want those values displayed by using the two menu fields directly
above the interface display area, as follows:
1. In the right-most menu field, click on the down arrow and select the unit in
which you wish to display the selected statistic: Load, Raw Counts, or Rate.
Bar graphs are only available when Load is the selected base unit; if you select Raw
NOTE
Counts or Rate, the Bar Graph column will be removed from the interface display.
2. Once you have selected the base unit, click on the down arrow in the left-most
field to specify the statistic you’dlike to display. Note that the options available
from this menu will vary depending on the base unit you have selected.
The ATX Switch Chassis View
After you select a new display mode, the statistics (and graphs, where applicable)
will refresh to reflect the current choice, as described below.
Raw Counts
The total count of network traffic received or transmitted on the indicated
interface since device counters were last reset. Raw counts are provided for the
following parameters:
In Octets Octets received on the interface, including framing
characters.
In Packets Packets (both unicast and non-unicast) received by the
device interface and delivered to a higher-layer protocol.
In Discards Packets received by the device interface that were
discarded even though no errors prevented them from
being delivered to a higher layer protocol (e.g., to free up
buffer space in the device).
In Errors Packets received by the device interface that contained
errors that prevented them from being delivered to a
higher-layer protocol.
In Unknown Packets received by the device interface that were
discarded because of an unknown or unsupported
protocol.
Out Octets Octets transmitted by the interface, including framing
characters.
Managing the Hub 2-25
Page 40

The ATX Switch Chassis View
Out Packets Packets transmitted, at the request of a higher level
Out Discards Outbound packets that were discarded by the device
Out Errors Outbound packets that could not be transmitted by the
Load
The number of bytes processed by the indicated interface during the last poll
interval in comparison to the theoretical maximum load for that interface type.
Load is further defined by the following parameters:
In Octets The number of bytes received by this interface, expressed
Out Octets The number of bytes transmitted by this interface,
protocol, by the device interface to a subnetwork address
(both unicast and non-unicast).
interface even though no errors were detected that
would prevent them from being transmitted. A possible
reason for discard would be to free up buffer space in the
device.
device interface because they contained errors.
as a percentage of the theoretical maximum load.
expressed as a percentage of the theoretical maximum
load.
When you select this option, a Bar Graph field will be added to the interface
display area; this field is only available when Load is the selected base unit.
Rate
The count for the selected statistic during the last poll interval. The available
parameters are the same as those provided for Raw Counts. Refer to the Raw
Counts section, above, for a complete description of each parameter.
Viewing Interface Detail
The Interface Statistics window (Figure 2-15) provides detailed MIB-II interface
statistical information — including counts for both transmit and receive packets,
and error and buffering information — for each individual port. Color-coded pie
charts also let you graphically view statistics for both received and transmitted
Unicast, Multicast, Discarded, and Error packets.
To open the Interface Statistics window:
1. In the I/F Summary window, click to select the interface for which you’d like to
2. Click on Detail. The appropriate I/F Statistics window, Figure 2-15, will
view more detailed statistics.
appear.
2-26 Managing the Hub
Page 41

Figure 2-15. Interface Detail Window
The ATX Switch Chassis View
Three informational fields appear in the upper portion of the window:
Description
Displays the interface description for the currently selected interface: Ethernet.
Address
Displays the MAC (physical) address of the selected interface.
Type
Displays the interface type of the selected port: ethernet-csmacd, sdlc, or other.
The lower portion of the window provides the following transmit and receive
statistics; note that the first four statistics are also graphically displayed in the pie
charts.
Unicast
Displays the number of packets transmitted to or received from this interface that
had a single, unique destination address. These statistics are displayed in the pie
chart, color-coded green.
Non-Unicast
Displays the number of packets transmitted to or received from this interface that
had a destination address that is recognized by more than one device on the
network segment. The multicast field includes a count of broadcast packets —
those that are recognized by all devices on a segment. These statistics are
displayed in the pie chart, color-coded dark blue.
Managing the Hub 2-27
Page 42

The ATX Switch Chassis View
Discarded
Displays the number of packets which were discarded even though they
contained no errors that would prevent transmission. Good packets are typically
discarded to free up buffer space when the network becomes very busy; if this is
occurring routinely, it usually means that network traffic is overwhelming the
device. To solve this problem, you may need to re-configure your bridging
parameters, or perhaps re-configure your network to add additional bridges or
switches. Consult the Network Troubleshooting Guide for more information.
These statistics are displayed in the pie chart, color-coded magenta.
Error
Displays the number of packets received or transmitted that contained errors.
These statistics are displayed in the pie chart, color-coded red.
Unknown Protocol
Displays the number of packets received which were discardedbecause they were
created under an unknown or unsupported protocol.
Packets Received
Displays the number of packets received by the selected interface.
Transmit Queue Size
Displays the number of packets currently queued for transmission from this
interface. The amount of device memory devoted to buffer space, and the traffic
level on the target network, determine how large the output packet queue can
grow before the 9H42x-xx module will begin to discard packets.
Packets Transmitted
Displays the number of packets transmitted by this interface.
Making Sense of Detail Statistics
The statistics available in this window can give you an idea of how an interface is
performing; by using the statistics in a few simple calculations, it’s also possible to
get a sense of an interface’s activity level:
To calculate the percentage of input errors:
(Received only)
(Received only)
(Transmit only)
(Transmit only)
Received Errors /Packets Received
To calculate the percentage of output errors:
Transmitted Errors /Packets Transmitted
To calculate the total number of inbound and outbound discards:
Received Discards + Transmitted Discards
2-28 Managing the Hub
Page 43

To calculate the percentage of inbound packets that were discarded:
Received Discards /Packets Received
To calculate the percentage of outbound packets that were discarded:
Transmit Discards /Packets Transmitted
Unlike the Interface Detail window, which this window replaces, the Interface Statistics
NOTE
window does not offer Disable or Test options. These options are available in the
Interface Group window, which can be accessed via the System Group window (select
System Group...from the Device menu). Refer to your Generic SNMP User’s Guide
for further information on the System Group and Interface Group windows.
Enabling and Disabling Ports
From the Port menus on the ATX Chassis View window, you can administratively
enable and disable the ports.
The ATX Switch Chassis View
In the ATX Switch Bridge Chassis View, the first Bridge port in the first module is not a
NOTE
port at all, but instead represents the Packet Processing Engine (PPE) of the ATX Switch,
which occupies the top slot in the ATX Switch chassis. You will therefore not be able to
enable or disable this “port.”
You can, however, access an interface description text box for the first bridge port index.
Administratively Enabling and Disabling Ports
When you administratively disable a bridge port, you disconnect that port’s
network from the bridge entirely. The port does not forward any packets, nor
does it participate in Spanning Tree operations. Nodes connected to the network
can still communicate with each other, but they can’t communicate with the
bridge or with other networks connected to the bridge. When you enable a port,
the port moves from the Disabled state through the Learning and Listening states
to the Forwarding state; bridge port state color codes will change accordingly.
To enable or disable a bridge port:
1. Click on the desired Port index. The Port menu will appear.
2. Click on Admin Enable to enable the port, or Admin Disable to disable the
port. Your port will now be enabled or disabled as desired.
For more information about bridging functions and how to determine the current state of
NOTE
each bridge port, see the Bridging chapter in the Tools Guide.
Managing the Hub 2-29
Page 44

The ATX Switch Chassis View
2-30 Managing the Hub
Page 45

Using ATX Trunking
The Trunking Table window; enabling and disabling trunking
Trunking, an extension of the 802.1D Spanning Tree protocol, allows you to
increase aggregate bandwidth when two or moreswitches are connected. A single
10BASE-T connection between switches yields 10 or 100 Mbps of bandwidth,
depending on the speed of the ports used for the connection. A trunk group is
created when two or more ports on the same switch (for which trunking protocol
is enabled) are physically connected to the same remote switch. By creating a
trunk group, each additional connection results in another 10 or 100 Mbps of
bandwidth, since the group of ports effectively acts as a single connection. The
trunking protocol modifies Spanning Tree to allow the redundant links which
form a trunk group. Trunking can be enabled or disabled for a port using the
Trunking Table window (Figure 3-1). Trunking can be enabled for use on up to
eight ports per switch, allowing you to configure up to four trunk groups
potentially yielding 80 or 800 Mbps of bandwidth, depending on the speed of the
interfaces.
Chapter 3
NOTE
Although you can enable trunking for more than eight ports in your ATXchassis (if more
than eight ports exist in your chassis), the trunking protocol prohibits the use of trunking
on more than eight ports at a time. If you enable trunking and establish a valid link for a
ninth port, the extra port will be in “hot standby” mode. If connections are broken for any
of the original eight trunk ports, the hot standby port will then participate in trunking,
provided that it has a valid link to a remote switch which is participating in a trunk
group.
To display the Trunking Table window from the ATX Chassis View:
1. Click on the PPE’s Module Index (Module 1). The Module menu will appear.
2. Drag down Port Trunking, and release. The Port Trunking window,
Figure 3-1, will appear.
3-1
Page 46

Using ATX Trunking
Trunking Table
Port Selection Area
Figure 3-1. The Trunking Table Window
The Port Trunking Window
The Port Trunking window features the trunking table (in the upper portion of
the window), which displays the following information about each interface for
which trunking is enabled:
Index
Displays the port’s strunkIfIndex identifier.
State
Indicates the port’s trunking condition (strunkState). The possible states are:
• closed — trunking is enabled, and the trunking protocol is attempting to
establish a trunk connection, but the port has not yet received any trunking
PDUs.
• oneway — trunking is enabled, and the trunking protocol is attempting to
establish a trunk connection, but incomingtrunking PDUs donot indicate that
the ATX’s trunking PDUs are being successfully received at the other end of
the link.
• joined — trunking is enabled, the trunking protocol has established a good
trunk connection, and the port is actively participating in the trunk group.
• perturbed— trunkingis enabled,the trunking protocol has established agood
trunk connection, and the port is actively participating in the trunk group;
however, the transmission of data packets has been temporarily stopped due
to a change in trunk group membership.
3-2 The Port Trunking Window
Page 47

NOTE
Using ATX Trunking
• helddown — trunking is enabled, but the trunk connection has been rejected.
Indicates that an error has been detected and the link is being held out of
service until the error condition clears. After a short time-out period, another
attempt will be automatically initiated to establish a good trunk connection.
• broken — the port has been configured for trunking, but is physically non-
operational.
Rmt Bridge Id
Displays the MAC address portion of the remote bridge’s bridge ID.
The Rmt Bridge Id field can be used to determine which ports belong to which trunk
group. Ports in the same trunk group will have the same remote bridge ID.
Rmt IP Address
Displays the remote bridge’s IP address.
Last Error
Displays the reason for failure when the link is in a helddown state. Reasons for
failure include:
• (1)none —noerror;the trunking protocol may restart with noerrorconditions
when trunking is activated for a port or when the MIB variable that controls
extra trunk groups is modified.
• (2) in-bpdu — a spanning tree BPDU was received, indicating that the
connection is not point-to-point, or that the far end of the link does not have
trunking enabled.
• (3)multiple-bridges — a different bridge has been connected at the far end of
the link, and the trunking protocol will restart.
• (4) ack-lost (acknowledgment lost) — the far end of the link has detected a
problem, and the trunking protocol will restart.
• (5) standby — the trunk group is filled to capacity with other ports; this port
is now a hot standby. If another port leaves the trunk group, this port will then
be included in the group.
• (6)too-many-groups — the maximumnumber of groups(4) has been reached,
and a new group cannot be added. This port will not be used until the
condition clears.
• (7)no-ack (no acknowledgment) — this port has not received a valid trunking
packet, and the trunking protocol will restart.
• (8) perturbed-threshold — errors are preventing stabilization, and the
trunking protocol will restart.
The Port Trunking Window 3-3
Page 48

Using ATX Trunking
• (9) self-connect — this port is connected to another port on the same device.
This port cannot be used until the condition clears.
• (10) port-moved — a different port has been connected at the far end. The
trunking protocol will restart.
• (11) multiple-lan-types — several LAN types have been connected on the
same device.
Link Ordinal
Displays the position of the port’s link within its trunk group.
Link Count
Displays the number of links within the port’s trunk group.
Last Change
Displays the time (in seconds) since the port’s trunk state (sftrunkState) changed.
The lower portion of the Trunking Table window displays the port selection area
which, when used in conjunction with the Enable and Disable buttons at the
bottom of the window, allows you to enable or disable trunking for selected ports.
The port selection area lists each of the ATX’s ports and whether or not they are
enabled, accompanied by each port’s MIB II ifIndex, ifType, ifSpeed.
Trunking cannot be enabled for the PPE (port 1). The Enable and Disable buttons will be
NOTE
grayed out when this port is selected.
The Trunking Table window also features:
Clear button -- when clicked, any selections you have made in the port selection
area will be deselected.
Update button -- when clicked, the ATX will be queried for trunking information,
and any changes that have occurred since the window was opened (or since the
Update button was last clicked) will be reflected in the trunking table.
Enabling and Disabling Trunking
To enable trunking for your ATX ports using the Trunking Table window:
1. In the port selection area, click on the selection buttons representing the ports
for which you would like to enable trunking.
2. Click on . The trunking table will update to include the new trunking
selections.
3-4 The Port Trunking Window
Page 49

NOTE
Using ATX Trunking
802.1D Spanning Tree takes about 30 seconds to resolve which ATX ports in a
trunk group are to become forwarding ports. As ports within a trunk group
become forwarding ports, traffic within the trunk group will be momentarily
halted to guarantee the first-in, first-out ordering of Ethernet packets.
Connections between ATX switches must be point-to-point; there cannot be any other
devices on those segments. The ATX ports used for trunking can be in any order.
Remember, though, that the switches on both ends of the connections must have trunking
enabled for their ports which are used for the connections.
Trunking can only be disabled for one port at a time. To disable trunking for your
ATX ports using the Trunking Table window:
1. In the port selection area, click on the selection button representing the port
for which you would like to disable trunking.
2. Click on Disable. The trunking table will update to reflect the new trunking
selections.
3. If you are disabling trunking for more than one port, click on Clear to clear
your previous selection in the port selection area.
4. Repeat steps 1-3 for any other ports for which you would like to disable
trunking.
The Port Trunking Window 3-5
Page 50

Using ATX Trunking
3-6 The Port Trunking Window
Page 51

Using ATX Port Filtering
Port filter table information; adding filters; viewing statistics
The ATX lets you create custom filters to screen data packets, and discard or
forward traffic based on the specified filter criteria. You may have several reasons
for creating filters — for example, to monitor traffic patterns as an aid to
optimizing your network design, or to evaluate your network security. Among
the criteria you can select for filtering are the packet’s source or destination
address, its entry or exit port, the packet’s Protocol type, or a 64 byte data value
filter applied anywhere in the packet’s data.
The ATX supports two basic types of filters:
Chapter 4
• Entry filters are pre-processing filters, applied to a port to screen incoming
traffic. The filter condition is satisfied before a bridging decision is made at the
port. Youcan use this filter to block incoming traffic from aparticular segment,
for instance.
• Exit filters are post-processing filters. The packet is received and processed at
a port, and then screenedafter a bridging decision is made at the port. Youcan
use this filter to allow traffic to be forwarded from a segment to some ports on
a bridge, but not to others, for example.
There are two basic methods of determining how packets get filtered:
• Bridge Address Table filters are created in the Bridge Filtering Database, and
are based on the address information stored in the bridge’s Source Address
Table. They let you screen packets on any source address that is recorded as a
static or dynamic entry in the bridge’s Source Address Table. The Source
Address Table can store up to 8,192 entries, of which 200 can be statically
createdthroughmanagement. By usingthese filters, youcan selectively screen
traffic to or from a particular station according to its MAC address, or filter on
multicastpackets — such as theFF-FF-FF-FF-FF-FF broadcast MAC address —
transmitted from a particular source address (to prevent broadcast storms
from propagating over the network from that source).
4-1
Page 52

Using ATX Port Filtering
• Port filters use the physical index number of a bridge port to determine
The Port Filtering window (Figure 4-1) allows you to view and configure the
ATX’s Port Filtering capabilities.
To access the Port Filtering window:
1. Click on the PPE’s Module Index (Module 1). The Module menu will appear.
2. Drag down Port Filtering, and release. The Port Filtering window, Figure 4-1,
whether traffic is to be screened at the port. These filters are useful for
screeningpacketsfrombeingforwardedonto a port’s attached segment.When
you use Port filters in combination with Bridge Address Tableentries, you can
create highly specific filtering conditions to allow certain packets to be
forwarded onto a port’s attached segment, or be filtered from it. For example,
you could make a filter that screens packets only if they are forwarded from
Port 3 of the ATX, are AppleTalk protocol packets, and are destined for a
station with an XYZ physical address.
will appear.
4-2
Figure 4-1. ATX Port Filtering Window
Page 53

Port Filters Table Information
The scrolling window at the top displays the filters defined for each port and
provides the following information about them:
Id (Identifier)
An identifier assigned to each filter entry in the Port Filters table. This identifier is
used to keep track of the number of entries in the Port Filters table, and is
incremented or decremented as necessary when filters are added to or removed
from the table. (Once the filter count has changed, you must refresh the window
to display the new identifiers.)
Type
The traffic direction at which a filter will take effect is determined by whether it is
an Entry filter or an Exit filter. An ENTRY filter is a pre-processing filter that is
applied to packets incoming from a port’s attached segment prior to any bridging
action taking place at the port. An EXIT filter is applied at a port to screen packets
outgoing from the port — that is, to screen packets once it has been determined
they should be bridged to other ports on the ATX.
If your ATX supports Port Mirroring, you can also use filters in conjunction with
the mirroring application. By using filters, you can reduce the amount of traffic
being mirrored. This may be especially useful when mirroring traffic to a remote
device. Note that Mirror Filters are not stored in the same location as Port Filters,
so the number of Mirror Filters you create will not affect the number of Port
Filters that can also be created.
Using ATX Port Filtering
To create a Mirror filter, select MENTRY (to filter incoming traffic at a port, as
described above for Entry Filter) or MEXIT (to filter outgoing traffic from a port,
as described above for Exit filter) from the Type list box.
Pseudo
A Pseudo filter can be used for test purposes to gather statistics without actually
filtering packets at the port. YES indicates a Pseudo filter is in effect at the port;
NO indicates the filter in effect at the port is actually screening packets.
Protocol
You can use a Protocol filter to screen traffic based on its protocol type. Predefined protocol types that you can screen on include any-802, any-ethernet,
Appletalk, Banyan, DECnet Phase IV, IP, Novell 1, Novell 2, XNS, Cabletron,
Enterasys, or you can screen on Other (which allows you to specify the protocol
type).
Source
Indicates the starting address of a filter based on a range of source MAC
addresses.
Port Filters Table Information 4-3
Page 54

Using ATX Port Filtering
Destination
Indicates the starting address of a filter based on a range of destination MAC
addresses.
MAC Addresses must be entered into this window in Canonical (Ethernet) format.
NOTE
Offset
Indicates the hexadecimal offset of a data field filter designed to screen packets
based on a portion of the data field.
Operator
The Boolean operator in effect for this filter. OR indicates the filter is a stand-alone
filter for packets received by this port; AND indicates this filter is to be used in
combination with the succeeding filter (of the same Entry/Exit type) to screen
packets at this port.
You use the following command buttons in conjunction with the Port Filters
window:
Add
Use this button to create a new entry or edit an existing entry in the Filter Table
(using the filter definition fields in the lower portion of the window).
Delete
Use this button to delete a highlighted entry in the Filter Table. This will cause the
filter identifiers to be regenerated.
Refresh
While you are creating or modifying a filter, use this button to clear all filter
definition fields back to their default states.
Apply
The Apply button will request current information from the Filter Table. Use this
button if you have created new entries in, or deleted old entries from, the Port
Filters table and need to update the filter display.
Editing the Port Filters Table
The bottom two thirds of the window are filter definition fields for adding and
modifying filters. Use these fields as described in the following sections to update
the Port Filters table at your ATX.
4-4 Editing the Port Filters Table
Page 55

Remember that the ATX’s performance may be adversely affected if you define a large
!
CAUTION
NOTE
number of Port filters. Because the ATX has to decode packet data further than it would if
no filters were established, the forwarding rate of traffic may be slowed as packets are
buffered and decoded.
Typically, if you create Bridge Address Table filters or only a small number of Port filters,
the forwarding rate of the ATX will not be affected; however, the more complex or greater
number of Port filters that you create, the moretraffic flow will be affected. For this reason,
it is good practice to delete filters from the Port Filtering Table when they are no longer
needed.
If you are also performing Work Group Configuration on your ATX, remember that each
Work Group that you establish will reduce the number of Port filters you can configure at
a one-to-one ratio.
Adding a New Filter
Using ATX Port Filtering
The ATX allows you to create up to 100 Port filters (total for all connected ports).
To add a new filter to the ATX or modify a previously configured Port Filter:
1. In the Port field, type in the interface number of the port to which this filter will
apply.
2. Click on the Type button to select the filter type: ENTRY (the default type)
EXIT, MENTRY, or MEXIT.
• Entry filters are used to screen incoming traffic at a receive port. They are
applied to packetsas they are being received by a specified port.
• Exit filters are used to screen outgoing traffic from the receive port. They
are applied to packets
port.
• Mirror Entry filtersare used to screen incoming traffic ata receive port that
supports and is using port mirroring. They are applied to packetsas they
are being received by a specified port.
• Mirror Exit filters are used to screen outgoing traffic from the receive port
when the port supports and is using port mirroring. They are applied to
packets
3. Click on the Pseudo button to indicate whether you want to create a pseudo
filter.
after
they are received and forwarded by a specified port.
after
theyare receivedand forwardedby a specified
• YES indicates that you wish to create a pseudo filter — one which gathers
statistics on all packets that have met the filtering criteria, but does not
actually filter them. Pseudo filters are useful if you want to determine the
effects of a filter without actually implementing it, or for monitoring traffic
Editing the Port Filters Table 4-5
Page 56

Using ATX Port Filtering
4. You can use Boolean AND/OR operators to logically link a series of filters
flow as an aid in determining yournetwork design or usage policies before
actually reconfiguring the network.
• NO (the default) indicates that you want to create an actual filter.
together for packets received on the defined port.
Port filters are maintained in a table. Each filter that you define is assigned an
index number in the table — incrementing the previous index number by one.
Port filtering is a one pass, sequential operation — that is, when a packet
enters a port, it is checked against each filter defined for that port in turn and
then filtered or forwarded, as appropriate.
When filters are defined for the
can use Boolean operators to group two or more filters together so they act as
a single filter, or to indicate that a filter be treated as an individual entity.
By linking Port filters with a Boolean AND operator, a packet must meet the
condition of this filter, as well as any succeeding filters linked by ANDs that
have been defined for the specified port and have the same Entry or Exit
value.For example, if an entry filter set to screen AppleTalk packetsis ANDed
with an entry filter set to screen packets with a broadcast address, the
cumulative effect of the filters will only screen broadcast AppleTalk packets,
letting other broadcast or AppleTalk packets be forwarded from the port.
When a Port filter is given a Boolean OR operator, a packet received on the
defined port is only checked against the conditions set in the single filter. If the
two filters mentioned previously had an OR operator between them,
broadcast packets and
forwarded through the port.
Click on the Boolean Operator: AND/OR button to determine whether this
filter will be combined with other filters with the same Entry or Exit value that
are defined for the same port.
a. Toggle the button to AND as the Boolean operator to filter packets by
using this filter and the succeeding Port Filter (as entered in the Port
Filters list) for same port.
all
same
port number
and
Entry or Exit value,you
all
AppleTalk packets would be filtered from being
b. Toggle the button to OR (the default) to filter packets based only on the
criteria specified within this filter.
5. To use a range of Source Addresses as a filter criteria:
a. In the Filter Parameters section, click on the Source Address Range
check box to activate the Source Address Range text fields.
b. Indicate whether you want the specified address range to be exclusive or
inclusive for filtering purposes.
1.) Click to activate (highlight) the Not In Range check box if you want to
filter on any source address outside of the specified range.
4-6 Editing the Port Filters Table
Page 57

Using ATX Port Filtering
2.) Click to de-activate (gray-out)the Not In Range check boxif you want
to filter on source address values within the specified range. This is
the default.
c. Click in the Mask: text box and type in an address mask value that you
want to apply to the source address range. (The default is all FF’s. An F in
the mask indicates that you want to match the corresponding bit within the
address range; a 0 in the mask indicates a “don’t care” bit. Forexample, a
mask of FF:FF:FF:F0:00:00 indicates that you want to decode the 6-byte
address to the seventh bit, and you don’t care about the remaining five
bits).
d. Click in the Begin: text box, and type in the source address that you want
to use as the initial entry within the range (in hexadecimal
XX:XX:XX:XX:XX:XX format, where the value of XX ranges from 00-FF).
e. Click in the End: text box, and type in the source address that you want to
use as the final entry within the range (in hexadecimal
XX:XX:XX:XX:XX:XX format).
6. To use a range of Destination Addresses as a filter criteria:
a. In the Filter Parameters section, click on the Destination Address
Range check box to activate the Destination Address Range text fields.
b. Indicate whether you want the specified address range to be exclusive or
inclusive for filtering purposes.
1.) Click to activate (highlight) the Not In Range check box if you want to
filter on any destination address outside of the specified range.
2.) Click to de-activate (gray-out)the Not In Range check boxif you want
to filter on destination address values within the specified range. This
is the default.
c. Click in the Mask: text box and type in any mask value that you want to
apply to the destination address range.
d. Click in the Begin: text box, and type in the destination address that you
want to use as the initial entry within the range (in hexadecimal
XX:XX:XX:XX:XX:XX format, where the value of XX ranges from 00-FF).
e. Click in the End: text box, and type in the destination address that you
want to use as the final entry within the range (in hexadecimal
XX:XX:XX:XX:XX:XX format).
Editing the Port Filters Table 4-7
Page 58

Using ATX Port Filtering
If you want to filter on a single source or destination address, make sure the address is
TIP
entered in both the Begin and End text boxes.
You can use both the source and destination address fields to filter data based on
equipment vendor, since the first three bytes of a MAC address are unique to a specific
vendor. For example, Sun workstations have a MAC address with the first three bytes
08:00:20. By setting a filter range of 08:00:20:00:00:00 to 08:00:20:FF:FF:FF, you could
filter all Sun workstation traffic on a particular segment.
7. You can use a data field value as a filter criteria by using the Field Offset
parameters. A data field value allows you to examine a packet (at a location
specified by a data Field Offset) for up to 64 bytes of data that will act as the
filtering criteria. To specify the portion of the packet you want examined, you
indicate where you want the data field to be examined (relative to an Origin
point), and enter the data value that you want to filter on (using a mask if
necessary to ignore any “don’t care” bytes). To use the Field Offset
parameters:
a. In the Filter Parameters section, click on the Field Offset check box to
activate the Field Offset text fields.
b. Indicate whether you want the specified field offset to be exclusive or
inclusive for filtering purposes.
1.) Click to activate(highlight) the Don’t Match check box if you want the
packet to be filtered if it does not match the field offset value.
2.) Click to de-activate (gray-out) the Don’t Match check box if you want
to the packet to be filtered if it matches the field offset value. This is
the default.
c. Click in the Offset text field, and type in the offset — in hexadecimal —
that indicates the number of bytes from the origin (discussed in the next
step) at which you want to begin examining the packet’s data field. For
example, an Offset of 1A indicates that you want to examine the packet
starting 26 bytes after the specified origin point.
d. Click on the Origin: button to determine where you want the field offset to
begin:
1.) Select MAC if you want the offset to be applied relative to the
beginning of the MAC addresses; an offset of 0 indicates the start of
the destination MAC address.
2.) Select IP if you want the offset to be relative to the end of the IP
header; an offset of 0 indicates the portion immediately following the
end of the IP header.
3.) Select SR if you want the offset to be relative to the end of the MAC
header, including the Source Routing (SR) header, if present.
4-8 Editing the Port Filters Table
Page 59

Using ATX Port Filtering
4.) Select FRAME if you want the field offset value relative to the end of
the Ethernet frame type (regardless of whether or not the frame type
is SNAP encapsulated). Forexample, forIP packets, a field offset of 0
indicates the start of the IP header.
e. If you want to use a data mask, click in the Mask: text box and type in an
eight octet hexadecimalmask that will be applied to the eight octets within
the packetbefore they are compared to the specified field value. Use an F
in the bitmask where you want to indicate an exact match to the
corresponding data field value; use a 0 in the bitmask to indicate a “don’t
care” bit.
f. To enter the Valuethat the filter will use when comparing packet data fora
match, click in the text box, and enter the hexadecimal field value of the
eight octets (beginning at the Offset from the specified Origin). Do
separators between each octet.
not
use
Each octet
example, if you were searching for a MAC address, you must enter each
bit in the address (00001d01020A, as opposed to 001d12A).
8. To use a packet’s protocol type as the filtering criteria:
a. Click the Frame Protocol selection box.
b. Indicate whether you want the specified protocol type to be exclusive or
inclusive for filtering purposes.
1.) Click to activate (highlight) the Don’t Match check box if you want to
filter on any packet that is not of the selected protocol type.
2.) Click to de-activate (gray-out) the Don’t Match check box if you want
to filter on packets that are of the selected protocol type. This is the
default.
c. Click on the Protocol menu button, and drag to select the appropriate
protocol type: any-802, any-ethernet, Appletalk, Banyan, DECnet
Phase IV, IP, Novell 1, Novell 2, XNS, Cabletron, Enterasys, or Other.
If you select one of the provided protocol types, its hexadecimal identifier
will appear in the Number (hex) text field (e.g., Appletalk=809b).
If you select Other, you can use the Number (hex) text field to enter the
hexadecimal identifier of the protocol type of your choice.
must
be represented by a two digit hexadecimal value. For
9. With the Filter Alarm parameters, you can configure the ATX to issue a trap
when a defined threshold of packets matching this filter’s parameters has
been exceeded within a specified interval.
a. Click in the Interval: text box, and enter the number of seconds during
which the specified threshold must be exceeded for a trap to be issued.
The range is from 0–3600 (1 hour), where 0 indicates no trap should be
generated.
Editing the Port Filters Table 4-9
Page 60

Using ATX Port Filtering
b. Click in the Threshold: text box, and enter the number of packets
matching this filter that must be detected within the given interval for the
trap to be generated.
If you are monitoring the ATX, you must set the configAlarmDynamic MIB OID
NOTE
(1.3.6.1.4.1.97.3.3.1.12) to 1 (True) for the ATX to generate the trap.
10. Once you have finished specifying the parameters for the filter, click on Add.
The filter and its parameters will be displayed in the Port Filters list.
Deleting a Port Filter
To delete a filter from the Port Filter table:
1. Highlight the desired filter in the Port Filters list.
2. Click on Delete. The selected Filter will be erased from the Port Filters table,
and the filter identifiers will be regenerated accordingly.
Viewing Filter Statistics
You can use the Filter Statistics fields to get performance feedback on any entry in
the device’s Port Filters table.
Last Frame Address
This field displays the source MAC address of the last frame that was screened by
this filter.
Packets
The Packets field indicates the number of packets that this entry has caused to be
filtered.
Bytes
This field displays the sum total of bytes in the filtered packets.
4-10 Viewing Filter Statistics
Page 61

Workgroup Configuration
Workgroups explained; adding and deleting workgroups from this window
The virtual workgroups feature of the ATX allows you to restrict multicast or
broadcast traffic from being propagated through every bridge port on your
device. This optimizes bandwidth by limiting the subnet broadcast traffic — such
as IP ARPs, or IPX Get Nearest Server Requests and Service Advertisement
Protocol packets — to only those ports that require the traffic. You define a virtual
workgroup by specifying a subset of device ports, the network protocols in effect
at the ports (IP, IPX, or All — any other frame type), and any IP or IPX network
identifier for the “broadcast domain” that you want to restrict. Each port can
belong to more than one workgroup (e.g., if both IP and IPX traffic are broadcast
over the same network segment). In all, you can create up to 100 virtual
workgroups per switch.
Chapter 5
NOTE
The ATX does not support workgroups in firmware versions earlier than 3.2.
The following provides a brief overview of how the virtual workgroups feature
works:
• When a Spanning Tree Forwarding port on an ATX receives a broadcast
packet, the ATX first determines the frame type of the packet: IP, IPX or ALL
(any other frame type). (Refer to the Tools Guide for more information on
bridging and Spanning Tree.)
• If no workgroups are defined on the ATX,the packet will be sent out all other
ports on the bridge that are in a Spanning Tree forwarding state.
• If the receiving port is part of at least one defined workgroup, the ATX
determines whether the workgroups to which the port belongs areconfigured
for the packet’s frame type (i.e., IP, IPX, or ALL).
5-1
Page 62

Workgroup Configuration
In a case where an ALL and an IP or IPX workgroup exist for the same port, the
NOTE
forwarding parameters for IP or IPX packets will be determined based on the IP or IPX
workgroup. Any non-IP or non-IPX packets will use the parameters set in the ALL
workgroup.
- If the ATX determines that the port does not belong to any workgroup
configured for the received packet’s type, the packet will again be sent out
through all other ports on the bridge that are in a Spanning Tree
Forwarding state.
- If the ATX determines that the port is a member of a single workgroup
configured for the received packet’s type, the packet will only be
forwarded to the other ports that are members of that same workgroup.
- If the ATX determines that the port is a member of multiple workgroups,
the ATXnarrowsdown the most appropriate workgroup (orworkgroups)
for the broadcast packet, andsends it throughall forwardingports that are
members of the appropriate workgroup (or workgroups).
Ifthe workgroups are configured for ALL broadcast packets, thebroadcast
is sent throughthe combined ports in those workgroups. Note thatif an IP
or IPX broadcast is detected at the port, but no IP or IPX workgroup is
defined for the port, then any ALL workgroup configured for the port will
be used instead.
If the workgroups are configured for an IP network, the IP routing tables
of those workgroups are combined, and the standard IP “best match”
algorithm is performed:
1. Attempt to match the complete destination IP of the broadcast —
matching network and host ID — and then, if a routing table entry is
found, forward the broadcast to the indicated next hop router or directly
connected interface; if this fails,
2. Search the routing table for an entry that matches only the network ID,
and then — if one is found (taking into account a subnet mask) — forward
the broadcast to the indicated next hop router or directly connected
interface; finally,
3. If no entry is found matching the network ID, search the routing tables
for a “default” entry, and forward the broadcast to the indicated next-hop
router.
If no match is found for the broadcast packet’s destination address using
the above methods, the packet is considered undeliverable and is
forwarded out all Spanning Tree Forwarding ports.
5-2
Page 63

NOTE
Workgroup Configuration
If the received packet has a class D IP address indicating a multicast group address
(224.0.0.0 through 239.255.255.255), the workgroups will not be used and the normal IP
forwarding rules apply.
If the workgroups are configured for an IPX network:
1. If the destination IPX network of the packet is zero, then all IPX
workgroups for the receiving port are combined.
2. If the destination IPX network of the packet matches the IPX network
defined for a workgroup, the broadcast will be sent to port members of
that workgroup.
3. If a default IPX workgroup for the receiving port is indicated, then the
broadcast will be sent out of the ports in that workgroup.
If none of these conditions apply, the packet will be forwarded out all
Spanning Tree forwarding ports.
To access the Virtual Workgroups window:
1. Click on the PPE’s Module Index (Module 1). The Module menu will appear.
2. Drag down to Workgroups.... The Virtual Workgroups window, Figure 5-1 will
appear.
Figure 5-1. Virtual Workgroups Window
5-3
Page 64

Workgroup Configuration
You can both view existing workgroups and configure new workgroups from this
window. The Workgroup Table at the top of the window lists each existing
workgroup along with its configuration information. The lower section of this
window allows you to set-up the parameters of your workgroup, including
Name, Type, and IP or IPX network identifier and contains a Port Selection box in
which you can choose the ports that will be included in the workgroup. The only
fields that are not user-configurable are the Index and Total fields. These are
described below:
Index
A unique number assigned to identify each workgroup in the table.
Total
Displays the total number of workgroups you have configured on your device;
this is displayed above the Workgroup Table.
You can configure up to 100 workgroups. Note that for the ATX, the workgroups will be
NOTE
stored in the same space reserved for port filters; therefore the number of workgroups you
have configured will affect the number of port filters you can set.
Configuring a Workgroup
To configure a workgroup from the Workgroup Configuration window:
1. Type a name in the Name field in the middle portion of this window. The name
can be 1-16 alphanumeric characters. You will use the name to identify the
workgroup.
2. Choose the Type of workgroup you would like to create. This determines
which broadcast packetframe type you want to restrict to the member ports of
this workgroup. The following are your possibilities:
• IP — the broadcast packet is forwarded through the workgroup member
ports only when it is an IP frame.
• IPX — the broadcast/multicast packetis forwarded through the workgroup
ports only when it is an IPX frame.
• All — all broadcast or multicast packets, regardless of packettype, will be
forwarded through all the ports in the workgroup.
a. If you choose IP as your workgroup type, you
address identifying the subnetwork which encompasses the member
ports (i.e., containing the network and subnetwork identifiers for hosts on
that subnet);
subnetting scheme (i.e., one for which the default standard IP address
class mask is not sufficient).
optionally
must
enter the network IP
, you can enter the IP Mask if you have a complex
5-4 Configuring a Workgroup
Page 65

Workgroup Configuration
• IP Address — you must enter a network IP address for the member
ports’ subnetwork. If the subnet identifier of the received packet’s
destination IP address matches the set workgroup IP address (when
compared toany set IP Mask), the packet will only be forwardedto the
other member ports of the workgroup.
• IP Mask — If your network uses a complex subnetting scheme (in
which the host identifying portion of the IP address is not subnetted on
the byte boundary), youcan enter the IP Mask identifying hosts within
the subnetwork.
b. If you choose IPX as your workgroup type, you can enter a specific IPX
Network Address to use as a match for incoming broadcast packets. The
IPX Network Address is a 4 byte hexadecimal value that has been
assigned to the IPX network. If you leave the IPX Network Address blank,
this workgroup will be considered the default IPX workgroup.
3. In the Ports in Workgroup area, click on the check boxes corresponding to
the ports you would like to include in this workgroup.Each port is identified by
indexnumber, interface type, and interface speed. Note that youcannot select
Port 1 (the Network Management PPP port) for inclusion into a workgroup.
4. Click on Add. The new workgroup entry will be added into the Workgroup
table.
5. Repeat steps 1-5 to set up any additional workgroups.
Deleting a Workgroup
Highlight the workgroup you would like to delete in the Workgroup Table. Click
on Delete, the highlighted workgroup will be deleted. To have this change
reflected in the workgroup table, click on Apply. The currently defined
workgroups will be displayed.
Configuring a Workgroup 5-5
Page 66

Workgroup Configuration
5-6 Configuring a Workgroup
Page 67

Chapter 6
ATX Port Mirroring
Using Port MIrroring; configuring port mirroring locally; configuring port mirroring remotely
The Port Mirroring utility allows you to capture network traffic appearing on one
or more of the ATX’s ports, and to reproduce that traffic on a designated
“diagnostic” port for monitoring purposes. The diagnostic port may be another of
the ATX’s ports (Ethernet, Token Ring, or FDDI), or a remote port on another ATX
in your network.
The Port Mirroring window (Figure 6-1) allows you to define port mirrors and
specify a diagnostic port. If mirrored packets are to be sent to a remote diagnostic
port, this window is also used to configure the remote ATX to direct mirrored
packets to the desired diagnostic port in its domain.
NOTE
Port mirroring introduces a certain amount of latency to the switch’s traffic,
depending upon the load at the mirrored ports, the types of packets being
captured, and whether the diagnostic port is local or remote. To remedy this
situation, you can establish “mirror filters” using the ATX’s Port Filtering utility.
Mirror filters are especially helpful when you are using a remote diagnostic port,
since the physical connection to the remote port imposes bandwidth constraints
on the mirrored traffic. Using a mirror filter you can restrict the amount of
monitored traffic by filtering inbound or outbound packets according to source
and destination addresses, vendors, types, and frame protocols. Youcan also filter
out packets based on a designated portion of their data field. Mirror filters can
also be used when you are using a local diagnostic port, if necessary. See
Chapter 4, Using ATX Port Filtering, for details on defining mirror filters.
The Port mirroring window also allows you to discard or truncate oversized
packets when using a local diagnostic port.
When mirroring traffic to a remote diagnostic port, the mirrored packets are encapsulated
and routed to the specified port. Oversized packets are segmented during this process, and
therefore do not need to be discarded or truncated.
6-1
Page 68

ATX Port Mirroring
TIP
Oversized packets might be produced when mirrored traffic is sent from an 802.5
interface to an 802.3 interface (i.e., an 802.5 frame, when mirrored to an 802.3
interface, must have its MAC address reversed and a length field must be added;
the translation process may increase the frame size so that it exceeds the size of
the maximum transport unit (MTU) of the diagnostic port). By discarding or
truncating such oversized packets, you can avoid overloading the diagnostic
interface, and further reduce any latency in your mirrored traffic.
In order to reproduce mirrored traffic as faithfully as possible (i.e., reduce the number of
dropped or truncated frames), it is recommended that the media type and framing protocol
of your mirrored ports and your diagnostic port be identical. We also recommend that the
speeds of all involved ports be identical, or at least that your diagnostic port operate at a
higher speed than your mirrored port(s).
The ATX’s mirroring software attempts to replicate mirrored packets as closely as
possible. Certain physical layer information, such as 802.5 Access Control and
Frame Control bytes, is not reproduced since it is not generally of interest when
examining mirrored traffic. MAC layer information, with the possible exception
of any necessary framing translation, is reproduced exactly. Network layer
information is also unmodified. Bridging packets are reproduced in their original
order. Routed packets are mirrored prior to any alteration by the ATX’s routing
software, and may be out of order, as is sometimes the case with normally routed
packets.
The Port Mirroring Window
To invoke the Port Mirroring window:
1. Click on the PPE’s Module Index (Module 1). The Module menu will appear.
2. Drag down Port Mirroring..., and release.
6-2 The Port Mirroring Window
Page 69
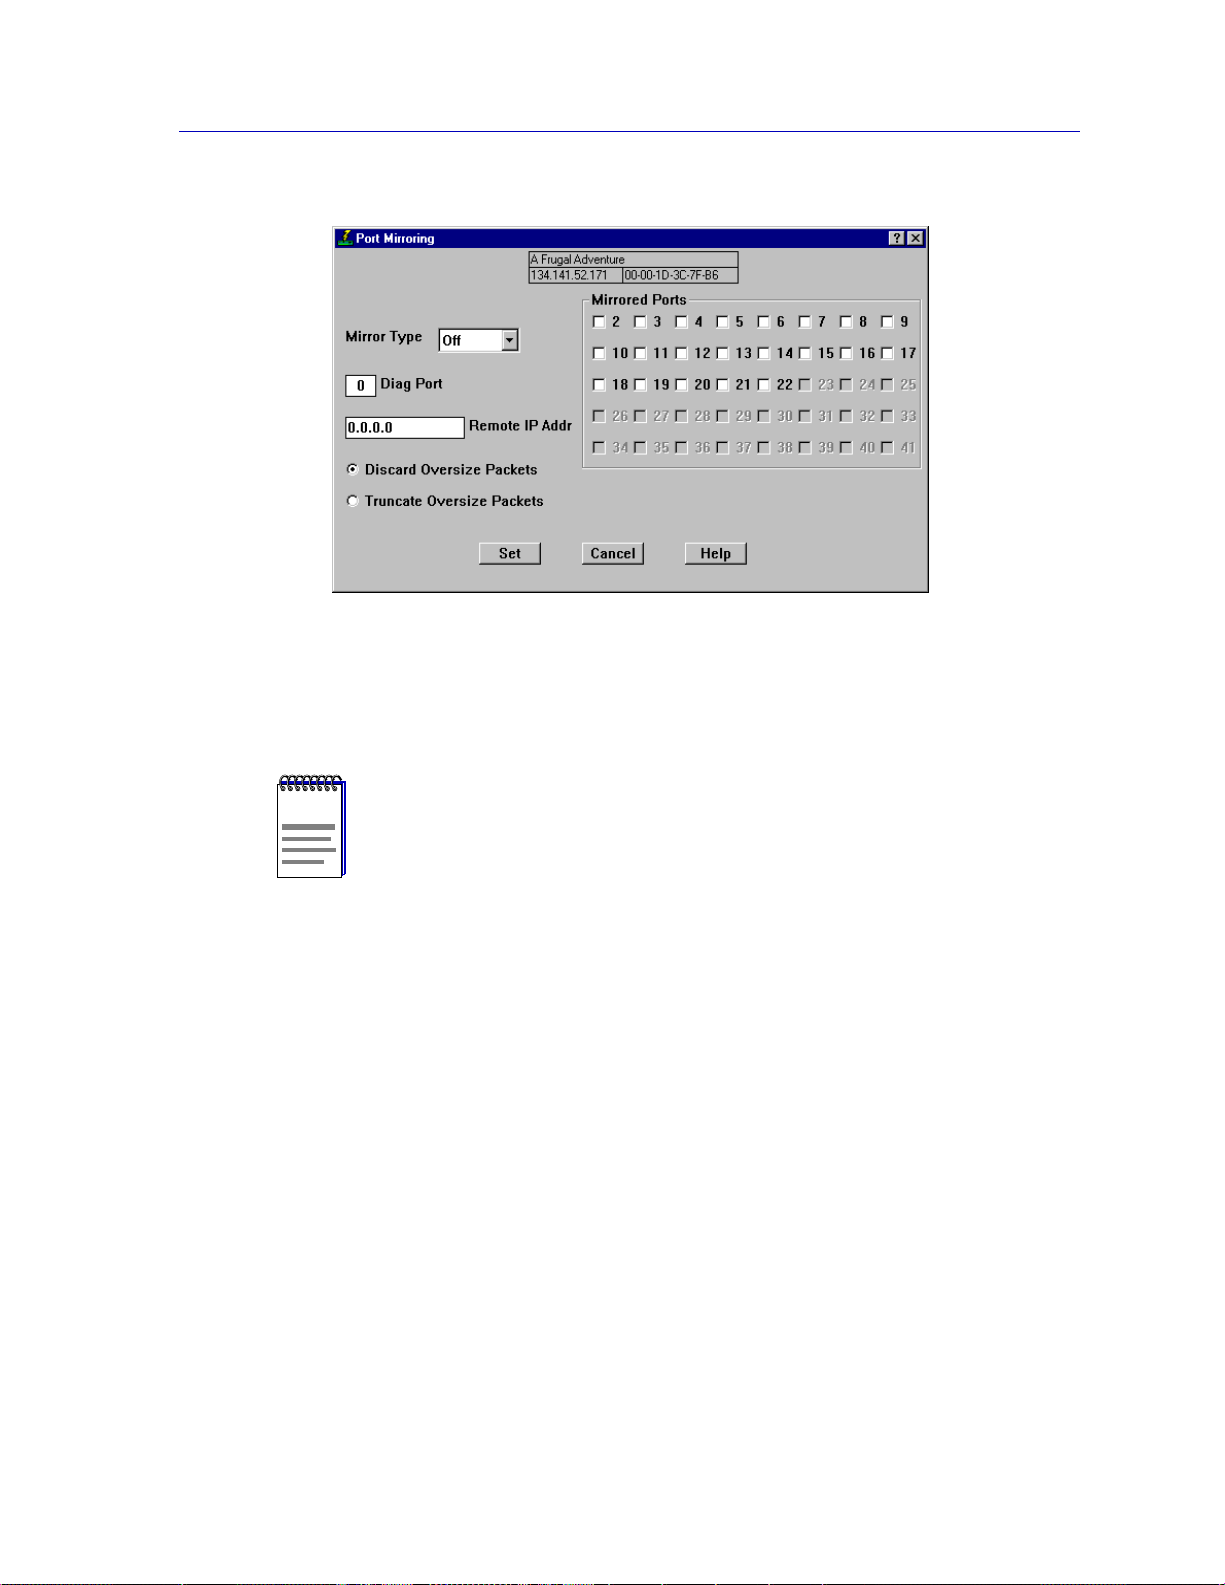
ATX Port Mirroring
Figure 6-1. The ATX Port Mirroring Window
The Port Mirroring window features a port selection area (at the right side of the
window), with selection buttons for each of the ATX’s managed ports.
The local management port (i.e., port 1) is not available for mirroring, and is therefore
NOTE
grayed out.
The left side of this window features fields which allow you to select the mirror
type (local, remote, or off), and specify a diagnostic port. Selection buttons below
these fields allow you to either discard or truncate oversized packets that arrive at
a local diagnostic port.
Configuring Port Mirroring
The Port Mirroring window is used differently depending upon whether the
ports being mirroredare local (i.e., being managed by the ATX you are modeling)
or remote (i.e., being managed by another ATX in your network that is sending
mirrored traffic to the ATX you are modeling). If you are mirroring traffic to a
remote ATX, you must configure mirroring on both the local and remote devices.
The Port Mirroring Window 6-3
Page 70

ATX Port Mirroring
If the port(s) being mirrored and the diagnostics port are both local
1. In the mirrored ports selection area, click on the selection button(s) for each
port that you wish to mirror.
2. In the Mirror Type field, click on the menu button to display the Port Type
selection menu. Select Local from the menu. To halt mirroring for the selected
ports, select Off.
3. To direct mirrored traffic to a local diagnostic port, highlight the contents of the
Diag Port field and type in the port index number of the port on your ATX that
will be used as the diagnostic port.
If you will be sending mirrored traffic to a local diagnostic port, the value in the Remote
NOTE
Ip Addr field should be 0.0.0.0.
4. To discard oversized packets which arrive at a local diagnostic port, click on
the Discard Oversized Packets selection button. To truncate oversized
packets, click on the Truncate Oversized Packets button.
5. Using the Port Filtering window, establish any mirror filters that you wish to
apply to the mirrored traffic. See Chapter 3, Using ATX Port Filtering, for
details on setting up your mirror filters.
6. Click on Set to apply your port mirroring configuration. Your configuration will
be reflected in the window.
If the port(s) being mirrored are remote
You will need to set port mirroring at the device where the mirrored ports are
located and at the device where the diagnostics port is located.
From the device where the mirrored ports are located
1. Highlight the contents of the Diag Port field, and type in 0 (zero) as the index
number. Specifying zero as the Port Index indicates that you will be sending
mirrored traffic to a remote diagnostic port.
2. In the Mirror Type field, click on the menu button to display the Port Type
selection menu. Select Local from the menu. To halt mirroring, select Off.
3. To direct mirrored traffic to a remote diagnostic port, highlight the contents of
the Remote IP Addr field and type in the IP address of the ATX on which the
remote diagnostic port resides.
4. In the port selection area, click on the selection button(s) for each port that
you wish to mirror.
6-4 The Port Mirroring Window
Page 71

ATX Port Mirroring
5. Using the Port Filtering window, establish any mirror filters that you wish to
apply to the mirrored traffic. See Chapter 3, Using ATX Port Filtering, for
details on setting up your mirror filters.
6. Click on Set to apply your port mirroring configuration. Your configuration will
be reflected in the window.
From the device where the diagnostic port is located
1. Make certain that there are no port buttons selected in the port selection area.
2. Highlight the contents of the Diag Port field, and type in the port index
number of the port on the ATX that will be used as the diagnostic port.
3. Make certain that the entry in the Remote IP Addr field is 0.0.0.0
4. To discard oversized packets which arrive at the Local diagnostic port, click
on the Discard Oversized Packets selection button. To truncate oversized
packets, click on the Truncate Oversized Packets button.
5. In the Port Type field, click on the menu button to display the Port Type
selection menu. Select Remote from the menu. To halt mirroring, select Off.
6. Click on Set to apply your port mirroring configuration. Your configuration will
be reflected in the window.
Upon applying these settings, all mirrored packets received by the ATX will be
sent to the specified diagnostic port.
The Port Mirroring Window 6-5
Page 72

ATX Port Mirroring
6-6 The Port Mirroring Window
Page 73

IPX Routing Tables
IPX Statistics defined
The IPX Routing Tables window displays statistics containing information about
IPX Routing on your ATX. The ATX’s ports can be configured to route IPX
(Internetwork Packet Exchange) packets, see the IPX Routing section in
Chapter 2, for more information. IPX is Novell’s proprietary protocol that
specifies how information is to be broken up into separate packets, and how those
packets are to be addressed in order to transfer data between the server and
workstations on the network. The ATX identifies IPX packets and routes them
appropriately.
Chapter 7
To display the IPX Routing Tables window from the ATX Hub View:
1. Click on the PPE’s Module Index (Module 1). The Module menu will appear.
2. Drag down to IPX Routing Tables, and release. The IPX Routing Tables
Routing window, Figure 7-1, will appear.
7-1
Page 74

IPX Routing Tables
IPX Statistics
The window consists of three separate tables: IPX Interface, IPX Route, and IPX
SAP. Each section contains a different table of IPX routing information.
IPX Interface
This section displays the ATX’s IPX routing attributes on a per interface basis.
Each entry defines the IPX routing information used by the interface. An entry is
displayed for each interface non-dependent of whether or not the interfaces are
configured for IPX routing.
Port#
Displays the interface number that corresponds with the entry.
IPX Network
The IPX network number (4 bytes) associated with this interface.
Figure 7-1. IPX Routing Tables window
7-2 IPX Statistics
Page 75

IPX Routing Tables
Framing
Displays the link-level framing to be used for this interface:
• ethernet 802.3 — the default for ethernet links. This framing will use an 802.3
length followed by the IPX header and data.
• ethernet 2 —the same framing as 802.3, except the third field (the length field
in 802.3) is used to store a value representing the type of transport packet that
is encapsulated within the Ethernet packet.
• ieee802.2 — the default for non-ethernet links. 802.2 frames are the same as
802.3 frames, except they have Logical Link Control (LLC) information
encoded within them immediately following the 802.3 length field.
• snap— framing will use standard SNAP encapsulation with 802.3 or Ethenet2
frames.
See Chapter 2 for more information on IPX Framing.
In-Rip-Pkts
Displays the number of IPX Routing Information Protocol (RIP) packets received
on this interface.
IPX Route
Out-Rip-Pkts
Displays the number of IPX Routing Information Protocol (RIP) packets
transmitted by this interface.
In-Sap-Pkts
Displays the number of IPX Service Advertising Protocol (SAP) packets received
on this interface.
Out-Sap-Pkts
Displays the number of IPX Service Advertising Protocol (SAP) packets
transmitted by this interface.
The ATX uses the RIP (Routing Information Protocol) to build an accurate current
routing table. Routers, including the ATX, send out broadcasts every 60 seconds
advertising the networks they know about, the routes to those networks, and the
number of hops to get there. In this way the ATX can stay up-to-date on the state
of its neighboring networks. This section contains an entry for each route
presently known to the ATX.
Destination
Displays the destination address of this route.
IPX Statistics 7-3
Page 76

IPX Routing Tables
Port#
Displays the interface index of the port on your ATX through which the next hop
of the route should be reached.
Hop Count
Displays the secondary routing metric for this route, which is the number of
routers that must be traversed to reach the destination.
Next Hop
Displays the IPX node address of the next hop of this route, if indirect. If direct
this field displays the address of the local interface.
Age
Displays the number of seconds since the route was last updated.
Tick Count
Displays the primary routing metric of this route, which is an estimate of the
amount of ticks (55 millisecond intervals) that are needed to reach the destination
address.
IPX SAP
SAP (Service Advertising Protocol) providesa method for IPX servers to advertise
the services they provide. It functions similarly to RIP, but it is the servers that
send out broadcasts advertising the services they provide. IPX routers gather the
information, maintain a database of services they know about, and broadcast that
information to other routers. Clients can then find the servers that provide the
services they need. This table displays an entry for each SAP-cache service
presently known to this router. Each entry is an IPX service definition, as
advertised by the SAP protocol and distributed through the SAP cache of this
router.
Index
The SAP index number is not related to the interface number assigned to each
port. This index is just a number assigned to the SAP entry itself.
Type
Identifies the type of service provided by the server. Values range from 0 to ffff
and they are defined by Novell.
Name
The name assigned to the server.
Network
Displays the IPX network address of the server providing the indicated service (as
defined in the Type field).
7-4 IPX Statistics
Page 77

IPX Routing Tables
NodeID
Displays the IPX node address of the server. When you are running Netware 2.x
this corresponds with a physical MAC address and is displayed in canonical bit
order. If you are using Netware 3.x the node address is typically 000000000001.
Socket
Displays the socket number to which service requests should be addressed.
Hop Count
Displays the number of routers (hops) that must be traversed in order to reach
this server.
IPX Statistics 7-5
Page 78

IPX Routing Tables
7-6 IPX Statistics
Page 79

Index
A
Admin 2-8
Admin/Link 2-8
Age 7-4
all 5-4
ARP Source Route 2-22
ARP Translate 2-21
B
Boolean operator 4-4, 4-6
Boot Prom, revision 2-4
Bridge 2-8
Bridge Configuration 2-17
Bridge Number 2-19
Bridge status mode 2-8
Broadcast Protection 2-16
buffer space 2-28
C
Cancel button 1-4
Clear button 3-4
color codes 2-9
color-coded port display 2-2
command buttons 1-5
Connection Status 2-3
D
destination address 7-3
Device Menu 2-5
Device Name 1-4
Device Type 2-11
Diag Port 6-4
Discard Oversized Packets 6-4, 6-5
Discarded packets 2-28
E
Entry filters 4-1
Ethernet 2 7-3
ethernet802.3 7-3
Exit filters 4-1
F
Field Offset 4-8
Filter Statistics 4-10
Firmware, revision 2-4
Framing 7-3
G
Getting Help 1-5
Global Call Center 1-5
H
Help button 1-4, 1-5
Help Menu 2-6
Hop Count 7-4, 7-5
I
I/F Summary
interface performance statistics 2-25
I/F Summary window 2-24
ieee802.2 7-3
Index 3-2
Index Port 2-15
In-Rip-Pkts 7-3
In-Sap-Pks 7-3
Interface Detail window 2-26
Interface Statistics window 2-26
IP 5-4
IP Address 2-15
IP address 1-4, 2-3
IP Config/Routing 2-14
IP Mask 2-15
IP Protocols 2-15
IPX 5-4
IPX Framing 2-21
IPX network number 7-2
IPX Routing 2-12
IPX Service Advertising Protocol 7-3
IPX Source Route 2-21
Index-1
Page 80

Index
L
Last Change 3-4
Last Error 3-3
Link Count 3-4
Link Ordinal Displays the position 3-4
link-level framing 7-3
Load 2-26
Local 6-4
Local Switching 2-17
Location 1-4
Logical Status 2-24
M
MAC address 1-4, 2-3
menu structure 2-4
MIB components 2-10
MIM type 2-11
Mirror Entry 4-3
Mirror Exit 4-3
Mirror filter 4-3
mirror filters 6-1
Mirror Type 6-4
Multicast (Non-Unicast) 2-27
N
Netbios Source Route 2-22
network address 7-4
Next Hop 7-4
NodeId 7-5
Non-Unicast (Multicast) 2-27
O
OFF 2-8
OK button 1-4
ON 2-8
Origin 4-8
Out-Rip-Pkts 7-3
Out-Sap-Pkts 7-3
P
Packets Received 2-28
Packets Transmitted 2-28
Physical Status 2-24
Port Configuration 2-16
port display, color codes 2-2
Port Filter
adding a filter 4-5
data offset 4-4, 4-8
deleting a filter 4-10
Destination Address filter 4-4, 4-7
editing 4-4
Filter Alarms 4-9
filtering statistics 4-10
modifying an existing filter 4-5
Operator option 4-4, 4-6
Protocol 4-3, 4-9
Pseudo filter 4-3
Source Address filter 4-3, 4-6
type 4-3
Port Filtering window 4-2
Port Menus 2-7
Port Mirror 6-2
Port Mirroring 4-3
Port Number 1-4
Port Status 2-3
port status color codes 2-9
Port Status Menu 2-5
Port Status Views 2-8
port type 2-11
Ports in Workgroup 5-5
PPE Port Menu 2-7
Protocol 4-3
Protocol filter 4-9
Pseudo filter 4-3, 4-5
R
Rate 2-26
Raw Counts 2-25
remote 6-5
Remote Ip Addr 6-5
Ring Number 2-19
Ring Speed 2-17
RIP 7-3
Rmt Bridge Id 3-3
Rmt IP Address 3-3
S
SAP 7-3
Selecting Port Status Views 2-8
Service Advertising Protocol 7-3
Set button 1-4
sftrunkState 3-2
Snap 7-3
Socket 7-5
State 3-2
subnetwork 5-4
Index-2
Page 81

T
technical support 1-5
Thresh Number 2-17
Thresh Time 2-17
Tick Count 7-4
to change the status view of your ports 2-8
Translation 2-20
Translation button 2-20
Transmit BPDUs 2-19
Transmit Queue Size 2-28
Troubleshooting 2-28
Truncate Oversized Packets 6-4, 6-5
Trunking 3-1
trunking table 3-2
type of service 7-4
U
Unicast 2-27
Unknown Protocol 2-28
Up Time 2-24
UpTime 2-3
Uptime 1-4
Utilities Menu 2-6
Index
W
work group type 5-4
Work Groups 5-3
Index-3
Page 82

Index
Index-4
 Loading...