


Enterasys
®
Intrusion Prevention System
Analysis and Reporting Guide
P/N 9034069-13


Notice
Enterasys Networks reserves the right to make changes in specifications and other information contained in this document and
its web site without prior notice. The reader should in all cases consult Enterasys Networks to determine whether any such
changes have been made.
The hardware, firmware, or software described in this document is subject to change without notice.
IN NO EVENT SHALL ENTERASYS NETWORKS BE LIABLE FOR ANY INCIDENTAL, INDIRECT, SPECIAL, OR
CONSEQUENTIAL DAMAGES WHATSOEVER (INCLUDING BUT NOT LIMITED TO LOST PROFITS) ARISING OUT OF
OR RELATED TO THIS DOCUMENT, WEB SITE, OR THE INFORMATION CONTAINED IN THEM, EVEN IF
ENTERASYS NETWORKS HAS BEEN ADVISED OF, KNEW OF, OR SHOULD HAVE KNOWN OF, THE POSSIBILITY OF
SUCH DAMAGES.
Enterasys Networks, Inc.
50 Minuteman Road
Andover, MA 01810
2011 Enterasys Networks, Inc. All rights reserved.
Part Number: 9034069-13 November 2011
ENTERASYS, ENTERASYS DRAGON, ENTERASYS NETSIGHT, ENTERASYS NETWORKS, and any logos associated
therewith, are trademarks or registered trademarks of Enterasys Networks, Inc. in the United States and other countries. For a
complete list of Enterasys trademarks, see http://www.enterasys.com/company/trademarks.aspx.
Adobe, Acrobat, and Acrobat Reader are registered trademarks of Adobe Systems Incorporated.
Intel, Intel Pentium, Xeon, Celeron, and Pentium II are trademarks or registered trademarks of Intel Corporation.
Cisco is a registered trademark of Cisco Systems, Inc.
FireWall-1, OPSEC and Check Point are trademarks or registered trademarks of Check Point Software Technologies Ltd.
Dell and PowerEdge are trademarks of Dell Inc.
IPX/SPX, Novell and NetWare are trademarks or registered trademarks of Novell, Inc.
Linux is a trademark of Linus Torvalds.
Microsoft, Windows, and Windows NT are trademarks or registered trademarks of Microsoft Corporation.
Netscape is a registered trademark of Netscape Communications Corporation.
Red Hat is a registered trademark of Red Hat, Inc.
Solaris is a trademark of Sun MicroSystems, Inc.
SPARC is a registered trademark of SPARC International, Inc.
Sun and Java are trademarks or registered trademarks of Sun Microsystems, Inc.
UNIX is a registered trademark of The Open Group.
Product Series Name includes software whose copyright is licensed from MySQL AB.
Product Series Name contains a proprietary operating system based on Linux.
GNU general public License Copyright (C) 1989, 1991 Free Software Foundation, Inc.
All other product names mentioned in this manual may be trademarks or registered trademarks of their respective companies.
Support Site URL: http://www.enterasys.com/support
Documentation URL: https://extranet.enterasys.com/downloads/
i

Enterasys Networks, Inc. Software License Agreement
This document is an agreement (“Agreement”) between You, the end user, and Enterasys Networks, Inc. on behalf of itself and
its Affiliates (“Enterasys”) that sets forth your rights and obligations with respect to the software contained in CD-ROM or
other media. “Affiliates” means any person, partnership, corporation, limited liability company, or other form of enterprise that
directly or indirectly through one or more intermediaries, controls, or is controlled by, or is under common control with the
party specified. BY INSTALLING THE ENCLOSED PRODUCT, YOU ARE AGREEING TO BECOME BOUND BY THE TERMS
OF THIS AGREEMENT, WHICH INCLUDES THE LICENSE AND THE LIMITATION OF WARRANTY AND DISCLAIMER
OF LIABILITY. IF YOU DO NOT AGREE TO THE TERMS OF THIS AGREEMENT, RETURN THE UNOPENED PRODUCT TO
ENTERASYS OR YOUR DEALER, IF ANY, WITHIN TEN (10) DAYS FOLLOWING THE DATE OF RECEIPT FOR A FULL
REFUND.
IF YOU HAVE ANY QUESTIONS ABOUT THIS AGREEMENT, CONTACT ENTERASYS NETWORKS, INC. (978) 684-1000.
Attn: Legal Department.
Enterasys will grant You a non-transferable, non-exclusive license to use the machine-readable form of software (the “Licensed
Software”) and the accompanying documentation (the Licensed Software, the media embodying the Licensed Software, and the
documentation are collectively referred to in this Agreement as the “Licensed Materials”) on one single computer if You agree
to the following terms and conditions:
1. TERM. This Agreement is effective from the date on which You open the package containing the Licensed Materials. You
may terminate the Agreement at any time by destroying the Licensed Materials, together with all copies, modifications and
merged portions in any form. The Agreement and your license to use the Licensed Materials will also terminate if You fail to
comply with any term or condition herein.
2. GRANT OF SOFTWARE LICENSE. The license granted to You by Enterasys when You open this sealed package
authorizes You to use the Licensed Software on any one, single computer only, or any replacement for that computer, for internal
use only. A separate license, under a separate Software License Agreement, is required for any other computer on which You or
another individual or employee intend to use the Licensed Software. YOU MAY NOT USE, COPY, OR MODIFY THE LICENSED
MATERIALS, IN WHOLE OR IN PART, EXCEPT AS EXPRESSLY PROVIDED IN THIS AGREEMENT.
3. RESTRICTION AGAINST COPYING OR MODIFYING LICENSED MATERIALS. Except as expressly permitted in this
Agreement, You may not copy or otherwise reproduce the Licensed Materials. In no event does the limited copying or
reproduction permitted under this Agreement include the right to decompile, disassemble, electronically transfer, or reverse
engineer the Licensed Software, or to translate the Licensed Software into another computer language.
The media embodying the Licensed Software may be copied by You, in whole or in part, into printed or machine readable
form, in sufficient numbers only for backup or archival purposes, or to replace a worn or defective copy. However, You agree
not to have more than two (2) copies of the Licensed Software in whole or in part, including the original media, in your
possession for said purposes without Enterasys’ prior written consent, and in no event shall You operate more than one copy of
the Licensed Software. You may not copy or reproduce the documentation. You agree to maintain appropriate records of the
location of the original media and all copies of the Licensed Software, in whole or in part, made by You. You may modify the
machine-readable form of the Licensed Software for (1) your own internal use or (2) to merge the Licensed Software into other
program material to form a modular work for your own use, provided that such work remains modular, but on termination of
this Agreement, You are required to completely remove the Licensed Software from any such modular work. Any portion of the
Licensed Software included in any such modular work shall be used only on a single computer for internal purposes and shall
remain subject to all the terms and conditions of this Agreement.
You agree to include any copyright or other proprietary notice set forth on the label of the media embodying the Licensed
Software on any copy of the Licensed Software in any form, in whole or in part, or on any modification of the Licensed Software
or any such modular work containing the Licensed Software or any part thereof.
4. TITLE AND PROPRIETARY RIGHTS.
(a) The Licensed Materials are copyrighted works and are the sole and exclusive property of Enterasys, any company or a
division thereof which Enterasys controls or is controlled by, or which may result from the merger or consolidation
with Enterasys (its “Affiliates”), and/or their suppliers. This Agreement conveys a limited right to operate the Licensed
Materials and shall not be construed to convey title to the Licensed Materials to You. There are no implied rights. You
shall not sell, lease, transfer, sublicense, dispose of, or otherwise make available the Licensed Materials or any portion
thereof, to any other party.
(b) You further acknowledge that in the event of a breach of this Agreement, Enterasys shall suffer severe and irreparable
damages for which monetary compensation alone will be inadequate. You therefore agree that in the event of a breach
of this Agreement, Enterasys shall be entitled to monetary damages and its reasonable attorney’s fees and costs in
enforcing this Agreement, as well as in juncti ve rel ief to r estrain such breach, in additi on to any other remedies available
to Enterasys.
ii

5. PROTECTION AND SECURITY. In the performance of this Agreement or in contemplation thereof, You and your
employees and agents may have access to private or confidential information owned or controlled by Enterasys relating to the
Licensed Materials supplied hereunder including, but not limited to, product specifications and schematics, and such
information may contain proprietary details and disclosures. All information and data so acquired by You or your employees or
agents under this Agreement or in contemplation hereof shall be and shall remain Enterasys’ exclusive property, and You shall
use your best efforts (which in any event shall not be less than the efforts You take to ensure the confidentiality of your own
proprietary and other confidential information) to keep, and have your employees and agents keep, any and all such information
and data confidential, and shall not copy, publish, or disclose it to others, without Enterasys’ prior written approval, and shall
return such information and data to Enterasys at its request. Nothing herein shall limit your use or dissemination of information
not actually derived from Enterasys or of information which has been or subsequently is made public by Enterasys, or a third
party having authority to do so.
You agree not to deliver or otherwise make available the Licensed Materials or any part thereof, including without
limitation the object or source code (if provided) of the Licensed Software, to any party other than Enterasys or its employees,
except for purposes specifically related to your use of the Licensed Software on a single computer as expressly provided in this
Agreement, without the prior written consent of Enterasys. You agree to use your best efforts and take all reasonable steps to
safeguard the Licensed Materials to ensure that no unauthorized personnel shall have access thereto and that no unauthorized
copy, publication, disclosure, or distribution, in whole or in part, in any form shall be made, and You agree to notify Enterasys
of any unauthorized use thereof. You acknowledge that the Licensed Materials contain valuable confidential information and
trade secrets, and that unauthorized use, copying and/or disclosure thereof are harmful to Enterasys or its Affiliates and/or
its/their software suppliers.
6. MAINTENANCE AND UPDATES. Updates and certain maintenance and support services, if any, shall be provided to
You pursuant to the terms of an Enterasys Service and Maintenance Agreement, if Enterasys and You enter into such an
agreement. Except as specifically set forth in such agreement, Enterasys shall not be under any obligation to provide Software
Updates, modifications, or enhancements, or Software maintenance and support services to You.
7. DEFAULT AND TERMINATION. In the event that You shall fail to keep, observe, or perform any obligation under this
Agreement, including a failure to pay any sums due to Enterasys, or in the event that You become insolvent or seek protection,
voluntarily or involuntarily, under any bankruptcy law, Enterasys may, in addition to any other remedies it may have under
law, terminate the License and any other agreements between Enterasys and You.
(a) Immediately after any termination of the Agreement or if You have for any reason discontinued use of Software, You
shall return to Enterasys the original and any copies of the Licensed Materials and remove the Licensed Software from
any modular works made pursuant to Section 3, and certify in writing that through your best efforts and to the best of
your knowledge the original and all copies of the terminated or discontinued Licensed Materials have been returned
to Enterasys.
(b) Sections 4, 5, 7, 8, 9, 10, 11, and 12 shall survive termination of this Agreement for any reason.
8. EXPORT REQUIREMENTS. You understand that Enterasys and its Affiliates are subject to regulation by agencies of the
U.S. Government, including the U.S. Department of Commerce, which prohibit export or diversion of certain technical products
to certain countries, unless a license to export the product is obtained from the U.S. Government or an exception from obtaining
such license may be relied upon by the exporting party.
If the Licensed Materials are exported from the United States pursuant to the License Exception CIV under the U.S. Export
Administration Regulations, You agree that You are a civil end user of the Licensed Materials and agree that You will use the
Licensed Materials for civil end uses only and not for military purposes.
If the Licensed Materials are exported from the United States pursuant to the License Exception TSR under the U.S. Export
Administration Regulations, in addition to the restriction on transfer set forth in Section 4 of this Agreement, You agree not to
(i) reexport or release the Licensed Software, the source code for the Licensed Software or technology to a national of a country
in Country Groups D:1 or E:2 (Albania, Armenia, Azerbaijan, Belarus, Cambodia, Cuba, Georgia, Iraq, Kazakhstan, Kyrgyzstan,
Laos, Libya, Macau, Moldova, Mongolia, North Korea, the People’s Republic of China, Russia, Tajikistan, Turkmenistan,
Ukraine, Uzbekistan, Vietnam, or such other countries as may be designated by the United States Government), (ii) export to
Country Groups D:1 or E:2 (as defined herein) the direct product of the Licensed Software or the technology, if such foreign
produced direct product is subject to national security controls as identified on the U.S. Commerce Control List, or (iii) if the
direct product of the technology is a complete plant o r any major component of a plant, export to Country Groups D:1 or E:2
the direct product of the plant or a major component thereof, if such foreign produced direct product is subject to national
security controls as identified on the U.S. Commerce Control List or is subject to State Department controls under the U.S.
Munitions List.
iii

9. UNITED STATES GOVERNMENT RESTRICTED RIGHTS. The Licensed Materials (i) were developed solely at private
expense; (ii) contains “restricted computer software” submitted with restricted rights in accordance with section 52.227-19 (a)
through (d) of the Commercial Computer Software-Restricted Rights Clause and its successors, and (iii) in all respects is
proprietary data belonging to Enterasys and/or its suppliers. For Department of Defense units, the Licensed Materials are
considered commercial computer software in accordance with DFARS section 227.7202-3 and its successors, and use,
duplication, or disclosure by the U.S. Government is subject to restrictions set forth herein.
10. LIMITED WARRANTY AND LIMITATION OF LIABILITY. The only warranty Enterasys makes to You in connection
with this license of the Licensed Materials is that if the media on which the Licensed Software is recorded is defective, it will be
replaced without charge, if Enterasys in good faith determines that the media and proof of payment of the license fee are
returned to Enterasys or the dealer from whom it was obtained within ninety (90) days of the date of payment of the license fee.
NEITHER ENTERASYS NOR ITS AFFILIATES MAKE ANY OTHER WARRANTY OR REPRESENTATION, EXPRESS OR
IMPLIED, WITH RESPECT TO THE LICENSED MATERIALS, WHICH ARE LICENSED "AS IS". THE LIMITED WARRANTY
AND REMEDY PROVIDED ABOVE ARE EXCLUSIVE AND IN LIEU OF ALL OTHER WARRANTIES, INCLUDING
IMPLIED WARRANTIES OF MERCHANTABILITY OR FITNESS FOR A PARTICULAR PURPOSE, WHICH ARE EXPRESSLY
DISCLAIMED, AND STATEMENTS OR REPRESENTATIONS MADE BY ANY OTHER PERSON OR FIRM ARE VOID. ONLY
TO THE EXTENT SUCH EXCLUSION OF ANY IMPLIED WARRANTY IS NOT PERMITTED BY LAW, THE DURATION OF
SUCH IMPLIED WARRANTY IS LIMITED TO THE DURATION OF THE LIMITED WARRANTY SET FORTH ABOVE. YOU
ASSUME ALL RISK AS TO THE QUALITY, FUNCTION AND PERFORMANCE OF THE LICENSED MATERIALS. IN NO
EVENT WILL ENTERASYS OR ANY OTHER PARTY WHO HAS BEEN INVOLVED IN THE CREATION, PRODUCTION OR
DELIVERY OF THE LICENSED MATERIALS BE LIABLE FOR SPECIAL, DIRECT, INDIRECT, RELIANCE, INCIDENTAL OR
CONSEQUENTIAL DAMAGES, INCLUDING LOSS OF DATA OR PROFITS OR FOR INABILITY TO USE THE LICENSED
MATERIALS, TO ANY PARTY EVEN IF ENTERASYS OR SUCH OTHER PARTY HAS BEEN ADVISED OF THE POSSIBILITY
OF SUCH DAMAGES. IN NO EVENT SHALL ENTERASYS OR SUCH OTHER PARTY'S LIABILITY FOR ANY DAMAGES
OR LOSS TO YOU OR ANY OTHER PARTY EXCEED THE LICENSE FEE YOU PAID FOR THE LICENSED MATERIALS.
Some states do not allow limitations on how long an implied warranty lasts and some states do not allow the exclusion or
limitation of incidental or consequential damages, so the above limitation and exclusion may not apply to You. This limited
warranty gives You specific legal rights, and You may also have other rights which vary from state to state.
11. JURISDICTION. The rights and obligations of the parties to this Agreement shall be governed and construed in
accordance with the laws and in the State and Federal courts of the Commonwealth of Massachusetts, without regard to its rules
with respect to choice of law. You waive any objections to the personal jurisdiction and venue of such courts. None of the 1980
United Nations Convention on the Limitation Period in the International Sale of Goods, and the Uniform Computer Information
Transactions Act shall apply to this Agreement.
12. GENERAL.
(a) This Agreement is the entire agreement between Enterasys and You regarding the Licensed Materials, and all prior
agreements, representations, statements, and undertakings, oral or written, are hereby expressly superseded and
canceled.
(b) This Agreement may not be changed or amended except in writing signed by both parties hereto.
(c) You represent that You have full right and/or authorization to enter into this Agreement.
(d) This Agreement shall not be assignable by You without the express written consent of Enterasys, The rights of
Enterasys and Your obligations under this Agreement shall inure to the benefit of Enterasys’ assignees, licensors, and
licensees.
(e) Section headings are for convenience only and shall not be considered in the interpretation of this Agreement.
(f) The provisions of the Agreement are severable and if any one or more of the provisions hereof are judicially determined
to be illegal or otherwise unenforceable, in whole or in part, the remaining provisions of this Agreement shall
nevertheless be binding on and enforceable by and between the parties hereto.
(g) Enterasys’ waiver of any right shall not constitute waiver of that right in future. This Agreement constitutes the entire
understanding between the parties with respect to the subject matter hereof, and all prior agreements, representations,
statements and undertakings, oral or written, are hereby expressly superseded and canceled. No purchase order shall
supersede this Agreement.
(h) Should You have any questions regarding this Agreement, You may contact Enterasys at the address set forth below.
Any notice or other communication to be sent to Enterasys must be mailed by certified mail to the following address:
ENTERASYS NETWORKS, INC., 50 Minuteman Road, Andover, MA 01810 Attn: Manager - Legal Department.
iv

Contents
About This Guide
Intended Audience .............................................................................................................................................ix
Version Support ................................................................................................................................................. ix
Related Documents ...........................................................................................................................................ix
Conventions ........................................................................................................................................................x
Getting Help ........................................................................................................................................................x
Chapter 1: Getting Started
Starting Enterasys IPS Reporting ................................................................................................................... 1-1
Displaying Interactive Reports ........................................................................................................................ 1-4
24 Hours Reports ..................................................................................................................................... 1-4
Top N Reports .......................................................................................................................................... 1-6
Trending Reports ..................................................................................................................................... 1-8
Creating and Editing Report Filters ........................................................................................................ 1-10
Creating and Viewing User Defined Reports ................................................................................................ 1-11
Creating a User Defined Report ............................................................................................................. 1-11
Viewing Generated Reports ................................................................................................................... 1-13
Finding Events .............................................................................................................................................. 1-13
Viewing Database Restore Status ................................................................................................................ 1-14
Chapter 2: System Dashboard
System Dashboard Overview ......................................................................................................................... 2-1
The Views Panel ............................................................................................................................................. 2-2
The Tabbed Panel .......................................................................................................................................... 2-4
Systems Tab ............................................................................................................................................ 2-4
Sensors Tab ............................................................................................................................................. 2-7
Interfaces Tab .......................................................................................................................................... 2-9
EMS/Reporting Tab ................................................................................................................................ 2-11
Customizing the Dashboard Interface .......................................................................................................... 2-12
Customizing the Views Panel ................................................................................................................. 2-12
Customizing Tables in the Tabbed Panel .............................................................................................. 2-14
Resetting the Dashboard Interface to the Default Layout ...................................................................... 2-19
Platform-Specific Dashboard Details ............................................................................................................ 2-20
Unix and Linux Systems ......................................................................................................................... 2-20
Windows Systems .................................................................................................................................. 2-20
Chapter 3: 24 Hours Reports
Event Summary Report .................................................................................................................................. 3-1
Event Log Report ............................................................................................................................................ 3-2
Setting Display Preferences ........................................................................................................................... 3-4
Customizing 24 Hours Report Tables ............................................................................................................. 3-4
Resizing Columns .................................................................................................................................... 3-4
Moving Columns ...................................................................................................................................... 3-4
Sorting, Filtering, and Grouping In Columns ............................................................................................ 3-4
Exporting Tables in CSV Format .............................................................................................................. 3-6
Chapter 4: Top N Reports
Defining a Top N Report ................................................................................................................................. 4-1
v

Selecting the Top N Report Type ................................................................................................................... 4-2
Event Breakdown of Data ............................................................................................................................... 4-4
Displaying Details for a Selected Event ................................................................................................... 4-5
Selecting a Chart Type ................................................................................................................................... 4-5
Chapter 5: Trending Reports
Daily Event Rate Report ................................................................................................................................. 5-1
Selecting a Display Type .......................................................................................................................... 5-2
Defining a Daily Event Rate Report ......................................................................................................... 5-5
Displaying Details for a Selected Event ................................................................................................... 5-5
Event Growth Report ...................................................................................................................................... 5-5
Selecting a Chart Type ............................................................................................................................. 5-7
Defining an Event Growth Report ............................................................................................................ 5-9
Chapter 6: Event Table Pane
Displaying Data in the Event Table Pane ....................................................................................................... 6-1
Customizing the Event Table Display ............................................................................................................. 6-3
Setting Display Preferences ..................................................................................................................... 6-3
Resizing Columns .................................................................................................................................... 6-4
Moving Columns ...................................................................................................................................... 6-4
Sorting, Filtering, and Grouping In Columns ............................................................................................ 6-4
Exporting Tables in CSV Format .............................................................................................................. 6-6
Chapter 7: Event Details
Chapter 8: Viewing a PCAP File for an Event
Chapter 9: User Defined Reporting
Creating a User Defined Report ..................................................................................................................... 9-1
Viewing Generated Reports ........................................................................................................................... 9-3
Chapter 10: Preferences
Schedule Preferences .................................................................................................................................. 10-1
Configuring Session Time-out ...................................................................................................................... 10-2
Chapter 11: Legacy Reporting
Legacy Reporting Tools ................................................................................................................................ 11-1
Dragon Realtime Console ...................................................................................................................... 11-1
Dragon Forensics Console ..................................................................................................................... 11-2
Dragon Trending Console ...................................................................................................................... 11-2
Dragon Executive Reporting .................................................................................................................. 11-2
IPv6 Support in Legacy Tools ................................................................................................................ 11-2
Accessing the Legacy Reporting Tools ........................................................................................................ 11-3
Main Window .......................................................................................................................................... 11-3
Using the Realtime Console ......................................................................................................................... 11-6
Using the Console .................................................................................................................................. 11-6
AnalyzeEvent ......................................................................................................................................... 11-7
ChartGroups ........................................................................................................................................... 11-7
GraphEvents and GraphScores ............................................................................................................. 11-8
EventDetail ............................................................................................................................................. 11-9
EventsByGroup .................................................................................................................................... 11-10
EventsByNetworkSensor ..................................................................................................................... 11-10
EventsScoredByIP ............................................................................................................................... 11-11
vi

SummaryByIP ...................................................................................................................................... 11-11
EventSummary ..................................................................................................................................... 11-11
SummaryByDirection ........................................................................................................................... 11-13
SummaryLast7Days ............................................................................................................................. 11-13
SummaryByGroup ................................................................................................................................ 11-13
Creating Custom Queries ..................................................................................................................... 11-14
Filter Management ............................................................................................................................... 11-16
Load Events ......................................................................................................................................... 11-17
Realtime Status .................................................................................................................................... 11-18
Using the Forensics Console ...................................................................................................................... 11-18
Reviewing Forensics ............................................................................................................................ 11-18
Notes Option ........................................................................................................................................ 11-21
Using the Trending Console ....................................................................................................................... 11-22
Event Summaries ................................................................................................................................. 11-22
IP Address Summaries ........................................................................................................................ 11-24
Event Details ........................................................................................................................................ 11-25
Creating Additional Reports ................................................................................................................. 11-26
Using Executive Reporting ......................................................................................................................... 11-28
Managing Reports ...................................................................................................................................... 11-29
Save All Reports .................................................................................................................................. 11-29
Viewing Saved Reports ........................................................................................................................ 11-30
Report Examples .................................................................................................................................. 11-30
Index
vii

viii

The Enterasys® Intrusion Prevention System (IPS) is a solution consisting of an Intrusion
Detection System (IDS), active response, and intrusion prevention. This guide describes the
reports available with Enterasys IPS version 7.5 or higher using the web-based GUI. The first part
of the book describes the current reporting tools. Legacy tools are described in the last chapter of
the book.
Reporting tools available using the command line are described in the Enterasys Intrusion
Prevention System Command Line Tools Reference.
Intended Audience
This document is intended for analysts who are responsible for generating reports about intrusive
attacks.
Version Support
This guide supports Enterasys Intrusion Prevention System Version 7.5, and higher.
Related Documents
About This Guide
The Enterasys IPS user documentation listed below is available from
https://extranet.enterasys.com/downloads.
Enterasys IPS Document Title Description
Appliance Hardware Installation Guide Describes how to set up the Enterasys IPS appliances.
Configuration Guide Describes how to configure Enterasys IPS using GUI
management tools. It also describes the placement of Enterasys
IPS components within your network.
Creating Host Sensor Policies Describes how to create custom Host Sensor policies.
Creating Network Sensor Policies and
Signatures
Analysis and Reporting Guide Describes the Enterasys IPS reporting tools. Reporting tools
Command Line Tools Reference Describes the forensics command line tools you can use to
Describes how to create custom Network Sensor policies and
signatures.
available from the command line are described in the Command
Line Tools Reference.
analyze the events database or a single dragon.db file.
Enterasys IPS Analysis and Reporting Guide ix

Conventions
The following conventions are used in this document.
<installdir> Indicates to enter the path were you installed Dragon. The default directory is
bold type Actual user input values or names of screens and commands.
blue type Indicates a hypertext link. When reading this document online, click the text in blue to
italic type User input value required.
courier Used for command-level input or output.
Getting Help
For additional support, contact Enterasys Networks using one of the following methods:
World Wide Web http://www.enterasys.com/support
Phone 1-800-872-8440 (toll-free in U.S. and Canada)
Email support@enterasys.com
/usr/dragon.
go to the referenced figure, table, or section.
or 1-978-684-1888
For the Enterasys Networks Support toll-free number in your country:
http://www.enterasys.com/support
To expedite your message, please type [dragon] in the subject line.
Before contacting Enterasys Networks for technical support, have the following information
ready:
• Your Enterasys Networks service contract number
• A description of the failure
• A description of any action(s) already taken to resolve the problem (for example, changing
mode switches, and rebooting the unit.)
• The serial and revision numbers of all involved Enterasys Networks products in the network
• A description of your network environment (for example, layout, and cable type)
• Network load and frame size at the time of trouble (if known)
• The device history (for example, have you returned the device before, is this a recurring
problem)
• Any previous Return Material Authorization (RMA) numbers
x

1
Getting Started
The Enterasys IPS Enterprise Management Server (EMS) provides a Web-based interface for
reporting that lets you report on real-time data, perform forensics analysis, and spot trends. The
reports use data from Network and Host Sensors. Enterasys IPS Reporting uses this data to
generate customized reports that help you isolate attacks. The reports help you analyze IDS events
in real time, spot long-term trends, and inspect individual event details and associated
information.
Starting with v7.4, Enterasys IPS reporting supports IPv6 and IPv4.
For information about... Refer to page...
Starting Enterasys IPS Reporting 1-1
Displaying Interactive Reports 1-4
Creating and Viewing User Defined Reports 1-11
Finding Events 1-13
Viewing Database Restore Status 1-14
Starting Enterasys IPS Reporting
Use the following procedure to start using the Enterasys IPS reporting tools:
1. Access the analysis and reporting tools in one of three ways:
• Directly, by entering the following URL in your web browser:
https://<IP address>:9443/dragonreports
where <IP address> is the IP address of the Reporting server.
• From the EMS client GUI. Select Tools > Dragon Analysis & Reporting > Launch.
Enterasys IPS Analysis and Reporting Guide 1-1
Starting Enterasys IPS Reporting Getting Started
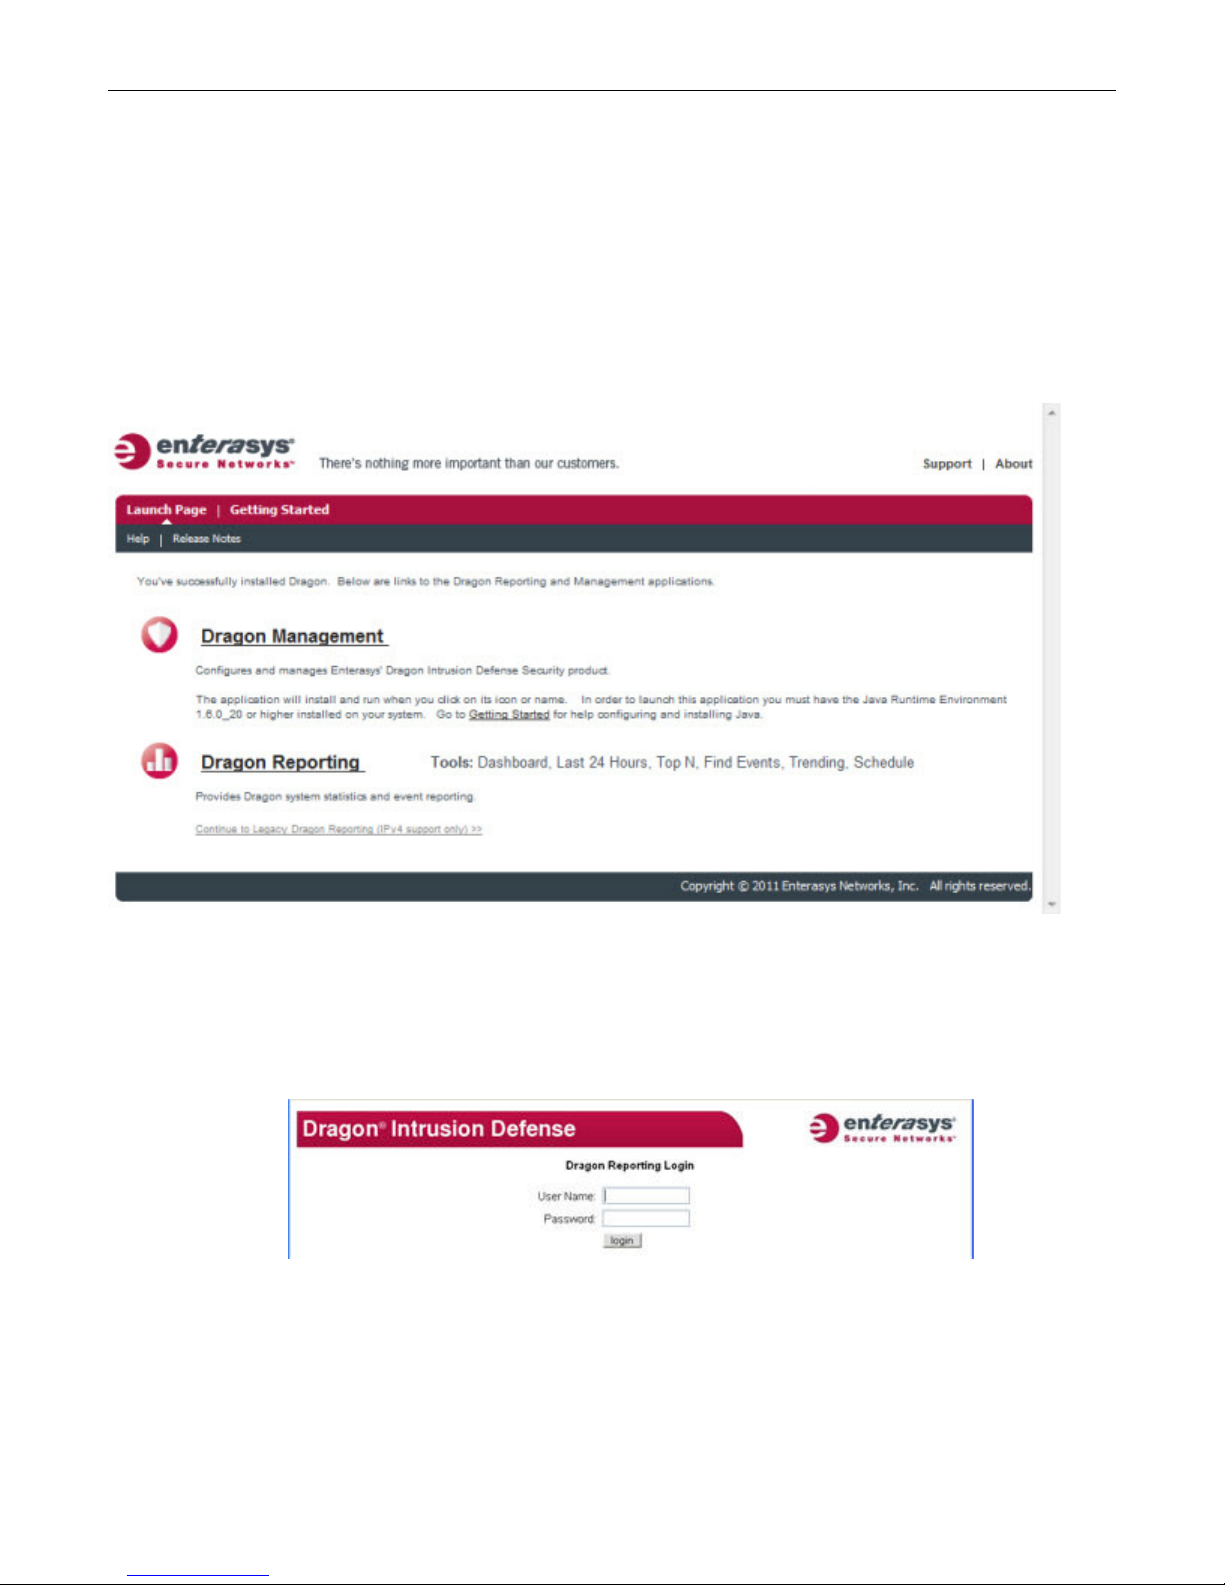
• By selecting Dragon Reporting from the Enterasys IPS Launch page.
a. Display the Launch page by entering either of the following URLs in your web
browser:
https://
<IP address>:9443/
or
http://
<IP address>:8080/
where <IP address> is the IP address of the Reporting server.
b. When the Launch page displays, click on the Dragon Reporting link.
The Enterasys IPS Launch page also offers a link to the Legacy Dragon Reporting
tools, which are described in Chapter 11, Legacy Reporting.
2. When the Dragon Reporting Login screen displays, enter your User Name and Password, then
click login.
The default User Name is dragon and there is no default password.
3. The System Dashboard and Reporting menu bar are displayed. The menu bar and Dashboard
areas are described in Tab le 1-1 below.
1-2 Enterasys IPS Analysis and Reporting Guide

Getting Started Starting Enterasys IPS Reporting
Table 1-1 System Dashboard and Menu Bar Descriptions
Component Description For more information...
Menu Bar The items on the menu bar allow you to:
• Select the type of interactive reports to
display
• Find information about specific events
• Schedule and manage user-defined reports
• Display help and logout
System Dashboard
Views Panel
System Dashboard
Tabbed Panel
Provides several views of the Enterasys IPS
system health information
Provides detailed information about the
Enterasys IPS components and sub-components
present in your network environment
•“Displaying Interactive
Reports” on page 1-4
•“Finding Events” on page 1-13
•“Creating and Viewing User
Defined Reports” on page 1-11
“The Views Panel” on page 2-2
“The Tabbed Panel” on page 2-4
Enterasys IPS Analysis and Reporting Guide 1-3

Displaying Interactive Reports Getting Started
Displaying Interactive Reports
You can display specific types of interactive reports by selecting from the menu bar. The
interactive reports include:
• 24 Hours Reports
• Top N Reports
• Trending Repo r ts
24 Hours Reports
The 24 Hours reports are described in detail in Chapter 3, 24 Hours Reports.
Two types of 24 Hours interactive reports can be displayed:
• Event Summary
• Event Log
Event Summary
By default, the Event Summary report lists each event that has occurred in the last 24 hours only
once, but gives you the number of times it has occurred during the last 24 hours and the hours in
which it occurred.
Clicking on an event causes event details to be displayed in the Event Table pane located at the
bottom of the interface window, as shown in the following figure. Right-clicking on an event in the
Event Table pane displays a menu of further actions that can be applied to the event. For more
information about the Event Table pane, see Chapter 6, Event Table Pane.
You can further filter the events displayed in the Event Summary tab by selecting an existing filter
from the Filter drop down list or by configuring additional filter Parameters, as described in
“Creating and Editing Report Filters” on page 1-10.
1-4 Enterasys IPS Analysis and Reporting Guide

Getting Started Displaying Interactive Reports
For information about navigating through multiple pages and setting display parameters for the
24 Hours reports, see“Setting Display Preferences” on page 3-4.
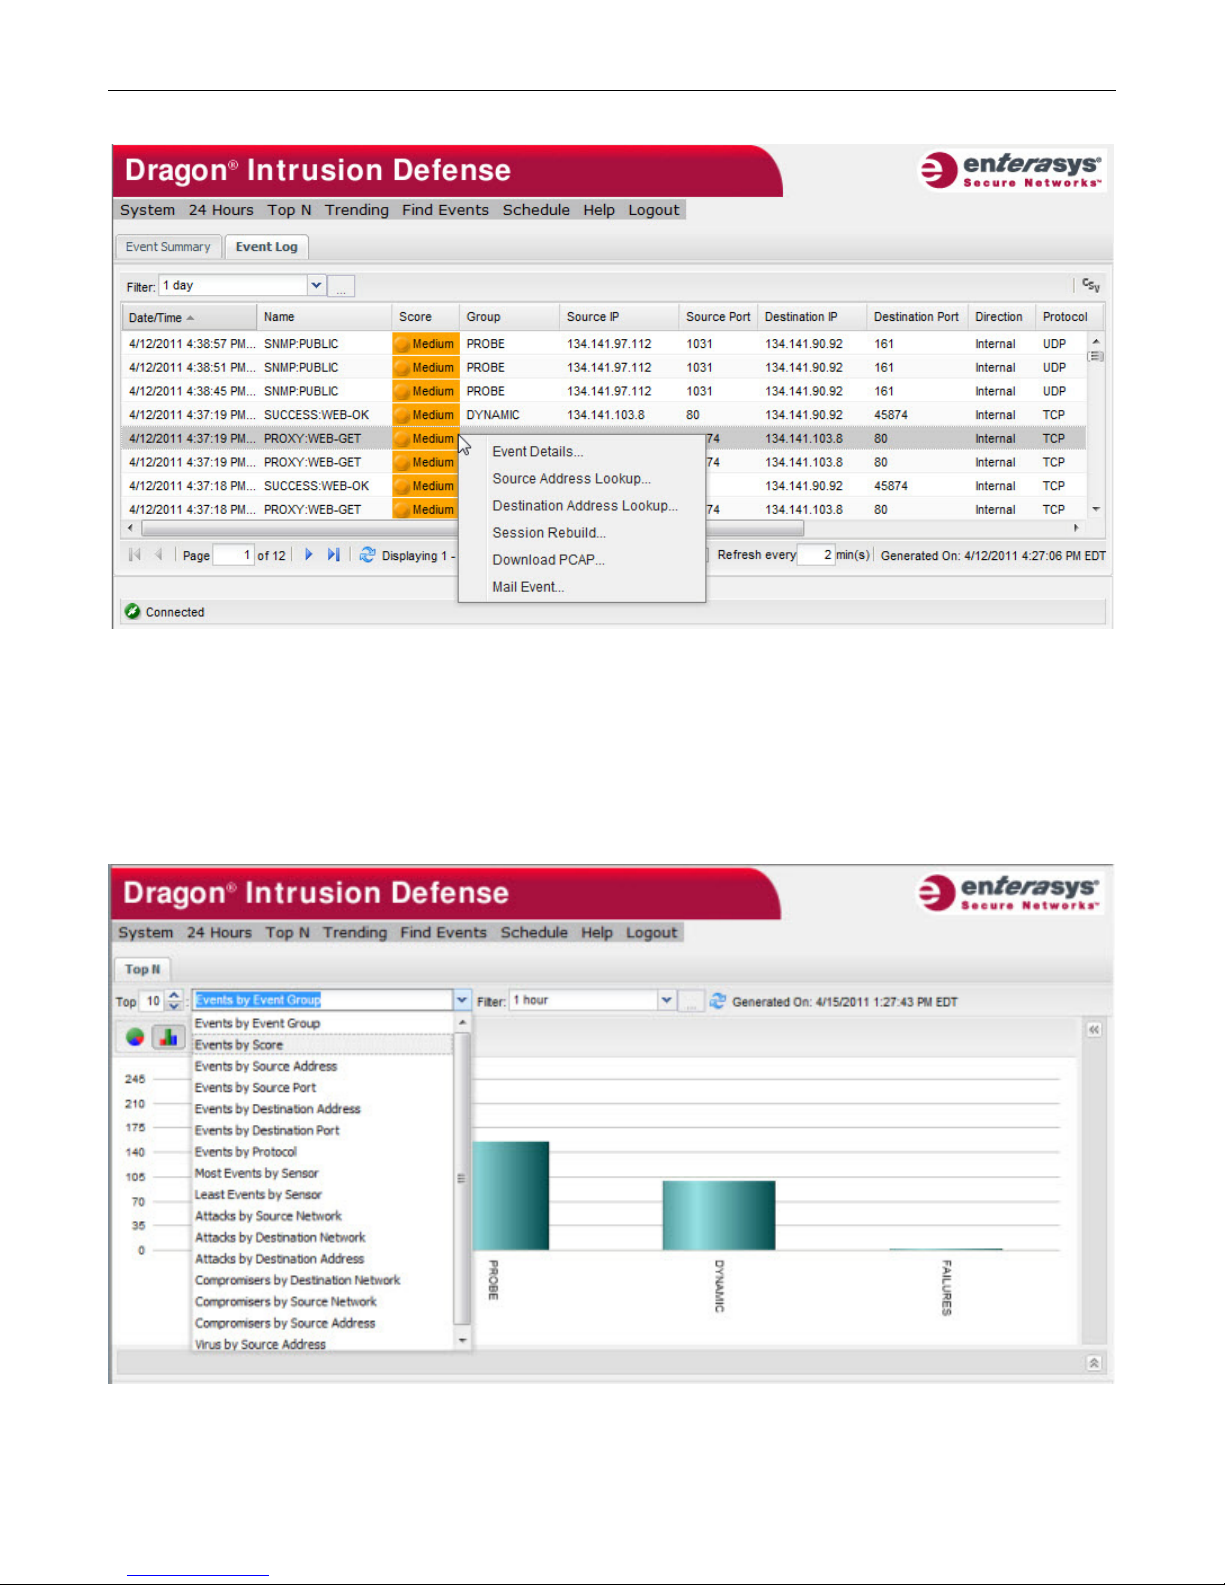
Event Log
By default, the Event Log report lists all the events that have occurred in the last 24 hours, in
sequential order. You can filter the data further by selecting an existing filter from the Filter drop
down list, or by creating a new filter, as described in “Creating and Editing Report Filters” on
page 1-10.
Right-clicking on an event displays a menu of further actions that can be applied to the event, as
shown below.
The Event Log report table can be exported in CSV (comma separated values) format and opened
immediately or saved as a file. To export, click on the CSV button at the top right of the pane.
Enterasys IPS Analysis and Reporting Guide 1-5
Displaying Interactive Reports Getting Started
Top N Reports
The Top N reports are described in more detail in Chapter 4, Top N Reports.
By default, Top N reports chart the top 10 occurrences of the selected event data, such as Events by
Event Group, Events by Score, and so on. You select the event data to display from a drop down
list, shown in the following figure.
You can interactively change the number of occurrences charted by increasing or decreasing the
number in the Top field.
1-6 Enterasys IPS Analysis and Reporting Guide

Getting Started Displaying Interactive Reports
Filter the data further by selecting an existing filter from the Filter drop down list, or by creating a
new filter, as described in “Creating and Editing Report Filters” on page 1-10.
The default chart type for the main reports is Column, but you can interactively change the chart
type to Pie or Bar, and for some charts, you can display the data in Logarithmic scale.
Single clicking on a data group in the chart causes event details to be displayed in the Event Table
pane located at the bottom of the interface window, as shown in the following figure. Rightclicking on an event in the Event Table pane displays a menu of further actions that can be applied
to the event. For more information about the Event Table pane, see Chapter 6, Event Table Pane.
Double clicking on a data group in the chart opens a pane on the right side of the main window
and displays a chart illustrating the event breakdown of the data group. Single clicking on a
section in the right hand chart causes those event details to be displayed in the Event Table pane.
Enterasys IPS Analysis and Reporting Guide 1-7

Displaying Interactive Reports Getting Started
Trending Reports
The Trending reports are described in detail in Chapter 5, Trending Reports.
The Trending reports can help you answer questions about long-term trends and activity. The
Trending reports query the MySQL database to display events. Two types of Trending interactive
reports can be displayed:
• Event Growth
• Daily Event Rates
Event Growth
The Event Growth tab compares the number of occurrences of events between two time periods.
By default, the time period is one day (comparing the last 24 hour period with the previous 24
hour period, as shown in the figure below).
Also by default, Event Growth charts (Column, Bar, Pie) show the Top 10 and Bottom 10 events —
the Top 10 events are those that showed the greatest positive growth over the time period, while
the Bottom 10 events showed the least (or negative) growth over the time period. You can select
the number of events to show, and you can choose to show only the Top n, only the Bottom n, or
both Top and Bottom.
You can interactively change the time periods displayed and other filter criteria, by changing the
time period value in the Filter drop-down list or by configuring a custom filter. For more
information about creating a custom filter, see “Creating and Editing Report Filters” on page 1-10.
The Event Growth Table shows all event counts for the two time periods, not just the Top and/or
Bottom n events.
1-8 Enterasys IPS Analysis and Reporting Guide

Getting Started Displaying Interactive Reports
Daily Event Rates
The Daily Event Rate report provides the average event count for the period, an n day moving
average, and a daily event count. Below the chart, the total event count is displayed for the period
as well as the average event count for the period shown. The minimum and maximum daily event
counts for the period are also displayed.
The figure below displays the Column chart view for the time period of one week with a three day
moving average.
Enterasys IPS Analysis and Reporting Guide 1-9

Displaying Interactive Reports Getting Started
As with the Event Growth Report, you can interactively change the time periods displayed and
other filter criteria, by changing the time period value in the Filter drop down list, changing the
number of Days in Moving Average by clicking the up or down arrows next to the field, or by
configuring a custom filter. For more information about creating a custom filter, see Creating and
Editing Report Filters.
Creating and Editing Report Filters
The 24 Hours, Top N, and Trending interactive reports allow you to further filter the data by
selecting an existing filter or by creating a new filter.
To create or edit a filter:
1. Click the Launch ( ...) button to the right of the Filter field. The Filter Parameters dialog
window is displayed.
1-10 Enterasys IPS Analysis and Reporting Guide

Getting Started Creating and Viewing User Defined Reports
2. Optionally, to edit an existing filter or create a new filter based on an existing filter, click the
Load button, then select the desired filter from the Select Filter to Load dialog box.
3. If you are creating a new filter, change the name of the filter.
Note that the default name of a new report is “1 day,” which must be changed in order to save
the new report.
4. For Top N report filters, in the Time group area, select either Range or Span from the drop
down list, then specify the desired values.
If no times are specified for the Range, the default times are from midnight on the start date to
11:59:59 pm on the end date.
Note that if you launch the Filter Parameters dialog from the 24 Hours reports, the Time group
area is grayed out and not available.
5. When you have completed specifying the filter parameters, click Apply to apply the filter to
the report. Note that this does not save the filter, but only applies a temporary filter to the
report.
6. Click Save to save the filter and apply the filter to the current report.
Note that the Save button is not available unless you have changed the name of the filter.
Creating and Viewing User Defined Reports
You can also create and generate reports based on criteria you want to see, by creating your own
report templates from predefined templates and then scheduling the report to run. Access these
functions from the Schedule menu bar item.
See Chapter 9, User Defined Reporting, for more information.
Creating a User Defined Report
User Defined report templates are easily created from predefined templates.
To create a new user defined report template and run the report:
1. Select Schedule > Manage Report Templates from the main menu bar, then click the New
Template button.
Enterasys IPS Analysis and Reporting Guide 1-11

Creating and Viewing User Defined Reports Getting Started
2. Click on the desired template from the Predefined Templates list, then fill in the template
details and click Save.
3. Your report template is added to the list of User Defined Templates.
4. Run the report manually by clicking on the Run icon (green arrow) on the right of the report
template’s row and view the output. Note that when you “run” the report, the output is not
stored as a generated report.
5. To generate the report and have it added to the list of generated reports, click the Generate
icon (gray gear).
1-12 Enterasys IPS Analysis and Reporting Guide

Getting Started Finding Events
Viewing Generated Reports
You can view generated user defined reports by selecting Schedule > Generated Reports from the
main menu bar.
From this page, you can:
• Display a generated report, by clicking on the green arrow
• Email a report, by clicking on the letter icon
• Delete a report, by clicking on the red X
Finding Events
You can use the Find Events menu bar item to search for specific events based on criteria that you
provide. The Find Events tab allows you to select from predefined criteria sets, as well as to
specify additional criteria, such as time period, source and destination addresses, event names or
groups, event severity score, or direction.
Note: A warning that a script is running slowly will sometimes display when generating a report with
a high event count.
Workaround: For Firefox, select the checkbox to not see this warning again. For Internet Explorer,
see http://support.microsoft.com/kb/175500.
Enterasys IPS Analysis and Reporting Guide 1-13

Viewing Database Restore Status Getting Started
Right-clicking on an event displayed in the right pane displays a menu of further actions that can
be applied to the event.
The columns in the right pane can be customized as described in “Customizing 24 Hours Report
Tab le s” on page 3-4.
Viewing Database Restore Status
As part of a software upgrade install, you can specify the number of days to restore from the
existing database (dragon.db files). The restore starts at the newest database days first, and
restores backwards from there.
During the restore process, a progress indicator showing the day currently being restored and the
number of days remaining is displayed in the status bar at the bottom of the Dashboard, 24 Hours,
Top N, and Find Events windows, as shown in the following figure.
1-14 Enterasys IPS Analysis and Reporting Guide

The System Dashboard provides a view into the health and status of the components of your
Enterasys IPS network infrastructure.
For information about... Refer to page...
System Dashboard Overview 2-1
The Views Panel 2-2
The Tabbed Panel 2-4
Customizing the Dashboard Interface 2-12
Platform-Specific Dashboard Details 2-20
System Dashboard Overview
The System Dashboard provides a view into the information you need to know to effectively
manage your Enterasys IPS deployment. This includes status information for the sensors and
nodes within a deployment. The Dashboard lets you see at a glance both an overview of the status
of your Enterasys IPS deployment and the status of each Enterasys IPS component in your
network.
2
System Dashboard
Enterasys IPS Analysis and Reporting Guide 2-1

The Views Panel System Dashboard
The Dashboard is displayed when you first log in to Reporting. After navigating away from the
Dashboard, you can return to the Dashboard by clicking System on the menu bar.
The Dashboard contains two main areas:
• The Views Panel
• The Tabbed Panel
The Views Panel
The Views Panel on the left side of the Dashboard displays the graphical views described in
Tab le 2- 1. You can enable and disable the views, as well as rearrange them within the Views Panel,
as described in “Customizing the Dashboard Interface” on page 2-12.
Each individual view provides additional information in a tooltip, which you can display by
mousing over a chart element.
Clicking a chart element within a view, such as a slice in a pie chart or an individual bar in a bar
graph, applies that chart element as a filter in the Tabbed Panel of the Dashboard (described in
“The Tabbed Panel” on page 2-4). Use this feature to zoom in on the specific information you are
most interested in.
Table 2-1 Views Panel Components
View Description
Busiest Sensors The Busiest Sensors view displays the top ten busiest Network
Sensors in terms of total packets read by the sensor.
The tooltip per bar displays the sensor name and the number of
packets read per second by that sensor.
Clicking on a sensor’s bar in the graph displays the Sensors Tab,
filtered on the specific sensor.
Busiest Systems The Busiest Systems chart displays the top ten busiest systems in
terms of total packets, including both packets read and packets
dropped.
The tooltip per bar displays the system name and the number of
packets read per second by that system.
Clicking on a system’s bar in the graph opens the Systems Tab in the
left pane of the Dashboard, filtered on the specific system.
2-2 Enterasys IPS Analysis and Reporting Guide

System Dashboard The Views Panel
Table 2-1 Views Panel Components (Continued)
View Description
Interfaces Status The Interfaces Status pie chart displays the status of all known
Enterasys IPS interfaces. Each currently present status category is a
“slice” of the pie chart. Interfaces that are up, down, and unavailable
are shown in the pie chart.
The tooltip per slice in the pie chart displays the status of that slice,
how many interfaces have that status, and the percentage of total
interfaces represented by that slice.
Clicking any slice in the pie chart opens the Interfaces Tab in the left
pane of the Dashboard, filtered on that status. For example,
double-clicking a Down slice would open the Interfaces tab and filter
the table to display only those interfaces that are down.
Sensors Status The Sensors Status chart displays a bar graph of all Host and Network
Sensors by status. Each currently present status category is a bar of
the chart showing sensors that are up, down, and unmanaged.
The tooltip per bar displays the type of sensor (Network or Host), the
status shown by the bar, and the number of sensors represented by
the bar.
Clicking any bar in the chart opens the Sensors Tab and filters it on
that status. For example, clicking the green Network bar would open
the Sensors tab, filtered to display only those Network Sensors that are
active.
Systems Status The Systems Status pie chart displays the status of all known
Enterasys IPS systems. Each currently present status category is a
“slice” of the pie chart. Interfaces that are active, unavailable, and
unmanaged are shown in the pie chart.
The tooltip per slice in the pie chart displays the status of that slice,
how many systems have that status, and the percentage of total
systems represented by that slice.
Clicking any slice in the pie chart opens the Systems Tab in the left
pane of the Dashboard and filters it on that status. For example,
double-clicking the Unavailable slice would open the Systems tab and
filter the table to display only those systems that are unavailable.
Enterasys IPS Analysis and Reporting Guide 2-3

The Tabbed Panel System Dashboard
Table 2-1 Views Panel Components (Continued)
View Description
Top Sensors by Event Rate The Top Sensors by Event Rate chart displays a bar graph of the top
ten most active (by Event Rate) Host and Network Sensors. Each of
the top ten Sensors is an entry in the chart.
The tooltip per bar displays the name of the sensor and the event rate
of that sensor in events per second.
Clicking any bar in the chart opens the Sensors Tab, filtered on that
individual sensor. For example, clicking the bar for
dragon244-ids1-eth1 opens the Sensors tab and filters the table to
display only that sensor.
Top Systems by Event Rate The Top Systems by Event Rate chart displays a bar graph of the top
ten most active (by Event Rate) Enterasys IPS systems. Each of the
top ten systems is an entry in the chart.
The tooltip per bar displays the name of the system and the event rate
of that system in events per second.
Clicking any bar in the chart opens the Systems Tab, filtered on that
individual system.
The Tabbed Panel
The Tabbed Panel on the right side of the Dashboard presents detailed information about the
Enterasys IPS components and subcomponents present in your network environment. The
following top-level tabs are in this panel:
• Systems Tab
• Sensors Tab
• Interfaces Tab
• EMS/Reporting Tab
Systems Tab
By default, the Systems tab provides a table of system information for all the Enterasys IPS
systems in your environment. An Enterasys IPS system is any system known to the EMS that
contains an IPS component. Tabl e 2- 2 on page 2-5 describes the columns displayed in the Systems
tab table.
You can display details about a specific system by selecting the system and clicking the double
arrow button at the bottom right of the tab, as shown in Figure 2-1 on page 2-5.
2-4 Enterasys IPS Analysis and Reporting Guide

System Dashboard The Tabbed Panel
Figure 2-1 The Systems Tab
Table 2-2 Systems Tab Columns
Column Header Description
Status Refer to Table 2-3 on page 2-6.
Status Message Status messages received from the system. Refer to Ta bl e 2 - 4 on
Configuration Channel Status Status of system’s Configuration Channel. Values can be:
Event Channel Status Status of system’s Event Channel. Values can be:
Operating System Type of operating system of the system.
page 2-6 for more information.
• Connected
• Disconnected
• Unknown (typically, status of Unmanaged systems)
•Up
•Down
• Blank, for systems that do not have an Event Channel, such as
an EMS that is not forwarding events to another server.
Enterasys IPS Analysis and Reporting Guide 2-5

The Tabbed Panel System Dashboard
Table 2-2 Systems Tab Columns (Continued)
Column Header Description
Uptime How long the host system has been up.
Last Heartbeat On The date and time of the last heartbeat event received from the
Event Channel on this system.
If this cell is yellow and displays a warning icon, it means that the
Dashboard has not yet received a heartbeat from this system.
Last Deployed On The date and time of the last deployment of this system.
Event Rate (per sec) Total events processed by the system. For an EMS or Reporting
Server, this value will include all incoming events.
CPU Usage % Percent of CPU in use by all processes running on the system.
Memory Total (MB) Total memory available on the system, in megabytes.
Memory User (MB, %) Total memory used by all processes, in megabytes and % of total
available.
Disk Total (MB) The amount of disk space on the drive or the partition where
Dragon is installed.
Disk Used (MB, %) Disk space used by all files and applications on the drive or
partition where Dragon is installed, in megabytes and % of total
available.
Version The version of Dragon running on system.
Possible Status column values are described in Ta ble 2- 3 below.
Table 2-3 Status Column Values
Status Description
Active System is operating normally (the Configuration Channel and Sensor are both
up).
Inactive System’s Configuration Channel is up but the Sensor is down.
Unavailable System’s Configuration Channel is down and no additional information about the
system is available.
Upgrading System is in the process of being upgraded.
Unmanaged System is not managed by the EMS.
Never Deployed System has never been successfully deployed.
Deleted System has been manually deleted from the EMS. To remove deleted items from
the Dashboard display, see “Removing a Table Entry” on page 2-17.
Messages displayed in the Status Message column are messages received from the system.
Although we cannot list all possible messages, Table 2-4 lists several examples of status messages
and their meanings.
Table 2-4 Example Status Messages
Status Message Condition
No message/blank field This sensor or system is up with no known issues.
Sensor-name is not up A system update occurred and one or more sensors on this system are
2-6 Enterasys IPS Analysis and Reporting Guide
down.

System Dashboard The Tabbed Panel
Table 2-4 Example Status Messages (Continued)
Status Message Condition
Network Sensor Shutting Down A network sensor or interface is shutting down.
Interface is Down The Interface is link-down.
Sensors Tab
The Sensors tab displays information about Network and Host Sensors in the Enterasys IPS
environment. Table 2-2 on page 2-5 describes the type of data shown in the Sensors tab table
columns.
You can display details about a specific sensor by selecting the sensor and clicking the double
arrow button at the bottom right of the tab, as shown in Figure 2-2 below.
Figure 2-2 The Sensors Tab
Table 2-5 Sensors Tab Columns
Column Header Description
Status Refer to Table 2-3 on page 2-6.
Enterasys IPS Analysis and Reporting Guide 2-7

The Tabbed Panel System Dashboard
Table 2-5 Sensors Tab Columns (Continued)
Column Header Description
Status Message Status messages received from the sensor. Refer to Ta b le 2 -4 on
page 2-6 for more information.
Operating System Type of operating system of the sensor.
Type Type of sensor: IDS, IPS, or Host.
Sensor Uptime How long the sensor process has been running.
Last Heartbeat On Time of the last heartbeat event received via the Event Channel.
If the cell is yellow and contains a warning icon, the last heartbeat
event received is old, as shown by the time in the field.
Last Deployed On The date and time of the last deployment of this sensor.
Event Rate (per sec) Total events processed by the sensor.
Packets Read (pps) Packets read by the Network Sensor that were not dropped (in
packets per second). The bits from these packets contribute to the
bandwidth license measurement (see Bits Read (Mbps) below.)
Packets Inspected (pps) Packets that are read in successfully and sent through the
inspection process. Expressed in packets per second.
Packets Filtered (pps) Packets that are read in successfully, but are filtered out by an
application filter statement or because they are of a protocol type
that Enterasys IPS does not know how to inspect. Expressed in
packets per second.
Packets Blocked (pps) In an in-line IPS deployment, the packets that are blocked due to
either intrusion prevention rules or a black list rule. Expressed in
packets per second.
Packets White-listed (pps) In an in-line IPS deployment, the packets that were read in
successfully and transmitted without inspection due to a white list
rule. Expressed in packets per second.
Bits Read (Mbps) Number of bits in packets read by the sensor that were not
dropped. Expressed in megabits per second.
This value is compared with the license bandwidth limit to
determine if the bandwidth limit has been exceeded.
Bits Inspected (Mbps) Number of bits in packets that were read in successfully and sent
through the inspection process. Expressed in megabits per
second.
Bits Filtered (Mbps) Number of bits in packets that were read in successfully but were
filtered out. Expressed in megabits per second.
Bits Blocked (Mbps) Number of bits in the packets that were blocked. Expressed in
megabits per second.
Bits White-listed (Mbps) Number of bits in the packets that were read in successfully and
transmitted without inspection. Expressed in megabits per second.
CPU Usage % Percent of CPU used by the sensor process.
Memory Total (MB) Total memory available on host system.
Memory Used (MB, %) Memory used by sensor process, expressed in megabytes and in
2-8 Enterasys IPS Analysis and Reporting Guide
percentage of total memory available.
System Dashboard The Tabbed Panel
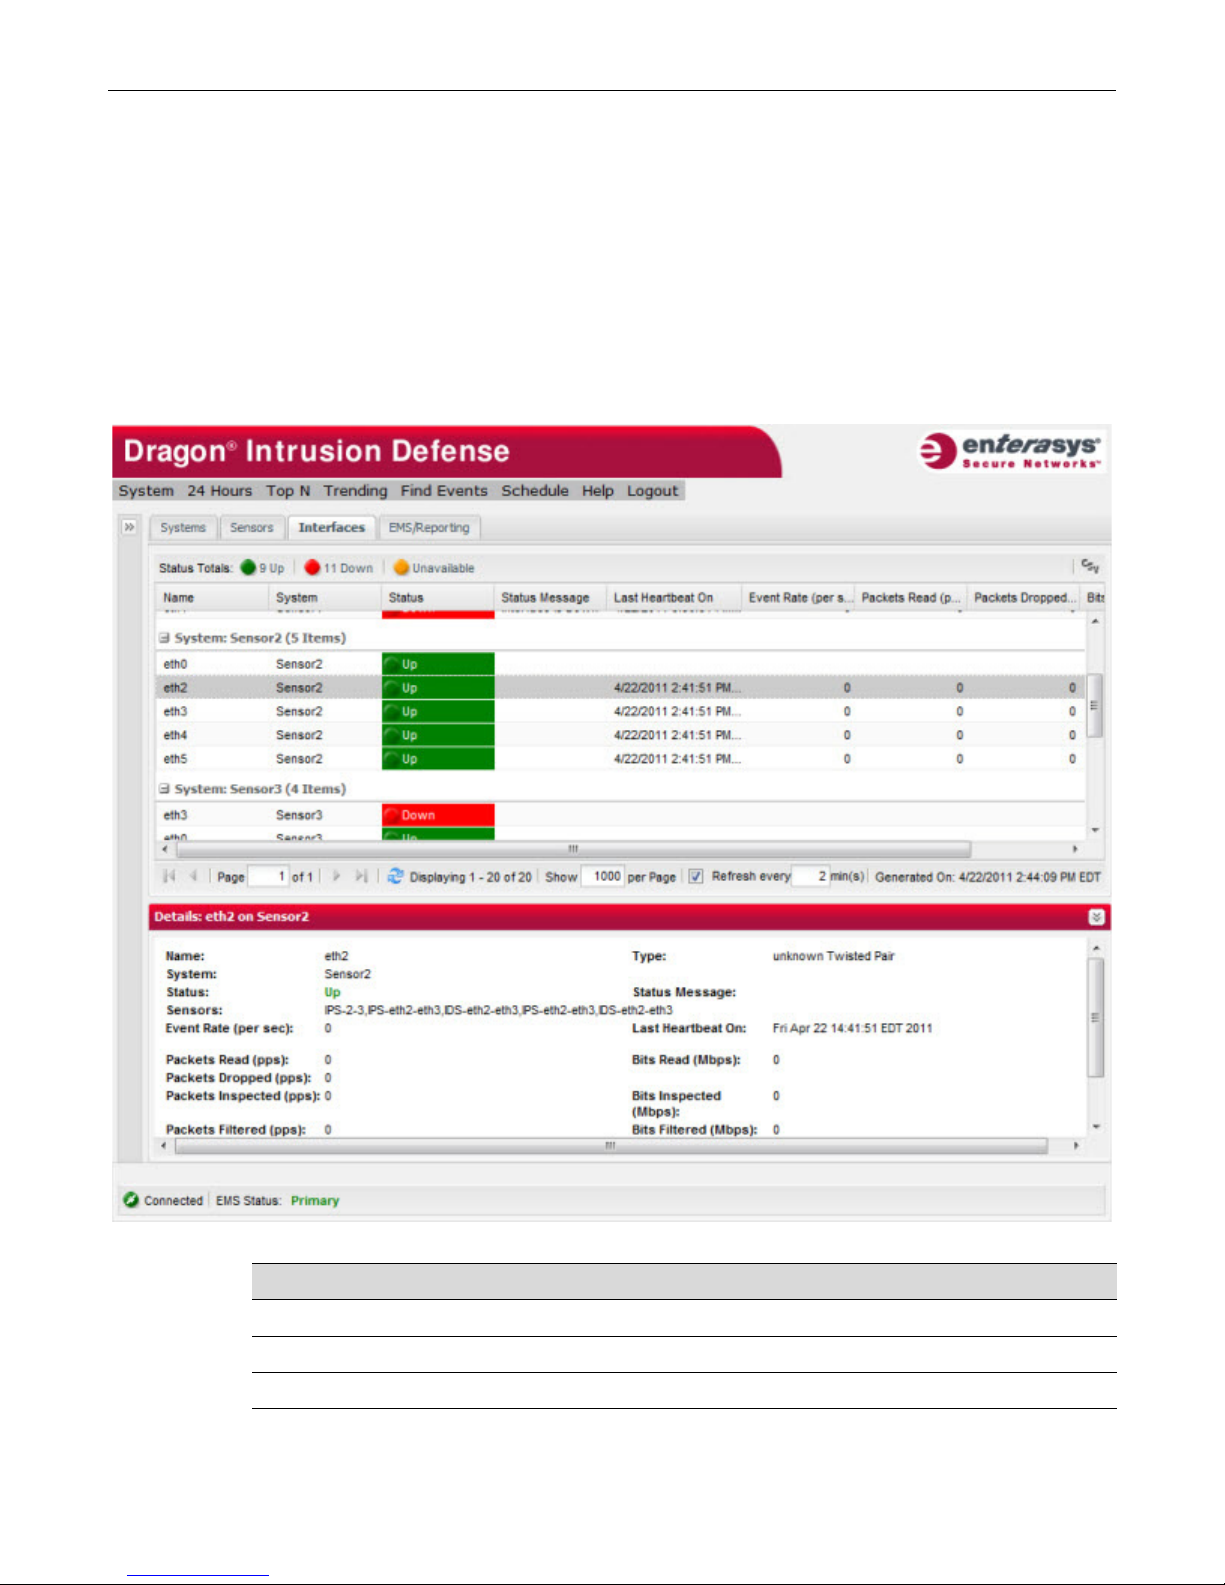
Interfaces Tab
The Interfaces tab displays information about the network interfaces of Enterasys IPS systems and
sensors in the Enterasys IPS environment. By default, interface information is grouped in this table
by system. Refer to “Sorting, Filtering, and Grouping In Columns” on page 2-15 for information
about changing the default display options.
Tab le 2- 6 on page 2-9 describes the type of data shown in the Interfaces tab table columns.
You can display details about a specific interface by selecting the interface and clicking the double
arrow button at the bottom right of the tab, as shown in Figure 2-3 on page 2-9.
Figure 2-3 The Interfaces Tab
Table 2-6 Interface Tab Columns
Column Header Description
Status The Up/Down link status of the port.
Status Message Refer to Table 2-4 on page 2-6.
Last Heartbeat On The last time a heartbeat event was received from the system.
Event Rate (per sec) Events generated for traffic received on this interface.
Enterasys IPS Analysis and Reporting Guide 2-9

The Tabbed Panel System Dashboard
Table 2-6 Interface Tab Columns (Continued)
Column Header Description
Packets Read (pps) Packets read by the Network Sensor on this interface that were
not dropped (in packets per second). The bits from these packets
contribute to the bandwidth license measurement.
Packets Dropped (pps) Packets that were dropped at the interface because the sensor
was too busy to service the queue in time. Any dropped rate
above zero indicates a gap in security, as these packets are not
being inspected. Expressed in packets per second.
Packets Inspected (pps) Packets that are read in successfully and sent through the
inspection process. Expressed in packets per second.
Packets Filtered (pps) Packets that are read in successfully, but are filtered out by an
application filter statement or because they are of a protocol type
that Enterasys IPS does not know how to inspect. Expressed in
packets per second.
Packets Blocked (pps) In an in-line IPS deployment, the packets that are blocked due to
either intrusion prevention rules or a black list rule. Expressed in
packets per second.
Packets White-listed (pps) In an in-line IPS deployment, the packets that were read in
successfully and transmitted without inspection due to a white list
rule. Expressed in packets per second.
Bits Read (Mbps) Number of bits in packets read by the sensor at this interface that
were not dropped. Expressed in megabits per second.
This value is compared with the license bandwidth limit to
determine if the bandwidth limit has been exceeded.
Bits Inspected (Mbps) Number of bits in packets that were read in successfully at this
interface and sent through the inspection process. Expressed in
megabits per second.
Bits Filtered (Mbps) Number of bits in packets that were read in successfully at this
interface but were filtered out. Expressed in megabits per second.
Bits Blocked (Mbps) Number of bits in the packets that were blocked at this interface.
Expressed in megabits per second.
Bits White-listed (Mbps) Number of bits in the packets that were read in successfully at this
interface and transmitted without inspection. Expressed in
megabits per second.
2-10 Enterasys IPS Analysis and Reporting Guide

System Dashboard The Tabbed Panel
EMS/Reporting Tab
The EMS/Reporting tab displays Enterasys IPS-specific system information about EMS and
Reporting servers in this Enterasys IPS environment. A graph of event cache traffic over time is
also displayed, as shown in Figure 2-4 below.
Figure 2-4 The EMS/Reporting Tab
Event Cache Traffic Graph
The Event Cache Traffic graph provides a visual indication of the rate at which events are being
sent to the EMS, and the rate at which they are being processed.
Events are sent to the EMS and stored temporarily in the event cache. After all registered agents
have processed an event, it is removed from the cache.
The line graph displays the rates at which events are entering and leaving the cache over the
selected time span. Green indicates received events and blue indicates processed events.
Enterasys IPS Analysis and Reporting Guide 2-11

Customizing the Dashboard Interface System Dashboard
Under optimal conditions, these lines are identical, indicating that events are processed as soon as
they are received. Under high load conditions, the event processing rate can lag the event
reception rate, resulting in delays in event reporting. Normally this backlog is cleared once the
incoming event rate settles down.
The Event Cache Traffic graph provides an easy way to quickly see the event load the EMS is
operating under and gauge how well it is keeping up with that load.
Customizing the Dashboard Interface
Customizing the Views Panel
You can resize interface elements in the Dashboard, such as panels. For example, to resize a panel,
mouse over the area between panels until the cursor changes as shown in Figure 2-5. Click, drag,
and release the panel separator to resize the panels.
Figure 2-5 Resizing the Views Panel
You can show and/or hide certain interface elements in the Dashboard, such as the entire Views
panel or individual views themselves.
To hide the entire Views panel, click the double left arrows icon as shown in Figure 2-6.
Figure 2-6 Hide Views Panel
To show the Views panel, click the double right arrows icon as shown in Figure 2-7.
2-12 Enterasys IPS Analysis and Reporting Guide

System Dashboard Customizing the Dashboard Interface
Figure 2-7 Show Views Panel
To show or hide an individual view, click the triangle icon in the individual view’s title bar as
shown in Figure 2-8. To close a view, click the Close icon in the views title bar.
Figure 2-8 Show or Hide Individual Views
If you remove a view from the Views Panel layout using the Close icon in the views title bar, you
can use the Views drop down menu to display the view again, as shown in Figure 2-9. Use this
drop down menu to remove individual views completely from the layout.
Figure 2-9 Removing or Adding a View to the Views Panel
To reorganize the layout of views, click and drag the view’s title bar as shown in Figure 2-10.
Enterasys IPS Analysis and Reporting Guide 2-13

Customizing the Dashboard Interface System Dashboard
Figure 2-10 Moving Views
Customizing Tables in the Tabbed Panel
The following sections describe customizations you can perform on the tables in the Systems,
Sensors, and Interfaces tabs.
Resizing Columns
You can resize table columns. For example, to resize a column, mouse over the area between
columns until the cursor changes as shown in Figure 2-11. Click, drag, and release the column
separator to resize the column.
Figure 2-11 Resizing Table Columns
Moving Columns
To reorganize the layout of columns within tables, click and drag the column name to a new
location. Figure 2-12 shows the Uptime column of the Systems table being repositioned to the
right of the Status column.
Figure 2-12 Moving Columns
2-14 Enterasys IPS Analysis and Reporting Guide

System Dashboard Customizing the Dashboard Interface
Sorting, Filtering, and Grouping In Columns
All columns in the Systems, Sensors, and Interfaces tab tables have a drop down menu that allows
you to sort, group, and filter the contents, as appropriate. Figure 2-13 shows the drop down menu
that is displayed for the Status Message column in the Systems tab.
Sort Options
With the exception of the Sort options, not all options shown in Figure 2-13 are selectable for all
columns, depending on what is appropriate for the data in the column.
Figure 2-13 Column Drop Down Menu
Group Options
Use the Group By This Field option to group the report displayed by the values in a specific
column, as shown in Figure 2-14. When you select Group By This Field, the Show in Groups
checkbox is automatically checked. To undo the grouping, uncheck the Show in Groups
checkbox.
Figure 2-14 Grouping Options
Filters Options
The Filters option varies, depending on the type of data displayed in the column. For example, as
shown in Figure 2-15, in the Systems tab table, the Filters option for the Status Message column
provides a text field in which you can enter the message text you want to filter on, while the Filters
option for the Configuration Channel column lets you choose from the possible values that can be
displayed in that column.
Enterasys IPS Analysis and Reporting Guide 2-15

Customizing the Dashboard Interface System Dashboard
Figure 2-15 Column Filters Options
Selecting Columns to Display
You can select what columns to display in the Systems, Sensors, and Interfaces tab tables, by
checking and unchecking the desired columns in the Columns option drop down menu.
Figure 2-16 on page 2-17 illustrates how to display a list of columns. Check or uncheck the
appropriate check box to display or hide specific columns.
Systems tab columns are described in Tab le 2- 2 on page 2-5.
Sensors tab columns are described in Tab le 2- 5 on page 2-7.
Interfaces tab columns are described in Tab le 2- 6 on page 2-9.
2-16 Enterasys IPS Analysis and Reporting Guide

System Dashboard Customizing the Dashboard Interface
Figure 2-16 Selecting Columns to Display
Removing a Table Entry
You can remove a row from a table by right-clicking the row, then selecting Remove Entry. When
prompted, click Yes to delete all status data associated with the entry from the Dashboard’s side of
the dragonevents database.
Use this feature to remove systems, sensors, or interfaces from the Dashboard that have stopped
reporting statistics or no longer exist in the Enterasys IPS deployment environment. If the
component starts reporting statistics again, it will again be displayed in the Dashboard.
Removing or Applying a Table Filter
The Systems, Sensors, and Interfaces tabs have a Status Totals bar at the top of the tab which
provides filter buttons you can use to filter the contents of the table, in addition to listing the
number of items in the table that match each filter. For example, in Figure 2-17 below, the
Unavailable filter has been applied so that only systems with a status of unavailable are displayed
in the table. The Status Totals bar also shows that 17 systems are Active, one system is
Unavailable, and one system is Unmanaged.
To remove (or apply) a filter in a tabbed view, click the desired filter button at the top of the table.
Enterasys IPS Analysis and Reporting Guide 2-17

Customizing the Dashboard Interface System Dashboard
Figure 2-17 Remove or Apply a Filter in the Tabbed Panel
Tab le 2- 7 describes the Systems and Sensors tab status filters. The Interfaces tab has similar filters
that filter on interfaces with a status of Up, Down, and Unavailable.
Table 2-7 Systems and Sensors Tab Status Filters
State Description
Active Filter on Enterasys IPS systems/sensors with a status of Active, meaning that
they are operating normally (the Configuration Channel and Sensor are both up)
Inactive Filter on Enterasys IPS systems/sensors with a status of Inactive, meaning that
the Configuration Channel is up but the Sensor is down
Unavailable Filter on Enterasys IPS systems/sensors with a status of Unavailable, meaning
that the Configuration Channel is down and no additional information about the
system is available
Upgrading Filter on Enterasys IPS systems/sensors with a status of Upgrading, meaning that
the system/sensor is in the process of being upgraded
Unmanaged Filter on Enterasys IPS systems/sensors with a status of Unmanaged, meaning
that the system/sensor is not managed by the EMS
Never Deployed Filter on Enterasys IPS systems/sensors with a status of Never Deployed,
meaning that the system/sensor has never been successfully deployed
Deleted Filter on Enterasys IPS systems/sensors with a status of Deleted, meaning that
the system/sensor has been manually deleted from the EMS. To remove deleted
items, see “Removing a Table Entry” on page 2-17.
Exporting Tables in CSV Format
The tables displayed in the Systems, Sensors, and Interfaces tabs can be exported in CSV (comma
separated values) format and opened immediately or saved as a file.
1. Click on the CSV button to the far right on the Status Totals bar.
If the CSV button is not visible:
– Right click in the table and select Export as .csv, or
– Resize the Tabbed Panel to display the entire Status Totals bar, or
– Click the double right arrows icon on the Status Totals bar which will display a drop
down menu with Export as .csv as an option.
2. When prompted, select Open or Save.
3. If you selected Open, the file will be opened using the selected application (such as Microsoft
Excel). If you selected Save, you will be prompted to specify the location.
2-18 Enterasys IPS Analysis and Reporting Guide

System Dashboard Customizing the Dashboard Interface
Resetting the Dashboard Interface to the Default Layout
Dashboard interface settings are stored in Web browser “cookies.” Removing these cookies lets
you reset the interface back to its default layout.
To remove all Dashboard interface layout changes and revert the Dashboard interface back to the
default settings, remove the Enterasys IPS Reporting server cookies as follows.
1. In the Web browser you use to view Enterasys IPS Reporting, view stored cookies. In Firefox,
for example, select Tools > Options from the main menu, then click Privacy. Click Show
Cookies to see the list of stored browser cookies.
2. Search for the cookies associated with your Enterasys IPS Reporting server. In this example,
this is the set of cookies for the site 10.20.117.245 as shown in Figure 2-18 below.
Figure 2-18 Removing Cookies
3. Remove this set of cookies and reload the Enterasys IPS Reporting main page.
4. Log in to Enterasys IPS Reporting. The Dashboard with the default interface layout appears.
Enterasys IPS Analysis and Reporting Guide 2-19

Platform-Specific Dashboard Details System Dashboard
Platform-Specific Dashboard Details
This section provides details about how the various Enterasys IPS statistics available in the
Dashboard are gathered. In addition, differences between supported operating systems in how
this data is collected are detailed.
Unix and Linux Systems
Unix and Linux Enterasys IPS systems use dragonctl, system calls and platform-specific shell
scripts to provide system status information to Dashboard. The dragonctl process reports system
statistics, while the host sensor process reports sensor statistics.
System Status
The dragonctl process generates heartbeat events that contain system status. Dashboard uses these
heartbeat events to provide the following information:
• System CPU used (percentage)
Note: Unix CPU Used values are averaged from snapshot measurements and may differ from the
output of running the top command.
• Total disk space available on the Dragon partition
• Total disk space used on the Dragon partition
• Total memory available on the system, in megabytes (MB)
• Total memory used on the system, in megabytes (MB)
• System uptime
• Event rate from the system
Host Sensor Status
On Unix platforms, the Host Sensor is responsible for generating heartbeat events that contain
Host Sensor status information. Dashboard uses these heartbeat events to report the following
information:
• Host Sensor uptime
• Host Sensor event rate
• Host Sensor CPU usage
• Host Sensor memory used
• Total system memory
Windows Systems
On Windows systems, the Host Sensor process generates heartbeat events that provide both
system and Host Sensor status information to the System Dashboard.
Note: On Windows systems, if the Host Sensor (DragonSquire Services) is not running, both
System Status and Host Sensor Status will be unavailable in the System Dashboard. This is
because the Host Sensor generates both sets of data for Windows systems.
2-20 Enterasys IPS Analysis and Reporting Guide

System Dashboard Platform-Specific Dashboard Details
System Status
On Windows systems, Dragon leverages Windows Management Instrumentation (WMI)
technology, the data management infrastructure for Windows-based operating systems, as well as
system calls to provide system status information to the System Dashboard.
• System CPU used (percentage)
Note: On Windows systems, the System CPU used (percentage) and Host Sensor CPU Usage are
both instantaneous measurements.
• Total disk space available on the Dragon partition
• Total disk space used on the Dragon partition
• Total memory available on the system, in megabytes (MB)
• Total memory used on the system, in megabytes (MB)
• System uptime
• Event rate from the system
Host Sensor Status
Dashboard uses Host Sensor heartbeat events on Windows to provide the following Host Sensor
status information:
• Host Sensor Uptime
• Host Sensor Event Rate
• Host Sensor CPU Usage
• Host Sensor Memory Used
• Total System Memory
Enterasys IPS Analysis and Reporting Guide 2-21

Platform-Specific Dashboard Details System Dashboard
2-22 Enterasys IPS Analysis and Reporting Guide

3
24 Hours Reports
The 24 Hours reports display information about events that have occurred over the last 24 hours.
You can display the 24 Hours reports by selecting 24 Hours from the Reporting menu bar. Two
reports are available: the Event Summary report and the Event Log report.
For information about... Refer to page...
Event Summary Report 3-1
Event Log Report 3-2
Setting Display Preferences 3-4
Customizing 24 Hours Report Tables 3-4
Note: A warning that a script is running slowly will sometimes display when generating a report with
a high event count.
Workaround: For Firefox, select the checkbox to not see this warning again. For Internet Explorer,
see http://support.microsoft.com/kb/175500.
Event Summary Report
The Event Summary report lists each event that has occurred in the last 24 hours only once, but
gives you the number of times it has occurred during the last 24 hours (in the Count column) and
the hours in which it occurred (in the green bullets in the hour columns). Tab le 3-1 on page 3-2
describes the columns in the Event Summary report.
You can filter the data in the report by selecting an existing filter from the Filter drop down list, or
by creating a new report filter, as described in “Creating and Editing Report Filters” on page 1-10.
Enterasys IPS Analysis and Reporting Guide 3-1

Event Log Report 24 Hours Reports
Figure 3-1 Event Summary Report
Refer to “Customizing 24 Hours Report Tables” on page 3-4 for information about customizing
your view of this report and about exporting the report in CSV (comma separated values) format.
Table 3-1 Event Summary Report Columns
Column Description
Name Name of the event. Right-click on the row and select Event
Details... to see information about the event. See Chapter 7,
Event Details for more information.
Count The number of times the event has occurred over the last 24
hours.
Score The severity score of the event. The table can be filtered by score.
Group The event group of the event. Table can be organized by event
group, and also filtered by group.
Last Time The date and time of the last occurrence of this event.
Time columns A column is displayed for each hour of the past 24 hours. If the
event occurred during that hour, the number of occurrences is
displayed.
Single clicking on a data group in the charts or table view causes details of the event to display in
the Event Table pane. The Event Table pane is described in detail in Chapter 6, Event Table Pane.
Event Log Report
The Event Log report lists all the events that have occurred in the last 24 hours, in sequential order.
You can filter the data further by selecting an existing filter from the Filter drop down list, or by
creating a new report filter, as described in “Creating and Editing Report Filters” on page 1-10.
3-2 Enterasys IPS Analysis and Reporting Guide

24 Hours Reports Event Log Report
Right-clicking on an event displays a menu of further actions that can be applied to the event, as
shown in Figure 3-2 on page 3-3. See “Right-Click Action Menu Options” on page 3-3 for
descriptions of the options.
Single clicking on a data group in the charts or table view causes details of the event to display in
the Event Table pane. The Event Table pane is described in detail in Chapter 6, Event Table Pane.
Figure 3-2 Event Log Report
Table 3-2 Right-Click Action Menu Options
Option Description
Event Details Displays a pop-up window containing details of the event. See
Chapter 7, Event Details for more information.
Source Address Lookup Displays a new browser window that attempts to resolve the IP
address using a DNS lookup. Additional publicly-available web
sites that perform address resolution are provided as links on the
browser page.
Destination Address Lookup Displays a new browser window that attempts to resolve the IP
address using a DNS lookup. Additional publicly-available web
sites that perform address resolution are provided as links on the
browser page.
Session Rebuild Displays a page with the session information for the selected
event. Applicable to TCP events.
Download PCAP Provides a download of a PCAP capture file. This file contains the
traffic between the source and destination IP addresses of the
event for the day the event was generated. Applicable to any TCP
event that supports the Dragon mktcpdump CLI tool.
Refer to Chapter 8, Viewing a PCAP File for an Event for more
information.
Mail Event Opens your mail application with the URL for the event in the
content field of the message.
Enterasys IPS Analysis and Reporting Guide 3-3

Setting Display Preferences 24 Hours Reports
Setting Display Preferences
The 24 Hours interactive reports allow you to set the display preferences for each report, by
editing the fields in the preferences bar at the bottom of the report window.
You can set the number of rows to display per page in the Show per Page field, and you can move
forward and back through the pages by clicking on the direction arrows next to the Page field, as
shown in the figure below. You can interactively refresh the display by clicking the circular arrow
icon next to the Page field.
In the 24 Hours reports, you can also set the automatic refresh rate, as shown below. You can also
turn automatic refreshing of the 24 Hours reports on or off.
Customizing 24 Hours Report Tables
The following sections describe customizations you can perform on the tables in the 24 Hours
reports.
Resizing Columns
You can resize table columns. For example, to resize a column, mouse over the area between
columns until the cursor changes as shown in Figure 3-3. Click, drag, and release the column
separator to resize the column.
Figure 3-3 Resizing Table Columns
Moving Columns
To reorganize the layout of columns within tables, click and drag the column name to a new
location. Figure 3-4 on page 3-4 shows the Group column being repositioned to the left of the
Score column.
Figure 3-4 Moving Columns
Sorting, Filtering, and Grouping In Columns
All columns in the 24 Hours report tables have a drop down menu that allows you to sort, group,
and filter the contents, as appropriate. Figure 3-5 shows the drop down menu that is displayed for
the Score column in the 24 Hours reports.
3-4 Enterasys IPS Analysis and Reporting Guide
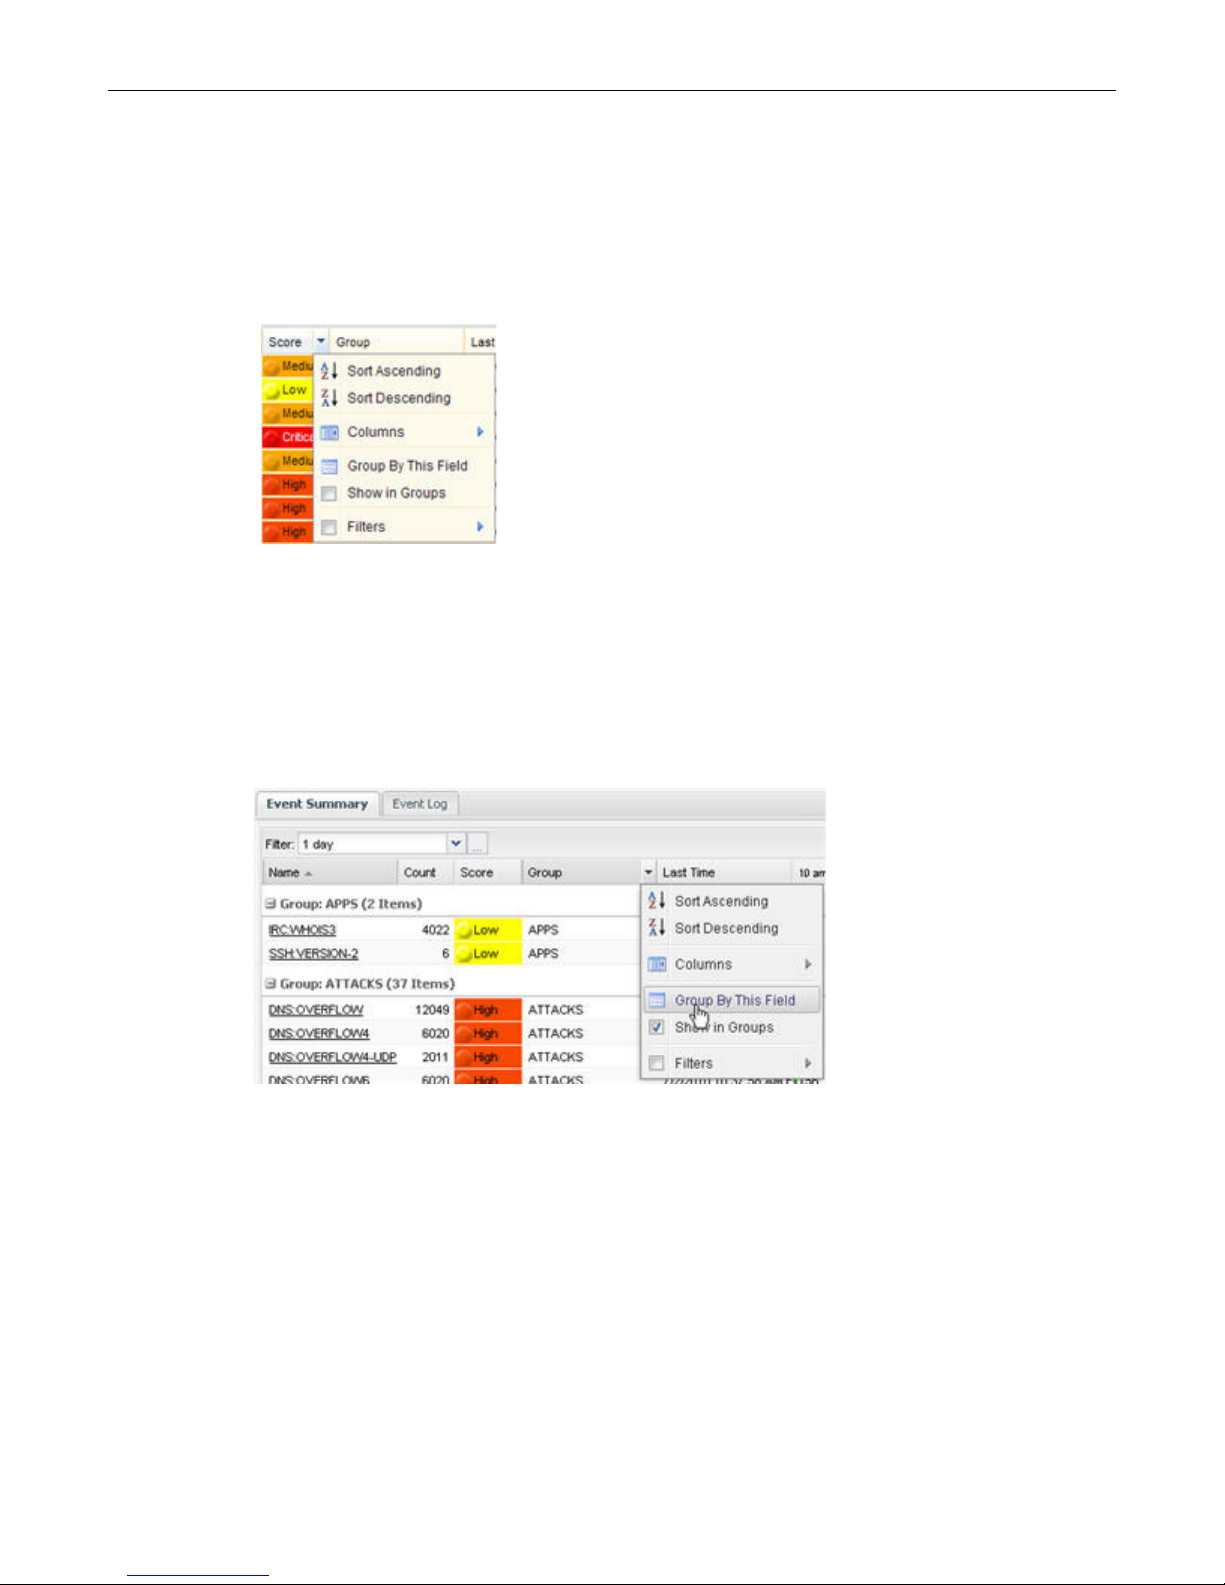
24 Hours Reports Customizing 24 Hours Report Tables
Sort Options
The Sort options are shown in Figure 3-5. With the exception of the Sort options, not all options
shown in Figure 3-5 are selectable for all columns, depending on what is appropriate for the data
in the column.
Clicking in the column header also reverses the sort order of the column.
Figure 3-5 Column Drop Down Menu
Group Options
Use the Group By This Field option to group the report displayed by the values in a specific
column, as shown in Figure 3-6. When you select Group By This Field, the Show in Groups
checkbox is automatically checked. To undo the grouping, uncheck the Show in Groups
checkbox.
Figure 3-6 Grouping Options
Filters Options
The Filters option varies, depending on the type of data displayed in the column. For example, as
shown in Figure 3-7, the Filters option for the Group column provides a text field in which you
can enter the group name you want to filter on, while the Filters option for the Score column lets
you choose from the possible values that can be displayed in that column (Critical, High, Medium,
Low).
Enterasys IPS Analysis and Reporting Guide 3-5

Customizing 24 Hours Report Tables 24 Hours Reports
Figure 3-7 Column Filters Option
s
Selecting Columns to Display
You can select what columns to display in the 24 Hours report tables, by checking and unchecking
the desired columns in the Columns option drop down menu. Figure 3-8 illustrates how to
display a list of columns in the 24 Hours Event Summary report. Check or uncheck the
appropriate check box to display or hide specific columns.
Figure 3-8 Selecting Columns to Display
Exporting Tables in CSV Format
The tables displayed in the 24 Hours reports can be exported in CSV (comma separated values)
format and opened immediately or saved as a file.
1. Click on the CSV button to the far right on the bar at the top of the report.
2. When prompted, select Open or Save.
3. If you selected Open, the file will be opened using the selected application (such as Microsoft
Excel). If you selected Save, you will be prompted to specify the location.
3-6 Enterasys IPS Analysis and Reporting Guide

4
Top N Reports
Top N reports chart the top number of occurrences (10 by default) of selected event data, such as
Events by Event Group, Events by Score, and so on. You can display the Top N report window by
selecting Top N from the Reporting menu bar.
For information about... Refer to page...
Defining a Top N Report 4-1
Event Breakdown of Data 4-4
Selecting a Chart Type 4-5
Note: A warning that a script is running slowly will sometimes display when generating a report with
a high event count.
Workaround: For Firefox, select the checkbox to not see this warning again. For Internet Explorer,
see http://support.microsoft.com/kb/175500.
Defining a Top N Report
The default TopN report displayed is a column chart of the top 10 Events by Event Group, as
shown in Figure 4-1. You can change the type of report to display by selecting from a drop down
list at the top of the report window, as shown in Figure 4-2 on page 4-3. Tab le 4- 1 on page 4-3
describes the Top N reports.
You can interactively change the number of occurrences charted by increasing or decreasing the
number in the Top field at the top of the chart.
Filter the data further by selecting an existing filter from the Filter drop down list, or by creating a
new filter, as described in “Creating and Editing Report Filters” on page 1-10.
Enterasys IPS Analysis and Reporting Guide 4-1

Selecting the Top N Report Type Top N Reports
Figure 4-1 Top N Report Window
Selecting the Top N Report Type
Figure 4-2 shows the drop down list of Top N report types that can be selected. Tab le 4-1 describes
the Top N reports.
4-2 Enterasys IPS Analysis and Reporting Guide

Top N Reports Selecting the Top N Report Type
Figure 4-2 Selecting the Top N Report Type
Tab le 4- 1 lists the available Top N reports.
Table 4-1 Top N Reports
Report Description
Events by Event Group Charts, by number of events, the top “N” event groups over the
time period specified by the Filter value. The value of “N” is 10 by
default, but can be changed in the To p field.
Events by Score Charts the events grouped by severity score over the time period
specified by the Filter value.
Events by Source Address Charts the top “N” source addresses generating events over the
time period specified by the Filter value. The value of “N” is 10 by
default, but can be changed in the To p field.
Events by Source Port Charts the top “N” source ports generating events over the time
period specified by the Filter value. The value of “N” is 10 by
default, but can be changed in the To p field.
Events by Destination Address Charts the top “N” destination addresses of events over the time
period specified by the Filter value. The value of “N” is 10 by
default, but can be changed in the To p field.
Events by Destination Port Charts the top “N” destination ports of events over the time period
specified by the Filter value. The value of “N” is 10 by default, but
can be changed in the Top field.
Events by Protocol Charts the top “N” protocols of generated events over the time
period specified by the Filter value. The value of “N” is 10 by
default, but can be changed in the To p field.
Most Events by Sensor Charts the top “N” sensors receiving the most events over the time
period specified by the Filter value. The value of “N” is 10 by
default, but can be changed in the To p field.
Least Events by Sensor Charts the top “N” sensors receiving the least events over the time
period specified by the Filter value. The value of “N” is 10 by
default, but can be changed in the To p field.
Enterasys IPS Analysis and Reporting Guide 4-3

Event Breakdown of Data Top N Reports
Table 4-1 Top N Reports (Continued)
Report Description
Attacks by Source Network Displays the top event counts categorized as ATTACKs by source
network over the time period specified by the Filter value. The
value of “N” is 10 by default, but can be changed in the Top field.
If high counts are occurring from internal protected networks, this
could indicate a need to investigate and correct the cause.
If the source networks are external, it could indicate that certain IP
addresses or networks should be restricted from access.
Attacks by Destination Network Displays the top event counts categorized as ATTACKs by
destination network over the time period specified by the Filter
value. The value of “N” is 10 by default, but can be changed in the
Top field.
Attacks by Destination Address Displays the top event counts categorized as ATTACKs by
destination address over the time period specified by the Filter
value. The value of “N” is 10 by default, but can be changed in the
Top field.
Compromisers by Destination Network Displays the top event counts categorized as COMPROMISE by
destination network over the time period specified by the Filter
value. The value of “N” is 10 by default, but can be changed in the
Top field.
Compromisers by Source Network Displays the top event counts categorized as COMPROMISE by
Compromisers by Source Address Displays the top event counts categorized as COMPROMISE by
Virus by Source Address Displays the top event counts categorized as VIRUS by source
Event Breakdown of Data
Double clicking on a data group in the Top N report chart opens a pane on the right side of the
main window and displays a chart illustrating the top 10 event breakdown of the data group, as
shown in Figure 4-3 on page 4-5. Single clicking on a section in the right hand chart causes those
event details to be displayed in the lower event detail pane.
source network over the time period specified by the Filter value.
The value of “N” is 10 by default, but can be changed in the Top
field.
source address over the time period specified by the Filter value.
The value of “N” is 10 by default, but can be changed in the Top
field.
address over the time period specified by the Filter value. The
value of “N” is 10 by default, but can be changed in the Top field.
4-4 Enterasys IPS Analysis and Reporting Guide

Top N Reports Selecting a Chart Type
Figure 4-3 Top 10 Event Breakdown Pane
Displaying Details for a Selected Event
Single clicking on a data group in the charts or table view causes details of the event to display in
the Event Table pane. The Event Table pane is described in detail in Chapter 6, Event Table Pane.
Selecting a Chart Type
The default chart type of Top N reports is Column and the default chart type of Event Breakdown
charts is Pie, but you can interactively change the chart type by clicking on the chart type icons at
the top of the windows.
Note: Pie chart legends in Top N reports have the potential for their bottom keys to be chopped off
if the view port/browser window is too small for the number of slices displayed by the chart. You can
either hover over a pie slice to see what it represents in a tooltip or change the chart type to Bar or
Column to obtain a chart with labeled data.
Enterasys IPS Analysis and Reporting Guide 4-5

Selecting a Chart Type Top N Reports
4-6 Enterasys IPS Analysis and Reporting Guide

5
Trending Reports
The Trending reports compare a current period to a previous period. Trending reports can help
you answer questions about long-term trends and activity. The Trending reports query the MySQL
database to display events. For the Event Growth report, the default display period is one day (the
current day compared to the previous day). For the Daily Event Rate report, the default period
displayed is one week, based on the time the report was displayed.
Select Trending from the Reporting menu bar to display the Trending interactive reports. Two
Trending report tabs are available: the Daily Event Rate report tab and the Event Growth report
tab.
For information about... Refer to page...
Daily Event Rate Report 5-1
Event Growth Report 5-5
Note: A warning that a script is running slowly will sometimes display when generating a report with
a high event count.
Workaround: For Firefox, select the checkbox to not see this warning again. For Internet Explorer,
see http://support.microsoft.com/kb/175500.
Daily Event Rate Report
The Daily Event Rate report provides the average event count for the period, an n day moving
average, and a daily event count. Below the chart, the total event count is displayed for the period
as well as the average event count for the period shown. The minimum and maximum daily event
counts for the period are also displayed.
Figure 5-1 displays the Column chart view for the time period of one week with a three days
moving average.
Enterasys IPS Analysis and Reporting Guide 5-1

Daily Event Rate Report Trending Reports
Figure 5-1 Daily Event Rate Report
The Columns represent the total events for a time period, typically a day. However, the time
periods shown by the columns at the start and end of the chart are segmented to add up to 24
hours based on the time the report was displayed. For example, in Figure 5-1, the column on the
left represents the event count for 10/22/2010 starting at 2:45:53 PM, while the column on the right
represents the event count for 10/29/2010 ending at 2:45:53 PM. At the top of the window, the
generation time for the report is displayed.
Hovering the mouse over a column displays the total event count and the event count change
from the prior time period. The text boxes displaying this information are bordered in green if the
event count increased and in red if the event count decreased.
The teal horizontal line represents the average event count over the period and the vertical blue
line represents the moving average. You can change the number of days used for the moving
average by clicking on the up or down arrows next to the Days in Moving Average field.
Selecting a Display Type
The Daily Event Rate tab can display data as a Table, Column chart, Bar chart, or Pie chart. You can
interactively change the chart type by clicking on the chart type icons at the top of the windows.
On some charts you can select the Logarithmic button to display the data in Logarithmic scale. The
following graphic illustrates the different chart types.
5-2 Enterasys IPS Analysis and Reporting Guide

Trending Reports Daily Event Rate Report
Column and Bar Charts
Bar charts show the information in a manner similar to the Column charts (described above and
shown in Figure 5-1) with lines indicating the average event count over the period and the moving
average. Figure 5-2 shows a Daily Event Rate Bar chart in logarithmic view.
Figure 5-2 Daily Event Rate Report – Bar Chart
Pie Charts
Pie charts show the event rate per time period. Hovering over a pie slice shows the date, number
of events, and the percent of events for the time period occurring on that date.
Enterasys IPS Analysis and Reporting Guide 5-3

Daily Event Rate Report Trending Reports
Figure 5-3 Daily Event Rate Report – Pie Chart
Note: Pie chart legends have the potential for their bottom keys to be chopped off if the view port/
browser window is too small for the number of slices displayed by the chart. You can either hover
over a pie slice to see what it represents in a tooltip or change the chart type to Bar or Column to
obtain a chart with labeled data.
Table Report
The Daily Event Count Table report lists the time period segments/days, the event count per day,
the difference in count from the previous day, and the moving average.
5-4 Enterasys IPS Analysis and Reporting Guide

Trending Reports Event Growth Report
Figure 5-4 Daily Event Rate Report – Table Report
Defining a Daily Event Rate Report
You can change the time period displayed by selecting from the Filter drop down list at the top of
the report window. The drop down list includes pre-defined time periods ranging from 15
minutes to 4 weeks, as well as any filters you may have created and saved. Creating your own
filters is described in “Creating and Editing Report Filters” on page 1-10
You can also interactively change the days in moving average by increasing or decreasing the
number in the Days in Moving Average field at the top of the report window.
Displaying Details for a Selected Event
Single clicking on a data group in the Daily Events charts or table view causes details of the event
to display in the Event Table pane. The Event Table pane is described in detail in Chapter 6, Event
Table Pan e.
Event Growth Report
The Event Growth tab compares the number of occurrences of events between two time periods.
By default, the time period is one day (comparing the last 24 hour period with the previous 24
Enterasys IPS Analysis and Reporting Guide 5-5

Event Growth Report Trending Reports
hour period, as shown in Figure 5-5), but you can use the Filter feature to set a different time
period.
See “Creating and Editing Report Filters” on page 1-10 for more information.
Also by default, Event Growth charts (column, bar, pie) show the Top 10 and Bottom 10 events —
the Top 10 events are those that showed the greatest positive growth over the time period, while
the Bottom 10 events showed the least (or negative) growth over the time period. You can select
the number of events to show, and you can choose to show only the Top n, only the Bottom n, or
both Top and Bottom. The maximum value of n is 50.
The Event Growth Table shows all event counts for the two time periods, not just the Top and/or
Bottom n events.
Figure 5-5 displays a Column chart format. The events with the greatest event growth are shown
on the left, graduating from greatest to least growth from left to right. The grey columns show the
previous range while the blue columns show the current range.
Hovering the mouse over a data segment displays the total event count for that period and, for the
current period, the event count change from the prior time period. The text boxes displaying this
information are bordered in green if the event count increased and in red if the event count
decreased.
Figure 5-5 Event Growth
Tab – Column Chart
5-6 Enterasys IPS Analysis and Reporting Guide

Trending Reports Event Growth Report
Selecting a Chart Type
The Event Growth report can display data as a Table, Column chart, Bar chart, or Pie chart. You
can interactively change the chart type by clicking on the chart type icons at the top of the
windows. On some charts you can select the Logarithmic button to display the data in
Logarithmic scale.
Column and Bar Charts
The Bar and Column charts show the event totals for each range side by side. These views provide
more “depth,” allowing you to compare the event totals in one range with another. The charts are
sorted by the two range differences, and the data is spread out from greatest positive growth to
greatest negative growth.
Figure 5-5 on page 5-6 shows an example of a Column Event Growth chart. Figure 5-6 shows an
example of a Bar chart in logarithmic scale.
Figure 5-6 Event Growth Tab – Bar Chart
Note: The axis labels in Bar charts may overlap, depending on the browser window size.
Enterasys IPS Analysis and Reporting Guide 5-7

Event Growth Report Trending Reports
Pie Charts
The Event Growth Pie chart shows the Top/Bottom n difference between the two ranges,
providing an easy and consolidated way to quickly see and compare the difference. Pie charts give
you a “broad” view of event growth. Figure 5-7 on page 5-8 illustrates a Pie chart.
Figure 5-7 Event Growth Tab – Pie Chart
Note: Pie chart legends have the potential for their bottom keys to be chopped off if the view port/
browser window is too small for the number of slices displayed by the chart. You can either hover
over a pie slice to see what it represents in a tooltip or change the chart type to Bar or Column to
obtain a chart with labeled data.
Table Reports
Table reports show all the data, not just the Top n and Bottom n events, as shown in Figure 5-8 on
page 5-9. In the Table report, you can right click on an event row to display a description of the
event.
5-8 Enterasys IPS Analysis and Reporting Guide

Trending Reports Event Growth Report
Figure 5-8 Event Growth Tab – Table
Defining an Event Growth Report
You can change the time periods being compared by using the Filter drop down list. When you
specify a period “t”, the time periods used in the event comparison are the most recent period t
and the period t immediately preceding the most recent period t.
For example, if you specify one day, the period used for comparison will be the previous day. The
time periods available from the Filter drop down list range from 15 minutes to 4 weeks. For
information on setting a date range or other filter parameters, see “Creating and Editing Report
Filters” on page 1-10.
Enterasys IPS Analysis and Reporting Guide 5-9

Event Growth Report Trending Reports
5-10 Enterasys IPS Analysis and Reporting Guide

You can display details for a selected item in the Event Table pane. The Event Table Pane is
Event Table
Pane
available for 24 Hours, Top N, and Trending Daily Event Rate reports.
For information about... Refer to page...
Displaying Data in the Event Table Pane 6-1
Customizing the Event Table Display 6-3
Displaying Data in the Event Table Pane
The Event Table pane is located at the bottom of the interface window. Single-clicking on a data
group in a chart or table causes the Event Table pane to display.
Figure 6-1 Event Table Pane
6
Event Table Pane
Enterasys IPS Analysis and Reporting Guide 6-1

Displaying Data in the Event Table Pane Event Table Pane
Right-clicking on an event in the Event Table pane displays a menu of further actions that can be
applied to the event, as shown in Figure 6-2.
Figure 6-2 Event Table Pane Action Menu
Tab le 6- 1 describes the columns in the Event Table report table.
Table 6-1 Event Table Report Columns
Event Detail Column Description
Date/Time The date stamp of when the event was generated.
Name The name of the event. Right-click on the row and select Event Details... to
see a description of the event. See Chapter 7, Event Details for more
information.
Score The severity score of the event. Table can be filtered by score value.
Group The event group of the event. Table can be organized by event group, and also
filtered by group.
Source IP The source IP address of the event. Right-click on the row and select Source
Address Lookup to display a new browser window that attempts to resolve
the IP address using a DNS lookup. Additional publicly-available web sites that
perform address resolution are provided as links on the browser page.
Source Port The source port.
Destination IP The destination IP address of the event. Right-click on the row and select
Destination Address Lookup to display a new browser window that attempts
to resolve the IP address using a DNS lookup. Additional publicly-available
web sites that perform address resolution are provided as links on the browser
page.
Destination Port The destination port.
6-2 Enterasys IPS Analysis and Reporting Guide

Event Table Pane Customizing the Event Table Display
Table 6-1 Event Table Report Columns
Event Detail Column Description
Direction The direction of the event (for example, Internal or External).
Protocol The protocol used in the event.
Sensor Name Name of the Dragon sensor that generated the event. In the case of Network
Sensors, this is the Virtual Sensor name.
Details Any additional details about the event.
Tab le 6- 2 describes the options in the right-click Action menu.
Table 6-2 Right-Click Action Menu Options
Option Description
Event Details Displays a pop-up window containing details of the event. See
Chapter 7, Event Details for more information.
Source Address Lookup Displays a new browser window that attempts to resolve the IP
address using a DNS lookup. Additional publicly-available web
sites that perform address resolution are provided as links on the
browser page.
Destination Address Lookup Displays a new browser window that attempts to resolve the IP
address using a DNS lookup. Additional publicly-available web
sites that perform address resolution are provided as links on the
browser page.
Session Rebuild Displays a page with the session information for the selected
event. Applicable to TCP events.
Download PCAP Provides a download of a PCAP capture file. This file contains the
traffic between the source and destination IP addresses of the
event for the day the event was generated. Applicable to any TCP
event that supports the Dragon mktcpdump CLI tool.
Refer to Chapter 8, Viewing a PCAP File for an Event for more
information.
Mail Event Opens your mail application with the URL for the event in the
content field of the message.
Customizing the Event Table Display
The following sections describe customizations you can perform on the Event Table pane.
Setting Display Preferences
The Event Table pane allows you to set the display preferences by editing the fields in the
preferences bar at the bottom of the pane.
You can set the number of rows to display per page in the Show per Page field, and you can move
forward and back through the pages by clicking on the direction arrows next to the Page field, as
shown in Figure 6-3. You can interactively refresh the display by clicking the circular arrow icon
next to the Page field.
Enterasys IPS Analysis and Reporting Guide 6-3

Customizing the Event Table Display Event Table Pane
Figure 6-3 Setting Display Preferences
Resizing Columns
You can resize table columns. For example, to resize a column, mouse over the area between
columns until the cursor changes as shown in Figure 6-4. Click, drag, and release the column
separator to resize the column.
Figure 6-4 Resizing Table Columns
Moving Columns
To reorganize the layout of columns within tables, click and drag the column name to a new
location. Figure 6-5 shows the Group column being repositioned to the left of the Score column.
Figure 6-5 Moving Columns
Sorting, Filtering, and Grouping In Columns
All columns in the Event Table pane have a drop down menu that allows you to sort, group, and
filter the contents, as appropriate. Figure 6-6 on page 6-5 shows the drop down menu that is
displayed for the Score column.
Sort Options
The Sort options are shown in Figure 6-6. With the exception of the Sort options, not all options
shown in Figure 6-6 are selectable for all columns, depending on what is appropriate for the data
in the column.
Clicking in the column header also reverses the sort order of the column.
6-4 Enterasys IPS Analysis and Reporting Guide

Event Table Pane Customizing the Event Table Display
Figure 6-6 Column Drop Down Menu
Group Options
Use the Group By This Field option to group the Event Table pane by the values in a specific
column, as shown in Figure 6-7. When you select Group By This Field, the Show in Groups
checkbox is automatically checked. To undo the grouping, uncheck the Show in Groups
checkbox.
Figure 6-7 Grouping Options
Selecting Columns to Display
You can select what columns to display in the Event Table pane, by checking and unchecking the
desired columns in the Columns option drop down menu. Figure 6-8 illustrates how to display a
list of columns in the Event Detail table. Check or uncheck the appropriate check box to display or
hide specific columns.
Figure 6-8 Selecting Columns to Display
Enterasys IPS Analysis and Reporting Guide 6-5

Customizing the Event Table Display Event Table Pane
Filters Options
The Filters option varies, depending on the type of data displayed in the column. For example, as
shown in Figure 6-9 on page 6-6, the Filters option for the Group column provides a text field in
which you can enter the group name you want to filter on, while the Filters option for the Score
column lets you choose from the possible values that can be displayed in that column (Critical,
High, Medium, Low).
Figure 6-9 Column Filters Option
Exporting Tables in CSV Format
Tables displayed in the Event Table pane can be exported in CSV (comma separated values) format
and opened immediately or saved as a file.
1. Click on the CSV button to the far right on the bar at the top of the report.
2. When prompted, select Open or Save.
3. If you selected Open, the file will be opened using the selected application (such as Microsoft
Excel). If you selected Save, you will be prompted to specify the location.
6-6 Enterasys IPS Analysis and Reporting Guide

The Event Details pop-up window displays detailed information about a selected event.
You can launch an Event Details window for any event instance or event name reported in a table,
such as Event Summary, Event Log, and the Event Table pane.
To display the Event Details window for an event:
1. Right click an event.
2. Select Event Details... from the right click menu.
Figure 7-1 Launching Event Details Window
7
Event Details
Enterasys IPS Analysis and Reporting Guide 7-1

Event Details
The tabbed Event Details window displays with information about the event that you selected.
If you launch the Event Details window from Event Log, the Event Table pane, or Find Events, the
Event Details window has an upper pane with details about the event (see Tabl e 7- 1 on page 7-3)
and three tabs:
• Description — Includes a detailed description of the event. The Reference(s) hotlinks launch a
web browser to Google to search for that reference.
• Signature Definition — Shows the signature of the event.
7-2 Enterasys IPS Analysis and Reporting Guide

Event Details
• Packet Data — Shows the packet data of the event.
You can adjust the size of the pop-up window to better view the event information.
Tab le 7- 1 describes the event details in the upper pane.
Table 7-1 Event Details Upper Pane
Field Description
Name Name of the event.
Date/Time Date and time of event occurrence.
Score The severity score of the event. The table can be filtered by score.
Source IP The source IP address of the event. Click the address link to
display a new browser window that attempts to resolve the IP
address using a DNS lookup. Additional publicly-available web
sites that perform address resolution are provided as links on the
browser page.
Port The source port.
Destination IP The destination IP address of the event. Click the address link to
display a new browser window that attempts to resolve the IP
address using a DNS lookup. Additional publicly-available web
sites that perform address resolution are provided as links on the
browser page.
Port The destination port.
Direction The direction of the event (for example, Internal or External).
Protocol The protocol used in the event.
Download PCAP Provides a download of a PCAP capture file. This file contains the
traffic between the source and destination IP addresses of the
event for the day the event was generated. Applicable to any TCP
event that supports the Dragon mktcpdump CLI tool.
Refer to Chapter 8, Viewing a PCAP File for an Event for more
information.
Enterasys IPS Analysis and Reporting Guide 7-3

Event Details
Table 7-1 Event Details Upper Pane (Continued)
Field Description
Sensor Name Name of the Dragon sensor that generated the event. In the case
of Network Sensors, this is the Virtual Sensor name.
Details Any additional details about the event.
If you launch the Event Details window from an event name, such as from Event Summary, the
Event Details window contains only the Description and Signature Definition tabs.
7-4 Enterasys IPS Analysis and Reporting Guide

8
Viewing a PCAP File for an Event
Enterasys IPS Reporting lets you download the session data for a given event in the form of a
PCAP file. This lets you view traffic data in an application such as Wireshark.
To view captured session traffic data for an event:
1. In the Event Table pane, right click and select Download PCAP.
The File Download dialog box appears.
2. Save the PCAP file locally.
3. Unzip the PCAP file and open it in Wireshark or a similar application.
Enterasys IPS Analysis and Reporting Guide 8-1

Viewing a PCAP File for an Event
8-2 Enterasys IPS Analysis and Reporting Guide

You can create and generate reports based on the criteria you want to see, by creating your own
report templates from predefined templates and scheduling reports based on those templates to
run. User defined reporting is accessed from the Schedule item on the main menu bar.
For information about... Refer to page...
Creating a User Defined Report 9-1
Viewing Generated Reports 9-3
Creating a User Defined Report
Select Schedule > Manage Report Templates to create or edit your own report formats.
User defined report templates are created from predefined templates.
To create a new user defined report template and run the report:
9
User Defined Reporting
1. Select Schedule > Manage Report Templates from the main menu bar, then click the New
Template button.
2. The list of Predefined Templates is displayed. The list includes a description of each template.
3. Click on the desired template from the Predefined Templates list. The Template Details
window is displayed.
Note that, depending on the template chosen, certain fields in the Query Parameters area may
be grayed out.
Enterasys IPS Analysis and Reporting Guide 9-1
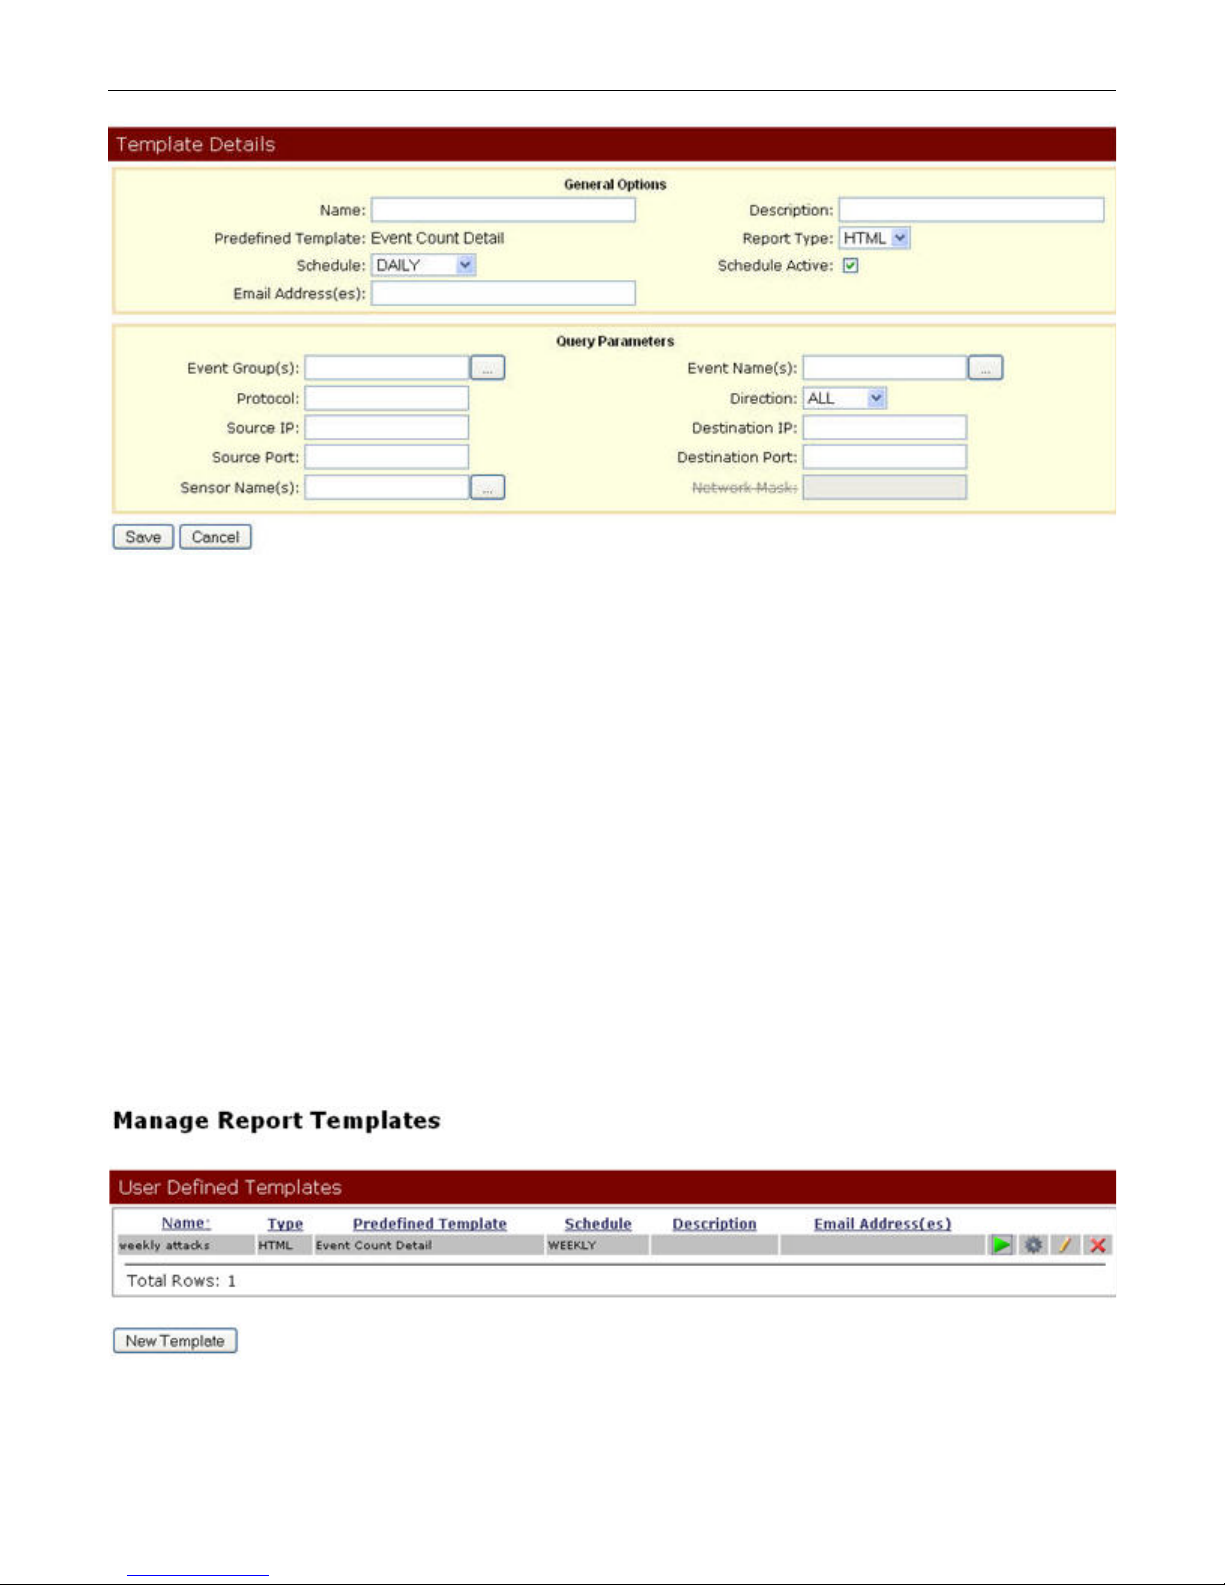
Creating a User Defined Report User Defined Reporting
4. In the General Options section of the Template Details page, enter a name and description for
the report template, and choose the Report Type to create (HTML, PDF, and RTF formats are
available).
5. By default, this report will be generated daily. To deactivate the scheduled generation of this
report completely, de-select the Schedule Active checkbox in General Options. To change the
schedule to weekly or monthly, use the Schedule dropdown menu. The following scheduling
options are available:
• DAILY: Report is generated daily at 1:00 AM.
• WEEKLY: Report is generated weekly on Sunday at 1:00 AM.
• MONTHLY: Report is generated monthly on the first of the month at 1:00 AM.
6. To email this report to one or more recipients when it is generated, enter one or more valid
email addresses in the Email Address(es) field. Separate multiple email addresses with
commas. You can configure the command used to email reports. See Chapter 10, Preferences
for more information.
7. In the Query Parameters section of Template Details, fill out any additional desired fields and
settings and click Save.
8. Your report template is added to the list of User Defined Templates in the Manage Report
Templates table.
9. Run the report manually by clicking on the Run Report icon (green arrow) on the right of the
report’s row and view the output. Note that when you “run” the report, the output is not
stored as a generated report.
9-2 Enterasys IPS Analysis and Reporting Guide

User Defined Reporting Viewing Generated Reports
10. To generate the report and have it added to the list of generated reports, click the Generate
Report icon (gray gear).
Each template entry in the Manage Report Templates table provides tools for the associated userdefined template. The tools are described in Tab le 9- 1.
Table 9-1 Manage Report Templates Tools
Icon Description
Run the report on demand, based on this template. This report is not stored as a generated
report.
Generate the report and add it to the list of generated reports.
Edit the selected template.
Delete the selected template.
Viewing Generated Reports
Select Schedule > Generated Reports to view reports that have been generated from user defined
templates.
The Generated Reports page displays a row for each generated report.
Figure 9-1 Viewing Generated Reports
Each generated report provides the tools described in Tab le 9- 2.
Table 9-2 Generated Reports Tools
Icon Description
Displays the selected generated report.
Creates a new email message containing a link to the selected generated report.
Enterasys IPS Analysis and Reporting Guide 9-3

Viewing Generated Reports User Defined Reporting
Table 9-2 Generated Reports Tools
Icon Description
Prompts you to delete the selected generated report.
9-4 Enterasys IPS Analysis and Reporting Guide

This section describes the preferences you can set when using the Schedule menu features, as well
as how to configure the reporting session time-out.
For information about... Refer to page...
Schedule Preferences 10-1
Configuring Session Time-out 10-2
Schedule Preferences
You can access the Preferences page by selecting Schedule > Preferences from the main menu bar.
Figure 10-1 shows the Reporting Preferences page.
Figure 10-1 Reporting Preferences
10
Preferences
The available preferences that apply to Schedule menu features are described in Table 10-1.
Table 10-1 Schedule Preferences
Preference Description
Table Page Max Rows The maximum number of table rows displayed per page when displaying a list of
generated reports or when displaying a list of report templates. By default this is
50 rows.
Enterasys IPS Analysis and Reporting Guide 10-1

Configuring Session Time-out Preferences
Table 10-1 Schedule Preferences
Preference Description
Paginator Max Pages The maximum number of pages displayed when displaying a list of generated
reports or when displaying a list of report templates. By default this is 10.
Email Command The command defined in this field is used to email a report. By default this is set
to the following:
/usr/bin/mail -a $REPORT -r dragon -s $SUBJECT $RECIPIENT
Generally, for Enterasys IPS appliances, this command should not be changed
from the default.
Configuring Session Time-out
The Enterasys IPS Reporting Web interface has a default session time-out of 30 minutes. You can
change this interval by editing the
editor as follows:
1. Open the following file in a text editor:
<installdir>/enterprise-manager/server/default/deploy/jbossweb-tomcat55.sar/
conf/web.xml
<session-timeout> parameter in the web.xml file in a text
2. In the web.xml file, find the following line and change the value to the number of minutes you
want to elapse before Reporting sessions timeout:
<session-timeout>30</session-timeout>
For example, change <session-timeout>30</session-timeout> to <session-timeout>500</
session-timeout>.
3. Restart the JBoss server by running the following command:
<installdir>/scripts/dragon-jboss restart
10-2 Enterasys IPS Analysis and Reporting Guide

11
Legacy Reporting
This section describes Dragon Reporting features prior to release 7.4. These legacy tools are also
available in Enterasys IPS 7.4. See “Starting Enterasys IPS Reporting” on page 1-1 for more
information about accessing these tools.
For information about... Refer to page...
Legacy Reporting Tools 11-1
Accessing the Legacy Reporting Tools 11-3
Using the Realtime Console 11-6
Using the Forensics Console 11-18
Using the Trending Console 11-22
Using Executive Reporting 11-28
Managing Reports 11-29
Legacy Reporting Tools
The Enterprise Management Server (EMS) offers five legacy reporting tools. These tools receive
data from Network and Host Sensors. The tools allow you to manipulate reporting to generate
customized, purposeful reports that help you isolate attacks. Each tool supports analysis of IDS
events in real time, long-term trending, and up close inspection of each event’s detail and
associated information. They provide 48-hour breakout histograms of events so you can spot
trends at a glance. The tools are:
• Realtime Console
• Forensic Console
• Trending Console
•Executive Reporting
• EMS Statistics
Dragon Realtime Console
The Dragon Realtime Console provides an extremely high-speed application to analyze several
million events. The Realtime Console reads new Dragon events and stores them in a circular ring
buffer. A high storage capacity is needed to store the significant number of events that can be in
the buffer. Dedicating a machine to run only the Realtime Console agent can easily maintain
several million events in the ring buffer.
Enterasys IPS Analysis and Reporting Guide 11-1

Legacy Reporting Tools Legacy Reporting
Dragon Forensics Console
The Dragon Forensics Console processes and displays event data collected in the Dragon
database. Using the Forensics Console, you can select a day of log data; for example, and produce
a summary of the collected events for that day, providing a list of events with other data. You can
also produce a list of individual events in the database that match a selected event. In this list, each
event can have extra data displayed about it, such as the associated network session. Options in
the Forensics Console provide many ways to view forensic data. Each option (also referred to as
forensics tools) contains a custom set of persistent filters that allow you to quickly focus on a string
of events.
Dragon Trending Console
The Dragon Trending Console is used to answer questions about long-term trends and activity.
The tool reads events and then sends them to a MySQL database. This Trending Console GUI
utilizes SQL queries to display IP addresses, events, or search for unique event entries. For each
query, the occurrence of the top seven matches over the selected time range is displayed.
Dragon Executive Reporting
Dragon Executive Reporting provides high-level reporting capabilities. There are eight executive
level reports which summarize event counts and the distribution of event types over reporting
periods of one week.
IPv6 Support in Legacy Tools
In general, the legacy tools should be used to report on IPv4 events.
• Realtime Console reports will not include any IPv6 events.
• Trending and Executive reports will include IPv6 events but will not display the address.
11-2 Enterasys IPS Analysis and Reporting Guide

Legacy Reporting Accessing the Legacy Reporting Tools
Accessing the Legacy Reporting Tools
Use the following procedure to start using the legacy Dragon reporting tools:
1. Enter either of the following URLs in your web browser:
https://
or
http://
where <IP address> is the IP address of the Reporting server.
2. When the Launch page displays, click on the Continue to Legacy Dragon Reporting (IPv4
support only) link, as shown in the following figure.
<IP address>:9443/
<IP address>:8080/
3. When the login screen displays, enter your User Name and Password, then click login. The
user name and password entered must be those of a user with the DragonReporting role.
Main Window
The reporting tool interface is web-based and its appearance may vary slightly depending your
browser. The Main window provides navigation areas and a display area as well the ability to
select the desired reporting tool.
Enterasys IPS Analysis and Reporting Guide 11-3

Accessing the Legacy Reporting Tools Legacy Reporting
Figure 11-1 Dragon Legacy Reporting Main Window
Navigation Areas
The reporting tools have a variety of navigation areas depending on the tool selected and the
current task. There is a top right navigation area which allows you to select the desired tool. The
Top left navigation area provides tool-specific selection. The left navigation area provides toolspecific functionality. The bottom navigation area contains tool-specific actions. Navigation areas
vary depending on the selected reporting tool.
11-4 Enterasys IPS Analysis and Reporting Guide
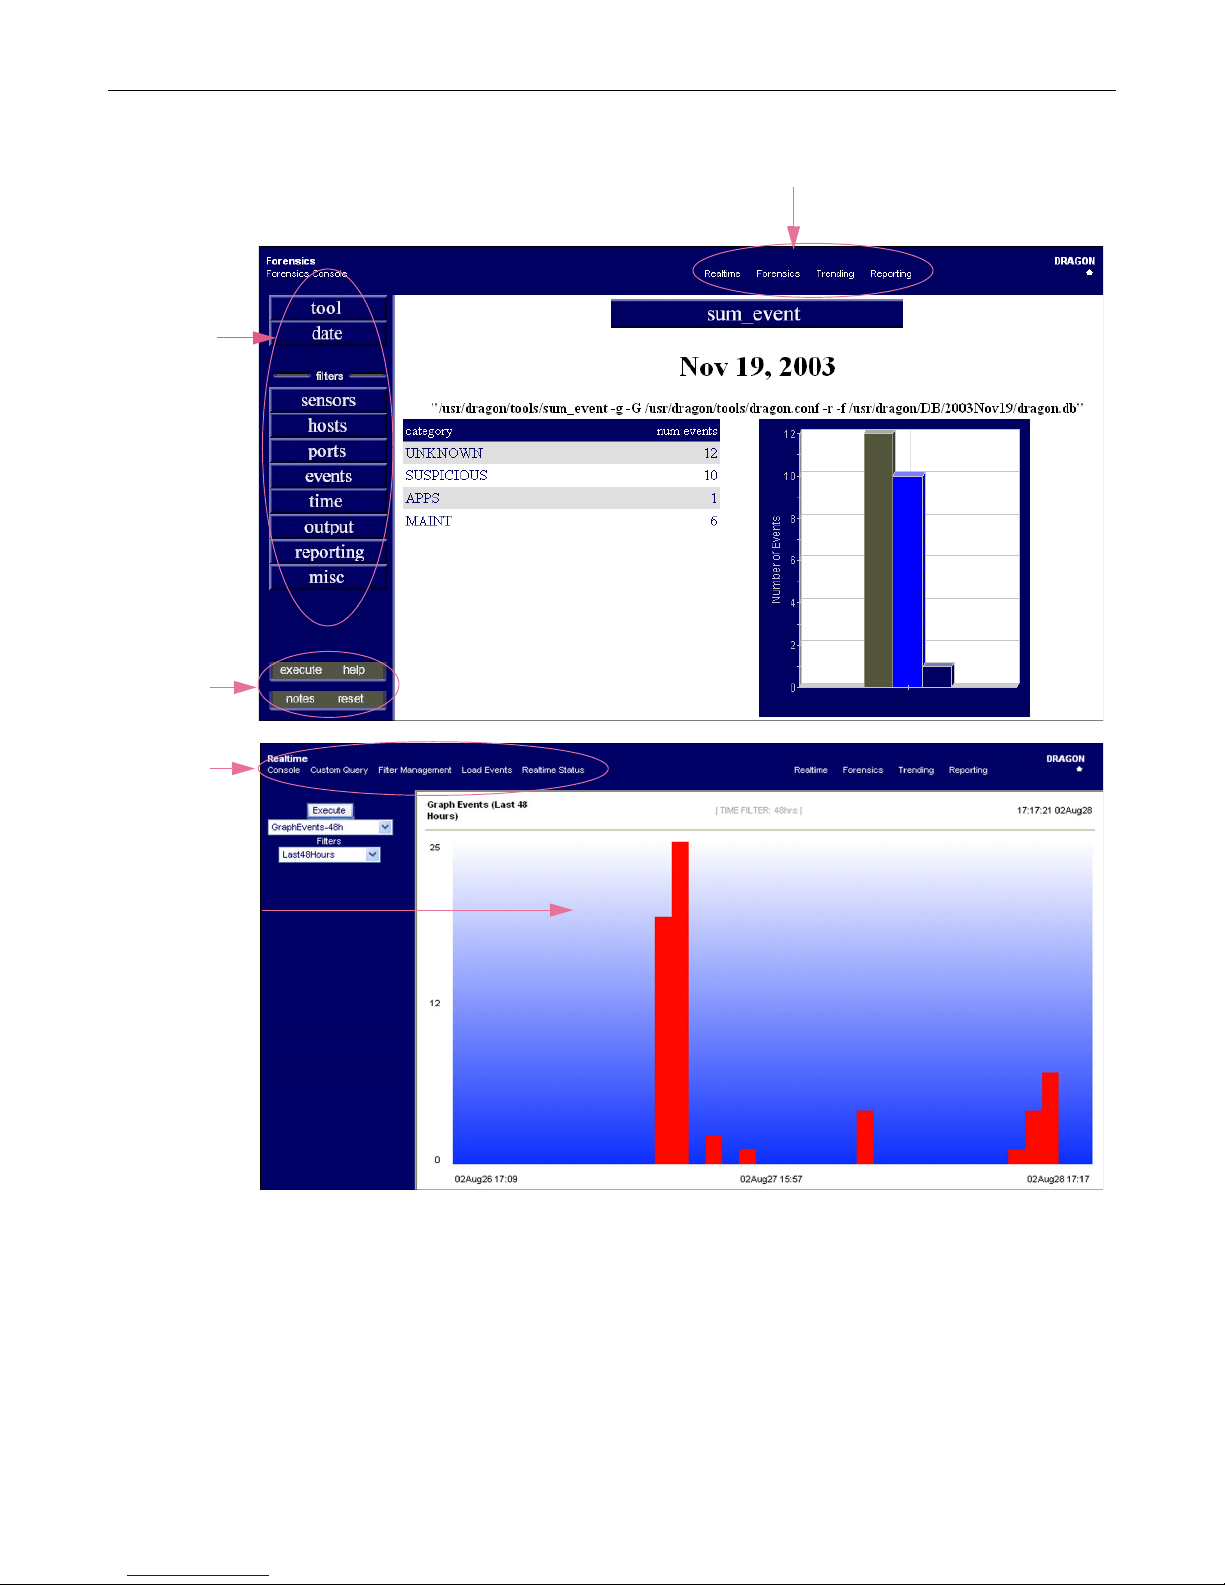
Legacy Reporting Accessing the Legacy Reporting Tools
Top Right Navigation Area
Left Navigation
Area
Bottom
Navigation Area
Top Left
Navigation
Area
Display Area
Figure 11-2 Navigation Areas
Display Area
The Display Area populates most of the right side of the window. It is in this area that the data
selected is displayed and that you manipulate that data.
Enterasys IPS Analysis and Reporting Guide 11-5

Using the Realtime Console Legacy Reporting
Using the Realtime Console
The Dragon Realtime Console dramatically speeds up analysis of a variety of Dragon functions by
providing realtime analysis data. It keeps all of the events it reads in memory and requires some
storage capacity. For example, 1,000,000 events require 25 MB of main memory. This tool does not
have a limit to the number of events it can hold in memory. However, experience with live data
shows that 500,000 events is adequate to hold a month’s worth of data on a single busy Network
Sensor.
Event summaries and event listings are very quick, but anything that enumerates data by an IP
address, can take 1-2 minutes, possibly more. The Realtime Console can also filter events, which
significantly lowers the total event count.
Note: It is recommended that the Realtime Console agent, which sends the event data, run on a
dedicated server.
To access the Realtime Console Main Window:
1. Click Realtime in the top right navigation area.
The Realtime Console main window appears as shown in Figure 11-3. Navigation options are
shown in the left navigation panel for the Console option in the top left navigation area.
Figure 11-3 Realtime Console Main Window
Using the Console
You can select the type of event summary and filter display. Each combination presents a unique
view of Dragon data.
To display Console data:
1. Click the Event Summary pulldown and select the desired type of summary.
Each type of summary produces a different type of output. These are described in detail in the
sections below.
2. Click the Filters pulldown and select the desired filter.
Although default filters exist, you can create custom filters. See Filter Management on
page 11-16.
3. Click Execute.
The desired data is shown in the display area.
11-6 Enterasys IPS Analysis and Reporting Guide

Legacy Reporting Using the Realtime Console
AnalyzeEvent
This event summary is designed to analyze high-volume events such as false positives and
network sweeps. It lists the most common directions of an event, the most common ports, the most
common IP address pairs, and also graphs the time-domain distribution of hours and weekdays.
Figure 11-4 Realtime Console AnalyzeEvent
Figure 11-5 displays an example of a graph generated by the AnalyzeEvent tool for an ISP that has
had several thousand SNMP:PUBLIC events.
Figure 11-5 Realtime Console AnalyzeEvent Graph of SNMP:PUBLIC Events
These SNMP events occurred over several months, yet some distinct patterns emerge. All of the
events seem to be concentrated on Monday and Saturday and also at 14:00, 17:00 and 21:00. This
indicates some form of scheduled usage of SNMP and is probably related to network
management.
ChartGroups
The ChartGroups event summary is used to graphically represent the most recent events. The
weekday and exact time based on hours and minutes are used to delineate the considered periods
of time. ChartGroups has several macros that enable certain recent time periods for analysis. For
example, ChartGroups-6hr charts the various group activities for the last 6 hours. For each active
Enterasys IPS Analysis and Reporting Guide 11-7

Using the Realtime Console Legacy Reporting
event group in that period of time, a group icon is used for representation. Figure 11-6 is an
example of the type of data generated by this tool.
Figure 11-6 Realtime Tool ChartGroups Output
GraphEvents and GraphScores
The GraphEvents and GraphScores event summaries print out a quick, low-resolution graph of
the recent activity. The graphs are designed for fast downloading. Graphing of total events or
scores is achieved. For events, a simple count of matching events is considered when plotting the
graph. For scores, the total accumulative sum of each event’s score for that time period is used to
determine the score for that area. Clicking on any portion of the graph brings you to that area’s
corresponding event summary. Figure 11-7 is an example graph of port 80 events over the last 48
hours.
11-8 Enterasys IPS Analysis and Reporting Guide

Legacy Reporting Using the Realtime Console
Figure 11-7 Realtime Tool GraphEvents Displaying a Traffic Spike
EventDetail
The EventDetail event summary provides a simple listing of the raw events held in memory by the
Dragon Realtime Shell as shown in Figure 11-8. They are printed out from the most recent event to
the least recent event. If the number of events matching a query is greater than the number of
events in the Lines/Sessions filter value, a set of up to ten URLs are printed at the bottom of the
displayed HTML output. These URLs correspond to the successive groups of matching events.
Figure 11-8 Realtime EventDetail
For network-based events of either TCP or UDP protocols, clicking on the URL associated with the
source and destination address results in a Dragon Forensics Console mksession query and
displays the underlying network session. Clicking on the event type for any event (regardless if it
Enterasys IPS Analysis and Reporting Guide 11-9

Using the Realtime Console Legacy Reporting
is from a Dragon Network Sensor or Dragon Host Sensor engine) displays the raw event
information including packet or log data.
Pre-Event Collection
You can view pre-event packets by clicking the Pre-event Collection column for an event. This
brings you to the pre-event packet information. Clicking the Packet Data column provides the
specific packet’s information.
Figure 11-9 Pre-Event Packet Data
EventsByGroup
This event summary lists all of the active event groups and the number of events in each group.
All event groups are listed, even if no events are associated with that group.
EventsByNetworkSensor
A list of all active Dragon Network Sensors are output for event summary, as shown in
Figure 11-10. Only Dragon sensors that have an active event are listed. Clicking on a Dragon
sensor name lists an event summary of events only from that engine.
Figure 11-10 Realtime EventsByNetworkSensor
11-10 Enterasys IPS Analysis and Reporting Guide

Legacy Reporting Using the Realtime Console
EventsScoredByIP
This event summary counts up each IP address’ total score, based on each event’s group score. The
IP addresses with the highest scores are ranked at the top and a rough graph to show how the
scores compare is displayed. Figure 11-11 is an example score analysis of Finger events.
Figure 11-11 Realtime EventsScoredByIP Tool
SummaryByIP
The SummaryByIP event summary can be used to list active IP addresses and drill-down views of
CIDR blocks. The CIDR field must be set to a high level CIDR number such as 8 or 16 to get good
performance. Leaving values of 24 or 32 will work, but results in many matches, most of which
cannot be displayed. You may start off by selecting a CIDR block of 8 then drilling down until the
list-events tool is called, listing events from that particular IP address. For each query, a bar chart
indicating the total number of events for that CIDR block is displayed, as shown in Figure 11-12.
Figure 11-12 Realtime SummaryByIP
EventSummary
The EventSummary event summary is used to list all active events in the order of the most recent
to the least recent. Each event is printed out with its total number, the last time of the most recent
event and a 48-hour activity strip chart. The strip chart shows a plus sign (+) for each hour that the
event has occurred at least once. The strip chart shows a 48-hour time line that is slightly different
than the 24-hour time line used in the Dragon Forensic Console’s sum_event tool. Figure 11-13 is
an example output.
Enterasys IPS Analysis and Reporting Guide 11-11

Using the Realtime Console Legacy Reporting
Figure 11-13 Realtime EventSummary (48-Hour Time line)
In this example, many events are observed to be active almost all of the time. This usually
indicates a high rate of false positives.
Figure 11-14 shows a more common output on a well-tuned Dragon Network Sensor. Notice the
trailing events and also a much less dense occurrence of any one event.
Figure 11-14 Realtime EventSummary (Well-Tuned)
Figure 11-15 Realtime EventSummary (IPS Events)
11-12 Enterasys IPS Analysis and Reporting Guide
 Loading...