

Page 1
XE & EP BATTERIES
APPLICATION
MANUAL
RESERVE
POWER
Page 2
Genesis®XE & EP Application Manual
TABLE OF CONTENTS
Preface 2
Chapter 1: Introducing the Genesis
®
Battery 3
1.1 Background 3
1.2 Transportation classification 3
1.3 UL component recognition 3
1.4 Non-halogenated plastics 3
1.5 Key Genesis benefits 3
Chapter 2: Technical Information 4
2.1 Introduction 4
2.2 Choosing the right Genesis version 4
2.3 Battery life 4
2.4 Constant-power and constant-current discharge performance 5
2.5 Charging characteristics & requirements 6
2.6 Constant-voltage (CV) regime 7
2.7 Constant-current (CC) regime 7
2.8 Three-step (IUU) charge profile 8
2.9 Storage characteristics 9
2.10 Self discharge 9
2.11 Open circuit voltage (OCV) and state of charge (SOC) 10
2.12 Procedure to recover overdischarged batteries 10
Chapter 3: General Test Data 11
3.1 Introduction 11
3.2 Thermal runaway test 11
3.3 Gassing test 11
3.4 DIN standard overdischarge recovery test 12
3.5 High temperature storage recovery test 12
3.6 Altitude test 12
3.7 Accelerated float life test 12
3.8 Performance test at different temperatures 13
Chapter 4: Installation, Operation & Maintenance 13
4.1 Introduction 13
4.2 Receiving the shipment 13
4.3 Storage 13
4.4 Installation 13
4.4.1 Temperature 14
4.4.2 Ventilation 14
4.4.3 Security 14
4.4.4 Mounting 14
4.4.5 Torque 14
4.5 Parallel strings 14
4.6 Discharging 14
Appendix A: Genesis
®
XE Discharge Characteristics 15-24
Appendix B: Genesis
®
EP Discharge Characteristics 25-31
Preface
This European edition of the
Genesis Application Manual
introduces the Genesis XE range
of batteries, packaged to offer
the same superior performance
characteristics as the Genesis EP
battery in more physically
demanding applications such as
high temperature and high
vibration environments.
Appendix A offers constant
current (CC) and constant power
(CP) performance data and
graphs for the full range of
Genesis XE batteries to several
end voltages. Appendix B offers
the same information for the EP
series.
Chapter 4 offers guidelines on
the installation, operation and
maintenance of Genesis
batteries, with the goal of
maximising performance and
service life.
2
www.enersys-emea.com
Page 3
Chapter 1:
Introducing the Genesis Battery
1.1 Background
Since its introduction in the early 1990s, the Genesis
®
thin plate pure lead-tin (TPPL) battery has established
itself as a premium high performance battery suitable for
a wide range of demanding applications. Today, TPPL
technology can be found in applications as diverse as
emergency power, avionics, medical, military and
consumer equipment.
The Genesis TPPL battery is offered in either the EP or
XE version, and Table 2.2.1 shows the differences
between the two versions.
1.2 Transportation classification
Effective September 30, 1995, Genesis batteries were
classified as "nonspillable batteries", and are excepted
from the Department of Transportation’s comprehensive
packaging requirements if the following conditions are
satisfied:
(1)
The battery is protected against short circuits
and is securely packaged and
(2)
The battery and outer
packaging must be plainly and durably marked
"NONSPILLABLE" or "NONSPILLABLE BATTERY".
Genesis batteries have been tested and determined to be
in compliance with the vibration and pressure differential
tests contained in 49 CFR § 173.159(d).
Because Genesis batteries are classified as
"Nonspillable" and meet the conditions above, [from §
173.159(d)] they do not have an assigned UN number
nor do they require additional DOT hazard labelling.
1.3 UL component recognition
All Genesis batteries are recognised as UL components.
1.4 Non-halogenated plastics
As the world becomes more environmentally aware,
EnerSys
®
is striving to provide the most environmentally
friendly products possible. With this in mind, we are
proud to say that the plastics used in our Genesis
product line are non-halogenated and therefore do not
contain any of the following materials:
Polybrominated biphenyls (PBB)
Polybrominated biphenyl ethers (PBBE)
Polybrominated biphenyloxides (PBBO)
Polybrominated diphenyl ethers (PBDPE)
Polybrominated diphenyl oxides (PBDPO)
Tetrabromobisphenol-A (TBBA)
Deca-bromo biphenyl ethers (DBBPE’s).
The battery meets the non-halogenated flame retardancy
requirements of UL 94V-0 by using plastics with nonhalogenated flame retardants. Finally, the plastic material
used in the manufacturing of Genesis batteries is in full
compliance with the German Dioxin Ordinance of 1994.
1.5 Key Genesis benefits
Table 1.5.1 lists some of this battery’s features and
benefits. The Genesis battery is well suited for any
application - high rate, low rate, float or deep discharge
cycling.
Chapter 1:
Introducing the Genesis®Battery
3
www.enersys-emea.com
Feature Benefit
High volumetric and gravimetric power densities More power in less space and weight
Thin-plate design Superior high rate discharge capability
Low internal resistance Flatter voltage profile under high-rate discharge;
excellent low temperature performance
1
Negligible gassing under normal charge Safe for use in human environments such as offices and
hospitals. Must be installed in non-gastight enclosures
100% maintenance-free terminals True fit-and-forget battery
Flexible mounting orientation Battery may be installed in any position except inverted
Rugged construction Tolerant of high shock and vibration environments, especially the
XE version
Advanced manufacturing techniques High reliability and consistency
Very high purity lead-tin grid Lower corrosion rates and longer life
Non-halogenated flame retardant case and cover Meets UL 94 V-0 requirement, with an LOI >28%
Excellent high-rate recharge capability Allows >95% recharge in under an hour
Low self-discharge Longest shelf life among VRLA batteries (2 years at 25ºC)
Wide operating temperature -40ºC to +80ºC
Table 1.5.1: Key features and benefits of the Genesis battery
1 See Table 2.4.1 and Figure 2.4.1 in Section 2.4 of Chapter 2
2 The XE version of the Genesis battery may be used at 80ºC when fitted with a metal jacket
Page 4

2.3 Battery life
The life expectancy of a Genesis battery depends on the
specific application. It is expressed in terms of either
cycles or years. While life in years is self-explanatory,
a cycle refers to a sequence in which a charged battery is
discharged and then charged back up. One complete
sequence constitutes one cycle. In general, if the battery
is to be discharged frequently, cycle life rather than
calendar life is more relevant. On the other hand, if the
battery is to be used primarily as power backup, calendar
life of the battery should be considered.
In situations where one is not quite sure whether the
application is cyclic or standby (float), the following
criteria may be used to determine the application
category:
If the average time on charge between two successive
discharges is thirty (30) days, the application may be
considered to be of a standby (float) nature.
The minimum time between two successive
discharges must not be less than fourteen (14) days.
If either of these two criteria is not satisfied, the
application should be considered cyclic.
Chapter 2:
Technical Information
2.1 Introduction
We have divided this chapter into small sections
allowing you to locate the information quickly and
easily.
2.2 Choosing the right Genesis
®
version
As mentioned before, the Genesis
®
pure lead-tin
battery is available in EP and XE versions.
The EP battery is adequate under most operating
conditions.
Special application situations such as high ambient
temperature or high shock and vibration require the
XE version.
Table 2.2.1 summarises the differences between the
two versions and is designed to help you choose the
right version for your application. In this table, the
differences are highlighted in red boldfaced.
Feature Genesis®EP Genesis®XE
Technology Pure lead-tin absorbed glass mat (AGM)
Float life @ 2.27 volts per cell (Vpc) charge 10 years @ 25ºC 12 years @ 25ºC
Cycle life 400 to 80% depth of discharge (DOD)
Shock & vibration tolerance Good Better
Operating temperature range • -40ºC to +45ºC • -40ºC to +45ºC
• -40ºC to +60ºC • -40ºC to +80ºC
with metal jacket (denoted EPX) with metal jacket (denoted XEX)
Shelf life @ 25ºC 2 years from 100% charged down to 12V per block
Capacity @ 10-hr. rate 100% (reference) ≈ 95%
Weight 100% (reference) ≈ 105%
Dimensions Same footprint
Quick charge 6C to 8C charge acceptance at 25ºC
Overdischarge abuse tolerance Exceeds DIN standard for overdischarge recovery
High-rate discharge 100% (reference) ≈ 95%
Flame retardant rating V-0 rated case and cover
Case & cover colour Black Orange
Shipping Air shippable with no restrictions
Table 2.2.1: Choosing the right Genesis
®
version
Chapter 2:
Technical Information
4
www.enersys-emea.com
Page 5
While several factors affect the life of a battery, cycle life
depends primarily on the depth of discharge (DOD). At a
DOD of 80%, the Genesis
®
battery will deliver 400 cycles;
at 100% DOD, that number decreases to 320 cycles
All cycle life estimates assume adequate full recharge.
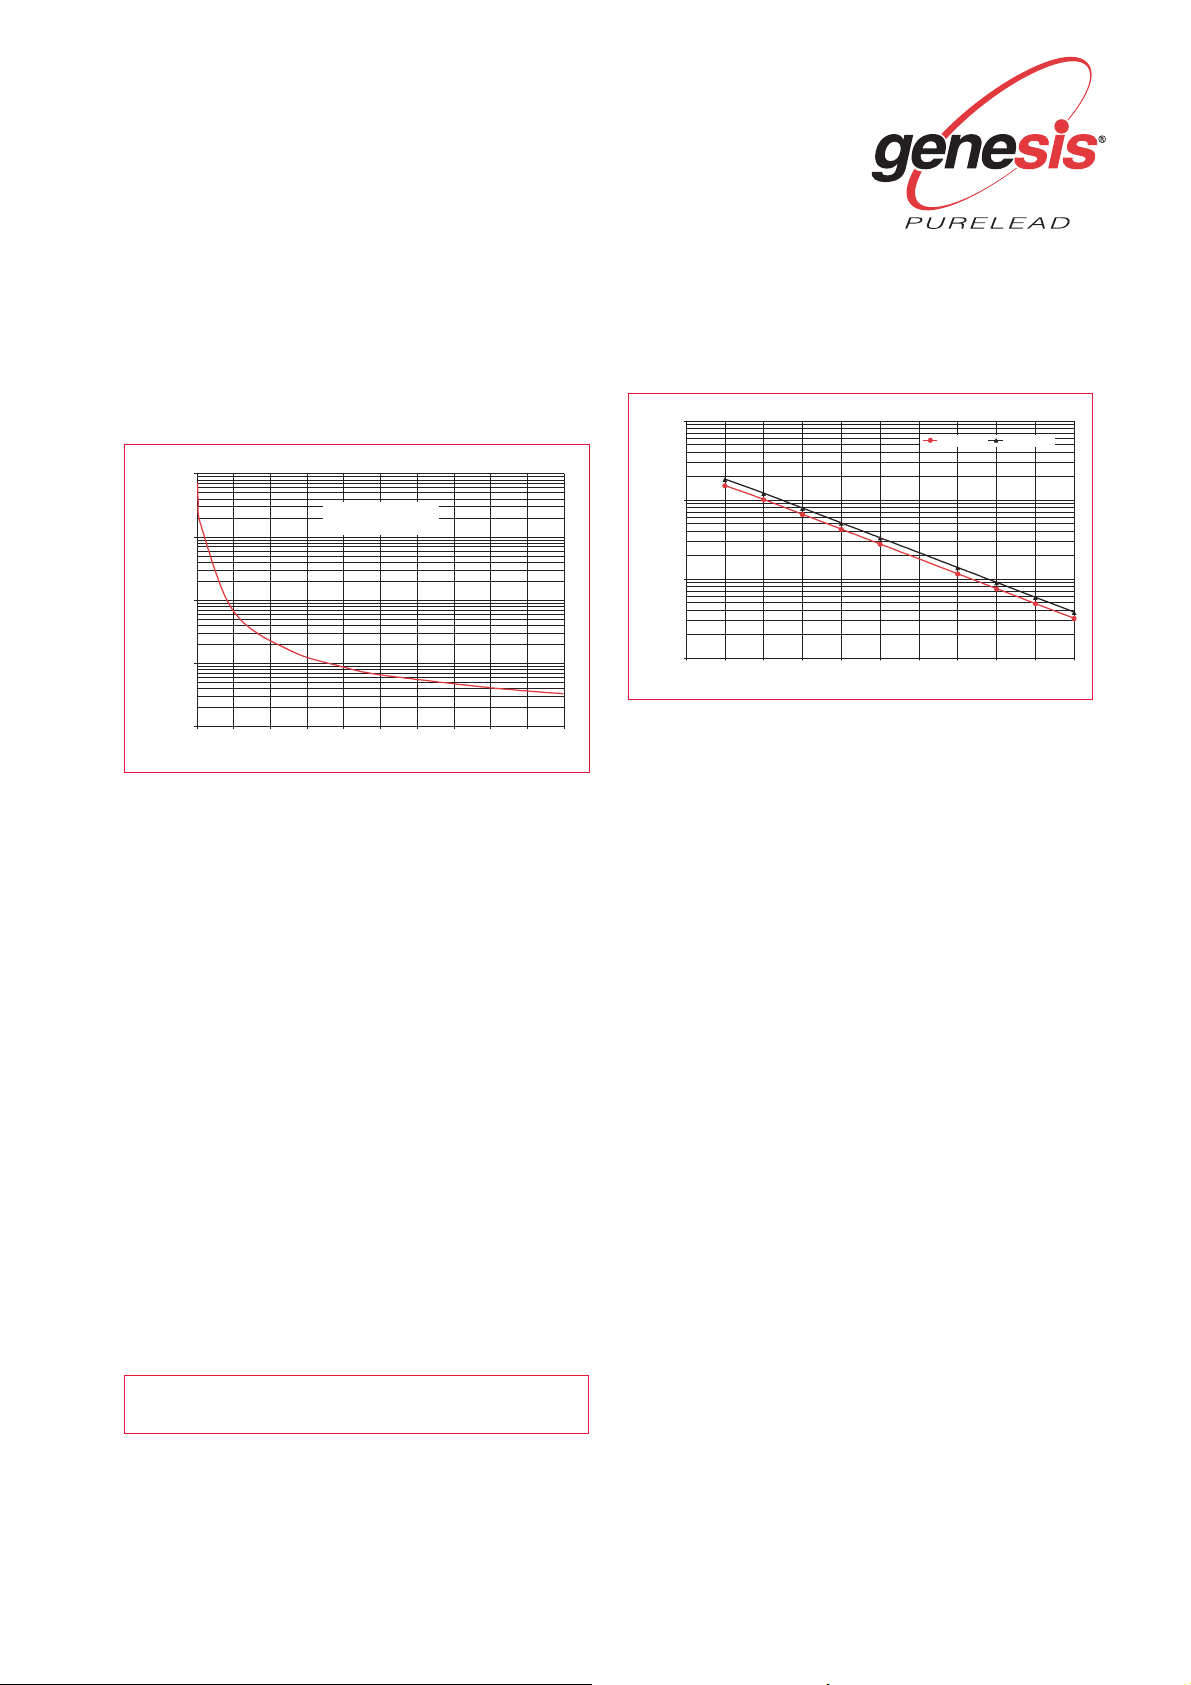
Figure 2.3.1 shows the relationship between DOD and
cycle life.
Figure 2.3.1: Cycle life and depth of discharge (DOD)
In contrast to cycle life, ambient temperature
dramatically affects float life. For roughly every 8°C rise
in ambient temperature above 25ºC, the float life of a
VRLA battery is cut in half. In other words, a 10-year
battery at 25°C) is only a 5-year battery at 33°C.
Additionally, float life is cut in half for every 100mV per
cell over the recommended float charge voltage.
The relationship between ambient temperature and
expected float life is given by the Arrhenius equation.
The equation defines the relationship between the
ambient temperature and the rate of internal positivegrid corrosion of the battery, which is the normal process
of battery aging.
A key point to note is that the temperature in question is
the battery ambient temperature. If the system is in a
25°C environment and the battery is installed next to a
power transformer where the temperature averages
32°C, then all battery calculations must be based on
32°C.
The Arrhenius equation is the theoretical foundation for
the relationship used in practice to derive the
acceleration factor for a given temperature. The equation
is shown below, in which AF is the acceleration factor
and T is the battery ambient temperature in ºC.
As an example, consider a battery in a float application
at an ambient temperature of 37ºC. Replacing T with 37
in the equation above the acceleration factor (AF) in this
case would be 2
(1.5)
or 2.83. A 10-year battery in this
situation should be expected to last only about
3.5 years (10/2.83 =3.5). Figure 2.3.2 graphically shows
the relationship between temperature and float life for
the EP and XE series batteries, assuming temperature
compensation and a reference temperature of 25ºC.
Figure 2.3.2: Battery temperature and float life
2.4 Constant-power and constant-current discharge
performance
Batteries are generally required to support either
constant-power (CP) or constant-current (CC) loads.
CP and CC discharge curves are provided in Appendix A
for Genesis
®
XE and in Appendix B for Genesis EP
batteries. The information is provided in both tabular and
graphical formats, with each curve representing the
discharge profile for a specific model to a specific end
voltage.
If intermediate run times are required, such as
watts per
battery
for 7 minutes to 1.67 volts per cell, the graphs
may be used to estimate the
watts per battery
available.
Generally speaking, most battery systems for indoor
applications are in temperature-regulated environments.
However, there are occasions when this is not the case.
This can happen when the batteries are installed in close
proximity to heat generating sources such as
transformers. In such cases, the user should know what
kind of life to expect from the batteries, since it is well
established that a battery’s overall life is sensitive to
ambient temperature.
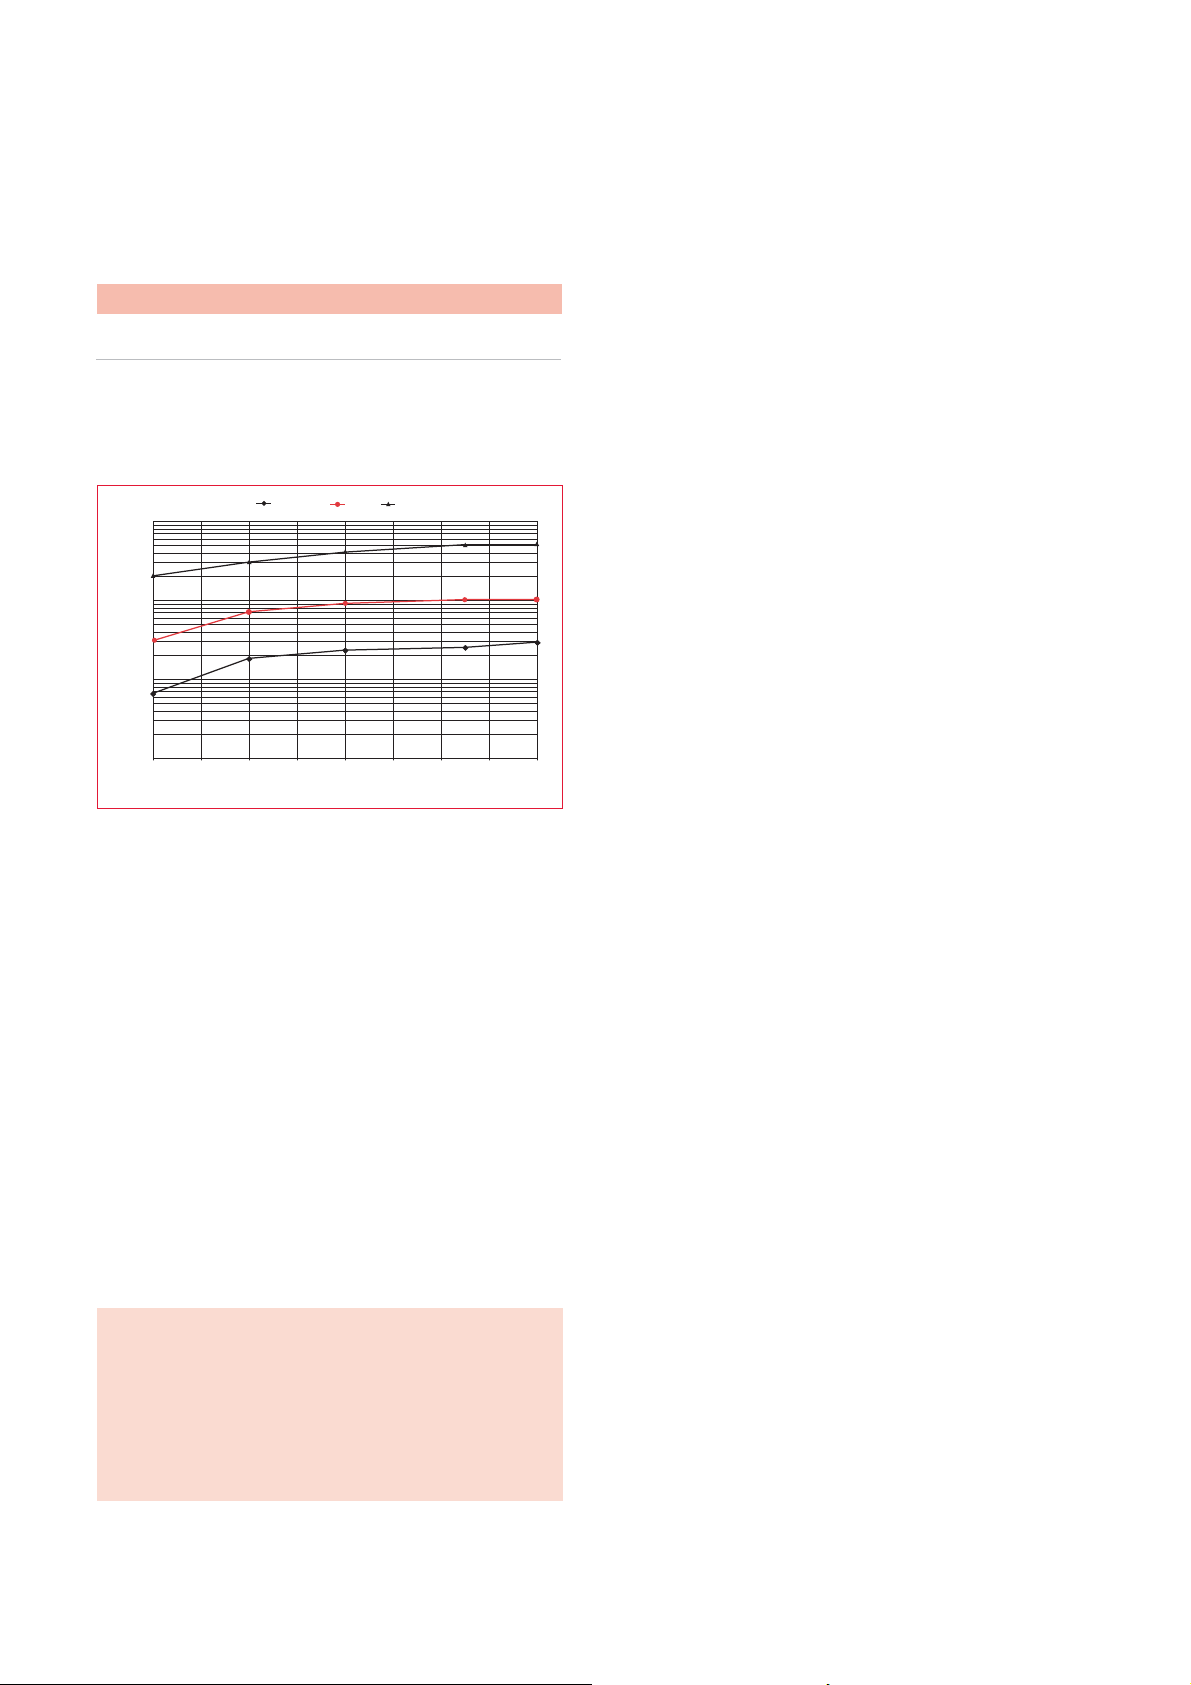
In addition to the dependence of battery life on ambient
temperature, battery capacity also varies with
temperature. Table 2.4.1 shows the variation in battery
capacity as a function of the ambient temperature.
The capacity at 25ºC is taken as 100%.
(0.125T-3.125)
AF = 2
5
www.enersys-emea.com
1000000
Charge profile:
CV@2.45 VPC for 16 hours
100000
10000
Current limit at 1C
100
10
1
Years to 80% capacity
Genesis EP Genesis XE
Nunmber of cycles
1000
100
10
0
30
20
50
40
Depth of discharge, DOD%
60
70
90
80
100
0
20
15
30 35
25
40 45
Temperature, °C
55
60
50
65
Page 6
Temperature -20ºC 0ºC 25ºC 40ºC 55ºC
Capacity @
15 min. rate 65% 84% 100% 110% 120%
Table 2.4.1: Effect of temperature on 15-minute discharge
A graph of capacity as a function of temperature for the
Genesis
®
battery is shown in Figure 2.4.1 for various
rates of discharge.
Figure 2.4.1: Capacity as a function of temperature
Although the Genesis battery may be used, with
appropriate derating, from -40°C to 80°C, it is strongly
recommended that every effort be made to install them
in temperature-regulated environments. Metal jackets are
required for temperatures exceeding 45°C continuous.
All battery temperatures refer to the temperatures
experienced by the active materials
inside
the battery.
The time required by the active materials to reach
thermal equilibrium within the battery environment may
be considerable.
2.5 Charging characteristics & requirements
A constant-voltage (CV) regime is the preferred method
of charging these batteries, although a constant-current
(CC) charger with appropriate controls may also be used.
There is no limit on the magnitude of the charge current
during a CV charge. Because of the Genesis battery’s low
internal resistance, it is able to accept any level of inrush
current provided by a constant-voltage charger.
Note:
The following paragraphs on battery
charging have been considerably simplified for better
understanding. For example, no account has been
taken of the polarisation voltage. Second, the
battery resistance has been assumed to be static.
This is a simplifying assumption since the battery’s
internal resistance will change continuously during
the charge cycle.
This dynamism in the internal resistance occurs because
of the changing state of charge and the fact that the
temperature of the active materials within the battery is
dynamic.
Owing to these simplifications, the current magnitudes
obtained in the sample calculations are exaggerated.
However, if one remembers that assumptions have been
made and that the
mathematical steps are for illustration
only
, then the actual current values calculated become
immaterial.
It is known from basic electric-circuit theory that the
current in any circuit is directly proportional to the
voltage differential in the circuit (Ohm’s Law). Therefore,
as charging continues at a constant voltage, the charging
current decreases due to the decreasing difference
between the charger-output voltage and the batteryterminal voltage. Expressed differently, the charging
current is at its highest value at the beginning of the
charge cycle and at its lowest value at the end of the
charge cycle.
Thus, in a CV charge circuit, the battery is the current
regulating device in the circuit. It will draw only that
amount of current as necessary to reach full charge.
Once it attains 100% state of charge, it continues to draw
small currents in order to compensate for
standing/parasitic losses.
Assume that the battery under consideration has an
internal resistance of 4mΩ (0.004Ω) when fully charged.
Also, assume that it has an internal resistance of 8mΩ
(0.008Ω) when discharged to an end voltage of 10.5
volts. However, the instant the load is removed from the
battery, its voltage jumps back up to 12 volts, and this is
the initial back electromotive force (EMF) the charger
output terminals will see. The influence of this voltage
on the charge-current inrush is illustrated in the initial
and final charging magnitudes.
It is now decided to recharge the battery at a constant
voltage of 2.27 volts per cell or 13.62 volts per battery.
Further, assume that when the battery reaches a state of
full charge, the internal resistance reduces to 4mΩ and
the terminal voltage rises to 13.60V.
For illustrative
purposes, this final end-of-charge terminal voltage has
been kept deliberately slightly lower than the charging
voltage.
In reality, the charging process is dynamic. As soon as a
charging source is placed across the terminals of a
discharged battery, its voltage begins rising in an
attempt to match the charger-output voltage. Given
enough time, one would expect that the battery voltage
at some point would exactly equal the charger voltage,
thereby reducing the voltage difference in the charging
circuit to zero and thus forcing the charge current to
zero. However, this does not happen because of the
internal electrochemistry, which ensures that the battery
will keep drawing small charging currents even when
fully charged.
6
www.enersys-emea.com
10
1
0.1
Discharge time, hours
0.01
-30
-40
15 min. rate
-20
-10 0
Temperature, °C
IC rate 0.2C rate
10
30
20
40
Page 7
However, almost immediately, the battery selfdischarges, depressing its terminal voltage below the
charger voltage, thereby initiating a current flow once
again. The entire process, as outlined in the previous
paragraph, will then repeat itself.
Applying Ohm’s Law, which states that
the current in a
circuit is equal to the voltage gradient (difference) in the
circuit divided by the total resistance in the circuit
, and
substituting the various parameters’ assumed values,
we have the following charging currents. Note that all
connection resistances, such as those for cables, are
neglected for simplicity. This omission does not affect
the outcome since its influence would be the same in
both cases, neglecting changes due to electrical heating.
Initial charging current = = 202.5A
Final charging current = = 5A
This example shows how the battery acts as a current
regulator in a CV charge circuit, decreasing the current
flow in the circuit to suit its own state of charge.
Thus, even if the current limit on the charger were
250 amperes, the battery would see an inrush current of
202.5 amperes, before it tapered off and finally dropped
to its lowest value at the end of the charge cycle.
Although the 250A figure is impractical because of
prohibitive charger costs, it serves to drive home the
point that as far as the battery is concerned, a specific
current limit is not necessary for Genesis
®
batteries
under CV charging. In reality, the current limit would be
dictated by a combination of technical and economic
considerations. Note also that, in general, most other
battery manufacturers recommend current limits based
on battery capacity, usually 0.25C
10, where C10 is the
10-hour rating.
Increasing the current limit will reduce the total recharge
time, but at greater cost. The reduction in recharge time
occurs mainly up to the 90% state of charge level; the
impact on total recharge time is much less. The chargeroutput voltage exercises a much greater influence on the
total recharge time.
The question then becomes whether the reduction in the
time needed for a recharge can justify the additional
costs. In some critical applications, this may be the case,
while in other situations the added cost may not be
justifiable.
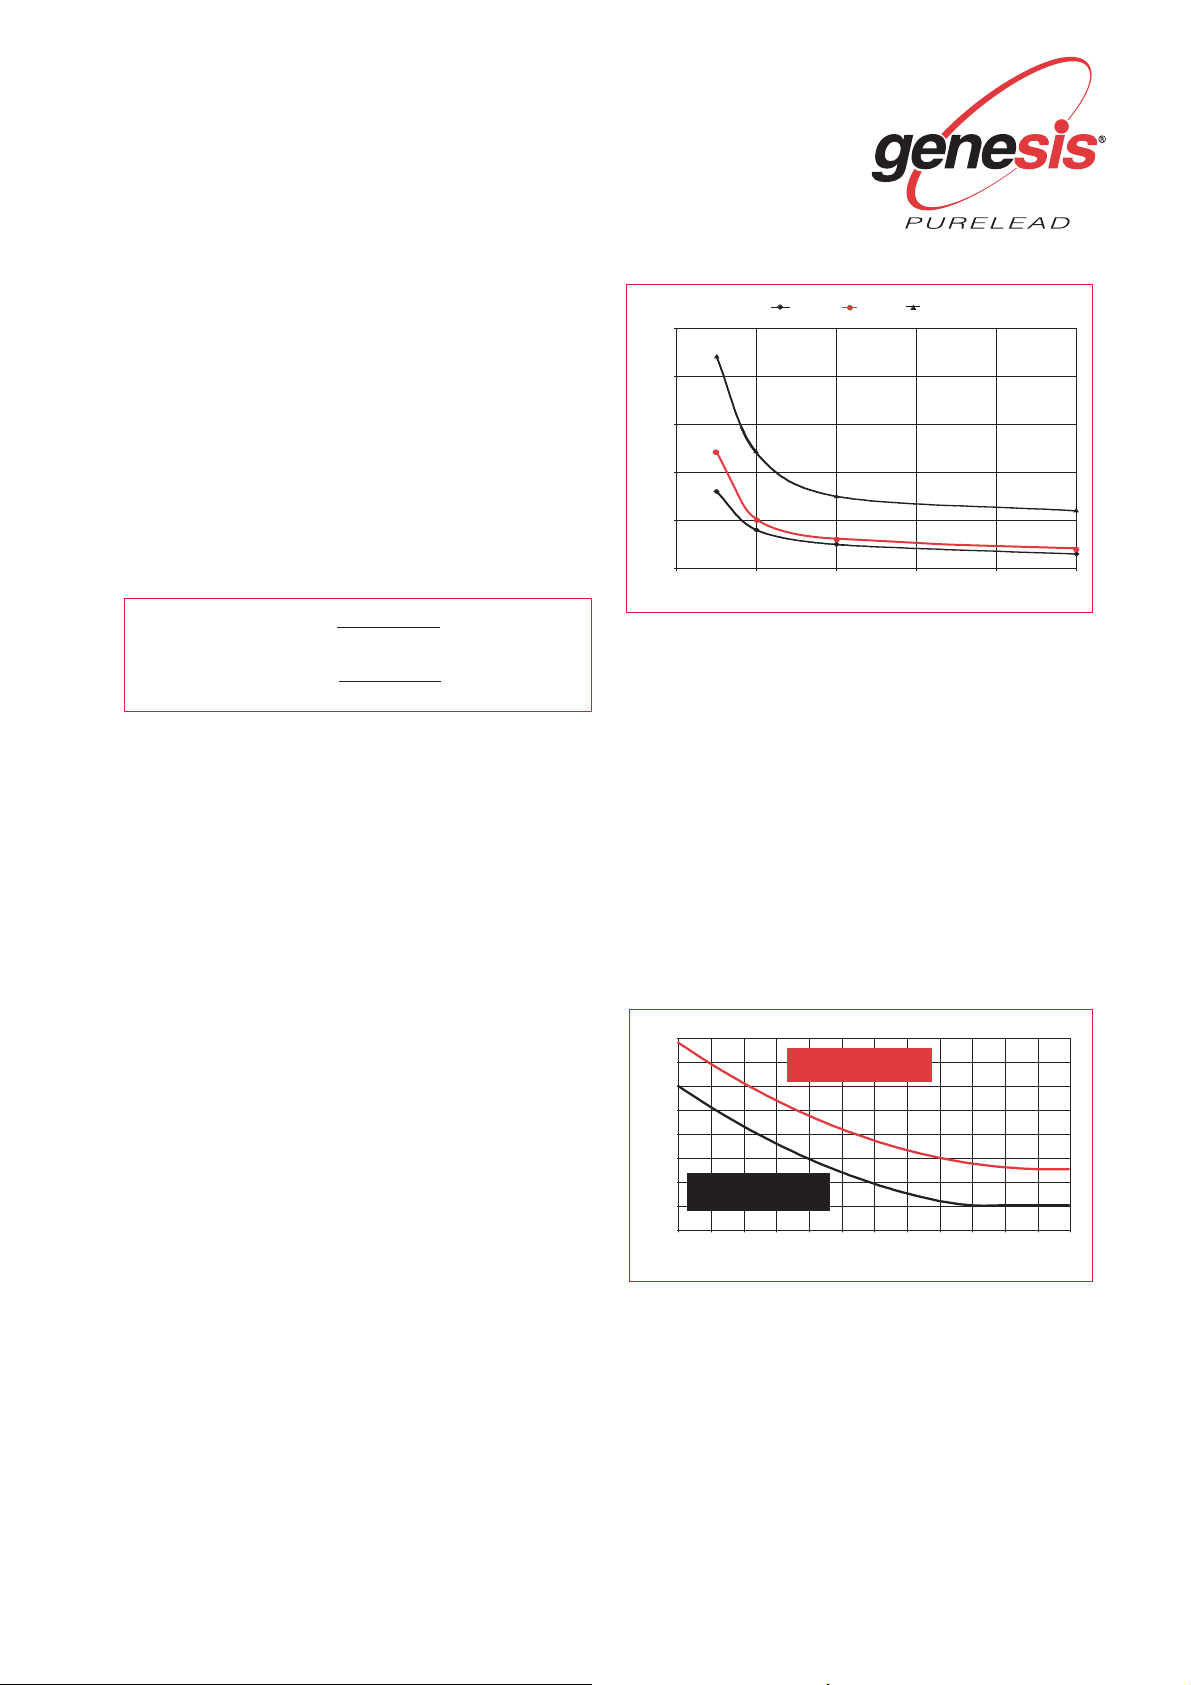
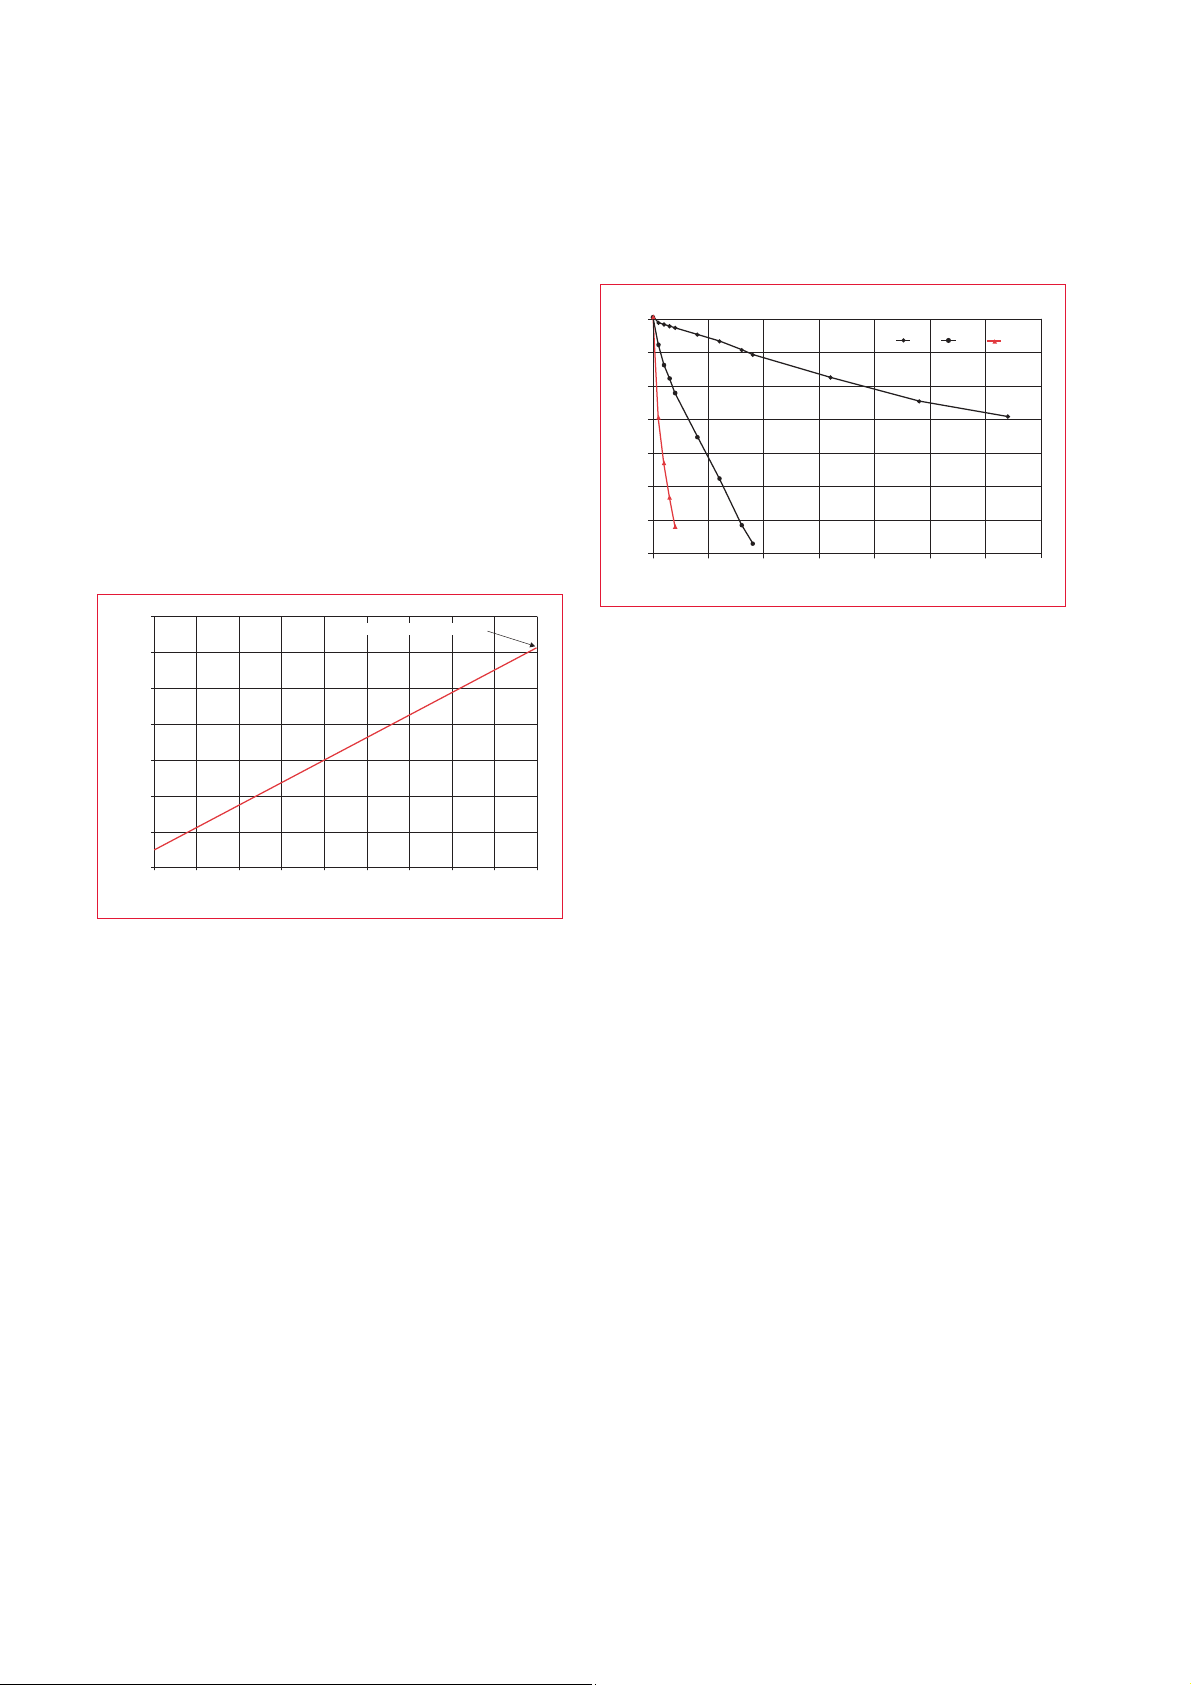
The time to recharge a battery under float charge is
shown in Figure 2.5.1. The graphs show the time taken
to reach three different states of charge. For example,
with a charge current of 0.2C
10 amps the battery will get
to 100% SOC in about 12 hours when charged at 13.62V
(2.27 Vpc).
Figure 2.5.1: Recharge times under float charge
2.6 Constant-voltage (CV) regime
In a float or standby application the CV charger should
be set at 13.5V to 13.8V at 25ºC. For a cyclic application,
the charge voltage should be set between 14.4V and 15V
at 25ºC. In both cases, the linearised temperature
compensation factor is ±24mV per battery per ºC
variation from 25ºC. The higher the temperature the
lower the charge voltage should be and vice versa.
Figure 2.6.1 shows the temperature compensation factor
for float and cyclic applications. Equations representing
the compensation curves are also shown in this figure.
Note that for both types of application there is no limit
on the inrush current. We recommend the highest
practical and economical current limit possible.
Figure 2.6.1: Temperature compensation graph
2.7 Constant-current (CC) regime
Unlike CV charging, CC charging requires the charge
current to be limited to 0.33C
10 to avoid damaging the
battery. Once 100% of previously discharged capacity
has been returned the overcharge should be continued
at a much lower rate, such as 0.002C
10, i.e., at the
500-hour rate.
13.62 - 12.00
0.008
13.62 - 13.60
0.004
7
www.enersys-emea.com
80% SOC
25
20
15
10
Time in hours at 2.27 VPC & 25°
5
0
0
0.2
Recharge current in multiple of rated capacity
90% SOC
0.4 0.6
100% SOC
0.8 1
2.90
2.80
2.70
2.60
2.50
2.40
Theoretical float (ideal)
Charge voltage, Vpc
2.30
V = 0.00004T
and 2.20VPC minium
2.20
2.10
-40
-30 -20
Theoretical cycling (ideal)
V = 0.00004T
2
- 0.006T + 2.3945
-10 0
2
- 0.006T + 2.5745
10
20
Temperature, °C
30
40
50 60
70 80
Page 8
When using a CC-charge regime, the charge current
must switch from a high (starting) rate to a low
(finishing) rate when the battery reaches 100% state of
charge. The point at which this switch occurs may be
determined by using a timer or by sensing the battery
voltage.
The timer setting can be determined by calculating the
time needed to return 105% to 110% of the amperehours drawn out. However, this method should not be
used unless the previously discharged capacity can be
reliably and consistently measured.
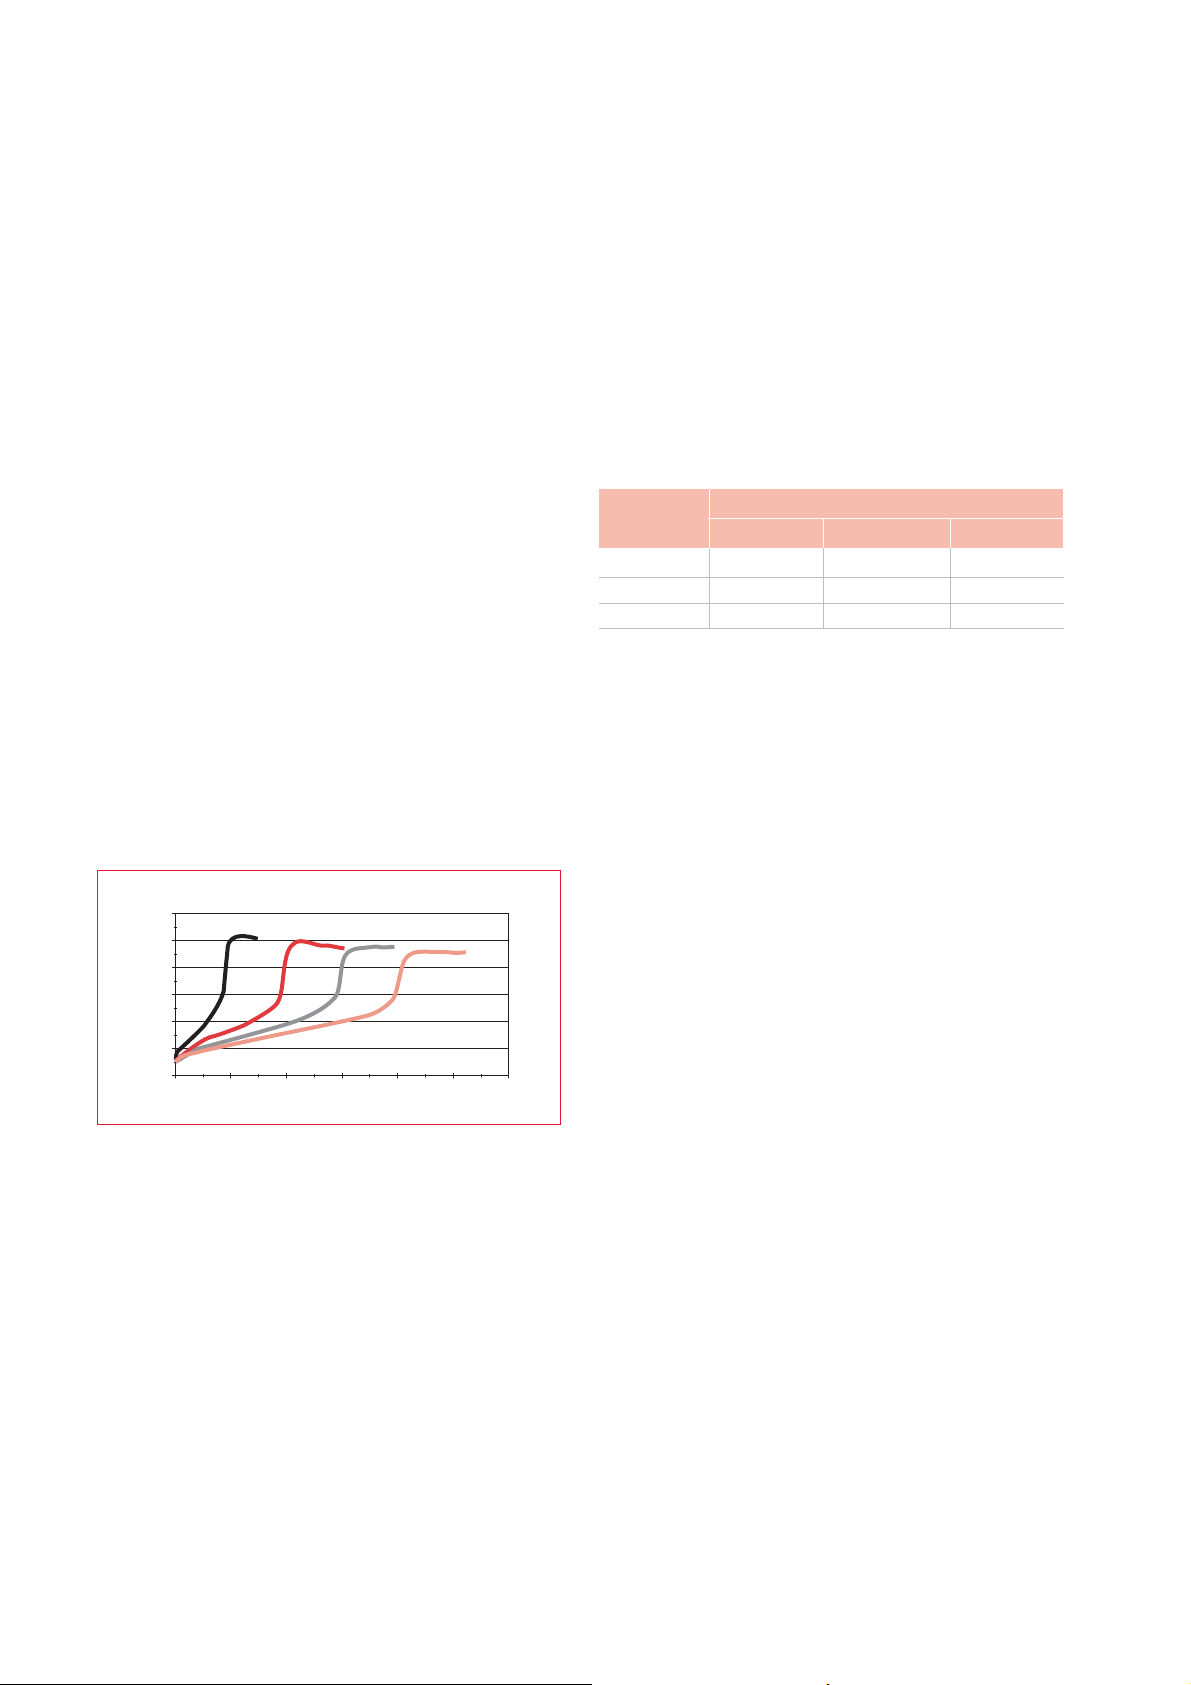
Alternatively, the battery-terminal voltage can be used to
trigger the transition from a high charge current to a low
charge current. As the battery charges up, its voltage
reaches a peak value and then begins to decline to the
steady-state, fully charged value. The point at which this
drop (point of inflection) begins depends on the charge
current’s magnitude, as shown in Figure 2.7.1. Since the
charge voltages in Figure 2.7.1 are on a per cell basis,
simply multiply the numbers by 6 as all Genesis
®
batteries are 12V units.
The inflection point may be used to switch the current
from a high rate (≤ 0.33C
10) to a low rate (≈0.002C10).
This is a more reliable method than amp-hour counting,
as it is independent of the previously discharged
capacity.
Figure 2.7.1: CC charging curves at 25ºC
The Genesis battery may be recharged using either a
constant-current (CC) or constant-voltage (CV) charger,
although the CV regime is the preferred method
. This
flexibility in the charging scheme is an advantage, since
it is easy for the user to replace existing batteries with
Genesis without having to alter the charging circuitry.
Because of the thin plate pure lead-tin technology used
in this battery, the internal resistance is significantly
lower than that of conventional VRLA batteries. For
example, the 26EP battery has an internal resistance of
about 5mΩ when fully charged. This compares very
favourably with a typical value of 10 to 15mΩ for
competitive products of equal capacity.
The low internal resistance helps the Genesis battery
accept large inrush currents without any harmful effects.
The heat generated by the charge current is kept at a low
level because of the very low internal resistance value.
The very high recharge efficiency of this battery also
allows high inrush currents. In tests performed on the
26Ah product, the initial current drawn by the battery
was 175 amperes. The Genesis battery may be recharged
much more rapidly than conventional VRLA batteries
because of its ability to safely accept very high currents.
Table 2.7.1 demonstrates this quick charge capability
when using a CV charge of 14.7V.
Table 2.7.1: Inrush current and charge time
This fast-charge capability is remarkable in a VRLA
battery. This feature makes the Genesis battery
competitive with a nickel-cadmium battery, which
traditionally had an advantage over lead acid batteries
due to its short charge times.
The quick charge capability of the Genesis battery makes
it particularly suitable for applications where the battery
has to be returned quickly to a high state of charge after
a discharge.
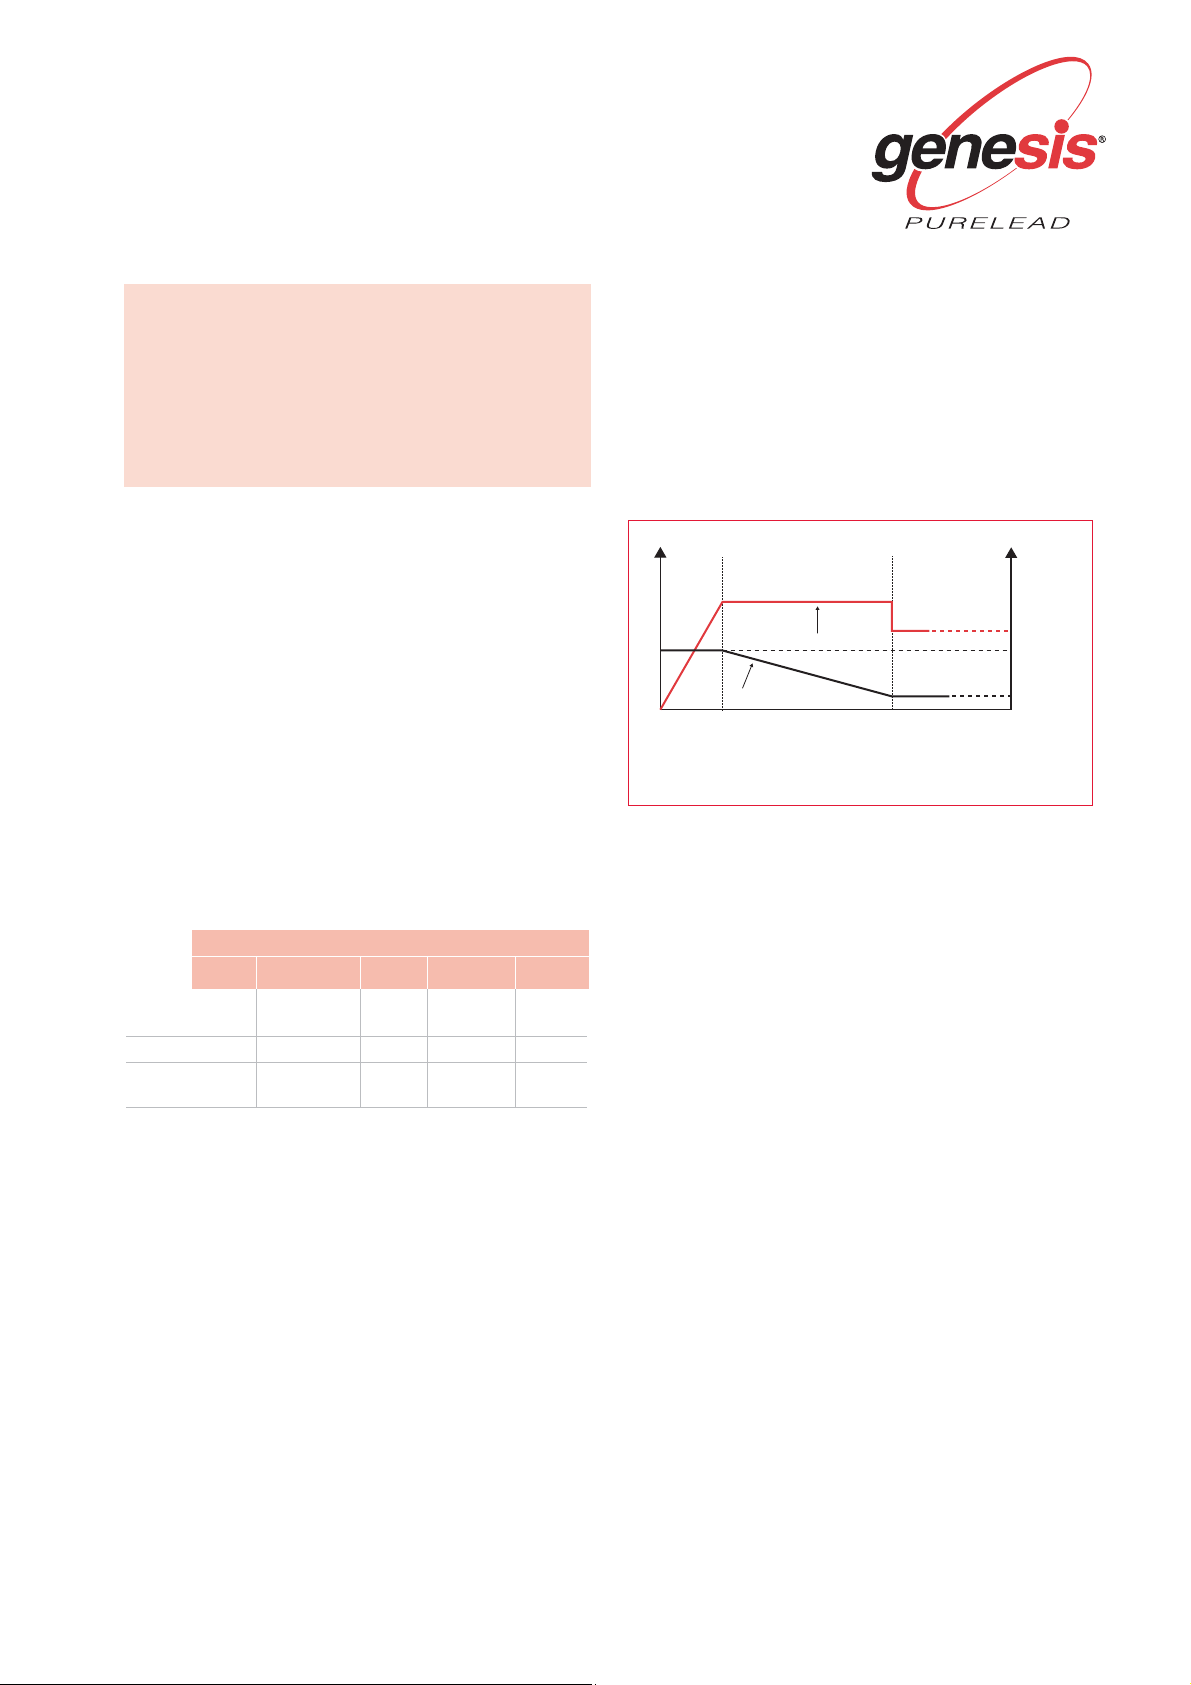
2.8 Three-step (IUU) charge profile
A three-step charge profile developed for use with the
Genesis TPPL battery is shown in Figure 2.8.1. The first
step (bulk charge) is a constant current (CC) charge with
a minimum current of 40% of the 10-hour (C
10) rating of
the battery. For example, to use this profile effectively on
the 16Ah battery, the minimum charge current must be
6.4 amps.
Bulk charge continues until the battery voltage reaches
14.7V. The charger then switches to a constant voltage
(CV) mode at 14.7V and the absorption charge phase
begins.
The charger switches to the temperature-compensated
float phase when either the current drops to 25% of the
bulk charge current (0.1C
10 amps) or the time in the
absorption phase reaches 8 hours, whichever occurs
first.
If the charger has a timer override so that the absorption
phase does not exceed 8 hours, the threshold current at
which the charger switches from absorption phase to
float phase should be reduced to 0.001C
10. This equals
16mA for the 16Ah battery discussed in the earlier
example.
If the charger does not have a timer the trigger to switch
from absorption phase to float phase should be set at
0.1C
10.
Magnitude of inrush current
Capacity
returned 0.8C
10
1.6C
10
3.1C
10
60% 44 min. 20 min. 10 min.
80% 57 min. 28 min. 14 min.
100% 1.5 hrs. 50 min. 30 min.
8
www.enersys-emea.com
Voltage Profiles at 25C
C/5
5
Constant Current Charging
C/15
C/10
10
Time (Hours)
C/20
2015
3025
Voltage
3
2.8
2.6
2.4
2.2
2
1.8
0
Page 9
Note:
The battery will not be fully charged when a
switch from absorption to float charge is made when
the current drops to 0.1C
10
. The battery will need a
minimum of 16-24 hours on float charge before it is
fully charged. The battery may be used as soon as
the switch to float is made, but repeatedly cycling it
without the necessary 16-24 hours’ on float charge
will cause premature failure of the battery.
Alternatively, the charger can stay in the absorption
phase for a fixed 8 hours. Once this absorption charge
time is over, the charger can switch to a temperaturecompensated float voltage. The advantage with this
design is a less complex circuit because it is not
necessary to monitor the charge current in the
absorption phase.
Table 2.8.1 lists the different IUU charge profile options.
A check mark indicates the feature is available in the
charger, while X indicates a charger that does not have
the feature. Note that all three designs have bulk,
absorption and float charge phases. The differences
between the three designs are limited to (a) whether a
timer is available, (b) whether the circuit monitors the
charge current and (c) the magnitude of the threshold
current, if it is used to trigger the switch from absorption
charge to float charge.
Table 2.8.1: IUU charger design options
Design 1:
The charger has a timer and a current threshold that
triggers the switch from absorption charge to float
charge. Since the timer is present, the trigger current is
set low. If the current does not drop to 0.001C
10
amps
within 8 hours on absorption charge, the timer will force
the switch to a temperature-compensated float charge.
Design 2:
The charger does not switch to a float charge based on a
preset charge current. Rather, the timer stays in the
absorption phase for 8 hours before switching to a
temperature-compensated float charge.
Design 3:
The charger has no timer. Since switching depends
solely on the charge current dropping to a set level, the
threshold is set high enough to ensure the charger will
always switch to a float charge. In this design the battery
will not be fully charged at the start of the float charge.
A minimum of 16-24 hours on float will be required to
complete the charge.
Figure 2.8.1: Three-step (IUU) charge profile
2.9 Storage characteristics
Improper storage is a common form of battery misuse.
High storage temperature and inadequate frequency of
freshening charges are examples of improper storage.
In order to better understand the various mechanisms
influencing sealed-lead batteries kept in storage, the
following paragraphs discuss in general terms several
aspects of the batteries’ storage requirements.
2.10 Self discharge
All batteries lose charge over time when kept on open
circuit. This phenomenon is termed
self-discharge
.
If the capacity loss due to self-discharge is not
compensated by recharging in a timely fashion, the
capacity loss may become irrecoverable due to
irreversible sulphation, where the active materials (PbO
2,
lead dioxide, at the positive plates and sponge lead at
the negative plates) are gradually converted into an
electroinactive form of lead sulphate, PbSO
4. If the
capacity loss associated with self-discharge is not
replenished, the battery ultimately fails because storage
is electrochemically equivalent to a very low rate of
discharge.
Storage temperature is the key factor influencing the
self-discharge rate because it plays a major role in
determining the speed at which the internal chemical
reaction proceeds. The higher the temperature, the faster
the speed of chemical reactions.
Design 1 ✓✓✓0.001C10
amps ✓
Design 2 ✓✓✓X ✓
Design 3 ✓✓X 0.10C
10
amps ✓
Feature
Bulk Absorption Timer Trigger Float
9
www.enersys-emea.com
Bulk charge
Voltage
(RED)
NOTES:
1. Charger LED stays RED in bulk charge phase (DO NOT TAKE BATTERY OFF CHARGE)
2. LED changes to ORANGE in absorption charge phase (BATTERY AT 80% STATE OF CHARGE)
3. LED changes to GREEN in float charge phase (BATTERY FULLY CHARGED)
4. Charge voltage is temperature compensated at ±24mV per battery per ºC variation from 25ºC
8-hour absorption charge
(ORANGE)
Charge voltage
Charge current
14.7V
Continuous float charge
(GREEN)
13.6V
0.4C
Amps
10 min
Page 10
Just as every 8°C rise in operating temperature cuts the
battery’s life expectancy in half, so does every 8°C
increase in ambient temperature reduce the storage life
of a battery by 50%. Conversely, a reduction in storage
temperature will have the reverse effect by increasing
the allowable storage time.
2.11 Open circuit voltage (OCV) and state of charge
(SOC)
Since most batteries are subject to some kind of storage,
it is important for the user to have some method of
accurately estimating the battery capacity after it has
been in storage.
Figure 2.11.1: Open circuit voltage and state of charge
Although efforts should be made to ensure that batteries
are stored in temperature-controlled environments, a
freshening charge should be applied once every twentyfour (24) months or when the open-circuit voltage (OCV)
reading drops to 12V, whichever comes first. As shown
in Figure 2.11.1, 12V corresponds to a 35% state of
charge (SOC).
The battery may be permanently
damaged if the OCV is allowed to drop below 11.90V
.
Figure 2.11.1 shows the OCV and corresponding SOC for
a Genesis battery. An OCV of 12.84V or more indicates a
battery at 100% SOC. The figure is accurate to within
20% of the true SOC of the battery
if the battery has not
been charged OR discharged in the 24 hours preceding
the voltage measurement
. The accuracy improves to 5%
if the period of inactivity before the voltage
measurement is 5 days.
Capacity loss during storage is an important
consideration, particularly in applications where
performance loss due to storage is unacceptable.
However, knowing how much charge is remaining in the
battery at any point in its storage life is equally
important as the battery must be maintained at a
minimum charge level in order to prevent permanent
damage. Figure 2.11.2 shows the relationship between
storage time and remaining capacity at 25ºC, 45ºC and
65ºC.
Figure 2.11.2: Storage capacity at temperatures
2.12 Procedure to recover overdischarged batteries
There may be instances when a Genesis
®
battery is
overdischarged to the point where a standard charger is
unable to fully recharge the battery. In such cases, the
following procedure may help recover the affected
battery.
1. Bring the battery to room temperature (25°C).
2. Measure the OCV. Continue to step 3 if it is at least
12V; otherwise terminate the procedure and reject the
battery.
3. Charge the battery using a 0.05C
10 constant current for
24 hours. The charger should be capable of providing
a driving voltage as high as 36V. Monitor the battery
temperature;
discontinue charging if the battery
temperature rises above 45ºC
.
4. Allow the charged battery to stand on open circuit for
a minimum of 1 hour before proceeding to Step 5.
5. Perform a capacity test on the battery and record the
amp-hours delivered. The longer the discharge the
more reliable the result. This is Cycle 1.
6. Repeat steps (3) to (5). The capacity returned in step 5
is now Cycle 2. If Cycle 2 capacity is greater than Cycle
1 capacity proceed to step 7; otherwise reject the
battery.
7. Repeat steps (3) to (5) to get Cycle 3 capacity. Proceed
to step 8 if Cycle 3 capacity is equal to or more than
Cycle 2 capacity. Reject the battery if Cycle 3 capacity
is less than Cycle 2 capacity.
8. If Cycle 3 capacity equals or exceeds Cycle 2 capacity,
recharge the battery and put it back in service.
10
www.enersys-emea.com
100
90
80
70
25°C
45°C
65°C
13.0
12.8
12.6
12.4
12.2
12.0
Open circuit voltage (OCV), V
11.8
11.6
20 30 40 50 60 70 80 90 100
10
12.84V or higher indicates 100% SOC
State of Charge (SOC), %
60
50
Percent of 0.05C capacity
40
30
0
20
10
30 40
Open circuit storage time in weeks
60 70
50
Page 11

Chapter 3:
General Test Data
3.1 Introduction
This section’s purpose is to discuss actual data from
various tests conducted on Genesis
®
batteries. These
tests may be of particular interest to system designers
and application engineers. Other test results serve to
confirm the data published in the
Genesis Selection
Guide
.
Tests covered in this chapter include the following:
Thermal runaway test
Altitude test
Overdischarge recovery tests (DIN standard test and
high temperature storage test)
Accelerated float life test
Gassing test
Performance test at different temperatures
3.2 Thermal runaway test
Thermal runaway (TR) describes a situation in which the
battery is unable to maintain a steady current when
connected to a CV charger. TR can also happen when the
battery temperature increases rapidly due to inadequate
heat dissipation from the battery.
As the battery draws current, its internal temperature
rises. If the heat generated is not dissipated, the internal
reaction rate of the battery will increase, forcing the
battery to draw more current. This in turn generates
more heat. The increasing heat generation and attendant
higher current draw feed on each other which, if allowed
to escalate will trigger TR.
Figure 3.2.1 shows the result of TR tests conducted on a
12V, 26EP Genesis TPPL battery that had been cycled 10
times to age it. After the tenth discharge the battery was
fully charged using normal charging parameters, then
put on a gross overcharge at 15.9V (2.65 VPC) at 25ºC.
The threshold criterion for initiation of TR was set at a
charge current of 4.5 amps or a battery temperature of
60ºC. In other words, the battery was considered to be in
TR when either the charge current reached 4.5 amps or
the battery case temperature rose to 60ºC. As shown in
Figure 3.2.1 the battery reached the temperature
threshold first, after the battery had been on overcharge
for 370.9 hours, or over 15 days.
Two points are noteworthy here. First, it took over 15
days on gross overcharge (remember, the battery was
fully charged when it was placed on a 15.9V charge)
before it showed signs of going into TR. The battery
received a staggering 565.7 amp-hours (over 2,000% of
its rated capacity) during the test.
Second, there was no catastrophic failure of the battery
and its case temperature rose gradually. It took over a
week (169 hours) for the temperature to rise from 45ºC to
60ºC. The results of this test clearly show that even in the
unlikely event of a Genesis battery going into TR, its
behaviour does not raise safety issues.
Figure 3.2.1: TR test at 15.9V (2.65Vpc) charge
3.3 Gassing test
The Genesis battery is safe for use in human
environments, such as offices and hospitals. A test was
developed to determine how much hydrogen gas is
evolved under normal operating conditions. This test’s
assumption is that any weight loss suffered by the
battery can be attributed to the water lost by the battery.
Knowing the amount of water lost by the battery and the
chemical composition of water, a relatively
straightforward calculation yields the amount of emitted
hydrogen gas. Table 3.3.1 summarises the test data on a
Genesis 26Ah battery.
Table 3.3.1: Gassing test data
The oxygen evolved is recombined, while the rate of
hydrogen emission is negligible, as Table 3.3.1 shows.
Nevertheless, the battery should not be recharged in a
gas-tight container. Ventilation must always be provided
in the charging area.
Test temperature 60ºC
Charge voltage 2.30 Vpc
Duration of test
at temperature 180 days
Weight loss at 65.6 grams
end of test period = 3.65 moles (gram equiv.) H
2O
= 3.65 moles H2 and 1.82 moles O2
Gas evolved Total 122.6 litres
Duration of test
at 25ºC 2,880 days (4,147,200 minutes)
Gassing rate Total 0.03 cc/min
Hydrogen (H2): 0.02 cc/min.
Chapter 3:
General Test Data
11
www.enersys-emea.com
12V, 26Ah Pure Lead-tin VRLA
70
60
50
40
30
Temperature, °C
20
10
0
Test ends when temperature reached 60°C or current rises to 4.5A
Battery temperature at 60°C
after 370.9 hours
Total input amp-hours: 565.7
Charge current
0 50 100 150 200 250 300 350 400
Hours on charge at 2.65Vpc
7
6
5
4
3
2
1
0
Amps
Page 12

3.4 DIN standard overdischarge recovery test
This German standard test was designed to determine
the ability of batteries to recover from overdischarge
using standard chargers. In addition, the test also gives
an indication of the resistance of the battery to
permanent damage caused by sulphation, a
phenomenon that occurs when a battery is left in a
discharged condition for an extended length of time.
The test began by discharging a fully charged 26Ah
battery at the 20-hour rate to 1.70 Vpc. Following the
discharge, a 5Ω resistor was connected across the
battery terminals and left connected for 28 days. At the
end of this 28-day period, the battery was recharged at a
constant voltage of 2.25 Vpc for only 48 hours.
The battery was tested for capacity after the 48-hour
recharge, and 97% of the initial capacity was obtained.
A subsequent recharge/discharge cycle yielded a
capacity of 94% of the initial capacity. The overdischarge
test exercise is summarised in Table 3.4.1 below.
Table 3.4.1: DIN standard overdischarge recovery test
result
3.5 High temperature storage recovery test
This test demonstrates the deep discharge recovery
capability of the Genesis
®
battery. Since the test involves
storing the battery in a discharged state for 4 weeks at
50ºC it is a more difficult test than the previously
described German DIN standard test. Figure 3.5.1
summarises the test results.
Figure 3.5.1: Recovery from discharged storage at 50ºC
Both samples were discharged at the 1-hour rate to an
end of discharge voltage of 9V, then stored in a
discharged condition for 4 weeks at 50ºC.
The batteries were then charged at 14.7V with a current
limit of 0.125C
10 for the first two cycles and 1C10 for
cycles 3 through 17.
It is clear that the charge current was too low for the first
two cycles, as evident from the rapid loss in capacity.
Boosting the charge current to 1C
10 brought both
batteries back to full capacity.
3.6 Altitude test
This test was designed to prove that the Genesis battery
is capable of operating safely and without performance
loss at any altitude. Since the design of the Genesis
battery’s Bunsen valve does not rely on atmospheric
pressure to operate, the battery will operate over a wide
range of external pressure, from vacuum to as much as
100 feet under water.
These batteries have also passed the pressure
differential test required to comply with the requirements
of DOT HMR 49 Non-Hazardous Materials, International
Civil Aeronautics Organisation (ICAO) and International
Air Transport Association (IATA) Packing Instruction 806
and Special Provision A67.
In the pressure differential test, the battery is placed in
a temperature-controlled altitude chamber at 24°C.
It is then subjected to 6 hours of differential pressure at a
minimum of 88 kPa (equivalent to an altitude of 50,000
feet). The test is repeated for each of three mutually
perpendicular orientations, including the inverted
position. A visual inspection showed no acid leakage,
indicating the battery passed the test.
Section 3.7: Accelerated float life test
Figure 3.7.1 shows the results of accelerated float life
(AFL) tests conducted on three samples of the Genesis
16Ah battery. In AFL tests, high temperatures accelerate
the aging process of the batteries. At an AFL test
temperature of 55ºC, the acceleration factor (AF) is
13.454, which means that every day at 55ºC is
electrochemically equivalent to 13.454 days at 25ºC.
This is a conservative AF because the charge voltage
used in the test is not temperature-compensated, as it
should be. No account is taken of the accelerated aging
of the battery due to a higher-than-recommended charge
voltage.
As shown in Figure 3.7.1 the three batteries were at
109%, 108% and 110% of their rated capacity after 270
days on test at 55ºC. This is electrochemically equivalent
to 9.95
1
years on float at 25ºC. Since end of life is defined
as the failure to deliver 80% of its rated capacity, none of
these batteries is close to the end of its design life of 10
years at 25ºC.
Conditions 0.05C10 rate discharge to 1.70 Vpc
Followed by 5Ω resistor connected across battery
terminals for 28 days
Recharge 2.25 Vpc CV charge for 48 hours
Results Initial capacity: 26.8Ah
Recovered 25.9Ah (97%) on first cycle
capacity 25.3Ah (94%) on second cycle
12
www.enersys-emea.com
36
34
32
30
28
26
24
Capacity at the 1-hr rate
22
20
86 420
Cycle number
Sample 1
10
Sample 2
12
14 16 18
Page 13

Figure 3.7.1: AFL test data for Genesis®16EP batteries
Similar tests on the Genesis
®
XE batteries showed an
average float life of 454 days at 55ºC, or the equivalent of
16.7 years at 25ºC to 80% of rated capacity. These results
validate the Genesis EP and XE published design life of
10 years and 12+ years, respectively, at 25ºC to 80% of
rated capacity.
Section 3.8: Performance test at different temperatures
Figure 3.8.1 shows the effect of temperature on the
discharge performance of Genesis batteries at three rates
of discharge. The vertical broken line represents 25ºC,
and its intersections with the graphs show the 100%
capacity at the three rates of discharge.
At –40ºC, the battery will run for 2 hours at the C
5 rate
(60% of its 5-hour capacity), for 18 minutes at the C
1 rate
(30% of its 1-hour capacity) and for 4 minutes at the
15-minute rate (27% of its 15-minute capacity). These are
excellent performance numbers, considering how low
the ambient temperature is.
Figure 3.8.1: Effect of temperature on capacity
Chapter 4:
Installation, Operation & Maintenance
4.1 Introduction
This chapter is designed to provide the user with
guidelines to help get the most out these batteries.
Even though VRLA batteries do not require the addition
of water, periodic maintenance checks are strongly
recommended. These are:
Individual unit voltages
Unit-to-unit connection resistances
Ambient temperature and battery temperat
ure
A load test can be carried out once or twice a year.
The batteries must be fully charged before any capacity
test is performed.
4.2 Receiving the shipment
All batteries must be carefully inspected upon arrival for
any sign of damage during their transportation.
Use rubber gloves when handling any that are broken or
physically damaged in case of acid leakage.
4.3 Storage
All Genesis batteries must be stored in a clean and dry
location, and preferably in a temperature-controlled
environment. Although these batteries are shipped fully
charged and may be stored for up to 2 years at 25ºC
periodic checks of their open circuit voltages are
recommended. The warmer the storage environment the
more frequent the voltage checks should be.
The batteries must be given a freshening charge once
every 2 years or when the OCV drops to 12.00V,
whichever occurs earlier. The freshening charge should
be for 96 hours at 13.62V at 25ºC or until the charge
current does not vary over a 3-hour period. Alternatively,
the freshening charge can be set at 14.4V for 16 to 24
hours or until the charge current does not vary over a 3hour period.
Failure to observe these conditions may result in greatly
reduced capacity and service life. FAILURE TO CHARGE
AS NOTED VOIDS THE BATTERY’S WARRANTY.
4.4 Installation
Batteries must be installed in a clean, dry area. Genesis
batteries release negligible amounts of gas during
normal operation (gas recombination efficiency ≥99%),
making them safe for installation near main equipment
and in close proximity to humans. Batteries must be
installed in accordance with BS 6133 or EN 50272.
Genesis® 16EP/AFL/55°C/2.27 VPC
Chapter 4:
Installation, Operation & Maintenance
13
www.enersys-emea.com
C/5 (3.0A) to 10.02V/15Ah = 100%; 12Ah = 80%
21
18
Acceleration factor for 55°C:13.454
Capacities after 270 days (9.95 years at 25°C):
15
Sample 1: 16.42Ah (109%)
Sample 2: 16.22Ah (108%)
Sample 3: 16.49Ah (110%)
12
9
0 50 100 150 200 250 300
Days at Temperature
10
1
0.1
Discharge time, hours
0.01
-40
-30 -20 -10 0 10 20 30 40
15 min. rate
1 hr. rate
100% capacity at 25C
Temperature, C
5 hr. rate
10
1
0.1
Discharge time, hours
0.01
Page 14

4.4.1 Temperature
Avoid placing batteries in areas of high temperature or
in direct sunlight. The optimal temperature range for
performance and service life of the Genesis
®
battery is
20ºC to 25ºC. These batteries can, however be used at
temperatures ranging from -40ºC to 80ºC when fitted
with a metal jacket.
4.4.2 Ventilation
As stated before, under normal operating conditions
the gas emission from Genesis batteries is very low.
Natural ventilation is adequate for cooling and to
prevent buildup of hydrogen gas. This is why Genesis
batteries may be used safely in offices, hospitals and
other occupied environments.
When installing batteries in cabinets or other
enclosures, care must be taken to ensure they are not
sealed enclosures. UNDER NO CIRCUMSTANCES
SHOULD THESE BATTERIES BE CHARGED IN A
SEALED CONTAINER.
All installations and ventilation must comply with
BS 6133 or EN 50272.
4.4.3 Mounting
Check that all contact surfaces are clean before
making the interbattery connections.
Tighten the screws to the recommended torque value
using insulated tools only and follow the polarities of
individual batteries to avoid short circuits. Finally,
connect the battery end terminals.
Since the Genesis battery has all of its electrolyte
immobilised in its separators, it can be mounted on its
sides without any performance degradation.
Note: The safety standards of EN 50272.
4.4.4 Torque
The recommended terminal torque for the full range is
given in Table 4.4.5.1. A loose connector can cause
problems in charger performance, erratic battery
performance, possible damage to the battery and even
personal injuries.
Only use insulated tools when working on batteries.
Table 4.4.5.1: Terminal torque values
4.5 Parallel strings
While there are no theoretical limits on the number of
parallel battery strings, we recommend no more than
6 parallel strings per system, particularly for cyclic
applications.
4.6 Discharging
It is strongly recommended that a low voltage cutoff be
included in the battery load circuit to protect the battery
from overdischarges. The setting for end of discharge
voltage (EODV) is dependent on the rate of discharge,
as shown in Table 4.6.1. For optimum battery life, we
recommend that the battery be disconnected from the
load when the appropriate voltage is reached and put
back on charge as soon as possible after a discharge.
Table 4.6.1: Suggested battery cutoff voltages
Note:
Discharging the Genesis battery below these
low voltage cutoff levels or leaving the battery
connected to a load in a discharged state may impair
the battery’s ability to accept a charge.
Battery model Terminal torque
13EP & XE13 5.6 Nm
16EP & XE16 5.6 Nm
26EP & XE30 6.8 Nm
42EP & XE40 6.8 Nm
70EP & XE70 6.8 Nm
- XE95 6.8 Nm
Discharge rate in amps Suggested
minimum EODV
0.05C
10 (C10/20) 10.50V
0.10C10 (C10/10) 10.20V
0.20C
10 (C10/5) 10.02V
0.40C10 (C10/2.5) 9.90V
1C10 9.60V
2C
10 9.30V
>5C10 9.00V
14
www.enersys-emea.com
Page 15

Appendix A
- Genesis®XE Discharge Rates
15
www.enersys-emea.com
Figure A-1: XE13 discharge data to 9.0V at 25°C
Figure A-2: XE13 discharge data to 10.02V at 25°C
Figure A-3: XE13 discharge data to 10.5V at 25°C
2 min. 1529 149.1 5.0 50.9 764.8 25.5 283.1 9.4
5 min. 760 71.2 5.9 63.3 400.2 33.3 140.7 11.7
10 min. 460 41.7 7.1 78.2 242.3 41.2 85.2 14.5
15 min. 339 30.2 7.6 84.8 178.8 44.7 62.8 15.7
20 min. 273 24.1 7.9 90.0 143.7 47.4 50.5 16.7
30 min. 199 17.4 8.7 99.4 104.7 52.4 36.8 18.4
45 min. 144 12.5 9.4 108.0 75.9 56.9 26.7 20.0
1 hr. 114 9.8 9.8 113.6 59.9 59.9 21.0 21.0
2 hr. 64 5.4 10.9 127.1 33.5 66.9 11.8 23.5
3 hr. 44 3.8 11.4 132.9 23.3 70.0 8.2 24.6
4 hr. 34 3.0 11.8 137.0 18.0 72.2 6.3 25.4
5 hr. 28 2.4 12.0 139.7 14.7 73.6 5.2 25.9
8 hr. 18 1.6 12.6 144.3 9.5 76.0 3.3 26.7
10 hr. 15 1.3 12.7 145.5 7.7 76.7 2.7 26.9
20 hr. 7 0.7 13.2 148.0 3.9 78.0 1.4 27.4
Time Watts Amps Capacity Energy
(W) (A) (Ah) (Wh) W/litre Wh/litre W/kg Wh/kg
ENERGY AND POWER DENSITIES
2 min. 1361 128.0 4.3 45.3 680.8 22.7 252.0 8.4
5 min. 701 64.4 5.4 58.4 369.4 30.8 129.8 10.8
10 min. 443 39.6 6.7 75.2 233.2 39.6 82.0 13.9
15 min. 330 29.2 7.3 82.6 174.1 43.5 61.2 15.3
20 min. 267 23.5 7.7 88.1 140.7 46.4 49.4 16.3
30 min. 195 16.9 8.5 97.5 102.7 51.4 36.1 18.1
45 min. 141 12.2 9.1 105.7 74.2 55.7 26.1 19.6
1 hr. 111 9.6 9.6 111.2 58.6 58.6 20.6 20.6
2 hr. 62 5.3 10.6 123.4 32.5 65.0 11.4 22.8
3 hr. 43 3.7 11.1 128.7 22.6 67.8 7.9 23.8
4 hr. 33 2.9 11.5 132.3 17.4 69.7 6.1 24.5
5 hr. 27 2.3 11.7 134.8 14.2 71.0 5.0 25.0
8 hr. 17 1.5 12.1 138.9 9.1 73.2 3.2 25.7
10 hr. 14 1.2 12.4 140.6 7.4 74.1 2.6 26.0
20 hr. 7 0.7 13.0 144.3 3.8 76.0 1.3 26.7
Time Watts Amps Capacity Energy
(W) (A) (Ah) (Wh) W/litre Wh/litre W/kg Wh/kg
ENERGY AND POWER DENSITIES
2 min. 1206 111.0 3.7 40.1 603.3 20.1 223.3 7.4
5 min. 662 58.9 4.9 55.2 348.9 29.1 122.6 10.2
10 min. 429 37.3 6.3 72.9 225.9 38.4 79.4 13.5
15 min. 323 28.0 7.0 80.7 170.2 42.5 59.8 15.0
20 min. 262 22.6 7.5 86.3 137.8 45.5 48.4 16.0
30 min. 191 16.5 8.3 95.6 100.8 50.4 35.4 17.7
45 min. 138 12.0 9.0 103.8 72.9 54.7 25.6 19.2
1 hr. 109 9.4 9.4 108.7 57.3 57.3 20.1 20.1
2 hr. 60 5.2 10.4 119.3 31.4 62.9 11.0 22.1
3 hr. 41 3.6 10.9 124.2 21.8 65.5 7.7 23.0
4 hr. 32 2.8 11.3 127.4 16.8 67.1 5.9 23.6
5 hr. 26 2.3 11.5 129.6 13.7 68.3 4.8 24.0
8 hr. 17 1.5 11.9 133.5 8.8 70.4 3.1 24.7
10 hr. 14 1.2 12.1 135.1 7.1 71.2 2.5 25.0
20 hr. 7 0.6 12.8 140.6 3.7 74.1 1.3 26.0
Time Watts Amps Capacity Energy
(W) (A) (Ah) (Wh) W/litre Wh/litre W/kg Wh/kg
ENERGY AND POWER DENSITIES
Amps
10000
1000
100
10
Watts or amps per XE13 battery
1
0.1
0.01
0.1
Watts
110
Hours to 9V at 25ºC
Amps
10000
1000
100
10
Watts or amps per XE13 battery
1
0.1
0.01
0.1
Watts
110
Hours to 10.02V at 25°C (77°F)
100
100
Amps
10000
1000
100
10
Watts or amps per XE13 battery
1
0.1
0.01
0.1
Watts
110
Hours to 10.5V at 25°C (77°F)
100
Page 16

16
www.enersys-emea.com
Figure A-6: XE16 discharge data to 10.02V at 25°C
2 min. 1486 143.0 4.8 49.5 638.8 21.3 232.1 7.7
5 min. 857 78.8 6.6 71.4 368.5 30.7 133.9 11.2
10 min. 546 49.3 8.4 92.9 234.9 39.9 85.3 14.5
15 min. 412 36.7 9.2 102.9 177.0 44.2 64.3 16.1
20 min. 335 29.6 9.8 110.4 143.9 47.5 52.3 17.2
30 min. 247 21.6 10.8 123.5 106.2 53.1 38.6 19.3
45 min. 180 15.6 11.7 135.1 77.5 58.1 28.2 21.1
1 hr. 143 12.3 12.3 142.8 61.4 61.4 22.3 22.3
2 hr. 81 6.9 13.7 161.6 34.7 69.5 12.6 25.3
3 hr. 57 4.8 14.4 170.5 24.4 73.3 8.9 26.6
4 hr. 44 3.7 14.8 176.8 19.0 76.0 6.9 27.6
5 hr. 36 3.0 15.2 181.0 15.6 77.8 5.7 28.3
8 hr. 24 2.0 15.7 189.3 10.2 81.4 3.7 29.6
10 hr. 19 1.6 16.0 193.2 8.3 83.1 3.0 30.2
20 hr. 10 0.8 16.7 201.8 4.3 86.8 1.6 31.5
Time Watts Amps Capacity Energy
(W) (A) (Ah) (Wh) W/litre Wh/litre W/kg Wh/kg
ENERGY AND POWER DENSITIES
Figure A-4: XE13 discharge data to 11.1V at 25°C
Figure A-5: XE16 discharge data to 9V at 25°C
2 min. 977 87.1 2.9 32.5 488.7 16.3 180.9 6.0
5 min. 612 51.1 4.3 51.0 322.6 26.9 113.4 9.4
10 min. 410 34.0 5.8 69.7 216.0 36.7 75.9 12.9
15 min. 312 26.0 6.5 78.0 164.4 41.1 57.8 14.4
20 min. 254 21.3 7.0 83.7 133.7 44.1 47.0 15.5
30 min. 186 15.8 7.9 93.1 98.1 49.1 34.5 17.2
45 min. 133 11.4 8.6 100.1 70.3 52.7 24.7 18.5
1 hr. 105 9.1 9.1 104.9 55.3 55.3 19.4 19.4
2 hr. 57 5.1 10.1 113.4 29.9 59.7 10.5 21.0
3 hr. 39 3.5 10.6 117.2 20.6 61.8 7.2 21.7
4 hr. 30 2.7 11.0 119.8 15.8 63.1 5.5 22.2
5 hr. 24 2.2 11.2 121.3 12.8 63.9 4.5 22.5
8 hr. 16 1.5 11.6 124.7 8.2 65.7 2.9 23.1
10 hr. 13 1.2 11.8 126.6 6.7 66.7 2.3 23.4
20 hr. 7 0.6 12.4 133.3 3.5 70.2 1.2 24.7
Time Watts Amps Capacity Energy
(W) (A) (Ah) (Wh) W/litre Wh/litre W/kg Wh/kg
ENERGY AND POWER DENSITIES
2 min. 1674 170.0 5.6 55.8 720.0 24.0 261.6 8.7
5 min. 915 87.9 7.3 76.3 393.6 32.8 143.0 11.9
10 min. 566 52.0 8.8 96.2 243.4 41.4 88.4 15.0
15 min. 422 38.0 9.5 105.4 181.4 45.3 65.9 16.5
20 min. 342 30.3 10.0 112.7 146.8 48.5 53.4 17.6
30 min. 251 22.0 11.0 125.4 107.8 53.9 39.2 19.6
45 min. 183 15.8 11.8 137.5 78.8 59.1 28.6 21.5
1 hr. 145 12.4 12.4 145.3 62.5 62.5 22.7 22.7
2 hr. 82 7.0 13.9 164.1 35.3 70.6 12.8 25.6
3 hr. 58 4.9 14.7 174.7 25.0 75.1 9.1 27.3
4 hr. 45 3.8 15.3 181.4 19.5 78.0 7.1 28.3
5 hr. 37 3.1 15.6 186.2 16.0 80.1 5.8 29.1
8 hr. 24 2.1 16.4 195.2 10.5 83.9 3.8 30.5
10 hr. 20 1.7 16.7 198.7 8.5 85.4 3.1 31.0
20 hr. 10 0.9 17.3 206.7 4.4 88.9 1.6 32.3
Time Watts Amps Capacity Energy
(W) (A) (Ah) (Wh) W/litre Wh/litre W/kg Wh/kg
ENERGY AND POWER DENSITIES
Amps
10000
1000
100
10
Watts or amps per XE13 battery
1
0.01
0.1
Watts
1 10 100
Hours to 11.1V at 25°C (77°F)
Amps
10000
1000
100
10
Watts or amps per XE16 battery
1
0.1
0.01
0.1
Watts
1 10 100
Hours to 9V at 25°C (77°F)
Amps
10000
1000
100
10
Watts or amps per XE16 battery
1
0.1
0.01
0.1
Watts
1 10 100
Hours to 10.02V at 25°C (77°F)
Page 17

17
www.enersys-emea.com
Figure A-7: XE16 discharge data to 10.5V at 25°C
2 min. 1312 124.9 4.2 43.7 564.3 18.8 205.1 6.8
5 min. 799 71.8 6.0 66.5 343.4 28.6 124.8 10.4
10 min. 522 46.5 7.9 88.8 224.6 38.2 81.6 13.9
15 min. 397 35.1 8.8 99.3 170.7 42.7 62.0 15.5
20 min. 324 28.6 9.4 106.9 139.3 46.0 50.6 16.7
30 min. 240 21.0 10.5 120.1 103.3 51.6 37.5 18.8
45 min. 176 15.2 11.4 131.8 75.6 56.7 27.5 20.6
1 hr. 140 12.0 12.0 139.7 60.1 60.1 21.8 21.8
2 hr. 78 6.7 13.3 156.7 33.7 67.4 12.2 24.5
3 hr. 55 4.7 14.0 166.1 23.8 71.4 8.6 25.9
4 hr. 43 3.6 14.4 172.1 18.5 74.0 6.7 26.9
5 hr. 35 2.9 14.7 176.1 15.1 75.7 5.5 27.5
8 hr. 23 1.9 15.2 183.9 9.9 79.1 3.6 28.7
10 hr. 19 1.6 15.5 187.7 8.1 80.7 2.9 29.3
20 hr. 10 0.8 16.1 196.9 4.2 84.7 1.5 30.8
Time Watts Amps Capacity Energy
(W) (A) (Ah) (Wh) W/litre Wh/litre W/kg Wh/kg
ENERGY AND POWER DENSITIES
Figure A-8: XE16 discharge data to 11.1V at 25°C
Figure A-9: XE30 discharge data to 9V at 25°C
2 min. 1058 100.4 3.3 35.2 454.8 15.1 165.3 5.5
5 min. 721 62.1 5.2 60.0 309.9 25.8 112.6 9.4
10 min. 485 42.2 7.2 82.4 208.5 35.4 75.8 12.9
15 min. 374 32.5 8.1 93.4 160.6 40.2 58.4 14.6
20 min. 307 26.7 8.8 101.4 132.2 43.6 48.0 15.9
30 min. 230 19.9 9.9 114.7 98.7 49.3 35.9 17.9
45 min. 168 14.4 10.8 126.2 72.4 54.3 26.3 19.7
1 hr. 134 11.5 11.5 134.1 57.7 57.7 21.0 21.0
2 hr. 75 6.4 12.7 150.5 32.4 64.7 11.8 23.5
3 hr. 53 4.4 13.3 159.3 22.8 68.5 8.3 24.9
4 hr. 41 3.4 13.7 164.7 17.7 70.8 6.4 25.7
5 hr. 34 2.8 13.9 168.5 14.5 72.4 5.3 26.3
8 hr. 22 1.8 14.4 176.1 9.5 75.7 3.4 27.5
10 hr. 18 1.5 14.7 179.1 7.7 77.0 2.8 28.0
20 hr. 9 0.8 15.3 188.3 4.0 81.0 1.5 29.4
Time Watts Amps Capacity Energy
(W) (A) (Ah) (Wh) W/litre Wh/litre W/kg Wh/kg
ENERGY AND POWER DENSITIES
2 min. 2837 283.4 9.4 94.5 768.7 25.6 267.6 8.9
5 min. 1694 160.1 13.3 141.1 459.2 38.2 159.9 13.3
10 min. 1062 95.6 16.3 180.5 287.7 48.9 100.2 17.0
15 min. 793 69.8 17.4 198.2 214.8 53.7 74.8 18.7
20 min. 638 55.6 18.3 210.4 172.8 57.0 60.1 19.8
30 min. 463 39.9 20.0 231.4 125.4 62.7 43.7 21.8
45 min. 333 28.4 21.3 249.7 90.2 67.7 31.4 23.6
1 hr. 262 22.3 22.3 262.1 71.0 71.0 24.7 24.7
2 hr. 144 12.1 24.3 288.7 39.1 78.2 13.6 27.2
3 hr. 101 8.5 25.4 302.3 27.3 81.9 9.5 28.5
4 hr. 78 6.6 26.2 311.8 21.1 84.5 7.4 29.4
5 hr. 64 5.3 26.7 318.6 17.3 86.3 6.0 30.1
8 hr. 41 3.5 27.9 331.1 11.2 89.7 3.9 31.2
10 hr. 34 2.8 28.3 337.5 9.1 91.5 3.2 31.8
20 hr. 18 1.5 30.0 357.1 4.8 96.8 1.7 33.7
Time Watts Amps Capacity Energy
(W) (A) (Ah) (Wh) W/litre Wh/litre W/kg Wh/kg
ENERGY AND POWER DENSITIES
Amps
10000
1000
100
10
Watts or amps per XE16 battery
1
0.1
0.01
0.1
Watts
1 10 100
Hours to 10.5V at 25°C (77°F)
Amps
10000
1000
100
10
Watts or amps per XE16 battery
1
0.1
0.01
0.1
Watts
1 10 100
Hours to 11.1V at 25°C (77°F)
Amps
10000
1000
100
10
Watts or amps per XE30 battery
1
0.01
0.1
Watts
1 10 100
Hours to 9V at 25°C (77°F)
Page 18

18
www.enersys-emea.com
Figure A-11: XE30 discharge data to 10.5V at 25°C
Figure A-12: XE30 discharge data to 11.1V at 25°C
2 min. 2129 195.7 6.5 70.9 576.8 19.2 200.8 6.7
5 min. 1454 130.9 10.9 121.1 391.1 32.8 137.2 11.4
10 min. 972 85.5 14.5 165.3 263.4 44.8 91.7 15.6
15 min. 742 64.5 16.1 185.5 201.1 50.3 70.0 17.5
20 min. 603 52.1 17.2 198.9 163.3 53.9 56.9 18.8
30 min. 444 38.0 19.0 222.0 120.3 60.1 41.9 20.9
45 min. 321 27.3 20.5 240.8 87.0 65.2 30.3 22.7
1 hr. 253 21.4 21.4 252.7 68.5 68.5 23.8 23.8
2 hr. 139 11.7 23.4 278.8 37.8 75.5 13.2 26.3
3 hr. 97 8.1 24.3 291.2 26.3 78.9 9.2 27.5
4 hr. 75 6.2 25.0 299.5 20.3 81.2 7.1 28.3
5 hr. 61 5.1 25.4 306.3 16.6 83.0 5.8 28.9
8 hr. 40 3.3 26.4 317.4 10.8 86.0 3.7 29.9
10 hr. 32 2.7 26.9 324.0 8.8 87.8 3.1 30.6
20 hr. 17 1.4 28.7 347.3 4.7 94.1 1.6 32.8
Time Watts Amps Capacity Energy
(W) (A) (Ah) (Wh) W/litre Wh/litre W/kg Wh/kg
ENERGY AND POWER DENSITIES
2 min. 1801 160.1 5.3 60.0 487.9 16.2 169.9 5.7
5 min. 1298 113.6 9.5 108.2 351.8 29.3 122.5 10.2
10 min. 895 77.6 13.2 152.2 242.6 41.3 84.5 14.4
15 min. 698 59.6 14.9 174.4 189.0 47.3 65.8 16.5
20 min. 571 48.7 16.1 188.3 154.6 51.0 53.8 17.8
30 min. 425 36.1 18.0 212.2 115.0 57.5 40.0 20.0
45 min. 309 26.1 19.6 231.9 83.8 62.8 29.2 21.9
1 hr. 245 20.6 20.6 244.7 66.3 66.3 23.1 23.1
2 hr. 135 11.3 22.6 270.2 36.6 73.2 12.7 25.5
3 hr. 94 7.9 23.6 282.0 25.5 76.4 8.9 26.6
4 hr. 72 6.1 24.2 289.7 19.6 78.5 6.8 27.3
5 hr. 59 4.9 24.7 296.5 16.1 80.3 5.6 28.0
8 hr. 39 3.2 25.6 308.1 10.4 83.5 3.6 29.1
10 hr. 31 2.6 26.1 314.3 8.5 85.2 3.0 29.6
20 hr. 17 1.4 27.7 336.3 4.6 91.1 1.6 31.7
Time Watts Amps Capacity Energy
(W) (A) (Ah) (Wh) W/litre Wh/litre W/kg Wh/kg
ENERGY AND POWER DENSITIES
Figure A-10: XE30 discharge data to 10.02V at 25°C
2 min. 2381 224.8 7.5 79.3 645.3 21.5 224.7 7.5
5 min. 1565 142.8 11.9 130.3 424.0 35.3 147.6 12.3
10 min. 1017 90.6 15.4 172.9 275.6 46.8 95.9 16.3
15 min. 767 67.4 16.9 191.8 207.9 52.0 72.4 18.1
20 min. 622 54.2 17.9 205.4 168.6 55.7 58.7 19.4
30 min. 455 39.2 19.6 227.6 123.4 61.7 42.9 21.5
45 min. 328 28.1 21.0 245.9 88.9 66.6 30.9 23.2
1 hr. 258 21.9 21.9 258.3 70.0 70.0 24.4 24.4
2 hr. 142 11.9 23.8 283.7 38.4 76.9 13.4 26.8
3 hr. 98 8.3 24.8 294.9 26.6 79.9 9.3 27.8
4 hr. 76 6.4 25.5 304.4 20.6 82.5 7.2 28.7
5 hr. 62 5.2 25.9 309.4 16.8 83.8 5.8 29.2
8 hr. 41 3.4 27.0 323.8 11.0 87.7 3.8 30.5
10 hr. 33 2.75 27.5 330.8 9.0 89.6 3.1 31.2
20 hr. 18 1.5 29.6 354.6 4.8 96.1 1.7 33.5
Time Watts Amps Capacity Energy
(W) (A) (Ah) (Wh) W/litre Wh/litre W/kg Wh/kg
ENERGY AND POWER DENSITIES
Amps
10000
1000
100
10
Watts or amps per XE30 battery
1
0.01
0.1
Watts
1 10 100
Hours to 10.02V at 25°C (77°F)
Amps
10000
1000
100
10
Watts or amps per XE30 battery
1
0.01
0.1
Watts
1 10 100
Hours to 10.5V at 25°C (77°F)
Amps
10000
1000
100
10
Watts or amps per XE30 battery
1
0.01
0.1
Watts
1 10 100
Hours to 11.1V at 25°C (77°F)
Page 19

19
Figure A-13: XE40 discharge data to 9V at 25°C
Figure A-14: XE40 discharge data to 10.02V at 25°C
Figure A-15: XE40 discharge data to 10.5V at 25°C
2 min. 4338 436.6 14.5 144.4 777.0 25.9 269.4 9.0
5 min. 2370 226.1 18.8 197.4 424.5 35.4 147.2 12.3
10 min. 1497 136.5 23.2 254.4 268.1 45.6 93.0 15.8
15 min. 1123 100.3 25.1 280.6 201.1 50.3 69.7 17.4
20 min. 909 80.2 26.5 299.9 162.8 53.7 56.5 18.6
30 min. 665 58.0 29.0 332.3 119.1 59.5 41.3 20.6
45 min. 484 41.6 31.2 362.8 86.7 65.0 30.0 22.5
1 hr. 383 32.7 32.7 382.5 68.5 68.5 23.8 23.8
2 hr. 213 18.1 36.2 426.8 38.2 76.5 13.3 26.5
3 hr. 150 12.6 37.8 449.7 26.9 80.6 9.3 27.9
4 hr. 116 9.8 39.1 464.0 20.8 83.1 7.2 28.8
5 hr. 95 8.0 39.9 474.8 17.0 85.0 5.9 29.5
8 hr. 62 5.2 41.6 494.0 11.1 88.5 3.8 30.7
10 hr. 51 4.2 42.4 505.0 9.0 90.5 3.1 31.4
20 hr. 27 2.2 44.4 529.5 4.7 94.8 1.6 32.9
Time Watts Amps Capacity Energy
(W) (A) (Ah) (Wh) W/litre Wh/litre W/kg Wh/kg
ENERGY AND POWER DENSITIES
2 min. 3580 337.9 11.3 119.2 641.2 21.4 222.3 7.4
5 min. 2155 199.1 16.6 179.5 386.1 32.2 133.9 11.2
10 min. 1426 127.9 21.7 242.5 255.5 43.4 88.6 15.1
15 min. 1085 96.0 24.0 271.1 194.3 48.6 67.4 16.8
20 min. 884 77.5 25.6 291.6 158.3 52.2 54.9 18.1
30 min. 652 56.6 28.3 326.0 116.8 58.4 40.5 20.3
45 min. 476 40.8 30.6 356.7 85.2 63.9 29.5 22.2
1 hr. 376 32.1 32.1 376.3 67.4 67.4 23.4 23.4
2 hr. 209 17.7 35.4 418.2 37.5 74.9 13.0 26.0
3 hr. 146 12.3 36.9 438.7 26.2 78.6 9.1 27.2
4 hr. 113 9.5 37.9 451.8 20.2 80.9 7.0 28.1
5 hr. 93 7.7 38.6 462.5 16.6 82.9 5.7 28.7
8 hr. 60 5.0 40.1 481.8 10.8 86.3 3.7 29.9
10 hr. 49 4.1 40.8 490.3 8.8 87.8 3.0 30.5
20 hr. 26 2.2 43.0 518.5 4.6 92.9 1.6 32.2
Time Watts Amps Capacity Energy
(W) (A) (Ah) (Wh) W/litre Wh/litre W/kg Wh/kg
ENERGY AND POWER DENSITIES
2 min. 3232 296.4 9.9 107.6 578.9 19.3 200.7 6.7
5 min. 1987 179.6 15.0 165.5 355.9 29.6 123.4 10.3
10 min. 1350 119.4 20.3 229.4 241.7 41.1 83.8 14.2
15 min. 1010 90.9 22.7 260.0 186.3 46.6 64.6 16.2
20 min. 852 74.1 24.4 281.2 152.6 50.4 52.9 17.5
30 min. 633 54.7 27.3 316.6 113.4 56.7 39.3 19.7
45 min. 464 39.7 29.8 347.9 83.1 62.3 28.8 21.6
1 hr. 368 31.3 31.3 368.3 66.0 66.0 22.9 22.9
2 hr. 205 17.3 34.5 410.8 36.8 73.6 12.8 25.5
3 hr. 144 12.1 36.2 431.3 25.8 77.3 8.9 26.8
4 hr. 111 9.3 37.2 444.4 19.9 79.6 6.9 27.6
5 hr. 91 7.6 37.9 453.3 16.2 81.2 5.6 28.2
8 hr. 59 4.9 39.3 473.0 10.6 84.7 3.7 29.4
10 hr. 48 4.0 39.9 481.8 8.6 86.3 3.0 29.9
20 hr. 26 2.1 42.2 509.9 4.6 91.3 1.6 31.7
Time Watts Amps Capacity Energy
(W) (A) (Ah) (Wh) W/litre Wh/litre W/kg Wh/kg
ENERGY AND POWER DENSITIES
Amps
10000
1000
100
10
Watts or amps per XE40 battery
1
0.01
0.1
Watts
1 10 100
Hours to 9V at 25°C (77°F)
Amps
10000
1000
100
10
Watts or amps per XE40 battery
1
0.01
0.1
Watts
1 10 100
Hours to 10.02V at 25°C (77°F)
Amps
10000
1000
100
10
Watts or amps per XE40 battery
1
0.01
0.1
Watts
1 10 100
Hours to 10.5V at 25°C (77°F)
Page 20

20
www.enersys-emea.com
Figure A-16: XE40 discharge data to 11.1V at 25°C
2 min. 2814 249.4 8.3 93.7 504.1 16.8 174.8 5.8
5 min. 1753 153.6 12.8 146.0 314.0 26.2 108.9 9.1
10 min. 1234 106.6 18.1 209.9 221.1 37.6 76.7 13.0
15 min. 964 83.0 20.7 241.0 172.7 43.2 59.9 15.0
20 min. 802 68.5 22.6 264.5 143.6 47.4 49.8 16.4
30 min. 603 51.3 25.7 301.3 107.9 54.0 37.4 18.7
45 min. 445 37.6 28.2 333.8 79.7 59.8 27.6 20.7
1 hr. 355 29.9 29.9 354.6 63.5 63.5 22.0 22.0
2 hr. 200 16.8 33.5 399.7 35.8 71.6 12.4 24.8
3 hr. 140 11.7 35.0 420.2 25.1 75.3 8.7 26.1
4 hr. 109 9.0 36.2 434.6 19.5 77.8 6.7 27.0
5 hr. 89 7.4 36.9 444.1 15.9 79.6 5.5 27.6
8 hr. 58 4.8 38.3 461.2 10.3 82.6 3.6 28.6
10 hr. 47 3.9 38.9 469.6 8.4 84.1 2.9 29.2
20 hr. 25 2.1 41.0 495.2 4.4 88.7 1.5 30.8
Time Watts Amps Capacity Energy
(W) (A) (Ah) (Wh) W/litre Wh/litre W/kg Wh/kg
ENERGY AND POWER DENSITIES
Figure A-17: XE70 discharge data to 9V at 25°C
2 min. 6597 644.0 21.4 219.7 674.0 22.4 256.7 8.5
5 min. 4051 388.4 32.4 337.4 413.9 34.5 157.6 13.1
10 min. 2565 235.6 40.0 436.0 262.0 44.5 99.8 17.0
15 min. 1909 172.3 43.1 477.2 195.0 48.8 74.3 18.6
20 min. 1540 137.8 45.5 508.2 157.3 51.9 59.9 19.8
30 min. 1122 98.5 49.3 561.2 114.7 57.3 43.7 21.8
45 min. 804 70.0 52.5 603.1 82.2 61.6 31.3 23.5
1 hr. 627 54.7 54.6 627.2 64.1 64.1 24.4 24.4
2 hr. 342 29.6 59.2 683.4 34.9 69.8 13.3 26.6
3 hr. 235 20.5 61.4 705.9 24.0 72.1 9.2 27.5
4 hr. 181 15.7 62.6 721.8 18.4 73.7 7.0 28.1
5 hr. 146 12.8 63.8 729.0 14.9 74.5 5.7 28.4
8 hr. 93 8.2 65.7 743.5 9.5 76.0 3.6 28.9
10 hr. 75 6.7 66.6 752.0 7.7 76.8 2.9 29.3
20 hr. 38 3.5 69.3 764.3 3.9 78.1 1.5 29.7
Time Watts Amps Capacity Energy
(W) (A) (Ah) (Wh) W/litre Wh/litre W/kg Wh/kg
ENERGY AND POWER DENSITIES
Figure A-18: XE70 discharge data to 10.02V at 25°C
2 min. 5942 569.8 19.0 197.9 607.0 20.2 231.2 7.7
5 min. 3636 337.6 28.1 302.8 371.4 30.9 141.5 11.8
10 min. 2411 218.5 37.2 409.9 246.3 41.9 93.8 16.0
15 min. 1833 163.8 41.0 458.2 187.2 46.8 71.3 17.8
20 min. 1490 132.6 43.7 491.6 152.2 50.2 58.0 19.1
30 min. 1091 96.0 48.0 545.5 111.5 55.7 42.5 21.2
45 min. 786 68.6 51.4 589.1 80.2 60.2 30.6 22.9
1 hr. 615 53.6 53.6 615.4 62.9 62.9 23.9 23.9
2 hr. 333 28.9 57.8 666.1 34.0 68.1 13.0 25.9
3 hr. 229 19.9 59.6 687.5 23.4 70.2 8.9 26.8
4 hr. 175 15.2 61.0 699.7 17.9 71.5 6.8 27.2
5 hr. 142 12.4 61.8 707.6 14.5 72.3 5.5 27.5
8 hr. 90 8.0 63.6 719.0 9.2 73.5 3.5 28.0
10 hr. 73 6.5 64.5 727.6 7.4 74.3 2.8 28.3
20 hr. 37 3.4 67.9 748.4 3.8 76.5 1.5 29.1
Time Watts Amps Capacity Energy
(W) (A) (Ah) (Wh) W/litre Wh/litre W/kg Wh/kg
ENERGY AND POWER DENSITIES
Amps
10000
1000
100
10
Watts or amps per XE40 battery
1
0.01
0.1
Watts
1 10 100
Hours to 11.1V at 25°C (77°F)
Amps
10000
1000
100
10
Watts or amps per XE70 battery
1
0.01
0.1
Watts
1 10 100
Hours to 9V at 25°C (77°F)
Amps
10000
1000
100
10
Watts or amps per XE70 battery
1
0.01
0.1
Watts
1 10 100
Hours to 10.02V at 25°C (77°F)
Page 21

21
www.enersys-emea.com
Figure A-19: XE70 discharge data to 10.5V at 25°C
2 min. 5140 480.8 16.0 171.2 525.1 17.5 200.0 6.7
5 min. 3317 301.9 25.1 276.3 338.9 28.2 129.1 10.8
10 min. 2258 201.5 34.3 383.8 230.7 39.2 87.9 14.9
15 min. 1738 154.3 38.6 434.4 177.5 44.4 67.6 16.9
20 min. 1420 125.2 41.3 468.7 145.1 47.9 55.3 18.2
30 min. 1053 92.0 46.0 526.7 107.6 53.8 41.0 20.5
45 min. 761 66.3 49.7 570.4 77.7 58.3 29.6 22.2
1 hr. 600 52.1 52.1 599.9 61.3 61.3 23.3 23.3
2 hr. 327 28.4 56.7 653.8 33.4 66.8 12.7 25.4
3 hr. 225 19.6 58.7 674.6 23.0 68.9 8.7 26.2
4 hr. 172 15.0 60.2 687.5 17.6 70.2 6.7 26.7
5 hr. 139 12.2 60.7 695.3 14.2 71.0 5.4 27.1
8 hr. 89 7.8 62.6 709.2 9.1 72.5 3.4 27.6
10 hr. 72 6.4 63.5 715.3 7.3 73.1 2.8 27.8
20 hr. 37 3.3 66.4 730.0 3.7 74.6 1.4 28.4
Time Watts Amps Capacity Energy
(W) (A) (Ah) (Wh) W/litre Wh/litre W/kg Wh/kg
ENERGY AND POWER DENSITIES
Figure A-20: XE70 discharge data to 11.1V at 25°C
2 min. 3911 351.5 11.7 130.2 399.5 13.3 152.2 5.1
5 min. 2870 254.3 21.2 239.0 293.2 24.4 111.7 9.3
10 min. 2028 177.0 30.1 344.7 207.1 35.2 78.9 13.4
15 min. 1586 137.4 34.4 396.4 162.0 40.5 61.7 15.4
20 min. 1313 113.6 37.5 433.3 134.1 44.3 51.1 16.9
30 min. 984 85.2 42.6 492.2 100.6 50.3 38.3 19.2
45 min. 723 62.4 46.8 542.4 73.9 55.4 28.1 21.1
1 hr. 574 49.5 49.5 574.4 58.7 58.7 22.4 22.4
2 hr. 317 27.5 54.9 634.1 32.4 64.8 12.3 24.7
3 hr. 219 19.1 57.1 658.0 22.4 67.2 8.5 25.6
4 hr. 168 14.7 58.9 672.7 17.2 68.7 6.5 26.2
5 hr. 136 12.0 59.7 680.0 13.9 69.5 5.3 26.5
8 hr. 86 7.7 61.4 689.7 8.8 70.5 3.4 26.8
10 hr. 69 6.2 62.2 697.0 7.1 71.2 2.7 27.1
20 hr. 35 3.2 64.4 701.9 3.6 71.7 1.4 27.3
Time Watts Amps Capacity Energy
(W) (A) (Ah) (Wh) W/litre Wh/litre W/kg Wh/kg
ENERGY AND POWER DENSITIES
Figure A-21: XE95 discharge data to 9V at 25°C
2 min. 8787 903.7 30.1 292.9 696.5 23.2 250.3 8.3
5 min. 5263 491.0 40.9 438.6 417.2 34.8 149.9 12.5
10 min. 3371 304.5 50.8 561.8 267.2 44.5 96.0 16.0
15 min. 2578 228.8 57.2 644.6 204.4 51.1 73.5 18.4
20 min. 2089 183.5 61.2 696.4 165.6 55.2 59.5 19.8
30 min. 1539 133.5 66.8 769.5 122.0 61.0 43.8 21.9
45 min. 1112 95.5 71.6 833.9 88.1 66.1 31.7 23.8
1 hr. 885 75.5 75.5 885.0 70.1 70.1 25.2 25.2
2 hr. 486 41.1 82.2 972.0 38.5 77.0 13.8 27.7
3 hr. 342 28.6 85.8 1026.0 27.1 81.3 9.7 29.2
4 hr. 264 22.3 89.2 1056.0 20.9 83.7 7.5 30.1
5 hr. 216 18.2 91.0 1080.0 17.1 85.6 6.2 30.8
8 hr. 142 12.0 96.0 1132.8 11.2 89.8 4.0 32.3
10 hr. 116 9.8 98.0 1158.0 9.2 91.8 3.3 33.0
20 hr. 63 5.3 106.0 1260.0 5.0 100.0 1.8 35.9
Time Watts Amps Capacity Energy
(W) (A) (Ah) (Wh) W/litre Wh/litre W/kg Wh/kg
ENERGY AND POWER DENSITIES
Amps
10000
1000
100
10
Watts or amps per XE70 battery
1
0.01
0.1
Watts
1 10 100
Hours to 10.5V at 25°C (77°F)
Amps
10000
1000
100
10
Watts or amps per XE70 battery
1
0.01
0.1
Watts
1 10 100
Hours to 11.1V at 25°C (77°F)
Amps
10000
1000
100
10
Watts or amps per XE95 battery
1
0.01
0.1
Watts
1 10 100
Hours to 9V at 25°C (77°F)
Page 22

22
www.enersys-emea.com
Figure A-22: XE95 discharge data to 10.02V at 25°C
Figure A-23: XE95 discharge data to 10.5V at 25°C
2 min. 7390 707.0 23.6 246.3 585.8 19.5 210.5 7.0
5 min. 4883 449.5 37.5 407.0 387.1 32.3 139.1 11.6
10 min. 3242 290.7 48.5 540.3 257.0 42.8 92.4 15.4
15 min. 2482 219.5 54.9 620.4 196.7 49.2 70.7 17.7
20 min. 2020 177.0 59.0 673.2 160.1 53.4 57.5 19.2
30 min. 1494 129.5 64.8 747.0 118.4 59.2 42.6 21.3
45 min. 1082 92.8 69.6 811.4 85.7 64.3 30.8 23.1
1 hr. 862 73.5 73.5 861.6 68.3 68.3 24.5 24.5
2 hr. 478 40.2 80.4 955.2 37.9 75.7 13.6 27.2
3 hr. 335 28.1 84.3 1004.4 26.5 79.6 9.5 28.6
4 hr. 260 21.8 87.2 1039.2 20.6 82.4 7.4 29.6
5 hr. 212 17.8 89.0 1062.0 16.8 84.2 6.1 30.3
8 hr. 140 11.7 93.6 1118.4 11.1 88.7 4.0 31.9
10 hr. 114 9.6 96.0 1140.0 9.0 90.4 3.2 32.5
20 hr. 61 5.2 104.0 1224.0 4.9 97.0 1.7 34.9
Time Watts Amps Capacity Energy
(W) (A) (Ah) (Wh) W/litre Wh/litre W/kg Wh/kg
ENERGY AND POWER DENSITIES
2 min. 6300 585.0 19.5 210.0 499.4 16.6 179.5 6.0
5 min. 4427 399.9 33.3 368.9 350.9 29.2 126.1 10.5
10 min. 3036 268.9 44.8 506.0 240.7 40.1 86.5 14.4
15 min. 2358 206.6 51.7 589.5 186.9 46.7 67.2 16.8
20 min. 1935 168.3 56.1 645.0 153.4 51.1 55.1 18.4
30 min. 1445 124.5 62.3 722.7 114.6 57.3 41.2 20.6
45 min. 1054 90.0 57.5 790.2 83.5 62.6 30.0 22.5
1 hr. 842 81.6 71.6 842.4 66.8 66.8 24.0 24.0
2 hr. 469 39.4 78.8 938.4 37.2 74.4 13.4 26.7
3 hr. 329 27.6 82.8 988.2 26.1 78.3 9.4 28.2
4 hr. 256 21.4 85.6 1022.4 20.3 81.0 7.3 29.1
5 hr. 209 17.5 87.5 1047.0 16.6 83.0 6.0 29.8
8 hr. 137 11.5 92.0 1099.2 10.9 87.1 3.9 31.3
10 hr. 112 9.4 94.0 1122.0 8.9 88.9 3.2 32.0
20 hr. 61 5.1 102.0 1212.0 4.8 96.1 1.7 34.5
Time Watts Amps Capacity Energy
(W) (A) (Ah) (Wh) W/litre Wh/litre W/kg Wh/kg
ENERGY AND POWER DENSITIES
Figure A-24: XE95 discharge data to 11.1V at 25°C
2 min. 4810 431.9 14.4 160.3 381.3 12.7 137.0 4.6
5 min. 3681 323.1 26.9 306.8 291.8 24.3 104.9 8.7
10 min. 2656 229.8 38.3 442.7 210.5 35.1 75.7 12.6
15 min. 2115 181.6 45.4 528.8 167.6 41.9 60.3 15.1
20 min. 1762 150.6 50.2 587.4 139.7 46.6 50.2 16.7
30 min. 1341 113.9 57.0 670.5 106.3 53.1 38.2 19.1
45 min. 993 83.9 62.9 744.8 78.7 59.0 28.3 21.2
1 hr. 801 67.5 67.5 801.0 63.5 63.5 22.8 22.8
2 hr. 453 37.9 75.8 906.0 35.9 71.8 12.9 25.8
3 hr. 320 26.7 80.1 959.4 25.3 76.0 9.1 27.3
4 hr. 248 20.8 83.2 993.6 19.7 78.8 7.1 28.3
5 hr. 203 17.0 85.0 1017.0 16.1 80.6 5.8 29.0
8 hr. 133 11.1 88.8 1065.6 10.6 84.5 3.8 30.4
10 hr. 109 9.1 91.0 1086.0 8.6 86.1 3.1 30.9
20 hr. 58 4.8 96.0 1164.0 4.6 92.3 1.7 33.2
Time Watts Amps Capacity Energy
(W) (A) (Ah) (Wh) W/litre Wh/litre W/kg Wh/kg
ENERGY AND POWER DENSITIES
Amps
10000
1000
100
10
Watts or amps per XE95 battery
1
0.01
0.1
Watts
1 10 100
Hours to 10.02V at 25°C (77°F)
Amps
10000
1000
100
10
Watts or amps per XE95 battery
1
0.01
0.1
Watts
1 10 100
Hours to 10.5V at 25°C (77°F)
Amps
10000
1000
100
10
Watts or amps per XE95 battery
1
0.01
0.1
Watts
1 10 100
Hours to 11.1V at 25°C (77°F)
Page 23

23
www.enersys-emea.com
Figure B-1: 13EP discharge data to 9V at 25°C
Figure B-2: 13EP discharge data to 10.02V at 25°C
2 min. 1437 149.6 5.0 47.9 756.2 25.2 293.3 9.8
5 min. 791 76.7 6.4 65.9 416.3 34.7 161.4 13.4
10 min. 488 45.3 7.7 83.0 256.8 43.7 99.6 16.9
15 min. 364 33.0 8.3 91.0 191.6 47.9 74.3 18.6
20 min. 293 26.2 8.7 97.6 154.2 51.3 59.8 19.9
30 min. 215 18.9 9.5 107.5 113.1 56.6 43.9 21.9
45 min. 156 13.5 10.1 117.0 82.1 61.6 31.8 23.9
1 hr. 124 10.6 10.6 124.0 65.3 65.3 25.3 25.3
2 hr. 69 5.8 11.6 138.0 36.3 72.6 14.1 28.2
3 hr. 49 4.1 12.3 147.0 25.8 77.4 10.0 30.0
4 hr. 38 3.2 12.8 152.0 20.0 80.0 7.8 31.0
5 hr. 31 2.6 13.0 155.0 16.3 81.6 6.3 31.6
8 hr. 20 1.7 13.6 160.0 10.5 84.2 4.1 32.7
10 hr. 16 1.4 14.0 160.0 8.4 84.2 3.3 32.7
20 hr. 8 0.7 14.0 160.0 4.2 84.2 1.6 32.7
Time Watts Amps Capacity Energy
(W) (A) (Ah) (Wh) W/litre Wh/litre W/kg Wh/kg
ENERGY AND POWER DENSITIES
2 min. 1268.0 123.9 4.1 42.2 667.3 22.2 258.8 8.6
5 min. 758.0 70.8 5.9 63.1 398.9 33.2 154.7 12.9
10 min. 482.0 43.6 7.4 81.9 253.7 43.1 98.4 16.7
15 min. 361.0 32.2 8.1 90.3 190.0 47.5 73.7 18.4
20 min. 292.0 25.7 8.6 97.2 153.7 51.2 59.6 19.8
30 min. 214.0 18.6 9.3 107.0 112.6 56.3 43.7 21.8
45 min. 154.0 13.2 9.9 115.5 81.0 60.8 31.4 23.6
1 hr. 121.0 10.4 10.4 121.0 63.7 63.7 24.7 24.7
2 hr. 67.0 5.7 11.4 134.0 35.3 70.5 13.7 27.3
3 hr. 47.0 3.9 11.7 141.0 24.7 74.2 9.6 28.8
4 hr. 36.0 3.0 12.0 144.0 18.9 75.8 7.3 29.4
5 hr. 29.0 2.5 12.5 145.0 15.3 76.3 5.9 29.6
8 hr. 19.0 1.6 12.8 152.0 10.0 80.0 3.9 31.0
10 hr. 16.0 1.3 13.0 160.0 8.4 84.2 3.3 32.7
20 hr. 8.0 0.7 14.0 160.0 4.2 84.2 1.6 32.7
Time Watts Amps Capacity Energy
(W) (A) (Ah) (Wh) W/litre Wh/litre W/kg Wh/kg
ENERGY AND POWER DENSITIES
Figure B-3: 13EP discharge data to 10.5V at 25°C
2 min. 1153.0 108.6 3.6 38.4 606.8 20.2 235.3 7.8
5 min. 715.0 65.5 5.5 59.6 376.3 31.3 145.9 12.2
10 min. 463.0 41.4 7.0 78.7 243.7 41.4 94.5 16.1
15 min. 349.0 30.9 7.7 87.3 183.7 45.9 71.2 17.8
20 min. 283.0 24.8 8.3 94.2 148.9 49.6 57.8 19.2
30 min. 208.0 18.0 9.0 104.0 109.5 54.7 42.4 21.2
45 min. 151.0 12.9 9.7 113.3 79.5 59.6 30.8 23.1
1 hr. 119.0 10.1 10.1 119.0 62.6 62.6 24.3 24.3
2 hr. 66.0 5.5 11.0 132.0 34.7 69.5 13.5 26.9
3 hr. 46.0 3.8 11.4 138.0 24.2 72.6 9.4 28.2
4 hr. 36.0 3.0 12.0 144.0 18.9 75.8 7.3 29.4
5 hr. 29.0 2.4 12.0 145.0 15.3 76.3 5.9 29.6
8 hr. 19.0 1.6 12.8 152.0 10.0 80.0 3.9 31.0
10 hr. 16.0 1.3 13.0 160.0 8.4 84.2 3.3 32.7
20 hr. 8.0 0.7 14.0 160.0 4.2 84.2 1.6 32.7
Time Watts Amps Capacity Energy
(W) (A) (Ah) (Wh) W/litre Wh/litre W/kg Wh/kg
ENERGY AND POWER DENSITIES
Appendix B
- Genesis®EP Discharge Rates
Amps
10000
1000
100
10
Watts or amps per 13EP
1
0.1
0.01
0.1
Watts
110
Hours to 9V at 25°C (77°F)
Amps
10000
1000
100
10
Watts or amps per 13EP
1
0.1
0.01
0.1
Watts
110
Hours to 10.02V at 25°C (77°F)
100
100
Amps
10000
1000
100
10
Watts or amps per 13EP
1
0.1
0.01
0.1
Watts
110
Hours to 10.5V at 25°C (77°F)
100
Page 24

24
www.enersys-emea.com
Figure B-4: 13EP discharge data to 11.1V at 25°C
Figure B-5: 16EP discharge data to 9V at 25°C
Figure B-6: 16EP discharge data to 10.02V at 25°C
2 min. 1001.0 89.2 3.0 33.3 526.8 17.5 204.3 6.8
5 min. 647.0 57.8 4.8 53.9 340.5 28.4 132.0 11.0
10 min. 428.0 37.9 6.4 72.8 225.2 38.3 87.3 14.8
15 min. 328.0 28.8 7.2 82.0 172.6 43.2 66.9 16.7
20 min. 268.0 23.3 7.8 89.2 141.0 47.0 54.7 18.2
30 min. 199.0 17.1 8.6 99.5 104.7 52.4 40.6 20.3
45 min. 145.0 12.4 9.3 108.8 76.3 57.2 29.6 22.2
1 hr. 115.0 9.7 9.7 115.0 60.5 60.5 23.5 23.5
2 hr. 64.0 5.3 10.6 128.0 33.7 67.4 13.1 26.1
3 hr. 45.0 3.7 11.1 135.0 23.7 71.0 9.2 27.6
4 hr. 35.0 2.9 11.6 140.0 18.4 73.7 7.1 28.6
5 hr. 29.0 2.3 11.5 145.0 15.3 76.3 5.9 29.6
8 hr. 19.0 1.5 12.0 152.0 10.0 80.0 3.9 31.0
10 hr. 15.0 1.2 12.0 150.0 7.9 78.9 3.1 30.6
20 hr. 8.0 0.7 14.0 160.0 4.2 84.2 1.6 32.7
Time Watts Amps Capacity Energy
(W) (A) (Ah) (Wh) W/litre Wh/litre W/kg Wh/kg
ENERGY AND POWER DENSITIES
2 min. 1900 195.7 6.5 63.3 817.0 27.2 311.5 10.4
5 min. 1028 98.4 8.2 85.6 442.0 36.8 168.5 14.0
10 min. 624 57.2 9.5 104.0 268.3 44.7 102.3 17.1
15 min. 460 41.3 10.3 115.0 197.8 49.5 75.4 18.9
20 min. 368 32.7 10.9 122.7 158.2 52.7 60.3 20.1
30 min. 268 23.4 11.7 134.0 115.2 57.6 43.9 22.0
45 min. 192 16.6 12.5 144.0 82.6 61.9 31.5 23.6
1 hr. 151 13.0 13.0 151.0 64.9 64.9 24.8 24.8
2 hr. 83 7.1 14.2 166.0 35.7 71.4 13.6 27.2
3 hr. 58 4.9 14.7 174.0 24.9 74.8 9.5 28.5
4 hr. 45 3.8 15.2 180.0 19.4 77.4 7.4 29.5
5 hr. 37 3.1 15.5 185.0 15.9 79.6 6.1 30.3
8 hr. 24 2.0 16.0 192.0 10.3 82.6 3.9 31.5
10 hr. 19 1.6 16.0 190.0 8.2 81.7 3.1 31.1
20 hr. 10 0.8 16.0 200.0 4.3 86.0 1.6 32.8
Time Watts Amps Capacity Energy
(W) (A) (Ah) (Wh) W/litre Wh/litre W/kg Wh/kg
ENERGY AND POWER DENSITIES
2 min. 1674 161.2 5.4 55.7 719.8 24.0 274.4 9.1
5 min. 976 90.0 7.5 81.3 419.7 35.0 160.0 13.3
10 min. 610 54.8 9.1 101.7 262.3 43.7 100.0 16.7
15 min. 454 40.1 10.0 113.5 195.2 48.8 74.4 18.6
20 min. 364 32.0 10.7 121.3 156.5 52.2 59.7 19.9
30 min. 265 23.0 11.5 132.5 114.0 57.0 43.4 21.7
45 min. 190 16.3 12.2 142.5 81.7 61.3 31.1 23.4
1 hr. 149 12.7 12.7 149.0 64.1 64.1 24.4 24.4
2 hr. 82 6.9 13.8 164.0 35.3 70.5 13.4 26.9
3 hr. 57 4.8 14.4 171.0 24.5 73.5 9.3 28.0
4 hr. 44 3.7 14.8 176.0 18.9 75.7 7.2 28.9
5 hr. 36 3.0 15.0 180.0 15.5 77.4 5.9 29.5
8 hr. 23 2.0 16.0 184.0 9.9 79.1 3.8 30.2
10 hr. 19 1.6 16.0 190.0 8.2 81.7 3.1 31.1
20 hr. 10 0.8 16.0 200.0 4.3 86.0 1.6 32.8
Time Watts Amps Capacity Energy
(W) (A) (Ah) (Wh) W/litre Wh/litre W/kg Wh/kg
ENERGY AND POWER DENSITIES
Amps
10000
1000
100
10
Watts or amps per 13EP
1
0.1
0.01
0.1
Watts
110
Hours to 11.1V at 25°C (77°F)
100
Amps
10000
1000
100
10
Watts or amps per 16EP
1
0.1
0.01
0.1
Watts
110
Hours to 9V at 25°C (77°F)
Amps
10000
1000
100
10
Watts or amps per 16EP
1
0.1
0.01
0.1
Watts
110
Hours to 10.02V at 25°C (77°F)
100
100
Page 25

25
www.enersys-emea.com
Figure B-7: 16EP discharge data to 10.5V at 25°C
Figure B-8: 16EP discharge data to 11.1V at 25°C
2 min. 1502 140.0 4.7 50.0 645.9 21.5 246.2 8.2
5 min. 919 83.0 6.9 76.6 395.2 32.9 150.7 12.5
10 min. 587 52.0 8.7 97.9 252.4 42.1 96.2 16.0
15 min. 441 38.6 9.7 110.3 189.6 47.4 72.3 18.1
20 min. 356 30.9 10.3 118.7 153.1 51.0 58.4 19.5
30 min. 260 22.3 11.2 130.0 111.8 55.9 42.6 21.3
45 min. 187 15.9 11.9 140.3 80.4 60.3 30.7 23.0
1 hr. 147 12.5 12.5 147.0 63.2 63.2 24.1 24.1
2 hr. 81 6.8 13.6 162.0 34.8 69.7 13.3 26.6
3 hr. 56 4.7 14.1 168.0 24.1 72.2 9.2 27.5
4 hr. 43 3.6 14.4 172.0 18.5 74.0 7.0 28.2
5 hr. 35 3.0 15.0 175.0 15.1 75.3 5.7 28.7
8 hr. 23 1.9 15.2 184.0 9.9 79.1 3.8 30.2
10 hr. 19 1.6 16.0 190.0 8.2 81.7 3.1 31.1
20 hr. 10 0.8 16.0 200.0 4.3 86.0 1.6 32.8
Time Watts Amps Capacity Energy
(W) (A) (Ah) (Wh) W/litre Wh/litre W/kg Wh/kg
ENERGY AND POWER DENSITIES
2 min. 1267 113.2 3.8 42.2 544.8 18.1 207.7 6.9
5 min. 832 72.9 6.1 69.3 357.8 29.8 136.4 11.4
10 min. 551 47.6 7.9 91.9 236.9 39.5 90.3 15.1
15 min. 419 36.0 9.0 104.8 180.2 45.0 68.7 17.2
20 min. 341 29.1 9.7 113.7 146.6 48.9 55.9 18.6
30 min. 251 21.3 10.7 125.5 107.9 54.0 41.1 20.6
45 min. 181 15.3 11.5 135.8 77.8 58.4 29.7 22.3
1 hr. 143 12.0 12.0 143.0 61.5 61.5 23.4 23.4
2 hr. 79 6.6 13.2 158.0 34.0 67.9 13.0 25.9
3 hr. 55 4.6 13.8 165.0 23.7 71.0 9.0 27.0
4 hr. 43 3.5 14.0 172.0 18.5 74.0 7.0 28.2
5 hr. 35 2.9 14.5 175.0 15.1 75.3 5.7 28.7
8 hr. 23 1.9 15.2 184.0 9.9 79.1 3.8 30.2
10 hr. 19 1.5 15.0 190.0 8.2 81.7 3.1 31.1
20 hr. 10 0.8 16.0 200.0 4.3 86.0 1.6 32.8
Time Watts Amps Capacity Energy
(W) (A) (Ah) (Wh) W/litre Wh/litre W/kg Wh/kg
ENERGY AND POWER DENSITIES
Figure B-9: 26EP discharge data to 9V at 25°C
2 min. 2898 302.4 10.1 96.5 785.3 26.2 286.9 9.6
5 min. 1674 162.2 13.5 139.4 453.6 37.8 165.7 13.8
10 min. 1045 96.9 16.2 174.2 283.2 47.2 103.5 17.2
15 min. 778 70.6 17.7 194.5 210.8 52.7 77.0 19.3
20 min. 625 56.0 18.7 208.3 169.4 56.4 61.9 20.6
30 min. 454 40.0 20.0 227.0 123.0 61.5 45.0 22.5
45 min. 326 28.4 21.3 244.5 88.3 66.3 32.3 24.2
1 hr. 256 22.1 22.1 256.0 69.4 69.4 25.3 25.3
2 hr. 140 11.9 23.8 280.0 37.9 75.9 13.9 27.7
3 hr. 97 8.3 24.9 291.0 26.3 78.9 9.6 28.8
4 hr. 75 6.3 25.2 300.0 20.3 81.3 7.4 29.7
5 hr. 61 5.1 25.5 305.0 16.5 82.6 6.0 30.2
8 hr. 39 3.3 26.4 312.0 10.6 84.5 3.9 30.9
10 hr. 32 2.7 27.0 320.0 8.7 86.7 3.2 31.7
20 hr. 16 1.4 28.0 320.0 4.3 86.7 1.6 31.7
Time Watts Amps Capacity Energy
(W) (A) (Ah) (Wh) W/litre Wh/litre W/kg Wh/kg
ENERGY AND POWER DENSITIES
Amps
10000
1000
100
10
Watts or amps per 16EP
1
0.1
0.01
0.1
Watts
110
Hours to 10.5V at 25°C (77°F)
100
Amps
10000
1000
100
10
Watts or amps per 16EP
1
0.1
0.01
0.1
Watts
110
Hours to 11.1V at 25°C (77°F)
Amps
10000
1000
100
Watts or amps per 26EP
10
1
0.01
0.1
Watts
110
Hours to 9V at 25°C (77°F)
100
100
Page 26

26
www.enersys-emea.com
Figure B-10: 26EP discharge data to 10.02V at 25°C
2 min. 2419 235.8 7.9 80.6 655.5 21.8 239.5 8.0
5 min. 1532 143.4 11.9 127.6 415.1 34.6 151.7 12.6
10 min. 995 90.7 15.1 165.9 269.6 44.9 98.5 16.4
15 min. 751 67.4 16.9 187.8 203.5 50.9 74.4 18.6
20 min. 607 54.1 18.0 202.3 164.5 54.8 60.1 20.0
30 min. 444 39.0 19.5 222.0 120.3 60.2 44.0 22.0
45 min. 319 27.8 20.9 239.3 86.4 64.8 31.6 23.7
1 hr. 251 21.7 21.7 251.0 68.0 68.0 24.9 24.9
2 hr. 137 11.7 23.4 274.0 37.1 74.2 13.6 27.1
3 hr. 95 8.0 24.0 285.0 25.7 77.2 9.4 28.2
4 hr. 73 6.1 24.4 292.0 19.8 79.1 7.2 28.9
5 hr. 59 5.0 25.0 295.0 16.0 79.9 5.8 29.2
8 hr. 38 3.2 25.6 304.0 10.3 82.4 3.8 30.1
10 hr. 31 2.6 26.0 310.0 8.4 84.0 3.1 30.7
20 hr. 16 1.4 28.0 320.0 4.3 86.7 1.6 31.7
Time Watts Amps Capacity Energy
(W) (A) (Ah) (Wh) W/litre Wh/litre W/kg Wh/kg
ENERGY AND POWER DENSITIES
Figure B-11: 26EP discharge data to 10.5V at 25°C
Figure B-12: 26EP discharge data to 11.1V at 25°C
2 min. 2141 200.9 6.7 71.3 580.2 19.3 212.0 7.1
5 min. 1424 129.9 10.8 118.6 385.9 32.1 141.0 11.7
10 min. 947 84.7 14.1 157.9 256.6 42.8 93.8 15.6
15 min. 721 63.8 16.0 180.3 195.4 48.8 71.4 17.8
20 min. 587 51.5 17.2 195.6 159.1 53.0 58.1 19.4
30 min. 431 37.5 18.8 215.5 116.8 58.4 42.7 21.3
45 min. 311 26.9 20.2 233.3 84.3 63.2 30.8 23.1
1 hr. 245 21.0 21.0 245.0 66.4 66.4 24.3 24.3
2 hr. 134 11.3 22.6 268.0 36.3 72.6 13.3 26.5
3 hr. 93 7.8 23.4 279.0 25.2 75.6 9.2 27.6
4 hr. 71 6.0 24.0 284.0 19.2 77.0 7.0 28.1
5 hr. 58 4.9 24.5 290.0 15.7 78.6 5.7 28.7
8 hr. 37 3.1 24.8 296.0 10.0 80.2 3.7 29.3
10 hr. 31 2.5 25.0 310.0 8.4 84.0 3.1 30.7
20 hr. 16 1.3 26.0 320.0 4.3 86.7 1.6 31.7
Time Watts Amps Capacity Energy
(W) (A) (Ah) (Wh) W/litre Wh/litre W/kg Wh/kg
ENERGY AND POWER DENSITIES
2 min. 1795 159.4 5.3 59.8 486.4 16.2 177.7 5.9
5 min. 1273 111.4 9.3 106.0 345.0 28.7 126.0 10.5
10 min. 876 75.8 12.6 146.0 237.4 39.6 86.7 14.5
15 min. 677 58.2 14.6 169.3 183.5 45.9 67.0 16.8
20 min. 555 47.5 15.8 185.0 150.4 50.1 55.0 18.3
30 min. 412 35.0 17.5 206.0 111.6 55.8 40.8 20.4
45 min. 299 25.3 19.0 224.3 81.0 60.8 29.6 22.2
1 hr. 236 19.9 19.9 236.0 64.0 64.0 23.4 23.4
2 hr. 130 10.8 21.6 260.0 35.2 70.5 12.9 25.7
3 hr. 90 7.5 22.5 270.0 24.4 73.2 8.9 26.7
4 hr. 69 5.7 22.8 276.0 18.7 74.8 6.8 27.3
5 hr. 56 4.7 23.5 280.0 15.2 75.9 5.5 27.7
8 hr. 37 3.0 24.0 296.0 10.0 80.2 3.7 29.3
10 hr. 29 2.4 24.0 290.0 7.9 78.6 2.9 28.7
20 hr. 16 1.3 26.0 320.0 4.3 86.7 1.6 31.7
Time Watts Amps Capacity Energy
(W) (A) (Ah) (Wh) W/litre Wh/litre W/kg Wh/kg
ENERGY AND POWER DENSITIES
Amps
10000
1000
100
Watts or amps per 26EP
10
1
0.01
Watts
0.1
Hours to 10.02V at 25°C (77°F)
110
100
Amps
10000
1000
100
Watts or amps per 26EP
10
1
0.01
Watts
0.1
Hours to 10.5V at 25°C (77°F)
110
Amps
10000
1000
100
Watts or amps per 26EP
10
1
0.01
Watts
0.1
Hours to 11.1V at 25°C (77°F)
110
100
100
Page 27

27
www.enersys-emea.com
Figure B-13: 42EP discharge data to 9V at 25°C
2 min. 4046 417.0 13.9 134.7 724.8 24.1 271.5 9.0
5 min. 2498 240.5 20.0 208.1 447.5 37.3 167.7 14.0
10 min. 1607 148.3 24.7 267.9 287.9 48.0 107.9 18.0
15 min. 1210 109.2 27.3 302.5 216.7 54.2 81.2 20.3
20 min. 979 87.2 29.1 326.3 175.4 58.5 65.7 21.9
30 min. 716 62.7 31.4 358.0 128.3 64.1 48.1 24.0
45 min. 516 44.6 33.5 387.0 92.4 69.3 34.6 26.0
1 hr. 406 34.8 34.8 406.0 72.7 72.7 27.2 27.2
2 hr. 223 18.8 37.6 446.0 39.9 79.9 15.0 29.9
3 hr. 155 13.1 39.3 465.0 27.8 83.3 10.4 31.2
4 hr. 119 10.0 40.0 476.0 21.3 85.3 8.0 31.9
5 hr. 98 8.2 41.0 490.0 17.6 87.8 6.6 32.9
8 hr. 64 5.3 42.4 512.0 11.5 91.7 4.3 34.4
10 hr. 52 4.3 43.0 520.0 9.3 93.1 3.5 34.9
20 hr. 28 2.3 46.0 560.0 5.0 100.3 1.9 37.6
Time Watts Amps Capacity Energy
(W) (A) (Ah) (Wh) W/litre Wh/litre W/kg Wh/kg
ENERGY AND POWER DENSITIES
Figure B-14: 42EP discharge data to 10.02V at 25°C
2 min. 3317 322.3 10.7 110.5 594.2 19.8 222.6 7.4
5 min. 2291 212.0 17.7 190.8 410.4 34.2 153.8 12.8
10 min. 1540 138.4 23.1 256.7 275.9 46.0 103.4 17.2
15 min. 1173 104.1 26.0 293.3 210.1 52.5 78.7 19.7
20 min. 953 83.8 27.9 317.6 170.7 56.9 64.0 21.3
30 min. 698 60.8 30.4 349.0 125.0 62.5 46.8 23.4
45 min. 502 43.3 32.5 376.5 89.9 67.4 33.7 25.3
1 hr. 394 33.8 33.8 394.0 70.6 70.6 26.4 26.4
2 hr. 215 18.2 36.4 430.0 38.5 77.0 14.4 28.9
3 hr. 149 12.6 37.8 447.0 26.7 80.1 10.0 30.0
4 hr. 115 9.7 38.8 460.0 20.6 82.4 7.7 30.9
5 hr. 94 7.9 39.5 470.0 16.8 84.2 6.3 31.5
8 hr. 62 5.1 40.8 496.0 11.1 88.8 4.2 33.3
10 hr. 51 4.2 42.0 510.0 9.1 91.4 3.4 34.2
20 hr. 28 2.3 46.0 560.0 5.0 100.3 1.9 37.6
Time Watts Amps Capacity Energy
(W) (A) (Ah) (Wh) W/litre Wh/litre W/kg Wh/kg
ENERGY AND POWER DENSITIES
Figure B-15: 42EP discharge data to 10.5V at 25°C
2 min. 2978 279.9 9.3 99.2 533.5 17.8 199.9 6.7
5 min. 2130 193.0 16.1 177.4 381.6 31.8 143.0 11.9
10 min. 1461 129.4 21.6 243.5 261.7 43.6 98.1 16.3
15 min. 1124 98.5 24.6 281.0 201.3 50.3 75.4 18.9
20 min. 919 80.0 26.7 306.3 164.6 54.9 61.7 20.6
30 min. 678 58.5 29.3 339.0 121.5 60.7 45.5 22.8
45 min. 491 42.0 31.5 368.3 88.0 66.0 33.0 24.7
1 hr. 386 32.9 32.9 386.0 69.1 69.1 25.9 25.9
2 hr. 212 17.9 35.8 424.0 38.0 76.0 14.2 28.5
3 hr. 147 12.4 37.2 441.0 26.3 79.0 9.9 29.6
4 hr. 113 9.5 38.0 452.0 20.2 81.0 7.6 30.3
5 hr. 93 7.7 38.5 465.0 16.7 83.3 6.2 31.2
8 hr. 61 5.0 40.0 488.0 10.9 87.4 4.1 32.8
10 hr. 50 4.1 41.0 500.0 9.0 89.6 3.4 33.6
20 hr. 28 2.3 46.0 560.0 5.0 100.3 1.9 37.6
Time Watts Amps Capacity Energy
(W) (A) (Ah) (Wh) W/litre Wh/litre W/kg Wh/kg
ENERGY AND POWER DENSITIES
Amps
10000
1000
100
Watts or amps per 42EP
10
1
0.01
0.1
Watts
110
Hours to 9V at 25°C (77°F)
100
Amps
10000
1000
100
Watts or amps per 42EP
10
1
0.01
0.1
Watts
110
Hours to 10.02V at 25°C (77°F)
Amps
10000
1000
100
Watts or amps per 42EP
10
1
0.01
0.1
Watts
110
Hours to 10.5V at 25°C (77°F)
100
100
Page 28

28
www.enersys-emea.com
Figure B-16: 42EP discharge data to 11.1V at 25°C
Figure B-17: 70EP discharge data to 9V at 25°C
Figure B-18: 70EP discharge data to 10.02V at 25°C
2 min. 2581 231.2 7.7 85.9 462.3 15.4 173.2 5.8
5 min. 1901 167.4 13.9 158.4 340.5 28.4 127.6 10.6
10 min. 1338 116.1 19.4 223.0 239.7 40.0 89.8 15.0
15 min. 1046 90.0 22.5 261.5 187.4 46.8 70.2 17.6
20 min. 863 73.9 24.6 287.6 154.6 51.5 57.9 19.3
30 min. 646 54.9 27.5 323.0 115.7 57.9 43.4 21.7
45 min. 473 39.9 29.9 354.8 84.7 63.5 31.7 23.8
1 hr. 376 31.5 31.5 376.0 67.4 67.4 25.2 25.2
2 hr. 208 17.3 34.6 416.0 37.3 74.5 14.0 27.9
3 hr. 145 12.1 36.3 435.0 26.0 77.9 9.7 29.2
4 hr. 112 9.3 37.2 448.0 20.1 80.3 7.5 30.1
5 hr. 91 7.6 38.0 455.0 16.3 81.5 6.1 30.5
8 hr. 59 4.9 39.2 472.0 10.6 84.6 4.0 31.7
10 hr. 48 4.0 40.0 480.0 8.6 86.0 3.2 32.2
20 hr. 26 2.2 44.0 520.0 4.7 93.1 1.7 34.9
Time Watts Amps Capacity Energy
(W) (A) (Ah) (Wh) W/litre Wh/litre W/kg Wh/kg
2 min. 6186 655.5 21.8 206.0 632.0 21.0 254.6 8.5
5 min. 3924 380.3 31.7 326.9 400.9 33.4 161.5 13.5
10 min. 2552 235.0 39.2 425.4 260.7 43.5 105.0 17.5
15 min. 1926 173.1 43.3 481.5 196.8 49.2 79.3 19.8
20 min. 1560 138.2 46.1 519.9 159.4 53.1 64.2 21.4
30 min. 1143 99.6 49.8 571.5 116.8 58.4 47.0 23.5
45 min. 822 70.7 53.0 616.5 84.0 63.0 33.8 25.4
1 hr. 644 55.0 55.0 644.0 65.8 65.8 26.5 26.5
2 hr. 349 29.5 59.0 698.0 35.7 71.3 14.4 28.7
3 hr. 241 20.3 60.9 723.0 24.6 73.9 9.9 29.8
4 hr. 185 15.6 62.4 740.0 18.9 75.6 7.6 30.5
5 hr. 151 12.6 63.0 755.0 15.4 77.1 6.2 31.1
8 hr. 97 8.1 64.8 776.0 9.9 79.3 4.0 31.9
10 hr. 79 6.6 66.0 790.0 8.1 80.7 3.3 32.5
20 hr. 41 3.5 70.0 820.0 4.2 83.8 1.7 33.7
Time Watts Amps Capacity Energy
(W) (A) (Ah) (Wh) W/litre Wh/litre W/kg Wh/kg
2 min. 4938 476.2 15.9 164.4 504.5 16.8 203.2 6.8
5 min. 3525 325.6 27.1 293.6 360.1 30.0 145.1 12.1
10 min. 2416 217.2 36.2 402.7 246.8 41.1 99.4 16.6
15 min. 1858 164.8 41.2 464.5 189.8 47.5 76.5 19.1
20 min. 1517 133.4 44.5 505.6 155.0 51.7 62.4 20.8
30 min. 1118 97.2 48.6 559.0 114.2 57.1 46.0 23.0
45 min. 806 69.5 52.1 604.5 82.3 61.8 33.2 24.9
1 hr. 633 54.2 54.2 633.0 64.7 64.7 26.0 26.0
2 hr. 343 29.1 58.2 686.0 35.0 70.1 14.1 28.2
3 hr. 237 20.0 60.0 711.0 24.2 72.6 9.8 29.3
4 hr. 182 15.2 60.8 728.0 18.6 74.4 7.5 30.0
5 hr. 148 12.4 62.0 740.0 15.1 75.6 6.1 30.5
8 hr. 95 7.9 63.2 760.0 9.7 77.6 3.9 31.3
10 hr. 77 6.5 65.0 770.0 7.9 78.7 3.2 31.7
20 hr. 41 3.4 68.0 820.0 4.2 83.8 1.7 33.7
Time Watts Amps Capacity Energy
(W) (A) (Ah) (Wh) W/litre Wh/litre W/kg Wh/kg
ENERGY AND POWER DENSITIES
ENERGY AND POWER DENSITIES
ENERGY AND POWER DENSITIES
Amps
10000
1000
100
Watts or amps per 42EP
10
1
0.01
0.1
Watts
110
Hours to 11.1V at 25°C (77°F)
100
Amps
10000
1000
100
Watts or amps per 70EP
10
1
0.01
0.1
Watts
110
Hours to 9V at 25°C (77°F)
Amps
10000
1000
100
Watts or amps per 70EP
10
1
0.01
0.1
Watts
110
Hours to 10.02V at 25°C (77°F)
100
100
Page 29

29
www.enersys-emea.com
2 min. 4328 404.1 13.5 144.1 442.2 14.7 178.1 5.9
5 min. 3241 293.3 24.4 270.0 331.1 27.6 133.4 11.1
10 min. 2279 202.2 33.7 379.9 232.8 38.8 93.8 15.6
15 min. 1773 155.6 38.9 443.3 181.1 45.3 73.0 18.2
20 min. 1458 127.1 42.4 486.0 149.0 49.6 60.0 20.0
30 min. 1082 93.5 46.8 541.0 110.5 55.3 44.5 22.3
45 min. 785 67.3 50.5 588.8 80.2 60.1 32.3 24.2
1 hr. 619 52.8 52.8 619.0 63.2 63.2 25.5 25.5
2 hr. 337 28.5 57.0 674.0 34.4 68.9 13.9 27.7
3 hr. 233 19.6 58.8 699.0 23.8 71.4 9.6 28.8
4 hr. 179 14.9 59.6 716.0 18.3 73.1 7.4 29.5
5 hr. 145 12.1 60.5 725.0 14.8 74.1 6.0 29.8
8 hr. 94 7.8 62.4 752.0 9.6 76.8 3.9 30.9
10 hr. 76 6.3 63.0 760.0 7.8 77.6 3.1 31.3
20 hr. 40 3.3 66.0 800.0 4.1 81.7 1.6 32.9
Time Watts Amps Capacity Energy
(W) (A) (Ah) (Wh) W/litre Wh/litre W/kg Wh/kg
ENERGY AND POWER DENSITIES
Figure B-19: 70EP discharge data to 10.5V at 25°C
Figure B-20: 70EP discharge data to 11.1V at 25°C
2 min. 3791 326.1 10.9 126.2 387.3 12.9 156.0 5.2
5 min. 2846 251.8 21.0 237.1 290.8 24.2 117.1 9.8
10 min. 2071 180.3 30.1 345.2 211.6 35.3 85.2 14.2
15 min. 1638 141.4 35.4 409.5 167.3 41.8 67.4 16.9
20 min. 1361 116.9 39.0 453.6 139.0 46.3 56.0 18.7
30 min. 1024 87.3 43.7 512.0 104.6 52.3 42.1 21.1
45 min. 751 63.6 47.7 563.3 76.7 57.5 30.9 23.2
1 hr. 595 50.2 50.2 595.0 60.8 60.8 24.5 24.5
2 hr. 328 27.4 54.8 656.0 33.5 67.0 13.5 27.0
1 hr. 227 18.9 56.7 681.0 23.2 69.6 9.3 28.0
4 hr. 174 14.5 58.0 696.0 17.8 71.1 7.2 28.6
5 hr. 141 11.8 59.0 705.0 14.4 72.0 5.8 29.0
8 hr. 91 7.5 60.0 728.0 9.3 74.4 3.7 30.0
10 hr. 74 6.1 61.0 740.0 7.6 75.6 3.0 30.5
20 hr. 39 3.2 64.0 780.0 4.0 79.7 1.6 32.1
Time Watts Amps Capacity Energy
(W) (A) (Ah) (Wh) W/litre Wh/litre W/kg Wh/kg
ENERGY AND POWER DENSITIES
Amps
10000
1000
100
Watts or amps per 70EP
10
1
0.01
Watts
0.1
Hours to 10.5V at 25°C (77°F)
110
100
Amps
10000
1000
100
Watts or amps per 70EP
10
1
0.01
Watts
0.1
Hours to 11.1V at 25°C (77°F)
110
100
Page 30

30
www.enersys-emea.com
Notes
Page 31

31
www.enersys-emea.com
Notes
Page 32

Publication No: EN-GPL-AM-005 - September 2011 - Subject to revisions without prior notice. E.&O.E.
www.enersys-emea.com
Contact:
© 2011 EnerSys. All rights reserved.
Trademarks and logos are the property of
EnerSys and its affiliates unless otherwise noted.
Wherever in the world you do business, EnerSys®is with you all the way. With large manufacturing
plants strategically located throughout Asia, Europe and North and South America, combined with a
strong global sales and support team, and backed with a reputation for world-leading technology, our
customers benefit through supply reliability, high quality products designed to meeting ever increasing
technical requirements, and our commitment to providing the best solution to meeting their Reserve
Power needs.
For more information, visit our website at www.enersys-emea.com, or contact an EnerSys Reserve
Power sales office.
EnerSys
P.O. Box 14145
Reading, PA 19612-4145
USA
Tel: +1-610-208-1991
+1-800-538-3627
Fax: +1-610-372-8613
EnerSys Ltd.
Oak Court
Clifton Business Park
Wynne Avenue, Swinton
Manchester M27 8FF
UK
Tel: +44 (0)161 794 4611
Fax: +44 (0)161 727 3809
EnerSys Europe
Löwenstrasse 32
8001 Zurich, Switzerland
EnerSys Asia
152 Beach Road
Gateway East Building, Level 11
189721 Singapore
Tel: +65 6508 1780
 Loading...