

Page 1
Instruction Manual
760000-C
November 2002
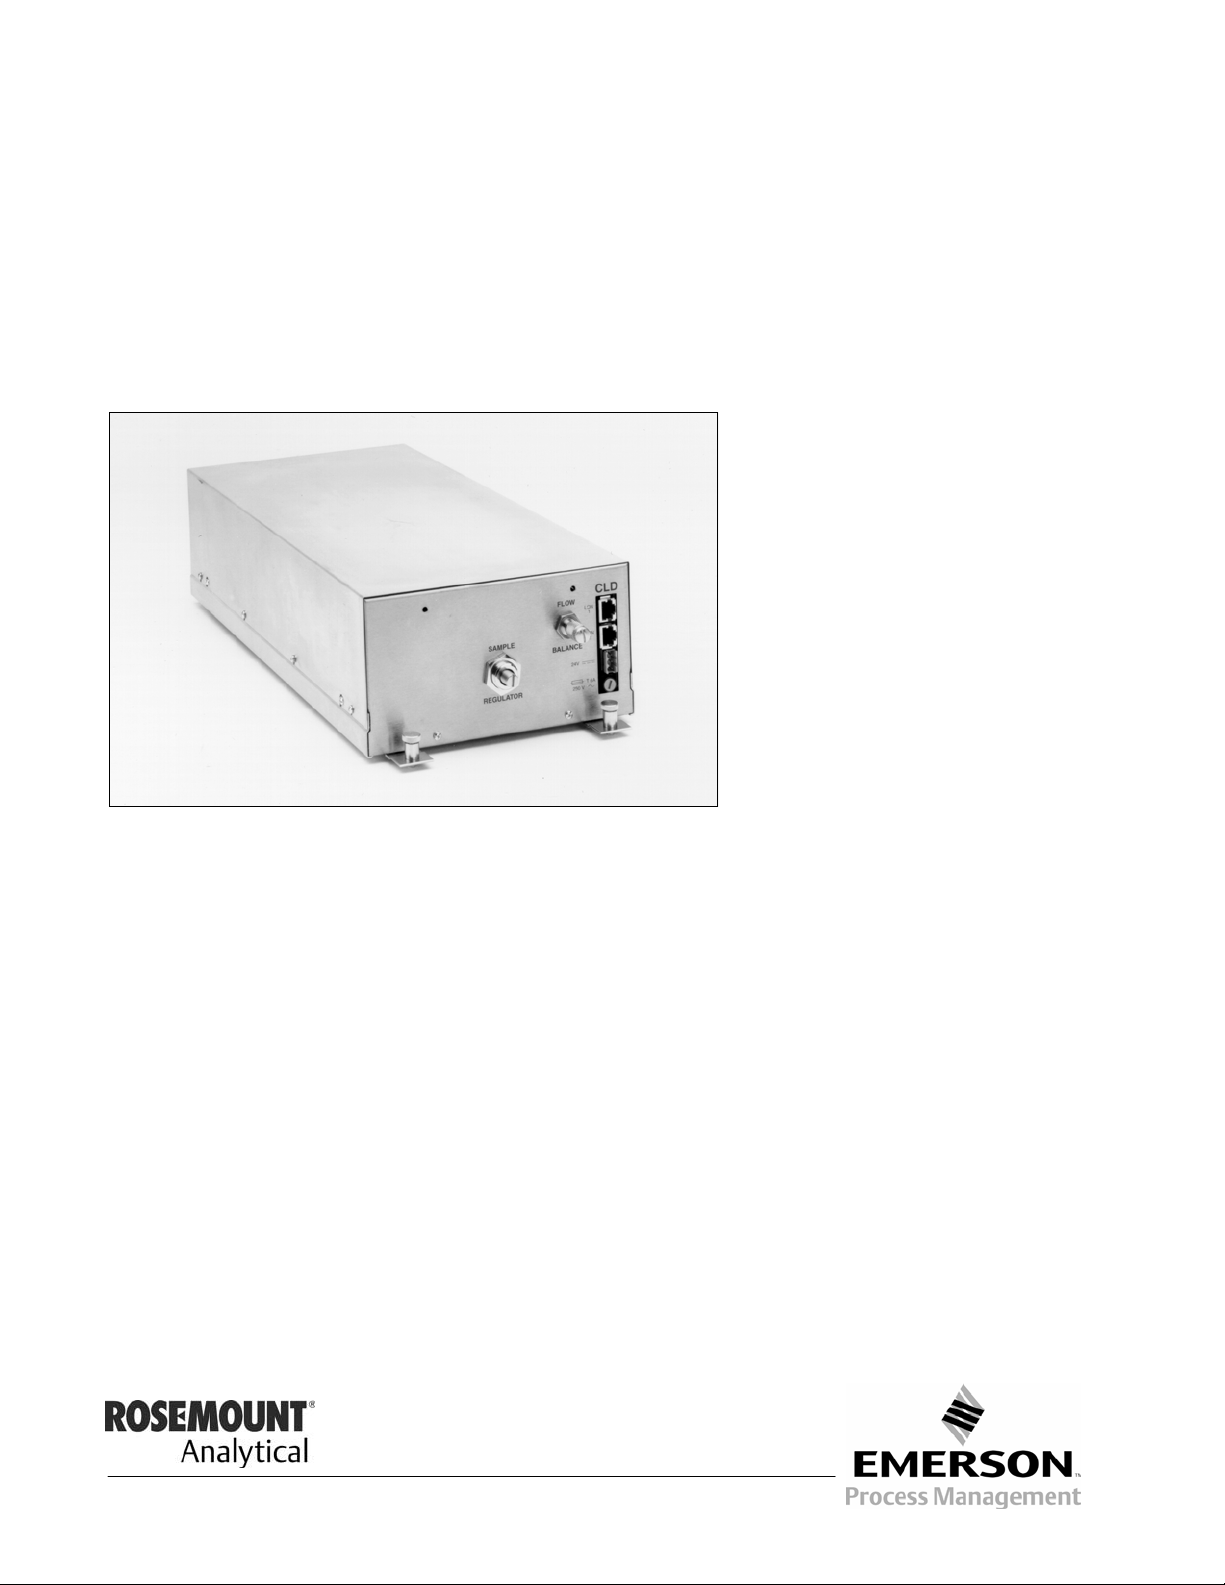
Model NGA2000 CLD
Chemiluminescence Analyzer Module
http://www.processanalytic.com
Page 2

ESSENTIAL INSTRUCTIONS
READ THIS PAGE BEFORE PROCEEDING!
Rosemount Analytical designs, manufactures and tests its products to meet many national and international standards. Because these instruments are sophisticated technical products, you
MUST properly install, use, and maintain them
normal specifications. The following instructions MUST be adhered to and integrated into your
safety program when installing, using, and maintaining Rosemount Analytical products. Failure to
follow the proper instructions may cause any one of the following situations to occur: Loss of life;
personal injury; property damage; damage to this instrument; and warranty invalidation.
to ensure they continue to operate within their
• Read all instructions
prior to installing, operating, and servicing the product.
• If you do not understand any of the instructions, contact your Rosemount Analytical representative
for clarification.
• Follow all warnings, cautions, and instructions
marked on and supplied with the product.
• Inform and educate your personnel in the proper installation, operation, and maintenance of
the product.
• Install your equipment as specified in the Installation Instructions of the appropriate Instruc-
tion Manual and per applicable local and national codes. Connect all products to the proper elec-
trical and pressure sources.
• To ensure proper performance, use qualified personnel
to install, operate, update, program, and
maintain the product.
• When replacement parts are required, ensure that qualified people use replacement parts specified by
Rosemount. Unauthorized parts and procedures can affect the product’s performance, place the safe
operation of your process at risk, and VOID YOUR WARRANTY
. Look-alike substitutions may result
in fire, electrical hazards, or improper operation.
• Ensure that all equipment doors are closed and protective covers are in place, except when
maintenance is being performed by qualified persons, to prevent electrical shock and personal
injury.
The information contained in this document is subject to change without notice.
Teflon is a Registered Trademark of E.I. duPont de Nemours and Co., Inc.
Kynar is a Registered Trademark of Atochem North America, Inc.
SNOOP is a registered trademark of NUPRO Co.
Emerson Process Management
Rosemount Analytical Inc.
Process Analytic Division
1201 N. Main St.
Orrville, OH 44667-0901
T (330) 682-9010
F (330) 684-4434
e-mail: gas.csc@EmersonProcess.com
http://www.processanalytic.com
Page 3

Model NGA2000 CLD
TABLE OF CONTENTS
PREFACE...........................................................................................................................................P-1
Definitions ...........................................................................................................................................P-1
Safety Summary .................................................................................................................................P-2
General Precautions For Handling And Storing High Pressure Gas Cylinders .................................P-6
Documentation....................................................................................................................................P-7
Compliances .......................................................................................................................................P-7
Glossary Of Terms ...........................................................................................................................P-8
1-0 DESCRIPTION AND SPECIFICATIONS..............................................................................1-1
1-1 Overview................................................................................................................................1-1
1-2 Typical Applications...............................................................................................................1-1
1-3 Theory of Technology............................................................................................................1-1
1-4 Features.................................................................................................................................1-1
1-5 Specifications.........................................................................................................................1-4
a. General ...........................................................................................................................1-4
b. Physical...........................................................................................................................1-4
c. Sample ............................................................................................................................1-4
d. Gas Connections.............................................................................................................1-5
Instruction Manual
760000-C
November 2002
2-0 INSTALLATION ....................................................................................................................2-1
2-1 Unpacking..............................................................................................................................2-1
2-2 Assembly ...............................................................................................................................2-1
2-3 Location .................................................................................................................................2-2
2-4 Gases ....................................................................................................................................2-2
a. Overview .........................................................................................................................2-2
b. Connections ....................................................................................................................2-2
c. Specifications ..................................................................................................................2-3
2-5 Electrical Connections ...........................................................................................................2-4
3-0 OPERATION .........................................................................................................................3-1
3-1 Overview................................................................................................................................3-1
3-2 Displays & Operating Keys....................................................................................................3-1
a. Menu Lines & Softkey Functionality................................................................................3-1
b. Common Function Keys..................................................................................................3-2
c. Entering & Changing Variables.......................................................................................3-3
d. Starting a Function..........................................................................................................3-3
e. Measure Mode Display ...................................................................................................3-4
f. Main Menu ......................................................................................................................3-4
3-3 Startup & Initialization............................................................................................................3-7
a. Routine Operation ...........................................................................................................3-7
3-4 Basic Controls and Status .....................................................................................................3-8
a. Analyzer Channel Status ................................................................................................3-8
b. Single Component Display..............................................................................................3-8
c. Multi Component Display................................................................................................3-9
3-5 Basic Controls........................................................................................................................3-10
Rosemount Analytical Inc. A Division of Emerson Process Management Contents i
Page 4

Instruction Manual
760000-C
November 2002
3-6 Display Controls ....................................................................................................................3-11
3-7 Analyzer And I/O, Expert Controls And Setup.......................................................................3-12
a. Range Settings................................................................................................................3-12
b. Physical Measurements ..................................................................................................3-13
c. Concentration Alarms .....................................................................................................3-13
d. Linearization Parameters ................................................................................................3-14
e. Linearization Functions ...................................................................................................3-15
f. Response Time ...............................................................................................................3-17
g. Automatic Range Change...............................................................................................3-17
h. Display Units ...................................................................................................................3-18
i. Physical Measurements & Pressure Limits ....................................................................3-18
j. Single Component Display Parameters..........................................................................3-19
3-8 Calibration Procedure............................................................................................................3-21
a. Calibration Setup.............................................................................................................3-21
b. Basic Controls Calibration...............................................................................................3-22
c. Expert Controls Calibration.............................................................................................3-23
d. Unable to Calibrate .........................................................................................................3-25
3-9 System & Network I/O Module Controls (Setup) – System SIO...........................................3-26
a. Analog Output Setup.......................................................................................................3-26
b. Serial Interface Setup .....................................................................................................3-29
c. Relay Outputs Setup.......................................................................................................3-29
3-10 System & Network I/O Module Controls (Setup) – System DIO ..........................................3-31
3-11 System Configuration and Diagnostics .................................................................................3-32
a. Diagnostic Menus............................................................................................................3-32
b. Load/Save Module Configuration....................................................................................3-34
c. Date and Time.................................................................................................................3-35
d. Security Codes................................................................................................................3-35
e. System Reset..................................................................................................................3-36
3-12 Converter Temperature Adjustment ......................................................................................3-37
3-13 Measurement of Converter Efficiency ...................................................................................3-38
a. Test Setup for Measurement of Conversion Efficiency...................................................3-38
b. Test Procedure................................................................................................................3-38
c. Subnormal Conversion Efficiency...................................................................................3-39
d. Replacement of Converter ..............................................................................................3-40
e. Capillaries .......................................................................................................................3-40
f. TEA Scrubber..................................................................................................................3-40
Model NGA2000 CLD
4-0 MAINTENANCE AND SERVICE ..........................................................................................4-1
4-1 Overview................................................................................................................................4-1
4-2 Fuses .....................................................................................................................................4-1
4-3 Fans.......................................................................................................................................4-1
4-4 Converter ...............................................................................................................................4-1
4-5 Ozonator ................................................................................................................................4-1
4-6 Printed Circuit Boards............................................................................................................4-1
4-7 Detector Disassembly............................................................................................................4-3
a. Reaction Chamber Removal...........................................................................................4-3
b. Reaction Chamber Installation........................................................................................4-3
c. Photodiode Removal.......................................................................................................4-4
d. Photodiode Installation....................................................................................................4-4
5-0 TROUBLESHOOTING ..........................................................................................................5-1
5-1 Leaks .....................................................................................................................................5-1
ii Contents Rosemount Analytical Inc. A Division of Emerson Process Management
Page 5

Model NGA2000 CLD
6-0 REPLACEMENT PARTS ......................................................................................................6-1
6-1 Matrix .....................................................................................................................................6-1
6-2 Replacement Parts ................................................................................................................6-1
7-0 RETURN OF MATERIAL......................................................................................................7-1
7-1 Return Of Material .................................................................................................................7-1
7-2 Customer Service ..................................................................................................................7-1
7-3 Training..................................................................................................................................7-1
8-0 INDEX....................................................................................................................................8-1
Instruction Manual
760000-C
November 2002
Rosemount Analytical Inc. A Division of Emerson Process Management Contents iii
Page 6

Instruction Manual
760000-C
November 2002
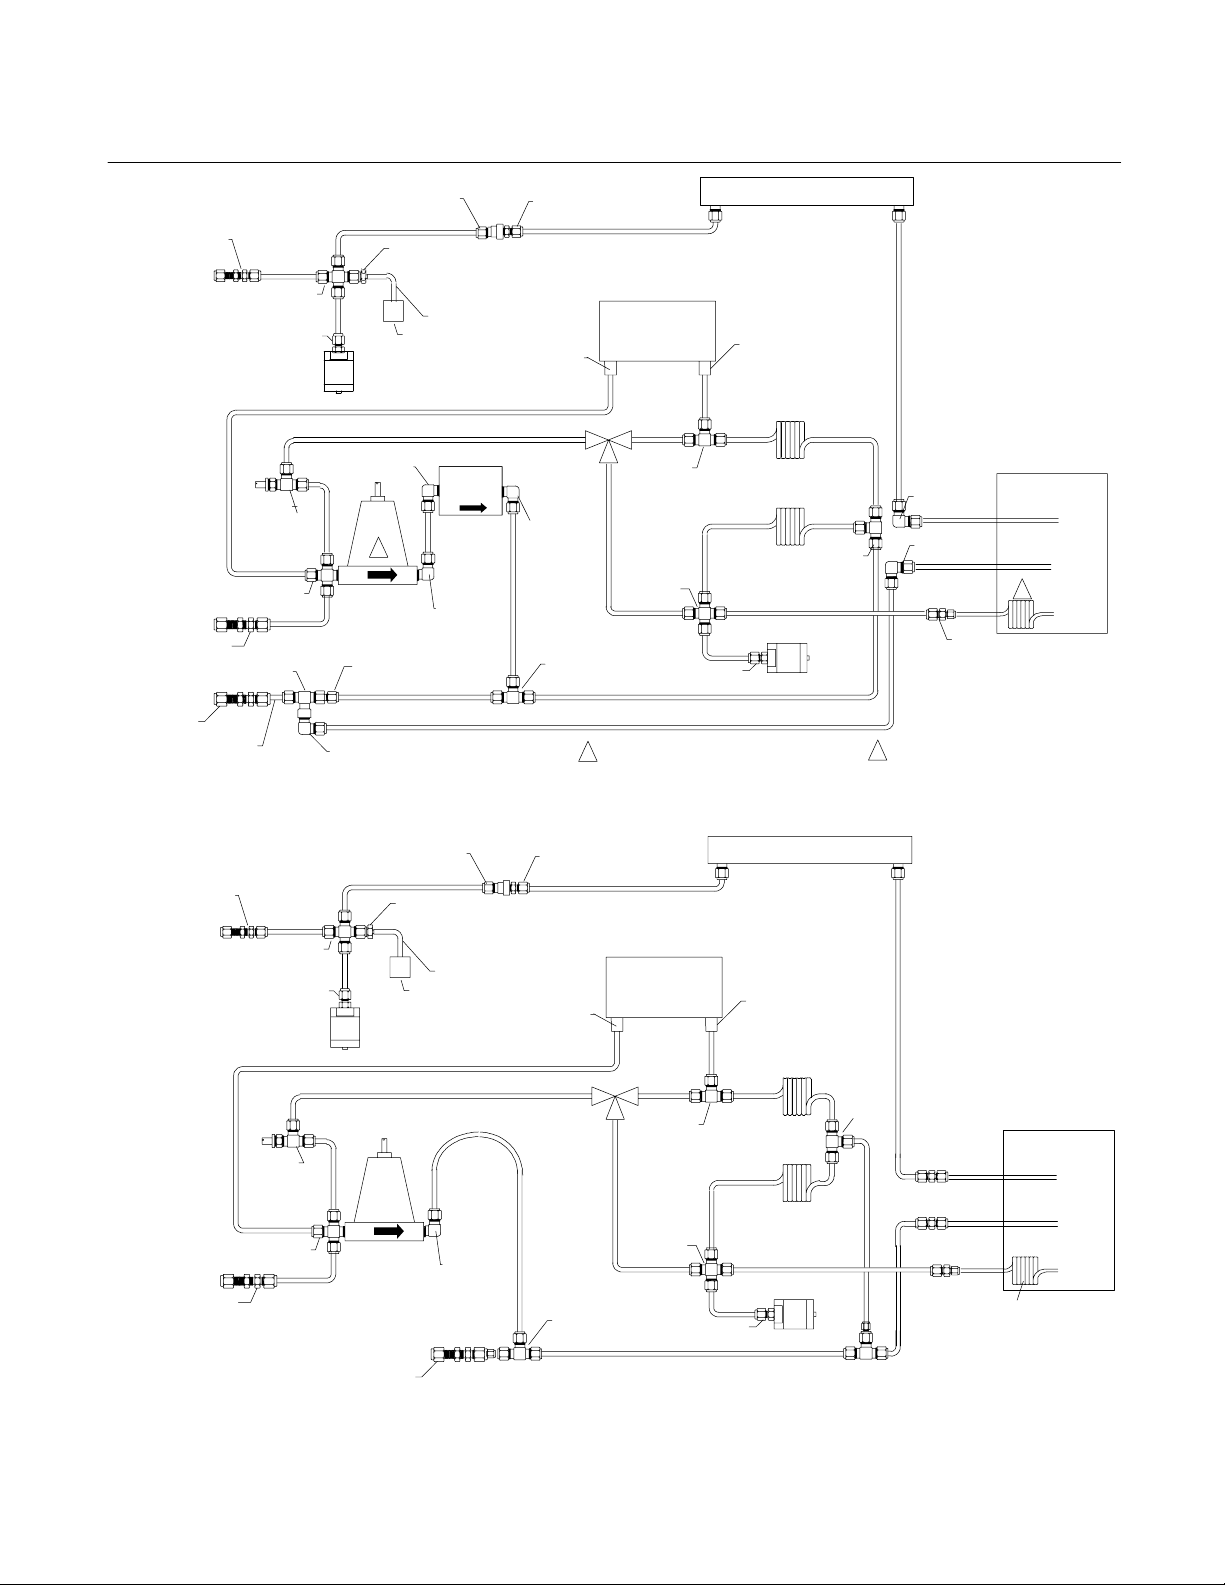
Figure 1-1. Flow Diagram - CLD Analyzer Module With Bypass Flow Sensor .................................1-2
Figure 1-2. Flow Diagram - CLD Analyzer Module Without Bypass Flow Sensor ...........................1-2
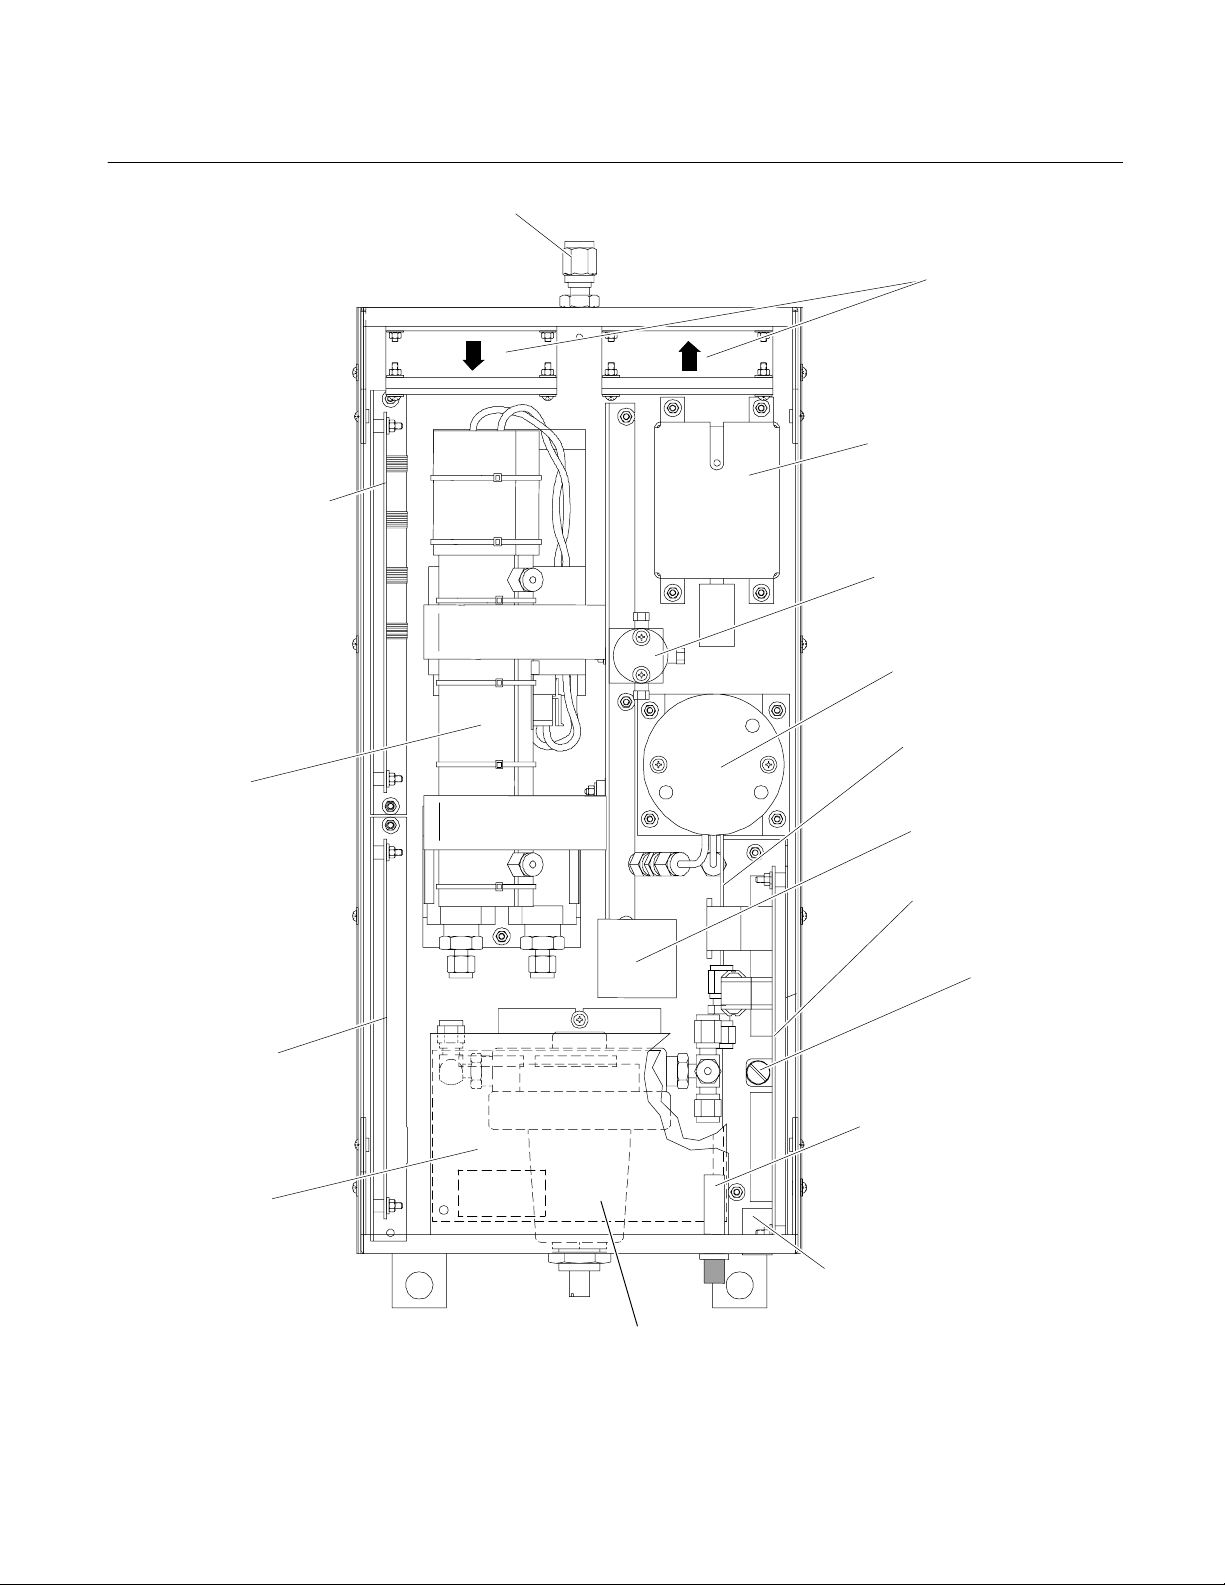
Figure 1-3. CLD Analyzer Module - Top View..................................................................................1-3
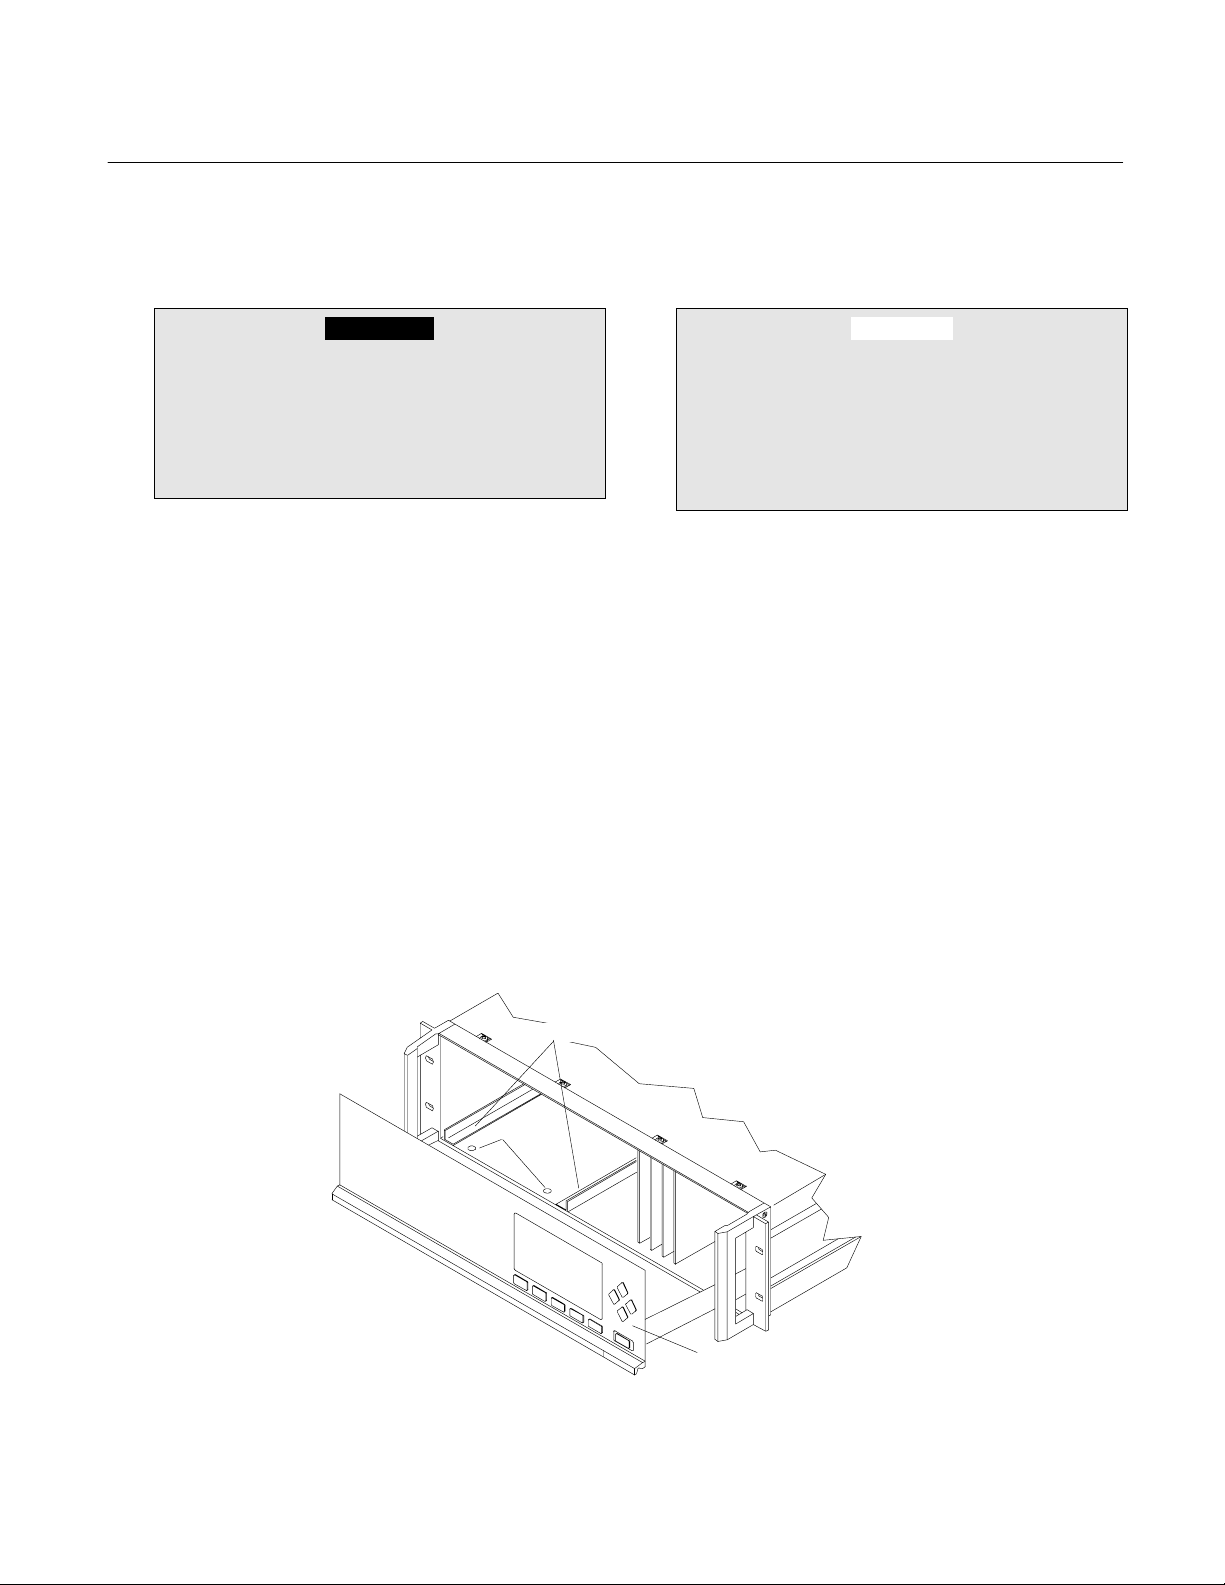
Figure 2-1. Analyzer Module Installation into Instrument Platform....................................................2-1
Figure 2-2. CLD Rear Panel Connections.........................................................................................2-3
Figure 2-3. Front Panel Controls and Electrical Connections ...........................................................2-4
Figure 2-4. CLD Wiring Diagram .......................................................................................................2-5
Figure 2-5. Outline and Mounting Dimensions..................................................................................2-6
Figure 3-1. Measure Mode Display ...................................................................................................3-1
Figure 3-2. The Display Screen.........................................................................................................3-3
Figure 3-3. Changing Variables.........................................................................................................3-3
Figure 3-4. Function Confirmation Display ........................................................................................3-3
Figure 3-5. Main Menu Display..........................................................................................................3-4
Figure 3-6. Module Manufacturing Data Displays .............................................................................3-5
Figure 3-7. Main Menu Sub Menus ...................................................................................................3-6
Figure 3-8. Startup Display................................................................................................................3-7
Figure 3-9. Basic Controls Menu .......................................................................................................3-10
Figure 3-10. Display Controls Menu ..................................................................................................3-11
Figure 3-11. Analyzer and I/O Expert Controls and Setup Menu......................................................3-12
Figure 3-12. Expert Controls Menu ...................................................................................................3-12
Figure 3-13. Range Settings Menu....................................................................................................3-12
Figure 3-14. Physical Measurements Menu......................................................................................3-13
Figure 3-15. Concentration Alarm Setup Menu.................................................................................3-13
Figure 3-16. Gas Measurement Parameters Menu...........................................................................3-14
Figure 3-17. Linearization Parameters Menu ....................................................................................3-14
Figure 3-18. Linearity Coefficients Menu...........................................................................................3-14
Figure 3-19. Linearization Functions Menu .......................................................................................3-15
Figure 3-20. Polynomial Setup Menu ................................................................................................3-15
Figure 3-21. Gas Concentrations Menu ............................................................................................3-15
Figure 3-22. Midpoint Correction Setup Menu ..................................................................................3-16
Figure 3-23. Response time/delay Parameters................................................................................3-17
Figure 3-24. Automatic Range Control Menu....................................................................................3-17
Figure 3-25. Actual Switch Levels Menu ...........................................................................................3-18
Figure 3-26. Display Units Menu .......................................................................................................3-18
Figure 3-27. Pressure Limits Menu ...................................................................................................3-19
Figure 3-28. Temperature Limits Menu .............................................................................................3-19
Figure 3-29. Physical Measurements – Manufacturer’s settings Display..........................................3-19
Figure 3-30. Displayed Parameters Menu.........................................................................................3-19
Figure 3-31. Calibration Gas List Menu.............................................................................................3-21
Figure 3-32. Calibration Parameters Display ....................................................................................3-22
Figure 3-33. Zero/Span Calibration Menu .........................................................................................3-23
Figure 3-34. Analyzer Zero Display...................................................................................................3-23
Figure 3-35. Zero/Span Diagnostic Data Menu.................................................................................3-24
Figure 3-36. Calibration Factors Menu..............................................................................................3-24
Figure 3-37. Range Factors Menu.....................................................................................................3-24
Figure 3-38. Range Factors -Manufacturer’s/Stored Settings Display..............................................3-25
Figure 3-39. System & Network I/O Module Controls Menu .............................................................3-26
Figure 3-40. System SIO Module Menu ............................................................................................3-26
Figure 3-41. Analyzer Modules Menu ...............................................................................................3-26
Model NGA2000 CLD
LIST OF ILLUSTRATIONS
iv Contents Rosemount Analytical Inc. A Division of Emerson Process Management
Page 7

Model NGA2000 CLD
Figure 3-42. Analog Output Setup Menu...........................................................................................3-27
Figure 3-43. Signals Menu ...............................................................................................................3-27
Figure 3-44. Output Signal If Assigned Module Fails Menu..............................................................3-28
Figure 3-45. Special Scaling for Concentration Signal Menu............................................................3-28
Figure 3-46. Analog Output Updates per Second Menu ...................................................................3-29
Figure 3-47. Serial Interface Setup Menu .........................................................................................3-29
Figure 3-48. AK Protocol Definitions Menu .......................................................................................3-29
Figure 3-49. Relay Outputs Setup Menu...........................................................................................3-30
Figure 3-50. Choose Source Module Menu ......................................................................................3-30
Figure 3-51. Choose Signal Menu.....................................................................................................3-30
Figure 3-52. System DIO Module Menu............................................................................................3-31
Figure 3-53. System Configuration and Diagnostics Menu...............................................................3-32
Figure 3-54. Diagnostic Menu ...........................................................................................................3-32
Figure 3-55. Analyzer Diagnostics Menu ..........................................................................................3-32
Figure 3-56. Power Supply Voltages Menu.......................................................................................3-33
Figure 3-57. Primary Variable Parameters Menu..............................................................................3-33
Figure 3-58. Temperature Control Menu (Screen 1) .........................................................................3-33
Figure 3-59. Temperature Control Menu (Screen 2) .........................................................................3-33
Figure 3-60. NO/NOx Flow Balance Menu........................................................................................3-34
Figure 3-61. Calculate Factor Using Pressure Ratio Menu...............................................................3-34
Figure 3-62. Load/Save Configuration (CM/MCA) Menu ..................................................................3-34
Figure 3-63. Date and Time Menu.....................................................................................................3-35
Figure 3-64. Security Codes Menu....................................................................................................3-35
Figure 3-65. Define Basic Level Security PIN Menu .........................................................................3-35
Figure 3-66. System Reset Menu......................................................................................................3-36
Figure 3-67. Measuring Efficiency of NO
Figure 3-68. Conversion Efficiency as a Function of Converter Temperature ..................................3-42
Figure 4-1. CLD Module Assembly....................................................................................................4-2
Figure 4-2. Converter Assembly........................................................................................................4-3
Figure 4-3. Detector Assembly ..........................................................................................................4-5
Instruction Manual
760000-C
November 2002
to NO Converter.............................................................3-41
2
LIST OF TABLES
Table 2-1. Gas Specifications...................................................................................................... 2-2
Rosemount Analytical Inc. A Division of Emerson Process Management Contents v
Page 8

Instruction Manual
760000-C
November 2002
Model NGA2000 CLD
vi Contents Rosemount Analytical Inc. A Division of Emerson Process Management
Page 9
Instruction Manual
Model NGA2000 CLD
November 2002
PREFACE
The purpose of this manual is to provide information concerning the components,
functions, installation and maintenance of the NGA 2000 CLD and the System Accessories
of the NGA 2000 System.
Some sections may describe equipment not used in your configuration. The user should
become thoroughly familiar with the operation of this module before operating it. Read
this instruction manual completely.
DEFINITIONS
The following definitions apply to DANGERS, WARNINGS, CAUTIONS and NOTES found throughout
this publication.
760000-C
DANGER .
Highlights the presence of a hazard which will cause severe personal injury, death, or substantial
property damage if the warning is ignored.
WARNING .
Highlights an operation or maintenance procedure, practice, condition, statement, etc. If not
strictly observed, could result in injury, death, or long-term health hazards of personnel.
CAUTION
Highlights an operation or maintenance procedure, practice, condition, statement, etc. If not
strictly observed, could result in damage to or destruction of equipment, or loss of effectiveness.
NOTE
Highlights an essential operating procedure,
condition or statement.
Rosemount Analytical Inc. A Division of Emerson Process Management Preface P-1
Page 10

Instruction Manual
760000-C
November 2002
Model NGA2000 CLD
SAFETY SUMMARY
If this equipment is used in a manner not specified in these instructions, protective systems may be
impaired.
AUTHORIZED PERSONNEL
To avoid explosion, loss of life, personal injury and damage to this equipment and on-site
property, all personnel authorized to install, operate and service the this equipment should be
thoroughly familiar with and strictly follow the instructions in this manual. SAVE THESE INSTRUCTIONS.
DANGER.
ELECTRICAL SHOCK HAZARD
Do not operate without doors and covers secure. Servicing requires access to live parts which can
cause death or serious injury. Refer servicing to qualified personnel. For safety and proper performance this instrument must be connected to a properly grounded three-wire source of power.
WARNING .
TOXIC AND OXIDIZING GAS
This module generates ozone which is toxic by inhalation and is a strong irritant to throat and
lungs. Ozone is also a strong oxidizing agent. Its presence is detected by a characteristic pungent
odor.
The module's exhaust contains both ozone and nitrogen dioxide, both toxic by inhalation, and may
contain other constituents of the sample gas which may be toxic. Such gases include various oxides of nitrogen, unburned hydrocarbons, carbon monoxide and other products of combustion reactions. Carbon monoxide is highly toxic and can cause headache, nausea, loss of consciousness,
and death.
Avoid inhalation of the ozone produced within the module, and avoid inhalation of the sample and
exhaust products transported within the module. Avoid inhalation of the combined exhaust products at the exhaust fitting.
Keep all tube fittings tight to avoid leaks The user is responsible for testing for leakage only at the
inlet and outlet fittings on the rear panel. Periodically, the user should do an internal leak test (with
a test procedure chosen by the user).
Connect rear exhaust outlet to outside vent with stainless steel or Teflon line. Check vent line and
connections for leakage.
P-2 Preface Rosemount Analytical Inc. A Division of Emerson Process Management
Page 11
Instruction Manual
Model NGA2000 CLD
WARNING.
PARTS INTEGRITY
Tampering or unauthorized substitution of components may adversely affect safety of this product.
Use only factory documented components for repair.
WARNING.
OVERBALANCE HAZARD
This analyzer module may tip instrument over if it is pulled out too far and the Platform is not properly supported.
WARNING.
INTERNAL ULTRAVIOLET LIGHT
Ultraviolet light from the ozone generator can cause permanent eye damage. Do not look directly at
the ultraviolet source. Use of ultraviolet filtering glasses is recommended.
November 2002
760000-C
WARNING.
TOXIC CHEMICAL HAZARD
The ozone generator lamp contains mercury. Lamp breakage could result in mercury exposure.
Mercury is highly toxic if absorbed through the skin or ingested, or if vapors are inhaled.
Handle lamp assembly with extreme care. If the lamp is broken, avoid skin contact and inhalation
in the area of the lamp or the mercury spill.
Immediately clean up and dispose of the mercury spill and lamp residue as follows:
• Wearing rubber gloves and goggles, collect all droplets of mercury by means of a suction pump
and aspirator bottle with a long capillary tube. (Alternately, a commercially available mercury
spill clean-up kit, such as J.T. Baker product No. 4439-01, is recommended.)
• Carefully sweep any remaining mercury and lamp debris into a dust pan. Carefully transfer all
mercury, lamp residue and debris into a plastic bottle which cab be tightly capped.
• Label and return to hazardous material reclamation center. Do not place in the trash, incinerate
or flush down the sewer.
• Cover any fine droplets of mercury in non-accessible crevices with calcium polysulfide and sul-
fur dust
Rosemount Analytical Inc. A Division of Emerson Process Management Preface P-3
Page 12
Instruction Manual
760000-C
November 2002
WARNING.
HAND INJURY HAZARD
Do not place hands or fingers in the Platform front handles when front panel is open. Dropping the
front panel of the Platform while hand or fingers are inside either handle can cause serious injury.
WARNING.
POSSIBLE EXPLOSION HAZARD
Ensure that all gas connections are made as labeled and are leak free. Improper gas connections
could result in explosion or death.
Model NGA2000 CLD
WARNING.
POSSIBLE EXPLOSION HAZARD
This equipment is not designed and should not be used in the analysis of flammable samples. Use
of this equipment in this way could result in explosion or death.
CAUTION
PRESSURIZED GAS
This module requires periodic use of pressurized gas. See General Precautions for Handling and
Storing High Pressure Gas Cylinders, page P-6
CAUTION
EXTERNALLY RESTRICT SAMPLE FLOW TO LESS THAN 2200 CC/MIN.
No restrictor is provided in the sample inlet of this module. For those users who cannot externally
limit sample flow, accessory restrictor PN 657300 is available from Rosemount Analytical.
To obtain this accessory, call 800-433-6076.
CAUTION
OVER-VOLTAGE SPIKING
If this analyzer module is used with a non-Rosemount Analytical power supply, adding Rosemount
Analytical PN 903341 Current Protector in series with the 24V positive power line will prevent overvoltage spiking and resultant fuse blowing when powering up the instrument.
P-4 Preface Rosemount Analytical Inc. A Division of Emerson Process Management
Page 13

Instruction Manual
Model NGA2000 CLD
NOTICE
Software compatibility is necessary for all NGA 2000 components in your system to work together. The version of your Platform's software must be equal to or greater that the version
of any other module(s) for successful compatibility. If it is not, contact Rosemount Analytical
at 800-433-6076 to order software upgrade kit PN 657150 for the Platform.
You can locate the version of each NGA 2000 component as follows:
Platform Controller Board
Turn power ON.
The display will show "Control Module V2. ...". This is the software version.
Analyzer Module
Located on the right side of the Analyzer Module case.
I/O Module
Located on the backplane connector of the module. If no label is present, the module is Version 2.0.
760000-C
November 2002
Rosemount Analytical Inc. A Division of Emerson Process Management Preface P-5
Page 14

Instruction Manual
760000-C
November 2002
Model NGA2000 CLD
GENERAL PRECAUTIONS FOR HANDLING AND STORING HIGH
PRESSURE GAS CYLINDERS
Edited from selected paragraphs of the Compressed Gas Association's "Handbook of Compressed
Gases" published in 1981
Compressed Gas Association
1235 Jefferson Davis Highway
Arlington, Virginia 22202
Used by Permission
1. Never drop cylinders or permit them to strike each other violently.
2. Cylinders may be stored in the open, but in such cases, should be protected against extremes of weather
and, to prevent rusting, from the dampness of the ground. Cylinders should be stored in the shade when located in areas where extreme temperatures are prevalent.
3. The valve protection cap should be left on each cylinder until it has been secured against a wall or bench, or
placed in a cylinder stand, and is ready to be used.
4. Avoid dragging, rolling, or sliding cylinders, even for a short distance; they should be moved by using a suitable hand-truck.
5. Never tamper with safety devices in valves or cylinders.
6. Do not store full and empty cylinders together. Serious suckback can occur when an empty cylinder is attached to a pressurized system.
7. No part of cylinder should be subjected to a temperature higher than 125
permitted to come in contact with any part of a compressed gas cylinder.
8. Do not place cylinders where they may become part of an electric circuit. When electric arc welding, precautions must be taken to prevent striking an arc against the cylinder.
°
F (52°C). A flame should never be
P-6 Preface Rosemount Analytical Inc. A Division of Emerson Process Management
Page 15
Instruction Manual
9
6
Model NGA2000 CLD
November 2002
DOCUMENTATION
The following NGA 2000 CLD instruction materials are available. Contact Customer Service Center or the
local representative to order.
760000 Instruction Manual (this document)
COMPLIANCES
This product may carry approvals from several certifying agencies, including Factory Mutual and the Canadian Standards Association (which is also an OSHA accredited, Nationally Recognized Testing Laboratory), for use in non-hazardous, indoor locations.
760000-C
Rosemount Analytical Inc. has satisfied all obligations from the European Legislation to harmonize the
product requirements in Europe.
This product complies with the standard level of NAMUR EMC. Recommendation (May 1993).
This product satisfies all obligations of all relevant standards of the EMC framework in Australia and New
Zealand.
FM
APPROVED
NAMUR
NRTL /C
®
97-C219
N
Rosemount Analytical Inc. A Division of Emerson Process Management Preface P-7
Page 16

Instruction Manual
760000-C
November 2002
Model NGA2000 CLD
GLOSSARY OF TERMS
Analyzer Module
The module that contains all sensor/detector components for development of a Primary Variable signal; includes all signal conditioning and temperature control circuitry.
Backplane
The interconnect circuit board which the Controller Board, Power Supply, Analyzer Module power and network cables, I/O Modules and Expansion Modules plug into.
Control Module
The Operator Interface plus the Controller Board.
Controller Board
The computer board that serves as the Network Manager and operates the Display and Keypad.
Distribution Assembly
The Backplane and the card cages that hold I/O and Expansion Modules.
Expansion Module
A circuit board that plugs into the Backplane from the front of the Platform and performs special features
not related to I/O functions.
I/O Module
A circuit board that plugs into the Backplane from the rear of the Platform. Has a connector terminal for
communication with external data acquisition devices and provides an input/output function.
Operator Interface
The Display and Keyboard.
Platform
Any workable collection of the following: Controller Board, Power Supply, Distribution Assembly, Enclosure
and Operator Interface.
Power Supply
Any of a variety of components that provides conditioned power to other NGA 2000 components, from the
Power Supply Board that plugs into the front of the Backplane in a stand-alone instrument to several larger
ones that can power larger collections of modules and components.
Primary Variable
The measured species concentration value from an Analyzer Module.
Secondary Variable
Data placed on the network by a module regarding current status, e.g., sample flow, source voltage and
other diagnostic information.
P-8 Preface Rosemount Analytical Inc. A Division of Emerson Process Management
Page 17

Instruction Manual
Model NGA2000 CLD
Softkeys
The five function softkeys located below the front panel display; they assume the function displayed directly
above each on the display, a function dictated by software.
System
Any collection of Analyzer Module(s), Platform(s), I/O Module(s) and Expansion Module(s).
November 2002
760000-C
Rosemount Analytical Inc. A Division of Emerson Process Management Preface P-9
Page 18

Instruction Manual
760000-C
November 2002
Model NGA2000 CLD
P-10 Preface Rosemount Analytical Inc. A Division of Emerson Process Management
Page 19

Model NGA2000 CLD
DESCRIPTION AND SPECIFICATIONS
1-1 OVERVIEW
This manual describes the Chemiluminescence
(CLD) Analyzer Module of Rosemount Analytical's NGA 2000 Series of gas analysis components (See Figure 1-1, Figure 1-2 page 1-2 and
Figure 1-3, page 1-3).
SECTION 1
NO
tronically excited state (NO
the excitation)). These revert immediately to the
ground state, with emission of photons (essentially, red light). The reactions involved are:
Instruction Manual
760000-C
November 2002
molecules thus produced are in an elec-
2
* - the "*" refers to
2
NO + O
→ NO2* + O2
3
The CLD Analyzer Module is designed to continuously determine the concentration of nitric
oxide and oxides of nitrogen (NO plus nitrogen
dioxide [NO
]) in a flowing gaseous mixture. The
2
concentration is expressed in parts-per-million.
The CLD Analyzer Module is designed as a
slide-in module (if configured in stand-alone instrument fashion), removable from the front of
the Platform, with gas connections made from
the rear. All electronics relative to sample detection and conditioning are included in this module.
1-2 TYPICAL APPLICATIONS
The CLD Analyzer Module has specific applications in the following areas:
• Oxides of nitrogen emissions from the
combustion of fossil fuels in:
Vehicle engine exhaust
Incinerators
Boilers
Gas appliances
Turbine exhaust
• Nitric acid plant emissions
NO
* → NO2 + red light
2
As NO and O
mix in the reaction chamber, the
3
intensity of the emitted red light is measured by
a photodiode and is proportional to the concentration of NO in the original gas sample.
To measure NOx (NO + NO
), any NO2 in the
2
sample is reduced to NO (at <95% efficiency)
by being continuously passed through a heated
bed of vitreous carbon (this occurs before the
sample gas is presented to the ozone). Any NO
initially present in the sample passes through
this converter stage unchanged before being
routed to the reaction chamber.
The photodiode generates a DC current, which
is then amplified, conditioned and expressed on
the network as the Primary Variable.
1-4 FEATURES
Among the features included in the CLD Analyzer Module are: 1) ozonator air loss shutoff
and 2) NO/NOx mode capability.
• De-NO
control system
X
• Nitric oxide emissions from decaying or-
ganic material (e.g., landfills).
1-3 THEORY OF TECHNOLOGY
The CLD Analyzer Module uses the chemiluminescence method of detection. This technology
is based on the reaction of NO with ozone (O
to produce NO
Rosemount Analytical Inc. A Division of Emerson Process Management Description and Specifications 1-1
and oxygen (O
2
). Some of the
2
)
3
Page 20
Instruction Manual
760000-C
November 2002
Model NGA2000 CLD
BULKHEAD REDUCER
1/4T - 1/8T BRS
OZONE AIR
SAMPLE
BULKHEAD REDUCER
1/4T - 1/8T SS
EXHAUST
BULKHEAD
1/4T SS
BULKHEAD REDUCER
CONNECTOR
1/4T SS
1/4T - 1/8T BRS
OZONE AIR
SAMPLE
BULKHEAD REDUCER
1/4T - 1/8T SS
OZONE GENERATOR
659494
CONNECTOR,GLASS
BLUE
VENT CAPILLARY
70cc/min 4 PSIG
634398
PUMP CAPILLARY
1/8 OD TEFLON
657473
SAMPLE PRESSURE
SENSOR 15 PSIG 655253
KYNAR
ELBOW 1/8T
SS
1/8 OD SS
TEE
1/8T
ELBOW 1/8T
SS
1/8 OD SS
2 70 cc/min. 5 psig CAPILLARY: PN 659657
200 cc/min. 2 psig CAPILLARY: PN 659658
CROSS
1/8T BRS
MALE CONNECTOR
1/8T-3/8NPT B RS
FLOW
BALANCE
VALVE
903207
TEE ASSEMBLY
1/8T-1/4MPT
1/4T - 1/8FP T SS
TEE
CONNECTOR
1/8T-1/8NPT BRS
MALE CONNECTOR
1/8T-3/8NPT BR S
PRESSURE SENSOR
30 PSIG AIR
655254
ELBOW
1/8T-1/8MPT KYNAR
1
BACK
PRESSURE
REGULATOR
REDUCER
1/4T - 1/8T SS
ELBOW
1/8T - 1/8MPT
SS
.116 ID VITON BLK
PRESSURE SWITCH
662298
BYPASS
FLOW
SENSOR
902931
ELBOW
1/8T-1/4MPT
SS
AIR RESTRICTOR
430cc/min @ 12 PSIG
658157
CONNECTOR,
GLASS BLUE
SOLENOID
VALVE
NO/NOx
655263
ELBOW
1/8T-1/8MPT
KYNAR
TEE 1/8T
KYNAR
NOx TO NO
CONVERTER
655250
TOP
NC NO
C
TEE 1/8T
KYNAR
CROSS
1/8T SS
CONNECTOR, MALE
1/8T-3/8MPT SS
1 BRASS/NEOPRENE 655269
STAINLESS STEEL/VITON 659063
Figure 1-1. Flow Diagram - CLD Analyzer Module With Bypass Flow Sensor
OZONE GENERATOR
659494
CONNECTOR,GLASS
BLUE
VENT CAPILLARY
70cc/min 4 PSIG
634398
PUMP CAPILLARY
2 PSIG
SAMPLE PRESSURE
SENSOR 15 PSIG 655253
TEE
1/8T
KYNAR
TEE 1/8T
KYNAR
UNION 1/8T S S
UNION 1/4T- 1/8T SS
REDUCING UNION
1/8T - 1/16T S S
CROSS
1/8T BRS
MALE CONNECTOR
1/8T-3/8NPT B RS
FLOW
BALANCE
VALVE
903207
TEE ASSEMBLY
1/8T-1/4MPT
CONNECTOR
1/8T-1/8NPT BRS
MALE CONNE CTOR
1/8T-3/8NPT BRS
PRESSURE SWITCH
662298
PRESSURE SENSOR
30 PSIG AIR
655254
BACK
PRESSURE
REGULATOR
EXHAUST
BULKHEAD
1/4T SS
.116 ID VITON BLK
ELBOW
1/8T-1/4MP T
SS
AIR RESTRICTOR
430cc/mi n @ 12 PSIG
658157
CONNECTOR,
GLASS BLUE
NO/NOx
SOLENOID
VALVE
655263
TEE 1/8T
SS
NOx TO NO
CONVERTER
TOP
NC NO
C
655250
TEE 1/8T
KYNAR
CROSS
1/8T SS
CONNECTOR, MALE
1/8T-3/8MPT SS
Figure 1-2. Flow Diagram - CLD Analyzer Module Without Bypass Flow Sensor
REACTION
CHAMBER
2
REDUCING UNION
1/8T - 1/16T SS
1/8 OD SS
1/8 OD SS
SAMPLE CAPILLARY
OZONE
EXHAUST
SAMPLE
DETECTOR
REACTION
CHAMBER
OZONE
EXHAUST
SAMPLE
1-2 Description and Specifications Rosemount Analytical Inc. A Division of Emerson Process Management
Page 21
Model NGA2000 CLD
Instruction Manual
760000-C
November 2002
COMPUTER
BOARD
DRIVER BOARD
OZONE
GENERATOR
SIGNAL
BOARD
INLET/OUTLET
FITTINGS
FANS
NO2 TO NO
CONVERTER
3-WAY
SOLENOID VALVE
DETECTOR
SAMPLE
CAPILLARY
FLOW SENSOR
POWER SUPPLY
BOARD
FUSE
FLOW BALANCE
NEEDLE VALVE
NETWORK/POWER
CONNECTOR
SAMPLE BACKPRESSURE REGULATOR
Figure 1-3. CLD Analyzer Module - Top View
Rosemount Analytical Inc. A Division of Emerson Process Management Description and Specifications 1-3
Page 22

Instruction Manual
760000-C
November 2002
1-5 SPECIFICATIONS
a. General
Measurement Species:.................. NO, NOx
Ranges: ......................................... 0 to 10 ppm through 0 to 10,000 ppm NO, NOx
Repeatability:................................. ±0.5% of fullscale (at constant temperature)
Min. Detectable Level:................... 0.1 ppm
Noise: ............................................ <1% of fullscale, peak to peak
Linearity: ........................................ ±1% of fullscale
Response Time: ............................ <1 sec. for 90% of fullscale for ranges of 25 ppm or greater
....................................................... <3 sec. for 90% of fullscale for ranges of less than 25 ppm
t90 Response ................................ 1-2 sec.
Zero Drift: (at constant temperature) <±1% of fullscale/24 hours, <±2% of fullscale/week
Span Drift: (at constant temperature) <±1% of fullscale/24 hours, <±3% of fullscale/week
Effect of Temperature:................... <2% of fullscale (over any 10°C ambient temperature variation
Ambient Temperature:................... 0°C to 45°C (32°F to 113°F)
Power Requirements:.................... 24V DC 120W
Model NGA2000 CLD
interval for a rate of change no greater than 10°C/hour)
b. Physical
Case Classification:....................... General purpose for installation in weather-protected area
Dimensions:................................... See Figure 2-5. Outline and Mounting Dimensions p2-6
Weight: .......................................... 8.1 kg (18 lbs.)
Mounting:....................................... Inside a Platform or custom-installed in a panel
Max. Length of LON Cable:........... 1600m (1 mile) between Analyzer Module and Platform
c. Sample
Temperature: ................................ 0°C to 45°C (32°F to 131°F)
Total Flow Rate: .......................... (Externally measured) 900 to 2200 cc/min. with backpressure
regulator pressure adjusted to 344 hPa (5 psig)
Particles: ...................................... Filtered to <2 microns
Dewpoint: ..................................... 5.5°C below ambient temperature, no entrained liquid
Materials in contact with Sample:.. Stainless steel, Teflon, glass, brass and neoprene
Optional: ..................... Stainless steel, Teflon, glass and Kynar
Ozonator Gas: ............................... Clean, dry air or oxygen; flow rate: 1 L/min. maximum; pressure:
689 hPa to 1034 hPa-gauge (10 to 15 psig); maintain a constant
pressure ±34 hPa (±0.5 psig)
d. Gas Connections
Ozone Air:...................................... 1/4” O.D. tube fitting, brass
Exhaust:......................................... 1/4” O.D. tube fitting, stainless steel
Sample In: ..................................... 1/4” O.D. tube fitting, stainless steel
See the Preface section of the Platform manual for specifications regarding Platform-related components
(e.g., case dimensions) and the I/O Module manual for specifications regarding I/O (e.g., relay outputs).
1-4 Description and Specifications Rosemount Analytical Inc. A Division of Emerson Process Management
Page 23
Model NGA2000 CLD
A
Instruction Manual
760000-C
November 2002
SECTION 2
INSTALLATION
WARNING.
Before starting to install this equipment,
read the “Essential Instructions” on the inside cover and the Safety Summary beginning on page P-2. Failure to follow the safety
instructions could result in serious injury or
death.
2-1 UNPACKING
If the Chemiluminescence (CLD) Analyzer Module is received as a separate unit, carefully examine the shipping carton and contents for
signs of damage. Immediately notify the shipping carrier if the carton or contents is damaged. Retain the carton and packing material
until all components associated with the CLD
Analyzer Module are operational.
2-2 ASSEMBLY
If the CLD Analyzer Module requires assembly
with other components (e.g., the Platform and
associated I/O Modules), do so at this time. Following the guides on the bottom left and bottom
center of the Platform, carefully slide the Analyzer Module halfway into place.
CAUTION.
HAND INJURY HAZARD
Do not place hands or fingers in Platform
front handles when the front panel is open.
Dropping front panel while hand or fingers
are inside either handle can cause serious
injury.
Lift the spring-loaded pins on the front of the
Analyzer Module, and carefully slide it the rest
of the distance. Secure the module in position
by releasing the pins, which seat in the available
holes in the bottom of the case (see Figure 2-1,
below). If the module and Platform are difficult
to assemble, remove the module, ensure the
top cover of the module is firmly seated on the
hold-down screws, and repeat the assembly
procedure.
Refer to Section 2-5, page 2-4 for electrical
connections.
Install I/O Module(s) according to guidelines in
the I/O manual. After startup and calibration
have been performed, secure the front panel
with the six screws provided.
NALYZER MODULE GUIDES
PIN SEATS
DISENGAGED FRO NT PANEL
Figure 2-1. Analyzer Module Installation into Instrument Platform
Rosemount Analytical Inc. A Division of Emerson Process Management Installation 2-1
Page 24

Instruction Manual
760000-C
November 2002
Model NGA2000 CLD
2-3 LOCATION
Install the CLD Analyzer Module in a clean,
weather-protected, vibration-free location free
from extreme temperature variations and moisture. For best results, install the instrument near
the sample stream to minimize sample transport
time.
The analyzer should be installed within ±15° of
horizontal.
NOTE
Unrestricted air flow to the rear of the Analyzer Module is critical to its performance
and reliability.
Operating ambient temperature is 0
o
(32
F to 113oF). Temperature change should
not exceed 10
o
C (18oF) per hour. The same
temperature range restrictions apply to the location of the air and span gas cylinders.
o
C to 45oC
2-4 GASES
a. Overview
See Table 2-1, page 2-2. The CLD Analyzer
Module requires two cylinder gases: 1)
breathing grade air or oxygen and 2) a
standard of accurately known composition
for use as a span gas.
Each gas should be supplied from a cylinder equipped with a clean, non-corrosive,
two-stage regulator. A shutoff valve is recommended.
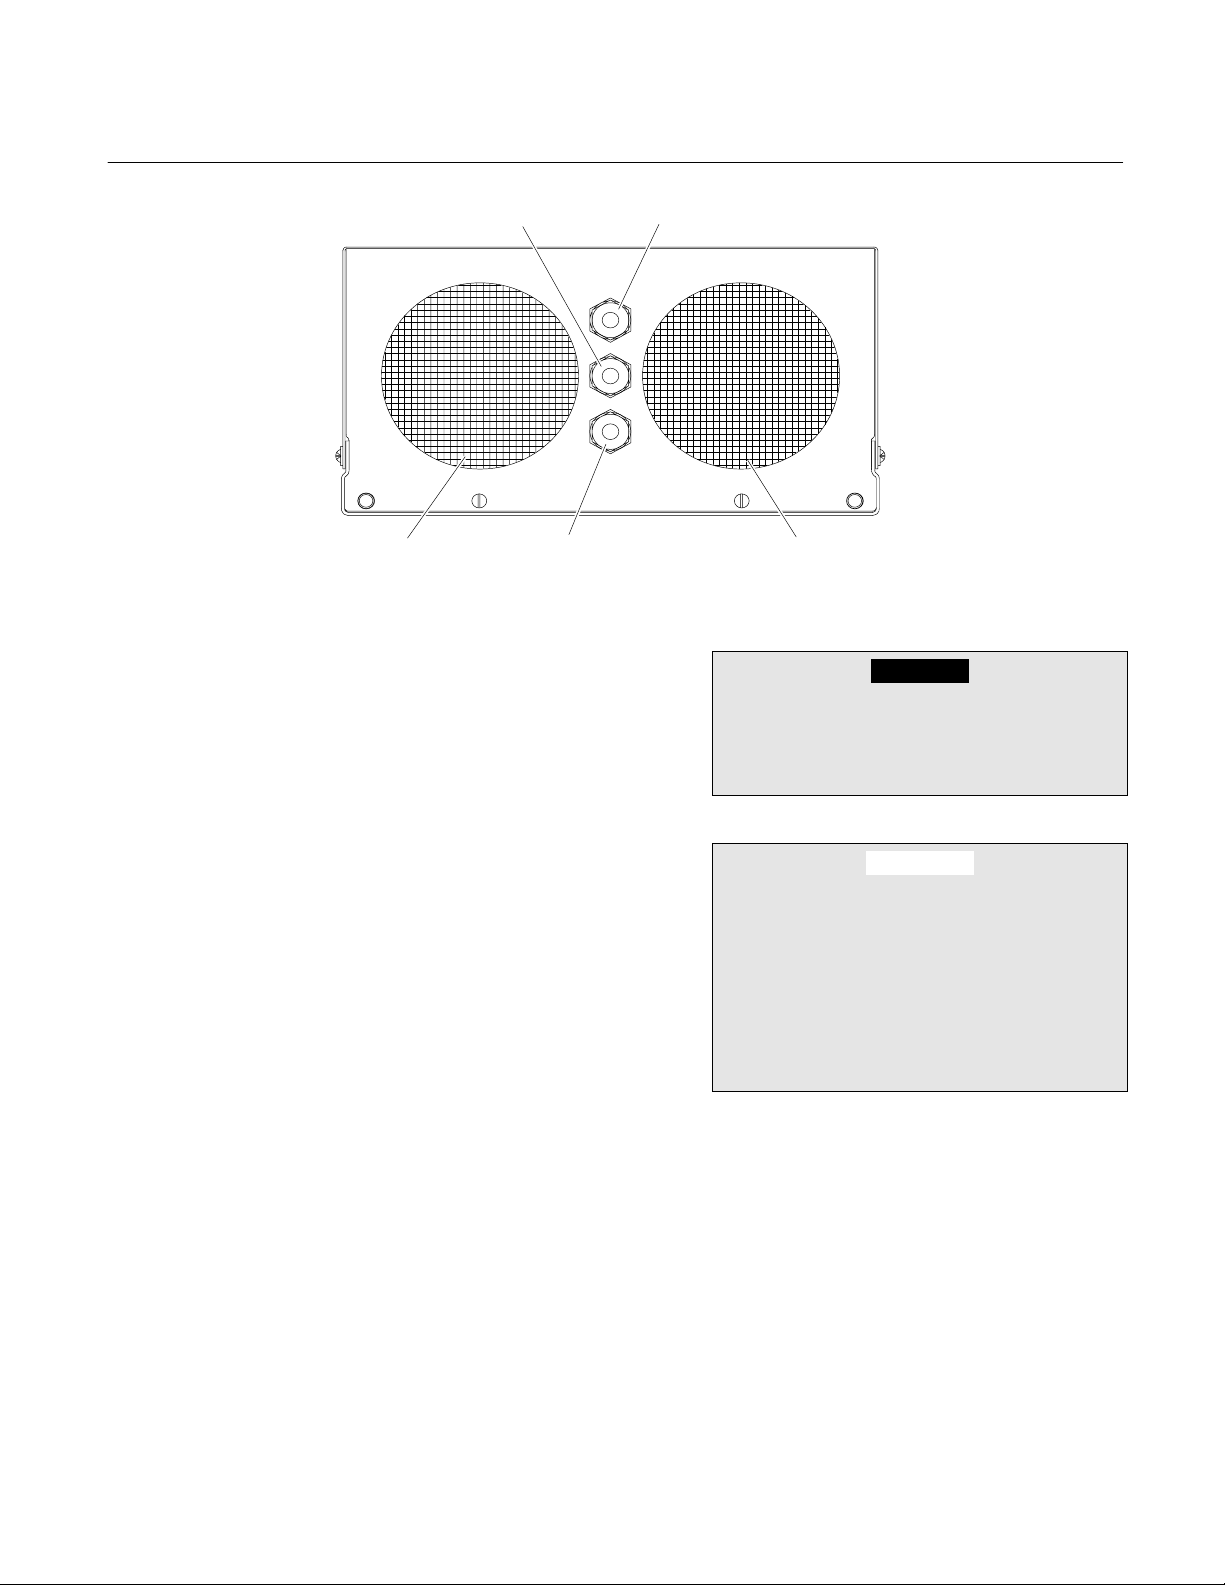
b. Connections
(See Figure 2-2, page 2-3) Connect inlet
and outlet lines for sample, air, and exhaust
to appropriately labeled fittings on the rear
panel, each of which is a 1/4-inch ferrule-type compression fitting.
Stainless steel or Teflon tubing is recommended for the sample line. Exhaust tubing
should be 1/4 inch (6.3 mm) or larger, and
made of stainless steel or Teflon.
MAXIMUM NOx
LEVEL IN PARTS
PER MILLION
GAS SUPPLIED
TO REAR PANEL
AIR INLET
800 Air
2,500 Air
10,000 Oxygen
SETTING ON OZONE
PRESSURE GAUGE
(pressure values:
gauge)
690 hPa (10 psig); provides flow of approximately 500 cc/min. to
ozone generator
690 hPa (10 psig); provides flow of approximately 1000 cc/min. to
ozone generator.
1035 hPa (15 psig); provides flow of approximately 1000 cc/min to
ozone generator.
SETTING ON SAMPLE
PRESSURE GAUGE
(pressure values:
gauge)
344 hPa (5 psig); provides flow of approximately 200 cc/min. to
reaction chamber
344 hPa (5 psig); provides flow of approximately 70 cc/min to
reaction chamber.
103 hPa (1.5 psig); provides flow of approximately 20 cc/min. to
reaction chamber.
CAUTION.
Externally Limit Sample Flow Rate To Less Than 2200 Cc/Min.
Table 2-1. Gas Specifications
2-2 Installation Rosemount Analytical Inc. A Division of Emerson Process Management
Page 25
Model NGA2000 CLD
Instruction Manual
760000-C
November 2002
c. Specifications
Calibration Gases
Either U.S.P. breathing grade air or nitrogen
is recommended for use as zero gas. A mixture of NO or NO
gen is recommended as span gas. For
maximum accuracy, the concentration of
NO in the span gas should be about the
same as that in the expected sample
stream.
Ozonator Source Gas
For analyzers with ranges less than
0 to 2,500 ppm, U.S.P. breathing grade air
should be used for generation of the ozone
required for the chemiluminescence reaction. For ranges greater than 0 to 2,500
ppm, breathing grade oxygen is required.
EXHAUST
EXHAUST FAN SAMPLE IN INTAKE FAN
OZONATOR AIR
Figure 2-2. CLD Rear Panel Connections
At no time should sample flow exceed
2200 cc/min. Damage to internal compo-
in a background of nitro-
2
nents may occur if this flow level is exceeded.
EXTERNALLY RESTRICT SAMPLE FLOW
TO LESS THAN 2200 CC/MIN.
No restrictor is provided in the sample
inlet of this module. For those users
who cannot externally limit sample flow,
accessory restrictor PN 657300 is available from Rosemount Analytical. To obtain this accessory, call 800-433-6076.
WARNING
CAUTION .
Sample
The sample must be clean and dry before
entering the Analyzer Module. Sample
should be filtered for particulates down to
two microns, and should have a dew point
o
5
C (13oF) below coldest ambient tempera-
ture.
Pressure
Between 690 and 1035 hPa-gauge (10 and
15 psig) of ozonator air (or oxygen, if appropriate) should be present at the rear
panel of the module. Bypass sample gas
flow rate should be between 700 and 2000
cc/min. with backpressure regulator pressure (see Capillary Pressure in “Current
Measurement Parameters” menu, which
can be viewed by selecting the PARMS
softkey in “Main Menu”) adjusted to 344
hPa (5 psig).
Rosemount Analytical Inc. A Division of Emerson Process Management Installation 2-3
Page 26
Instruction Manual
760000-C
November 2002
Model NGA2000 CLD
Zero/span gases should be introduced at
the SAMPLE IN fitting at normal sample inlet flow rate.
WARNING
At no time should ozonator gas pressure
exceed 2070 hPa-gauge (30 psig). Damage to internal components may occur if
this pressure level is exceeded.
Leak Test
The CLD Analyzer Module is completely
tested at the factory for gas leakage. The
user is responsible for testing for leakage
only at the inlet and outlet fittings on the
rear panel. Periodically, the user should do
an internal leak test (with a test procedure
chosen by the user).
Contaminants
White crystal deposits on the windows of
the reaction chamber, and the clogging of
capillaries and vent are usually due to sample contaminates such as ammonia reacting
with the high ozone levels and NO components.
To eliminate the contaminates, the sampling
system should be reworked or a preventive
maintenance program developed (if dropout
is not excessive). Another source of crystalline formation is contaminated air.
2-5 ELECTRICAL CONNECTIONS
NOTE
Electrical installation must be in compliance
with National Electrical Code (ANSI/NFPA
70) and/or any applicable national or local
codes.
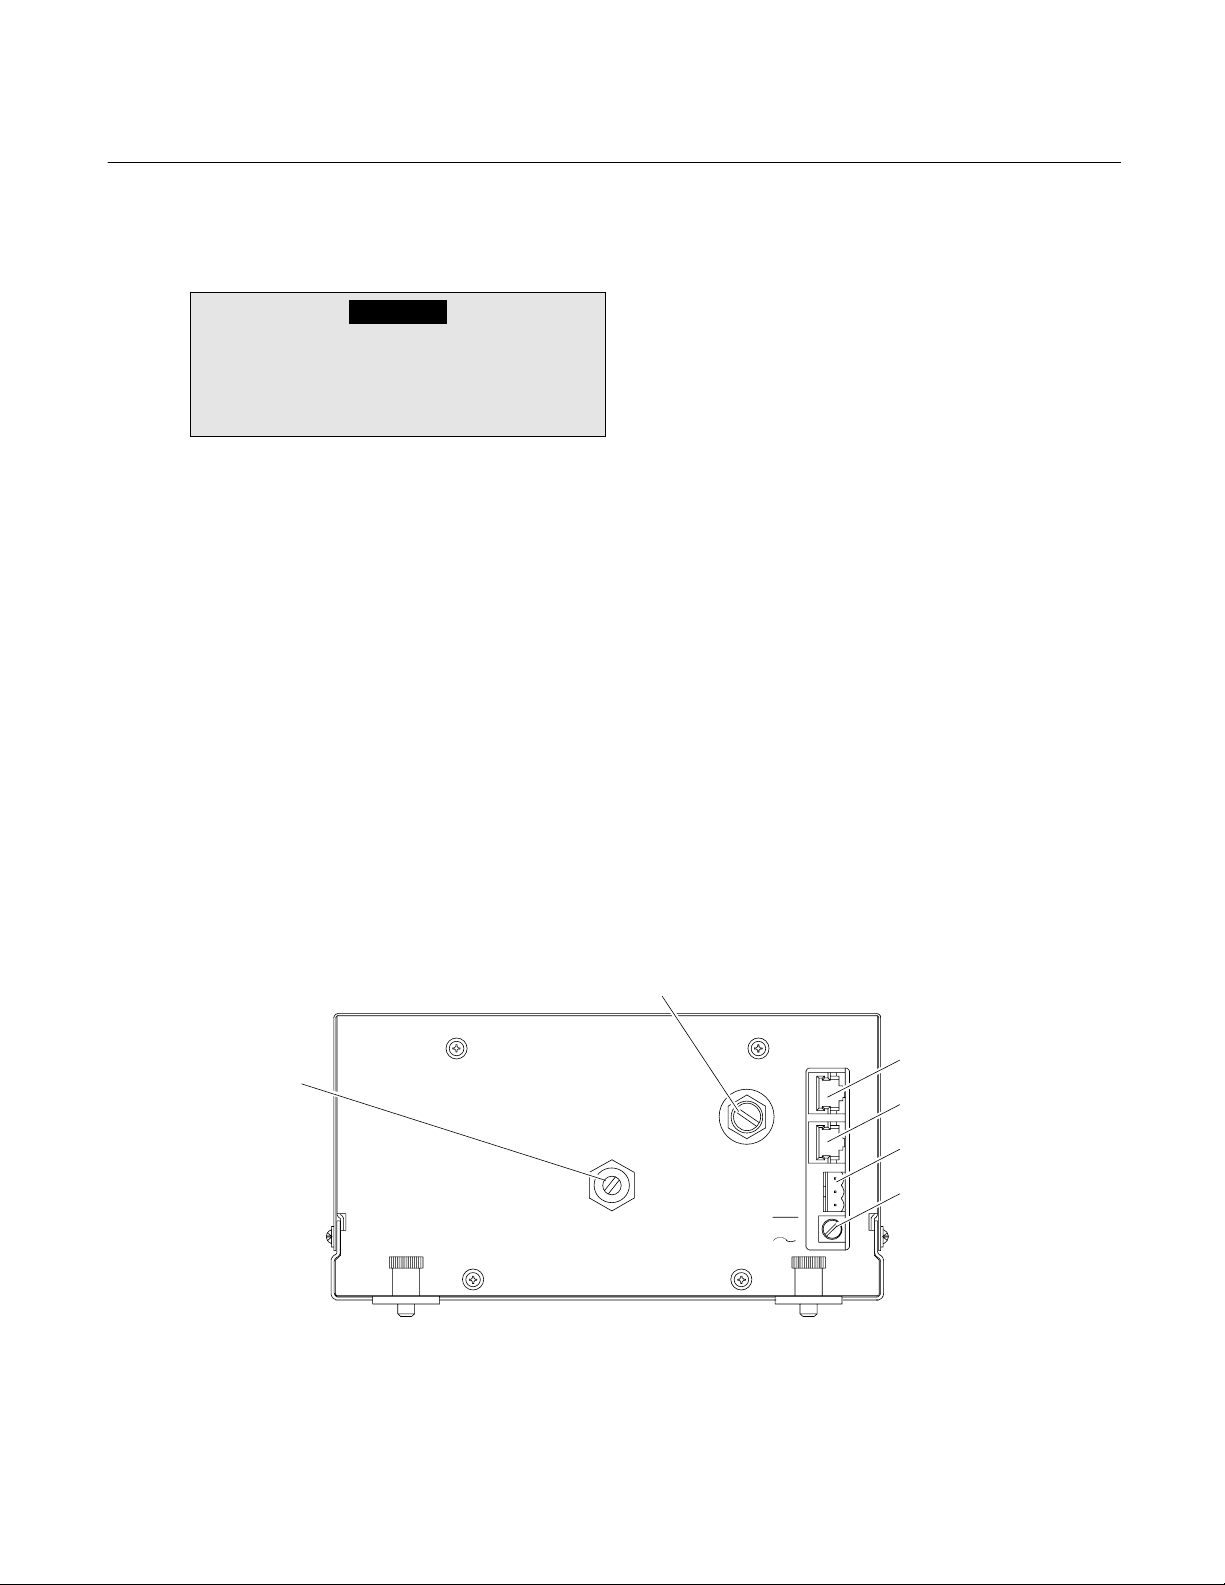
Refer to Figure 2-3, page 2-4. Two electrical
connections are required on the Analyzer Module: POWER and NETWORK. On the Analyzer
Module, two NETWORK connectors are available, either of which is appropriate for:
1. Interconnection with the Backplane of the
Platform. (See instruction manual for the
NGA 2000 Platform).
2. "Daisy-chaining" with other NGA 2000 components.
Connect Analyzer Module POWER to 24 VDC,
120 Watt power source, either the Platform or
external power source.
Metering Valve
Regulator Adjus t
Slot
Flow
Sample
Balance
Regulator
24V
250 V
CLD
LON
1
LON
2
1 +
2 3 GND
T 6A
Network1 Connect ion
Network2 Connect ion
Power Connection
Fuse
Figure 2-3. Front Panel Controls and Electrical Connections
2-4 Installation Rosemount Analytical Inc. A Division of Emerson Process Management
Page 27
Model NGA2000 CLD
5
3
5
4
4
4
Instruction Manual
760000-C
November 2002
POWER SUPPLY BOARD-LON/POWER
MODULE ASSEMBLY 657510
J2
J1
LON/PWR MODULE
656761
J5
3 2 1
RED
CABLE, CONTR OLLER PWR 903034
NC
J6
1 2
1
2
POWER SUPPLY
BOARD 657520
J13
8 7
1
2
J1
10
9
3
12
7
HEATERS
J11
1
10
J3
6
1
12
RED
DETECTOR
658160
CONVERTER HEATER JACKET 655228
J3
E3
E2
E1
GRN
ORN
BLK
GRN
BLK
1
GRN
J2
2
ORN
3
WHT
WHT
THERMISTOR 655216
THERMOSTAT
657298
THERMOSTAT
CONVERTER TEMPERATURE
SENSOR 65528 2
CONVERTER
655250
NC
1
J1
J4
1
J2
COMPUTER ANALYSIS BOARD 655520
1
J3
J5 J6
CABLE, INTERNAL NETWOR K 903035
HARNESS, SIGNAL POWER 655252
CABLE, FLOW SENSOR 655384
PRESSURE
SWITC H (NO)
RED
WHT
BLK
FLOW
SENSOR
902931
4-15 PSIG
662298
BRN (NO)
1
HARNESS, DRIVER POWER 655243
HEATER/THERMOSTAT ASSEMBLY 655235
PHOTODIODE SOCKET ASSEMBLY 655218
NO/NOx
SOLENOID
655263
WHT
WHT
SHLD
GRN
JUMPER
657162
OZONATOR
POWER
SUPPLY
657716
SHIELD
HARNESS, EXPANSION I/O 655249
111
1
J7
2
SAMPLE
PRESSURE
SENSOR
655253
YEL (COM)
OZONATOR
659494
TRANSISTOR
E
2SD1308
C
655264
B
B = YEL
C = RED
E = BLU
RED
SAMPLE
PRESSURE
SENSOR
655254
RED
WHT
BLU
RED
YEL
BLK
ORN
ORN
BRN
WHT
BLK
RED
BLK
RED
WHT
WHT
BRN
BRN
YEL
J6
4
3
J8
2
1
J9
J1
J13
BRN
1 4 5 6
GRN
WHT
RED
3
J2
2
1
3
J1
2
1
J4 2
1
2
1
3
J9
2
1
1
2
3
4
J8
5
6
7
8
4
3
J5
2
1
4
3
J12
2
1
12
10
J5
J3
SIGNAL BOARD 655580
1 2 3 4 5 6 7 8 9
SHLD*
ORN
GRN
WIRE*
YEL
WHT
BLU
BLK
*COAX CABLE
RED
J11
1 2 3 6
J2
GRN
WHT
BLK
RED
BLK
WHT
RED
RED
4 3 1
J10
J3
DRIVER BOARD
655620
3
J11
1
J2 J6
10
2
1
2
CABLE, ANALO G I/O 903033
BLK
WHT
BLK
7 6
1
8
CABLE, DIGIT AL I/O 655246
CABLE, DIAGNOSTICS 903032
24
1 Optional in Bypass Flow
Sensor Configuration.
FAN 655245
FAN 655245
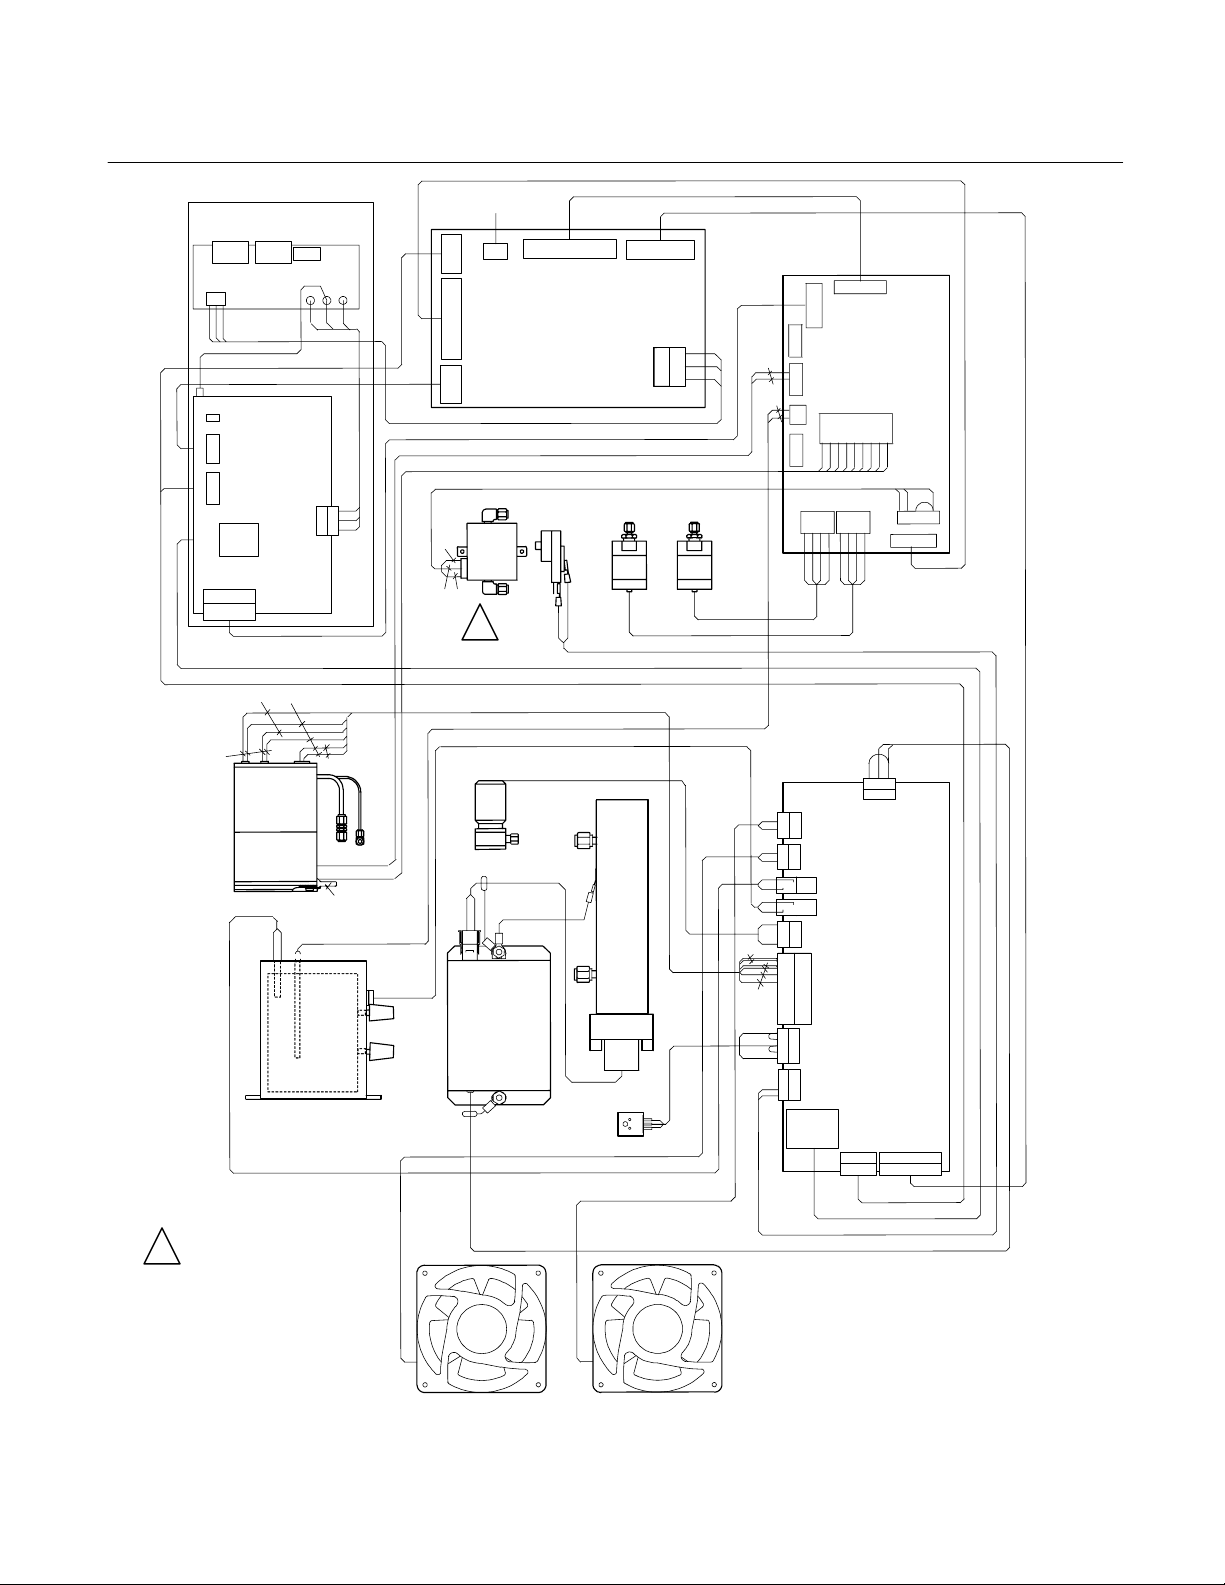
Figure 2-4. CLD Wiring Diagram
Rosemount Analytical Inc. A Division of Emerson Process Management Installation 2-5
Page 28

Instruction Manual
[
]
[23].9[23].9[33]
760000-C
November 2002
.5
[13]
Dimensions:
INCHES
[MM]
8.4
[213]
8.2
[208]
6.1
[155]
6.0
[152]
17.5
[445]
4.3
[109]
1.3
2.5
[64]
1.5
[38]
1.1
[28]
4.1
[104]
4.1
4.1
104
Figure 2-5. Outline and Mounting Dimensions
Model NGA2000 CLD
.4
[10]
.7
[18]
[20]
2.8
[71]
.8
1.3
[33]
2-6 Installation Rosemount Analytical Inc. A Division of Emerson Process Management
Page 29

Model NGA2000 CLD
y
Instruction Manual
760000-C
November 2002
SECTION 3
OPERATION
3-1 OVERVIEW
Once the CLD has been correctly assembled
and installed, the analyzer is ready for operation.
Before operating the system, verify that the
Leak Checks have been performed in accordance with Section 2-4, page 2-2.
For the remainder of this section, Analyzer
Module interconnection with a Platform or
some interfacing component is assumed. Display and Keypad information refers to that
which the user can expect to see and do with
regard to the Front Panel of the Platform.
CLD
Sample flow: 1300 ml/min 200 1500
Sample press: 4.0 hPa 50.0 490.0
Ozonator: OFF – PRESS. SW.
Converter temp: 30.9 C 150.0 500.0
Displa
3-2 DISPLAYS & OPERATING KEYS
The LCD screen shows all measurement values of the analyzer, status values and all user
menu instructions. Operation is performed
with five function softkeys, four arrow (cursor)
softkeys and the enter softkey. The function of
each softkey varies depending on the installed
analyzer module, any auxiliary modules installed, and the individual menu displayed.
In case of power failure, all user defined specific module parameters are saved by a battery powered memory.
7.50
0.00 Range: 1 10.00
Status… Main… Channel BasicCal
ppm NO
Figure 3-1. Measure Mode Display
The Function Keys, also called softkeys, are
assigned values depending on the menu or
a menu or to select numeric digits for adjust-
ment.
screen being displayed. The legend is displayed above the softkeys.
The
Enter Key is used to confirm a previously
entered variable value, to start a selected
function or to go to a submenu selected at a
menu line as opposed to the Function Keys.
As an alternate to using the Enter Key to start
a. Menu Lines & Softkey Functionality
Menu lines can be selected with the ↑
softkey or the ↓ softkey. The selected line
is displayed as white lettering on a black
background (highlighted). Menus can contain four different types of lines:
a function, the → softkey can be used.
Menu Line – A line ending with three dots
The
Cursor Keys (↑ or ↓) are used to move
up or down the lines within a menu or to increment and decrement number variables.
(…) indicates that it leads to a submenu.
The submenu can be activated by pressing the ↵ softkey or the → softkey when
the line is highlighted.
Cursor Keys (← or →) are used to move
The
backwards or forwards between the pages of
Rosemount Analytical Inc. A Division of Emerson Process Management Operation 3-1
Page 30

Instruction Manual
760000-C
November 2002
Model NGA2000 CLD
Function Line – A line ending with an
exclamation point (!) indicates that it will
start a function. The function can be activated by pressing the ↵ softkey or the →
softkey when the line is highlighted.
Variable Line – A line ending with a colon
(:) indicates that it displays a module variable parameter. Some parameters can be
changed and some parameters display
only a status and cannot be changed. Parameters that cannot be changed will be
displayed below a line within the menu.
Text Line – A line without punctuation
marks only displays information.
Tag Line – At the top of each menu page
is the tag line of the current channel. To
the right of the Tag is the value of the indicated channel.
The Function Keys (Softkeys) can sometimes be assigned as Functions (exclamation point) or Submenus (three dots) as
shown below.
b. Common Function Keys
Display
ponent display to the multi-component
display. F1 in the single component display.
Measure – Change from menus and
submenus to the single component display of the selected channel. F1.
Status – Change to the menu “Current
measurement parameters” which displays
the most important parameters and information about the status of the current
channel or module. F2 if available. (See
Section 3-4a, page 3-8)
– Change from the single com-
Channel – Scrolls through the channels
in the same menu. In the main menu and
the single component display menu it
moves between the channels of the connected analyzers and analyzer modules.
In the submenus it moves only between
the channels of the current analyzer or
analyzer module. F3 if available, F4 in the
single component display.
Lock – Changes to the main menu and
locks all three operation levels, if a security code is enabled in the system configuration (See Section 3-11d, page 3-35).
F4 in the main menu.
BasicCal – Change from the single com-
ponent display to the menu “Basic Controls and Setup.” F5 in the single
component display. (See Section 3-5,
page 3-10)
MFG Data – Change from the main menu
to the menu “Manufacturing Data” which
displays further submenus with information about the control module and analyzer module, such as address of the
manufacturer, serial number of the modules and software and hardware versions.
F5 in the main menu. (See Section 3-2f,
page 3-4 and Figure 3-6, page 3-5)
More – Changes to an additional menu
page of the current menu. F3 or F5 if
available.
ESCAPE/Back – Returns to the previous
menu. Usually F2 or F4. When changing
a variable, the previous value is displayed
above the Back softkey. Pressing the
Back softkey restores the previous value.
INFO – Context sensitive help screens for
the current menu.
Main – Change from single component
display to the main menu. F3 in the single
component display. (See Section 3-2e,
page 3-4)
HOME – Change for various menus to the
main menu. F1.
3-2 Operation Rosemount Analytical Inc. A Division of Emerson Process Management
Page 31

Model NGA2000 CLD
g
Y
y
y
play
y
g
c. Entering & Changing Variables
1. Select the variable line desired to be
changed using the ↑ softkey or the
↓ softkey. The selected line will be
highlighted white on black.
2. Press the ↵ softkey and the pa-
rameter will be selected for modification.
3. The F2 softkey changes to “Back…”
and the previous value of the variable shows above it for easy reference. When the variable being
changed is numeric, the F4 softkey
changes to “+/-“ to allow changing of
the sign from positive to negative if
applicable.
4. Use the ↑ softkey or the ↓ softkey
change the entire value, scroll
among the available variables or
change the value of a selected digit
or character.
5. Use the ← softkey or the → softkey
to select digits within a number. For
some variables the quantity of digits
or characters can be changed.
6. Press the ↵ softkey again to confirm
the new value.
Tag Line
Menu Line
Function Lines
Variable Lines
CLD 7.50 ppm
Analyzer basic controls (calibration) & setup…
Anal
zer and I/O, expert controls & setup…
stem configuration and diagnostics…
S
Dis
Time & Date:
stem tag:
S
Measure
-- Main Menu --
controls…
Status… Channel Lock… MFG Data
Figure 3-2. The Display Screen
d. Starting a Function
Instruction Manual
760000-C
November 2002
Selected Line
(Reverse Text)
Lines below this separator
are information and cannot
be chan
Function softkeys F1 – F5 Legend
CLD 7.50 ppm
Displayed concentration digits: 4
Digits after decimal point: 2
Module identification tag: CLD
Si
Signal on mini-bargraph – 2: Sample press
Signal on mini-bargraph – 3: Ozonator OFF – PRESS SW
Signal on mini-bargraph – 4: Converter temp
Measure
-- Measurement Display Configuration --
nal on mini-bargraph – 1: Sample flow
Back…
Figure 3-3. Changing Variables
Pressing the ↵ softkey or the → softkey
while a function line is highlighted will
bring up a confirmation menu as shown
below.
Pressing the Yes (F2) softkey will start the
function immediately.
Pressing the Back… (F4) softkey will return to the previous menu page.
CLD 7.50 ppm
-- Confirmation Required –
Do you really want to do this ??
Press “Yes” or “Back…”
es
Figure 3-4. Function Confirmation
ed.
Back…
Display
Rosemount Analytical Inc. A Division of Emerson Process Management Operation 3-3
Page 32

Instruction Manual
A
A
760000-C
November 2002
Model NGA2000 CLD
e. Measure Mode Display
The Measure Mode is the normal mode of
operation. In this mode, the Display will
show the current gas measurement, the
component of interest, the current operations of the softkeys, and several graphics. A bar representing the displayed
concentration is shown as a percent of
full-scale and up to four lines showing
user selectable secondary parameters
from either the Analyzer Module or any IO
module bound to it. See the Platform
manual for information as to how to select
these. The Measure Mode display is
shown in Figure 3-1, page 3-1.
If more than one Analyzer Module is connected to the system, an additional Run
Mode display will show as many as four
(five for version 2.3 and later) gas measurements on the display screen.
f. Main Menu
Pressing the Main… (F3) softkey or the →
softkey while in any single component
display will bring up the Main Menu. From
the Main menu it is possible to change all
operating values of the analyzer to set up
and control the parameters of measurement, calibration and data transfer. The
sub menus of the Main Menu are shown
in Figure 3-7, on page 3-6
From the Main menu, the MFG Data (F5)
softkey will access several submenus
showing the manufacturing and version
data of the analyzer as shown in Figure
3-6, page 3-4.
Selection from the Main menu:
Measure (F1) – Changes to the single
component display of the current channel.
See Section 3-4b, page 3-8.
Status… (F2) – Changes to the “Current
measurement parameters” menu of the
current channel. See Section 3-4a, page
3-8.
Channel (F3) – Scrolls through all chan-
nels of the connected Analyzers and Analyzer modules.
Lock… (F4) – Locks any operating level
by security code. See Section 3-11d,
page 3-35.
MFG Data (F5) – Changes to “Module
Manufacturing Data” menu. See Figure
3-6, page 3-5.
CLD 7.50 ppm
-- Main Menu --
nalyzer basic controls (calibration) & setup…
nalyzer and I/O, expert controls & setup…
System configuration and diagnostics…
Display control s…
Time & Dat e: 10:30:05 August 10 2001
System tag: Fisher-Ro semount
Measure Status… Channel Lock… MFG Data
Figure 3-5. Main Menu Display
3-4 Operation Rosemount Analytical Inc. A Division of Emerson Process Management
Page 33

Model NGA2000 CLD
y
g
g
y
g
g
y
g
y
y
play
y
Instruction Manual
760000-C
November 2002
CLD 7. 50 ppm
Analyzer basic controls (calibration) & setup…
zer and I/O, expert controls & setup…
Anal
S
stem configuration and di agnostics…
Dis
controls…
Time & Date: 10:30:05 August 10 2001
S
stem tag: Fisher-Rosemount
Measure
-- Main Menu --
Status… Channel Lock… MFG Data
CLD 7. 50 ppm
Control module manufacturing data…
Anal
-- Module Manufacturin
zer module manufacturing data…
Data --
CLD 7. 50 ppm
-- Control Module Manufacturin
(C) 2001 Fisher-Rosemount MFG GmbH & Co OHG
Manufactured by:
Fisher-Rosemount GmbH & Co OHG
Industriestrasse 1
D-63594 Hasselroth / Germany
Tel: (+49) 6055 884-0
FAX: (+49) 6055 884-209
Data --
Measure
Status… Back…<<< >>>
Measure
Or… More…
Back…
CLD 7. 50 ppm
More…
Bench confi
-- Anal
zer Module Manufacturing Data --
uration code: CLA – low range
Minimum ran ge: 10 .0 ppm
Maximum range: 10000 ppm
Diode s/n, block s/n: 0000, 0000
Capillary: 200.0 ml/min
Flow sensor: Present
HOME
ESCAPE RESET STORE INFO
CLD 7.5 0 ppm
Revision date: May 8 2001
Revision time: 15:30:02
Phrase dictionary version: P012/01/00
Language: English
Measure
-- Control Module Version Information --
Serial number: CM1
Manufacturi ng date: 20 04 01
Hardware revision: ACU02 R 3.3.1.D April 01 2001
Software revi sion: 3.6 0 / P010
Back…
CLD 7.5 0 ppm
Measure
-- Control Module Manufacturin
(C) 2001 Fisher-Rosemount
Manufactured by:
Rosemount Analytical Inc.
4125 East La Palma Avenue
Anaheim, CA 92807-1802 / USA
Tel: (714) 986-7600
FAX: (714) 577-8739
Or… More…
Data --
Back…
CLD 7. 50 ppm
Measure
-- Control Module Manufacturin
(C) 2001 Fisher-Rosemount
Manufactured by:
Rosemount Analytical Inc.
4125 East La Palma Avenue
Anaheim, CA 92807-1802 / USA
Tel: (714) 986-7600
FAX: (714) 577-8739
Or… More…
Data --
Back…
CLD 7.5 0 ppm
-- Anal
zer Module Version Information --
Serial number: CLD1
Manufacturing date: 08 08 01
Hardware revision: 1.0
Software revi sion: 3.6 0 / P012
Revision date: August 8 2001
Revision time: 03:26:15
Measure
Back…
Figure 3-6. Module Manufacturing Data Displays
Rosemount Analytical Inc. A Division of Emerson Process Management Operation 3-5
Page 34

Instruction Manual
y
y
y
play
y
p
y
play
pp
760000-C
November 2002
CLD 7.5 0 ppm
Anal
zer basic controls (calibration) & setup…
zer and I/O, expert controls & setup…
Anal
S
stem configuration and diagnostics…
Dis
controls…
Time & Date: 10:30:05 August 10 2001
S
stem tag: Fisher-Rosemount
Measure
-- Main Menu --
Status… Cha nnel Lock… MFG Data
Figure 3-7. Main Menu Sub Menus
Model NGA2000 CLD
CLD 7.50 ppm
Measurement range number: 1
Range upper lim it: 10.0 ppm
Automatic range change control: Disabled
Ranges with valid calibration: None
Calibration status: READY
Span gas concentration: 10.0 ppm
Status: STANDBY
Measurement mode: NO
Ozonator status: OFF – PRES. SW.
Ozonator
CLD 7.50 ppm
Analyzer module controls…
System & network I/O module controls…
Analyzer module setup…
System & network I/O module setup…
(Note: Controls & setup are identical for MLT/TFID)
Measure
CLD 7.50
System calibration…
Diagnostic menus…
Load/Save configuration (CMMCA)…
Date and time…
Security codes…
Network module management…
System reset…
Pump 1: Off
Pump 2: Off
Measure
CLD 7.50 ppm
Measure
ower: Enabled
HOME
-- Anal
-- System Configuration and Diagnostics --
Brightness: 70%
Contrast: 23%
Switch automatically to “Measure” after: 30 s
Switch off backlight after: Never
-- Basic Controls
NO/NOx
zer and I/O, Expert Controls and Setup --
ZERO INFO
Channel
Channel
-- Dis
Back…
Back…
Controls --
Back…
SPAN
m
3-6 Operation Rosemount Analytical Inc. A Division of Emerson Process Management
Page 35

Model NGA2000 CLD
Instruction Manual
760000-C
November 2002
3-3 STARTUP & INITIALIZATION
Apply power to the CLD Analyzer Module. If it
is associated with a Platform, do this by plugging in the Platform to a power source. The
Platform has no ON/OFF power button. Once
power has been supplied to the Platform, the
CLD Analyzer Module will be energized.
After switching on the CLD, the analyzer will
begin its booting procedure which is apparent
on the LCD screen. The first part of the initialization procedure is a self check of the
software and analyzer components. Various
displays will show the status of the initialization including revision notes, “Initializing network interface,” “Searching for nodes,”
“Scanning Module 2: CLD, 12% Complete,”
and “Calculating bindings.”
If the user's system contains only one Analyzer Module, all system components, the
Controller Board and the network "self-install"
(bind together) during initial startup. If the system contains more than one Analyzer Module,
the startup sequence will interrogate the network to locate and identify all components on
the network. The user will have to bind appropriate combinations of components after the
startup sequence. See the Platform manual
for instructions on binding combinations of
modules.
Pressing the F1 softkey during initializing will
reset the LCD brightness and contrast to factory settings (See Section 3-6, page 3-11).
Pressing the F3 softkey will abort the network
initializing, aborting any connection to other
analyzers. In that case, only the menus of the
local analyzer will be available.
ozonator air pressure and sample flow rate
are within specifications (see page 1-4). Calibrate and adjust converter efficiency, and begin routine operation as the following sections
indicate.
(C) 2001 FISHER-ROSEMOUNT Analytical
NGA-2000 Control-Module Rev. 3.6.0 /P010
Language: P012/01/00
Initializing Network
Initializing network interface
LCDReset
Abort
Figure 3-8. Startup Display
a. Routine Operation
The CLD Analyzer Module is designed to
continuously analyze the sample stream.
Normally, it is never powered off except
for servicing or for a prolonged shutdown.
Maximum permissible interval between
calibrations depends on the analytical accuracy required, and therefore cannot be
specified. Initially, the instrument should
be calibrated at least once every eight
hours. This practice should continue until
experience indicates that some other interval is more appropriate.
At the end of the initializing routine the
“measure” screen will display as shown on the
next page. This screen is the access to all
other channels, menus and submenus. The
actual display may differ from that shown depending on any custom configuration as described in Sections 3-7h, page 3-18 and
Section 3-7j, page 3-19.
After the warm-up period (about one hour for
the CLD Analyzer Module), all modules are
completely functional. Establish that correct
Rosemount Analytical Inc. A Division of Emerson Process Management Operation 3-7
Page 36

Instruction Manual
p
p
y
y
A
y
760000-C
November 2002
Model NGA2000 CLD
3-4 BASIC CONTROLS AND STATUS
The following sections describe the basic control of the analyzer and the viewing of channel
parameters. Examples of stepping through the
menus are shown so that the user can become familiar with the operation, keeping in
mind that displays and menu choices may be
different depending on actual analyzer configuration and any customization of the
menus.
a. Analyzer Channel Status
The analyzer status is displayed in the
Current measurement parameters display.
To access the Current measurement parameters display:
Main Menu [Measure (F1)]
↓
Measurement Mode [STATUS(F2)]
↓
Current measurement parameters
CLD 7.50 ppm
Analyzer gas measured: NO
Measurement range number: 1
Range change control: Local
Linearization mode: Disabled
Analyzer operational state: STANDBY
Analyzer alarm state: NORMAL
Alarms reported: FAILURE
Current total variable updates per second: 24
HOME
-- Current measurement
ESCAPE MORE INFO
arameters --
From the Current measurement parameters menu an additional sub menu is
available with additional parameters.
Press MORE (F3) to access the next
menu.
CLD 7.50 ppm
Response time: 3.0 s
Bypass flow: 1300 ml/min.
Capillary pressure: 4.0 hPa
Detector pressure: 38.8 c
-- Current measurement
arameters --
HOME
ESCAPE MORE INFO
Press ESCAPE (F2) or MORE (F4) to return to the first menu or HOME (F1) to return to the Main menu display.
b. Single Component Display
The Measure menu that displays after
startup is the Single Component display
of the analyzer. If other analyzer modules
are connected to the Platform, it is possible to display them using the following
steps to change the channel of the single
component display:
From the Measure Mode display, press
Channel (F4) to change to the Single
Component Display of any other installed
Analyzer Modules.
Example: Changing from CLD (channel 1)
to CO
(channel 2). Continue pressing
2
Channel (F4) to display the desired channel depending on the installed analyzer
configuration, ultimately returning to the
first channel.
CLD
7.50
0.00 Range: 1 10.00
Sample flow: 1300 ml/min 200 1500
Sample press: 4.0 hPa 50.0 490.0
Ozonator: OFF – PRESS. SW.
Converter temp: 30.9 C 150.0 500.0
Displa
MLT/CH1/R2
Temperature: 37.0 C 0.0 100.0
Maintenance Requests: No
ny alarms: No
Operation: Ready
Displa
CLD
Sample flow: 1300 ml/min 200 1500
Sample press: 4.0 hPa 50.0 490.0
Ozonator: OFF – PRESS. SW.
Converter temp: 30.9 C 150.0 500.0
Status… Main… Channel BasicCal
2.50
0.00 Range: 2 5.00
Status… Main… Channel BasicCal
7.50
0.00 Range: 1 10.00
ppm NO
% CO2
ppm NO
Displa
3-8 Operation Rosemount Analytical Inc. A Division of Emerson Process Management
Status… Main… Channel BasicCal
Page 37

Model NGA2000 CLD
y
A
[2]
[2]
y
Instruction Manual
760000-C
November 2002
c. Multi Component Display
If other analyzer modules are connected
to the Platform, it is possible to display up
to five using the following steps to change
from the single component display to the
multi component display as follows:
From the single channel display (Measure) press Display (F1) to change to the
Multi Component Display of all other installed Analyzer Modules.
Changing to the multi component display
can be done from each single component
display.
CLD
7.50
0.00 Range: 1 10. 00
Sample flow: 1300 ml/min 200 1500
Sample press: 4.0 hPa 50.0 490.0
Ozonator: OFF – PRESS. SW.
Converter temp: 30.9 C 150.0 500.0
Displa
Status… Main… Channel BasicCal
ppm NO
MLT/CH1
% CO2
MLT/CH2
ppm CO
>
7.50
2.50
95.00
Select
Status… Tags Off LCDReset
CLD
0.00 [1] 10.00
0.000
0.00
ppm NO
5.00
250.00
Each bargraph shows the start and end of
the range for the respective channel. The
number in parentheses indicates the
number of the selected range for that
channel. (F.S. = full scale)
(Display may look different depending on
installed analyzers.)
Use the F3 softkey (Tags Off) to turn the
analyzer tags on or off.
To select a single channel display in the
multi channel display, enable the select
symbol (>) by pressing the F1 softkey or
the ↓ softkey.
Then use the ↓ or ↑ softkey to select the
line for the desired channel. When the
desired channel is marked, select it for
single component display by pressing the
F1 softkey.
MLT/CH1
2.50
% CO2
0.00 Range: 2 5.00
Temperature: 37.0 C 0.0 100.0
Maintenance-Request No
ny-alarms: No
Operation: Read y
Displa
Status… Main… Chann el BasicCal
Rosemount Analytical Inc. A Division of Emerson Process Management Operation 3-9
Page 38

Instruction Manual
760000-C
November 2002
Model NGA2000 CLD
3-5 BASIC CONTROLS
To access the Basic Controls menu:
Measurement Mode [BasicCal (F5)]
Or
Main Menu
↓
Analyzer basic controls (calibration) &
setup…
CLD 7.50 ppm
Measurement range number: 1
Range upper limit: 10.0 ppm
Automatic range change control: Disabled
Ranges with valid calibration: None
Calibration status: READY
Span gas concentrati on: 10.0 ppm
Status: STANDBY
Measurement mode: NO
Ozonator status: OFF – PRES. SW.
Ozonator power: Enabled
HOME
-- Basic Controls --
NO/NOx
ZERO INFO
Figure 3-9. Basic Controls Menu
The Basic Controls menu is used to set the
range, initiate and exit a quick start and exit
the sleep mode.
Measurement range number:
SPAN
See Section 3-7a, page 3-12 to change the
begin and end concentration values for each
of the four ranges.
Automatic range change control:
When enabled, the CLD analyzer module will
change ranges automatically when the present range is exceeded.
Span gas concentration:
Allows setting of the calibration span gas concentration. The default is the range upper
limit.
Ozonator Power:
Used to turn off (Disable) the ozonator. For
applications where measurements are made
infrequently but the analyzer is to remain on to
avoid the warm-up period, the CLD would be
placed in Standby mode and the Ozonator
could be Disabled to conserve the life of the
lamp and converter.
NO/NOx (F2)
Press the F2 softkey to toggle the measurement mode between NO and NOx.
To select one of the four ranges of the CLD
analyzer, Move the cursor to the “Measurement range number:” line and press the ↵
softkey. Change the range number using the
↑ and ↓ softkeys and then press the ↵ softkey
again to save the selection.
ZERO (F3) / SPAN (F4)
To ZERO (F3) or SPAN (F4) the analyzer,
flow the appropriate gas, select the correct
range and press the appropriate softkey. Do a
zero before span!
3-10 Operation Rosemount Analytical Inc. A Division of Emerson Process Management
Page 39

Model NGA2000 CLD
Instruction Manual
760000-C
November 2002
3-6 DISPLAY CONTROLS
Main Menu
↓
Display control…
CLD 7.50 ppm
Brightness: 70 %
Contrast: 23 %
Switch automatically to “Measure” after: 30 s
Switch off backlight after: Never
Measure
-- Display Controls --
Figure 3-10. Display Controls Menu
The Display Controls menu is used to adjust
the display parameters.
Brightness and Contrast:
These controls can be adjusted to accommodate the ambient lighting conditions. The
range of values are 20-100% for brightness
and 1-45% for contrast.
These values can be reset to the defaults
from the Multi Channel display screen (Section 3-4c, page 3-9) by pressing LCDReset
(F1) function softkey and from the Start up
display (Figure 3-8, page 3-7) by pressing
LCDReset (F5).
Switch automatically to “Measure” after:
This variable line allows setting of the delay
time before any selected menu switches back
to the Measure screen. The selectable values
are:
10 sec
30 sec
1 min
5 min
10 min
30 min
Never
Switch off backlight after:
This variable line allows setting of the delay
time before switching off the backlight of the
display screen. The selectable values are:
10 sec
30 sec
1 min
5 min
10 min
30 min
Never
Rosemount Analytical Inc. A Division of Emerson Process Management Operation 3-11
Page 40

Instruction Manual
g
p
y
760000-C
November 2002
Model NGA2000 CLD
3-7 ANALYZER AND I/O, EXPERT CONTROLS
AND SETUP
Main Menu
↓
Analyzer and I/O expert controls & setup…
CLD 7.50 ppm
Analyzer module controls…
System & network I/O module controls…
Analyzer module setup…
System & network I/O module setup…
(Note: Controls & setup are identical for MLT/TFID)
zer and I/O, Expert Controls and Setup --
-- Anal
Measure
Channel
Back…
Figure 3-11. Analyzer and I/O Expert Controls
and Setup Menu
The Expert Controls and Setup menus provide for the configuration of system and network I/O (SIO & DIO), and for the
configuration of various functions on the CLD
analyzer module:
softkeys and then press the ↵ softkey again to
save the selection.
CLD 7.50 ppm
Measurement range number: 1
Range upper limit: 10.0 ppm
Range settings…
Range and functional control: Local
Measurement mode: NO
Ozonator status: OFF – PRES. SW.
Ozonator power: Enabled
Zero/Span calibration…
Ranges with valid calibration: None
Physical measurements…
HOME
-- Ex
ert Controls --
CAL
NO/NOx
Figure 3-12. Expert Controls Menu
Range and functional control:
Local = Range control by the menus
Inputs I/O module = Range control by remote
communication
Program I/O module = Range control by the
I/O module
a. Range Settings
INFOESCAPE
NOTE
Whenever the “Channel” tag appears
above the F3 softkey, pressing F3 will
switch to any other installed analyzer
modules, one after the other and eventually back to the CLD module. When activating any other installed module, the menus
will be different depending on that module.
See each module’s manual for a description of those menus.
In the “Analyzer and I/O expert controls and
setup” menu, select “Analyzer module control…” . The “Expert Controls” menu will display as shown in Figure 3-12.
NOTE
Zero/Span calibration… is described in
Section 3-8c, page 3-23.
Measurement range number:
To select one of the four ranges of the CLD
analyzer, Move the cursor to the “Range
number:” line and press the ↵ softkey.
Change the range number using the ↑ and ↓
Used to change the upper and lower limit
for each of the four ranges. select Range
settings… from the Expert Controls menu.
Main Menu
↓
Analyzer and I/O expert controls &
setup…
↓
Analyzer module controls…
↓
Range settings…
CLD 7.50 ppm
Minimum range: 10.0 ppm
Maximum range: 10000 ppm
Range 1 lower limit: 0.0 ppm
Range 1 upper limit: 10.0 ppm
Range 2 lower limit: 0.0 ppm
Range 2 upper limit: 25.0 ppm
Range 3 lower limit: 0.0 ppm
Range 3 upper limit: 100.0 ppm
Range 4 lower limit: 0.0 ppm
Range 4 upper limit: 250.0 ppm
HOME
ESCAPE
-- Ran
e Settings --
INFO
Figure 3-13. Range Settings Menu
3-12 Operation Rosemount Analytical Inc. A Division of Emerson Process Management
Page 41

Model NGA2000 CLD
y
p
Instruction Manual
760000-C
November 2002
To change any of the limits, move the
cursor to the desired line and press the ↵
softkey. Change the limit value using the
↑ and ↓ softkeys and then press the ↵
softkey again to save the selection.
Press the ESCAPE (F2) softkey before
pressing the ↵ softkey to restore the previous value.
The Range Settings menu is also accessible from Gas Measurement Parameters
menu (Figure 3-16).
The Analyzer Module will not allow the
user to increase the upper limit of a range
beyond the maximum range software setting. To change the Maximum Range
value, select “Range x upper limit”, and
use the arrow softkeys to scroll the indicated value. The same applies for the
“Range x lower limit” value.
b. Physical Measurements
Use the Physical Measurements menu to
view various conditions of the CLD module and to adjust the bypass flow limits.
Main Menu
Analyzer and I/O expert controls &
Analyzer module controls…
Physical measurements…
CLD 7.50 ppm
Bypass sample flow: 1300 ml/min
Flow lower limit: 200 ml/min
Flow upper limit: 1500 ml/min
Sample pressure: 3.4 hPa
Ozone supply pressure: 2.7 hPa
Sensor block temperature: 29.6 C
sical Measurements --
-- Ph
HOME
Figure 3-14. Physical Measurements
↓
setup…
↓
↓
NO/NOx
Menu
The bypass flow path is used to increase
the response time of the detector. Upper
and lower limits can be set to trigger a diagnostic alarm.
To change any of the limits, move the
cursor to the desired line and press the ↵
softkey. Change the limit value using the
↑ and ↓ softkeys and then press the ↵
softkey again to save the selection.
Press the Back (F2) softkey before pressing the ↵ softkey to restore the previous
value.
The normal value for bypass flow is 7002000 cc/min.
c. Concentration Alarms
Use the Concentration Alarm Setup menu
to establish or change the alarms for the
sample gas concentration measurement.
(Calibration parameters are described in
Section 3-8a on 3-21)
Main Menu
↓
Analyzer and I/O expert controls &
setup…
↓
Analyzer module setup…
↓
Concentration alarms…
CLD 7.50 ppm
Alarm generation is: On
Level for Low-Low alarm: 0.000
Level for Low alarm: 0 .000
Level for High alarm: 9.000
Level for High-High alarm: 10.000
Alarm delay: 1.0 s
Low-Low alarm: On
Low alarm: On
High alarm: On
High-High alarm: On
HOME
-- Concentration Alarm Setu
ESCAPE
ACKN
--
Figure 3-15. Concentration Alarm
Setup Menu
INFOESCAPE
To change the alarm limits, move the cursor to the desired line and press the ↵
softkey. Change the limit value using the
↑ and ↓ softkeys and then press the ↵
softkey again to save the selection.
Rosemount Analytical Inc. A Division of Emerson Process Management Operation 3-13
Page 42

Instruction Manual
p
760000-C
November 2002
Model NGA2000 CLD
Press the Back (F2) softkey before pressing the ↵ softkey to restore the previous
value.
Alarm delay:
Set the alarm delay for the desired time
delay after the concentration value exceeds the limit before the alarm is activated.
Alarm generation is:
This setting establishes the generation of
alarms as “Off,” “On,” or “On (Hold
Alarm).” The “On (Hold Alarm)” setting
provides that the alarm will remain active
even after the gas concentration returns
below the appropriate level until the
ACKN softkey is pressed or it is reset
from the remote I/O.
ACKN
Press the F3 softkey to acknowledge and
reset any alarm.
d. Linearization Parameters
Linearization parameters allows the establishment of linearizer coefficients and
the assignment of coefficient sets to individual ranges.
Main Menu
Analyzer and I/O expert controls &
Analyzer module setup…
Gas measurement parameters…
CLD 7.50 ppm
Linearization parameters…
Response time/delay parameters…
Range settings…
Automatic range change parameters…
Units…
-- Gas measurement
Linearization functions…
HOME
ESCAPE
Figure 3-16. Gas Measurement
Parameters Menu
↓
setup…
↓
↓
arameters --
INFO
From the Gas measurement parameters
menu, select Linearization parameters…
CLD 7.50 ppm
Range 1 linearizer: Disabled
If enabled, uses curve no.: 1
Range 2 linearizer: Disabled
If enabled, uses curve no.: 2
Range 3 linearizer: Disabled
If enabled, uses curve no.: 3
Range 4 linearizer: Disabled
If enabled, uses curve no.: 4
Set coefficients…
HOME
-- Linearization Parameters --
ESCAPE
INFO
Figure 3-17. Linearization Parameters
Menu
The linear polynomials act over a range
(not the same as the measurement
range). The system uses the linearizer
polynomial appropriate for the measurement range chosen. This is the polynomial with the next higher range. It is,
however, possible to specify that the analyzer use a wider range polynomial.
Note that the use of different polynomials
on different ranges will give different readings on a new range.
Coefficients may be edited for custom
curves.
CLD 7.50 ppm
A0 coefficient: 0.000000
A1 coefficient: 1.000000
A2 coefficient: 0.000000
A3 coefficient: 0.000000
A4 coefficient: 0.000000
Curve upper limit: 10.0 ppm
Curve over-range: 5.0 %
Curve under-range: 5.0 %
Status: Disabled
HOME
Linearity coefficients
ESCAPE
Curve 1
NEXT LAST
INFO
Figure 3-18. Linearity Coefficients
Menu
Edit the polynomial coefficients as desired. Make sure that the curve upper limit
is correct. This is the limit of the range
that this polynomial will support.
The last line (Status) selects whether the
curve is in use. Use the NEXT (F3),
LAST (F4), and BACK (F4) softkeys to
access all four curves.
3-14 Operation Rosemount Analytical Inc. A Division of Emerson Process Management
Page 43

Model NGA2000 CLD
y
A
A
Instruction Manual
760000-C
November 2002
e. Linearization Functions
The linearization functions allow the primary variable output to be linearized by
either a polynomial of up to 20 set points,
or by midpoint piecewise correction with
up to three midpoints.
Analyzer and I/O expert controls &
Analyzer module setup…
Gas measurement parameters…
Linearization functions…
CLD 7.50 ppm
Polynomial setup…
Midpoint correction setup…
Use the polynomial setup to generate a linearizing
polynomial from up to 20 gases. With more than 6 gases
it will produce a fourth order polynomial linearizer.
Use the midpoint correction for a piecewise-linear final
correction, to bring up to three points precisely onto
the curve.
HOME
-- Linearization Functions --
ESCAPE
Figure 3-19. Linearization Functions
Polynomial Set Up
Use the polynomial set up to generate a
linearizing polynomial from up to 20
gases. With more than 6 gases, it will
produce a fourth order polynomial linearizer.
Analyzer and I/O expert controls &
Analyzer module setup…
Gas measurement parameters…
Linearization functions…
Polynomial set up…
Main Menu
↓
setup…
↓
↓
↓
Menu
Main Menu
↓
setup…
↓
↓
↓
↓
INFO
CLD 7.50 ppm
Range to be li nearized: 1
Current span gas: 10.0 ppm
Calculated polynomial order: 4
Gas value shown is: ppm
Gas concentrations…
Analyzer function: READY
HOME
ESCAPE
-- Pol
nomial Setup --
CALC
INFO
Figure 3-20. Polynomial Setup Menu
Setup:
Select the range to linearize.
Make sure that the span gas value is correct and set into the “Correct span gas”
line.
Choose whether to define the gas concentrations as absolute values (ppm) or
as a percent of the span gas (Percent of
span gas) in the “Gas values shown as”
line.
Percent would be used if the span gas is
being diluted with a mixing device.
From the “Polynomial set up” menu
(Figure 3-20, page 3-15) select the “Gas
concentrations…” submenu to enter up to
20 points for each range.
CLD 7.50 ppm
Gas value: 1.00
Raw reading: 0.9 ppm
Linearized value: 1.0 ppm
Gas value: 2.00
Raw reading: 1.9 ppm
Linearized value: 2.0 ppm
Point to be measured: Point 1
nalyzer function: READY
HOME
ESCAPE
Gas concentrations
Point 1
Point 2
DAT
NEXT
INFO
Figure 3-21. Gas Concentrations Menu
In the “Gas concentrations” menu, enter
the gas value for the desired point as ppm
or percent of scan range in accordance
with the previous choice made for the
“Gas values shown as.”
Rosemount Analytical Inc. A Division of Emerson Process Management Operation 3-15
Page 44

Instruction Manual
A
760000-C
November 2002
Model NGA2000 CLD
Choose the point to be measured from
the “Point to be measured” line.
At each point in succession, flow the gas
of the correct value and, when the reading
is stable, press the DATA (F3) softkey to
record the gas value and raw reading for
each point.
Move to the next two points with the
NEXT (F4) softkey and move backwards
with the ESCAPE (F2) softkey. After the
desired number of points has been measured and recorded, press ESCAPE from
the Point 1 menu to return to the “Polynomial set up” menu.
In the “Polynomial set up” menu, press
the “CALC” softkey.
The analyzer will calculate the best fit
polynomial and store it as the coefficients
in the current range’s linearizer function.
The order or the polynomial is optimized
based on the number of data points provided. At least 7 points are required for a
fourth-order polynomial correction. The
results can be modified with the “Midpoint
correction” also provided. See Section 37e, page 3-15.
CAUTION.
The linearization curve must be monotonic. If it is not, the calibration routine
will fail and the analyzer will not calibrate. Test this by copying the values
of the linearization coefficients into a
spreadsheet program and plotting the
results.
The analyzer does not test for monotonicity when it spans, but this test may not
catch all possible errors.
Monotonic means that the curve does not
change direction as the gas concentration
increases.
Midpoint Correction Set Up
This function allows the adjustment of the
primary variable output into a precise
value using up to three midpoints. It does
this with a piecewise-linear algorithm that
occurs after and in addition to any polynomial linearization. .
The correction can be performed individually for each range.
Main Menu
↓
Analyzer and I/O expert controls &
setup…
↓
Analyzer module setup…
↓
Gas measurement parameters…
↓
Linearization functions…
↓
Midpoint correction set up…
CLD 7.50 ppm
Correction: DISABLED
Point being mesured: Point 1
Point 1 gas concentration: 2.50 ppm
Point 2 gs concentration: 5.00 ppm
Point 3 gas concentration: 7.50 ppm
Point 1 reading: 2.52 ppm
Point 2 reading: 5.12 ppm
Point 3 reading: 7.56 ppm
Span gas value: 10.00 ppm
nalyzer function: READY
HOME
Midpoint correction setup
Point 1
ESCAPE
SET
RANGE 2
INFO
Figure 3-22. Midpoint Correction
Setup Menu
First, disable the correction.
Set the point being measured to Point 1.
Then enter the first midpoint gas value,
run the gas, and when stable, press
“SET.” “Point 1 reading” will show the actual reading, but the analyzer will adjust it
to the correct value.
Repeat the above steps with the second
and third points as desired.
When complete, se the “Correction:” line
to “ENABLED” to activate the correction.
3-16 Operation Rosemount Analytical Inc. A Division of Emerson Process Management
Page 45

Model NGA2000 CLD
g
A
CAUTION.
Make sure that the corrections are not
excessive. If the correction is too excessive, the calibration routine will fail
and calibration of the analyzer will not
be possible.
f. Response Time
The response time menus allows the setting of the primary analyzer variable t90
times, the LON update rate and the output
delay time.
Main Menu
↓
Analyzer and I/O expert controls &
setup…
↓
Analyzer module setup…
↓
Gas measurement parameters…
↓
Response time/delay parameters…
CLD 7.50 ppm
Range 1 t90 ti me: 3.0 s
Range 2 t90 ti me: 3.0 s
Range 3 t90 ti me: 3.0 s
Range 4 t90 ti me: 3.0 s
LON update time: 10 per sec
Output delay time: 0.0 s
HOME
Response time/delay Parameters
ESCAPE
Figure 3-23. Response time/delay
The
t90 time adjusts the filtering or damp-
ing factor for the concentration outputs for
each range. They are adjustable from 0.1
to 30 seconds with a default of 3.0 seconds.
The
LON Update Rate is the rate at
which the analyzer communicates over
the system network. It is adjustable to
“ASAP” (the fastest rate that the network
communicates), “10 per sec,” and “1 per
sec.”
Parameters
Output Delay Time establishes the
The
delay for the DIO and analog outputs to
respond to a change in concentration
value. It is adjustable from 0.0 to 30.0
seconds.
To change a value, move the cursor to
the desired line and press the ↵ softkey.
Change the value using the ↑ and ↓ soft-
keys and then press the ↵ softkey again
to save the selection. Press the Back (F2)
softkey before pressing the ↵ softkey to
restore the previous value.
g. Automatic Range Change
This menu function allows the setting and
enabling of the automatic range change
for each of the four ranges. The automatic
range switching for increasing values is
effective at the upper range limit of each
range, while for decreasing values it is the
next lower range limit times the hysteresis
percent times the upper range limit.
Main Menu
Analyzer and I/O expert controls &
setup…
Analyzer module setup…
Gas measurement parameters…
Automatic range change parameters…
CLD 7.50 ppm
Actual switch levels…
Switch level hysteresis: 20 %
Usage of range –1: Enabled
Usage of range –2: Enabled
Usage of range –3: Enabled
Usage of range –4: Enabled
Automatic range change control: Enabled
Absolute range upper limit: 10000 ppm
bsolute range lower limit: 10.0 ppm
Measure
-- Automatic Ran
Figure 3-24. Automatic Range Control
Set the desired hysteresis level in the
range of 10% to 50% which is applied to
each range transition. (20% is the default
setting.) Enable the desired ranges and
enable the automatic range change control. To view the actual switching levels,
Instruction Manual
760000-C
November 2002
↓
↓
↓
↓
e Control --
Back…
Menu
Rosemount Analytical Inc. A Division of Emerson Process Management Operation 3-17
Page 46

Instruction Manual
760000-C
November 2002
Model NGA2000 CLD
select the submenu “Actual switch levels…”.
CLD 7.50 ppm
-- Actual Switch Levels --
Range – 1 up: 10.0 ppm
Range – 1 down: -1000000 ppm
Range – 2 up: 25.0 ppm
Range – 2 down: 9.0 ppm
Range – 3 up: 100.0 ppm
Range – 3 down: 22.5 ppm
Range – 4 up: 250.0 ppm
Range – 4 down: 90.0 ppm
Measure
Figure 3-25. Actual Switch Levels
h. Display Units
This menu function is used to set the displayed units for the various parameters.
This only affects the displayed values. All
outputs are in the basic SI units which, for
example, for pressure is hPa. Gas concentration values are for all ranges. Individual ranges cannot be set to different
units.
Main Menu
Analyzer and I/O expert controls &
setup…
Analyzer module setup…
Gas measurement parameters…
]
CLD 7.50 ppm
Gas measurement units: ppm
Pressure measurement units: hPa
Temperature measurement units: C
Ppm to mg/Nm3 conversion factor: 1.000
Lower explosion limit (LEL): 0.00 %
Upper explosion limit (UEL) 0.00 %
Variable are still sent as the basic SI unit.
HOME
-- Units --
Figure 3-26. Display Units Menu
Menu
↓
↓
↓
↓
Units…
Back…
Select the desired parameter and change
the units as follows:
Gas measurement units: ppm, %, ppb, mg/Nm3
Pressure measurement units: hPa, psig
Temperature measurement units: C, F
ppm to mg/Nm3 conversion factor:
The ppm to mg/Nm
3
conversion factor in
the range of 1 to 100000 according to the
formula:
mg/Nm3 =
MW
Molecular weight
NO 30.0
NO
46.0
2
CO 28.0
SO
O
64.1
2
32.0
2
Lower explosion limit (LEL) and upper explosion limit (UEL):
These parameters are used for the PMD,
FID2 and NDIR modules and do not apply
to the CLD. They should both be set at
0.00%.
i. Physical Measurements & Pressure
Limits
This menu is used to display the physical
diagnostic parameters of the CLD analyzer and to set the various pressure limits.
INFOESCAPE
In the Physical measurements display,
the normal values for the displayed values
are:
Sample capillary pressure: 7 psig
Ozone supply pressure: 15 psig
Ozonator status: On
Ozonator power: Enabled
Bypass flow: 800 cc/min
3-18 Operation Rosemount Analytical Inc. A Division of Emerson Process Management
Page 47

Model NGA2000 CLD
play
Instruction Manual
760000-C
November 2002
Converter temperature: 300 °C
Ozonator temperature: 58 °C
Sensor temperature: 0.5 °C
Block temperature: 51.5 °C
Capillary flow rate: 200 cc/min
CLD 7.50 ppm
Sample capillary pressure: 7.0 hPa
Ozone supply pressure: 15.0 hPa
Converter temperature: 300.0 C
Sensor temperature: 50.0 C
Block temperature: 51.5 C
Physical Measurements
Manufacturer’s settings
From the “Physical Measurements” menu
(Figure 3-14), select “Pressure limits…”
submenu to view and set the alarm pressure limits for the sample capillary and the
ozonator.
CLD 7.50 ppm
-- Pressure Limits --
HOME
ESCAPE
INFO
Figure 3-29. Physical Measurements –
Manufacturer’s settings Display
j. Single Component Display Parameters
Sample capillary upper limit: 490.0 hPa
Sample capillary lower limit: 50.0 hPa
Ozone supply upper limit: 1050 hPa
Ozone supply lower limit: 700.0 hPa
This function and menu is used to establish the parameters to be displayed on the
single component display.
Barometric pressure: 1013 hPa
HOME
ESCAPE
Figure 3-27. Pressure Limits Menu
The nominal values are:
INFO
Main Menu
↓
Analyzer and I/O expert controls & setup…
↓
Analyzer module setup…
↓
Physical measurements parameters…
Capillary upper limit: 7.1 psig
Capillary lower limit: 0.7 psig
Ozone upper limit: 15.2 psig
Ozone lower limit:: 10.2 psig
In the “Physical Measurements” menu,
the “MORE” (F3) softkey displays the
submenu selection for Temperature limits
as shown on the next page. The “HISTORY” (F4) softkey displays the values
for pressure and temperature as originally
set at the factory.
CLD 7.50 ppm
Converter upper limit: 500.0 C
Converter lower limit: 150.0 C
Ozonator upper limit: 65.0 C
Ozonator lower limit: 40.0 C
Sensor upper limit: 55 C
Sensor lower limit : 45 C
Block upper limit: 55.0 C
Block lower limit: 45.0 C
-- Temperature Limits --
HOME
ESCAPE
INFO
Figure 3-28. Temperature Limits Menu
CLD 7.50 ppm
-- Dis
ed Parameters --
First line’s parameter: Sample flow
Second line’s parameter: Sample press
Third line’s parameter: Ozonator
Fourth line’s parameter Converter temp
Displayed concentration digits: 6
Digits after decimal point: 2
HOME
INFOESCAPE
Figure 3-30. Displayed Parameters
Menu
Here you can change the parameters that
are displayed in the Single Component
Display.
It is also possible to set the concentration
value precision and number of digits. This
does not change the inherent precision of
the analyzer.
Select a line and press the ↵ softkey. To
change the value use the ↑ and ↓ softkeys. The values will scroll through the allowable selections as follows:
Rosemount Analytical Inc. A Division of Emerson Process Management Operation 3-19
Page 48

Instruction Manual
760000-C
November 2002
Model NGA2000 CLD
Sample flow
Displays the sample flow rate in ml/min
with a bargraph.
Sample press
Displays the sample pressure with a bargraph.
Ozonator
Displays the status of the Ozonator: ON,
Disabled, OFF-PRES.SW.
Converter temp
Displays the converter temperature with a
bargraph.
Block temp
Displays the detector block temperature
with a bargraph.
Detector temp
Displays the photodiode detector temperature with a bargraph.
NO/NOx
Displays the current mode, NO or NOx
Noise level
Displays the concentration noise level in
ppm in the range 0.0 to 0.1 with a bargraph.
t90 time
Displays the t90 response time for the
displayed range with a bargraph.
Output delay time
Displays the output delay time setting with
a bargraph.
Calibration status
Displays the calibration status: READY,
Calibration
Linearizer
________________
Measurement mode
________________
Operational state
Standby, Calibration, Ready
Health
________________
Interference
Off, On
Validity
Validity of the concentration measurement: Valid, Invalid (Goes to Valid after a
successful calibration)
Raw signal
Displays the raw concentration output of
the detector before any linearization or
other correction.
3-20 Operation Rosemount Analytical Inc. A Division of Emerson Process Management
Page 49

Model NGA2000 CLD
Instruction Manual
760000-C
November 2002
3-8 CALIBRATION PROCEDURE
The CLD analyzer module may require periodic calibration with known zero and span
gases in order to maintain a desire level of
analytical accuracy. It is recommended, after
initial startup, that the CLD Analyzer Module is
calibrated at least once every eight hours.
This practice should continue until evidence
indicates that some other interval is more appropriate depending on the analytical accuracy required.
Calibration is the process of flowing known
zero or span calibration gas into the analyzer
for a specified period (averaging time), after
which the analyzer will automatically set its
zero or span factors so that the concentration
measurement equals the calibration gas
value. A limit can be set, beyond which any
attempt by the analyzer to reset its concentration measurement will cause a warning alarm.
In this case, user intervention would be required to reset the alarm and attempt another
calibration.
There are three methods for performing a
calibration with the CLD Analyzer Module and
NGA Platform:
Basic Controls calibration:
(See Section 3-
8b, page 3-22)
This method allows the user to input a span
calibration gas value and perform a zero or
span calibration for each of the four ranges.
This method uses calibration parameters established in the module setup menus. (See
Section 3-8a, page 3-21)
Expert Controls calibration
: (See Section
3-8c, page 3-23)
This method allows the user to perform a zero
or span calibration for each of the four ranges,
enable or disable the calibration adjustment
limits, view the results, and view or change
the Factors that the analyzer uses to adjust
the zero and span concentration reading. This
method uses calibration parameters established in the module setup menus. (See Section 3-8a, page 3-21)
System calibration and setup:
This method allows the user to establish complex automated calibration sequences for
modules bound to the Platform. This is fully
described in the Platform manual.
NOTE
If zero calibration is done with other than a
true zero gas followed by a span calibration, it may be necessary to repeat the
calibration. This is due to the
slope/intercept effect where the subsequent span calibration may change the
zero crossing point.
a. Calibration Setup
Calibration Gas List
This menu is used to set the concentration values of the calibration gases for
each range. These values are used for all
calibrations except in Basic where the
span gas can be entered for a quick manual calibration.
Main Menu
↓
Analyzer and I/O expert controls &
setup…
↓
Analyzer module setup…
↓
Calibration gas list…
CLD 7.50 ppm
Zero gas – range 1: 0.00 ppm
NO span gas – range 1: 10.00 ppm
NOx span gas – range 1: 10.00 ppm
Zero gas – range 2: 0.00 ppm
NO span gas – range 2: 10.00 ppm
NOx span gas – range 2: 10.00 ppm
Calibration…
HOME
-- Calibration Gas List --
MORE
INFOESCAPE
Figure 3-31. Calibration Gas List Menu
Use the MORE (F3) softkey to display
and change the values for the remaining
ranges.
Rosemount Analytical Inc. A Division of Emerson Process Management Operation 3-21
Page 50

Instruction Manual
760000-C
November 2002
Model NGA2000 CLD
The “Calibration…” submenu provides
quick access to the Expert Controls Calibration menu, Section 3-8c, page 3-23.
Calibration Parameters
This menu provides various parameter
settings for all calibration performed from
Basic or Expert modes.
Analyzer and I/O expert controls &
Analyzer module setup…
Calibration parameters…
CLD 7.50 ppm
Calibration adjustment limits: Enabled
Calibration averaging time: 5 s
Calibration failure alarm: No
Cal failure error allowed: 50 %
Calibration time out: 60 s
Zero ranges: TOGETHER
Span ranges: SEPARATELY
HOME
Figure 3-32. Calibration Parameters
Calibration adjustment limits:
Set to “Disable” to recover from a calibration failure.
Calibration averaging time:
Sets the time used by the analyzer to av-
erage its reading during calibration. A
longer time will give a better calibration.
Main Menu
↓
setup…
↓
↓
-- Calibration Parameters --
Display
Calibration time out:
Sets how long the analyzer will wait for
the signal to stabilize before issuing a
Warning.
Zero (Span) ranges:
Used to select whether to calibrate ranges
TOGETHER or SEPARATELY. If together, zeroing or spanning will go
through each range one by one. If the
change required is too great, it will fail and
send an alarm if warning alarms are enabled. In this case, Disable Calibration
Adjustment Limits and try again. First
check that the calibration gases are correct. If non-zero gases are used, or the
changes are great, zero and span may
have to be repeated a few times.
b. Basic Controls Calibration
This method allows the user to input a
span calibration gas value and perform a
zero or span calibration for each of the
four ranges.
INFOESCAPE
In the “Basic Controls” menu, move the
cursor to the “Span gas concentration:”
line and set the correct value for the calibration span gas. The zero gas is assumed to be 0.00 ppm.
Begin flowing the calibration gas (zero or
span) and allow time for the analyzer to
stabilize on the gas.
Press the appropriate ZERO (F3) or
SPAN (F4) softkey to display the calibration menu as shown below.
Calibration failure alarm:
When turned on (Yes), issues a warning if
The “Calibration status” must be READY
in order to initiate a calibration.
the analyzer has to change its calibration
by more than the Cal Failure Error, if
warning alarms are enabled.
Verify that the desired measurement
range is active. If not, press ESCAPE (F2)
to return to the previous menu and
Cal failure error allowed:
The percentage by which the calibration
can change before an alarm is triggered if
the Calibration Failure Alarm is enabled.
3-22 Operation Rosemount Analytical Inc. A Division of Emerson Process Management
change the range.
The “Zero (Span) ranges” tag indicates if
the ranges will be calibrated together or
separately. See Section 3-8a, page 3-21
to change this.
Page 51

Model NGA2000 CLD
p
j
Instruction Manual
760000-C
November 2002
The “Calibration time” begins to count after the calibration is started to show the
elapsed time.
Press the ZERO (F3) [SPAN (F4)] softkey
to begin the calibration. The “Calibration
status” will display ZEROING-WAIT and
the “Calibration time” clock will count the
seconds. After the signal has stabilized
the calibration will finish. If the signal does
not stabilize within the timeout period
(See Section 3-8a, page 3-21), the calibration will fail and another attempt will be
started automatically. Make sure that the
proper calibration gas is flowing.
c. Expert Controls Calibration
This method allows the user to perform a
zero or span calibration for each of the
four ranges, enable or disable the calibration adjustment limits, view the results,
and view or change the Factors that the
analyzer uses to adjust the zero and span
concentration reading.
In the “Expert Controls” menu (Figure
3-12), set the desired measurement range
number to be calibrated. Change the
measurement mode using the “NO/NOx
toggle!” control.
Select “Zero/Span calibration…” menu
line.
CLD 7.50 ppm
Measurement range number: 1
Zero gas concentration: 0.0 ppm
Span gas concentration: 10.0 ppm
Sample flow: 1300 ml/min
Raw measurement signal: 5216063.5
Measurement gas: NO
NO/NOx toggle!
Status: READY
Result…
Calibration ad
HOME
-- Zero/s
ustment limits: Enabled
FACTORS INFOSPANZERO
Figure 3-33. Zero/Span Calibration
Menu
an calibration --
The zero and span gas concentrations
(set in the calibration gas values menu)
are displayed. See Section 3-8a, page 321 to change the values.
The sample flow rate is displayed along
with the raw measurement signal. The
sample flow rate should be in the range of
200 – 2200 ml/min.
The raw measurement signal can be used
to set the FACTORS described in Section
3-8c, page 3-23.
The “Measurement gas:” tag shows the
current measurement status as NO or
NOx.
Press the ZERO (F3) [SPAN (F4)] softkey
to begin the calibration.
CLD 7.50 ppm
Are you sure?
You must have zero gas flowing through the analyzer.
-- Analyzer Zero --
Calibration time: 0 s
Measurement range number: 1
Zero ranges TOGETHER
Calibration status: READY
Error message for last zero: CAL OK
HOME
ESCAPE INFOZERO
Figure 3-34. Analyzer Zero Display
The “Calibration status” will display ZEROING-WAIT and the “Calibration time”
clock will count the seconds. After the
signal has stabilized the calibration will
finish. If the signal does not stabilize
within the timeout period (See Section 38a, page 3-21), the calibration will fail and
another attempt will be started automatically. Make sure that the proper calibration gas is flowing. See Section 3-8a,
page 3-21 for “Calibration adjustment limits.”
Calibration Results
The last calibration results can be viewed
by selecting the “Result…” submenu from
the “Zero/span calibration” menu (Figure
3-33, page 3-23). The “Zero/span diagnostic data” screen will be displayed.
Rosemount Analytical Inc. A Division of Emerson Process Management Operation 3-23
Page 52

Instruction Manual
760000-C
November 2002
Model NGA2000 CLD
CLD 7.50 ppm
Date of last zero: Apr 28, 2001
Error message for last zero: CAL OK
Error percentage for last zero: -5
Raw signal at last zero: 0
Last zero gas would read: 0.000 ppm
Date of last span: Arp 28, 2001
Error message for last span: CAL OK
Error percentage for last span: 25
Calibration status: 789542.0
The last span would read: 10.000 ppm
HOME
-- Zero/span diagnostic data --
ESCAPE INFOFACTORS
Figure 3-35. Zero/Span Diagnostic
Data Menu
The errors are expressed as a percentage
of the range.
The last zero and span readings are how
the analyzer would read on those gases
with the current calibration results or factors.
Calibration Factors
Calibration Factors can be used to manually set a calibration by flowing calibration
gas and setting the Factor for zero or
span until the reading conforms to the
calibration gas value. In this way, the user
can force the analyzer to any desired
reading. Alternately, the Factors can be
viewed and recorded after an automatic
calibration.
NOTE
CLD 7.50 ppm
Only those factors appropriate for the current range
Will affect the reading on the current range.
Make sure you are using the right ones!
Measurement range number: 1
Range 1 factors…
Range 2 factors…
Range 3 factors…
Range 4 factors…
HOME
-- Calibration Factors --
ESCAPE INFO
Figure 3-36. Calibration Factors Menu
Move the cursor to the “Range _ factors…” line corresponding to the selected
range and press ↵. The “Range _ Factors” menu will display.
CLD 7.50 ppm
Zero offset: 524287.0
Span factor: 0.000021250
Full scale range at calibration: 250.0 PPM
Measurement range number: 1
Raw measurement signal: 522819.7
-- Range 1 Factors --
HOME
STORE INFONEXT HISTORY
Figure 3-37. Range Factors Menu
Flow the appropriate gas (zero/span)
while adjusting the corresponding factor
(Zero offset/Span factor) until the concentration reading is stabilized on the desired
calibration gas value.
If zero calibration is done with other
than a true zero gas followed by a span
calibration, it may be necessary to repeat the calibration. This is due to the
slope/intercept effect where the subsequent span calibration may change
the zero crossing point.
In the “Zero/span Calibration” menu
(Figure 3-33, page 3-23), verify the
“Measurement range number:” is set to
the desired range. If not, move the cursor
to the “Measurement range number:” line
The factors take effect after pressing the
↵ softkey. With zero gas, the zero factor
should be the same as the raw reading.
When the correct zero and span calibration is achieved, press the STORE (F2)
softkey to save the factors.
Use the “Measurement range number”
line to change the range and the NEXT
(F3) softkey to display the factors for the
next range.
and change the setting. Press the
FACTORS (F2) softkey. The “Calibration
Factors” menu is displayed.
3-24 Operation Rosemount Analytical Inc. A Division of Emerson Process Management
Page 53

Model NGA2000 CLD
Instruction Manual
760000-C
November 2002
CLD 7.50 ppm
Zero offset: 0.000000
Span factor: 0.000000
Zero offset: 524287.0
Span factor: 0.00021250
HOME
NEXT INFORSTRMN RSTRST
Figure 3-38. Range Factors -
Manufacturer’s/Stored Settings Display
Press the HISTORY (F4) softkey to view
the current stored factors versus the
manufacturer’s (factory) settings. Use the
RSTR MN (F3) softkey to restore the
manufacturer’s settings and the RSTR ST
(F4) softkey to restore the stored settings.
d. Unable to Calibrate
If the user is unable to calibrate the Analyzer Module (i.e., when ZERO or SPAN
is initiated, nothing happens), a possible
solution relates to the use of an incorrect
gas for zeroing or spanning (e.g., using a
high concentration gas to zero or a zero
gas to span the Analyzer Module). Simply
recalibrating with the appropriate gas(es)
will not correct the problem because the
ZERO OFFSET or SPAN FACTOR has
been set to an extreme value in the process.
To remedy the problem, do the following:
1. Select the following from the Main
Menu: “Analyzer and I/O Expert
Range 1 Factors
Manufacturer’s settings
Stored settings
Controls & Setup,” “Analyzer Module Set Up,” and “Calibration Parameters...”
2. Using the ↓ arrow, select “Zero
Ranges:”, press ENTER and, using
the up/down arrows, toggle to
SEPARATE. Do the same for the
“Span Ranges:” selection. Do not
press ESCAPE at any time unless
retention of prior settings is desired.
3. Return to the “Main Menu” and
make the following selections: “Analyzer and I/O Expert Controls &
Setup,” “Analyzer Module Controls,”
“Zero/Span Calibration,” FACTORS
(F3) softkey, and Range 1 (2, 3, 4)
Factors (do Steps 4 and 5 for each
range).
4. Select “Zero Offset,” press ENTER,
adjust the value to 32700 with the ↑
and ↓ arrow softkeys, and press
ENTER. Do not press ESCAPE at
any time unless retention of prior
settings is desired.
5. Select “Span Factor,” press ENTER,
adjust the value to 0.00015 with the
↑ and ↓ arrow softkeys, and press
ENTER. Do not press ESCAPE
unless retention of prior settings is
desired.
6. Attempt to recalibrate the Analyzer
Module according to the procedure
outlined in Section 3-8c, page 3-23.
If recalibration fails, return to the
Range Factors menu, readjust Zero
Offset and Span Factor values, and
try calibrating again.
Rosemount Analytical Inc. A Division of Emerson Process Management Operation 3-25
Page 54

Instruction Manual
y
y
y
760000-C
November 2002
Model NGA2000 CLD
3-9 SYSTEM & NETWORK I/O MODULE CON-
TROLS (SETUP) – SYSTEM SIO
This menu provides access to several submenus for setting parameters of the SIO (Signal Input/Output) and DIO (Digital
Input/Output) of the analyzer.
Main Menu
↓
Analyzer and I/O, expert controls &
setup…
↓
System & network I/O module controls…
CLD 7.50 ppm
System SIO module…
System DIO module…
stem & Network I/O Module Controls --
-- S
Measure
>>>Back…<<<
Figure 3-39. System & Network I/O Module
Controls Menu
Press the ↵ or → softkeys to change to the
desired submenu.
If there is no SIO module installed in the analyzer, a corresponding message will be displayed instead of the menu.
The “System SIO Module” menu provides
submenus for setting up the output configurations of the SIO signals. The SIO board can
contain 2 to 8 analog outputs, a serial interface (RS232 or RS485), and three relay outputs. General configuration of the SIO board
is contained in its own manual. If the SIO
board is installed in the analyzer, the line
“Module installed:” must be set to “Yes.”
To access this menu, in “System & network
I/O module controls…”, select “System SIO
module…”.
CLD 7.50 ppm
Analog output setup…
Serial interface setup…
Relay outputs setup…
Module installed: Yes
stem SIO Module --
-- S
Measure
Back…
Figure 3-40. System SIO Module Menu
Select a line with the ↑ or ↓ softkeys.
Select the variable or change to the submenu
with the ↵ or → softkeys.
Select the variable parameter with the ↑ or ↓
softkeys.
Confirm the new value with the Enter ↵ softkey or cancel and return to the last value with
the F2 softkey.
a. Analog Output Setup
In the System SIO Module menu (Figure
3-40, page 3-26), select Analog output
setup…
CLD 7.50 ppm
-- Anal
zer Modules --
Measure
Figure 3-41. Analyzer Modules Menu
Output number:
Choose the desired analog output (1-8) to
set the parameters. The number of outputs depends on the analyzer configuration as 2, 4, 6, or 8.
CLD: 1.0
MLT/CH1
MLT/CH2
MLT/CH3
>>>Back…<<<
3-26 Operation Rosemount Analytical Inc. A Division of Emerson Process Management
Page 55

Model NGA2000 CLD
g
g
g
Instruction Manual
760000-C
November 2002
Choose signal source module…
Select the “Analyzer Modules” submenu
by selecting the “Choose signal source
module…” line and pressing the ↵ soft-
key.
Select the tag of the desired reference
channel with the ↑ or ↓ softkeys and then
press the ↵ or → softkey. The display will
return to the previous menu automatically
and the selected reference channel will be
displayed in the “Source module:” line.
The available selections may be different
depending on the installed modules.
Choose signal…
CLD 7.50 ppm
Output number: 1
Choose signal source module…
Choose signal…
Signal value for 0 % output: 0.00
Signal value for 100 % output: 100.00
Output current: 0…20 mA
Hold output during calibration: No
Signal name: Sample flow
Current signal value: 8.60
Source module: CLD
Measure
-- Analo
Output Setup --
More…Back…
CLD 7.50 ppm
-- Si
nals --
Sample flow:
Sample press:
Ozonator:
Converter temp:
Block temp:
Detector temp:
NO/NOx:
Noise level:
Measure
CLD 7.50 ppm
-- Si
nals --
>>>Back…<<<
t90 time:
Output delay time:
Measure
Calibration status:
Linearizer:
Measurement mode:
Operational status:
Health:
Interference:
>>>Back…<<<
Figure 3-43. Signals Menu
Signal value for 0% (100%) output:
It is possible to set the signal value for 0%
output and for 100% output so as to output only a portion of the entire range.
Figure 3-42. Analog Output Setup Menu
Example:
Choose signal…
Select the “Signals” submenu by selecting
the “Choose signal…” line and pressing
the ↵ softkey. (The list of signals will de-
pend on the module chosen.)
Range from 0 to 1000 ppm
0% value to be 400 ppm, 100%
value to be 700 ppm.
Analog output normally: 0V = 0
ppm, 10v = 1000 ppm
After changing the output scaling:
Press the F5 softkey to go to additional
0V = 400 ppm, 10V = 700 ppm
menus to choose the Primary Variable
signal for the analog output. The Primary
Variable is the actual NO or NOx concentration.
Move the cursor to the “Signal value for
0% output:” line and adjust the value to
400. Then change to the “Signal value for
100% output:” line and adjust the value to
The signal chosen here will be applied to
the analog output (1-8) chosen above.
See Section 3-7b, page 3-13 for a list of
the signals and their values.
700.
NOTE
If the measurement range is changed,
the settings done in this menu will re-
vert back to the standard values of the
range. The output values can be
changed permanently in the menu
“Range Settings.” See Section 3-7a,
page 3-12.
Rosemount Analytical Inc. A Division of Emerson Process Management Operation 3-27
Page 56

Instruction Manual
p
760000-C
November 2002
Model NGA2000 CLD
NOTE
The signal range of the analog output
should not be less than the smallest
range of the channel. Otherwise the
analog output may exhibit excessive
noise.
Output current:
Select the desired output range in the
“Output current range:” line. The options
are 0…20 mA or 4…20 mA.
Hold output during calibration:
Enable this option to hold the analog output to the last value during calibration.
Pressing the F5 (More…) softkey
changes to the submenus “Output Signal
if Assigned Module Fails” and “Fine Adjustment.”
CLD 7.50 ppm
-- Out
Output(s) value on analyzer failure: BeginOfRange – 10 %
Output number: 1
Operation mode: Normal
Fine adjustment for 0 % output: 4096
Fine adjustment for 100 % output: 819
ut Signal if Assigned Module Fails --
-- Fine Adjustment –
Operation mode:
Normal: The absolute measurement sig-
nal will be sent to the analog output.
Adjust 0V: Used to set the display equal
to the analog output for 0V and 0 mA. Life
zero signals (4-20 mA and 2-10V) are set
automatically and cannot be adjusted.
Adjust 10V: Used to set the display equal
to the analog output for 10V and 20 mA.
Select the “Fine adjustment for 0% out-
put” and/or “Fine adjustment for 100%
output” lines with the ↵ or → softkey. Ad-
just to the desired value with the ↑ or ↓
softkey and confirm with the ↵ softkey.
The range of values are:
3000 to 6000 for 0% (default 4096)
600 to 1000 for 100% (default 819)
The last three lines of the “Analog Output
Setup” menu are display only for configu-
ration values of the analog output.
Signal name: The name of the signal
chosen in the “Choose signal” menu.
Measure
More…Back…
Figure 3-44. Output Signal If Assigned
Module Fails Menu
Output(s) value on analyzer failure:
Choose the desired signal level to cause
a failure condition. The choices are:
Actual
BeginOfRange
EndOfRange
BeginOfRange-10%
BeginOfRange+10%
Output number:
Choose the output number (1-8) for setting the fine adjustment.
Current signal value: The current value
of the variable.
Source module: The name of the module
chosen in the “Choose signal source
module” menu.
Pressing the F5 (More…) softkey
changes to the submenu “Special Scaling
for Concentration Signal.”
CLD 7.50 ppm
-- Special Scaling for Concentration Signal –
(Scaling is the same as range limits)
Output #1: Yes
Output #2: Yes
Output #3: Yes
Output #4: Yes
Output #5: Yes
Output #6: Yes
Output #7: Yes
Output #8: Yes
Measure
More…Back…
Figure 3-45. Special Scaling for
Concentration Signal Menu
3-28 Operation Rosemount Analytical Inc. A Division of Emerson Process Management
Page 57

Model NGA2000 CLD
g
p
Instruction Manual
760000-C
November 2002
This menu allows for the setting of each
of the 8 outputs to be the same as the
range limits “Yes” or as set on the previous menus.
See Section 3-7a, page 3-12 for setting
the range limits.
Pressing the F5 (More…) softkey
changes to the submenu “Analog Output
Updates per Second.”
CLD 7.50 ppm
Output #1: 10
Output #2: 0
Output #3: 0
Output #4: 0
Output #5: 0
Output #6: 0
Output #7: 0
Output #8: 0
Measure
-- Analo
Figure 3-46. Analog Output Updates per
This menu allows for the setting of the
update rate for each of the 8 outputs.
b. Serial Interface Setup
The submenu “Serial Interface Setup” is
used to set the parameters for data transfer between the analyzer and external devices. The choices in this menu depend
on the configuration of the analyzer. The
full specification of the serial interface is
described in its own manual.
In the System SIO Module menu (Figure
3-40, page 3-26), select “Serial interface
setup…”
CLD 7.50 ppm
Baud rate: 19200
Data bits: 8
Stop bits: 1
Parity: None
Echo mode: Disabled
Handshake: Xon/Xoff
Transmission delay: 0
Type of installed serial interface: RS232
Communication protocol: AK
Special protocol definitions…
Measure
Figure 3-47. Serial Interface Setup
Output Updates per Second --
Back…
Second Menu
-- Serial Interface Setu
Menu
--
Back…
Options:
Baud rate: 300, 1200, 2400, 4800, 9600,
19200
Data bits: 7, 8
Stop bits: 1, 2
Parity: None, Even, Odd
Echo mode: Enabled, Disabled
Handshake: None, Xon/Xoff
Transmission delay: 0…100.
Type of installed serial interface: RS232,
RS485/2w, RS485/4w, RS485/4w bus,
None
Communication protocol: AK, MODBUS
RTU, None (not applicable to CLD)
The “special protocol definitions…”
line accesses a submenu for setting
the parameters of the AK and MODBUS
TRU communication protocols.
CLD 7.50 ppm
Device address (RS-485 only): 1
Measure
Figure 3-48. AK Protocol Definitions
The value can range from 1 to 50.
c. Relay Outputs Setup
There are three relays on the SIO board.
The contact logic can be set with a jumper
on the SIO board to select NO (normally
open) or NC (normally closed). Full details
of the SIO board are contained in its own
manual.
In the System SIO Module menu (Figure
3-40, page 3-26), select “Relay outputs
setup…”
NOTE
-- AK Protocol Definitions --
Back…
Menu
Rosemount Analytical Inc. A Division of Emerson Process Management Operation 3-29
Page 58

Instruction Manual
y
g
t
760000-C
November 2002
Model NGA2000 CLD
CLD 7.50 ppm
Output number: 1
Invert signal: Disabled
Choose source module…
Choose signal…
Signal comes from: Control module
Signal name: Failure
Actual status: Off
Measure
-- Rela
Outputs Setup --
Back…
Figure 3-49. Relay Outputs Setup Menu
Output number:
Corresponds to the relay number 1-3.
The list of modules will depend on the installed modules.
Choose signal
CLD 7.50 ppm
Measure
…
-- Choose Si
nal --
Function control
Maintenance reques
Zero in progress
Span in progress
Back…
Failure
Cal. In progress
Zero failed
Span failed
Figure 3-51. Choose Signal Menu
Choose desired signal for the relay output
Invert signal:
number (1-3) being configured.
“Disabled” signal is normal, “Enabled”
signal is inverted.
The list of signals will depend on the cho-
sen module. If available, press the >>>
Choose source module..
CLD 7.50 ppm
-- Choose Source Module --
Control module: 0.0
CLD: 1.0
(F5) softkey for additional signals.
The three lines displayed at the bottom of
the “Relay Outputs Setup” menu show the
current status of the selected relay output.
Signal comes from: The module chosen
from the “Choose Source Module” menu.
Measure
Back…<<< >>>
Figure 3-50. Choose Source Module
Menu
Signal name: The signal chosen from the
“Choose Signal” menu.
Actual status: The current status of the
signal; Off or On.
Choose desired source module for the relay output number (1-3) being configured.
3-30 Operation Rosemount Analytical Inc. A Division of Emerson Process Management
Page 59

Model NGA2000 CLD
y
Instruction Manual
760000-C
November 2002
3-10 SYSTEM & NETWORK I/O MODULE CON-
TROLS (SETUP) – SYSTEM DIO
Selecting “System DIO module…” from the
“System & Network I/O Module Controls”
menu (Figure 3-39, page 3-26) provides submenus for setting up the output configurations
of the DIO signals. The DIO board is comprised of 8 digital inputs and 24 digital outputs. Functions of supported analyzer
modules can be attached to each input and a
signal to each output. Further detailed information about the DIO board is contained in its
own manual.
If there is no DIO module installed in the analyzer, a corresponding message will be displayed instead of the menu.
Main Menu
↓
Analyzer and I/O, expert controls & setup…
↓
System & Network I/O Module Controls…
↓
System DIO module…
CLD 7.50 ppm
Input number: 1
Output number: 1
Choose module…
Choose signal…
Invert signal: No
Module status: ???
Slot ID: ???
Signal name: ???
Signal level: 000.0
Signal comes from: ???
Measure
stem DIO Module --
-- S
Back…
Figure 3-52. System DIO Module Menu
For detailed information on the installation and
setup of the DIO module, see the NGA 2000
Platform manual P/N 760006.
Rosemount Analytical Inc. A Division of Emerson Process Management Operation 3-31
Page 60

Instruction Manual
y
y
760000-C
November 2002
Model NGA2000 CLD
3-11 SYSTEM CONFIGURATION AND DIAGNOS-
TICS
This menu and its submenus provides for
setup of the system parameters for the platform.
Main Menu
↓
System configuration and diagnostics…
CLD 7.50 ppm
stem Configuration and Diagnostics --
-- S
System calibration…
Diagnostic menus…
Load/Save configuration (CM/MCA)
Date and time…
Security codes…
Network module management…
System reset…
Pump 1: Off
Pump 2: Off
System tag:
Measure
Channel
Back…
Figure 3-53. System Configuration and
Diagnostics Menu
The following is a short overview of the contents of the menus:
1
System calibration…
Diagnostic menus…
Control module diagnostics…
1
Analyzer module diagnostics…
Software error messages
Loading/saving configuration parameters…
Sending or loading of analyzer configuration
data by the serial interface
Date and time…
Date and time setup of the analyzer
a. Diagnostic Menus
From the “System Configuration and Di-
agnostics” menu (Figure 3-53, page 3-
32), select “Diagnostic menus…”.
CLD 7.50 ppm
Control module diagnostics…
Analyzer module diagnostics…
Measure
Figure 3-54. Diagnostic Menu
This menu has two submenus for viewing
and resetting any software errors.
The “Control module diagnostics” menu is
not applicable to this analyzer model.
Analyzer Module Diagnostics
From “Diagnostic Menus” (Figure 3-54,
page 3-32), select “Analyzer module di-
agnostics…”
CLD 7.50 ppm
Power supply voltages…
Primary variable parameters…
Physical measurement…
Temperature control parameters…
NO/NOx flow balance…
Miscellaneous control parameters…
Trend display control…
Software diagnostic s…
Alarm message valid for: FAILURE
Start up analyzer…
NOx converter efficienc
HOME
ESCAPE
-- Diagnostics Menus --
<<<
-- Analyzer Diagnostics --
…
Back…
>>>
INFO
Security codes…
Setup of security codes for the different operating levels
Network module management…
1
System reset…
System reset and re-initializing of the analyzer
Figure 3-55. Analyzer Diagnostics Menu
This menu provides access to several
submenus for viewing and adjusting the
various CLD module parameters.
Choose one of the submenus to view or
adjust the parameters.
The “Alarm messages valid for:” functions
1
Not used in this module. See NGA 2000 Platform man-
ual PN 760006.
3-32 Operation Rosemount Analytical Inc. A Division of Emerson Process Management
allows a choice of annunciation for these
choices:
Page 61

Model NGA2000 CLD
Instruction Manual
760000-C
November 2002
WARNING
FAILURE
SAFETY FAILURE
“Calibration factors…” see Section 3-8c.
ANY
Physical measurement…
Power supply voltages…
CLD 7.50 ppm
+15V analog is: 15.06 V
+15V analog was: 0.0 V
-15V analog is: 15.26 V
-15V analog was: 0.0 V
+5V digital is: 4.980 V
+5V digital was: 0.0 V
+25V power is: 23.73 V
+25V power was: 0.0 V
+12V analog is: 11.98 V
+12V analog was: 0.0 V
HOME
-- Analyzer Diagnostics -Power supply voltages
ESCAPE
MORE
INFO
Figure 3-56. Power Supply Voltages Menu
The “is” lines show the current value of
the power supplies. The “was” values
show the values when the analyzer was
manufactured. Changes of more than a
few percent should be tracked. The 24V
power supply may differ substantially if
the Rosemount Analytical power supply is
not used. Use the MORE (3) softkey to
see additional values.
Refer to Figure 3-14, page 3-13. These
are measurements made by the analyzer
module to verify proper functioning and
appropriate flows of sample and support
gases, if any. See Section 3-7i, page 318 for a complete description.
Temperature control parameters…
CLD 7.50 ppm
Converter set point: 300 C
Converter P gain: 0.015
Converter I gain: 0.000125
Converter bias: 0.6 C
Converter temperature: 28.6 C
Detector set point: 51.5 C
Detector P gain: 0.100
Detector I gain: 0.000170
Detector bias: 0.4 C
Detector temperature: 29.2 C
HOME
Temperature control
ESCAPE
MORE
INFO
Figure 3-58. Temperature Control Menu
(Screen 1)
Displays the parameters used by the
temperature control PID algorithms. Allows setting of the warning alarms for the
temperatures.
Primary variable parameters…
CLD 7.50 ppm
Raw measurement signal: 521651.7
Signal gain setting: 64
Current range: 1
Barometric pressure compensation: Enabled
Pk-pk noise: 39.9 ppm
Peltier device voltage: Failure
Reference duty cycle: 0.2785000
Duty cycle coefficient: -0.0681700
(Temperature compensation coefficients…)
Calibration factors…
HOME
Primary variables parameters
ESCAPE
INFO
Figure 3-57. Primary Variable Parameters
Menu
Shows the value of internal parameters
used in the primary variable calculation.
Barometric pressure compensation may
be enabled if another analyzer has a
Press the MORE (F3) softkey for the
Ozonator settings.
CLD 7.50 ppm
Ozonator set point: 58.0 C
Ozonator P gain: 0.100
Ozonator I gain: 0.000170
Ozonator bias: 0.4 C
Ozonator temperature: 29.2 C
Minimum full-on block FET current: 1.000 A
Temperature control
HOME
ESCAPE
INFO
Figure 3-59. Temperature Control Menu
(Screen 2)
Displays the parameters used by the
temperature control PID algorithms.
Allows setting of the warning alarms for
the temperatures.
pressure measurement device and is set
to report its reading.
Rosemount Analytical Inc. A Division of Emerson Process Management Operation 3-33
Page 62

Instruction Manual
760000-C
November 2002
Model NGA2000 CLD
NO/NOx flow balance…
b. Load/Save Module Configuration
CLD 7.50 ppm
NO/NOx flow balance
From the “System Configurations and Diagnostic” menu (Figure 3-53, page 3-32),
select “Load/save configuration
NOx correction factor: 1.0000
Calculate factor using pressure ratio…
Calculate factor using span gas response ration…
HOME
ESCAPE
INFO
Figure 3-60. NO/NOx Flow Balance Menu
Since the sample flows through separate
paths in the NO and NOx mode of meas-
(CM/MCA)…
This menu provides several functions to
send or load configuration data of the
analyzer through the serial interface.
These functions are only available if an
SIO with serial interface is installed.
NOTE
When loading configuration data all of
the current configuration in the memory will be overwritten.
urement, there are differences in the flows
entering the reaction chamber of the two
modes. The CLD analyzer uses a correction factor in the NOx mode to compensate for the reduced flow rate. This
correction factor can be entered manually
or it can be calculated by the analyzer using one of two methods. One is based on
adjusting to respond equally to a span
gas and the other is based on adjusting
for equal capillary pressure.
To start the automatic measurement and
flow balance calculation cycle, enter the
appropriate menu and follow the directions.
CLD 7.50 ppm
This procedure will calcul ate the NO/NOx flow balance
correction factor by measuring the capillary head both the
NO pressure used in both the NO and NOx modes and
using the ratio between the two pressures as the correction
factor.
Press the CALC softkey to start the measurement and
calculation.
Status: Factor entered manually
HOME
Calculate factor using pressure ratio
ESCAPE
CALC
INFO
Figure 3-61. Calculate Factor Using
Pressure Ratio Menu
It is recommended to flow the gas at the
same pressure and flow rate as the sam-
CLD 7.50 ppm
Send configuration to s erial interf ace!
Load configuration from serial interface!
-- Load/Save Configuration (CM/MCA)
- BE CAREFUL with this functi on -
Replace current configuration with fac tory settings!
Measure
Back…
Figure 3-62. Load/Save Configuration
(CM/MCA) Menu
If asked, confirm with the F2 (Yes) softkey
or cancel and go back to the menu page
with the F4 (Back…) or ← softkey.
Send configuration to serial interface !
The configuration data in memory will be
sent through the serial interface of the
analyzer to an external computer or other
device.
Load configuration data from serial interface !
Configuration data will be loaded into
memory from an external computer or
other device through the serial interface of
the analyzer. The current configuration in
memory will be overwritten.
ple gas.
3-34 Operation Rosemount Analytical Inc. A Division of Emerson Process Management
Page 63

Model NGA2000 CLD
A
Y
Instruction Manual
760000-C
November 2002
Replace current configuration with factory settings !
Deletes the configuration in memory and
re-establishes the factory default setting
from the Flash-EPROM.
c. Date and Time
From the “System Configurations and Diagnostic” menu (Figure 3-53, page 3-32),
select “Date and time…”
CLD 7.50 ppm
Minutes: 0
Hours: 12
ear: 2000
Day: 1
Month: 2
Network updating: Enabled
Current time: 08:45:35 February 01, 2000
Measure
Figure 3-63. Date and Time Menu
This menu is used to set the date, time
and format for the analyzer.
Select a line with the ↑ or ↓ softkeys.
Press the ↵ or → softkeys to select the
parameter.
Select any digit with the ← or → softkey
and set a new value with the ↑ or ↓ soft-
key.
Network updating:
Not used with this model.
-- Date and Time --
Set!
Back…
This menu is used to set the security
codes for the three levels of security.
CAUTION
If a security code is lost or forgotten,
there is no possibility of entering the
locked security level.
CLD 7.50 ppm
Basic level security: Disabled
Expert level security: Disabled
System level security: Disabled
Define basic level security PIN…
Define expert level security PIN…
Define system level security PIN…
Measure
-- Security Codes --
Back…
Figure 3-64. Security Codes Menu
Use the function softkeys F1 to F5 to enter the numerical security code in the desired sequence. The numbers will appear
in the “Actual PIN” line as they are entered. The characters displayed on the
function softkeys cannot be entered as
code numbers.
Setting the code numbers
Enter the submenu for the desired security level to set the PIN. The default values are:
Basic level: 12345
Expert level: 54321
System level: 12345
Set up a new date or time:
Set the “Minutes,” “Hours,” “Year,” “Day,”
or “Month” lines and make any desired
adjustments. Press the F3 softkey to set
the new time and date. The “Current time”
line will change to reflect the new time
and date set.
d. Security Codes
From the “System Configurations and Diagnostic” menu (Figure 3-53, page 3-32),
select “Security codes…”
Rosemount Analytical Inc. A Division of Emerson Process Management Operation 3-35
Example:
CLD 7.50 ppm
The actual PIN is prepresented by the order in which they
Actual PIN: 12345
BCDE1
-- Define Basic Leve l Security PIN --
Press five softkeys in any order to define the PIN
are pressed, and shown numberically below.
Press the left arrow key when you are done.
FGHIJ2
KLMNO3
PQRST4
UVWXYZ5
Figure 3-65. Define Basic Level Security
PIN Menu
Page 64

Instruction Manual
760000-C
November 2002
Model NGA2000 CLD
Enable Security Code
Select the desired security level line to
enable. Change the parameter to “Enabled.”
Once a locked security level has been
entered, it will remain unlocked even
after exiting to a different security
level. To protect the level, press the F4
NOTE
(Lock..) softkey in the Main Menu after
CAUTION
If System level is enabled, it will not be
possible to re-enter the Security Setup
returning from the locked level.
Press the ← softkey to return to the “Security setup” menu.
and change back to Disabled without
the code.
Entering a level locked by security code
For example, return to the Main Menu by
pressing the F4 softkey twice.
Attempt to enter an enabled level by
choosing the menu line. A new menu will
appear requesting entry of the security
code. Enter the correct code using the
correct sequence of function softkeys.
The asterisk (*) symbol will appear for
each entry.
e. System Reset
From the “System Configurations and Diagnostic” menu (Figure 3-53, page 3-32),
select “System reset…”
CLD 7.50 ppm
-- System Reset --
System reset!
Measure
Are you sure?
Back…
If the code is incorrect, the message
“Ready” will appear in the line and access
to the locked level is prevented. If the
code is correct, the display will change to
the locked level after the last digit of the
correct code is entered.
Figure 3-66. System Reset Menu
Resets the analyzer to the initializing
mode which is the same as switching the
power off and then on.
3-36 Operation Rosemount Analytical Inc. A Division of Emerson Process Management
Page 65

Model NGA2000 CLD
Instruction Manual
760000-C
November 2002
3-12 CONVERTER TEMPERATURE ADJUST-
MENT
The vitreous carbon converter used in this
analyzer module must be checked periodically
to assure that it is working at peak efficiency.
The efficiency of the converter is typically 95%
to 98%, that is, 95% to 98% of the nitrogen
dioxide introduced to the module is reduced to
nitric oxide. That is well above the 90% minimum required by the Environmental Protection Agency. (Refer to 40 CFR 60, App. A,
Method 20)
Two conditions reduce the efficiency of the
converter:
• The converter is operating at too low a tem-
perature and the efficiency drops or
• The converter is operating at too high a
temperature and the nitrogen dioxide is reduced to nitrogen, which is not detectable by
the chemiluminescence reaction.
Initially, an interval of one week between converter efficiency checks is recommended because high temperature operation changes
conditions inside the converter. The active
surface area of the vitreous carbon increases
through use. Initially, when the surface area is
low, the temperature at which converter efficiency peaks is relatively high. This peak
temperature moves downscale as surface
area increases, and less external energy is
required to cause adequate conversion.
The nominal range of converter operational
temperatures is 300°C to 400°C (572°F to
752°F). The current converter temperature
can be viewed in the “Physical measurement”
menu. To access the converter temperature
adjustment:
Main Menu
↓
Analyzer and I/O expert controls &
setup…
↓
Analyzer module setup…
↓
Physical measurements parameters…
Follow this procedure to optimize the operating temperature of the converter:
1. Power up the module and allow it to stabilize at operating temperature (about one
hour).
2. Check the Converter Temperature in the
Physical Measurements menu (See Section 3-7b, page 3-13). Note the value for
future reference.
3. Introduce a calibration gas of known
(NO
) concentration into the analyzer and
2
note the concentration value determined
when the full response has been
achieved.
4. Change Converter Setpoint in the “Temperature Control” menu to 300°C (See
Section 3-11a, page 3-32). Allow module
15 minutes to stabilize, recheck the concentration value and note the value for
later use.
5. Increase the Converter Setpoint value by
20°C, wait 15 minutes, and note the concentration value. Repeat this step until either a converter efficiency of between
95% and 98% is obtained or the final
20°C increment produces an efficiency increase of less than one percent.
6. Decrease the Converter Setpoint value by
5°C, which places the converter at a temperature suitable for low ammonia interference and efficient NO
7. Recheck the Converter Temperature
value in the “Physical Measurements”
menu, and compare it to the initially recorded value.
conversion.
2
NOTE
Converter temperature is not a direct
measure of converter efficiency. Temperature measurement is for reference purposes only.
Rosemount Analytical Inc. A Division of Emerson Process Management Operation 3-37
Page 66

Instruction Manual
760000-C
November 2002
Model NGA2000 CLD
3-13 MEASUREMENT OF CONVERTER EFFI-
CIENCY
It is the responsibility of the user to measure
efficiency of the NO2-to-NO converter during
initial startup and thereafter at intervals appropriate to the application (normally once a
month).
The reactant material used in the converter
provides the optimum combination of high
conversion efficiency and low ammonia interference. Unlike most competitive analyzers,
the NGA 2000 CLD Analyzer Module utilizes a
reactant material that gradually becomes
more efficient at a given temperature. Thus,
after a period of use, operation at a lower
temperature setpoint than initially required is
possible.
a. Test Setup for Measurement of Con-
version Efficiency
A typical setup for measurement of conversion efficiency is shown in Figure 3-67,
page 3-41. The test setup includes:
A cylinder of nitric oxide standard gas
consisting of NO in N
The concentration of NO in the standard
gas should be about the full-scale value of
the range under test. The test sample
supplied to the analyzer should contain a
concentration of NO comparable to that in
the samples that are to be analyzed. Alternatively, a higher concentration NO
standard may be used if the test setup includes provision for diluting it appropriately with zero air. Suitable standard
gases are available from various suppliers. Stainless steel cylinders are commonly used, but specially treated
aluminum is preferred for low
parts-per-million NO samples.
An ozone generator utilizing an ultraviolet
lamp, not a corona discharge
A corona discharge ozone generator is
undesirable because it may produce oxygen atoms, which can then combine with
atmospheric nitrogen to form NO. The re-
2
sult can be an erroneously high value for
the measured conversion efficiency.
b. Test Procedure
1. Measure converter temperature in
the sub-menu structure as described in Section 3-7i, page 3-18.
Note present reading as a reference
for comparison with subsequent
readings.
2. Lower converter temperature to
300°C as described in Section 311a, page 3-32, Temperature Control Parameters, and wait 15 minutes for temperature equilibration.
3. (See Figure 3-67, page 3-41) Con-
nect the Model 958 Converter Efficiency Tester to the CLD Module,
and follow Steps 4 through 17 below
(as adapted from 40 CFR 60):
4. Attach the NO/N
air supply to C1, and the CLD Module inlet fitting to C3.
5. With the variable transformer off,
switch the CLD Module to NO
mode, and close valve MV1.
6. Open valve MV2 until the CLD
Module SAMPLE Pressure Gauge
reaches operating pressure and the
BYPASS flowmeter indicates some
bypass flow. Wait until stable readings are obtained by the CLD Module.
7. Zero and span the Analyzer output
to indicate the value of the NO concentration being used. This value
should be about 80% of full-scale.
Record this concentration.
8. Open valve MV1 (air supply meter-
ing valve) and adjust to blend
enough air to lower the NO concentration (as noted above) about 10%.
Record this concentration.
9. Power up the ozonator, and in-
crease its supply voltage until the
supply to C2, the
2
3-38 Operation Rosemount Analytical Inc. A Division of Emerson Process Management
Page 67

Model NGA2000 CLD
Instruction Manual
760000-C
November 2002
NO concentration noted in Step 8 is
reduced to about 20 percent of the
concentration noted in Step 7. Wait
for stabilization. NO
formed from the NO + O
is now being
2
reaction.
3
There must always be at least 10
percent un-reacted NO at this point.
Record this concentration.
10. Switch the CLD Module to NOx
mode. Total NOx concentration is
now output to the network for display. Record this concentration.
11. Turn off the ozonator, and allow the
Analyzer reading to stabilize. Total
NOx concentration of the dilute NO
span gas initially used is displayed.
Record this concentration.
12. Close valve MV1. The NO concentration should be equal to or greater
than the reading in Step 7. This indicates whether the NO contains
any NO
.
2
In the initial measurement, after
lowering the temperature setpoint
in Step 2, the efficiency will normally be less than 92%.
14. Reset converter temperature setpoint
20°C higher, wait 15 minutes for
temperature equilibration, and
measure conversion efficiency by repeating Steps 3 through 13. Conversion efficiency should be improved.
15. Repeat Step 14 until: a) 95% to 98%
efficiency is attained or b) the final
20°C converter temperature adjustment yields an increase in efficiency
of less than 1%.
16. Reset converter temperature setpoint
5°C lower. Converter temperature is
now set to the front edge of the plateau on the efficiency-vs.-temperature curve. (See
NOTE
Figure 3-68, page 3-42.) This setting
13. Calculate the efficiency of the NO
converter by substituting the concentrations obtained during the test
should provide the optimum combination of high conversion efficiency
and low ammonia interference.
in the equation below:
17. Wait 15 minutes for temperature
%efficiency = 1 + x 100
a - b
-
Where:
a = recorded concentration in Step 10
equilibration, and check converter
temperature. Compare present temperature with original value. Normally, converter temperature should
be in the range of 300°C to 400°C
(572°F to 752°F).
b = recorded concentration in Step 11
c = recorded concentration in Step 8
d = recorded concentration in Step 9
In the example in Figure 3-67B, page
3-41, the following calculations would
apply:
c. Subnormal Conversion Efficiency
If a measured conversion efficiency of between 95% and 98% is unobtainable
within the normal temperature range, the
most probable cause is depletion of the
catalytic material within the converter.
%efficiency = 1 + x 100 = 92%
Efficiency checks should be made on
each analyzer range, using an NO
span gas concentration appropriate
to the instrument range.
Rosemount Analytical Inc. A Division of Emerson Process Management Operation 3-39
80 - 85
-
However, before concluding that the converter is defective, ensure that the conversion efficiency measurement is
accurate. Though the measured efficiency
is less than the 95% to 98% range, the
actual efficiency may be somewhat
higher.
Page 68

Instruction Manual
760000-C
November 2002
Model NGA2000 CLD
An apparent subnormal efficiency can be
due to a problem external to the Analyzer
Module, perhaps located either within the
test setup or between it and the Analyzer
Module. Check the following:
1. Leakage.
2. Loss of NO
Analyzer Module. Such loss can occur by reaction with a rubber diaphragm in a pressure regulator or
flow controller. Stainless steel diaphragms are preferred. Loss can
also occur during passage through
filter media.
d. Replacement of Converter
If the subnormal conversion efficiency is
real, and not due to measurement error
introduced by the test setup, the converter
must be replaced. See Section 4-4, page
4-1.
between test setup and
2
The usual cause of converter failure is
destruction of a large part of the catalytic
material by excessive heat. This is due either to an excessively high temperature
setpoint or failure of the converter temperature control circuitry.
e. Capillaries
Replacement vent and pump capillaries
should be installed finger-tight. Use of a
wrench can constrict capillaries, thus
changing flow rate. Sample capillary is
metal; use a wrench for tightening.
f. TEA Scrubber
The presence of NO2 in the NO cylinders
can cause inaccurate converter efficiency
values. The TEA Scrubber accessory
(P/N NL635741) can be used to remove
residual NO
of this accessory allows an NO2-free NO
calibration gas.
from the NO cylinders. Use
2
3-40 Operation Rosemount Analytical Inc. A Division of Emerson Process Management
Page 69

Instruction Manual
760000-C
November 2002
A. TYPICAL TEST SETUP
FLOWMETER
FM2
METERING
VALVE MV2
Model NGA2000 CLD
CONNECTOR C3
TO SAMPLE INLET OF
OFF
115
ON
VAC
VARIABLE
TRANSFORMER
T1
OZONATOR
UTILIZING
ULTRAVIOLET
LAMP
FLOWMETER
FM1
CLD ANALYZER MODULE
FLOW APPROXIMATELY 3
LITERS PER MINUTE
CONNECTOR C2
STANDARD GAS:
NO IN N
BACKGROUND
2
ALL LINES AND FITTINGS STAINLESS STEEL OR TEFLON
B. TYPICAL TEST RESULTS
NO in
2
N
85
90
80
AIR ADDED
OZONATOR OFF
OZONATOR
ON
CONNECTOR C1
ZERO AIR
METERING
VALVE MV1
CAUTION: Externally limit sample
flow rate to less than 2200 cc/min.
a-b
c-d
20
0
c
NO Mode
a
d
TO NOX
MODE
NOX Mode
b
% Efficiency = 100
a - b
1+
( )
c - d
Figure 3-67. Measuring Efficiency of NO2 to NO Converter
3-42 Operation Rosemount Analytical Inc. A Division of Emerson Process Management
Page 70

Model NGA2000 CLD
A
bout
Instruction Manual
760000-C
November 2002
97%
Final 2 degree
higher
adjustment
Final 1 degree lower
Converter
Efficiency
adjustment
Converter Temperature
Figure 3-68. Conversion Efficiency as a Function of Converter Temperature
Rosemount Analytical Inc. A Division of Emerson Process Management Operation 3-43
Page 71

Model NGA2000 CLD
MAINTENANCE AND SERVICE
Instruction Manual
760000-C
November 2002
SECTION 4
WARNING.
ELECTRICAL SHOCK HAZARD
Disconnect power to the module(s) prior to replacing components.
This equipment should not be adjusted or repaired
by anyone except properly qualified service personnel.
4-1 OVERVIEW
The CLD Analyzer Module requires very little
maintenance during normal operation.
Occasionally, the intake fan screen may require
cleaning, refer to Section 4-3, page 4-1.
Also, the detector's reaction chamber and sapphire window may require cleaning, refer to Section 4-7, page 4-3.
White crystal deposits on the windows of the reaction chamber and plugging of capillaries and vent
are usually due to sample contaminates such as
ammonia reacting with the high ozone levels and
NO components. To eliminate the contaminates,
the sampling system should be reworked or a preventive maintenance program developed (if dropout is not excessive). Another source of crystalline
formation is contaminated air.
Several components may require replacement.
These are discussed in the following sections.
4-2 FUSES
The main power fuse may require replacement.
NOTE
Before replacing the fuse, remove power to
the Analyzer Module.
See Figure 1-3, page 1-3 for the location of the
Power Supply Board main power fuse, which
protects 24 VDC input to the module.
4-3 FANS
Refer to Figure 4-1, page 4-2. To replace either rear panel fan, remove the cover of the
Analyzer Module and then the rear panel.
Disconnect connectors and remove screws.
Assemble in reverse order.
4-4 CONVERTER
Refer to Figure 4-1, page 4-2 and Figure 4-2,
page 4-3. To replace the converter or sensor,
disconnect the two pneumatic tubes and two
electrical connections. Unlace the heater
blanket, and remove the converter. Reassemble in reverse order, ensuring that the converter is oriented with the glass cloth at the
bottom and the sensor is oriented correctly inside the heater jacket.
4-5 OZONATOR
Refer to Figure 4-1, page 4-2.To replace the
ozonator, remove the two large straps and all
tie-wraps, and disconnect the one electrical
connection. Reassemble in reverse order.
4-6 PRINTED CIRCUIT BOARDS
All four printed circuit boards can be replaced,
if necessary. Refer to Figure 4-1, page 4-2 for
location of the Driver, Power Supply, Signal
and Computer Boards.
To remove any PCB (except the Computer
Board), disassemble the enclosure side first.
Ribbon and other cables are long enough to
allow the entire side to be folded out from the
remainder of the components. This makes
PCB removal much simpler.
Tag each connector and its location before
disconnecting any wiring. This helps in reassembly.
Rosemount Analytical Inc. A Division of Emerson Process Management Maintenance and Service 4-1
Page 72

Instruction Manual
760000-C
November 2002
Optional Bypass Flow Sensor.
4
Ground wires from ozonator shown.
3
Flow direction of intake fan (shown) is into case. Flow direction of exhaust fan is out of case.
2
1
Fan guard between fan and EMI filter is on the intake fan only (shown).
PCB Insulators
Flow Balance
Metering Valve
903207
Ozonator
659494
Signal
Board
655580
Insulator
Computer Analysis
Board 655520
Transistor
655264
Driver
Board
655620
Sample
Pressure
Sensor
655253
Sample
Regulator
655269
NO/NOx Solenoid
655263
Thermostat
657298
4
Flow Sensor
902931
Glass Tube
Connectors
Pressure Switch 662298
Ozonator Power Supply
657716
Ozone
Pressure
Sensor
655254
Fuse, Power
903347
3
LON/Power
Module
Fan Guard
Figure 4-1. CLD Module Assembly
Model NGA2000 CLD
Converter Assembly 655250
See Figure 4-2
1
Fan Guard
EMI Shield
2
Fan
655245
Detector Assembly 658160
See Figure 4-3
Detector Case
Insulator
Power Supply
Board 657520
4-2 Maintenance and Service Rosemount Analytical Inc. A Division of Emerson Process Management
Page 73

Model NGA2000 CLD
r
r
r
r
Instruction Manual
760000-C
November 2002
ASSEMBLED SIDE VIEW
Senso
Glass
Cloth
4-7 DETECTOR DISASSEMBLY
Refer to Figure 4-3, page 4-5.
a. Reaction Chamber Removal
Disconnect the stainless steel tubing lines at
the fittings. Remove the (4) nuts holding the
Detector Assembly to the chassis. Disconnect the plug from connector J1 on the Signal Board and remove the assembly from the
chassis.
NOTE
Care should be taken to avoid getting
heatsink compound on optical surfaces. If
this substance is removed during the disassembly process, a zinc-oxide-filled,
silicone grease (e.g., Dow Corning 340 or
EG&G Wakefield Engineering's Series 120
Thermal Joint Compound) be reapplied in
the reassembly of this component.
Heate
Jacket
655228
Converte
Tube 655227
Wrap with
aluminum foil
Figure 4-2. Converter Assembly
Remove the (2) screws holding the tube
assembly in place. Hold the tubing with
one hand while inverting the Detector
Housing with the other, allowing the Reaction Chamber O-ring and window to be
removed from below.
b. Reaction Chamber Installation
To reinstall, hold the housing in the inverted position while sliding the Reaction
Chamber O-ring and window into position
and the tubing into the slot in the housing.
Hold the Reaction Chamber in place while
rotating the housing upright. Replace the
hold-down screws.
The procedure described above is for
the purpose of maintaining the relative
positions of windows and O-ring to the
Reaction Chamber during installation.
Senso
655282
NOTE
Although the heater and thermostat can be
removed to facilitate handling, contact with
the white heatsink compound can be minimized by leaving these items in place. Re-
Replace the top cap and screws. Reverse
the removal procedure to reinstall the Detector Assembly into the Analyzer Mod-
ule.
move the (2) screws holding the top plate of
the Detector , and move the plate along the
wires and away from the Detector .
Rosemount Analytical Inc. A Division of Emerson Process Management Maintenance and Service 4-3
Page 74

Instruction Manual
760000-C
November 2002
Model NGA2000 CLD
c. Photodiode Removal
Remove the Detector Assembly as described
above. Invert the housing to access the
mounting bracket. Remove the (3) screws
and shoulder washers from the bracket. Remove the bracket, insulating disk and bottom
plate as a unit to minimize the spread of the
heatsink compound.
Remove the (2) screws holding the lower
section of the Detector Housing, then slide
the section along the cable and remove.
Remove the (2) screws holding the socket,
thermistor and photodiode in place, being
careful not to lose the washers that are used
as shims.
Grasp the socket and photodiode base while
slowly rotating to separate the photodiode
from the housing. Some friction will be felt as
an O-ring is used around the photodiode as a
seal.
d. Photodiode Installation
To replace the photodiode, carefully remove
the diode from the green socket, and replace
with a new one. Before mounting the new di-
ode, the top cap of the enclosure should
be temporarily removed and the (2)
screws holding the Reaction Chamber
loosened about two turns. This allows air
which is trapped between the O-ring seals
to escape when the diode is inserted. It
also maintains the position of the O-ring
and window in the upper compartment.
The new photodiode should be slowly in-
serted into the housing while gradually ro-
tating the body. This allows the O-ring to
properly seat. Continue replacing screws,
washers, thermistors, etc., with the thicker
shim (washer) on the opposite side of the
socket from the thermistor.
Replace the lower section of the housing,
then the bottom cover, insulator and
bracket with the shoulder washers and
screws.
Re-tighten the screws in the Reaction
Chamber (upper section). Replace the top
cap and its screws.
To reinstall in the Analyzer Module, re-
verse the procedure for removal as indi-
cated above.
4-4 Maintenance and Service Rosemount Analytical Inc. A Division of Emerson Process Management
Page 75

Model NGA2000 CLD
A
Instruction Manual
760000-C
November 2002
Sapphire
Window
Photodiode
Reaction
Chamber
Thermistor
Assembly
Exhaust
Heater
*
M3X0.5 x 16 mm Screw (2)
3mm Spring Washer (2)
Photodiode Socket
ssembly
Detector Mounting
Bracket
Heater
*
Thermostat
Tubing Cover
M3X0.5 x 25 mm Screw (2)
3mm Spring Washer (2)
Detector Header
Retainer Gasket
*
Reaction Chamber
O-Ring 854540
Sapphire Window
Cushioning Gasket
Ozone
Sample
Photodiode
Cable
Lower Cover
Insulator
(between Lower Cover
and Mounting Bracket)
Photodiode Case
Ground
M3X0.5 x 16mm
Screw (3)
Nylon Shoulder
Washers (3)
O-Ring 876478
Photodiode Assembly
(see detail below)
M3X0.5 x 20 mm Screw (2)
(see detail below)
3mm Spring Washer (2)
Detector Cover
M3X0.5 x 16 mm Screw (2)
3mm Spring Washer (2)
Heater/Thermostat Assembly 655235.
*
Photodiode
655258
Thermistor
655216
Thermistor Shim
Thermistor Spacer
No. 6 Flat Washer (2)
Photodiode Socket Assembly
Assembly of Photodiode
Figure 4-3. Detector Assembly
Rosemount Analytical Inc. A Division of Emerson Process Management Maintenance and Service 4-5
Page 76

Instruction Manual
760000-C
November 2002
Model NGA2000 CLD
4-6 Maintenance and Service Rosemount Analytical Inc. A Division of Emerson Process Management
Page 77

Model NGA2000 CLD
TROUBLESHOOTING
5-1 LEAKS
Liberally cover all fittings, seals, and other
possible sources of leakage with a suitable
leak test liquid such as SNOOP (part
837801). Bubbling or foaming indicates leakage. Checking for bubbles will locate most
leaks but could miss some, as some areas
are inaccessible to the application of SNOOP.
For positive assurance that system is leak
free, perform one of the tests above.
Instruction Manual
760000-C
November 2002
SECTION 5
Rosemount Analytical Inc. A Division of Emerson Process Management Troubleshooting 5-1
Page 78

Instruction Manual
760000-C
November 2002
Model NGA2000 CLD
5-2 Troubleshooting Rosemount Analytical Inc. A Division of Emerson Process Management
Page 79

Instruction Manual
760000-C
Model NGA2000 CLD
November 2002
SECTION 6
REPLACEMENT PARTS
WARNING
PARTS INTEGRITY
Tampering with or unauthorized substitution of components may adversely affect safety of this product.
Use only factory-approved components for repair.
6-1 MATRIX
Each analyzer is configured per the customer
sales order. Below is the CLD sales matrix
which lists the various configurations avail-
To identify the configuration of an analyzer,
locate the analyzer name-rating plate. The
sales matrix identifier number appears on the
analyzer name-rating plate.
able.
CLD CHEMILUMINESCENCE NO/NOx ANALYZER - CLD (ANALYZER MODULE)
Code Software Version
01 Current Version Software
02 2.2.1 Version Software
03 3X Version Software - specify version
Code Configuration Identifier(1)
A Calibrated Low Ranges: 0-10, 0-25, 0-100, 0-250 ppm
B Calibrated Low Ranges: 0-10, 0-30, 0-100, 0-300 ppm
C Calibrated Low Ranges: 0-10, 0-50, 0-100, 0-500 ppm
D Calibrated High Ranges: 0-250, 0-1000, 0-2500, 0-10000
E Calibrated High Ranges: 0-300, 0-1000, 0-3000, 0-10000 ppm
F Calibrated High Ranges: 0-500, 0-1000, 0-5000, 0-10000 ppm
G Calibrated Low Range 0-5 ppm
9 Special
Code Materials
1 Brass and Neoprene Back Pressure Regulator 5 psi
2 Brass and Neoprene Back Pressure Regulator 2 psi
3 Stainless Steel and Viton Back Pressure Regulator 5 psi
4 Stainless Steel and Viton Back Pressure Regulator 2 psi
9 Special
Code Flow Sensor
01 Standard (No Flow Sensor)
02 400 - 2000 cc/min
99 Special
Code Special Requirements
00 None
G1 Customer Option
99 Special
CLD 01 A 3 01 00 Example
Rosemount Analytical Inc. A Division of Emerson Process Management Replacement Parts 6-1
Page 80

Instruction Manual
760000-C
November 2002
Model NGA2000 CLD
6-2 REPLACEMENT PARTS
658157 Air Restrictor 430 cc/min 12 psig
657473 Capillary, Pump 5 psig
660405 Capillary, Pump 2 psig
660404 Capillary, Sample 200 cc/min 2 psig
659658 Capillary, Sample 200 cc/min. 5 psig
659657 Capillary, Sample 70 cc/min. 5 psig
655520 Computer Board
655250 Converter
659754 Detector 200 cc/min.
659753 Detector 70 cc/min.
655620 Driver Board
655245 Fan (Exhaust and Intake)
903347 Fuse, Main Power 6A 250V
659494 Lamp, Ozone Generator
657719 Ozone Generator
657520 Power Supply Board
657716 Power Supply, Ozone Generator
655253 Pressure Sensor, Sample
662298 Pressure Switch
659895 PROM
660400 Regulator, Brass/Neoprene 2 psig
655269 Regulator, Brass/Neoprene 7 psig
660401 Regulator, SS/Viton 2 psig
659063 Regulator, SS/Viton 5 psig
902931 Sensor, Flow
655254 Sensor, Ozone Pressure
655580 Signal Board
655263 Solenoid Valve, NO/NOx
657298
655264 Transistor Assembly
903207 Valve, Flow Balance
Thermostat 80°C
655250 Converter Replacement Parts
655228 Heater Jacket
655227 Tube, Aged
655282 Sensor, Temperature
659753, 659754 Detector Replacement
Parts
655235 Heater/Thermostat Assembly
655216 Thermistor
655258 Photodiode
854540 O-Ring, Viton .739ID .875OD
876478 O-Ring, Viton .737ID .943OD
6-2 Return of Material Rosemount Analytical Inc. A Division of Emerson Process Management
Page 81

Model NGA 2000 TO2
RETURN OF MATERIAL
7-1 RETURN OF MATERIAL
If factory repair of defective equipment is required, proceed as follows:
1. Secure a return authorization from a
Rosemount Analytical Inc. Sales Office or
Representative before returning the
equipment. Equipment must be returned
with complete identification in accordance
with Rosemount instructions or it will not
be accepted.
Rosemount CSC will provide the shipping
address for your instrument.
In no event will Rosemount be responsible for equipment returned without proper
authorization and identification.
2. Carefully pack the defective unit in a
sturdy box with sufficient shock absorbing
material to ensure no additional damage
occurs during shipping.
3. In a cover letter, describe completely:
• The symptoms that determined the
equipment is faulty.
• The environment in which the equip-
ment was operating (housing,
weather, vibration, dust, etc.).
• Site from where the equipment was
removed.
• Whether warranty or non-warranty
service is expected.
• Complete shipping instructions for the
return of the equipment.
4. Enclose a cover letter and purchase order
and ship the defective equipment according to instructions provided in the Rosemount Return Authorization, prepaid, to
the address provided by Rosemount
CSC.
Rosemount Analytical Inc.
Process Analytical Division
Customer Service Center
1-800-433-6076
SECTION 7
7-2 CUSTOMER SERVICE
7-3 TRAINING
Instruction Manual
760000-C
November 2002
If warranty service is expected, the defective
unit will be carefully inspected and tested at
the factory. If the failure was due to the conditions listed in the standard Rosemount warranty, the defective unit will be repaired or
replaced at Rosemount’s option, and an operating unit will be returned to the customer in
accordance with the shipping instructions furnished in the cover letter.
For equipment no longer under warranty, the
equipment will be repaired at the factory and
returned as directed by the purchase order
and shipping instructions.
For order administration, replacement Parts,
application assistance, on-site or factory repair, service or maintenance contract information, contact:
Rosemount Analytical Inc.
Process Analytical Division
Customer Service Center
1-800-433-6076
A comprehensive Factory Training Program of
operator and service classes is available. For
a copy of the Current Operator and Service
Training Schedule
vices Department at:
Rosemount Analytical Inc.
Customer Service Center
contact the Technical Ser-
1-800-433-6076
Rosemount Analytical Inc. A Division of Emerson Process Management Return of Material 7-1
Page 82

Instruction Manual
760000-C
November 2002
Model NGA2000 CLD
7-2 Return of Material Rosemount Analytical Inc. A Division of Emerson Process Management
Page 83

Model NGA 2000 TO2
SECTION 8
A
ACKN, 3-14
Actual status, 3-30
Alarm delay, 3-14
Alarm generation, 3-14
Alarm messages valid for, 3-32
analyzer module diagnostics, 3-32
analyzer will calculate the best fit polynomial, 3-16
Applying power, 3-7
automatic measurement and flow balance
calculation, 3-34
Automatic range change control, 3-10
B
Barometric pressure compensation, 3-33
binding, 3-7
Block temp, 3-20
Brightness and Contrast, 3-11
bypass flow, 3-13
Instruction Manual
760000-C
November 2002
INDEX
installation location temperature restrictions, 2-2
power connection, 2-4
communication protocol, 3-29
Computer Board, 4-1
Contaminants, 2-4
converter operational temperatures, 3-37
Converter temp, 3-20
correction factor, 3-34
Current signal value, 3-28
Cursor Keys, 3-1
cylinder gases, 2-2
D
Date and time, 3-32
Detector Assembly, 4-3
Detector Assembly, 4-4
Detector temp, 3-20
Diagnostic menus, 3-32
DIO module, 3-31
Dow Corning 340, 4-3
Driver Board, 4-1
C
Cal failure error allowed, 3-22
calibration, 3-21
basic controls level, 3-21
expert controls level, 3-21
system, 3-21
Calibration adjustment limits, 3-22
Calibration averaging time, 3-22
calibration factors, 3-24
Calibration failure alarm, 3-22
Calibration Gas List, 3-21
Calibration Gases, 2-3
Calibration Parameters, 3-22
Calibration Results, 3-23
Calibration status, 3-20
Calibration time out, 3-22
capillaries, 3-40
cause of converter failure, 3-40
change the alarm limits, 3-13
chemiluminescence method of detection, 1-1
choose signal, 3-27
Choose signal, 3-30
choose source module, 3-30
choose the analyzer module, 3-27
CLD Analyzer Module
Installation into Platform, 2-1
E
efficiency of the NO2-to-NO converter, 3-38
EG&G Wakefield Engineering's Series 120 Thermal
Joint Compound, 4-3
Enable Security Code, 3-36
Enter Key, 3-1
Entering a level locked by security code, 3-36
F
fan screen, 4-1
Flash-EPROM, 3-35
Function Keys, 3-1
Back, 3-2
BasicCal, 3-2
Channel, 3-2
Display, 3-2
ESCAPE, 3-2
FACTORS, 3-24
HISTORY, 3-25
HOME, 3-2
INFO, 3-2
Lock, 3-2
Main, 3-2
Measure, 3-2
MFG Data, 3-2
Rosemount Analytical Inc. A Division of Emerson Process Management Index 8-1
Page 84

Instruction Manual
760000-C
November 2002
Model NGA2000 CLD
More, 3-2
NEXT, 3-24
RSTR MN, 3-25
RSTR ST, 3-25
Status, 3-2
STORE, 3-24
Function Line, 3-2
G
Gas measurement, 3-18
H
Health, 3-20
heater, 4-1, 4-3
heater jacket, 4-1
hold output during calibration, 3-28
hysteresis level, 3-17
I
I/O Module
installation, 2-1
Inlet/Outlet fittings, 2-2
Interference, 3-20
invert signal, 3-30
L
LCD brightness and contrast, 3-7
Leak Test, 2-4
linear polynomials, 3-14
linearization curve must be monotonic, 3-16
Linearizer, 3-20
Load configuration data from serial interface, 3-34
Loading/saving configuration parameters, 3-32
LON update rate, 3-17
M
main power fuse, 4-1
Maximum permissible interval between calibrations,
3-7
measured conversion efficiency, 3-39
Measurement mode, 3-20
Measurement range number, 3-10, 3-12
Menu Line, 3-1
Midpoint Correction Set Up, 3-16
Monotonic, 3-16
N
NO/NOx, 3-20
NO/NOx flow balance, 3-34
Noise level, 3-20
O
operation mode, 3-28
adjust 0V, 3-28
adjust 10V, 3-28
normal, 3-28
Operational state, 3-20
output current, 3-28
output delay time, 3-17, 3-20
output number, 3-30
Output number, 3-28
output(s) value on analyzer failure, 3-28
Ozonator, 3-20
Ozonator Power, 3-10
Ozonator Source Gas, 2-3
P
photodiode, 1-1, 3-20, 4-4
PIN, 3-35
point to be measured, 3-16
power failure, 3-1
Power Supply Board, 4-1
Power Supply Board main power fuse, 4-1
Power supply voltages, 3-33
ppm to mg/Nm3 conversion factor:, 3-18
Pressure, 2-3
Pressure measurement, 3-18
Primary variable parameters, 3-33
R
Range and functional control, 3-12
Raw signal, 3-20
Reaction Chamber, 4-3, 4-4
Replace current configuration with factory settings,
3-35
response time, 3-17
Return Authorization, 7-2
S
Sample, 2-3
maximum flow, 2-3
sample contaminates, 4-1
Sample flow, 3-20
Sample line tubing type, 2-2
Sample press, 3-20
security codes, 3-32
Security codes
enabled, 3-36
lost or forgotten, 3-35
select analog output number, 3-26
Send configuration to serial interface, 3-34
serial interface options, 3-29
Set up a new date or time, 3-35
8-2 Index Rosemount Analytical Inc. A Division of Emerson Process Management
Page 85

Model NGA 2000 TO2
Instruction Manual
760000-C
November 2002
Setting the code numbers, 3-35
shipping damage, 2-1
Signal Board, 4-1, 4-3
Signal comes from, 3-30
Signal name, 3-28, 3-30
signal value for 0% (100%) output, 3-27
SIO module, 3-26
SNOOP, 5-1
Source module, 3-28
Span gas concentration, 3-10
special scaling for concentration signal, 3-28
subnormal efficiency, 3-40
Switch automatically to, 3-11
Switch off backlight, 3-11
System calibration, 3-32
System reset, 3-32
T
t90 time, 3-17, 3-20
Tag Line, 3-2
TEA Scrubber, 3-40
temperature control PID algorithms, 3-33
Temperature measurement, 3-18
Text Line, 3-2
thermistor, 4-4
V
Validity, 3-20
Variable Line, 3-2
vitreous carbon converter, 3-37
reduced efficiency, 3-37
W
warm-up period, 3-7
warning alarms for the temperatures, 3-33
Z
Zero (Span) ranges, 3-22
Rosemount Analytical Inc. A Division of Emerson Process Management Index 8-3
Page 86

Instruction Manual
760000-C
November 2002
Model NGA2000 CLD
8-4 Index Rosemount Analytical Inc. A Division of Emerson Process Management
Page 87

Model NGA2000 CLD
MATRIX POSITION 12, VALUE “G”
1.0 OVERVIEW
The following special modifications to your
standard CLD Analyzer (PN 194005) are
made as specified by the “G” designator chosen for the 12
and supercedes the information supplied in
this manual.
2.0 SPECIFICATIONS
Range: 10, 50, 300 PPM
Noise: 1% Range
T90 Response: 1-2 sec.
Sample Flow: 3 L/min.
Sample Pressure: 2 psig
Conformity: Non-Linear
3.0 PHYSICAL MODIFICATIONS
Flow Sensor Removal
The flow sensor (PN 902931) has been removed. This does not affect the operation,
accuracy or safety of the analyzer. It means
that the bypass flow is no longer measured.
Therefore, the platform display has been
modified to show:
th
position of the product matrix
Addendum
748371-E
February 2000
ADDENDUM
Sample pressure
Block temperature
Ozonator
Converter temperature
The CLD physical parameter will now indicate
zero sample flow, and generate a validity and
warning alarm which will not be displayed and
should be disregarded.
Component Changes
The following parts have replaced the standard components:
• Pump Capillary PN 660405
• Detector 200 cc/min 2 psig PN 660404
• Back Pressure Regulator 2 psig PN
660400
4.0 FLOW DIAGRAM
CLD module with value “G” in matrix position
12, Figure 1-1 Flow Diagram is replaced with
Figure 1-1 on this addendum.
http://www.processanalytic.com
Page 88

Addendum
748371-E
February 2000
Model NGA2000 CLD
TUBING, 1/8 O.D. FLOUROCARBON
OZONE GENERATOR
CONN, GLASS
TUBE (2)
BLACK
1/8 O.D.
1/8T
BRASS
NOx/NO CONVERTER
NC NO
NOx/NO SOLENOID VALVE
PRESSURE SWITCH
4-15 psig (NO)
SENSOR, OZONE
PRESSURE 30 psig
CONN, MALE
1/8T – 3/8NPT
BRASS
RESTRICTOR, AIR
130 cc/min. @ 12 psig
CONN
1/8T – 1/8NPT
BRASS
TUBING, VITON
.116 I.D.
CONN, MALE
1/8T – 3/8NPT
BRASS
CROSS
REDUCER, BULKHEAD
1/4T – 1/8T BRASS
E AIR
Unless otherwise specified all tubing is 1/8 O.D. teflon.
OZONE
CHAMBER
REACTION
DETECTOR
UNION
1/8T CRES
TEE
1/8T
KYNAR
VENT CAPILLARY
70 cc/min. 4 psig
PN 634398
TEE 1/8T KYNAR
C
METERING VALVE
.125 SWL CRES
EXHAUST
UNION
1/4T - 1/8T CRES
PUMP CAPILLARY
1/8 O.D. TEFLON
PN 657473
REDUCER
TUBING, 1/4O.D. TEFLON
ELBOW, MALE
1/4T – 1/4NPT
CRES
BACK
PRESSURE
TEE ASSEMBLY
1/8T – 1/4NPT
SAMPLE
SAMPLE CAPILLARY
70 cc/min. 5 psig PN 659657
TUBING 1 / 4 O.D. TEFLON
REDUCER
1/4T - 1/8T
CRES
1/8T - 1/16T CRES
SENSOR, SAMPLE
PRESSURE 15 PSIG
CROSS 1/8T
CRES
TEE
1/4T
REGULATOR
REDUCER, BULKHEAD
1/4T – 1/8T CRES
MPLE
200 cc/min. 2 psig PN 659658
CONN, MALE
CRES
BULKHEAD
1/4T CRES
1/8T-3/8NPT CRES
UST
TEE 1/8T
KYNAR
TUBING, 1/4O.D. TEFLON TUBING, 1/4O.D. TEFLON
Figure 1-1. CLD Flow Diagram – Matrix Position 12, Value “G”
Teflon® is a registered trademark of E.I. duPont de Nemours and Co., Inc.
Kynar® is a registered trademark of Pennwalt, Inc.
2 of 2 Addendum - Matrix Position 12, Value "G"
Rosemount Analytical Inc. A Division of Emerson Process Management
Page 89

WARRANTY
Goods and part(s) (excluding consumables) manufactured by Seller are warranted to be free from
defects in workmanship and material under normal use and service for a period of twelve (12)
months from the date of shipment by Seller. Consumables, glass electrodes, membranes, liquid
junctions, electrolyte, o-rings, etc., are warranted to be free from defects in workmanship and material under normal use and service for a period of ninety (90) days from date of shipment by
Seller. Goods, part(s) and consumables proven by Seller to be defective in workmanship and/or
material shall be replaced or repaired, free of charge, F.O.B. Seller's factory provided that the
goods, part(s) or consumables are returned to Seller's designated factory, transportation charges
prepaid, within the twelve (12) month period of warranty in the case of goods and part(s), and in
the case of consumables, within the ninety (90) day period of warranty. This warranty shall be in
effect for replacement or repaired goods, part(s) and the remaining portion of the ninety (90) day
warranty in the case of consumables. A defect in goods, part(s) and consumables of the commercial unit shall not operate to condemn such commercial unit when such goods, part(s) and
consumables are capable of being renewed, repaired or replaced.
The Seller shall not be liable to the Buyer, or to any other person, for the loss or damage directly
or indirectly, arising from the use of the equipment or goods, from breach of any warranty, or from
any other cause. All other warranties, expressed or implied are hereby excluded.
IN CONSIDERATION OF THE HEREIN STATED PURCHASE PRICE OF THE GOODS,
SELLER GRANTS ONLY THE ABOVE STATED EXPRESS WARRANTY. NO OTHER WARRANTIES ARE GRANTED INCLUDING, BUT NOT LIMITED TO, EXPRESS AND IMPLIED
WARRANTIES OR MERCHANTABILITY AND FITNESS FOR A PARTICULAR PURPOSE.
Limitations of Remedy. SELLER SHALL NOT BE LIABLE FOR DAMAGES CAUSED BY DE-
LAY IN PERFORMANCE. THE SOLE AND EXCLUSIVE REMEDY FOR BREACH OF WARRANTY SHALL BE LIMITED TO REPAIR OR REPLACEMENT UNDER THE STANDARD
WARRANTY CLAUSE. IN NO CASE, REGARDLESS OF THE FORM OF THE CAUSE OF ACTION, SHALL SELLER'S LIABILITY EXCEED THE PRICE TO BUYER OF THE SPECIFIC
GOODS MANUFACTURED BY SELLER GIVING RISE TO THE CAUSE OF ACTION. BUYER
AGREES THAT IN NO EVENT SHALL SELLER'S LIABILITY EXTEND TO INCLUDE INCIDENTAL OR CONSEQUENTIAL DAMAGES. CONSEQUENTIAL DAMAGES SHALL INCLUDE, BUT
ARE NOT LIMITED TO, LOSS OF ANTICIPATED PROFITS, LOSS OF USE, LOSS OF REVENUE, COST OF CAPITAL AND DAMAGE OR LOSS OF OTHER PROPERTY OR EQUIPMENT.
IN NO EVENT SHALL SELLER BE OBLIGATED TO INDEMNIFY BUYER IN ANY MANNER
NOR SHALL SELLER BE LIABLE FOR PROPERTY DAMAGE AND/OR THIRD PARTY CLAIMS
COVERED BY UMBRELLA INSURANCE AND/OR INDEMNITY COVERAGE PROVIDED TO
BUYER, ITS ASSIGNS, AND EACH SUCCESSOR INTEREST TO THE GOODS PROVIDED
HEREUNDER.
Force Majeure. Seller shall not be liable for failure to perform due to labor strikes or acts beyond
Seller's direct control.
Page 90

Instruction Manual
760000-C
November 2002
Model NGA2000 CLD
EMERSON PROCESS MANAGEMENT
ROSEMOUNT ANALYTICAL INC.
PROCESS ANALYTIC DIVISION
1201 N. Main St.
Orrville, OH 44667-0901
T (330) 682-9010
F (330) 684-4434
E gas.csc@emersonprocess.com
ASIA - PACIFIC
Fisher-Rosemount
Singapore Private Ltd.
1 Pandan Crescent
Singapore 128461
Republic of Singapore
T 65-777-8211
F 65-777-0947
http://www.processanalytic.com
© Rosemount Analytical Inc. 2002
EUROPEAN TECHNOLOGY CENTER
Fisher-Rosemount GmbH & Co.
Industriestrasse 1
63594 Hasselroth
Germany
T 49-6055-884 0
F 49-6055-884209
EUROPE, MIDDLE EAST, AFRICA
Fisher-Rosemount Ltd.
Heath Place
Bognor Regis
West Sussex PO22 9SH
England
T 44-1243-863121
F 44-1243-845354
LATIN AMERICA
Fisher - Rosemount
Av. das Americas
3333 sala 1004
Rio de Janeiro, RJ
Brazil 22631-003
T 55-21-2431-1882
 Loading...