

Page 1

Operations manual
DAN-20057316, Rev AA
Daniel™ 3410 Series Gas Ultrasonic Flow
meters
Model 3418
January 2019
Page 2

2
Page 3

Flow Lifecycle Services for Daniel products
Location Telephone number Fax number
North America/Latin America +1.713.467.6000 +1.713.827.4805
Flow Lifecycle Services for Daniel products +1.713.827.6314 +1.713.827.6312
USA (toll free) +1.888.356.9001 +1.713.827.3380
Asia Pacific (Republic of Singapore) +65.6777.8211 +65.6777.0947.0743
Europe (Stirling Scotland, UK) +44 (0)1786.433400 +44 (0)1786.433401
Middle East Africa (Dubai, UAE) +971 4 8118100 +971 4 8865465
Daniel Measurement and Control, Inc. (Headquarters)
11100 Brittmoore Park Drive
Houston, TX 77041 USA
http://www.emerson.com
Email
• Customer Service: DanielCST.Support@Emerson.com
• Customer Support: Daniel.TechnicalSupport@Emerson.com
• Field Lifecycle Services: Tech.Service@Emerson.com
• Asia-Pacific: danielap.support@emerson.com
• Europe: danielEMA.cst@emerson.com
Return Material Authorization (RMA)
A Return Material Authorization (RMA) number must be obtained prior to returning any equipment for any reason. Access and
fill in the RMA form for Daniel products clicking on the link below.
http://go.emersonprocess.com/RMAOnlineForm
3
Page 4

Signal words and symbols
Pay special attention to the following signal words, safety alert symbols and statements:
Safety alert symbol
This is a safety alert symbol. It is used to alert you to potential physical injury hazards. Obey all safety messages that follow this
symbol to avoid possible injury or death.
DANGER
Danger indicates a hazardous situation which, if not avoided, will result in death or serious injury.
WARNING
Warning indicates a hazardous situation which, if not avoided, could result in death or serious injury.
CAUTION
Caution indicates a hazardous situation which, if not avoided, could result in minor or moderate injury.
NOTICE
Notice is used to address safety messages or practices not related to personal injury.
Important
Important is a statement the user needs to know and consider.
Tip
Tip provides information or suggestions for improved efficiency or best results.
Note
Note is “general by-the-way” content not essential to the main flow of information.
4
Page 5

Important safety instructions
Daniel Measurement and Control, Inc. (Daniel) designs, manufactures and tests products to function within specific conditions.
Because these products are sophisticated technical instruments, it is important that the owner and operation personnel must
strictly adhere both to the information printed on the product and to all instructions provided in this manual prior to installation,
operation, and maintenance.
Daniel also urges you to integrate this manual into your training and safety program.
BE SURE ALL PERSONNEL READ AND FOLLOW THE INSTRUCTIONS IN THIS MANUAL AND ALL NOTICES AND PRODUCT WARNINGS.
WARNING
Failure to follow the installation, operation or maintenance instructions for a Daniel product could lead to serious injury or
death from explosion or exposure to dangerous substances.
To reduce the risk:
• Comply with all information on the product, in this manual, and in any local and national codes that apply to this product.
• Do not allow untrained personnel to work with this product.
• Use Daniel parts and work procedures specified in this manual.
Product owners (Purchasers):
• Use the correct product for the environment and pressures present. See technical data or product specifications for
limitations. If you are unsure, discuss your needs with your Daniel representative.
• Inform and train all personnel in the proper installation, operation, and maintenance of this product.
• To ensure safe and proper performance, only informed and trained personnel should install, operate, repair and maintain this
product.
• Verify that this is the correct instruction manual for your Daniel product. If this is not the correct documentation, contact
Daniel at 1-713-827-6314. You may also download the correct manual from: https://www.emerson.com/en-us/automation/
daniel.
• Save this instruction manual for future reference.
• If you resell or transfer this product, it is your responsibility to forward this instruction manual along with the product to the
new owner or transferee.
• ALWAYS READ AND FOLLOW THE INSTALLATION, OPERATIONS, MAINTENANCE AND TROUBLESHOOTING MANUAL(S) AND
ALL PRODUCT WARNINGS AND INSTRUCTIONS.
• Do not use this equipment for any purpose other than its intended service. This may result in property damage and/or serious
personal injury or death.
5
Page 6

Product operation (Personnel):
• To prevent personal injury, personnel must follow all instructions of this manual prior to and during operation of the product.
• Follow all warnings, cautions, and notices marked on, and supplied with, this product.
• Verify that this is the correct instruction manual for your Daniel product. If this is not the correct documentation, contact
Daniel at 1-713-827-6314. You may also download the correct manual from: https://www.emerson.com/en-us/automation/
daniel.
• Read and understand all instructions and operating procedures for this product.
• If you do not understand an instruction, or do not feel comfortable following the instructions, contact your Daniel
representative for clarification or assistance.
• Install this product as specified in the INSTALLATION section of this manual per applicable local and national codes.
• Follow all instructions during the installation, operation, and maintenance of this product.
• Ensure that all connections to pressure and electrical sources are secure prior to and during equipment operation.
• Use only replacement parts specified by Daniel. Unauthorized parts and procedures can affect this product's performance,
safety, and invalidate the warranty. “Look-a-like” substitutions may result in deadly fire, explosion, release of toxic substances
or improper operation.
• Save this instruction manual for future reference.
6
Page 7

Notice
THE CONTENTS OF THIS PUBLICATION ARE PRESENTED FOR INFORMATIONAL PURPOSES ONLY, AND WHILE EVERY EFFORT HAS
BEEN MADE TO ENSURE THEIR ACCURACY, THEY ARE NOT TO BE CONSTRUED AS WARRANTIES OR GUARANTEES, EXPRESSED OR
IMPLIED, REGARDING THE PRODUCTS OR SERVICES DESCRIBED HEREIN OR THEIR USE OR APPLICABILITY. ALL SALES ARE
GOVERNED BY DANIEL'S TERMS AND CONDITIONS, WHICH ARE AVAILABLE UPON REQUEST. WE RESERVE THE RIGHT TO MODIFY
OR IMPROVE THE DESIGNS OR SPECIFICATIONS OF SUCH PRODUCTS AT ANY TIME.
DANIEL DOES NOT ASSUME RESPONSIBILITY FOR THE SELECTION, USE OR MAINTENANCE OF ANY PRODUCT. RESPONSIBILITY FOR
PROPER SELECTION, USE AND MAINTENANCE OF ANY DANIEL PRODUCT REMAINS SOLELY WITH THE PURCHASER AND END-USER.
TO THE BEST OF DANIEL'S KNOWLEDGE THE INFORMATION HEREIN IS COMPLETE AND ACCURATE. DANIEL MAKES NO
WARRANTIES, EXPRESSED OR IMPLIED, INCLUDING THE IMPLIED WARRANTIES OF MERCHANTABILITY AND FITNESS FOR A
PARTICULAR PURPOSE WITH RESPECT TO THIS MANUAL AND, IN NO EVENT, SHALL DANIEL BE LIABLE FOR ANY INCIDENTAL,
PUNITIVE, SPECIAL OR CONSEQUENTIAL DAMAGES INCLUDING, BUT NOT LIMITED TO, LOSS OF PRODUCTION, LOSS OF PROFITS,
LOSS OF REVENUE OR USE AND COSTS INCURRED INCLUDING WITHOUT LIMITATION FOR CAPITAL, FUEL AND POWER, AND
CLAIMS OF THIRD PARTIES.
PRODUCT NAMES USED HEREIN ARE FOR MANUFACTURER OR SUPPLIER IDENTIFICATION ONLY AND MAY BE TRADEMARKS/
REGISTERED TRADEMARKS OF THESE COMPANIES.
7
Page 8

Warranty and Limitations
1. LIMITED WARRANTY: Subject to the limitations contained in Section 2 herein, Daniel Measurement & Control, Inc. (“Daniel”)
warrants that the licensed firmware embodied in the Goods will execute the programming instructions provided by Daniel, and
that the Goods manufactured by Daniel will be free from defects in materials or workmanship under normal use and care and
Services will be performed by trained personnel using proper equipment and instrumentation for the particular Service provided.
The foregoing warranties will apply until the expiration of the applicable warranty period. Goods are warranted for twelve (12)
months from the date of initial installation or eighteen (18) months from the date of shipment by Daniel, whichever period expires
first. Consumables and Services are warranted for a period of 90 days from the date of shipment or completion of the Services.
Products purchased by Daniel from a third party for resale to Buyer (“Resale Products”) shall carry only the warranty extended by
the original manufacturer. Buyer agrees that Daniel has no liability for Resale Products beyond making a reasonable commercial
effort to arrange for procurement and shipping of the Resale Products. If Buyer discovers any warranty defects and notifies Daniel
thereof in writing during the applicable warranty period, Daniel shall, at its option, correct any errors that are found by Daniel in
the firmware or Services or repair or replace F.O.B. point of manufacture that portion of the Goods or firmware found by Daniel to
be defective, or refund the purchase price of the defective portion of the Goods/Services. All replacements or repairs necessitated
by inadequate maintenance, normal wear and usage, unsuitable power sources or environmental conditions, accident, misuse,
improper installation, modification, repair, use of unauthorized replacement parts, storage or handling, or any other cause not the
fault of Daniel are not covered by this limited warranty, and shall be at Buyer's expense. Daniel shall not be obligated to pay any
costs or charges incurred by Buyer or any other party except as may be agreed upon in writing in advance by Daniel. All costs of
dismantling, reinstallation and freight and the time and expenses of Daniel's personnel and representatives for site travel and
diagnosis under this warranty clause shall be borne by Buyer unless accepted in writing by Daniel. Goods repaired and parts
replaced by Daniel during the warranty period shall be in warranty for the remainder of the original warranty period or ninety (90)
days, whichever is longer. This limited warranty is the only warranty made by Daniel and can be amended only in a writing signed
by Daniel. THE WARRANTIES AND REMEDIES SET FORTH ABOVE ARE EXCLUSIVE. THERE ARE NO REPRESENTATIONS OR
WARRANTIES OF ANY KIND, EXPRESS OR IMPLIED, AS TO MERCHANTABILITY, FITNESS FOR PARTICULAR PURPOSE OR ANY OTHER
MATTER WITH RESPECT TO ANY OF THE GOODS OR SERVICES. Buyer acknowledges and agrees that corrosion or erosion of
materials is not covered by this warranty.
2. LIMITATION OF REMEDY AND LIABILITY: Daniel shall not be liable for damages caused by delay in performance. The remedies of
Buyer set forth in this agreement are exclusive. In no event, regardless of the form of the claim or cause of action (whether based
in contract, infringement, negligence, strict liability, other tort or otherwise), shall Daniel's liability to Buyer and/or its customers
exceed the price to Buyer of the specific goods manufactured or services provided by Daniel giving rise to the claim or cause of
action. Buyer agrees that in no event shall Daniel's liability to Buyer and/or its customers extend to include incidental,
consequential or punitive damages. The term “consequential damages” shall include, but not be limited to, loss of anticipated
profits, revenue or use and costs incurred including without limitation for capital, fuel and power, and claims of Buyer's customers.
8
Page 9

Operations manual Contents
DAN-20057316 January 2019
Contents
Chapter 1 Startup........................................................................................................................ 11
1.1 Checklist.........................................................................................................................................11
Chapter 2 Communications..........................................................................................................13
2.1 Setup meter communications........................................................................................................ 13
Chapter 3 Optional feature keys...................................................................................................21
3.1 General overview of the Optional feature keys................................................................................21
3.2 Configure optional keys..................................................................................................................22
Chapter 4 Measurement.............................................................................................................. 23
4.1 Flow measurement.........................................................................................................................23
4.2 Signal processing............................................................................................................................25
4.3 Acquisition mode........................................................................................................................... 27
4.4 Chord gas and sound velocity measurements.................................................................................28
4.5 Volumetric flow rate values............................................................................................................ 32
4.6 3410 Series gas flow meter characterizations................................................................................. 37
Chapter 5 Configurations............................................................................................................. 39
5.1 Calibrate and configure the meter..................................................................................................39
5.2 Calibrate analog inputs and outputs............................................................................................... 51
5.3 Calibrate meter factors...................................................................................................................54
5.4 Configure frequency outputs..........................................................................................................59
5.5 Configure digital input/outputs......................................................................................................61
5.6 Outputs test mode......................................................................................................................... 62
5.7 Configure temperature and pressure..............................................................................................63
5.8 Configure Gas Chromatograph parameters....................................................................................66
Chapter 6 Directory..................................................................................................................... 83
6.1 Archive logs....................................................................................................................................83
Chapter 7 Commands.................................................................................................................119
7.1 Tools commands..........................................................................................................................119
Appendix A Conversion factors..................................................................................................... 137
A.1 Conversion factors per unit of measurement................................................................................137
Appendix B Miscellaneous equations............................................................................................ 139
B.1 K-Factor and Inverse K-Factor....................................................................................................... 139
B.2 Calculation of Chord "L" dimension............................................................................................... 140
Appendix C Troubleshooting comm., mech., and elec................................................................... 141
C.1 Communications troubleshooting................................................................................................141
C.2 Mechanical/Electrical troubleshooting......................................................................................... 142
Model 3418 GUSM 9
Page 10

Contents Operations manual
January 2019 DAN-20057316
Appendix D Flow Rate charts.........................................................................................................145
D.1 Summary charts for Flow rate...................................................................................................... 145
Appendix E Write-protected configuration...................................................................................149
E.1 Parameters for Write-protected configuration..............................................................................149
Appendix F Engineering drawings................................................................................................ 163
F.1 3410 Series engineering drawings................................................................................................ 163
10 Operations manual
Page 11

Operations manual Startup
DAN-20057316 January 2019
1 Startup
1.1 Checklist
During meter startup, have the following equipment and information on hand:
Mater startup checklist
Site pipe and ID drawings with elevations
Site wiring diagrams
Daniel Gas Ultrasonic Meter calibration data
Daniel Gas Ultrasonic Meter manuals
Information and manuals for all other flow instrumentation - flow computers, pressure
and temperature transmitter data sheets, and wiring
Shutoff and control valve information, specifications, operation and setup data.
Ethernet (Cat 5 cables) or serial cables to link the laptop to the meter
Field service representative's telephone numbers for major components; valves, meter,
flow computer, communication gear, transmitters, site designers or integrators.
Check all ultrasonic meter wiring.
Check the settings of any bit switches on transmitter I/O cards.
Establish flow in the meter (at lease 3 feet per second to ensure good thermal mixing)
Save the meter configuration file - your "As Found" record of the meter. In Daniel
MeterLink™ select Tools > Edit/Compare Configuration.
Click the Read button and select File Save.
Open File > Program Settings and customize Daniel MeterLink™ user preferences.
Open Meter > Monitor and check the measurement paths or chords and that they agree
with each other to approximately 0.2%.
Check for alarms, open Meter > Monitor and click Check Status.
Check for good signal strength (usually shown as "SNR") or, Signal to Noise Ratio.
Check for reasonably correct flow profile
From the Logs/Reports menu, click Maintenance Logs/Reports, collect and save a
Maintenance Log to record the initial performance of your meter (this is your "as Found"
record).
From the Meter > Field Setup Wizard menu. Make any configuration adjustments, such
as setting the frequency output variable and frequency full scale.
Save another Maintenance Log (this is your "As Left" record).
Model 3418 GUSM 11
Page 12

Startup Operations manual
January 2019 DAN-20057316
12 Operations manual
Page 13

Operations manual Communications
DAN-20057316 January 2019
2 Communications
2.1 Setup meter communications
After the installation of your Daniel Ultrasonic Meter, install Daniel MeterLink™ on your PC
or laptop as described in the Daniel MeterLink Software for Gas and Liquid Ultrasonic Flow
Meters Quick Start Manual (P/N 3-9000-763) for your operating system (Windows® 7 or
Windows® 8, Windows® 10), then configure the meter.
The Daniel MeterLink Software for Gas and Liquid Ultrasonic Flow Meters Quick Start Manual
(P/N 3-9000-763) is made available with the meter.
The Daniel MeterLink installation program is available for download from the Daniel
Measurement and Control, Inc. website: https://www.emerson.com/en-us/catalog/daniel-
meterlink.
2.1.1
Daniel MeterLink utilities
Daniel MeterLink™ provides the following utilities to configure the meter's flow
measurement units, meter output parameters, communications settings, output tests
and logs and reports file management.
Field Setup Wizard
• Startup
• General
• Frequency/Digital Output Sources
• Frequency Outputs
• Meter Digital Outputs
• Current Outputs
• Meter Corrections
• Temperature and Pressure
• Gas Chromatograph Setup
• AGA8
• Continuous Flow Analysis
• Local Display
Tools
• Edit/Compare Configuration
• Waveform Viewer
• SOS Calculator
• Outputs Test
• Transduce Swap-Out
Model 3418 GUSM 13
Page 14

Communications Operations manual
January 2019 DAN-20057316
• Program Download
• Communications Analyzer
Log/Reports
• Maintenance logs and reports
• Trend maintenance logs
• Meter archive logs
• Compare Excel® meter configurations
Calibration
• Analog inputs
• Meter Factors
• Flow calibration
Setup the meter directory
Setup the connection properties for your meter. By default, the meter directory contains
only one record named New Meter, that is defaulted to connect to a Daniel Gas Ultrasonic
meter configured as shipped from the factory.
Create a new meter record
Procedure
1. Select Insert, Insert Duplicate, or Add from the File pull-down menu to create a
new record.
2. Setup the record by entering a Meter Name, Short Desc, Meter Type, and select the
connection type(s) checkboxes Direct, Modem, Ethernet.
3. For each connection type selected, a button will be enabled at the bottom of the
dialog with the same name. Click these buttons to edit the connection properties
for that connection method. After choosing the connection properties, click OK
accept the changes or click Cancel to discard any changes and close the dialog.
a) Direct connection - to connect to the meter directly through one of the serial
ports on the meter using one of the serial ports on your computer. Click
Direct to set the following parameters.
• Protocol: TCP/IP is a read-only field and is the only protocol Daniel
MeterLink uses.
Note
Daniel Ultrasonic meters still support Modbus ASCII and Modbus RTU
when talking to other applications or devices.
• Comms Address: Enter the communication address that is configured in
the meter hardware. The default address for meters from the factory is
32. For Daniel Ultrasonic meters the valid range is from 1 to 247.
• Port: Select the available driver from the list of those installed on your
machine.
14 Operations manual
Page 15

Operations manual Communications
DAN-20057316 January 2019
Note
For Windows® 7, you cannot use the Communications cable between two
computers at this time and must use the Daniel Direct Connection driver.
• Baud Rate: Select the serial port baud rate from the drop-down list for
which the meter hardware is configured. The default Baud Rates is 19200.
• Check Box labeled Route IP packets to connection to configure MeterLink
to automatically connect to both Transmitter heads of DualConfiguration meters when data sharing is enabled. This requires
Ethernet connection between the two heads.
b) Modem connection- set the following properties to connect to the meter via
a modem.
• Protocol and Comms Address: Use the Protocol and Comms Address
parameters in Step 3a.
• Modem: Select the modem to use from the drop-down list. Only modems
installed in Windows® show in the drop-down list. If the drop-down list is
blank, then no modems have been installed for Windows®.
Note
Do not select Daniel Direct Connection or Communications cable
between two computers for the modem. This is a NULL modem driver for
direct connection to Daniel Ultrasonic meters only. It will not work for the
Modem connection.
Daniel MeterLink uses the Microsoft® Dial-up Networking for making
modem and direct serial connections to a meter. Click Modem Properties
to bring up the Dial-up networking entry Daniel MeterLink™ has created
for this meter. Most of the information required is setup correctly by
Daniel MeterLink™.
• Baud Rate: Select the desired Baud Rate from the drop-down list.
• Telephone #: Enter the telephone number for the modem to which the
meter is connected. Include digits to obtain to an outside line, if
necessary. Inserting commas between the digits pauses the dialing rate.
Each comma is approximately equal to two seconds.
• Modem Properties: configures the properties associated with the
modem.
Daniel MeterLink uses the Microsoft® Dial-up Networking for making
modem and direct serial connections to a meter. Click Modem Properties
to bring up the Dial-up networking entry Daniel MeterLink has created for
this meter. Most of the information required is setup correctly by Daniel
MeterLink. Click OK to accept the changes or click Cancel to discard any
changes and return to the Meter Directory dialog box.
c) Ethernet connection - Set the following properties to configure the Daniel
ultrasonic meter hardware for Ethernet connectivity.
Model 3418 GUSM 15
Page 16

Communications Operations manual
January 2019 DAN-20057316
NOTICE
It is strongly recommended that the meter be configured using an
independent (off- network) single host computer. After configuration of the
meter, the DHCP option should be disabled.
• IP Address: Enter the IP Address for the meter's Ethernet port.
The factory set IP Address is 172.16.17.200 for Daniel Gas Ultrasonic
meters or you can use 192.168.135.100 if DHCP is enabled in the meter
(see DHCP below for more details).
Dynamic Host Configuration Protocol (DHCP): Business PCs are usually
configured to work in a network environment where a DHCP server
assigns an IP address to each computer when they connect to the
network.
If a PC is configured to obtain an IP address from a DHCP server and it is
going to connect through the Ethernet Cable (1-360-01-596) to a Daniel
meter that is not connected to a network, then the DHCP server in the
meter must be enabled so it can assign an IP address to the PC when it
connects.
The DHCP server can be enabled on the meter by setting the DHCP switch
on the CPU module to the ON position.
When connecting to a meter with DHCP enabled, use the IP address of
192.168.135.100 to connect to the meter. In this mode you can create
just one Meter Directory record with this IP address to connect to all your
meters with DHCP enabled. When the connection is made, select to use
the Meter Name in the meter instead of the Meter Directory Name in
order to keep all log files and configurations separate from each meter.
Click OK to accept the changes or click Cancel to discard any changes and
return to the Meter Directory dialog box.
Ethernet initial connection steps
Procedure
1. Power up the meter.
2. Shutdown the PC.
3. Plug the Ethernet adapter cable Phoenix end into the meter Field Connection Board
connector J8 and connect the RJ-45 end into the PC Ethernet connector.
4. Enable the Ethernet LAN connector DHCP server on the CPU Module by moving the
DHCP (switch-1) to the ON position (see direction arrow on the CPU Module label).
5. Power up (boot) the PC and log in to the initial Windows logon prompt.
6. Verify the Ethernet connection status by the CPU Module “LINK” LED which should
be on solid green.
7. Launch Daniel MeterLink and create a new meter record.
Import a meter record
Procedure
1. Select File > Import from the Meter Directory drop-down menu or click Import.
16 Operations manual
Page 17

Operations manual Communications
DAN-20057316 January 2019
2. The Import Meter Directory File dialog which allows you to select a meter
directory .DAT file to import the file into the currently used meter directory file.
If an identical meter record already exists and a duplicate is trying to be imported,
Daniel MeterLink inserts the duplicate meter record. The Import button performs
the same operation.
Export a meter record
Use the Export command to save the current meter directory to file. Select File > Meter
Directory from the Meter Directory drop-down menu or click Export.
Procedure
1. Enable the meter directory record checkbox you want to export or click Select All.
2. Click OK to begin exporting the meter record(s). Use the Export Meter Directory File
dialog to save the exported record to the default folder (C:\Ultrasonic Data) or enter
another location.
3. Click Save. If you have an existing METER_DIRECTORY_EXPORT.DAT file, you are
prompted to change the file name or replace the file. If changing the file name,
keep the .DAT extension to maintain functionality when importing the file to the
new machine.
4. Copy the exported file to the new machine.
5. Use the Import command to select this file and import it into the Meter directory.
Important
Due to limitations in the Microsoft® Dial-Up Networking, not all of the directory
information for Direct and Modem connection can be exported to the
METER_DIRECTORY.DAT file for Daniel Ultrasonic meters. It will be able to export
the meter names, Comms Address, Interface, and Telephone numbers. It will still be
necessary to recheck the connection properties and verify the communication
parameters such as COM port, data bits, and parity are configured correctly.
Connect to the meter
Procedure
1. From the menu bar, select Meter > Connect or click
toolbar.
2. The Connect to Meter dialog box displays a list of meters setup in Daniel MeterLink.
Click Direct, Modem or Ethernet next to the Meter Name to establish a connection
with your Daniel Ultrasonic meter.
, the Connect icon, on the
Collect “As Found” logs and reports
Use the Daniel MeterLink Logs/Reports menu and collect and save the logs and reports for
a historical record of the meter at several velocities within the operating range of the
meter. This will establish a baseline to be used for the trending of the meter diagnostics.
Save the following logs and reports for the "As Found" settings (factory default).
• Maintenance log
Model 3418 GUSM 17
Page 18
Communications Operations manual
January 2019 DAN-20057316
• System log
• Save your meter's configuration file
• Use the Tools > Edit/Compare Configuration menu to display the dialog. Enable the
View All or Metrology radio button and click Read.
The All View displays the meter's extended configuration parameters. Grayed out
values are read-only, but help describe the configuration. The Metrology View displays
the path dimensions, pipe diameter, transducer delay parameters, zero flow calibration
coefficients, and flow calibration coefficients.
Click the question mark icon, , for the data point to display additional information.
• Click Save to save the configuration file. By default, the file is saved to the Data Folder
setup in File > Program Settings.
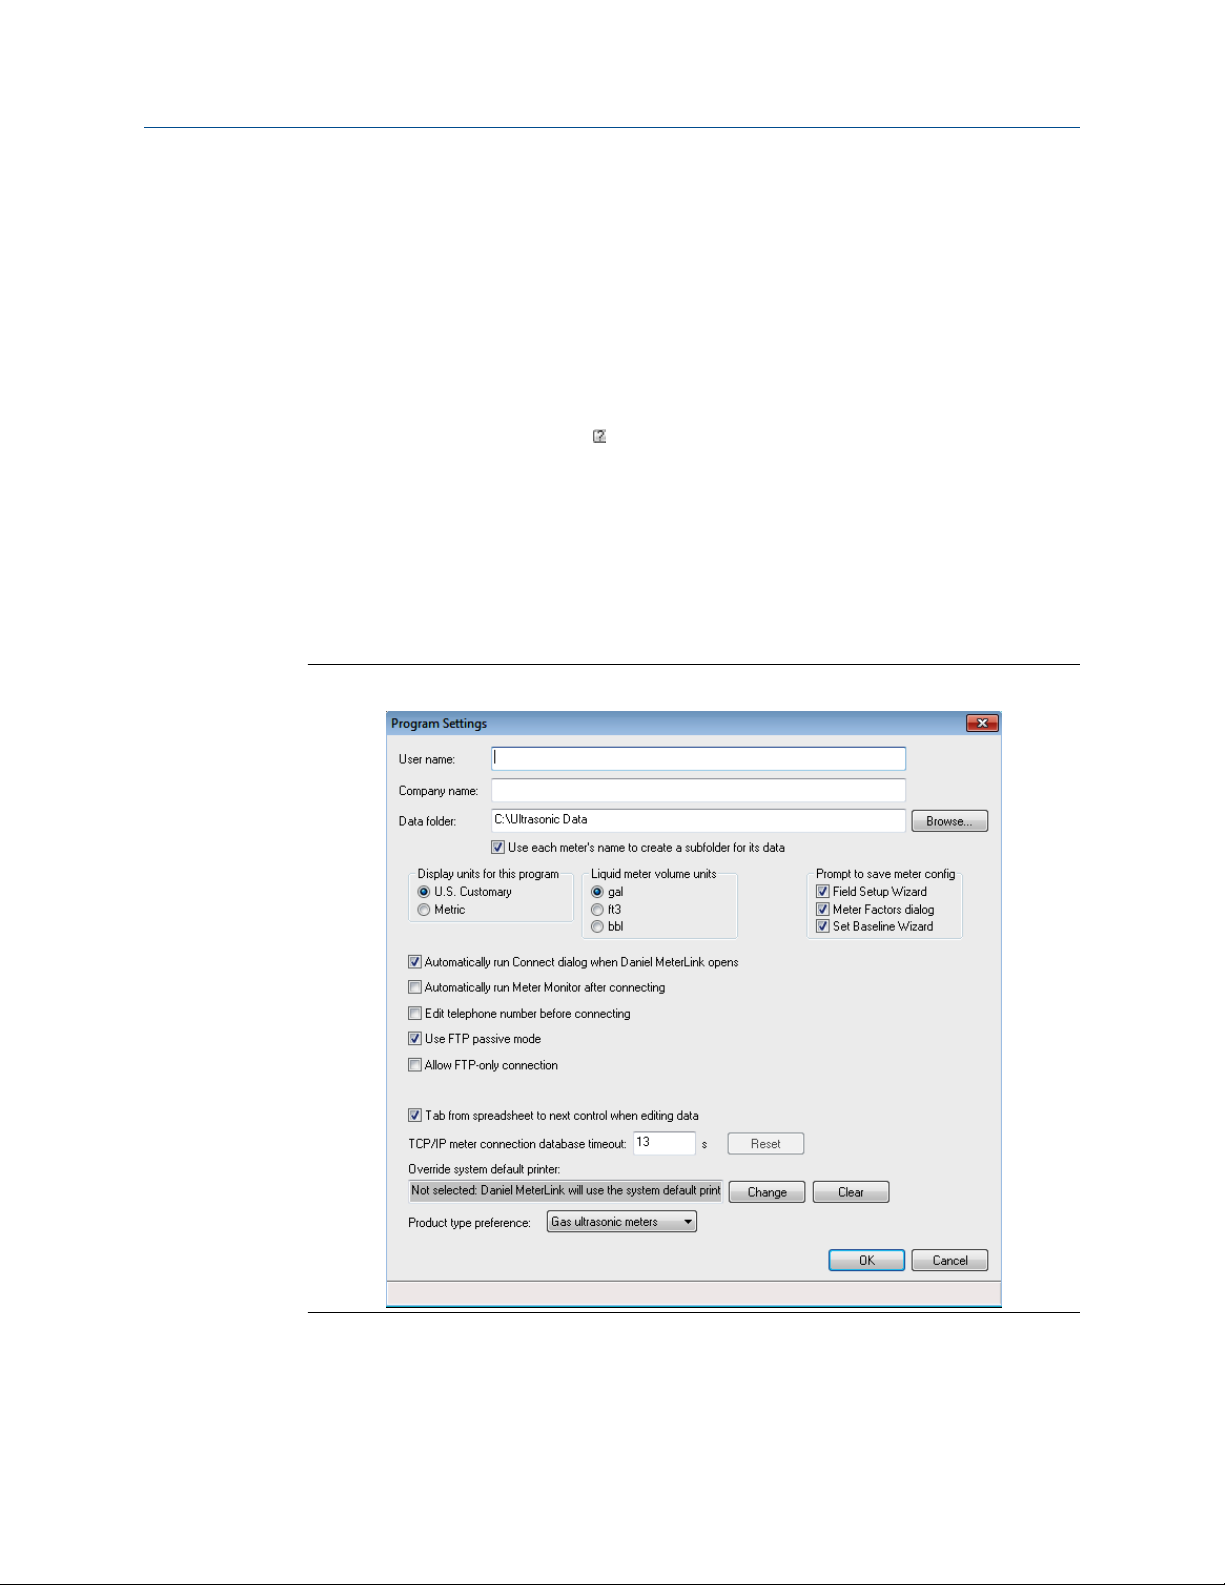
Customize Daniel MeterLink settings
Open Daniel MeterLink and access File > Program Settings, then input the desired settings
for your meter. Your user name and company name is included on reports and logs
generated with Daniel MeterLink.
Figure 2-1: Program Settings
• User name
• Company name
• Data folder (where meter's data is stored)
18 Operations manual
Page 19

Operations manual Communications
DAN-20057316 January 2019
• Select the checkbox to create a subfolder with the meter's name under Data folder for
saving and opening files for your meter
• Display units (of measurement); U.S. Customary or Metric for necessary unit
conversions read by the meter
• Meter volume units; gal, cubic feet, or bbl
• Prompt to save meter config (configuration) prompts you to save a copy of the meter
configuration after writing changes to the meter
• Run Connect dialog automatically after connecting
• Run Meter Monitor automatically after connecting
• Run Meter Monitor summary or detailed view after connecting
• Edit telephone number before connecting with a modem
• Use FTP passive mode (client - server pot communications)
• FTP-only connection - used to download firmware to Daniel Ultrasonic meters
• Tab from spreadsheet to next control instead of next cell
2.1.2
• TCP/IP meter connection database timeout - amount of time Daniel MeterLink waits to
respond to a request for data from the meter database (default 13 seconds)
• Override system default printer - used to change printer
• Product type preference - meter type you will most often connect, gas or liquid.
Setup Modbus communications
Daniel 3410 Gas Ultrasonic Flow Meters support RS-232 or RS-485 4-wire or 2-wire half
duplex serial interface to an external system (e.g., flow computer) using Modbus ACSII
protocol with the following parameters:
Setting
Baud rate 19200
Data bits 7
Stop bits 1
Parity even
Protocol Modbus ACSII
Refer to your flow computer user manual to set I/O settings required to allow serial
communication with the Daniel 3410 Gas Ultrasonic Flow Meters.
The Daniel 3410 Gas Ultrasonic Flow Meters supports ASCII and RTU Modbus
communication. For ASCII Modbus, both 7E1 and 7O1 are supported. For RTU Modbus,
8N1 is supported. The communication ports provide automatic protocol detection - only
the baud rate and Modbus ID need to be specified. Also, refer to the Daniel website and
select the Product page for the model of your meter:
Value
https://www.emerson.com/en-us/automation/daniel
Model 3418 GUSM 19
Page 20

Communications Operations manual
January 2019 DAN-20057316
20 Operations manual
Page 21

Operations manual Optional feature keys
DAN-20057316 January 2019
3 Optional feature keys
3.1 General overview of the Optional feature keys
Daniel 3410 Series Gas Ultrasonic Flow Meters offer many industry-leading features
including Chapter 21-compliant data log access, gas chromatograph (GC) interface,
AGA10 sound velocity calculation (with comparison to measured sound velocity) and
Continuous Flow Analysis diagnostics.
Daniel recognizes that these features are valuable to many, but not all customers. The
optional keys may be purchased with the meter or at a later time and this key enables all
optional features available. All keys are unique to the CPU board's serial number, so a key
entered for one meter will not work in another meter.
The Continuous Flow Analysis optional feature is enabled via a software "key" value that is
specific to the meter's CPU Board. This software feature key consists of 16 characters
divided into four hyphen-separated, 4-character groups (such as 1234-5678-90AB-CDEF).
This dialog is only available while connected to a meter with firmware that contains option
keys to enable.
3.1.1
3.1.2
In Daniel MeterLink, access the Key Manager to view key statuses, add keys or change the
key values.
Obtaining optional keys
If you do not have a valid key to enter to enable a feature, you must have the CPU board
serial number available, which displays in the Meter > Key Manager dialog and the Meter
Menu > Meter Information dialog, when you contact Daniel to obtain the key. The keys
can be given verbally over the phone or they can be e-mailed in a Key file for easy entry.
• E-mail: tech.service@emersonprocess.com
• Web: http://www.emerson.com/en-us/support
• Also see, Daniel MeterLinkHelp > Technical_Support
GC interface key
The optional GC interface feature allows the meter to read gas property data (composition
and heating value) from a Daniel gas chromatograph.
The meter can use the gas composition data to:
1. Calculate AGA8 compressibilities for converting volumetric flow rate and volumes
to standard (base) condition
2. Calculate AGA8 density for calculating mass rate and mass totals
3. To optionally calculate the AGA10 sound velocity (see AGA10 key (sound velocity
calculation)). The meter uses the GC-reported gas heating value to calculate the
energy rate and totalized energy rate values. This feature is enabled/disabled via the
GCKey data point.
Model 3418 GUSM 21
Page 22

Optional feature keys Operations manual
January 2019 DAN-20057316
3.1.3 AGA10 key (sound velocity calculation)
The optional AGA10 sound velocity calculation feature allows the meter to calculate the
predicted sound velocity based upon the gas composition and compare this value to the
measured average sound velocity. The gas composition can be either specified via data
points or optionally read live from a GC (see above). This feature is enabled or disabled via
the AGA10Key data point.
3.1.4 Continuous Flow Analysis (CFA) key
The Continuous Flow Analysis key enables all optional features and provides extensive
diagnostics for the meter's operational health.
3.1.5
Key status
The Status column will indicate if the key entered is a Valid key or if the key is disabled.
Leaving the Key field empty or entering 0000-0000-0000-0000 will disable the feature
once Write to Meter is clicked.
3.2 Configure optional keys
Procedure
1. Open Daniel MeterLink and connect to your meter.
2. Use the Meter Menu drop-down list and click Key Manager. Daniel MeterLink
displays the Key Manager dialog.
3. Enter the key you obtained in the appropriate field in the Key Manager dialog.
The field turns yellow indicating a change was made and the status will be updated.
When at least one change is made and none of the keys are Invalid, the Write to
Meter button is enabled so the changes can be written to the meter.
The Status column indicates if the key you entered is a Valid key.
4. Click Write to Meter to write the keys to the meter. After the keys are written
successfully, the Key Manager dialog closes.
If for any reason, one or more keys were not written successfully, before the Key
Manager closes, a message displays stating which keys could not be written to the
meter. This could occur if communications to the meter is lost between entering
the Key Manager dialog and clicking Write to Meter.
5. If desired, on the Field Setup Wizard-Startup page, enable the View Gas
Chromatograph setup and View Continuous Flow Analysis setup checkboxes to
display these pages later in the Field Setup Wizard. The Gas Chromatograph Setup
page provides the serial port configuration option to collect live gas compositions.
The Continuous Flow Analysis Setup page allows you to configure the SOS
comparison, liquid detection, abnormal profile detection, blockage detection, and
internal bore buildup detection features.
22 Operations manual
Page 23

Operations manual Measurement
DAN-20057316 January 2019
4 Measurement
4.1 Flow measurement
Daniel 3410 Gas Ultrasonic Flow Meters measure the transit times of ultrasonic pulses
passing through the medium on two parallel planes. The measurement paths (also
referred to as "chords") are angled to the pipe axis, and each chord has two transducers
acting alternately as transmitter and receiver as shown in Direct path transit-time
measurement principle. This permits the transit times to be measured both with and
against the flow (upstream and downstream).
The transducers are mounted on the meter body at accurately known locations for each
pipe size so the distance L between opposing transducers and the angle are precisely
defined for the measurement path.
The 3418 combines the power of two interlocked 4-path British Gas design meters in one
flowmeter body. The second set of chords is the mirror image of the first, which allows the
meter to cancel out the effects of swirl and cross flow.
4.1.1
Figure 4-1: Direct path transit-time measurement principle
Transducer timing control
The following terms are used in explaining the effects of transducer timing control, the
performance of batch data collection and calculation updates in Daniel 3410 Gas
Ultrasonic Flow Meters.
Model 3418 GUSM 23
Page 24

Measurement Operations manual
January 2019 DAN-20057316
Figure 4-2: Signal Analyzer - update rate, stack size, filter and emission rate
Terminology
• Sequence - a complete cycle of firing all enabled transducers in a single round of
transducer operation.
• Stacking - the process of modifying a sequence so that each individual transducer is
fired "x" times (where x equals the stack size) before the next transducer in the
sequence is fired.
• Stack size - the multiple of times each transducer is fired before the next transducer
within the sequence is fired. (When stacking is absent or disabled, the stack size is
actually 1, because each enabled transducer is fired once during the sequence. When
stacking is applied or enabled, it is applied increments of 2, 4, 8, and 16 and are the
only stack size choices, so that each enabled transducer is fired 2, 4, 8, or 16 times
before the next transducer in the sequence is fired.)
• Emission rate - the time elapsed before the next transducer in a sequence is fired,
regardless of stack size (minimum emission rate is 2 milliseconds with the Filter ON or
OFF). We recommend the default Filter setting, which is the OFF position.
• Stack emission rate - the time elapsed before a single transducer is re-fired when
stacking is enabled (minimum stack emission rate is 2 milliseconds with the Filter OFF).
• Chords inactive or active - the exclusion or inclusion of a chord-forming pair of
transducers in the sequence of transducer operation.
• Update time - the time elapsed, in seconds, between each processing, or recalculation
of data that is collected from sequences of transducer firings.
• Batch period, or batch cycle - synonymous with Update time, as defined above.
24 Operations manual
Page 25

Operations manual Measurement
DAN-20057316 January 2019
• Sample - refers to one point on the waveform as in samples per cycle. The data that is
collected from one Sequence of transducer operation. (This term is displayed in the
Daniel MeterLink™ Signal Analyzer screen, and is nearly synonymous with Sequence, as
defined above. That is, Samples/update, as displayed in the Daniel MeterLink™ Signal
Analyzer Wizard, could be interpreted as Sequences/update.) This shows the average
number of new samples collected during an update period.
4.2 Signal processing
The signal at the receiving transducer is amplified, digitized and processed digitally to
provide accurate transit time measurement.
A measure of the signal "quality" is the signal-to-noise ratio (SNR). The higher the SNR, the
better the signal. In general there are two types of noise: "white" noise and "colored" noise.
White noise is noise that occurs across the frequency spectrum and is asynchronous to the
transmitted signal. Colored noise is concentrated around a particular frequency and can
be synchronous with the transmitted signal. The meter provides two methods for
improving the received signal waveform SNR by reducing the noise energy: Stacking and
Filtering.
4.2.1
4.2.2
Stacking
Stacking is a method of firing a transducer multiple times and averaging the received
signals on a point-by-point basis.
Stacking is effective on asynchronous noise such as is typically seen with valve noise. This
method is not useful for removing synchronous noise and should not be used when there
is a great deal of signal "jitter." Meters are configured by default with a stack size of 1 (no
stacking).
Care should be taken when turning on stacking and it is recommended to consult with
Daniel Customer Service if you are unsure of how stacking a signal can affect the meter's
operation. Refer to Technical Support under the Help menu of Daniel MeterLink for
contact information.
The number of consecutive times to fire each transducer is specified via the StackSize data
point. Available stack sizes are 1 (None), 2, 4, 8, and 16. A stack size of 1 selects no
stacking (i.e., stacking disabled). Stacking is only available when the standard update rate
is selected (see Batch update period).
Filtering
Filtering applies a bandpass filter that removes noise that is above and below the
transducer frequency.
Filtering is effective on noise outside of the frequency passband of the filter (e.g., filtering
works on any noise outside of the passband of the filter).
Filtering is enabled/disabled via the Filter data point (TRUE=enable filtering, FALSE=disable
filtering). Meters are configured by default with filtering disabled. The minimum emission
rate for the gas meter is 2 milliseconds with the filter ON or OFF. We recommend the
default Filter setting, which is the OFF position.
Model 3418 GUSM 25
Page 26

Measurement Operations manual
January 2019 DAN-20057316
Care should be taken when enabling/disabling filtering and it is recommended to consult
with Flow Lifecycle Services for Daniel products if you are unsure of how this change can
affect the meter's operation. Refer to Technical Support under the Help menu of Daniel
MeterLink™ for contact information.
4.2.3 Batch cycle processing
Batch update period
Calculation updates performed by the meter, for deriving volume and velocity, are based
on batches of data samples collected from sequences of transducer firings. The batch
update period is dependent upon the user specified batch update period
(SpecBatchUpdtPeriod)and the stack size (StackSize) as shown in Table 4-1. The Standard
batch update period is the default. The actual batch update period is readable via the
BatchUpdatePeriod data point.
Table 4-1: Actual meter update period
Stack size
1 (None) 2 4 8 16
SpecBatchUpdtPeriod Rapid
(250 ms)
Standard
(1000 ms)
Emission rates
The emission rate is the period between firing two different transducers. The stacked
emission rate is the period between consecutive firings of a single transducer when
stacking is used (i.e., the stack size is not set to None).
The actual emission rates used (readable via the EmRateActual and StackEmRateActual
data points) are functions of the desired emission rates, meter type, firing sequence, stack
size, and pipe diameter.
The user specifies the desired emission rates via the EmRateDesired and
StackEmRateDesired data points. If a desired emission rate is set to zero, the meter uses
the fastest possible emission rate which can be as short as is 2 milliseconds. Otherwise, the
meter uses the fastest possible emission rate that is not less than the desired value. We
recommend setting the Filter to the OFF position.
The Signal Analyzer (Meter > Signal Analyzer) is used to configure the EmRateDesired and
StackEm-RateDesired. These values are set to zero to achieve the most transducer firings
per batch update.
0.25 sec N/A N/A N/A N/A
1 sec 1 sec 1.5 sec 3 sec 5 sec
4.2.4
26 Operations manual
Smoothing
The Daniel 3410 Series Gas Ultrasonic Flow Meter applies a method for smoothing the
output (particularly the frequency output) by averaging times collected from past batch
periods with new times for the current batch period.
Page 27

Operations manual Measurement
DAN-20057316 January 2019
Smoothing can be applied in the following increments: 0 (i.e., smoothing is disabled), 20,
40, 60, or 80%.
For example, setting Smoothing to 20% means that of the samples used for the current
update, 20% will be from previously collected samples and 80% will be from the newly
collected samples. Thus, if eight new samples are collected, then those eight samples
along with the last two previous samples would be used together for the current update
period calculations.
Meters are configured by default for Smoothing of 0% (only new samples are used for the
Current Update period).
4.3 Acquisition mode
Daniel 3410 Gas Ultrasonic Flow Meters have two modes of normal operation: Acquisition
and Measurement. The Acquisition mode is used to acquire the ultrasonic signals. This
mode is entered when power is applied to the meter.
Once the ultrasonic signals are acquired, the Measurement mode is entered and the flow
velocity is measured. The meter remains in the Measurement mode as long as at least one
chord is operational.
4.3.1
If while in the Measurement mode all chords fail, then the meter re-enters the Acquisition
mode. If the VelHold data point is set to a value greater than zero, then, while in the
Acquisition mode, the meter holds the average weighted flow velocity to the last good
value for up to the VelHold number of batches before setting the velocity to zero. The
VelHold default value is 0.
The Acquisition mode uses the chords' "L" dimensions (LA…LH as appropriate to the meter
type) and the specified minimum and maximum sound velocities (SSMin and SSMax)
determines the signal search range. MinHoldTime and MaxHoldTime are also used to
determine the signal search range. The meter uses the more restrictive of SSMin/
MaxHoldTime and SSMax/MinHold time.
Re-acquisition
When fewer than MinChord (default 1) chords are good, then the meter re-enters the
Acquisition mode. If MinChord is set to the number of active chords, the meter will
reacquire on the first time a chord is failed for a batch.
Note that failed for a batch is different from hard failed. A chord fails for a batch when PctGood[A1..H2] is less than MinPctGood.
Hard fails occur after AlarmDef number of batches in a row.
If the VelHold data point is set to a value greater than zero, then, while in the Acquisition
mode, the meter holds the average weighted flow velocity to the last good value for up to
the VelHold number of batches before setting the velocity to zero. The VelHold default
value is 0.0.
Model 3418 GUSM 27
Page 28

Measurement Operations manual
January 2019 DAN-20057316
4.4 Chord gas and sound velocity measurements
At each batch update period, each firing path's transit time measurements are averaged.
The average (mean) value for each path is available via data points MeanTmA1...
MeanTmH2 (as appropriate for the meter type).
NOTICE
The data point names often use a "short-hand" way of identifying the receiving transducer.
The last two characters identify the chord (A...H) and the transducer (1=upstream,
2=downstream). For example, MeanTmA1 is the mean transit time for the chord A
upstream transducer.
The difference between a chord's average upstream transit time and average downstream
transit time is the average delta time. The chord's average times and the chord "X" and "L"
dimensions are used to calculate the gas velocity and sound velocity measured by the
chord as shown in Equation 4-1 and Equation 4-2.
Equation 4-1: Chord Gas Velocity
2
V
chord
L
=
2X
chord
chord
t1‐t
t1t
2
2
and
Equation 4-2: Chord Sound Velocity
C
chord,classic
C
=C
chord
L
=
chord,classic
t1+t
chord
2
t1t
2
2
×PortAngleFactor
where the PortAngleFactor is a dimensionless factor that is dependent upon the chord port
angle
with respect to the meter body:
For 60 degree port angles,
PortAngleFactor= 1+ 0.5•
2
V
chord
2
C
chord,classic
•
2
X
chord
2
L
chord
•tan260°
For 75 degree port angles,
PortAngleFactor= 1+ 0.5•
2
V
chord
2
C
chord,classic
•
2
X
chord
2
L
chord
•tan275°
For all other port angles,
PortAngleFactor=1
where
V
= chord average gas velocity (m/s) (FlowVelA ... FlowVelH)
chord
C
= chord average sound velocity (m/s) (SndVelA ... SndVelH)
chord
28 Operations manual
Page 29

Operations manual Measurement
DAN-20057316 January 2019
L
= chord "L" dimension (m) (LA ... LH)
chord
X
= chord "X" dimension (m) (XA ... XH))
chord
t1 = chord average transit time in the upstream direction (s) (MeanTmA1 ...
MeanTmH1)
t2 = chord average transit time in the downstream direction (s) (MeanTmA2 ...
MeanTmH2)
Important
Note that a positive chord gas velocity indicates flow in the forward direction whereas a
negative chord gas velocity indicates flow in the reverse direction.
4.4.1 Average sound velocity
The Average Sound Velocity is calculated as the average of the active chord sound velocity
measurements as shown in the equation below:
Equation 4-3: Average sound velocity
c
Avg
∑
ActiveCℎords
=
NumActiveCℎords
• C
cℎord
4.4.2
where
C
= average sound velocity (m/s) (AvgSndVel)
Avg
C
= chord average sound velocity (m/s) (SndVelA... SndVelH)
chord
NumActiveChords = number of active chords
Optional AGA10 sound velocity calculation and comparison
The Daniel 3410 Series Gas Ultrasonic Flow Meter offers an option to calculate the sound
velocity (using AGA10 equations and gas property data) and compare the result to the
meter- measured sound velocity on an hourly basis.
This feature is enabled via the AGA10 Key (see AGA10 key (sound velocity calculation)).
The gas property data required for using this feature can be specified via data points or
optionally read from a Daniel GC (Configure Gas Chromatograph parameters). The AGA8
Detailed Method must be selected (via the HCH_Method data point, Configure Gas
Chromatograph parameters) in order for the AGA10 calculations to be performed (as the
AGA10 calculations require AGA8 Detailed method calculation intermediate results).
Every five seconds the meter updates the AGA10-calculated sound velocity. This value is
readable via the AGA10SndVel data point and the calculation status value is readable via
the AGA10SndVelStatus data point. The status values are as listed in the table below:
Table 4-2: AGA10 calculation status
AGA10SndVelStatus value Description
0 Calculation OK (no errors)
1 Calculation not performed as the feature is not enabled (see
Configure optional keys). AGA10SnVel is set to zero.
Model 3418 GUSM 29
Page 30

Measurement Operations manual
January 2019 DAN-20057316
Table 4-2: AGA10 calculation status (continued)
AGA10SndVelStatus value Description
2 Calculation not performed as the selected AGA8 method is not
the Detailed method (HCH_Method not set to Detailed Method
(3)). AGA10SnVel is set to zero.
3 Calculation not performed due to invalid AGA8 calculation
results. AGA10SndVel is set to zero.
4 Calculation error due to division by zero. AGA10SndVel is set to
zero.
Over the course of an hour (starting from the top of the hour), the meter calculates the
average measured sound velocity (the average of the average weighted sound velocity)
and the average AGA10-calculated sound velocity. At the end of the hour, the two
averages are compared; the comparison error (%) is readable via the SndVelCompErr data
point.
Note that the comparison error is only calculated at the end of the hour if during the hour
all of the following are true:
4.4.3
• No AGA10 sound velocity calculation errors occurred (i.e., AGA10SndVelStatus always
equal to 0),
• the measured flow velocity was always above the minimum sound-speed-check flow
velocity (specified via the SndSpdChkMinVel data point which has a default value of 1
m/ s), and
• the measured sound velocity was always valid (as indicated by the QMeterValidity data
point).
Average weighted gas flow velocity
When all active chords are non-failed, the average weighted gas flow velocity is a weighted
sum of the chord velocity measurements as shown in Equation 4-4 where the chord
weights are determined by the meter geometry.
Equation 4-4: Average weighted gas flow velocity
where
V
Wtd
V
V
AvgWtd
= average weighted gas flow velocity (m/s) (AvgWtdFlowVel)
AvgWtd
= chord weight (dimensionless) (WtA ... WtH)
chord
= chord average gas velocity (m/s) (FlowVelA ... FlowVelH)
chord
= ∑
ActiveCℎordsWtcℎordVcℎord
4.4.4
30 Operations manual
Average weighted flow velocity using chord proportions
In the event of one or more chord failure(s), the meter operation is dependent upon the
number of non-failed chords. If there is at least one operating chord, then the meter uses a
velocity estimation method described in the following paragraphs.
Page 31

Operations manual Measurement
DAN-20057316 January 2019
If all chords fail, then the meter re-enters the Acquisition mode as described in the Re-
acquisition section.
The meter partitions the velocity range (for forward and reverse flow) into ten
consecutive, non- overlapping "bins" (where the velocity range is as specified via the
MeterMaxVel data point).
The meter maintains a set of bins for each active chord where each bin contain three data
values: (1) the chord's average velocity (within the bin's velocity range), (2) the chord's
average proportion value, and (3) an indicator that the value is still the default (Is[Fwd/
Rev]Prop[A..H]DfltBin[1..10]). A chord proportion value is the ratio of the chord velocity
to the average weighted flow velocity as shown in Equation 4-5 below. The default
indicator is used to determine if a bin's velocity and proportion data values have been
updated from their initialized values. The bins are initialized with the average velocity over
the bin's range and meter-geometry-dependent proportion values. All default indicators
are initialized to TRUE. The bin data is stored in non-volatile memory.
Equation 4-5: Chord proportion calculation
V
Prop
cℎord
−
cℎord
V
AvgWtd
where
Prop
V
chord
V
AvgWtd
= chord proportion (dimensionless)
chord
= chord velocity (m/s) (FlowVelA ... FlowVelH)
= average weighted gas flow velocity (m/s) (AvgWtdFlowVel)
When the meter has operated for a user-specified number of consecutive batches without
any chord failures, the meter updates each chord's data values for the bin containing the
chord velocity as shown in Equation 4-6 and sets the bin's default indicator to FALSE. The
PropUpdtBatches data point, configurable via the Daniel MeterLink Edit/Compare
Configuration screen, specifies the number of consecutive failure-free batches required
for updating the bin data (range: [1, 1000], default: 24). The NumVals data point (that
determines how quickly an average value changes) is also configurable via the Edit/
Compare Configuration screen (range: [1, 1000], default: 10).
Equation 4-6: Updating chord proportion bin data values
AvgVel
AvgProp
CℎordBin
CℎordBin
n + 1
n + 1
−
AvgVel
−
CℎordBin
AvgProp
CℎordBin
NumVals − 1 + V
⋅
n
NumVals
NumVals − 1 + Prop
⋅
n
NumVals
cℎord
cℎord
where
AvgVel
AvgVel
ChordBin
ChordBin
= chord bin (n+1)st average velocity (m/s)
n+1
= chord bin nth average velocity (m/s)
n
NumVals = update factor data point (dimensionless) (NumVals)
V
= chord velocity (m/s) (FlowVelA ... FlowVelH)
chord
AvgProp
AvgVel
Prop
chord
ChordBin
ChordBin
= chord proportion (dimensionless)
= chord bin (n+1)st average proportion value (dimensionless)
n+1
= chord bin nth average proportion value (dimensionless)
n
Model 3418 GUSM 31
Page 32

Measurement Operations manual
January 2019 DAN-20057316
In the event of a chord failure with at least one operating chord, the meter's average
weighted flow velocity is estimated as shown in Equation 4-7.
Equation 4-7: Estimating average flow velocity using proportion values
V
cℎord
∑
V
AvgWtd
Non − Failedcℎord(s)
−
InterProp
est
∑
Non − Failedcℎord(s)
cℎord
where
V
AvgWtd
V
Chord
InterProp
= estimated average weighted flow velocity (m/s) (AvgWtdFlowVel)
est
= (non-failed) chord velocity (m/s) (FlowVelA ... FlowVelH)
= (non-failed) chord interpolated proportion value (dimensionless)
chord
For each non-failed chord, the interpolated proportion value used in Equation 4-7 is
calculated as follows:
• If the chord's velocity is surrounded by non-default (average velocity, average
proportion) data pairs, then the interpolated proportion is the linear interpolation
between the two data pairs.
• If the chord's velocity has a non-default (average velocity, average proportion) data
pair on one side of it but not the other, then the interpolated proportion is the data pair
average proportion.
• If there are only default (average velocity, average proportion) data pairs, then the
interpolated proportion is the corresponding bin's default average proportion value.
4.5 Volumetric flow rate values
The Daniel 3410 Series Gas Ultrasonic Flow Meter meter provides three volumetric flow
rate values: raw, (expansion-corrected and/or profile-effect corrected) flow-condition, and
base- condition. Note that a positive volumetric flow rate indicates flow in the forward
direction whereas a negative volumetric flow rate indicates flow in the reverse direction.
4.5.1
Raw volumetric flow rate
The "raw" volumetric flow rate is calculated from the average gas flow velocity (wetcalibration gas flow velocity) as shown in Raw volumetric flow rate.
Equation 4-8: Raw volumetric flow rate
2
Q
Raw
= V
WetCal
πD
⋅
⋅ 3600 s/ℎ
4
where
Q
= “raw” volumetric flow rate (m3/h) (QMeter)
Raw
V
= wet-calibration gas flow velocity (m/s) (AvgFlow)
WetCal
π = geometric constant, pi (dimensionless) (3.14159...)
D = pipe inside diameter (m) (PipeDiam)
32 Operations manual
Page 33

Operations manual Measurement
DAN-20057316 January 2019
4.5.2 Flow-condition volumetric flow rate
The flow-condition volumetric flow rate is the result of applying expansion correction and
flow- profile correction to the raw volumetric flow rate as shown in Flow-condition
volumetric flow rate subject to the low- flow cut-off. If the resulting value is below the low-
flow cut-off value, it is set to zero. The low-flow cut-off volumetric flow rate (CutRate) is
the specified low-flow velocity threshold (ZeroCut) converted to a volumetric flow rate.
Q
= Q
Flow
where
Q
= flow-condition volumetric flow rate (m3/h) (QFlow)
Flow
Q
= “raw” volumetric flow rate (m3/h) (QMeter)
Raw
ExpCorrP = expansion correction factor due to pressure (dimensionless)
(ExpCorrPressure) calculated as shown in Equation 4-9.
ExpCorrT = expansion correction factor due to temperature (dimensionless)
(ExpCorrTemperature) calculated as shown in Equation 4-11.
ExpCorrPExCorr
Raw
T
4.5.3
Pressure-effect expansion correction
The meter is capable of correcting the raw volumetric flow rate for the effect of pipe
expansion due to pressure changes.
Note that for the pressure-effect expansion correction factor to be calculated, the
correction must be enabled (via the EnableExpCorrPress data point) and the flowcondition pressure must be available (i.e., the EnablePressureInput data point must be set
to 'Live'(1) or 'Fixed'(2), see Configure the pressure parameters for the meter. The
pressure-effect calculation is shown in Equation 4-9. If the pressure-effect expansion
correction factor is not calculated, it is set to 1.0.
Equation 4-9: Pressure-effect expansion correction
ExpCorrP= 1 + 3 × β × P
ExpCorrP = expansion correction factor due to pressure (dimensionless)
(ExpCorrPressure)
ß = pipe linear expansion coefficient due to temperature (MPaas-1)
(StrainPerUnitStress) calculated as shown in Equation 4-8.
P
= flow-condition absolute pressure (MPaa) (AbsFlowPressure) calculated as
abs,f
shown in Equation 4-12
P
= reference absolute pressure (MPaa) (0.101325MPaa) reference temperature for
ref
the pipe linear expansion coefficient (K)
abs, f
− P
ref
Equation 4-10: Pressure-effect strain per unit stress
β=
2
D
out
1+υ + D
E× D
2
out
‐D
2
in
2
in
1‐2υ
β = pipe strain per unit stress (MPaa-1) (StrainPerUnitStress)
Model 3418 GUSM 33
Page 34

Measurement Operations manual
January 2019 DAN-20057316
D
= outside diameter of the meter or pipe (m) (PipeOutsideDiameter)
out
Din = inside diameter of the meter or pipe (m) (PipeDiam)
ʋ = Poisson’s Ratio (dimensionless) (PoissonsRatio)
E = Young’s Modulus of elasticity (MPaa) (YoungsModulus)
4.5.4 Temperature-effect expansion correction
The meter is capable of correcting the raw volumetric flow rate for the effect of pipe
expansion due to temperature changes.
Note that for the temperature-effect expansion correction factor to be calculated, the
correction must be enabled (via the EnableExpCorrTemp data point) and the flowcondition temperature must be available (i.e., the EnableTemperatureInput data point
must be set to 'Live'(1) or 'Fixed'(2), see Temperature expansion correction). The
temperature-effect calculation is shown in Temperature-effect expansion correction. If the
temperature-effect expansion correction factor is not calculated, it is set to 1.0.
Equation 4-11: Temperature-effect expansion correction
4.5.5
ExpCorrT= 1 + 3 × α × Tf− T
ref
ExpCorrT = expansion correction factor due to temperature (dimensionless)
(ExpCorrTemperature)
α = pipe linear expansion coefficient due to temperature (K-1) (LinearExpansionCoef)
Tf = flow-condition temperature (K) (FlowTemperature)
T
= reference temperature for the pipe linear expansion coefficient (K)
ref
(RefTempLinearExpCoef)
Base-condition volumetric flow rate
The base-condition volumetric flow rate is the result converting the flow-condition
volumetric flow rate to the base pressure-temperature condition.
This conversion requires (1) AGA8 calculations to be either performed internally (i.e., by
the meter) or externally (with the resulting compressibilities specified to the meter via the
SpecZFlow and SpecZBase data points), and (2) the flow-condition temperature and
pressure to be live or fixed. If AGA8 calculations are not performed (i.e., neither internally
nor externally) or the flow-condition temperature and/or pressure are/is not enabled, then
the base-condition volumetric flow rate is set to zero. The base-condition volumetric flow
rate is calculated as shown in Equation 4-12.
Equation 4-12: Base-condition volumetric flow rate
Q
Base
= Q
Flow
P
abs, f
P
abs, b
T
Z
b
b
T
Z
f
f
where
Q
= “raw” volumetric flow rate (m3/h) (QMeter)
Base
Q
= flow-condition volumetric flow rate (m3/h) (QFlow)
Flow
34 Operations manual
Page 35

Operations manual Measurement
DAN-20057316 January 2019
P
= flow-condition absolute pressure (MPaa) (AbsFlowPressure) calculated as
abs,b
shown in Equation 4-9.
Tb = base-condition temperature (K) (TBase)
Tf = flow-condition temperature (K) (FlowTemperature)
Zb = base-condition compressibility factor (ZBase)
Zf = flow-condition compressibility factor (ZFlow)
4.5.6 Volume
The Daniel 3410 Series Gas Ultrasonic Flow Meter provides forward and reverse volume
accumulators for each of the three volumetric flow rate values: raw, flow-condition (raw
with expansion and/or profile correction), and base-condition.
Each volume accumulator is actually stored as a data pair: (64-bit unsigned integer
portion, 32-bit floating point fractional portion). For example, a volume of 12345.750 m
is stored as 12345 m3 for the integer portion and 0.750 m3 as the fractional portion. Note
that while a volumetric flow rate can be positive (indicating forward flow) or negative
(indicating reverse flow), the volume accumulators are always positive values.
The non-volatile volume accumulator data points are as listed in the table below:
Table 4-3: Volume accumulation data points
Volumetric
flow rate type
Raw
Flow-condition
Base-condition
Forward Direction Reverse direction
Integer Fraction Integer Fraction
PosVolUncorr PosVolUncorrFrac NegVolUncorr NegVolUncorrFrac
PosVolFlow PosVolFlowFrac NegVolFlow NegVolFlowUncorr
PosVolBase PosVolBaseFrac NegVolBase NegVolBaseUncorr
4.5.7 Energy rate and totals
These calculations require that the flow-condition pressure and temperature are available
(either fixed or optional analog inputs, Flow-condition pressure and temperature, the gas
property data (composition and heating value) are available (either fixed or optionally read
from a GC, Flow-condition pressure and temperature), and the AGA8 calculations are
performed (internally by the meter or externally with the results written to the meter,
Flow-condition pressure and temperature).
3
The energy rate is calculated as shown in Energy rate
Equation 4-13: Energy rate
QE= Q
Base
× HV ×
1MJ
1000kJ
×
1000dm
3
1m
3
where
QE = energy rate (MJ/h) (EnergyRate)
Q
= base-condition volumetric flow rate (m3/h) (QBase)
Base
HV = "in-use" heating value (kJ/dm3) (HeatingValueInUse)
Model 3418 GUSM 35
Page 36

Measurement Operations manual
January 2019 DAN-20057316
The sign of the energy rate indicates the flow direction: a positive value indicates flow in
the forward direction, a negative value indicates flow in the reverse direction.
The energy rate validity is indicated by the EnergyRateValidity data point TRUE(1)
indicates valid). The energy rate is valid if the base-condition volumetric flow rate is valid
(indicated by QBaseValidity where TRUE(1) indicates valid) and if the in-use gas properties
are valid (indicated by AreGasPropertiesInvalidInUse where FALSE(0) indicates valid).
The energy rate is accumulated into the corresponding direction energy total regardless of
the energy rate validity.
The forward and reverse direction energy totals are each stored in non-volatile memory as
a data pair: a 64-bit unsigned integer portion and a 32-bit floating point fractional portion.
For example, an energy total of 12345.750 MJ is stored as 12345 MJ for the integer portion
and 0.750 MJ as the fractional portion. Note that while the energy rate can be positive
(indicating forward flow) or negative (indicating reverse flow), the energy totals are always
positive values.
The non-volatile energy total data points are as listed in the table below:
Forward direction Reverse direction
Integer Fraction Integer Fraction
PosEnergy PosEnergyfrac NegEnergy NegEnergyFrac
4.5.8 Mass rate and totals
The Daniel 3410 Series Gas Ultrasonic Flow Meter meter calculates the mass rate and mass
totals (forward and reverse).
These calculations requires that the flow-condition pressure and temperature are available
(either fixed or optional analog inputs, Gas properties), the gas composition is available
(either fixed or optionally read from a GC, Gas property data), and the AGA8 calculations
are performed (internally by the meter or externally with the results written to the meter,
Configure Gas Chromatograph parameters).
The mass rate is calculated as shown in Mass rate
Equation 4-14: Mass rate
MassRate = mass rate (kg/h) (MassRate)
Q
= flow-condition volumetric flow rate (m3/h) (QFlow)
Flow
ρ
= "in-use" flow-condition gas mass density (kg/m3) (RhoMixFlow)
Flow
The sign of the mass rate indicates the flow direction: a positive value indicates flow in the
forward direction, a negative value indicates flow in the reverse direction.
MassRate = Q
Flow
× ρ
Flow
The mass rate validity is indicated by the MassRateValidity data point (TRUE(1) indicates
valid). The mass rate is valid if the flow-condition volumetric flow rate is valid (indicated by
QFlowValidity where TRUE(1) indicates valid) and if the AGA8 flow-condition calculation is
valid (indicated by AGA8FlowCalcValidity where TRUE(1) indicates valid).
36 Operations manual
Page 37

Operations manual Measurement
DAN-20057316 January 2019
The mass rate is accumulated into the corresponding direction mass total regardless of
the mass rate validity.
The forward and reverse direction mass totals are each stored in non-volatile memory as a
data pair: a 64-bit unsigned integer portion and a 32-bit floating point fractional portion.
For example, a mass total of 12345.750 kg is stored as 12345 kg for the integer portion
and 750 kg as the fractional portion. Note that while the mass rate can be positive
(indicating forward flow) or negative (indicating reverse flow), the mass totals are always
positive values.
The non-volatile mass total data points are as listed in the table below:
Table 4-4: Mass total data points
Forward direction Reverse direction
Integer Fraction Integer Fraction
PosMass PosMassFrac NegMass NegMassFrac
4.6 3410 Series gas flow meter characterizations
Symmetry
For Daniel 3410 Series Gas Ultrasonic Flow Meter SeniorSonic meters only, the following
flow characterizations are calculated/estimated: symmetry, cross-flow, chord turbulence,
profile factor, and swirl angle. Alarm limits are provided for the chord turbulence and swirl
angle values.
Symmetry is a dimensionless measure of the flow symmetry comparing the upper chords
to the lower chords and is readable via the Symmetry data point. Ideally the Symmetry
should be 1.0.
Cross-flow
Cross-flow is a dimensionless measure of the flow symmetry comparing the chords on one
side of the meter to the chords on the other side. It is readable via the CrossFlow data
point. Ideally the Cross-flow should be 1.0.
Chord turbulence
Chord Turbulence is a estimate of the turbulence (percentage) at a chord location. A value
is calculated for each active chord and is readable via the TurbulenceA, TurbulenceB,
TurbulenceC, TurbulenceD, TurbulenceE, TurbulenceF, TurbulenceG, or TurbulenceH
data points. A value of 0% indicates no appreciable turbulence.
Profile Factor
The profile factor is a dimensionless ratio of the inner chord velocities to the outer chord
velocities. It is readable via the ProfileFactor data point. Ideally the Profile Factor should be
1.17 for an 8-path transmitter head.
Swirl angle
The swirl angle is an estimate of the swirl (to the nearest degree) and is readable via the
SwirlAngle data point. It is calculated as a function of the meter body style and Profile
Factor (see above). A value of 0 degrees indicates no appreciable swirl.
Model 3418 GUSM 37
Page 38

Measurement Operations manual
January 2019 DAN-20057316
38 Operations manual
Page 39

Operations manual Configurations
DAN-20057316 January 2019
5 Configurations
5.1 Calibrate and configure the meter
Use Daniel MeterLink™ to calibrate and configure the meter parameters: Analog (current),
Meter Factors, Flow Calibration, Frequency/Digital Output Sources, Frequency and Digital
inputs and outputs, HART output, Meter corrections, Temperature and Pressure, AGA8
calculations, and Local Display parameters.
5.1.1 Calibration methods
The Daniel 3410 Series Gas Ultrasonic Flow meter uses two calibration steps: "dry"
calibration and "wet" calibration.
In this methodology, the "dry-calibration" values are set by Daniel at the factory and are
not expected to be modified; the "wet-calibration" values are expected to be set as the
result of a user flow calibration (if desired). These two calibration methods are explained in
further detail below.
Important
The WRITE PROT. switch on the CPU Module must be disabled (OFF) before writing
calibration factors to the meter.
After the meter is configured, enable the WRITE PROT. switch (ON) to write-protect the
configuration.
Collect a Maintenance Log and configuration file the meter's "As left" configuration
settings.
Gas flow velocity for dry calibration
The dry-calibration gas flow velocity is the result of applying a third-order polynomial
equation to the average weighted gas flow velocity as shown in Dry-calibration gas flow
velocity.
Equation 5-1: Dry-calibration gas flow velocity
V
where
V
= dry-calibration gas flow velocity (m/s) (DryCalVel)
DryCal
V
A0 = dry-calibration 0th order coefficient (m/s) (FwdA0 or RevA0)
A1 = dry-calibration 1st order coefficient (dimensionless) (FwdA1 or RevA1)
A2 = dry-calibration 2nd order coefficient (s/m) (FwdA2 or RevA2)
A3 = dry-calibration 3rd order coefficient (s2/m2) (FwdA3 or RevA3)
= average weighted gas flow velocity (m/s) (AvgWtdFlowVel)
AvgWtd
DryCal
= A0+ A1V
AvgWtd
+ A2V
2
AvgWtd
+ A3V
3
AvgWtd
Model 3418 GUSM 39
Page 40

Configurations Operations manual
January 2019 DAN-20057316
Note
Note that the meter provides two sets of dry calibration coefficients - one set for each flow
direction.
Dry calibration procedure
Prerequisites
NOTICE
Modification of dry calibration parameters is not recommended. The dry calibration
parameters should not be modified unless directed by Daniel personnel.
Procedure
1. Select the Calibration > Meter Factors menu.
Figure 5-1: Calibration - Meter factors page
2. Click the Advanced View button to display the zero flow calibration polynomial
coefficients. Regardless of what flow calibration method is selected, the zero flow
calibration polynomial coefficients will be applied first.
3. Set the flow calibration method to None.
4. Enter the appropriate forward and reverse meter factors and click Write to send the
factors to the meter.
5. Click the Cancel button to cancel any changes and close the dialog box.
The meter provides separate dry calibration coefficients for each flow direction as
listed in the table below.
40 Operations manual
Page 41

Operations manual Configurations
DAN-20057316 January 2019
Table 5-1: Data Points for dry calibration
Daniel MeterLink
Display Name
Forward A0 Data points affected:
Forward A1 Data points affected:
™
Data points, options and guidelines
• FwdA
0 Options:
• Enter a value (m/s or ft/s) within the range [-1,1 m/s].
Guidelines:
• This value should only be modified under direction of Daniel
personnel.
• FwdA
1 Options:
• Enter a value (dimensionless) within the range [0.95, 1.05].
Guidelines:
• This value should only be modified under direction of Daniel
personnel.
Forward A2 Data points affected:
• FwdA
2 Options:
• Enter a value (s/m or s/ft) within the range [-0.1, 0.1].
Guidelines:
• This value should only be modified under direction of Daniel
personnel.
Forward A3 Data points affected:
• FwdA
3 Options:
• Enter a value (s2/m2 or s2/ft2) within the range [-0.1, 0.1 s2/
m2].
Guidelines:
• This value should only be modified under direction of Daniel
personnel.
Reverse A0 Data points affected:
• RevA
0 Options:
• Enter a value (s/m or s/ft) within the range [-1, 1].
Guidelines:
• This value should only be modified under direction of Daniel
personnel.
Model 3418 GUSM 41
Page 42

Configurations Operations manual
January 2019 DAN-20057316
Table 5-1: Data Points for dry calibration (continued)
Daniel MeterLink
Display Name
Reverse A1 Data points affected:
Reverse A2 Data points affected:
™
Data points, options and guidelines
• RevA
1 Options:
• Enter a value (dimensionless) within the range [0.95, 1.05].
Guidelines:
• This value should only be modified under direction of Daniel
personnel.
• RevA
2 Options:
• Enter a value (s/m or s/ft) within the range [-0.1, 0.1].
Guidelines:
• This value should only be modified under direction of Daniel
personnel.
Reverse A3 Data points affected:
• RevA
3 Options:
• Enter a value s2/m2 or s2/ft2) within the range [-0.1, 0.1 s2/
m2].
Guidelines:
• This value should only be modified under direction of Daniel
personnel.
Gas flow velocity for wet calibration
The Daniel 3410 Series Gas Ultrasonic Flow meter offers three selections for wet
calibration: 12-point piece-wise linearization, a third-order polynomial, or none. The wet
calibration method is selected via the CalMethod data point with "None" being the default
value. The wet calibration gas flow velocity is calculated from the dry calibration gas flow
velocity as shown in Wet-calibration gas flow velocity.
Equation 5-2: Wet-calibration gas flow velocity
V
where
= WetCalFunction V
WetCal
DryCal
V
= wet-calibration gas flow velocity (m/s) (AvgFlow)
WetCal
V
= dry-calibration gas flow velocity (m/s) (DrycalVel)
DryCal
WetCalFunction(x) = selected wet-calibration function
42 Operations manual
Page 43

Operations manual Configurations
DAN-20057316 January 2019
Wet calibration procedure using gas flow velocity
Configure the date points listed below from the Daniel MeterLink Calibration > Meter
Factors menu:
Table 5-2: Data Points for wet calibration
Daniel MeterLink
Display Name
Flow calibration method Data points affected:
™
Data points, options and guidelines
• CalMethod
d Options:
• Piece-wise (2)
• Polynomial (1)
• None
(0) Guidelines:
• This value should only be modified under direction of Daniel
personnel.
Procedure
1. Choose a Flow Calibration Method:
• Polynomial
• Piece-wise linear
• None (If set to None then the wet calibration has the same value as the dry
calibration.)
2. Select the Calibration > Meter Factors menu.
Model 3418 GUSM 43
Page 44

Configurations Operations manual
January 2019 DAN-20057316
Figure 5-2: Calibration - Meter Factor: None
Piece-wise linearization for wet calibration
If the 12-point piece-wise linearization (PWL) wet calibration method is selected, then the
dry-calibration gas flow velocity is calculated as shown in Wet calibration - 12-point piecewise linearization.
The inputs to the 12-point piece-wise linearization are the (up to) 12 pairs of volumetric
flow rates and meter factors for each flow direction ([FwdFlwRt1, FwdMtrFctr1], ...,
[FwdFlwRt12, FwdMtrFctr12] for forward flow; [RevFlwRt1, RevMtrFctr1], ...,
[RevFlwRt12, RevMtrFctr12] for reverse flow). Refer to Calibrate meter factors to
configuring these data points using Daniel MeterLink.
NOTICE
The input flow rates should be entered in descending order (highest first) with their
corresponding meter factors. If these are entered in the wrong order, the meter will still
work but the accuracy may be affected. The meter will not accept negative values, so only
positive values should be entered for both forward and reverse flow rates. If fewer than 12
points are to be used, the unused flow rate and meter factor pairs should be set to 0 and 1
respectively.
Equation 5-3: Wet calibration - 12-point piece-wise linearization
LinearMeterFctr
DryCal
where
V
WetCal
= V
44 Operations manual
Page 45

Operations manual Configurations
DAN-20057316 January 2019
V
= wet-calibration gas flow velocity (m/s) (AvgFlow)
WetCal
V
= dry-calibration gas flow velocity (m/s) (DryCalVel)
DryCal
LinearMeterFctr = linear meter factor (dimensionless) (LinearMeterFctr)
Wet calibration procedure using piece-wise linearization
The linear meter factor is determined by the PWL inputs, the flow direction, and the drycalibration gas flow velocity. If set to Piece-wise Linear" then the piece-wise linearization
flow rate and meter factor parameters are used to calculate the meter factor to be applied.
Figure 5-3: Calibration - Meter Factor: Piece-wise linearization
Table 5-3: Data points for Piece-wise linearization calibration
Daniel Meterlink
Display Name
Forward Flow Rate Data points affected
Forward Meter Factor Data points affected
Model 3418 GUSM 45
™
Data points, options and guidelines
• FwdFlwRate1...FwdfltRate
12 Options:
• Enter a value (m3/h or ft3/h) within the range [0.200000 m3/h].
Guidelines:
• The flow rates must be entered from highest to lowest.
• FwdMtrFctr1...FwdMtrFctr1
2 Options:
• Enter a value (dimensionless) within the range [0.95, 1.05].
Page 46

Configurations Operations manual
January 2019 DAN-20057316
Table 5-3: Data points for Piece-wise linearization calibration (continued)
Daniel Meterlink
Display Name
Reverse Flow Rate Data points affected
Reverse Meter Factor Data points affected
™
Data points, options and guidelines
• RevFlwRate1...RevFltRate
12 Options:
• Enter a value (m3/h or ft3/h) within the range [0.200000 m3/h]
Guidelines:
• The flow rates must be entered from highest to lowest.
• RevMtrFctr1...RevMtrFctr1
12 Options:
• Enter a value (dimensionless) within the range [0.95, 1.05]
Procedure
1. Select Piece-wise linear from the Calibration > Meter Factors menu.
2. Click the Add button below the table to add a new calibration point to the bottom
of the table. You can add a maximum of 12 points. The calibration points must be
entered from the highest flow rate to the lowest flow rate.
3. Click Write to apply the calibration parameters to the meter.
Third-order polynomial for wet calibration
When the Polynomial wet calibration method is selected, the meter uses a third-order
polynomial on the dry-calibration velocity Wet calibration - third order polynomial.
Equation 5-4: Wet calibration - third order polynomial
V
WetCal
= C0+ C1V
DryCal +C2VDryCal
2
Where
V
= wet-calibration gas flow velocity (m/s) (AvgFlow)
WetCal
V
= dry-calibration gas flow velocity (m/s) (ADryCalVel)
SryCal
C0 = wet-calibration 0thorder coefficient (m/s) (FwdC0 or RevC0)
C1 = wet-calibration 1storder coefficient (dimensionless) (FwdC1 or RevC1)
C2 = wet-calibration 2ndorder coefficient (s/m) (FwdC2 or RevC2)
C3 = wet-calibration 3rdorder coefficient (s2/m2) (FwdC3 or RevC3)
+ C3V
3
DryCal
Wet calibration procedure using Third-order polynomial
If selecting "Polynomial Coefficients", the "C" calibration coefficients are applied.
46 Operations manual
Page 47

Operations manual Configurations
DAN-20057316 January 2019
Figure 5-4: Calibration - Meter Factor: Polynomial
Three coefficients are specified for each flow direction from the Daniel MeterLink
Calibration > Meter Factors page as shown in the table below:
Table 5-4: Data points for Polynomial wet calibration
Daniel Meterlink
Display Name
Forward C0 Data points affected
Forward C1 Data points affected
Forward C2 Data points affected
Forward C3 Data points affected
™
Data points, options and guidelines
• FwdC
0 Options:
• Enter a value (m/s or ft/s) within the range [-1, 1 m/s].
• FwdC
1 Options:
• Enter a value (dimensionless) within the range [0.95, 1.05].
• FwdC
2 Options:
• Enter a value (s/m or s/ft ) within the range [-0.1, 0.1 s/m].
• FwdC
0 Options:
• Enter a value (m/s or ft/s) within the range (s2/m2 or s2/ft 2) within
the range [-0.1, 0.1 s2/m2].
Model 3418 GUSM 47
Page 48

Configurations Operations manual
January 2019 DAN-20057316
Table 5-4: Data points for Polynomial wet calibration (continued)
Daniel Meterlink
Display Name
Reverse C0 Data points affected
Reverse C1 Data points affected
Reverse C2 Data points affected
™
Data points, options and guidelines
• RevC
0 Options:
• Enter a value (m/s or ft/s) within the range [-1, 1 m/s].
• RevC
1 Options:
• Enter a value (dimensionless) within the range [0.95, 1.05].
• RevC
2 Options:
• Enter a value (m/s or ft/s) within the range [-0.1, 0.1 s/m].
Reverse C3 Data points affected
• RevC
0 Options:
• Enter a value (s2/m2 or s2/ft 2) within the range [-0.1, 0.1 s2/m2].
Procedure
1. Select Polynomial from the Calibration > Meter Factors menu.
2. Add the value for the forward and reverse coefficients.
3. Click Write to apply the parameters to the meter.
No wet calibration
If no wet calibration is selected, then the wet calibration gas flow velocity is equal to the
dry calibration gas flow velocity.
Triggered delta volumes
The "triggered delta volume" feature provides the ability to measure total gas flow volume
(flow- and base-condition) between two successive external event triggers.
To trigger an event, set the DoUpdtTrigDeltaVols data point to TRUE. This causes the
meter to save the current accumulated flow- and base-condition volume values (forward
and reverse). The meter then calculates the difference between these values and the
corresponding values saved from the previous event trigger. Finally the meter writes the
delta volume values to the appropriate data points (TrigDeltaPosVolFlow,
TrigDeltaNegVolFlow, TrigDeltaPosVolBase, and TrigDeltaNegVolBase) and sets the
DoUpdtTrigDeltaVols data point to FALSE to clear the trigger and indicate the calculation
completion.
48 Operations manual
Page 49

Operations manual Configurations
DAN-20057316 January 2019
The triggered delta volume functionality is retained across power cycles as the
accumulated volumes values at the last event trigger are saved in non-volatile memory.
The delta volume data points are stored internally in non-volatile memory as doubleprecision floating point numbers. The delta volume data points can be read via Modbus as
either 32-bit floating point values or as integer values (using the [overflow,lower] LONG
register pair in a manner similar to reading the accumulated volumes).
Suggested user access logic
The following pseudo-code demonstrates the logic to access the triggered delta volume
functionality:
• INITIAL SET-UP:
Ensure Modbus units are set-up as desired: set Modbus register 10026 (UnitsSystem)
to 0 for U.S. Customary units or to 1 for metric units.
• Periodic Loop:
Wait for external event for synchronizing the start of the meter delta volumes.
Send trigger Modbus message: set Modbus register 12199 (DoUpdtTrigDeltaVols) to 1
(TRUE).
Read trigger Modbus register 12199 (DoUpdtTrigDeltaVols) in a loop until it is read as
0 (FALSE) indicating that the delta volumes have been updated.
5.1.2
Read delta volume registers (either the FLOAT registers or the LONG register pairs) in a
single Modbus read. If the delta volume registers are read as LONG register pairs, calculate
each delta volume as follows:
Equation 5-5: Triggered delta volume
DeltaVolume = Overflow × 1e9 + Lower
where
DeltaVolume = triggered delta volume (forward or reverse, flow-condition or basecondition) (m3 or ft3) (TrigDeltaPosVolFlow, TrigDeltaNegVolFlow,
TrigDeltaPosVolBase, TrigDeltaNegVolBase)
Overflow = triggered delta volume overflow integer value (forward or reverse, flowcondition or base-condition) (1e9m3 or 1e9ft3)
Lower = triggered delta volume lower integer value (forward or reverse, flow-condition
or base-condition) (m3 or ft3)
Repeat "PERIODIC LOOP"
Configure operational parameters
Table 5-5: Configure Operational parameters
Calibration selection Description
Analog inputs and outputs
(Calibrate analog inputs
and outputs)
Calibration settings for the pressure and temperature analog inputs.
Meter factors (Calibrate
meter factors)
Model 3418 GUSM 49
Calibration settings for the pressure and temperature analog inputs.
Page 50

Configurations Operations manual
January 2019 DAN-20057316
Table 5-5: Configure Operational parameters (continued)
Calibration selection Description
Flow calibration (Flow
calibration)
Frequency/Digital output
sources (Configure
Frequency/Digital output
sources)
Frequency output
(Configure frequency
outputs)
Meter Digital outputs
(Configure digital input/
outputs)
HART outputs (Configure
HART outputs)
Meter corrections
(Configure meter
corrections)
Calibrate the meter during flowing conditions.
Outputs that can be configured as either a frequency output or a
digital status.
Configure the available frequency outputs.
Configure the digital outputs.
Configure the HART outputs.
Configure meter corrections that include:
• Temperature expansion correction (if Live or Fixed), Linear
expansion coefficient
• Linear expansion coefficient reference temperature
• Pressure expansion correction
• Pipe outside diameter
• Young's modulus value (ratio of tensile stress to tensile strain)
• Poisson's Ratio value (the absolute ratio of the pipe material lateral
strain over axial strain)
Temperature and pressure
(Configure temperature
and pressure)
Gas Chromatograph setup
(Configure Gas
Chromatograph
parameters)
AGA8 calculations
(Configure AGA8
parameters)
50 Operations manual
Temperature and Pressure - to set the scaling for analog inputs, enter
fixed values, and set alarm limits for both temperature
Configure a serial port as a Modbus master for polling a GC. Selections
include:
• Serial port
• GC protocol
• GC baud rate
• GC comms address
• GC stream number
• GC heating value units
Configure the properties necessary for the AGA8 calculations.
Selections include:
• Gross Method 1
• Gross Method 2
• Detail
• Externally
Page 51

Operations manual Configurations
DAN-20057316 January 2019
Table 5-5: Configure Operational parameters (continued)
Calibration selection Description
Continuous flow analysis
(Configure Continuous
Flow Analysis parameters)
Local Display (Configure
the local display)
Configure the Continuous Flow Analysis features. Selections include:
• Flow limits
• SOS comparison
• Liquid detection
• Abnormal profile
Configure the local display settings. Selections include:
• Display units
• Display Items
• Scroll Delay
5.2 Calibrate analog inputs and outputs
NOTICE
The WRITE PROT. switch on the CPU Module must be disabled or the calibration values will
not be updated for a meter.
An analog input can be calibrated regardless of the corresponding input type, pressure of
temperature. However, if the corresponding input type is selected as Live, then the input
being calibrated is considered to be invalid and the in-use value depends upon the
FlowPOrTSrcUponAlarm selection (see above). In this case, the appropriate data point
(FlowPressureWhileCal, FlowTemperatureWhileCal) is set to the in-use value so that it
can be logged in the optional log.
The offset and gain can be reset to the default values (0 and 1, respectively) by clicking the
Reset Defaults button.
NOTICE
Clicking the Reset Defaults button writes the offset and gain immediately - the previous
values cannot be restored.
Click the Edit Scaling button to modify the input scaling.
NOTICE
Changes made to an analog input's offset, gain, and scaling values are written to the log.
From Daniel MeterLink, select Calibrate to make changes using the Analog Inputs Wizard.
Procedure
1. Choose the analog input to calibrate, either temperature or pressure and click Next.
The Current > Calibration screen shows the current offset and gain and the input
scaling (i.e., the pressures or temperatures corresponding to the minimum (4 mA)
input and maximum (20 mA) inputs).
2. Click Next to proceed to the Calibration > Method screen then, select either the
offset or two-point calibration methods.
Model 3418 GUSM 51
Page 52

Configurations Operations manual
January 2019 DAN-20057316
• The Offset method requires a single calibration point and only affects the input's
calibration offset parameter.
• The two-point calibration requires calibrating at two different points (ideally far
apart in value) and affects the input's calibration offset and gain parameters.
Depending upon the selected calibration method, either one or two screens will
follow when the Next button is clicked.
3. The screen(s) displays the current (live) reading. When the input is stable, click the
Hold button to freeze the current reading.
4. Enter the correct value in the Actual edit box. Finally, the Finish screen shows the
new calculated offset and gain values.
Figure 5-5: Offset calibration
5. Click
Finish to write the values to the meter. If the meter is not configured to use
live values from the analog input for calculation, a prompt displays asking if the
configuration should be changed to use the live input.
6. Enable the WRITE PROT. switch on the CPU Module to write-protect the
configuration.
52 Operations manual
Page 53

Operations manual Configurations
DAN-20057316 January 2019
Table 5-6: Calibrate analog inputs and outputs
Daniel
MeterLink
Display name
Current output
Output setting
Current output
Start (Stop) AO1
Dat Points, options and guidelines
Data points affected:
• AO1estModeOutputPercent
Options:
• Enter the integer percentage of full scale for the analog output
within the range [0, 100 %] where 0% corresponds to the
minimum output (4 mA) and 100% corresponds to the
maximum output (20 mA).
Guidelines
• The specified test value takes effect within one batch period of
clicking the Start button.
Data points affected:
• IsAO1EnableTest
Options:
• Click on the StartAO1 button to enter the test mode (TRUE).
Note
the Start button will become the Stop button after clicking on it.
• Click on the StopAO1 button to exit the test mode (FALSE).
Current output
Output setting
Note
the Stop button will become the Start button after clicking on it.
Guidelines
• The specified test value takes effect within one batch period of
clicking the Start button (see below).
Data points affected:
• AO2TestModeOutputPercent
Options:
• Enter the integer percentage of full scale for the analog output
within the range [0, 100 %] where 0% corresponds to the
minimum output (4 mA) and 100% corresponds to the
maximum output (20 mA).
Guidelines
• The specified test value takes effect within one batch period of
clicking the Start button.
Note
The AO2 is only available with CPU module, part number
1-360-03-010.
Model 3418 GUSM 53
Page 54

Configurations Operations manual
January 2019 DAN-20057316
Table 5-6: Calibrate analog inputs and outputs (continued)
Daniel
MeterLink
Display name
The maximum length of time that the analog output can remain in the test mode is
specified via the NonNormalModeTimeout data point. Note that this data point
applies to other tests as well. The NonNormalModeTimeout data point can be
changed using the Daniel MeterLink Edit/Compare Configuration screen. It can be
set within the range [1, 30 min] and has a default value of 2 min.
Dat Points, options and guidelines
Data points affected:
• IsAO2EnableTest
Options:
• Click on the StartAO2 button to enter the test mode (TRUE).
Note
the Start button will become the Stop button after clicking on it.
• Click on the StopAO2 button to exit the test mode (FALSE).
Note
the Stop button will become the Start button after clicking on it.
Guidelines
• The specified test value takes effect within one batch period of
clicking the Start button (see below).
5.3 Calibrate meter factors
The factory calibrated flow velocity is the result of applying a third-order polynomial
equation (see Third-order polynomial for wet calibration) to the average weighted flow
velocity. Daniel 3410 Gas Ultrasonic Flow Meters are factory calibrated and the default
calibration settings are recommended.
5.3.1
Flow calibration
Daniel 3410 Gas Ultrasonic Flow Meters can be calibrated during flowing conditions by
selecting the calibration type in Daniel MeterLink from Calibration > Flow Calibration.
In a timed calibration, the meter records the volume through the meter over a user
specified period of time for a calibration run.
A gated calibration records the volume seen between switch closures directly from a
prover for the number of passes it takes for the prover to make a run. Use the spin buttons
or type in the number of passes of a prover to make a run. Calibration Gating configuration
parameter selections are:
• Edge gated, active high
54 Operations manual
Page 55

Operations manual Configurations
DAN-20057316 January 2019
Figure 5-6: Gating configuration parameter Edge gated, active high
• Edge gated, active low
Figure 5-7: Gating configuration parameter Edge gated, active low
• State gated, active high
Figure 5-8: Gating configuration parameter State gated, active high
• State gated, active low
Model 3418 GUSM 55
Page 56

Configurations Operations manual
January 2019 DAN-20057316
Figure 5-9: Gating configuration parameter State gated, active low
A Microsoft Excel® file is generated and the calibration log report can be saved or
appended to an existing file.
5.3.2
Configure Frequency/Digital output sources
The meter has three user-configurable outputs that can be configured for either a
Frequency output or Digital output (FODO).
• FODO1 (eight possible parameter configurations) [Type 2] [Type 4]
• FODO2 (eight possible parameter configurations) [Type 2] [Type 4]
• FODO3 (eight possible parameter configurations) [Type 2] [Type 4]
• FODO4 (eight possible parameter configurations) [Type 4]
• FODO5 (eight possible parameter configurations) [Type 4]
• FODO6 (eight possible parameter configurations) [Type 4]
— (DI1Mode must be set to Frequency/Digital Output 6 to enable FODO6)
Frequency or Digital Outputs (FODO1, FODO6) source options ~ Group 1
• FO1A, DO1A, FO1B, DO1B, FO2A, DO2A, FO2B, DO2B
• Frequency output 1A is the A Phase of Frequency output 1 content (Uncorrected
volume flow rate, Corrected volume flow rate, Average flow velocity, Average speed of
sound, Energy flow rate, Mass flow rate)
• Frequency output 1B is the B Phase of Frequency output 1
• Frequency output 2A is based on frequency content (Actual - Uncorrected Flow Rate)
• Frequency output 2B is based on frequency content and Frequency 2B Phase
• Digital output 1A is based on Digital output1A content (Frequency Output 1 Validity,
Flow Direction, Process Validity)
• Digital output 1B is based on Digital output1B content (Frequency Output 1 Validity,
Flow Direction, Process Validity)
• Digital output 2A is based on Digital output 2A content (Frequency Output 2 Validity,
Flow Direction, Process Validity)
• Digital output 2B is based on Digital output 2B content (Frequency Output 2 Validity,
Flow Direction, Process Validity)
56 Operations manual
Page 57

Operations manual Configurations
DAN-20057316 January 2019
Frequency or Digital Outputs (FODO2, FODO3, FODO4, FODO5) source options ~
Group 2
• FO1A, DO1A, FO1B, DO1B, FO2A, DO2A, FO2B, DO2B
• Frequency output 1A is the A Phase of Frequency output 1 content (Uncorrected
volume flow rate, Corrected volume flow rate, Average flow velocity, Average speed of
sound, Energy flow rate, Mass flow rate)
• Frequency output 1B is the B Phase of Frequency output 1
• Frequency output 2A is the A Phase of Frequency output 2 content (Uncorrected
volume flow rate, Corrected volume flow rate, Average flow velocity, Average speed of
sound, Energy flow rate, Mass flow rate)
• Frequency output 2B is the B Phase of Frequency output 2 content
• Digital output 1A is based on Digital output1A content (Frequency Output 1 Validity,
Flow Direction, Process Validity)
• Digital output 1B is based on Digital output1B content (Frequency Output 1 Validity,
Flow Direction, Process Validity)
• Digital output 2A is based on Digital output 2A content (Frequency Output 2 Validity,
Flow Direction, Process Validity)
• Digital output 2B is based on Digital output 2B content (Frequency Output 2 Validity,
Flow Direction, Process Validity)
Mode options
• Open Collector (requires external excitation supply voltage and pull-up resistor)
• TTL (internally powered by the meter 0-5 VDC signal)
Channel B Phase options:
• Lag forward, Lead reverse (Phase B lags Phase A while reporting forward flow, leads
Phase A while reporting reverse flow)
• Lead forward, Lag reverse (Phase B leads Phase A while reporting forward flow, lags
Phase A while reporting reverse flow)
Phase A and Phase B output (based on flow direction)
• Reverse flow - output only reports flow in the reverse direction. For frequency outputs,
Phase B of the output is 90 degrees out of phase with Phase A.
• Forward flow - output only reports flow in the forward direction. For frequency outputs,
Phase B of the output is 90 degrees out of phase with Phase A.
• Absolute - output reports flow in both directions. For frequency outputs, Phase B of the
output is 90 degrees out of phase with Phase A.
• Bidirectional - output reports flow on Phase A only in the forward direction and on
Phase B only in the reverse direction.
Maximum frequency for the frequency outputs
• 1000Hz
• 5000Hz
Model 3418 GUSM 57
Page 58

Configurations Operations manual
January 2019 DAN-20057316
Frequency/Digital output Source configuration
Frequency /Digital Output 1
Frequency /Digital Output 2
Frequency /Digital Output 3
Frequency /Digital Output4
Frequency /Digital Output 5
Frequency /Digital Output 6
• Frequency output 1A
• Frequency output 1B
• Digital output 1A
• Digital output 1B
• Frequency output 2A
• Frequency output 2B
• Digital output 2A
• Digital output 2B
Output for FODO1 and Digital Input 1 (Group 1 on the CPU Module) share a common
ground and have 50V isolation. FODO2 and FODO3 (Group 2 on the CPU Module) share a
common ground and have 50V isolation. This allows an output to be connected to a
different flow computer. The outputs are opto-isolated from the CPU Module and have a
withstand voltage of at least 500V rms dielectric.
Figure 5-10: CPU Module - Frequency/Digital outputs common ground - Type 2
A. FODO1 and Digital input1 - shared common ground (Group 1)
B. FODO2 and FODO3 - shared common ground (Group 2)
58 Operations manual
Page 59

Operations manual Configurations
DAN-20057316 January 2019
Figure 5-11: CPU Module - Frequency/Digital outputs common ground - Type 4
A. FODO1 and DI1/FODO6 - shared common ground - Type 4 CPU Module (Group 1)
B. FODO2, FODO3, FODO4 and FODO5 - shared common ground - Type 4 CPU Module
(Group 2)
5.4 Configure frequency outputs
The Frequency Outputs allows you to configure the available frequency outputs for the
meter.
If you previously configured one or more Frequency/Digital outputs make selections for
the following parameters.
Content:
• Valid outputs are based on Uncorrected (Actual) flow rates or on Corrected (Standard)
flow rates. If pressure or temperature is set to Not used, or the Base condition
correction is cleared on the Startup Page, the Corrected (Standard) option will not be
available.
• Daniel Gas Ultrasonic meters will also allow you to set the outputs for Average Flow
Velocity, Average Sound Velocity, Energy Rate, and Mass Rate.
Direction:
• Reverse: The output only reports flow in the reverse direction. For frequency outputs,
Phase B of the output is 90 degrees out of phase with Phase A.
• Forward: The output only reports flow in the forward direction. For frequency outputs,
Phase B of the output is 90 degrees out of phase with Phase A.
• Absolute: The output reports flow in both directions. For frequency outputs, Phase B of
the output is 90 degrees out of phase with Phase A.
• Bidirectional: The output reports flow on Phase A only in the forward direction and on
Phase B only in the reverse direction.
Model 3418 GUSM 59
Page 60

Configurations Operations manual
January 2019 DAN-20057316
Maximum frequency output:
• Valid frequency output options are 1000 Hz and 5000 Hz.
The following fields are used to configure the frequency outputs selected to output a
volumetric flow rate. The fields are only enabled if the associated output's Content is set to
Uncorrected (Actual) or Corrected (Standard).
Full scale volumetric flow rate used with output:
• Enter the flow rate to be equivalent to the maximum frequency of the frequency
output. This property is disabled if Frequency outputs was cleared on the Startup Page.
K-factor:
A read-only value showing the calculated K-factor from the Full scale volumetric flow rate
used with frequency outputs and the Maximum frequency for frequency output. This
property is disabled if Frequency outputs was cleared on the Startup Page.
Vol/pulse:
A read-only value showing the calculated inverse of the K-factor. This property is disabled
if Frequency outputs was cleared on the Startup Page.
Velocity:
• Maximum scale velocity used with output: Enter the velocity to be equivalent to the
maximum frequency of the frequency output. These values are only enabled if the
Content is set to Average flow velocity or Average sound velocity. This property is
disabled if Frequency outputs was cleared on the Startup Page.
• Minimum scale velocity used with output: Enter the velocity to be equivalent to the
minimum frequency (i.e. 0Hz) of the frequency output. These values are only enabled if
the Content is set to Average flow velocity or Average sound velocity. This property is
disabled if Frequency outputs was cleared on the Startup Page.
Energy Rate:
The following fields are used to configure the frequency or current outputs selected to
output an energy rate. The fields are only enabled if the associated output's Content is set
to Energy rate.
• Full scale energy rate used with output: Enter the energy rate to be equivalent to the
maximum frequency of the frequency output.
• Energy/pulse: A read-only value showing the calculated inverse of the K-factor. Each
frequency output has its own register.
Mass Rate:
• The following fields are used to configure the frequency outputs selected to output a
mass rate. The fields are only enabled if the associated output's Content is set to Mass
rate.
• Full scale mass rate used with output: Enter the mass rate to be equivalent to the
maximum frequency of the frequency output.
• Mass/pulse: A read-only value showing the calculated inverse of the K-factor. Each
frequency output has its own register.
60 Operations manual
Page 61

Operations manual Configurations
DAN-20057316 January 2019
5.5 Configure digital input/outputs
Digital input
The Daniel 3410 Gas Ultrasonic Flow Meters provides one digital input (referred to as DI1).
The polarity of the input is configured via the DI1IsInvPolarity data point as follows:
• FALSE - normal polarity (default setting), or
• TRUE - inverted polarity
The digital input is not configurable via the Daniel MeterLink Field Setup Wizard. It must be
configured via the Daniel MeterLink Tools|Edit/Compare Configuration.
Digital input calibration
The IsDI1UsedForCal specifies whether digital input 1 (DI1) is used for general purpose
(when set to FALSE) or for synchronizing calibration (when set to TRUE). If used for
calibration, the polarity is determined by the IsDI1ForCalActiveLow data point select one
of the following:
• FALSE - general purpose (default setting), or
• TRUE - for synchronizing calibration
The IsDI1ForCalActiveLow data point specifies the polarity for digital input 1 (DI1) when it
is configured (via IsDI1UsedForCal) for use in synchronizing a calibration. See also
IsDI1ForCalStateGated.
• FALSE = Cal Active High
• TRUE = Cal Active Low (default)
The IsDI1ForCalStateGated data point specifies the calibration gating for digital input 1
(DI1) when it is configured (via IsDI1UsedForCal) for use in synchronizing a calibration.
When FALSE, the calibration is started/stopped via an inactive->active edge; when TRUE,
the calibration is started via an inactive->active state change and stopped via an active>inactive state change. The active edge/state is specified via the IsDI1ForCalActiveLow
data point.
• FALSE = Cal Edge Gated (default)
• TRUE = Cal State Gated
For detailed digital proving configuration, refer to Flow calibration.
Digital output
Select the function for which the digital output should be configured. Available options are
validity and direction.
The inverted operation option is useful if the output of the ultrasonic meter is reversed
from what a flow computer is expecting. This means that if the output normally outputs a
HIGH for a TRUE condition, selecting this checkbox will change the output to output a
LOW for a TRUE condition.
Model 3418 GUSM 61
Page 62

Configurations Operations manual
January 2019 DAN-20057316
5.6 Outputs test mode
The Daniel 3410 Gas Ultrasonic Flow Meters provides a mode of operation for testing the
frequency, current (analog) and digital output signals. Entering, configuring, and exiting
this mode is accomplished by setting data points using the Daniel MeterLink Tools >
Outputs Test.
Figure 5-12: Meter Outputs Test page
Note
The AO2 is only available with CPU module, part number 1-360-03-010.
The Outputs Test dialog box allows you to monitor the live values of all the frequency,
current (analog) and digital outputs. Additionally the outputs can be set into a Test mode
to force the outputs to a specific user defined value. This dialog box is only available while
connected to a meter.
When the dialog box first opens, the available Outputs show the current "Live" values the
outputs are driving. The LED Test mode will remain gray while not in Test mode.
62 Operations manual
Page 63

Operations manual Configurations
DAN-20057316 January 2019
To fix the frequency and current outputs to a user-defined value, enter the desired
percentage of full-scale into the Output setting. For Daniel 3410 Gas Ultrasonic Flow
Meters, each available output has individual output control and can be set from 0 to 150%.
The 100% Scaling indicates the full scale value for the frequency outputs and can be
changed from the Field Setup Wizard.
Click the Start button to enter Test mode. Each output has its own start button, so each
available output can be tested one at a time. The frequency and current outputs will not
be updated until the end of the next batch cycle. Once the Test mode LED turns green, the
output values displayed represent the values the outputs are driving under test.
The frequency outputs for both the A and B channels are displayed. If Channel B zero on
error is selected in the Field Setup Wizard the Channel B phase will show zero because the
frequency output is considered invalid during test mode.
The K-Factor and Inverse K-Factor will be displayed for the frequency outputs configured
for Volumetric flow rate. The values will be displayed next to the label for the associated
frequency output.
To set the digital outputs to a known state, select the Test High or Test Low for the
appropriate digital output and click the Start button for the digital output. Once the Test
mode LED turns green, the value displayed for the outputs will represent the values the
outputs are driving under test.
The timeout for each output in test mode is reset by Daniel MeterLink each time the values
are updated. As long as this dialog is open with an output in test mode, the output will
remain in test mode or until the Stop button is clicked to end the test.
In the event communications are lost between Daniel MeterLink and the meter (before a
test mode is stopped), the meter will automatically end the test mode after the
NonNormalModeTimeout has expired. This can be from 1 to 30 minutes depending on its
settings. By default, the timeout is set to two minutes.
The Output setting can only be changed while out of Test mode. To end the Test mode,
click Stop and wait for the end of the batch and the Test mode LED to turn gray to indicate
the Outputs are driving live values.
Click Cancel to close the dialog box. If the meter is currently in Test mode when Cancel is
clicked, Daniel MeterLink will first end the test mode before returning to the Main Screen.
5.7 Configure temperature and pressure
5.7.1 Flow-condition pressure and temperature
The flow-condition pressure and temperature are used by the Daniel 3410 Series Gas
Ultrasonic Flow Meter for various calculations such as:
• Expansion correction
• Flow profile correction (JuniorSonic™ meters only)
• Calculation of base (standard) condition volumetric flow rate and volumes
• Optional AGA10 sound velocity calculation
Model 3418 GUSM 63
Page 64

Configurations Operations manual
January 2019 DAN-20057316
Configuration
The flow-condition pressure and temperature are individually configurable (via the
EnablePressureInput and EnableTemperatureInput data points) to be:
• Disabled (0),
• Live (1) (4-20 mA input signal)
• Fixed (2)
If an input is live, then the values corresponding to the minimum and maximum input (4
and 20 mA, respectively) are specified via data points (MinInputPressure,
MaxInputPressure, MinInputTemperature, MaxInputTemperature).
If an input is fixed, then its value is specified via a data point (SpecFlowPressure,
SpecFlowTemperature).
Alarm limits can be specified for each input (LowPressureAlarm, HighPressureAlarm,
LowTemperatureAlarm, HighTemperatureAlarm). Additionally, the flow-condition
pressure is configurable to be gage or absolute (via the InputPressureUnit data point). If
the pressure is gage, then the atmospheric pressure must be specified (via the
AtmosphericPress data point). See Configure the temperature parameters for the meter
and Configure the pressure parameters for the meter for details on configuring the flowcondition pressure and temperature.
Another data point (FlowPOrTSrcUponAlarm), common to both pressure and
temperature, is used to specify the data source to use when the selected input data is
invalid (i.e., value at or outside its alarm limits or a live input in calibration) as either:
• Last good value (0), or
• Fixed value (1).
This data point (FlowPOrTSrcUponAlarm) is configurable via the Daniel MeterLink Field
Setup Wizard > Temperature and Pressure page under Alarm Selection. It is also
configurable via the Daniel MeterLink Tools > Edit/Compare Configuration screen. The
default is to use the last good value.
Data updates
The Daniel 3410 Series Gas Ultrasonic Flow Meter samples the input analog signal(s) and
updates the corresponding data point(s) (LiveFlowPressure, LiveFlowTemperature) once
per second regardless of the input selection (disabled, live, or fixed).
Every five seconds, the meter updates the "in-use" flow-condition pressure and
temperature values (FlowPressure, AbsFlowPressure, FlowTemperature) depending
upon the input selection, validity of the input data, and the selected data source upon
alarm according to Table 5-7.
64 Operations manual
Page 65

Operations manual Configurations
DAN-20057316 January 2019
Table 5-7: Flow-condition pressure and temperature data source
Input Type
(EnablePressureInput
or
EnableTemperaturein
put)
Disabled N/A N/A "In-Use" value unchanged
Live Valid N/A Average of live values
Live input can be invalid due to (a) one or more live values is/are at or outside the alarm limits, or
(1)
(b) the input is being calibrated.
Data Validity
(PressureValidity or
TemperatureValidity)
(1)
Invalid
Valid N/A Fixed data point
Invalid Last good value "In-Use" value changed
Data Source Upon
Alarm
(FloePOrtSrcUponA
larm)
Last good value "In-Use" value unchanged
Fixed Fixed data point
"In-Use" Data Source
(FlowPressure or
FlowTemperature)
(LiveFlowPressure or
FlowTemperature)
(SpecFlowPressure or
SpecFlowTemperature)
(SpecFlowPressure or
SpecFlowTemperature)
Fixed data point
(SpecFlowPressure or
SpecFlowTemperature)
5.7.2
The flow-condition absolute flow pressure is calculated as shown in Flow-condition
absolute pressure.
Equation 5-6: Flow-condition absolute pressure
P
abs, f
P
abs, f
+P
= P
Atmospℎere
f
InputPressureUnit = FALSE
= PfInputPressureUnit = TRUE Absolute
Gage
where
P
= flow-condition absolute pressure (MPaa) (AbsFlowPressure)
abs,f
Pf = flow-condition pressure (MPa if InputPressureUnit=FALSE, MPaa if
InputPressureUnit=TRUE) (FlowPressure)
P
Atmosphere
= (specified) atmospheric pressure (MPaa) (AtmosphericPress)
Configure the temperature parameters for the meter
• Live temperature - if Live Analog was selected for Temperature for meter corrections on
the Daniel MeterLink Startup Page, enter the scaling for the transmitter connected to
the analog input. Minimum input is the zero scale temperature of the transmitter (i.e. 1
Volt or 4mA). Maximum input is the full scale temperature of the transmitter (i.e. 5
Volts or 20 mA).
Model 3418 GUSM 65
Page 66

Configurations Operations manual
January 2019 DAN-20057316
• Fixed temperature - If Fixed was selected on the Daniel MeterLink Startup Page for
Temperature It will also be enabled if a live temperature input was selected. Enter a
fixed value to use for calculations if the live input goes into alarm. Enter an average
temperature of the process fluid.
• Temperature alarm - Enter the low and high alarm limits. A temperature reading
outside of these limits causes a Temperature Validity alarm. The Alarm selection
determines what value to use while a live input is in alarm. This value is common with
the pressure Alarm selection so when one is changed, the other will change to match.
5.7.3 Configure the pressure parameters for the meter
• Pressure reading - Select either Gage or Absolute for the type of pressure reading
desired. If a live pressure transmitter is connected, select the type of reading the
transmitter outputs. If Absolute is selected, you must also enter the Atmospheric
pressure.
• Live pressure - Enter in the scaling for the transmitter connected to the analog input.
Min. input is the zero scale pressure of the transmitter (i.e. 1 Volt or 4mA). Max. input is
the full scale pressure of the transmitter (i.e. 5 Volts or 20 mA).
• Fixed pressure - Enabled if Fixed was selected for Temperature for meter corrections on
the Startup Page. It will also be enabled if a live temperature input was selected to
allow you to enter a fixed value to use for calculations if the live input goes into alarm.
Enter an average pressure of the process fluid.
• Pressure alarm - Enter the low and high alarm limits. A pressure reading outside of
these limits causes a Pressure Validity alarm. The Alarm selection determines what
value to use while a live input is in alarm. This value is common with the temperature
Alarm selection so when one is changed, the other will change to match.
5.8 Configure Gas Chromatograph parameters
Use the Meter > Field Setup Wizard menu and enable the View Gas Chromatograph
setup checkbox. Configure the following parameters to setup a serial port as a Modbus
master for polling a GC.
• Port - Select which port will be connected to the GC. While a serial port is configured for
communications to a GC, it will not act as a Modbus slave device for communications
from Daniel MeterLink or a SCADA system
• GC protocol - Select the protocol for which the GC is configured. The Daniel Gas
Ultrasonic meter uses 7 data bits, Even parity, and 1 stop bit for ASCII Modbus and 8
data bits, No parity, and 1 stop bit for RTU Modbus.
• GC baud rate - Select the baud rate for which the GC is configured.
• GC comms address/unit identifier - Enter the Modbus ID of the GC.
• GC IP address - This option will be enabled only when the Ethernet is selected.
• GC TCP/IP port number - This option will be enabled only when the Ethernet is selected.
66 Operations manual
Page 67

Operations manual Configurations
DAN-20057316 January 2019
• GC stream number - Enter the stream number for the gas composition the Daniel Gas
Ultrasonic meter will read.
• GC heating value units - Select the units for which the heating value is configured in the
GC.
— Btu/ft
— kJ/m
— kJ/dm
— MJ/m
— kCal/m
— kWh/m
3
3
3
3
3
3
• GC heating value type - Select the type of heating value the GC will return.
— Btu-Dry
— Btu-Saturated
— Btu-Actual
5.8.1
• Gas composition on GC alarm - Select which gas composition the Daniel Gas Ultrasonic
meter will use if the GC goes into alarm.
— Fixed - if selected, the meter will start using the fixed gas composition stored in the
meter.
— Last Good Value - if selected, the meter will use the last gas composition collected
from the GC before the GC started to report alarms.
Gas properties
Gas property data (composition and heating value) are used by the meter for AGA8
calculations (for converting to base or standard volumes and for mass calculation), for
energy calculation, and for optional AGA10 calculations (sound velocity calculation and
comparison).
The data are also used by JuniorSonic™ meters when the profile correction factor is to be
calculated by the meter (rather than fixed or a default value). See Table 5-12 for GC
registers polled by the meter. The gas property data can either be fixed (specified via data
points) or optionally read from a Daniel™ Gas Chromatograph (GC). Reading the gas
property data from a GC requires a valid GC feature key (See GC interface key). Use the
Field Setup Wizard in Daniel MeterLink™ to configure these parameters.
Fixed gas property data
If the data is fixed, then the heating value and its reference temperature are specified via
the MeasVolGrossHeatingVal and RefTemperatureHV data points, respectively; the gas
components are specified via the data points listed in Table 5-8 below. Fixed gas property
data is always assumed to be valid.
NOTICE
If the gas composition is specified from within Daniel MeterLink, the data point's unit is
mole percentage, not mole fraction (as the data point name would imply).
Model 3418 GUSM 67
Page 68

Configurations Operations manual
January 2019 DAN-20057316
Table 5-8: Fixed gas composition data points
Gas composition data points
MoleFractionN2Method2
MoleFractionCO2
MoleFractionH2
MoleFractionCO
MoleFractionMethane
MoleFractionEthane
MoleFractionPropane
MoleFractionIsoButane
MoleFractionNButane
MoleFractionIsoPentane
MoleFractionNPentane
MoleFractionNHexane
MoleFractionNHeptane
MoleFractionNOctane
MoleFractionNNonane
MoleFractionNDecane
MoleFractionH2S
MoleFractionHelium
MoleFractionWater
MoleFractionOxygen
MoleFractionArgon
Live (GC) gas property data
The purpose of this section is to give a brief overview of the gas property data read from a
GC. Refer to Daniel MeterLink utilities for information on configuring the Daniel 3410
Series Gas Ultrasonic Flow Meter (using the Daniel MeterLink program) for communicating
with a Daniel GC.
If the gas components are read from the GC, then the GC-reported heating value is
readable via the HeatingValueGC data point. Note that type of heating value to be read
from the GC must be specified via the GCHeatingValueType data point as either Btu-Dry,
Btu-Saturated, or Btu-Actual. So that the correct GC register is read. Also, the heating
value unit must be specified via the GCHeatingValueUnit data point as either Btu/ft3,
kJ/m3, kJ/dm3, MJ/m3, kCal/m3, or kWh/ m3. The GC-reported gas composition is readable
via the data points listed in Table 5-9 below:
68 Operations manual
Page 69

Operations manual Configurations
DAN-20057316 January 2019
Table 5-9: GC-reported gas composition data points
GC reported composition data points
N2GC
CO2GC
H2GC
COGC
MethaneGC
EthaneGC
PropaneGC
IsoButaneGC
NButaneGC
IsoPentaneGC
NPentaneGC
NHexaneGC
NHeptaneGC
NOctaneGC
NNonaneGC
NDecaneGC
H2SGC
HeliumGC
WaterGC
OxygenGC
ArgonGC
C6PlusGC (C6PlusGCComponentID)
NeoPentaneGC
The validity of the GC-read gas property data is readable via the
AreGasPropertiesInvalidGC data point where TRUE(1) indicates invalid data and FALSE(0)
indicates valid data. Refer to GC data validity for further information on how the data
validity is determined.
In-Use gas property data
The "In-Use" gas property data is the actual data used by the meter for calculations.
The GasPropertiesSrcSel data point is used to select the gas property data source as either
Fixed (0) or Live - GC (1). If the data source is Live - GC and the GC-read data is invalid, then
the GasPropertiesSrcSelGCAlarm data point is used to select the data source as either Last
good value (0) or Fixed value (1). When Last good value is selected, the "In-Use" gas
property data is not updated with the invalid GC-read gas property data. When Fixed value
is used, the "In-Use" gas property data is updated with the fixed gas property data.
Model 3418 GUSM 69
Page 70

Configurations Operations manual
January 2019 DAN-20057316
The meter maps the appropriate input gas property data points (fixed or GC-reported as
discussed above) to the corresponding "In-Use" data points (the HeatingValueInUse data
point and the gas composition data points listed in the Table 5-10 below).
Table 5-10: In-Use gas composition data points
"In-Use" gas composition data points
N2InUse
CO2InUse
H2InUse
COInUse
MethaneInUse
EthaneInUse
PropaneInUse
IsoButaneInUse
NButaneInUse
IsoPentaneInUse
NPentaneInUse
NHexaneInUse
NHeptaneInUse
NOctaneInUse
NNonaneInUse
NDecaneInUse
H2SInUse
HeliumInUse
WaterInUse
OxygenInUse
ArgonInUse
The fixed gas component data points map directly to the corresponding "In-Use" gas
component data points. The GC-reported gas component data points map directly to the
corresponding "In-Use" gas component data points except for the C6PlusGC and
NeoPentaneGC components. The C6PlusGC quantity is divided among the
NHexaneInUse, NHeptaneInUse, and NOctaneInUse data points according to the
component ID (C6PlusGCComponentID) as listed in Table 5-11 below:
Table 5-11: C
C 6 + Component ID
(C6PlusGCComponent
ID)
108 47.466 35.340 17.194
70 Operations manual
+ breakdown to standard components by component ID
6
Percentage to
NHexaneInUse
Percentage to
NHeptaneInUse
Percentage to
NOctaneInUse
Page 71

Operations manual Configurations
DAN-20057316 January 2019
Table 5-11: C6+ breakdown to standard components by component ID (continued)
C 6 + Component ID
(C6PlusGCComponent
ID)
109 50.000 50.000 0.000
110 60.000 30.000 10.000
111 57.143 28.572 14.285
Percentage to
NHexaneInUse
Percentage to
NHeptaneInUse
Percentage to
NOctaneInUse
For example, if the C6PlusGC mole percentage is 1% and its component ID is 110, then 60%
of the C6+ mole percentage (0.60x1%=0.60%) is added to NHexaneInUse, 30%
(0.30x1%=0.30%) is added to NHeptaneInUse, and 10% (0.10x1%=0.10%) is added to
NOctaneInUse.
The GC-reported NeoPentane component (NeoPentaneGC) quantity is added to the
IsoPentane component (IsoPentaneInUse).
The validity of the "In-Use" gas property data is readable via the
AreGasPropertiesInvalidInUse data point where TRUE(1) indicates invalid data and
FALSE(0) indicates valid data. The validity of the "In-Use" gas property data is a function of
the validity of the selected source data. If the source data is selected as Fixed, then the "InUse" gas property data is valid (since the fixed data is assumed to be valid). If the source
data is selected as Live - GC, then the "In-Use" gas property data is valid only if the GC-read
gas property data is valid.
Optional gas chromatograph interface
The Daniel 3410 Series Gas Ultrasonic Flow Meter can optionally interface with any Daniel
gas chromatograph (GC) that supports the SIM 2251 mode to read gas property data
(such as for AGA8, AGA10, energy rate, mass rate, and/or profile correction calculations).
NOTICE
The gas chromatograph interface is an optional feature that requires a valid GC feature
key. Refer to GC interface key.
The following table lists the Gas Chromatograph SIM registers polled by the meter. Also
refer to Daniel Engineering Specification Part Number ES-17128-005 Rev. B.
Table 5-12: Gas chromatograph Sim 2251 Registers
Sim 2251 Register Description
3034 Stream identifier
3041 Cyc le time start - month(1-12)
3042 Cyc le time start - day(1-31)
3043 Cyc le time start - last two year digits
3044 Cyc le time start - hour(0-23)
3045 yc le time start - minutes(0-59)
3046 GC alarm bitmap 1
3047 GC alarm bitmap 2
Model 3418 GUSM 71
Page 72

Configurations Operations manual
January 2019 DAN-20057316
Table 5-12: Gas chromatograph Sim 2251 Registers (continued)
Sim 2251 Register Description
3001 - 3016 Component codes
7001 - 7016 Mole fractions for corresponding component codes
7033 BTU (dry)
7034 BTU (sat)
7035 Specific gravity)
7038 Total unnormalized mole percent
7054 BTU (actual)
Table 5-13: Supported Components IDs
Component IDs
METHANE (100)
CO2 (117)
PROPANE (102)
H2S (140)
CO (115)
IBUTANE (103)
IPENTANE (105)
NHEXANE (139)
NOCTANE (152)
NDECANE (150)
ARGON (146)
C6PLUS_COMP_ID_1 (108)
C6PLUS_COMP_ID_3 (110)
NITROGEN (114)
ETHANE (101)
H20 (144)
HYDROGEN (112)
O2 (116)
NBUTANE (104)
NPENTANE (106)
NHEPTANE (145)
NNONANE (151)
HELIUM (113)
NEO_PENTANE (107)
72 Operations manual
Page 73

Operations manual Configurations
DAN-20057316 January 2019
Table 5-13: Supported Components IDs (continued)
Component IDs
C6PLUS_COMP_ID_2 (109)
Note
Components read from the register 3001-3016 had 100 subtracted from them by the GC.
The Daniel Gas Ultrasonic Meter must add 100 to each ID read from the GC before looking
it up in this table.
Gas property data
The gas property data read from the GC includes gas composition, heating value, and
specific gravity (relative density).
The gas composition includes the 21 standard components plus C6+ and Neopentane (see
Table 5-9 for a list of data point names). Refer to In-Use gas property data for further
information on how the GC-read gas properties are mapped to the 'in-use' gas property
data points.
The GC-read heating value and specific gravity are stored in the HeatingValueGC and
SpecificGravityGC data points, respectively.
Data polling
The meter periodically polls the GC looking for data updates. If the meter is
communicating normally with the GC, then it polls the GC every one minute looking for an
update (i.e., a change in the GC analysis time). Otherwise, the meter polls the GC every 15
seconds.
When the meter determines that a GC update is available for the specified stream number,
it then reads the GC data using multiple reads one second apart until all the data is read.
The GC analysis time is read again at the end of the data collection to determine if another
update occurred during the data collection (i.e., the data is not all from the same update).
If so, the meter discards the gas property data just read and begins looking immediately
for the next update.
If the meter cannot successfully communicate with the GC after four consecutive polls (15
seconds apart), then the meter indicates the communication alarm via the IsGCComErr
data point with the GCCommStatus data point indicating an error code (listed in Table
5-14 below).
Table 5-14: GC Communications status list
GCComm status value Error description
0 No error.
1 Desired stream not found.
2 GC controller is busy (error defined by Modbus protocol).
3 GC detected an illegal Modbus function code from the meter.
4 GC detected an illegal Modbus data address from the meter.
Model 3418 GUSM 73
Page 74

Configurations Operations manual
January 2019 DAN-20057316
Table 5-14: GC Communications status list (continued)
GCComm status value Error description
5 GC detected an illegal data value from the meter.
6 Failure in associated device (Modbus defined error).
7 GC has accepted the meter's request but is still processing.
8 A firmware logic error was detected.
9 Modbus address mismatch.
10 Modbus function code mismatch.
11 GC reports an exception code that is unrecognized.
12 The meter's Modbus request message is too long (exceeds the
maximum allowable length).
13 The GC's Modbus response message is too long (exceeds the
maximum allowable length).
14 GC response message has incorrect number of registers.
15 GC does not support the requested message data type.
16 GC does not support the requested data protocol.
17 The meter's Modbus request message (RTU protocol) is too
long (exceeds the maximum allowable length).
18 GC response not received within the communication timeout.
19 GC response message (ASCII protocol) incomplete.
20 GC response message (RTU protocol) incomplete.
GC data validity
The GC-read gas property data validity is indicated by the AreGasPropertiesInvalidGC data
point. The data is considered invalid if any of the conditions listed in Table 5-15 is true.
These conditions are indicated by the Daniel MeterLink Monitor page Field I/O indicator.
Table 5-15: GC-read gas property invalid conditions
Indication Data Point Condition
IsGCAlarmPresent Invalid GC feature key (GC interface key)
Port improperly configured (such as if configured without using the
Daniel MeterLink Field Setup Wizard).
Unrecognized gas component ID.
Specified gas stream (GCStreamNumber) not found within the specified
period (GCDesiredStreamTimeout).
GC reported alarm (GC Alarm1 bits 14 and/or 15 set, GC Alarm2 bits 0, 1,
2, and/or 3 set).
IsGCWarningPresent Not presently used - reserved for future use.
IsGCCommErr Refer to communication error conditions listed in Table 5-14.
74 Operations manual
Page 75

Operations manual Configurations
DAN-20057316 January 2019
Table 5-15: GC-read gas property invalid conditions (continued)
Indication Data Point Condition
IsGCDataErr The total unnormalized gas composition mole percentage is not within
[85%, 115%].
An individual gas composition mole percentage is not within [0%, 100%].
The specific gravity is not within [0.2, 0.8].
The heating value is greater than 50 kJ/dm3.
GC alarm handling
The following data points are included in the meter's alarm log (See Event log: alarm/
audit): AreGasPropertiesInvalidGC, IsGCAlarmPresent, IsGCCommErr, GCCommStatus,
and IsGCDataErr.
5.8.2
Configure AGA8 parameters
Configure the properties necessary for the AGA8 calculations.
How the AGA8 calculations to be performed:
• Internally by the meter - calculates the flow mass density, the flow compressibility and
the base compressibility.
• Externally - calculations are done externally. The calculated values must then be written
to the meter using Daniel MeterLink™ or a flow computer.
AGA8 method
• Gross Method 1
• Gross Method 2
• Detail - enter the amount of each of the 21 gas components as a percentage.
• GERG-2008
Gas composition
• Fixed - use the fixed gas composition stored in the meter for all calculations.
• Live GC - use a gas composition collected by the meter from a gas chromatograph for
all calculations. This option is only available with a GC key or is enabled with the
Continuous Flow Analysis key.
• Configure the Gas properties for the gas chromatograph
• Base temperature
• Base pressure
• Gas composition to use on GC alarm
• Specific gravity
• Specific gravity reference temperature
Model 3418 GUSM 75
Page 76

Configurations Operations manual
January 2019 DAN-20057316
• Specific gravity reference pressure
• Volumetric gross heating value
• Volumetric gross heating value reference temperature
• Molar density reference temperature
• Molar density reference pressure
• Flow mass density
• Flow compressibility
• Base compressibility
(1)
(1)
(1)
5.8.3 Configure Continuous Flow Analysis parameters
Configure the Continuous Flow Analysis features of the Daniel Ultrasonic meter. This
Daniel MeterLink™ Field Setup Wizard page is displayed only if the View Continuous Flow
Analysis setup was selected on the Startup Page and you have a valid Continuous Flow
Analysis key.
These features require that the meter baseline be set using the Tools > Set Baseline
Wizard.
• Flow limits - low and high flow velocity limits.
• SOS comparison (requires AGA 8 Detail method to be used) - compares the meter
average speed of sound to the AGA 10 calculated speed of sound.
• Liquid detection - identifies when liquids may be present in the bottom of the meter run
base on the meter's flow characteristics.
• Abnormal profile - identifies if the meter flow profile has shifted from the original
baseline profile of the meter.
• Blockage - identifies a possible blockage of an upstream flow conditioner.
• Internal bore buildup - indicates that the flow characteristics have changed indicating a
build up on the internal bore of the meter.
Set Baseline parameters
Select the direction to baseline and what data to use to perform the baseline. The wizard
will step you through setting a baseline in one direction.
It is necessary to baseline the meter in both directions if the meter will be operating in a bidirectional application. For meters only operating in a uni-directional application, the
meter only needs one baseline. The status message displayed on the Meter monitor
screen about the baseline not being set can simply be acknowledged to clear the alarm for
a flow direction you do not want to baseline.
Setting baselines in two directions is only necessary if the meter is installed in a bidirectional application. Flow through the meter in one direction can be quite different
from flow through a meter in the opposite direction. This could be because of flow
conditioners, thermowells, or elbows.
If a flow computer or SCADA system is used to write these values to the meter, they do not have to be entered at this time.
(1)
76 Operations manual
Page 77

Operations manual Configurations
DAN-20057316 January 2019
• Select baseline flow direction - forward or reverse
• Select baseline data source
— 1-minute averages from the meter - the preferred option when setting the baseline
for a new meter. The meter must be under typical flowing conditions when the
baseline is set.
— Maintenance log - if the meter has already been installed in the field for a period of
time and a Daniel MeterLink maintenance log is available from the initial startup
that was taken during normal flowing conditions.
— Manual entry - manually enter data for each of the parameters. This could be used
to modify a single parameter for a baseline already set or it could be to enter data
from a historical record from when the meter was first put into service.
Configure the local display
Configure the parameters for the local display.
Use the drop-down arrow in the Display Items list box and select or modify the parameters
that will be displayed; the Display items, the Display units and the Scroll delay.
Important
When connected to a meter with the local display option, reverse flow direction is
indicated with a minus sign (negative) before the value(s) shown on the local display.
Figure 5-13: Field Setup Wizard - Local Display
Model 3418 GUSM 77
Page 78

Configurations Operations manual
January 2019 DAN-20057316
Mode
Select Scroll items 1-10 or Uncorrected volume only. The default value is Scroll items 1-10.
Scroll items 1-10 mode, allows selection of up to ten data points to be displayed on the
local display. In Uncorrected volume only mode, the display will only alternate between
the forward and reverse uncorrected volume in units of cubic meters in compliance with
OIML R-137-1 and the European MID directive. Depending on the size of the meter, the
value displayed in the Uncorrected volume only mode will be X 10 cubic meters or X 100
cubic meters as indicated on the display in the bottom line.
Display items and display units
Display units - Meter volume units displayed are either U.S. Customary or Metric. The Meter
volume units displayed reflect the meter's units selected on the File > Program Settings
dialog (e.g. U.S. Customary or Metric units). Configure the Meter volume units for U.S.
Customary selections:
• Cubic feet,
• Thousand cubic feet Or
Metric unit selections are:
• Cubic meters
• Thousand cubic meters
Configure the Flow rate time units:
• Second
• Hour
• Day
Display units preceded by a plus or minus sign indicate forward and reverse flow
direction, as shown in the table below.
Table 5-16: Local display labels, descriptions and valid units
Local display labels, descriptions and valid units
QFLOW - Uncorrected volume flow rate
— ACF - Actual Cubic Feet
— ACM - Actual Cubic Meters
— MACF - Thousand Actual Cubic Feet
— MACM - Thousand Actual Cubic Meters
TDYVL - Current day's forward uncorrected volume
— +ACF - Actual Cubic Feet
— +ACM - Actual Cubic Meters
— +MACF - Thousand Actual Cubic Feet
— +MACM - Thousand Actual Cubic Meters
78 Operations manual
Page 79

Operations manual Configurations
DAN-20057316 January 2019
Table 5-16: Local display labels, descriptions and valid units (continued)
Local display labels, descriptions and valid units
TDYVL - Current day's reverse uncorrected volume
— -ACF - Actual Cubic Feet
— -ACM - Actual Cubic Meters
— -MACF - Thousand Actual Cubic Feet
— -MACM - Thousand Actual Cubic Meters
YSTVL - Previous day's forward uncorrected volume
— +ACF - Actual Cubic Feet
— +ACM - Actual Cubic Meters
— +MACF - Thousand Actual Cubic Feet
— +MACM - Thousand Actual Cubic Meters
YSTVL- Previous day's forward uncorrected volume
— -ACF - Actual Cubic Feet
— -ACM - Actual Cubic Meters
— -MACF - Thousand Actual Cubic Feet
— -MACM - Thousand Actual Cubic Meters
TOTVL - Forward uncorrected volume
— +ACF - Actual Cubic Feet
— +ACM - Actual Cubic Meters
— +MACF - Thousand Actual Cubic Feet
— +MACM - Thousand Actual Cubic Meters
TOTVL - Reverse uncorrected volume
— -ACF - Actual Cubic Feet
— -ACM - Actual Cubic Meters
— -MACF - Thousand Actual Cubic Feet
— -MACM - Thousand Actual Cubic Meters
QBASE - Corrected volume flow rate
— SCF - Standard Cubic Feet
— SCM - Standard Cubic Meters
— MSCF - Thousand Standard Cubic Feet
— MSCM - Thousand Standard Cubic Meters
TDYVL- Current days forward corrected volume
— +SCF - Standard Cubic Feet
— +SCM - Standard Cubic Meters
— +MSCF - Thousand Standard Cubic Feet
— +MSCM - Thousand Standard Cubic Meters
Model 3418 GUSM 79
Page 80

Configurations Operations manual
January 2019 DAN-20057316
Table 5-16: Local display labels, descriptions and valid units (continued)
Local display labels, descriptions and valid units
TDYVL- Current days reverse corrected volume
— -SCF - Standard Cubic Feet
— -SCM - Standard Cubic Meters
— -MSCF - Thousand Standard Cubic Feet
— -MSCM - Thousand Standard Cubic Meters
YSTVL - Previous days forward corrected volume
— +SCF - Standard Cubic Feet
— +SCM - Standard Cubic Meters
— +MSCF - Thousand Standard Cubic Feet
— +MSCM - Thousand Standard Cubic Meters
YSTVL - Previous days reverse corrected volume
— -SCF - Standard Cubic Feet
— -SCM - Standard Cubic Meters
— -MSCF - Thousand Standard Cubic Feet
— -MSCM - Thousand Standard Cubic Meters
TOTVL - Forward uncorrected volume
— +SCF - Standard Cubic Feet
— +SCM - Standard Cubic Meters
— +MSCF - Thousand Standard Cubic Feet
— +MSCM - Thousand Standard Cubic Meters
TOTVL - Reverse uncorrected volume
— -SCF - Standard Cubic Feet
— -SCM - Standard Cubic Meters
— -MSCF - Thousand Standard Cubic Feet
— -MSCM - Thousand Standard Cubic Meters
VEL - Average flow velocity
— Ft/S - Feet per Second
— M/S - Meters per Second
SOS - Average sound velocity
— Ft/S - Feet per Second
— M/S - Meters per Second
TEMP - Flow-condition temperature
— DEGF - Degrees Fahrenheit
— DEGC - Degrees Celsius
80 Operations manual
Page 81

Operations manual Configurations
DAN-20057316 January 2019
Table 5-16: Local display labels, descriptions and valid units (continued)
Local display labels, descriptions and valid units
PRESS - Flow-condition pressure
— PSI - Pound per square inch
— MPA_ Megapascals
FRQ1A - Frequency channel 1A
— HZ - Hertz
FRQ1B - Frequency channel 1B
— HZ - Hertz
KFCT1 - Frequency 1K-factor
— CF - Cubic Feet
— CM - Cubic Meters
— MCF - Thousand Cubic Feet
— MCM - Thousand Cubic Meters
FRQ2A - Frequency channel 2A
— HZ - Hertz
FRQ2B - Frequency channel 2B
— HZ - Hertz
KFCT2 - Frequency 2K-factor
— CF - Cubic Feet
— CM - Cubic Meters
— MCF - Thousand Cubic Feet
— MCM - Thousand Cubic Meters
AO1- Analog Output 1 current
— MA- Miliamperes
AO2 - Analog Output 2 current
— MA- Miliamperes
Scroll delay - Time interval for the selected display items to be shown on the Local
Display. Use the spin buttons to increase or decrease the time interval.
Model 3418 GUSM 81
Page 82

Configurations Operations manual
January 2019 DAN-20057316
82 Operations manual
Page 83

Operations manual
DAN-20057316 January 2019
Directory
6 Directory
6.1 Archive logs
The Daniel 3410 Series Gas Ultrasonic Flow Meters provides five types of data logs (daily,
hourly, audit, alarm, and system logs).
Each log type is discussed in detail below followed by Daniel MeterLink instructions to read
(and optionally save) meter log records (Options for reading daily and/or hourly log
records).
6.1.1 Daily and Hourly log data points actions
Five different log data point actions are supported by the daily and hourly logs: snapshot,
average, flow-gated (average), totalize, and macro as described below:
• SNAPSHOT: causes the data point's value at the log time to be recorded.
• AVERAGE: causes the data point's average value over the log interval (day or hour) to
be recorded.
• FLOW-GATED: causes the data point's flow-gated average value over the log interval
(day or hour) to be recorded. A point's flow-gated average is the average of its values
when the flow is above the low-flow cut-off. If the flow does not exceed the cut-off
during the interval, then the data point's flow-gated average is the same as its regular
(non-flow- gated) average.
• TOTALIZE: causes the data point's accumulated value over the log interval (day or
hour) to be recorded.
• MACRO: causes the (boolean) data point's 'latched' value over the log interval (day or
hour) to be recorded. A (boolean) data point's latched value indicates if the point was
ever TRUE during the log interval (where a TRUE value is represented by a 1 and a FALSE
value is represented by a 0). This allows a group of boolean data points to be grouped
into a single integer value where each bit represents the latched value of a single
boolean data point.
Daily log
The Daniel 3410 Series Gas Ultrasonic Flow Meter stores a daily log record once per day at
the specified contract hour.
(Refer to the Daniel MeterLink Help files for information on specifying the ContractHour
data point.)
The meter can store up to 365 daily records. The user can select whether old, unread
records can be overwritten by new records when the log becomes full via the data point
DoOverwriteUnreadDailyLog. This point can be modified using the Daniel MeterLink
Tools > Edit/Compare Configuration screen. The default is to overwrite old, unread
records. Refer to Options for reading daily and/or hourly log records for information on
reading records and marking records as read. The data point IsDailyLogFull indicates
whether or not the daily log is full and cannot overwrite old, unread records.
Model 3418 GUSM 83
Page 84

Directory Operations manual
January 2019 DAN-20057316
The data points included in the daily log and the corresponding log action are as shown in
the table below. Data points required by the API Chapter 21 standard are marked with an
asterisk (*). For information on a particular data point, consult Daniel MeterLink online
help (see the help topic for any data point in Daniel MeterLink. Click Help > Gas 3410
Series Registers Reference, select the Index tab, start typing the data point name until
the desired point is highlighted, and then click the Display button.)
Table 6-1: Daily log content
Data point Content Log action
PosVolFlow* Totalize and
Snapshot
NegVolFlow* Totalize and
Snapshot
PosVolBase Totalize and
Snapshot
NegVolBase Totalize and
Snapshot
FlowTemperature* Flow-Gated
FlowPressure* Flow-Gated
AbsFlowPressure* Flow-Gated
AccumFlowTime* Totalize
AvgSndVel* Flow-Gated
PrevDayMacro1 Macro
bit 30-31
bit 29
bits 26-28
bit 25
bit 24
bit 23
bit 22
bit 21
bit 20
bit 19
bit 18
bit 17
bit 16
bits 5-15
bit 4
bit 3
bit 2
bit 1
bit 0
(unused)
DI1
(unused)
IsAcqMode
IsAcqModuleError
DidPowerFail
DidCnfgChksumChg
IsElecTempOutOfRange
IsElecVoltOutOfRange
IsGCAlarmPresent
IsGCCommErr
IsColocMeterCommErr
IsXdcrFiringSyncError
(unused)
IsEstimatedFlowVelocityInUse
IsEnergyRateInvalid
IsMassRateInvalid
IsQBaseInvalid
IsQFlowInvalid
Paths A-H,
8-path meters
PrevDayMacro2*: Macro
84 Operations manual
Page 85

Operations manual Directory
DAN-20057316 January 2019
Table 6-1: Daily log content (continued)
Data point Content Log action
bit 31
bit 30
bit 29
bit 28
bit 27
bit 26
bit 25
bit 24
bit 23
bit 22
bit 21
bit 20
bit 19
bit 18
bit 17
bit 16
bits 14-15
bit 13
bit 12
bit 11
bit 10
bit 9
bit 8
bit 7
bit 6
bit 5
bit 4
bit 3
bit 2
bit 1
bit 0
IsHardFailedH
IsHardFailedG
IsHardFailedF
IsHardFailedE
IsHardFailedD
IsHardFailedC
IsHardFailedB
IsHardFailedA
IsPkSwDetect
IsSNRTooLow
IsXDCRMaintReqd
IsChordLengthMismatched
(unused)
IsPressureInvalid
IsTemperatureInvalid
IsAnyLogFull
(unused)
IsColocMeterQFlowRangeErr
IsColocMeterSndSpdRangeErr
IsSevereFlowCondDetected
IsDiagSndSpdRangeErr
IsBlockageDetected
IsBoreBuildupDetected
IsLiquidDetected
IsAbnormalProfileDetected
IsReverseFlowDetected
IsSoundVelCompErr
AreGasPropInvalidInUse
IsMeasSndSpdRange
IsAvgSoundVelRangeErr
IsMeterVelAboveMaxLmt
Paths A-H, 8paths meters
SndVelA,
SndVelB,
SndVelC
SndVelD,
SndVelE,
SndVelF,
SndVelG,
SndVelH
Model 3418 GUSM 85
Flow-Gated
Page 86

Directory Operations manual
January 2019 DAN-20057316
Table 6-1: Daily log content (continued)
Data point Content Log action
FlowVelA,
FlowVelB,
FlowVelC,
FlowVelD,
FlowVelE,
FlowVelF,
FlowVelG,
FlowVelH
AvgFlow Flow-Gated
(Percent of good batch signals) PctGoodA1, PctGoodA2, PctGoodB1, PctGoodB2,
PctGoodC1, PctGoodC2, PctGoodD1, PctGoodD2, PctGoodE1, PctGoodE2,
PctGoodF1, PctGoodF2, PctGoodG1, PctGoodG2, PctGoodH1, PctGoodH2
QFlow Flow-Gated
QBase Flow-Gated
(Transducer Gain) GainA1, GainA2, GainB1, GainB2, GainC1, GainC2, GainD1,
GainD2, GainE1, GainE2, GainF1, GainF2, GainG1, GainG2, GainH1, GainH2
(Signal Energy) SEA1, SEA2, SEB1, SEB2, SEC1, SEC2, SED1, SED2, SEE1, SEE2,
SEF1, SEF2, SEG1, SEG2, SEH1, SEH2
(Noise Energy) NEA1, NEA2, NEB1, NEB2, NEC1, NEC2, NED1, NED2, NEE1, NEE2,
NEF1, NEF2, NEG1, NEG2, NEH1, NEH2
(Transit time standard deviation) SDevTmA1, SDevTmA2, SDevTmB1, SDevTmB2,
SDevTmC1, SDevTmC2, SDevTmD1, SDevTmD2, SDevTmE1, SDevTmE1,
SDevTmF1, SDevTmF2, SDevTmG1, SDevTmG2, SDevTmH1, SDevTmH2
Flow-Gated
Average
Average
Average
Average
Flow-Gated
MethaneInUse Flow-Gated
EthaneInUse Flow-Gated
PropaneInUse Flow-Gated
IsoButaneInUse Flow-Gated
NButaneInUse Flow-Gated
IsoPentaneInUse Flow-Gated
NPentaneInUse Flow-Gated
NHexaneInUse Flow-Gated
NHeptaneInUse Flow-Gated
NOctaneInUse Flow-Gated
NNonaneInUse Flow-Gated
CO2InUse Flow-Gated
N2InUse Flow-Gated
H2SInUse Flow-Gated
HeliumInUse Flow-Gated
86 Operations manual
Page 87

Operations manual
DAN-20057316 January 2019
Directory
Table 6-1: Daily log content (continued)
Data point Content Log action
WaterInUse Flow-Gated
OxygenInUse Flow-Gated
ArgonInUse Flow-Gated
H2InUse Flow-Gated
COinUse Flow-Gated
CnfgChksumValue Snapshot
CnfgChksumDate Snapshot
HeatingValueInUse Flow-Gated
PosEnergy Totalize
NegEnergy Totalize
PosEnergy Snapshot
NegEnergy Snapshot
TurbulenceA Flow-Gated
TurbulenceB Flow-Gated
TurbulenceC Flow-Gated
TurbulenceD Flow-Gated
TurbulenceE Flow-Gated
TurbulenceF Flow-Gated
TurbulenceG Flow-Gated
TurbulenceH Flow-Gated
ProfileFactor Flow-Gated
Symmetry Flow-Gated
CrossFlow Flow-Gated
PosMass Totalize
NegMass Totalize
SwirlAngle Flow-Analysis-
Gated
ProfileFactor Flow-Analysis-
Gated
SpecificGravityInUse Flow-Gated
Hourly log
The Daniel 3410 Series Gas Ultrasonic Flow Meter meter stores an hourly log record once
per hour on the hour. The meter can store up to 2400 hourly records (100 days' worth).
Model 3418 GUSM 87
Page 88

Directory Operations manual
January 2019 DAN-20057316
The user can select whether old, unread records can be overwritten by new records when
the log becomes full via the data point DoOverwriteUnreadHourlyLog.
This point can be modified using the Daniel MeterLink™ Tools > Edit/Compare
Configuration screen. The default is to overwrite old, unread records. Refer to Options for
reading daily and/or hourly log records for information on reading records and marking
records as read. The data point IsHourlyLogFull indicates whether or not the hourly log is
full and cannot overwrite old, unread records.
The data points included in the hourly log and the corresponding log action are as shown
in the table below. Data points required by the API Chapter 21 standard are marked with
an asterisk (*). For information on a particular data point, consult Daniel MeterLink online
help.
Table 6-2: Hourly log action type
Data point Content Log action
PosVolFlow* Totalize and
Snapshot
NegVolFlow* Totalize and
Snapshot
PosVolBase Totalize and
Snapshot
NegVolBase Totalize and
Snapshot
FlowTemperature* Flow-Gated
FlowPressure* Flow-Gated
AbsFlowPressure* Flow-Gated
AccumFlowTime* Totalize
AvgSndVel* Flow-Gated
PrevDayMacro1 Macro
88 Operations manual
Page 89

Operations manual Directory
DAN-20057316 January 2019
Table 6-2: Hourly log action type (continued)
Data point Content Log action
bits 30-31
bit 29
bits 26-28
bit 25
bit 24
bit 23
bit 22
bit 21
bit 20
bit 19
bit 18
bit 17
bit 16
bits 5-15
bit 4
bit 3
bit 2
bit 1
bit 0
PrevDayMacro2*: Macro
(unused)
DI1
(unused)
IsAcqMode
IsAcqModuleError
DidPowerFail
DidCnfgChksumChg
IsElecTempOutOfRange
IsElecVoltOutOfRange
IsGCAlarmPresent
IsGCCommErr
IsColocMeterCommErr
IsXdcrFiringSyncError
(unused)
IsEstimatedFlowVelocityInUse
IsEnergyRateInvalid
IsMassRateInvalid
IsQBaseInvalid
IsQFlowInvalid
Paths A-H,
8-path meters
Model 3418 GUSM 89
Page 90

Directory Operations manual
January 2019 DAN-20057316
Table 6-2: Hourly log action type (continued)
Data point Content Log action
bit 31
bit 30
bit 29
bit 28
bit 27
bit 26
bit 25
bit 24
bit 23
bit 22
bit 21
bit 20
bit 19
bit 18
bit 17
bit 16
bits 14-15
bit 13
bit 12
bit 11
bit 10
bit 9
bit 8
bit 7
bit 6
bit 5
bit 4
bit 3
bit 2
bit 1
bit 0
IsHardFailedH
IsHardFailedG
IsHardFailedF
IsHardFailedE
IsHardFailedD
IsHardFailedC
IsHardFailedB
IsHardFailedA
IsPkSwDetect
IsSNRTooLow
IsXDCRMaintReqd
IsChordLengthMismatched
(unused)
IsPressureInvalid
IsTemperatureInvalid
IsAnyLogFull
(unused)
IsColocMeterQFlowRangeErr
IsColocMeterSndSpdRangeErr
IsSevereFlowCondDetected
IsDiagSndSpdRangeErr
IsBlockageDetected
IsBoreBuildupDetected
IsLiquidDetected
IsAbnormalProfileDetected
IsReverseFlowDetected
IsSoundVelCompErr
AreGasPropInvalidInUse
IsMeasSndSpdRange
IsAvgSoundVelRangeErr
IsMeterVelAboveMaxLmt
Paths A-H, 8paths meters
SndVelA,
SndVelB,
SndVelC,
SndVelD,
SndVelE,
SndVelF,
SndVelG,
SndVelH
90 Operations manual
Flow-Gated
Page 91

Operations manual Directory
DAN-20057316 January 2019
Table 6-2: Hourly log action type (continued)
Data point Content Log action
FlowVelA,
FlowVelB,
FlowVelC,
FlowVelD,
FlowVelE,
FlowVelF,
FlowVelG,
FlowVelH
AvgFlow Flow-Gated
(Percent of good batch signals) PctGoodA1, PctGoodA2, PctGoodB1, PctGoodB2,
PctGoodC1, PctGoodC2, PctGoodD1,PctGoodD2, PctGoodE1, PctGoodE2,
PctGoodF1, PctGoodF2, PctGoodG1, PctGoodG2, PctGoodH1, PctGoodH2
QFlow Flow-Gated
QBase Flow-Gated
(Transducer Gain) GainA1, GainA2, GainB1, GainB2, GainC1, GainC2, GainD1,
GainD2, GainE1, GainE2, GainF1, GainF2, GainG1, GainG2, GainH1, GainH2
(Signal Energy) SEA1, SEA2, SEB1, SEB2, SEC1, SEC2, SED1, SED2, SEE1, SEE2,
SEF1, SEF2, SEG1, SEG2, SEH1, SEH2
(Noise Energy) NEA1, NEA2, NEB1, NEB2, NEC1, NEC2, NED1, NED2, NEE1, NEE2,
NEF1, NEF2, NEG1, NEG2, NEH1, NEH2
(Transit time standard deviation) SDevTmA1, SDevTmA2, SDevTmB1, SDevTmB2,
SDevTmC1, SDevTmC2, SDevTmD1, SDevTmD2, SDevTmE1, SDevTmE1,
SDevTmF1, SDevTmF2, SDevTmG1, SDevTmG2, SDevTmH1, SDevTmH2
Flow-Gated
Average
Average
Average
Average
Flow-Gated
MethaneInUse Flow-Gated
EthaneInUse Flow-Gated
PropaneInUse Flow-Gated
IsoButaneInUse Flow-Gated
NButaneInUse Flow-Gated
IsoPentaneInUse Flow-Gated
NPentaneInUse Flow-Gated
NHexaneInUse Flow-Gated
NHeptaneInUse Flow-Gated
NOctaneInUse Flow-Gated
NNonaneInUse Flow-Gated
CO2InUse Flow-Gated
N2InUse Flow-Gated
H2SInUse Flow-Gated
HeliumInUse Flow-Gated
Model 3418 GUSM 91
Page 92

Directory
January 2019 DAN-20057316
Operations manual
Table 6-2: Hourly log action type (continued)
Data point Content Log action
WaterInUse Flow-Gated
OxygenInUse Flow-Gated
ArgonInUse Flow-Gated
H2InUse Flow-Gated
COinUse Flow-Gated
CnfgChksumValue Snapshot
CnfgChksumDate Snapshot
HeatingValueInUse Flow-Gated
PosEnergy Totalize
NegEnergy Totalize
PosEnergy Snapshot
NegEnergy Snapshot
TurbulenceA Flow-Gated
TurbulenceB Flow-Gated
TurbulenceC Flow-Gated
TurbulenceD Flow-Gated
TurbulenceE Flow-Gated
TurbulenceF Flow-Gated
TurbulenceG Flow-Gated
TurbulenceH Flow-Gated
ProfileFactor Flow-Gated
Symmetry Flow-Gated
CrossFlow Flow-Gated
PosMass Totalize
NegMass Totalize
SwirlAngle Flow-Analysis-
Gated
ProfileFactor Flow-Analysis-
Gated
SpecificGravityInUse Flow-Gated
Audit log
The Daniel 3410 Gas Ultrasonic Flow Meters stores an audit log record whenever any
parameter affecting the flow measurement is modified. The audit log record indicates
92 Operations manual
Page 93

Operations manual
DAN-20057316 January 2019
Directory
which data point changed, the date and time of the change, and both the 'as-found' and
'as-left' values.
The meter can store up to 3000 audit records. The user can select whether old, unread
records can be overwritten by new records when the log becomes full via the data point
DoOverwriteUnreadAuditLog. This point can be modified using the Daniel MeterLink
Tools > Edit/Compare Configuration screen. The default is to overwrite old, unread
records. Refer to Options for reading audit, alarm, and/or system log records for
information on reading records and marking records as read. The data point
IsAuditLogFull indicates whether or not the audit log is full and cannot overwrite old,
unread records.
The data points monitored and collected for the audit log are as shown in Audit log
through Event log: alarm/audit below. The points are grouped and, within each group, are
listed alphabetically.
The groupings are as follows:
• AGA8
• AGA10
• Calibration
• Chord Proportions
• Co-located meter
• Communications
• Data Logging
• Expansion Correction
• Flow analysis
• Frequency, Digital, and Analog Signals
• Gas chromatograph
• General
• HART
• Indicators
• Local display
• Meter Information
• Pressure & Temperature
• Reynolds Number Calculation
• Signal Processing
• Tracking
For information on a particular data point, consult Daniel MeterLink online help.
Model 3418 GUSM 93
Page 94

Directory Operations manual
January 2019 DAN-20057316
Table 6-3: Audit log AGA 8 group monitored data points
AGA 8 data group Data Point
HCH_Method
PBase
RefPressureGr
RefPressureMolarDensity
RefTemperatureGr
RefTemperatureHV RefTemperatureMolarDensity
Tbase
Table 6-4: Audit log AGA 10 group monitored data points
AGA 8 data group Data Point
AGA10Key
IsSndVelCompEnabled SndVelCompErrLimit
94 Operations manual
Page 95

Operations manual Directory
DAN-20057316 January 2019
Table 6-5: Audit log Baseline group monitored data points
Baseline data group Data Point
FwdBaselineAvgFlow
FwdBaselineComment
FwdBaselineCrossFlow
FwdBaselineFlowPressure
FwdBaselineFlowTemperature
FwdBaselineProfileFactor
FwdBaselineSwirlAngle
FwdBaselineSymmetry
FwdBaselineTime
FwdBaselineTurbulenceA
FwdBaselineTurbulenceB
FwdBaselineTurbulenceC
FwdBaselineTurbulenceD
FwdBaselineTurbulenceE
FwdBaselineTurbulenceF
FwdBaselineTurbulenceG
FwdBaselineTurbulenceH
RevBaselineAvgFlow
RevBaselineComment
RevBaselineCrossFlow
RevBaselineFlowPressure
RevBaselineFlowTemperature
RevBaselineProfileFactor
RevBaselineSwirlAngle
RevBaselineSymmetry
RevBaselineTime
RevBaselineTurbulenceA
RevBaselineTurbulenceB
RevBaselineTurbulenceC
RevBaselineTurbulenceD
RevBaselineTurbulenceE
RevBaselineTurbulenceF
RevBaselineTurbulenceG
RevBaselineTurbulenceH
Model 3418 GUSM 95
Page 96

Directory
January 2019 DAN-20057316
Operations manual
Table 6-6: Audit log calibration group monitored data points
Calibration data
group
Data Point
AvgDlyA
AvgDlyB
AvgDlyC
AvgDlyD
AvgDlyE
AvgDlyF
AvgDlyG
AvgDlyH
CalFlag
CalMethod
DltDlyA
DltDlyB
DltDlyC
DltDlyD
DltDlyE
DltDlyF
DltDlyG
DltDlyH
FwdA0
FwdA1
FwdA2
FwdA3
FwdC0
FwdC1
FwdC2
FwdC3
FwdFlwRt1
FwdFlwRt10
FwdFlwRt11
FwdFlwRt12
FwdFlwRt2
FwdFlwRt3
FwdFlwRt4
FwdFlwRt5
FwdFlwRt6
FwdFlwRt7
FwdFlwRt8
FwdFlwRt9
FwdMtrFctr1
FwdMtrFctr10
FwdMtrFctr11
FwdMtrFctr12
96 Operations manual
Page 97

Operations manual
DAN-20057316 January 2019
Directory
Calibration data
group
Data Point
FwdMtrFctr2
FwdMtrFctr3
FwdMtrFctr4
FwdMtrFctr5
FwdMtrFctr6
FwdMtrFctr7
FwdMtrFctr8
FwdMtrFctr9
LA
LB
LC
LD
LE
LF
LG
LH
PipeDiam
RevA0
RevA1
RevA2
RevA3
RevC0
RevC1
RevC2
RevC3
RevFlwRt1
RevFlwRt10
RevFlwRt11
RevFlwRt12
RevFlwRt2
RevFlwRt3
RevFlwRt4
RevFlwRt5
RevFlwRt6
RevFlwRt7
RevFlwRt8
RevFlwRt9
RevMtrFctr1
RevMtrFctr10
RevMtrFctr11
RevMtrFctr12
RevMtrFctr2
RevMtrFctr3
Model 3418 GUSM 97
Page 98

Directory Operations manual
January 2019 DAN-20057316
Calibration data
group
Data Point
RevMtrFctr4
RevMtrFctr5
RevMtrFctr6
RevMtrFctr7
RevMtrFctr8
RevMtrFctr9
SystemDelay WtA ... WtH
XA ... XH
Table 6-7: Audit log Chord proportions group monitored data points
Chord proportions
data group
Data Point
LowFlowLmt
NumVals
PropUpdtBatches
ResetProp
Table 6-8: Audit log colocated meter group monitored data point
Colocated meter data
group
Data Point
ColocMeterMode
Table 6-9: Audit log communication group monitored data point
Communications
meter data group
Data Point
CommTCPTimeoutPortA
CommTCPTimeoutPortB
Table 6-10: Audit log data logging group monitored data point
Data logging data
group
Data Point
AlarmTurnOffHysterisisCount
AlarmTurnOffHysterisisTimeSpan
ContractHour
DailyLogInterval
HourlyLogInterval
98 Operations manual
Page 99

Operations manual Directory
DAN-20057316 January 2019
Table 6-11: Audit log Expansion correction group monitored data point
Expansion correction
data group
Data Point
EnableExpCorrPress
EnableExpCorrTemp
LinearExpansionCoef
PipeOutsideDiameter
PoissonsRatio
RefPressExpCoef
RefTempLinearExpCoef
YoungsModulus
Table 6-12: Audit log Flow analysis group monitored data point
Flow analysis data
group
Data Point
AbnormalProfileDetectionLmt
BlockageCrossFlowLmt
BlockageSymmetryLmt
BlockageTurbulenceLmtA
BlockageTurbulenceLmtB
BlockageTurbulenceLmtC
BlockageTurbulenceLmtD
BlockageTurbulenceLmtE
BlockageTurbulenceLmtF
BlockageTurbulenceLmtG
BlockageTurbulenceLmtH
ContinuousFlowAnalysisKey
FlowAnalysisHighFlowLmt
FlowAnalysisLowFlowLmt
IsAbnormalProfileDetectionEnabled
IsBlockageDetectionEnabled
IsBoreBuildupDetectionEnabled
IsLiquidDetectionEnabled
IsReverseFlowDetectionEnabled
LiquidDetectionSDevCrossFlowLmt
LiquidDetectionSDevProfileFactorLmt
LiquidDetectionSDevSymmetryLmt
ReverseFlowDetectionZeroCut
ReverseFlowVolLmt
Model 3418 GUSM 99
Page 100

Directory Operations manual
January 2019 DAN-20057316
Table 6-13: Audit log frequency, digital and analog group monitored data point
Frequency, digital &
analog signals data
group
Data Point
AO1ActionUponInvalidContent
AO1Content AO1CurrentTrimGain
AO1CurrentTrimZero
AO1Dir AO1FullScaleEnergyRate
AO1FullScaleMassRate
AO1FullScaleVolFlowRate
AO1MaxVel
AO1MinVel
AO1TestModeOutputPercent
AO1TrimCurrent
AO1TrimGainExtMeasCurrent
AO1TrimZeroExtMeasCurrent
AO1ZeroScaleEnergyRate
AO1ZeroScaleMassRate
AO1ZeroScaleVolFlowRate
AO2ActionUponInvalidContent
AO2Content
AO2CurrentTrimGain
AO2CurrentTrimZero
AO2Dir
AO2FullScaleEnergyRate
AO2FullScaleMassRate
AO2FullScaleVolFlowRate
AO2MaxVel
AO2MinVel
AO2TestModeOutputPercent
AO2TrimCurrent
AO2TrimGainExtMeasCurrent
AO2TrimZeroExtMeasCurrent
AO2ZeroScaleEnergyRate
AO2ZeroScaleMassRate
AO2ZeroScaleVolFlowRate
DI1IsInvPolarity
DO1AContent ... DO1BContent
DO1AIsInvPolarity ... DO1BIsInvPolarity
DO1PairTestEnable
DO2AContent ... DO2BContent
DO2AIsInvPolarity... DO2BIsInvPolarity
DO2PairTestEnable
FODO1Mode
FODO1Source
100 Operations manual
 Loading...