

Page 1
CSI 2140 Machinery Health™ Analyzer
User Guide
User Guide
MHM-97432, Rev 1
October 2013
Page 2

Copyright
©
2013 by Emerson Process Management. All rights reserved.
No part of this publication may be reproduced, transmitted, transcribed, stored in a retrieval system, or translated into any
language in any form by any means without the written permission of Emerson.
Disclaimer
This manual is provided for informational purposes. EMERSON PROCESS MANAGEMENT MAKES NO WARRANTY OF ANY KIND WITH
REGARD TO THIS MATERIAL, INCLUDING, BUT NOT LIMITED TO, THE IMPLIED WARRANTIES OF MERCHANTABILITY AND FITNESS
FOR A PARTICULAR PURPOSE. Emerson Process Management shall not be liable for errors, omissions, or inconsistencies that may be
contained herein or for incidental or consequential damages in connection with the furnishing, performance, or use of this material.
Information in this document is subject to change without notice and does not represent a commitment on the part of Emerson
Process Management. The information in this manual is not all-inclusive and cannot cover all unique situations.
Trademarks and Servicemarks
See http://www2.emersonprocess.com/siteadmincenter/PM%20Central%20Web%20Documents/marks.pdf
ME'scopeVES is a trademark of Vibrant Technology, Inc.
Bluetooth is a registered trademark of the Bluetooth SIG, Inc.
All other marks are property of their respective owners.
Patents
The product(s) described in this manual are covered under existing and pending patents.
CE Notice
Emerson Process Management products bearing the symbol on the product or in the user’s manual are in compliance with
applicable EMC and Safety Directives of the European Union. In accordance with CENELEC standard EN 50082-2, normal intended
operation is specified as follows: 1. The product must not pose a safety hazard. 2. The product must not sustain damage as a result
of use under environmental conditions specified in the user documentation. 3. The product must stay in or default to an operating
mode that is restorable by the user. 4. The product must not lose program memory, user-configured memory (e.g., routes), or
previously stored data memory. When apparent, the user may need to initiate a reset and/or restart of a data acquisition in
progress. A Declaration of Conformity certificate for the product is on file at the appropriate Emerson Process Management office
within the European Community.
Page 3

Contents
Contents
Chapter 1 CSI 2140 Machinery Health Analyzer ................................................................................. 1
1.1 CSI 2140 Machinery Health Analyzer overview ................................................................................ 1
1.2 User Guide overview ....................................................................................................................... 1
1.3 User Guide conventions ..................................................................................................................1
1.4 Precautions and general maintenance ............................................................................................ 2
1.5 Technical support ........................................................................................................................... 3
Chapter 2 Introduction to the analyzer ..............................................................................................5
2.1 Standard equipment ....................................................................................................................... 5
2.2 Front view ....................................................................................................................................... 6
2.3 Using the stand ............................................................................................................................... 7
2.4 Attach the shoulder strap ................................................................................................................8
2.5 Battery pack ....................................................................................................................................8
2.6 Turn the analyzer on or off ............................................................................................................ 13
2.7 Home screen .................................................................................................................................14
2.8 Backlight .......................................................................................................................................17
2.9 Touchscreen ................................................................................................................................. 17
2.10 Menu navigation .......................................................................................................................... 18
2.11 Settings ........................................................................................................................................ 21
2.12 Memory card .................................................................................................................................24
2.13 Bluetooth ......................................................................................................................................25
2.14 Utilities ......................................................................................................................................... 28
2.15 Clean the analyzer .........................................................................................................................32
2.16 CSI 2140 Four-Channel Input Adapter ........................................................................................... 32
2.17 Multiple inputs ..............................................................................................................................33
Chapter 3 Transfer files with CSI 2140 ............................................................................................. 35
3.1 AMS Machinery Manager Data Transfer .........................................................................................35
3.2 AMS Machinery Manager Standalone Data Transfer application .................................................... 35
3.3 Communication setup .................................................................................................................. 36
3.4 Routes and jobs .............................................................................................................................46
3.5 Analyzer firmware and programs .................................................................................................. 52
3.6 Screen captures ............................................................................................................................ 54
3.7 Splash screens ...............................................................................................................................55
3.8 Printing .........................................................................................................................................56
Chapter 4 Route ............................................................................................................................. 59
4.1 Route overview ............................................................................................................................. 59
4.2 Manage routes ..............................................................................................................................62
4.3 Set data collection and display parameters ................................................................................... 66
4.4 Tachometers .................................................................................................................................72
4.5 Multiple inputs and measurements ...............................................................................................74
4.6 Collect route data .........................................................................................................................75
4.7 Notes ........................................................................................................................................... 79
4.8 Plot data ....................................................................................................................................... 81
4.9 Run Analyze to collect data for a route measurement point .......................................................... 81
4.10 View the measurement point setup and history ............................................................................ 82
4.11 Route reports ................................................................................................................................84
i
Page 4

Contents
Chapter 5 Plots ............................................................................................................................... 87
5.1 View a full screen version of the plot .............................................................................................87
5.2 Select an active plot ...................................................................................................................... 87
5.3 Switch the plot type ...................................................................................................................... 88
5.4 Add or remove a cursor ................................................................................................................. 88
5.5 Change the cursor type ................................................................................................................. 89
5.6 Change the scale of the x and y axis ...............................................................................................89
5.7 Expand or compress the X axis ...................................................................................................... 90
5.8 View the highest frequency peaks on the spectrum plot ............................................................... 90
5.9 Set RPM ........................................................................................................................................ 90
5.10 View fault frequencies ...................................................................................................................91
Chapter 6 Analyze and Advanced Analyze ....................................................................................... 93
6.1 Analyze overview .......................................................................................................................... 93
6.2 Manage jobs ................................................................................................................................. 97
6.3 Set display parameters ................................................................................................................100
6.4 Multi-input measurements ......................................................................................................... 101
6.5 Sensors and inputs ...................................................................................................................... 101
6.6 Tachometers ...............................................................................................................................103
6.7 Common data collection parameters ..........................................................................................105
6.8 Collecting data using an Analysis Expert ......................................................................................111
6.9 Collect data using Manual Analyze .............................................................................................. 125
6.10 Listen to live vibration data in Analyze .........................................................................................144
6.11 Redo a measurement ..................................................................................................................146
6.12 Store data to a route or a job .......................................................................................................146
6.13 Review collected data ................................................................................................................. 147
6.14 Print an Analyze plot to AMS Machinery Manager ........................................................................147
6.15 Print an Analyze plot to a memory card ....................................................................................... 147
6.16 Reset Analyze defaults ................................................................................................................ 148
Chapter 7 Advanced Transient ...................................................................................................... 149
7.1 Advanced Transient overview ..................................................................................................... 149
7.2 Manage jobs ............................................................................................................................... 153
7.3 Sensors and inputs ...................................................................................................................... 155
7.4 Tachometers ...............................................................................................................................157
7.5 Select a section of the full transient waveform ............................................................................159
7.6 Set the number and type of plots to display ................................................................................ 161
7.7 Set data collection parameters ....................................................................................................161
7.8 Collect transient data ..................................................................................................................163
7.9 Plot data ..................................................................................................................................... 164
Chapter 8 ODS/Modal ................................................................................................................... 167
8.1 ODS/Modal overview ..................................................................................................................167
8.2 Manage jobs ............................................................................................................................... 171
8.3 Sensors and inputs ...................................................................................................................... 173
8.4 Tachometers ...............................................................................................................................175
8.5 Set up the plots ...........................................................................................................................178
8.6 Set up the job ..............................................................................................................................179
8.7 Collect ODS/Modal data ..............................................................................................................183
8.8 Display the data for a measurement point ...................................................................................186
8.9 Print an ODS/Modal plot to AMS Machinery Manager ..................................................................186
8.10 Print an ODS/Modal plot to a memory card ................................................................................. 187
ii
Page 5

Contents
Chapter 9 Balance ......................................................................................................................... 189
9.1 Balance overview ........................................................................................................................ 189
9.2 Manage jobs ............................................................................................................................... 194
9.3 Job Setup .................................................................................................................................... 197
9.4 Sensor Setup ...............................................................................................................................204
9.5 Measurement Plane Setup ..........................................................................................................208
9.6 Weight Plane Setup .....................................................................................................................211
9.7 Acquire Data ............................................................................................................................... 214
9.8 Balance correction ...................................................................................................................... 224
9.9 Trim run ......................................................................................................................................226
9.10 One-run balance job ....................................................................................................................230
9.11 Notes .......................................................................................................................................... 231
9.12 Balance summary reports ............................................................................................................232
9.13 Review balance data ................................................................................................................... 235
9.14 Manually enter balance job data ..................................................................................................236
9.15 Calculator Mode ..........................................................................................................................236
9.16 Tips and additional information .................................................................................................. 247
9.17 Balance accessories .....................................................................................................................252
Appendices and reference
Appendix A Technical specifications ................................................................................................ 263
A.1 Hardware specifications ..............................................................................................................263
A.2 Measurement specifications ....................................................................................................... 264
A.3 Input specifications .....................................................................................................................265
A.4 Connecting to a computer ..........................................................................................................266
A.5 Waste Electrical and Electronic Equipment ..................................................................................267
Glossary ........................................................................................................................................... 269
Index ................................................................................................................................................275
iii
Page 6

Contents
iv
Page 7

CSI 2140 Machinery Health Analyzer
1 CSI 2140 Machinery Health Analyzer
Topics covered in this chapter:
• CSI 2140 Machinery Health Analyzer overview
• User Guide overview
• User Guide conventions
• Precautions and general maintenance
• Technical support
1.1 CSI 2140 Machinery Health Analyzer overview
The CSI 2140 Machinery Health Analyzer is a portable vibration analyzer that lets you
quickly and easily collect data from rotating equipment in process plants, do an on-site
analysis of the machine, and export results to the AMS Suite: Machinery Health Manager
software for storage and further analysis. You can also collect data using PeakVue
technology. The analyzer supports up to four-channels to make collecting data faster and
more efficient.
™
You can add additional programs to the analyzer to further expand your analysis and
troubleshooting capabilities. Add the Advanced Analyze, Balance, ODS/Modal, and Advanced
Transient programs at any time.
1.2 User Guide overview
The CSI 2140 Machinery Health Analyzer User Guide is written for Vibration Analysts,
Reliability Data Collection Technicians, and Reliability Engineers who monitor rotating
machines in a process plant environment.
The User Guide describes how to set up the analyzer, take route and job-based
measurements, review the data, and transfer the data to AMS Machinery Manager for
storage and analysis. The User Guide is written for the single-channel, dual-channel, and
four-channel versions of the CSI 2140. Any differences are noted.
1.3 User Guide conventions
The following conventions are used throughout this User Guide.
Note
A note paragraph contains special comments or instructions.
1
Page 8

CSI 2140 Machinery Health Analyzer
CAUTION!
A caution paragraph alerts you to actions that may have a major impact on the equipment or
stored data.
WARNING!
A warning paragraph alerts you to actions that may have extremely serious consequences for
equipment and/or personnel.
1.4 Precautions and general maintenance
Any maintenance, repair, or replacement of components not listed below must be
performed by specially trained personnel at Emerson authorized service centers. Any
damage to the product caused by misuse, abuse, neglect, carelessness or modifications
performed by anyone other than Emerson may void the warranty.
Following the precautions listed below, you can perform common maintenance
procedures on the CSI 2140 and its accessories.
WARNING!
• An electrostatic discharge is possible when you clean the equipment exterior. When
cleaning the equipment exterior, do not use any abrasive or corrosive chemicals or
materials. Do not use petroleum distillates and ketone solvents, for example, acetone,
gasoline and kerosene. Use a dry, lint-free towel or cloth dampened with a mild soap
and water solution. Clean the analyzer only in a non-hazardous area.
• Charge, remove, and replace the battery pack only in a non-hazardous area.
• Use only Emerson's battery packs with the CSI 2140. The analyzer will not function if a
non-Emerson battery pack is used. Lithium-Ion batteries have very specific charging
requirements. Emerson-supplied power supplies and chargers are designed to work
with Emerson's Lithium-Ion battery pack. Using battery packs other than Emerson's
approved battery packs could not only void the warranty, but could also be hazardous.
Precautions
• To prevent permanent damage to the touchscreen on the CSI 2140, never use sharp
objects or excessive pressure with your fingers or stylus. Lightly tap the screen.
• Use only Emerson's power supplies and chargers approved for use with the CSI 2140
and Emerson's battery packs. Using any power supplies and chargers other than
Emerson's approved power supplies and battery packs could not only void the
warranty, but will also most likely damage the analyzer or the battery pack.
• Do not change or remove the battery pack in the CSI 2140 with the power supply
connected to the analyzer. The CSI 2140 or battery pack may be damaged.
• Do not use Emerson's battery packs, power supplies, and chargers with any product
other than their corresponding Emerson product.
2
Page 9

CSI 2140 Machinery Health Analyzer
• When charging the CSI 2140 with the battery pack or the battery pack by itself,
ensure the ambient temperature where the analyzer is located is 50° F to 95° F (10° C
to 35° C).
• When operating the CSI 2140 with the battery pack, ensure the ambient
temperature where the analyzer is being used is -4° F to 122° F ( -20° C to 50° C).
Prevent battery degradation
When storing the CSI 2140 with the battery pack or storing the battery pack by itself for a
prolonged period of time:
• Ensure the ambient temperature where the battery pack is located is -4° F to 95° F
( -20° C to 35° C). Due to the chemical composition of Lithium-Ion battery
technology, over time there will be some degradation that results in a reduced
charge capacity and performance. This degradation is unavoidable and irreversible.
Prolonged storage at temperatures outside this range, especially temperatures
above the high end, speeds up the degradation process.
• Ensure the battery capacity is approximately 40 percent and periodically recharge
the battery pack (to approximately 40 percent charge capacity) during storage to
ensure the battery does not drain to low levels.
• Disconnect the power supply from the CSI 2140 or the battery pack.
Prevent damage
To prevent damage to the analyzer:
• Do not connect a signal larger than 0 to 24 volts into the Accel input of the CSI 2140.
• Do not connect a signal larger than +/- 24 volts into the Volts / Tach input of the CSI
2140.
1.5 Technical support
If you have a problem, explain the exact nature of your problem. For example, what are the
error messages? (If possible, take a screen capture of the error message.) When do they
occur? Know what you were doing when the problem occurred. For example, what mode
were you in? What steps did you go through? Try to determine before you call whether the
problem is repeatable.
Hardware Technical Help
Please have the number of the current version of your firmware ready when you call. To
view the firmware version of the CSI 2140, select Home > ALT > F1 Version.
Software Technical Help
Please provide the software version numbers of your Microsoft® Windows operating
system and AMS Suite: Machinery Health Manager. In AMS Machinery Manager, select Help
> About.
Please be at your computer when you call. We can serve you better when we can work
through the problem together.
3
Page 10

CSI 2140 Machinery Health Analyzer
Software Technical Support
Emerson provides technical support through the following for those with an active support
agreement:
• Telephone assistance and communication via the Internet.
• Mass updates that are released during that time.
• Interim updates upon request. Please contact Emerson Technical Support for more
information.
Contact us
For Emerson Technical Support and Customer Service Toll Free numbers, email addresses,
and hours of operation, please visit http://www.sureservice.com/TechnicalSupport.
4
Page 11

2 Introduction to the analyzer
Topics covered in this chapter:
• Standard equipment
• Front view
• Using the stand
• Attach the shoulder strap
• Battery pack
• Turn the analyzer on or off
• Home screen
• Backlight
• Touchscreen
• Menu navigation
• Settings
• Memory card
• Bluetooth
• Utilities
• Clean the analyzer
• CSI 2140 Four-Channel Input Adapter
• Multiple inputs
Introduction to the analyzer
2.1 Standard equipment
Unpack the analyzer and compare the contents of the package to the list below. If you find
a discrepancy, contact your local sales representative immediately.
• Firmware media
• Micro USB cable to connect to AMS Machinery Manager
• Power supply to charge the battery pack
• Screen protector
• Shoulder strap
Note
The CSI 2140 does not support cables with 25-pin connectors or cables that connect to the Volts/
Tach input from previous CSI vibration analyzers.
5
Page 12
Introduction to the analyzer
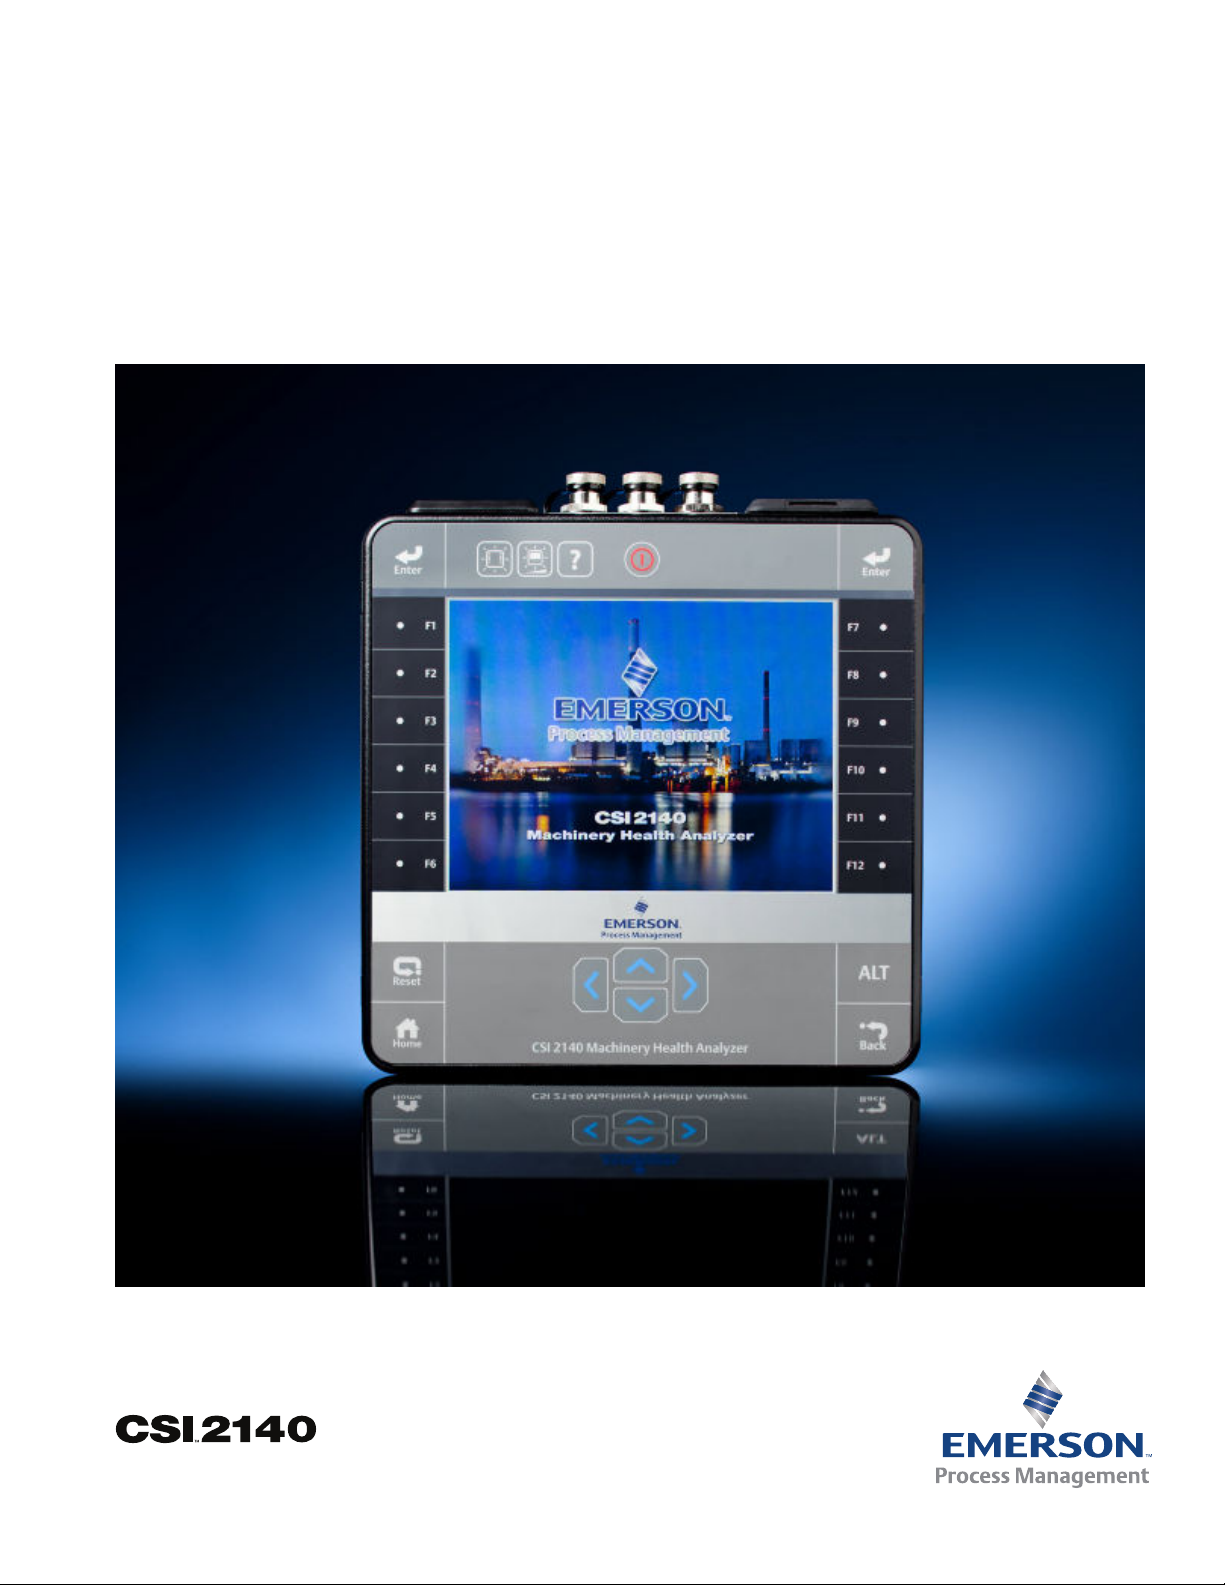
2.2 Front view
CSI 2140 front panelFigure 2-1:
A. Home key - Return to the Home screen from any program.
B. Reset key - Return to the main menu in a program.
C. Function keys - Display menu options.
D. Enter key - Select a menu or option.
E. Keypad backlight key - Turn on the backlight under the keys.
F. LCD backlight key - Set the backlight for the LCD touchscreen.
G. Help key - Display Help text for a key.
H. Power key -Turn the analyzer on or off, or put the analyzer in standby.
I. Battery LED - Display a green LED if the battery pack is charged, or an orange LED if the battery pack
is charging.
J. Status LED - Flash a blue LED each time you press a key or option. The LED is solid blue when the
analyzer is in standby.
K. Arrow keys - Move through menus.
L. ALT key - Display an alternate screen, if available.
M. Back key - Back up to the main menu in a program.
6
Page 13
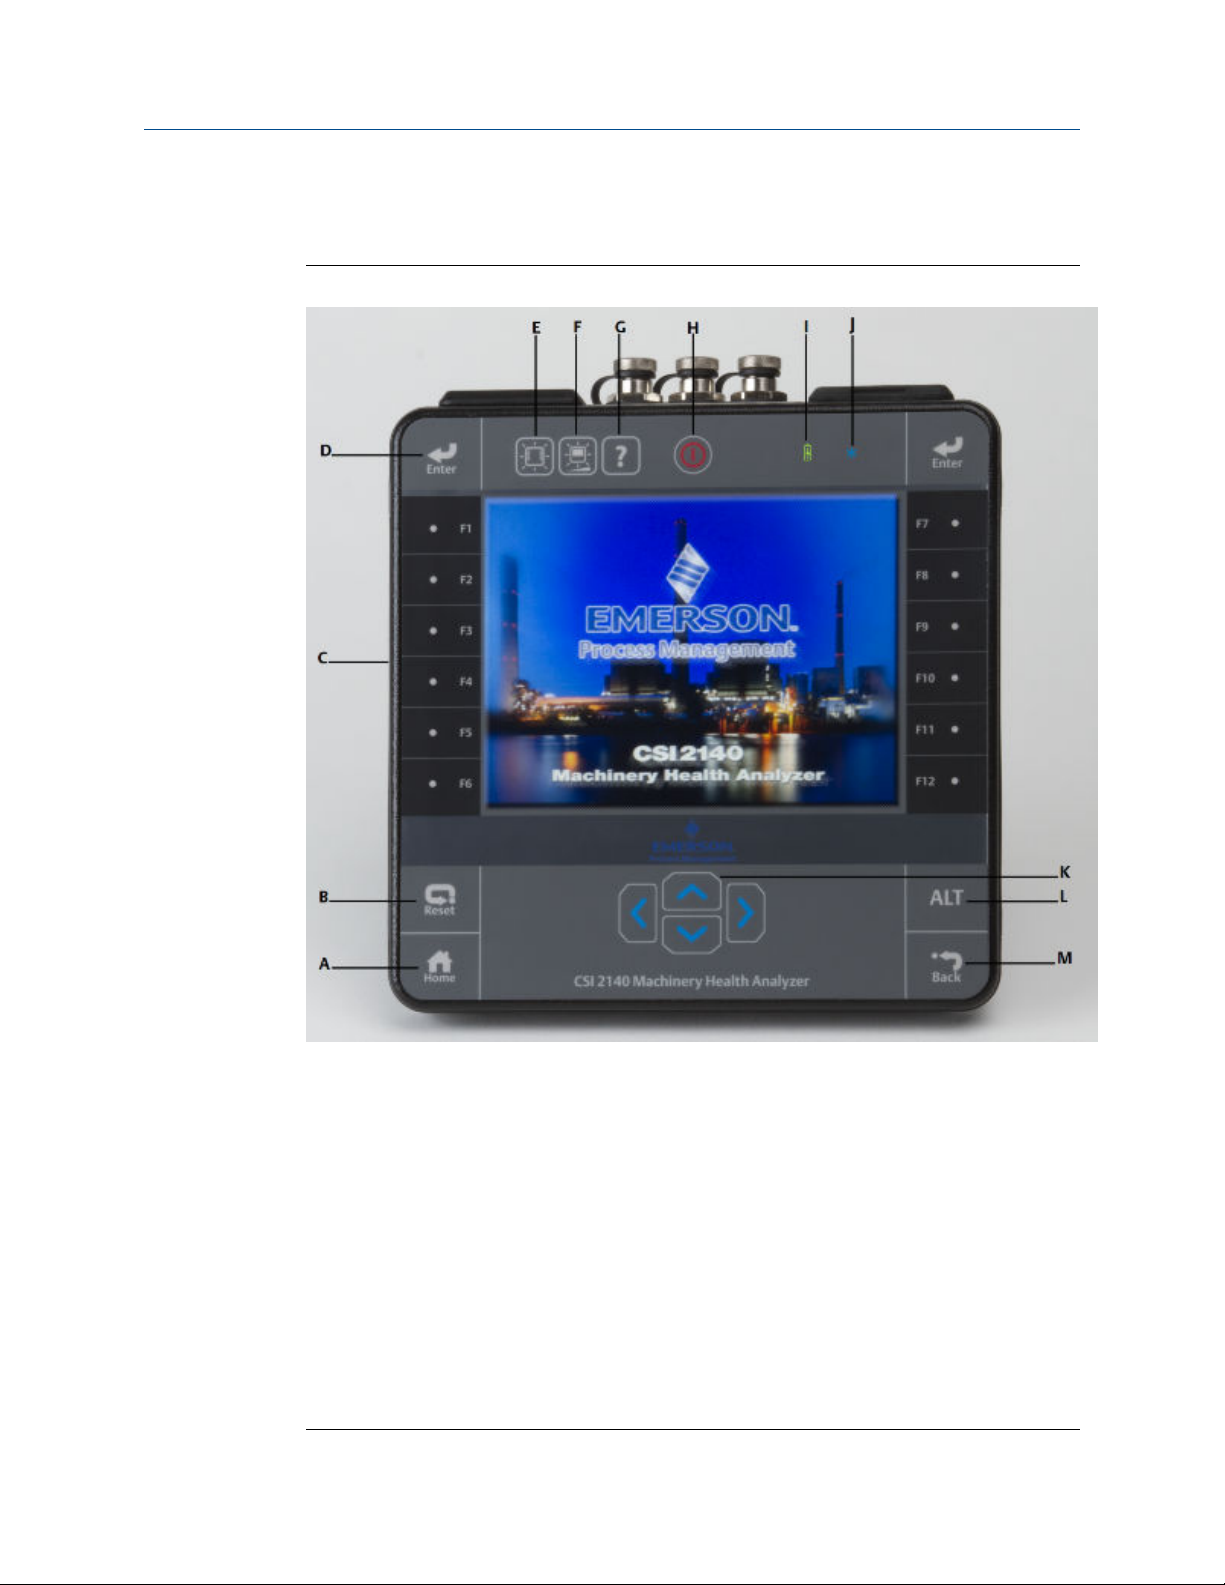
2.2.1 Top view
A. Power supply connector.
B. Ethernet port.
C. Micro USB port.
D. Wireless LED.
E. Bluetooth® LED.
Introduction to the analyzer
ConnectorsFigure 2-2:
CAUTION!
To prevent damage to the analyzer:
• Do not connect a signal larger than 0 to 24 volts into the Accel input of the CSI 2140.
• Do not connect a signal larger than +/- 24 volts into the Volts / Tach input of the CSI
2140.
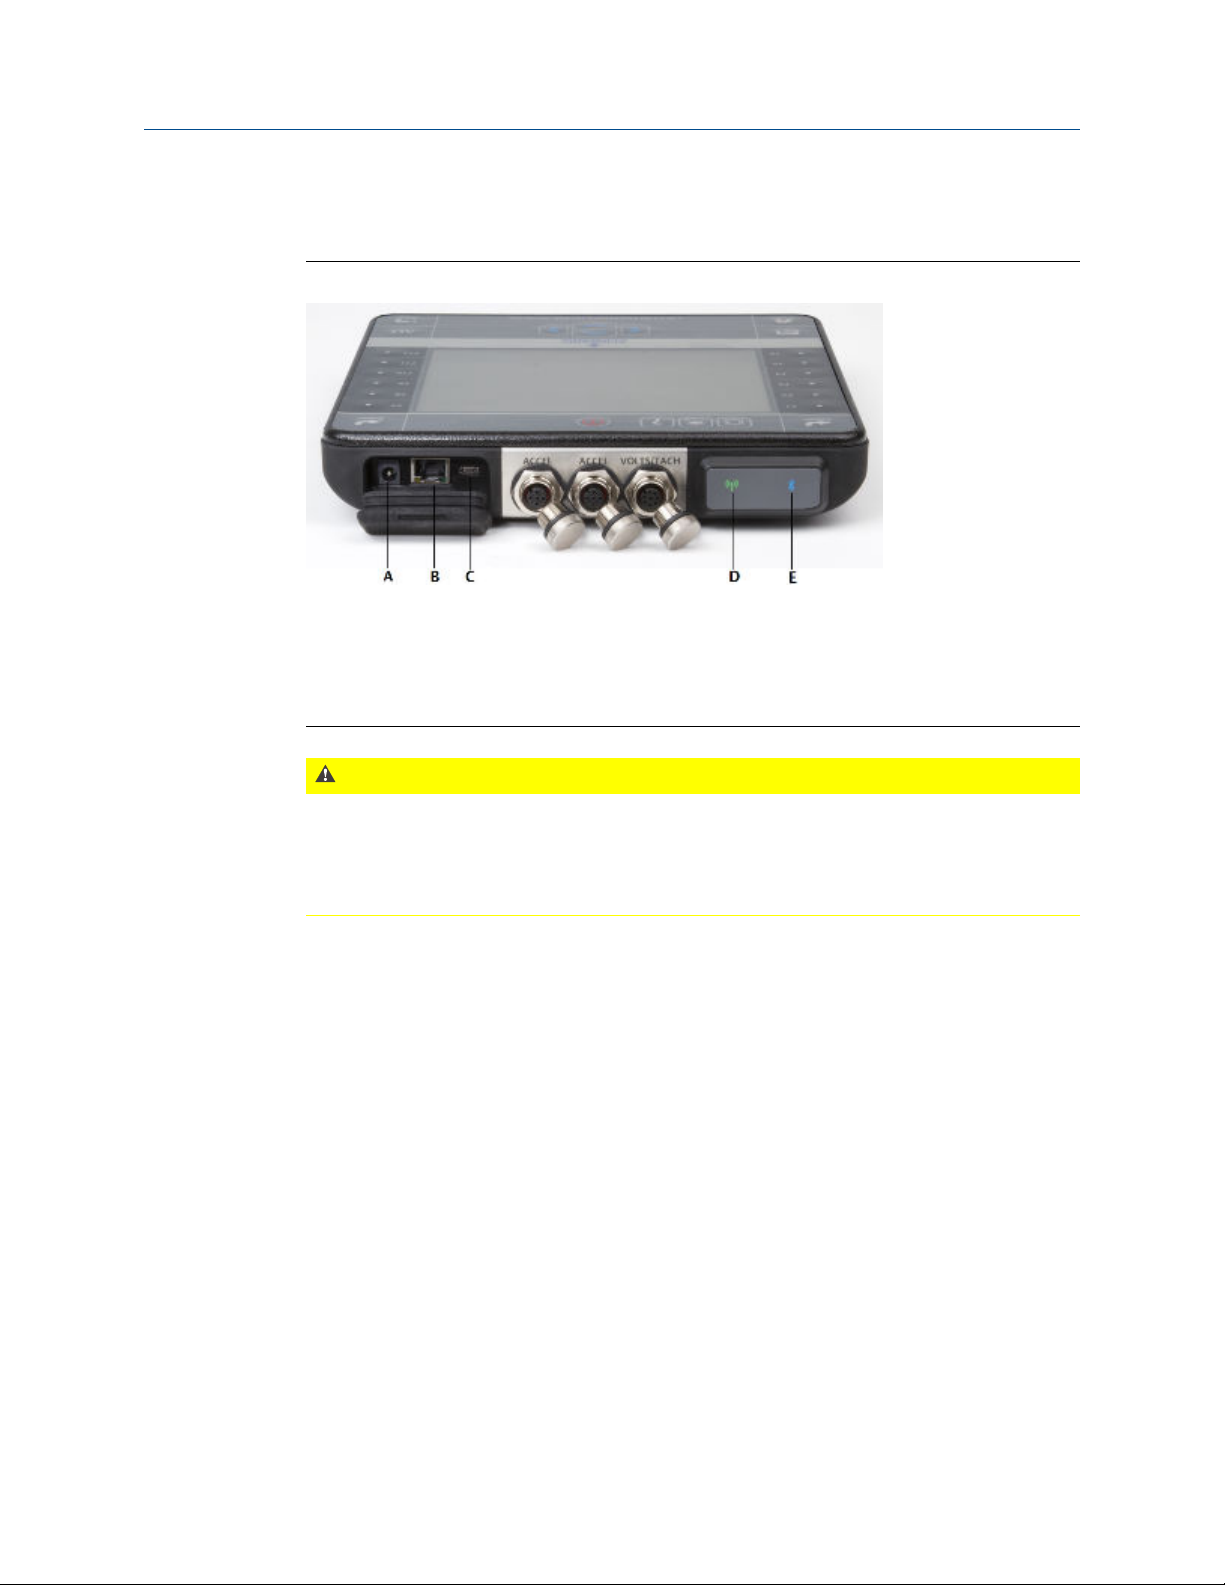
2.3 Using the stand
1. To put the stand in the upright position, grab the stand and pull up until the stand
locks.
2. To release the stand, place the analyzer face down, grab the base of the stand, and
gently pull.
The lock releases, and you can push the stand toward the analyzer.
7
Page 14
Introduction to the analyzer
Release the standFigure 2-3:
2.4 Attach the shoulder strap
1. Press and hold the button on the strap connector, and insert it into the connectors
on the sides of the analyzer or the CSI 2140 Four-Channel Input Adapter, if attached.
2. To release the strap, press and hold the button on the connector and then pull.
2.5 Battery pack
A rechargeable Lithium-Ion battery pack powers the analyzer. A typical charge should last
for more than 8 hours of continuous use. The analyzer displays a low-battery warning
when the remaining charge reaches a set level; the default is 15 percent. If the battery
pack fully discharges, you do not lose any data or settings.
You do not need to discharge or calibrate the battery pack. The hardware optimizes
battery pack performance. Contact technical support if you experience any problems or
for instructions to replace the battery pack.
WARNING!
Use only Emerson battery packs with the CSI 2140. The analyzer will not function if a nonEmerson battery pack is used. Lithium-Ion batteries have very specific charging requirements.
Emerson power supplies and chargers are designed to work with the Emerson Lithium-Ion
battery pack. Using battery packs other than approved Emerson battery packs could not only
void the warranty, but could also be hazardous.
8
Page 15
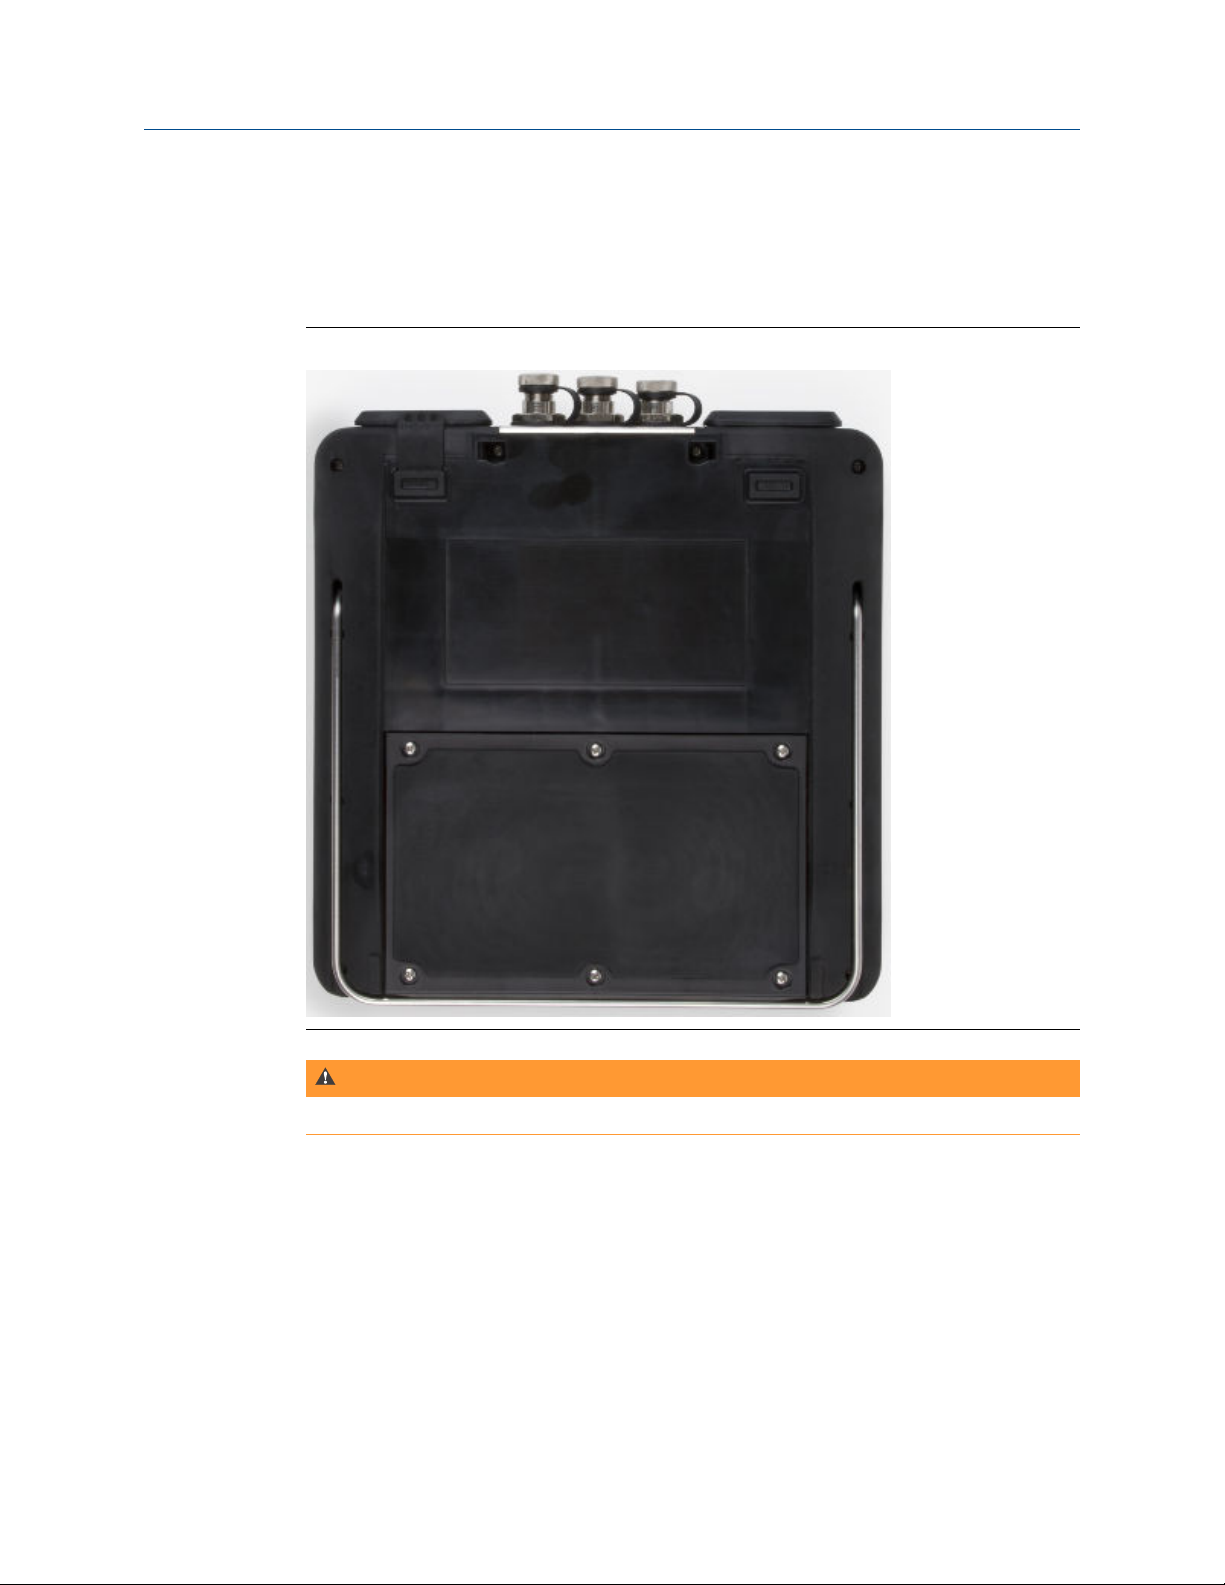
2.5.1 Access the battery pack
The battery pack is located on the back of the analyzer. To access the battery, remove the
six screws that attach it to the analyzer.
Six battery pack screwsFigure 2-4:
Introduction to the analyzer
WARNING!
Remove the battery pack only in a non-hazardous area.
2.5.2 Battery pack and power supply precautions
Understand and follow the precautions below before using the battery pack and power
supply.
• Do not use Emerson's battery packs, power supplies, and chargers with any product
other than their corresponding Emerson product.
9
Page 16

Introduction to the analyzer
• Use only Emerson's power supplies and chargers approved for use with the CSI 2140
• Do not change or remove the battery pack in the CSI 2140 with the power supply
• When charging the CSI 2140 with the battery pack or the battery pack by itself,
• When operating the CSI 2140 with the battery pack, ensure the ambient
• Use only Emerson's battery packs with the CSI 2140. The analyzer will not function if a
• Charge, remove, and replace the battery pack only in a non-hazardous area.
and Emerson's battery packs. Using any power supplies and chargers other than
Emerson's approved power supplies and battery packs could not only void the
warranty, but will also most likely damage the analyzer or the battery pack.
connected to the analyzer. The CSI 2140 or battery pack may be damaged.
ensure the ambient temperature where the analyzer is located is 50° F to 95° F (10° C
to 35° C).
temperature where the analyzer is being used is -4° F to 122° F ( -20° C to 50° C).
WARNING!
non-Emerson battery pack is used. Lithium-Ion batteries have very specific charging
requirements. Emerson-supplied power supplies and chargers are designed to work
with Emerson's Lithium-Ion battery pack. Using battery packs other than Emerson's
approved battery packs could not only void the warranty, but could also be hazardous.
2.5.3 View the battery charge level
View the remaining charge level from the analyzer Home screen or from the LEDs on the
battery pack.
Procedure
Do one of the following:
• From the Home screen, view the remaining battery charge on the lower left side of the
screen.
• Press the button on the inside of the battery pack. Each LED indicates 20 percent
remaining charge.
10
Page 17

Introduction to the analyzer
Check the remaining charge from the battery packFigure 2-5:
2.5.4 Charge the battery pack
The analyzer is fully operational during charging. As a best practice, charge the battery
pack frequently. Emerson recommends you charge the battery pack the night before you
intend to use it.
WARNING!
• Use only Emerson-supplied power supplies and chargers approved for use with the CSI
2140 and Emerson battery packs. Using any power supplies and chargers other than
approved Emerson power supplies and battery packs could not only void the warranty,
but will also most likely damage the analyzer or the battery pack.
• When charging the CSI 2140 with the battery pack or the battery pack by itself, ensure
the ambient temperature where the analyzer is located is 50° F to 95° F (10° C to 35° C).
• Charge the battery pack only in a non-hazardous area.
Procedure
1. Remove the rubber plug on the top of the analyzer.
2. Insert the power supply connector into the analyzer. The analyzer can be powered
on or off.
3. Plug the AC connector on the power supply into a standard AC outlet, ranging from
100 VAC to 250 VAC, 50-60 Hz. A full recharge may take four hours.
11
Page 18
Introduction to the analyzer
The back of the analyzer may feel warm during charging. The power supply can
remain connected to the analyzer after charging completes. You cannot overcharge
the battery pack.
2.5.5 LED for charging the battery pack
The battery pack LED on the front of the analyzer shows the progress when charging the
battery pack. The LED is located to the right of the Power key.
LED color Battery pack status
Orange Charging
Green Fully charged
2.5.6 Remove or change the battery pack
The analyzer gives you unlimited usage by changing the battery pack with a fully charged
spare battery pack. When you change the battery pack, the data saved in the analyzer is
not affected.
CAUTION!
Do not remove or change the battery pack with the power supply connected to the analyzer.
Damage may occur to the analyzer or the battery pack.
WARNING!
• Use only Emerson's battery packs with the CSI 2140. The analyzer will not function if a
non-Emerson battery pack is used.
• Remove or change the battery pack only in a non-hazardous area.
Procedure
1. Turn off the analyzer and remove the power supply, if connected.
2. Set the analyzer face down on a level surface.
3. Lift up the stand.
4. On the back of the analyzer, remove the six screws that attach the battery pack to
the analyzer.
5. Carefully remove the battery pack from the battery compartment.
6. Insert the new battery pack and ensure it aligns with the contacts inside the battery
compartment on the analyzer.
7. Insert and tighten the six screws on the back panel.
12
Page 19

2.5.7 Battery pack maintenance
To prevent any significant loss of the battery capacity when storing the analyzer with the
battery pack or storing the battery pack by itself for a prolonged period of time:
• Ensure the ambient temperature where the battery pack is located is -4° F to 95° F
( -20° C to 35° C). Due to the chemical composition of Lithium-Ion battery
technology, over time there will be some degradation that results in a reduced
charge capacity and performance. This degradation is unavoidable and irreversible.
Prolonged storage at temperatures outside this range, especially temperatures
above the high end, speeds up the degradation process.
• Ensure the battery capacity is approximately 40 percent and periodically recharge
the battery pack (to approximately 40 percent charge capacity) during storage to
ensure the battery does not drain to low levels.
• Disconnect the power supply from the CSI 2140 or the battery pack.
2.5.8 Conserve battery pack power
• Set timers to automatically put the analyzer in standby or turn off the backlight after
a set period of inactivity, such as not pressing any keys or not collecting data. You
can also put the analyzer into standby mode by quickly pressing the power key.
• Set the LCD backlight intensity to "medium". If you use the "High" setting, Emerson
recommends setting the backlight timer to 30 seconds.
Introduction to the analyzer
These options are available on the General Analyzer Setup screen. Press Home > ALT > F2
General Setup.
2.6 Turn the analyzer on or off
You can set the number of seconds to hold the power key to shut down the analyzer. See
Section 2.11.6.
Procedure
Press and hold the power key
The Home screen appears when you turn on the analyzer. If you were working in a
program before shutting down, that program appears.
2.6.1 Hard reboot
Do a hard reboot only if the analyzer is unresponsive.
Procedure
Press and hold the power key
down.
to turn the analyzer on or off.
for approximately 10 seconds until the analyzer shuts
13
Page 20

Introduction to the analyzer
2.6.2 Standby
Standby is similar to the standby mode on a computer. The analyzer is powered on, but the
backlight is off to conserve battery power. You can use standby mode to lock the
touchscreen and keys when you are carrying the analyzer. You can manually put the
analyzer in standby, or you can wait for the standby timer. See Section 2.11.2. The standby
timer also shuts off the keypad backlight.
Note
After 60 minutes in standby, the analyzer shuts down. You do not lose any data when this occurs.
Procedure
1.
To enter standby, quickly press (1 second) the power key , or wait for the
standby timer to expire.
The LCD backlight and keypad backlight turn off. The blue LED on the analyzer's
front panel is lit.
2.
To leave standby, quickly press the power key .
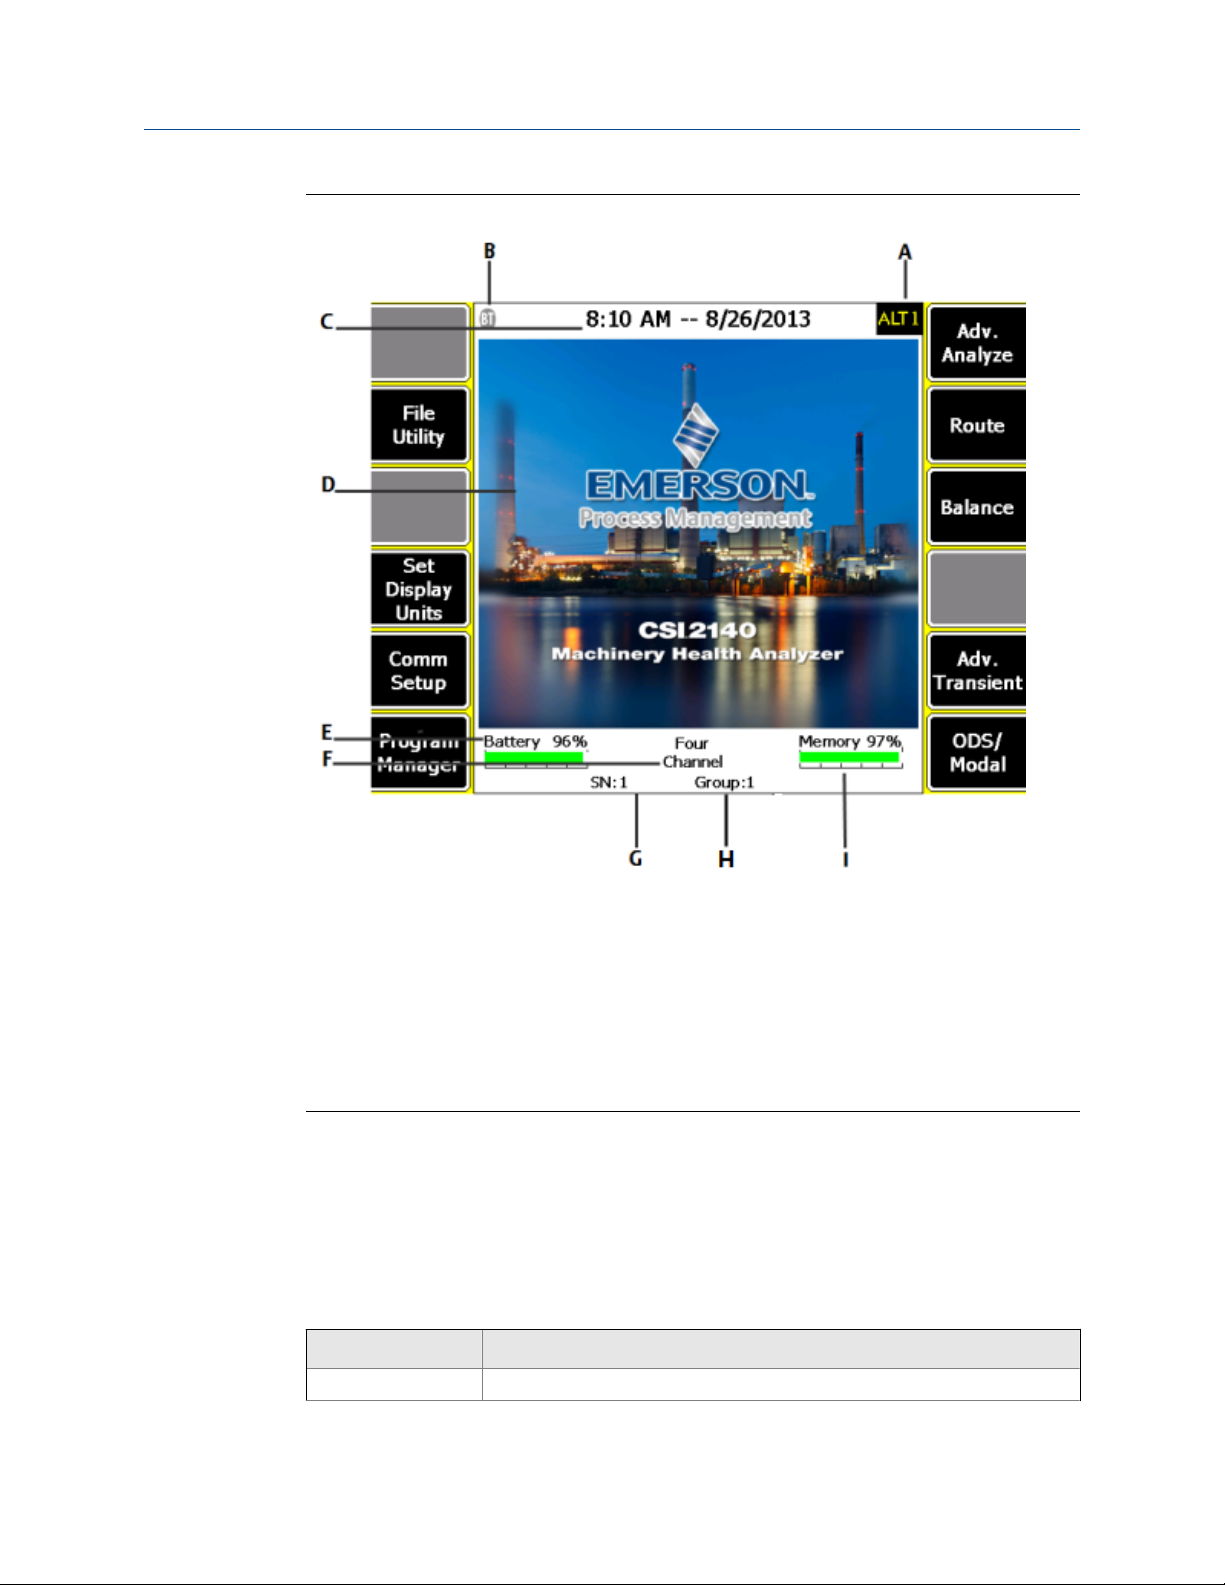
2.7 Home screen
The Home screen appears when you turn on the analyzer by pressing the power key.
14
Page 21
Introduction to the analyzer
Home screenFigure 2-6:
A. An alternate screen (ALT) includes additional options.
B. Bluetooth icon to indicate when the analyzer's Bluetooth radio is on, off, or connected to a device.
C. Current time and date.
D. Default splash screen.
E. Remaining battery pack charge.
F. Number of supported channels for the analyzer.
G. Serial number.
H. Group number for updating multiple analyzers at one site.
I. Available internal memory.
Home screen programs and settings
The Home screen has two alternate screens that display programs and settings. ALT1 or
ALT2 appears at the top of the screen and the function keys are outlined in yellow. To
switch ALT screens, press the ALT key or the ALT text on the touchscreen.
ALT1 keys
Option Description
F1 Intentionally blank.
15
Page 22

Introduction to the analyzer
Option Description
F2 File Utility Copy, delete, or move routes or jobs saved in the analyzer internal memory
F3 Intentionally blank.
F4 Set Display Units Set the default display units for the measurement values and plots.
F5 Comm Setup Set the communication options to connect the analyzer to AMS Machinery
F6 Program Manager Update the programs, add new programs, delete unused programs, or
F7 Analyze or Adv.
Analyze
F8 Route Collect data using a route created in AMS Machinery Manager. You cannot
F9 Balance Balance a machine. Balance is an optional program that you load onto the
F10 Intentionally blank.
F11 Adv. Transient Collect large, unbroken time waveforms similar to a digital recorder.
F12 ODS/Modal Collect cross channel data for animated analysis of a machine. ODS/Modal is
or a memory card.
Manager. You can also set up the Bluetooth functionality.
change the splash screen. A password is required to delete programs.
Collect data using predefined measurements called Analysis Experts, or
create your own measurements in Manual Analyze.
create or modify routes on the analyzer.
analyzer.
Advanced Transient is an optional program that you load onto the analyzer.
an optional program that you load onto the analyzer.
ALT2 keys
Option Description
F1 Version View the versions of the firmware and programs installed on your analyzer.
F2 General Setup Modify settings for the analyzer screen, keys, and print functionality.
F3 Set Time Set the time and date in the analyzer.
F4 Memory Utility View information about the internal memory.
F5 Battery Utility View information about the battery pack.
F6 View Error Log View information about any errors the firmware generated.
F7 Connect For
Printing
F8 Intentionally blank.
F9 Intentionally blank.
F10 Intentionally blank.
F11 Intentionally blank.
F12 Intentionally blank.
Connect to AMS Machinery Manager to print files or screen captures.
16
Page 23

2.7.1 Return to the Home screen
Press the Home key on the front of the analyzer.
2.8 Backlight
2.8.1 Set the LCD backlight
By default, the analyzer uses the Auto backlight mode to automatically adjust the backlight
intensity based on the light in your environment. You can disable the automatic
adjustments. You can set a timer to disable the backlight after a period of inactivity. See
Section 2.11.3.
Note
A higher backlight intensity decreases the battery pack life. For optimum battery pack life, set the
backlight to the medium setting.
Introduction to the analyzer
Change the backlight using the LCD backlight key or the General Setup menu on the Home
screen.
Procedure
1.
To set the backlight using the LCD backlight key , press the key to select a
setting.
Each time you press the key, the backlight changes. The default is Auto.
2. To set the backlight from the Home screen:
a. Press Home > ALT > F2 General Setup > F8 Set Backlight.
b. Use the up and down arrow keys to select a setting.
c. Press Enter.
2.8.2 Set the keypad backlight
If your area has low light, turn on the keypad backlight to illuminate the analyzer's keys.
Procedure
Press the keypad backlight key
to turn the light on or off.
2.9 Touchscreen
The touchscreen and function keys let you access the menu options and enter text. If the
touchscreen does not respond accurately, calibrate the touchscreen.
17
Page 24

Introduction to the analyzer
WARNING!
Clean the touchscreen only in a non-hazardous area. An electrostatic discharge is possible
when you clean the equipment exterior. Do not use any abrasive or corrosive chemicals or
materials. Do not use petroleum distillates and ketone solvents, for example, acetone, gasoline
and kerosene. Use a dry, lint-free towel or cloth dampened with a mild soap and water
solution.
Note
To prevent permanent damage to the touchscreen, never use sharp objects or excessive pressure
with your fingers or stylus. Lightly tap the screen.
2.9.1 Lock or unlock the touchscreen
You can lock the touchscreen and only use the keys on the front of the analyzer to select
menus and options. Lock the screen to prevent inadvertently pressing buttons when you
carry the analyzer. You can also put the analyzer in standby to lock the touchscreen.
Procedure
Press Home > ALT > F2 General Setup > F9 Set Touch Screen to lock or unlock the screen.
The touchscreen is locked. You can still use the buttons on the side of the screen to select
options.
2.9.2 Calibrate the touchscreen
Calibrate the touchscreen to respond to your touch. You can use your finger or a stylus.
Calibrate if the touchscreen does not respond accurately.
Procedure
1. Press Home > ALT > F2 General Setup > F10 Calibrate Touch Screen.
2. Touch in the center of each crosshair.
3. Press Enter.
2.10 Menu navigation
The analyzer has a touchscreen and function keys for navigating and selecting menu
options. The menu options appear on the left and right sides of the screen and correspond
to the function keys on the analyzer. When you press a key or an option on the
touchscreen, a blue status LED flashes on the analyzer's front panel.
18
To cancel or return to a previous screen, press the Back key. Press the Home key to return to
the Home screen.
Page 25

2.10.1 ALT screens
Each screen displays up to 12 menu options, but additional options may be available on
alternate screens. ALT1 or ALT2 appears at the top of the screen and the function keys are
outlined in yellow. To switch screens, press the ALT key or the ALT label on the screen.
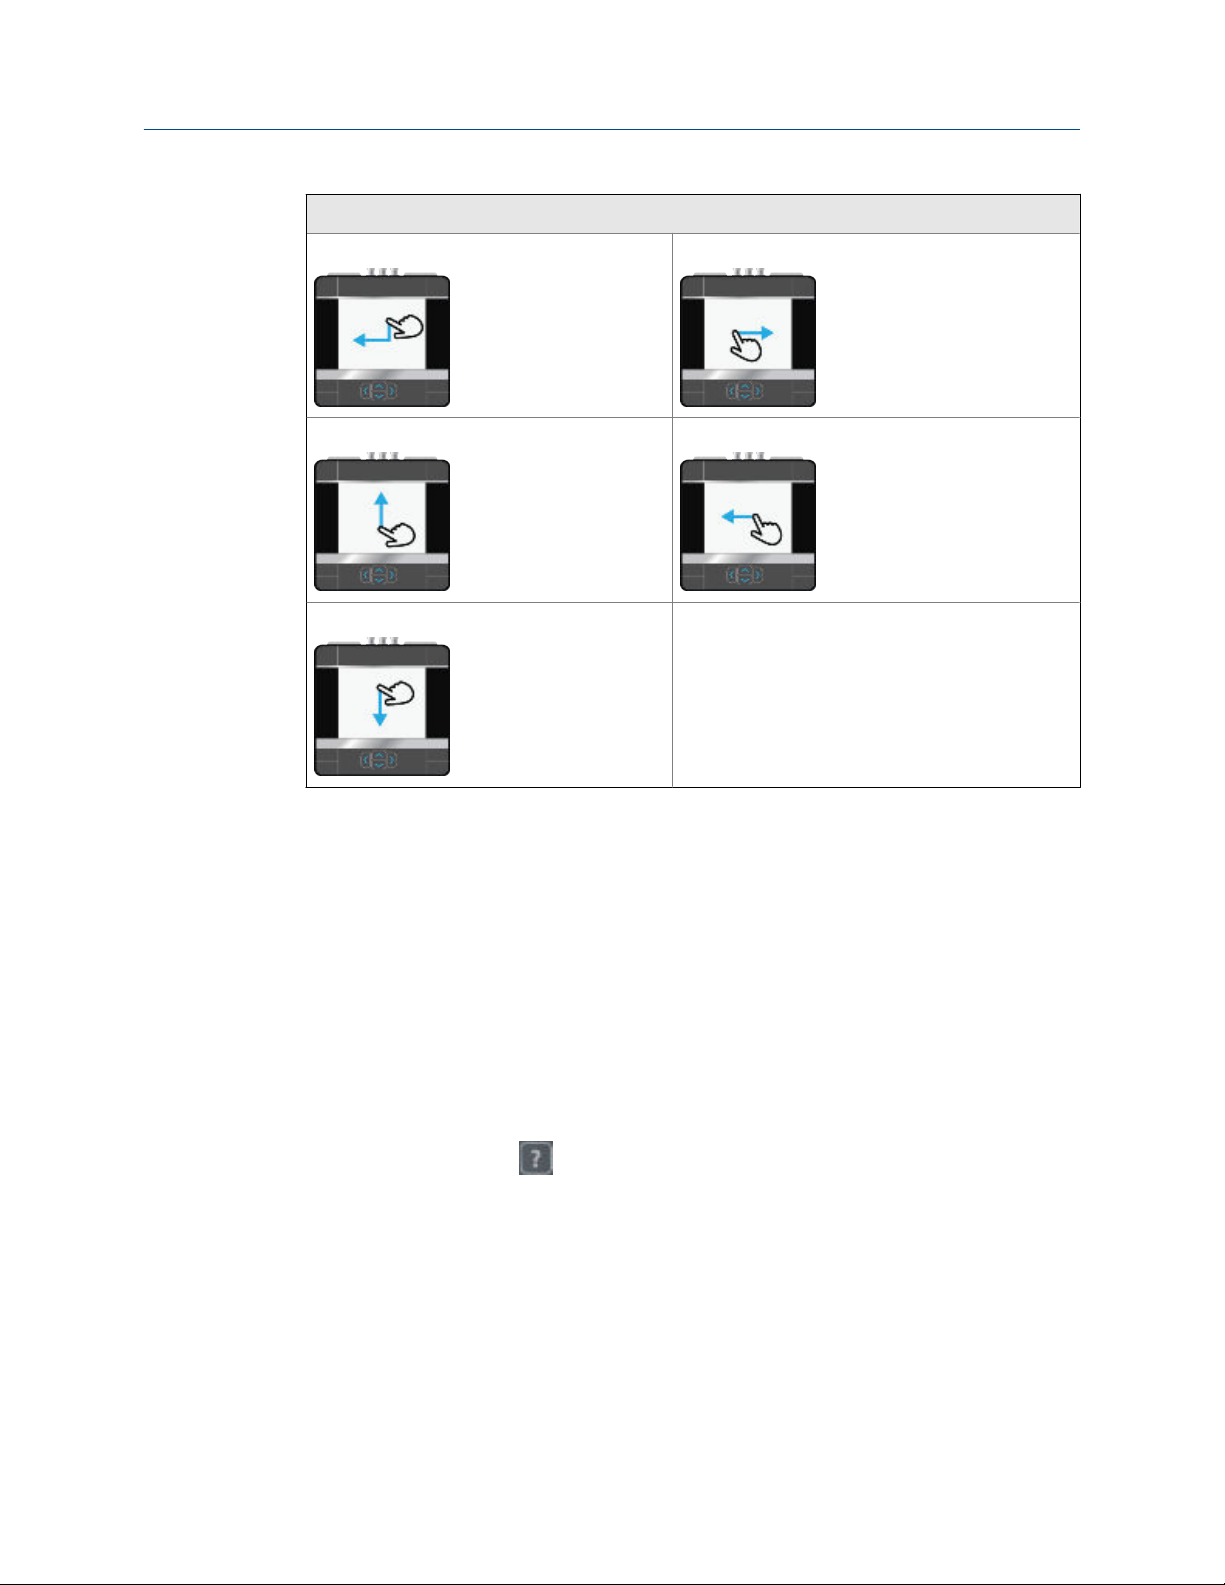
2.10.2 Gestures
You can use gestures rather than pressing the keys to select menu options. The gestures
match the arrows on the corresponding analyzer keys. You can use gestures on all screens
that support the corresponding keys. Use consistent pressure when you press in the
middle of the touchscreen as indicated below.
Gestures for plots
Note
You cannot use gestures when using Log for the plot axis. The Enter gesture does not work on plots.
Working with plots
Activate a plot Touch the desired plot when the analyzer displays multiple
Add a cursor Touch anywhere on the plot.
Move a cursor Swipe left or right, or touch anywhere on the plot. On a
Increase or decrease the plot
amplitude
Introduction to the analyzer
plots.
waveform, the cursor moves 20 percent of the waveform. On
a spectrum, the cursor moves to the next highest peak. To
clear a cursor, use the Clear Cursor option on the plot's ALT
screen.
Swipe up or down.
Gestures for menus and text
Entering text or selecting options
Use upper or lower case
characters
Scroll items in a list Swipe up or down. This also applies to the options on the
Tip
Use consistent pressure when you press in the middle of the touchscreen as indicated below.
Swipe up or down.
Balance main menu.
19
Page 26
Introduction to the analyzer
Gestures
Enter Right arrow (swipe right)
Up arrow (swipe up) Left arrow (swipe left)
Down arrow (swipe down)
2.10.3 Entering text
If a menu option lets you enter text, the screen lists a set of characters. Repeatedly press
the key or touchscreen until the desired character appears. Wait until the cursor moves
and then enter the next character.
2.10.4 Display Help
Use the Help key to access information about a menu option or key.
Procedure
1.
Press the Help key .
2. Press a menu option.
The analyzer displays the Help text for that menu option.
3. Press Enter to close the Help text.
20
Page 27

Introduction to the analyzer
2.11 Settings
View and modify the default global settings from the Home ALT1 or ALT2 screens.
2.11.1 Enable or disable the beeper for key presses and status indicators
You can enable or disable the beeper for status indicators or key presses.
Procedure
1. Press Home > ALT > F2 General Setup.
2. Press F2 Set Keypad Beeper to enable or disable the sound when you press a key.
3. Press F3 Set Status Beeper to enable or disable sounds for alerts and status indicators.
4. Press Enter.
2.11.2 Set the standby timer
To conserve battery pack power, set the timer to automatically put the analyzer in standby
after a period of inactivity, such as no data collection or key presses. Standby is similar to
the standby mode on a computer. The analyzer is powered on, but the backlight is off to
conserve battery power. The standby timer also shuts off the keypad backlight. The
standby timer is disabled when the power supply is connected to and powers the analyzer.
The blue LED displays on the front of the analyzer when the analyzer is in standby. To leave
standby, quickly press the power key.
Note
After 60 minutes in standby, the analyzer shuts down. You do not lose any data when this occurs.
Procedure
1. Press Home > ALT > F2 General Setup > F4 Set Standby Time.
2. Enter the number of minutes between 1 and 30.
The default is 10 minutes.
3. Press Enter.
2.11.3 Set the backlight timer
To conserve battery pack power, set the timer to automatically turn off the backlight after
a specified period of inactivity, such as no data collection or key presses. After the timer
expires and the backlight is turned off, press a key or the screen to turn on the LCD
backlight and reset the timer. The timer is disabled when the power supply is connected to
and powers the analyzer.
Unlike standby mode, the blue LED on the front of the analyzer does not display when the
backlight is off.
21
Page 28

Introduction to the analyzer
Procedure
1. Press Home > ALT > F2 General Setup > F5 Set Backlight Time.
2. Enter the number of seconds between 0 and 120.
A 0 disables this feature. The default is 30 seconds.
3. Press Enter.
2.11.4 Enable or disable printing to AMS Machinery Manager or a memory card
You can enable or disable printing on the analyzer. When printing is enabled, you can send
routes, jobs, and summary reports to AMS Machinery Manager or an inserted SD (Secure
Digital) memory card. By default, the analyzer can send files to AMS Machinery Manager.
Procedure
1. Press Home > ALT > F2 General Setup > F6 Set Print Mode.
2. Use the up and down arrow keys to select an option.
Option Description
Send to PC Send files between the analyzer and AMS Machinery Manager. Files
can include routes, jobs, screen captures, splash screens, or summary
reports. The default is Send to PC.
Store as BMP on CARD Save the file as a .bmp to the SD memory card.
Store as JPG on CARD Save the file as a .jpg to the SD memory card.
Print Off Disable printing. Print options, such as the F7 Connect For Printing
option on the Home ALT2 screen, are not available.
3. Press Enter.
2.11.5 Set the low-battery warning level
When the battery pack discharges to the specified percent, the analyzer displays a
message telling you to recharge the battery pack.
Procedure
1. Press Home > ALT > F2 General Setup > ALT > F3 Set Warning Level.
2. Enter a percent between 0 and 99.
A 0 disables this feature. The default is 15 percent.
22
3. Press Enter.
Page 29

2.11.6 Configure the power key
You can set the number of seconds you must hold the power key to shut down the
analyzer. This option does not change the hold time to put the analyzer in standby.
Increase the number of seconds to prevent users from accidentally pressing the power key
and shutting down the analyzer.
Procedure
1. Press Home > ALT > F2 General Setup > ALT > F4 Set Hold Time.
2. Enter a number between 1 and 5 seconds.
The default is 3 seconds.
3. Press Enter.
2.11.7 Set the time and date
The analyzer's time must be within 15 minutes of the computer's time for the analyzer and
computer to communicate successfully. If there is a time conflict, the analyzer prompts
you to automatically synchronize the analyzer with the computer's time.
Introduction to the analyzer
Procedure
1. Press Home > ALT > F3 Set Time.
2. Set the following options.
Option Description
F2 Set Local Time Enter values for the time and date. Use the arrow keys to go to the
next value.
F5 Date Display Format Select the format used for the date.
F6 Time Display Format Select the 12 or 24 hour time format.
F9 Set Time Zone Select the time zone. If the time zone uses Daylight Savings Time, the
analyzer automatically adjusts the time and notifies you of the
change.
3. Press Enter.
2.11.8 Set the default display units
You can set the default display units for measurements and plots. You can also select
English, SI, or metric units, and the X and Y axis types for graphs.
Note
You can overwrite only the X and Y axes while in other programs.
23
Page 30

Introduction to the analyzer
Procedure
1. Press Home > F4 Set Display Units.
2. Use the up and down arrow keys to select an option.
Option Description
F2 Set Accel Set the acceleration type. Not applicable for the Balance program.
The default is RMS.
F3 Set Veloc Set the velocity units. Not applicable for the Balance program. The
default is Peak.
F4 Set Displace Set the displacement units. Not applicable for the Balance program.
The default is Peak to Peak.
F5 Set Non Standard Set the non-standard data types. Not applicable for the Balance
program. The default is RMS.
F6 Set Units Set to English Units, Metric Units, or SI Units. The default is English Units.
F8 Set dB Ref Configure acceleration, velocity, displacement, non-standard, and
microphone measurements displays for decibel reference. Enter a
value between 0.000000001 and 2. Not applicable for the Balance or
Route programs. The dB reference values are loaded with the route.
F10 Change Y Axis
Type
F11 Change X Axis
Type
F12 Change Hz \ CPM Set the frequency to Hz Units (Hertz) or CPM Units (cycles per minute).
Set the amplitude axis type. Not applicable for the Balance program.
The default is Linear.
Set the frequency axis type. Not applicable for the Balance program.
The default is Linear.
The default is Hz Units.
3. Press Enter.
2.12 Memory card
You can insert a memory card into the analyzer to store route or job files. You may want to
store some routes or jobs on specific cards to stay organized.
The memory card slot is located under the battery pack on the back of the analyzer. You
must remove the six screws to remove the battery pack and access the memory card slot.
You can use the File Utility to add, copy, move, or delete files from the inserted memory
card.
2.12.1 Insert or remove a memory card
WARNING!
• Insert or remove memory cards only when the analyzer is turned off.
• Remove the battery pack only in a non-hazardous area.
24
Page 31

Introduction to the analyzer
Procedure
1. Ensure the power supply is disconnected from the analyzer.
2. Remove the battery pack from the back of the analyzer. See Section 2.5.6.
3. To insert a memory card, press the memory card, with the metal contacts facing up,
into the memory card slot until it clicks.
Memory card partially inserted into the analyzerFigure 2-7:
4. To remove the memory card, push the memory card into the memory card slot until
it clicks and releases.
2.13 Bluetooth
If your analyzer is configured for Bluetooth® communication, you can listen to live
vibration signals from an accelerometer. You need an A2DP Bluetooth headphone, or an
A2DP Bluetooth receiver and any headphone. The audio is not stored. If your analyzer does
not have a Bluetooth radio, the Bluetooth options in the Communication Setup, Route,
and Analyze screens are unavailable.
Note
You can use the CSI 2130 A646 headphones with the Bluetooth functionality in the CSI 2140. You
need the adapter cable from Emerson and an A2DP Bluetooth receiver available online or from an
electronics store.
25
Page 32

Introduction to the analyzer
To use Bluetooth receivers and headphones, enable the Bluetooth radio in the analyzer
and then pair and connect to the Bluetooth device. When the radio is enabled, the
Bluetooth LED on the top of the analyzer turns on and a small "BT" icon appears in the
upper corner of the screen. The radio remains on until you disable it.
To help ensure a good connection, make sure the Bluetooth device is charged and located
within 30 feet of the analyzer. Also, follow the instructions from the manufacturer of your
device. After you pair the device, the analyzer automatically tries to connect to the device.
After the connection is made, open the Route or Analyze program and select the Listen To
Live Data option to listen to data.
2.13.1 Enable or disable the Bluetooth radio in the analyzer
If your analyzer is configured for Bluetooth, you can enable or disable the internal radio.
After you enable the analyzer's Bluetooth radio, the analyzer searches for nearby Bluetooth
devices that you can pair. The radio remains on until you disable it.
Procedure
1. Press Home > F5 Comm Setup > F7 Bluetooth Setup.
2. Press F2 Bluetooth to enable or disable the Bluetooth radio.
When the radio is enabled, the Bluetooth LED on the top of the analyzer turns on
and the
icon appears in the upper corner of the screen.
2.13.2 Bluetooth (BT) icons
When you enable the Bluetooth radio in your analyzer or connect to a device, the
Bluetooth (BT) icon in the upper corner of the screen shows the status of the connection.
See the table below for the icons and the descriptions.
Icon Meaning
The Bluetooth radio in the analyzer is enabled, but the analyzer is not
connected to a Bluetooth device.
The analyzer is connected to a Bluetooth device.
No icon The Bluetooth radio is disabled/off.
2.13.3 Pair a Bluetooth device
To establish communication between a Bluetooth device and the analyzer, you must first
pair the device.
26
Prerequisites
• Ensure your device is close to the analyzer (within 30 feet), and the device is in
discoverable mode.
Page 33

Introduction to the analyzer
• Ensure the Bluetooth radio in your analyzer is enabled. See Section 2.13.1.
Procedure
1. Press Home > F5 Comm Setup > F7 Bluetooth Setup.
2. If more than one device is listed, use the up and down arrow keys to select a
Bluetooth device.
3. (Optional) Press F8 Device Info to view information about the device, including
device alias (if you renamed the device), device name, supported protocols, status
and device address.
4. Press F7 Pair to pair the selected device.
The analyzer automatically tries to pair and connect to the device using a pin of
0000. If the analyzer connects to the device, a checkmark and "Connected" appears
next to the device. The F7 key changes to Unpair. If the analyzer cannot pair the
device using the default pin, enter the pin for the device, and press Enter.
Postrequisites
After the analyzer connects to the paired device, go to the Route or Analyze programs and
press the Listen To Live Data option to start listening to the live vibration signal.
2.13.4 Connect to a paired Bluetooth device
If you have more than one paired Bluetooth device, you can select and connect to a
desired device.
Prerequisites
Ensure your Bluetooth device has been paired. See Section 2.13.3.
Procedure
1. Press Home > F5 Comm Setup > F7 Bluetooth Setup.
2. Use the up and down arrow keys to select a paired device.
3. Press F9 Connect.
A checkmark and "Connected" appears next to the device name when the analyzer
connects to the device. The
Postrequisites
After the analyzer connects to the paired device, go to the Route or Analyze programs and
press the Listen To Live Data option to start listening to the live vibration signal.
icon appears in the upper corner of the screen.
2.13.5 Rename a paired Bluetooth device
After you pair a Bluetooth device, you can change the device name that appears on the
Bluetooth Setup screen. If you unpair the device, the new name is removed from that
device.
27
Page 34

Introduction to the analyzer
Procedure
1. Press Home > F5 Comm Setup > F7 Bluetooth Setup.
2. If more than one device is listed, use the up and down arrow keys to select a
Bluetooth device at the bottom of the screen.
3. Press F3 Rename Device and enter up to 16 characters to change the name of the
device.
4. Press Enter.
2.13.6 View information about a Bluetooth device
You can view the information and settings for a Bluetooth device. This can help identify a
Bluetooth device.
Procedure
1. Press Home > F5 Comm Setup > F7 Bluetooth Setup.
2. Use the up and down arrow keys to select a device.
3. Press F8 Device Info.
2.13.7 Unpair a Bluetooth device
If you previously paired a device, you can use the unpair option to remove the device
information from the analyzer.
Procedure
1. Press Home > F5 Comm Setup > F7 Bluetooth Setup.
2. Use the up and down arrow keys to select a paired device.
3. Press F7 Unpair.
2.14 Utilities
2.14.1 File Utility
The File Utility on the Home screen lets you copy, delete, or move routes or jobs saved in the
internal memory or memory card. By default, the File Utility shows the files saved in the
internal memory. The Set Source Card and Mode keys are available only if you inserted a
memory card into the analyzer.
View all jobs saved in internal memory or a memory card from the File Utility. Use the up and
down arrow keys to scroll through the list of file names.
28
View all files saved in the analyzer
1. Press Home > F2 File Utility.
Page 35

2. Use the up and down arrow keys to scroll through the files.
3. To view the files on the memory card, press F10 Set Source Card.
File types and extensions
Note
The CSI 2140 uses different file extensions than the CSI 2130.
File extension File type
.ANJ Analyze or Advanced Analyze job
.BJB Balance job
.ODJ ODS/Modal job
.RDA Route Data File (created after a route is activated)
.RDF Route Definition File (an empty route file)
.TRJ Transient job
Introduction to the analyzer
Copy a route or job file to a memory card or internal memory
1. Insert a memory card into the analyzer.
2. Press Home > F2 File Utility.
3. Press F8 Mode until F7 displays Copy.
4. Press F10 Set Source Card to select the location of the file to copy.
The Source and Destination fields change.
5. Select the file to copy, and press F9 Select/Unselect File.
A checkmark appears next to the file.
6. Press F7 Copy.
The file appears at the new location.
Delete a route or job file from the memory card or internal memory
Note
Use caution with the Delete option. Deleted data cannot be recovered.
Procedure
1. Press Home > F2 File Utility.
2. Press F8 Mode until F7 displays Delete.
29
Page 36

Introduction to the analyzer
3. Press F10 Set Source Card to select the location of the file.
4. Select the file to delete, and press F9 Select/Unselect File.
5. Press F7 Delete.
6. Press Enter to delete the file, or press Back to cancel.
Move a route or a job file to a memory card or internal memory
1. Insert a memory card into the analyzer.
2. Press Home > F2 File Utility.
3. Press F8 Mode until F7 displays Move.
4. Press F10 Set Source Card to select the location of the file to move.
5. Select the file to move, and press F9 Select/Unselect File.
A checkmark appears next to the file.
The Source and Destination fields change.
A checkmark appears next to the file.
6. Press F7 Move.
The file appears at the new location, and is deleted from the previous location.
2.14.2 Memory Utility
The Memory Utility on the Home ALT2 screen lets you control the internal memory. You can
view detailed information about the internal memory, clean the memory, erase internal
settings, and format disks.
CAUTION!
Use the Memory Utility features only when instructed by technical support. When used
improperly, these options can delete important information.
View detailed information about the internal memory
Use this information to troubleshoot issues with the internal memory.
Procedure
Press Home > ALT > F4 Memory Utility > F2 Detailed Info.
30
Defragment the internal memory
Defragment the internal memory to optimize memory storage. No data is deleted during
this process.
Page 37

Introduction to the analyzer
Note
This operation may take several hours.
Procedure
Press Home > ALT > F4 Memory Utility > F3 Clean Disk.
Clear the internal settings
You can clear the internal settings of the analyzer that are stored in permanent memory.
The default settings are loaded the next time you turn on the analyzer.
CAUTION!
Do this operation only if instructed by technical support.
Procedure
1. Press Home > ALT > F4 Memory Utility > F8 Erase PReg.
2. Press Enter.
Format the internal memory
Formatting the internal memory erases all data and programs in the analyzer. When the
formatting is complete, the analyzer shuts down. The internal memory includes programs
like Route, Analyze, and Balance. All routes, jobs, and data are erased.
Procedure
1. Press Home > ALT > F4 Memory Utility > F9 Format Disk.
2. Press Enter.
2.14.3 Battery Utility
The Battery Utility on the Home ALT2 screen lets you view detailed information about the
battery pack, including the remaining charge and battery voltage.
View the battery status
1. Press Home > ALT > F5 Battery Utility.
The screen indicates if the analyzer is running on battery power or the power supply.
2. Press F3 Show Details for additional diagnostic information, if necessary.
The charge and voltage level decreases as the battery discharges.
Note
Approximate values are displayed and they should be used only as a guideline.
31
Page 38

Introduction to the analyzer
3. Press Enter.
2.15 Clean the analyzer
WARNING!
An electrostatic discharge is possible when cleaning the equipment exterior. Clean the
analyzer only in a non-hazardous area.
To clean the exterior of the analyzer, use only a dry, lint-free towel or cloth dampened with
a mild soap and water solution. Do not use any abrasive or corrosive chemicals or
materials, or any petroleum distillates and ketone solvents (for example, acetone, gasoline
and kerosene).
2.16 CSI 2140 Four-Channel Input Adapter
The CSI 2140 Four-Channel Input Adapter expands the capabilities of your CSI 2140 by
enabling four inputs.
WARNING!
Use the CSI 2140 Four-Channel Input Adapter in non-hazardous areas only.
The CSI 2140 Four-Channel Input Adapter has two sides that display connectors for Volts
and Accel. Each side has a connector labeled "To CSI 2140". Use the appropriate Interface
cable to connect the CSI 2140 Four-Channel Input Adapter to the CSI 2140. The Accel side
has a 5-pin connector. The Volts side has an 8-pin connector.
Connect to the CSI 2140
Attach the CSI 2140 Four-Channel Input Adapter to the shoulder strap connectors on each
side of the analyzer, and press the tabs until they click into place. To release the adapter,
press the tabs on each side of the CSI 2140 Four-Channel Input Adapter. To attach the
shoulder strap, use the connectors on the sides of the CSI 2140 Four-Channel Input
Adapter.
Use the appropriate Interface cable to connect the CSI 2140 Four-Channel Input Adapter
to the CSI 2140.
Side Required interface cable
Accel A40ADAPTR Accel Interface Cable
Volts A40ADAPTR Tach/Volts Interface Cable
32
Page 39

Introduction to the analyzer
Figure 2-8:
CSI 2140 Four-Channel Input Adapter attached to the CSI 2140 without
the interface cable
Use with the CSI 2140
The CSI 2140 Four-Channel Input Adapter requires no additional setup, except in the
Balance program. For the Balance program, you must enable the mux option to use the CSI
2140 Four-Channel Input Adapter.
To access the other connectors, turn the adapter over and connect to the CSI 2140 using
the appropriate Interface cable.
2.17 Multiple inputs
Your analyzer may support up to four channels in each program to simultaneously collect
data. To use the multi-channel functionality, set the number of inputs in the Input Setup
menu in each program, set up a sensor for each input, and use a connection listed below.
For routes, you need to set up the inputs and sensors in AMS Machinery Manager.
Number of
inputs Connection options
1 Use a single cable.
2 • Use two single cables on two separate inputs (acceleration only).
• Use a splitter cable on one input.
• Use the CSI 2140 Four-Channel Input Adapter.
33
Page 40

Introduction to the analyzer
Number of
inputs Connection options
3 • Use a splitter and one single cable on two separate inputs.
4 • Use two splitters on two separate inputs.
• Use the CSI 2140 Four-Channel Input Adapter.
• Use the triaxial accelerometer with a single cable.
• Use the CSI 2140 Four-Channel Input Adapter.
• Use the triaxial accelerometer with a single cable on one accelerometer
input and another cable on the other accelerometer input.
34
Page 41

Transfer files with CSI 2140
3 Transfer files with CSI 2140
Topics covered in this chapter:
• AMS Machinery Manager Data Transfer
• AMS Machinery Manager Standalone Data Transfer application
• Communication setup
• Routes and jobs
• Analyzer firmware and programs
• Screen captures
• Splash screens
• Printing
3.1 AMS Machinery Manager Data Transfer
AMS Machinery Manager Data Transfer lets you manage the files in your analyzer. You
need Data Transfer to establish a connection between the AMS Machinery Manager
database and the programs in your analyzer so you can transfer vibration data (routes) and
job files. Data Transfer allows different levels of interactive functionality with your analyzer
depending on the analyzer's capabilities.
You can do the following:
• Transfer and store routes and jobs between the analyzer and AMS Machinery
Manager.
• Transfer and store routes and jobs between the analyzer and a folder on your
computer.
• Create route definition files and route data files that you can email to others.
• Take a screen capture of any screen in the analyzer.
• Print reports to AMS Machinery Manager.
• Upgrade the firmware or programs in your analyzer.
3.2 AMS Machinery Manager Standalone Data
Transfer application
If your computer does not have AMS Machinery Manager installed, use the AMS
Standalone Data Transfer application to transfer route and job files between an analyzer
and a folder on the computer or network. AMS Standalone Data Transfer does not have a
database, so all files are transferred to a computer folder. You can also print route reports
or plots from the analyzer and transfer firmware or programs to the analyzer.
35
Page 42

Transfer files with CSI 2140
AMS Standalone Data Transfer is available on your install disk that is included with your
analyzer. Follow the prompts in the install wizard.
AMS Standalone Data Transfer allows different levels of interactive functionality with your
analyzer depending on the analyzer's capabilities.
Analyzers using Ethernet may connect to the CSI Data Transfer Service running on the AMS
Machinery Manager server. Enter your AMS Machinery Manager user name and password
to access the database list.
Transferring files
AMS Standalone Data Transfer allows you to transfer a route to a file that can be sent to
remote locations by email, for example, and then transferred into an analyzer or into the
database. This type of file lets you send routes to and from analyzers at remote locations
using AMS Standalone Data Transfer instead of an AMS Machinery Manager Client.
To send a file to a remote user, create a route file using AMS Machinery Manager Data
Transfer and email the file to the remote location. The remote user can use Standalone
Data Transfer to load the file onto a connected analyzer.
To transfer a route or job into the AMS Machinery Manager database, use AMS Standalone
Data Transfer to load the file from the analyzer to a files on the computer. Then email the
file to the AMS Machinery Manager user, or put the file on a network drive. If you email the
file, put the file in the Working Directory to import the file.
Limitations
• You cannot install AMS Standalone Data Transfer on the same computer as AMS
Machinery Manager.
• You cannot create route or job files. You can only transfer files.
• You cannot save files directly to the AMS Machinery Manager database.
3.3 Communication setup
3.3.1 Compatible versions of AMS Machinery Manager
You must use AMS Machinery Manager version 5.6 or newer with the analyzer. The
analyzer uses a different format for routes, which is not compatible with previous versions
of AMS Machinery Manager.
3.3.2 Change the ID of the analyzer
The ID helps you uniquely identify an analyzer. The ID also appears in AMS Machinery
Manager Data Transfer when you connect to the analyzer.
Procedure
36
1. Press Home > F5 Comm Setup > F2 Change Device ID.
2. Enter up to 20 characters.
Page 43

Each time you press a key, the character changes. For additional characters, press
ALT and a different set of characters and text tools appears.
3. Press Enter.
4. Press Enter to return to the Home screen.
3.3.3 Set the connection type on the analyzer
You can set the connection type for connecting the analyzer to AMS Machinery Manager.
The default is USB. AMS Machinery Manager Data Transfer must have the same connection
type selected before connecting to the analyzer.
Ethernet is the fastest connection type, followed by USB.
Note
Setting up the Ethernet or Wireless connections require detailed knowledge of the network. Contact
your IT group for assistance.
Procedure
Transfer files with CSI 2140
1. Press Home > F5 Comm Setup > F1 Set Connect Port.
2. Use the up and down arrow keys to select a connection type.
3. Press Enter.
4. If you selected Ethernet or Wireless, press F4 Ethernet Network Setup or F4 Wireless
Network Setup and complete the steps below.
5. Press F3 to enable or disable DHCP.
6. If DHCP is disabled, do the following:
a. Enter the IP address, and press Enter.
b. Enter the submask, and press Enter.
c. Enter the address for the gateway, and press Enter.
d. Press Enter.
7. Press F6 Set Host Info.
8. Enter the following information, if necessary.
Note
The Set Host Info options apply to both the Ethernet and Wireless connection types.
37
Page 44

Transfer files with CSI 2140
9. To test the connection, select one of the following:
Option Description
F4 Set Host
Name
F5 Set IP
Address
F6 Set Host
Port
Enter the host name of your computer. This computer should be on your
wireless network and it should have AMS Machinery Manager installed. This
value must match what is set in AMS Machinery Manager for the CSI 2140
Setup Options.
If your network includes a DHCP server (DHCP enabled), enter the
computer name. Otherwise, enter the IP Address of the computer. For
additional text tools, press the ALT key and different set of characters
appears.
Enter the IP address of the host computer.
Enter the TCP/IP port number to use to establish communication between
the analyzer and the host computer. This value must match what is set in
AMS Machinery Manager for the CSI 2140 Setup Options. Use the default
value (10077) unless otherwise directed by technical support.
• F10 IP Config/all
• F11 Ping by IP
• F12 Ping by Name
10. Press Enter to return to the Home screen.
3.3.4 Enable the analyzer in Data Transfer
1. Open and log in to AMS Machinery Manager.
2. Click the Data Transfer tab.
3. Click the Enable Device icon and select your analyzer type from the menu.
A device status box with an icon, name, and status appears in the Device(s) waiting
for connection panel.
3.3.5 Set the connection type in Data Transfer
1. Enable the analyzer in Data Transfer.
2. In Devices waiting for connection pane, right-click the device status box to select
Configure Device.
The analyzer options panel opens on the right side of the screen.
38
3. Select the connection type.
Page 45

3.3.6 USB connection
The analyzer can communicate with AMS Machinery Manager using a USB cable. The USB
interface is the most common way to transfer files between the analyzer and the AMS
Machinery Manager. USB is the default connection type.
To use a USB connection with AMS Machinery Manager, do the following:
• Set the connection type on the analyzer.
• Set the connection type in AMS Machinery Manager.
After you set up the connection, use the Connect For Transfer option in the analyzer's
programs to connect to AMS Machinery Manager.
Connect to AMS Machinery Manager using USB
1. Connect the analyzer to the computer using the USB cable.
2. On the computer, open Data Transfer.
3. Click the Enable Device menu and select your analyzer.
Transfer files with CSI 2140
A device status box with an icon, name, and status appears in the workspace.
4. If more than one analyzer is enabled, click a device status box to select an analyzer.
5. Click the Options icon to expand the Options pane.
6. Set the connection type to USB on the analyzer and in Data Transfer.
7. On the analyzer, open a program and select Connect For Transfer using a path below.
Choose the program that corresponds to the file type you want to transfer.
Program Key sequence to Connect for Transfer option
Analyze Home > F7 Analyze > ALT > F9 Connect For Transfer
Balance Home > F9 Balance > F12 Job Manager > F7 Connect For Transfer
ODS/Modal Home > F12 ODS/Modal > F8 Job Manager > F7 Connect For Transfer
Program Manager Home > F6 Program Manager > F8 Connect For Transfer
Route Home > F8 Route > ALT > F9 Route Mgnt > F7 Connect For Transfer
Transient Home > F11 Adv. Transient > F8 Job Manager > F7 Connect For Transfer
Both the analyzer and AMS Machinery Manager display a message indicating the
connection was made. You can now transfer files between the opened program and
AMS Machinery Manager.
3.3.7 Ethernet connection
The analyzer can communicate with AMS Machinery Manager using an Ethernet cable. To
use an Ethernet connection with AMS Machinery Manager, do the following:
39
Page 46

Transfer files with CSI 2140
• Set the connection type on the analyzer and review the Ethernet settings in the F5
• Set the connection type in AMS Machinery Manager.
After the connection is setup, use the Connect For Transfer option in the analyzer's programs.
Connect to a remote AMS Machinery Manager server
Remote users of the analyzer can use an Ethernet connection to the CSI Data Transfer
Service running on the AMS Machinery Manager server. When the analyzer connects to the
CSI Data Transfer Service, all communication is driven from the analyzer. Enter your AMS
Machinery Manager user name and password to access the database list. For further
information concerning the CSI Data Transfer Service, please contact technical support.
Dynamic Host Configuration Protocol (DHCP)
DHCP is an Internet protocol that automates the configuration of computers that use
TCP/IP. DHCP automatically assigns IP addresses to deliver TCP/IP stack configuration
parameters, such as the subnet mask and default router. DHCP also provides other
configuration information.
Comm Setup menu.
To use Ethernet with your analyzer, use DHCP or a static IP address. Check with your
Information Technology department to see if DHCP is supported. If your workplace does
not support DHCP, your Information Technology department needs to provide you a valid
IP address, sub mask, and gateway.
Connect to AMS Machinery Manager using Ethernet
Your Ethernet settings depend on your local networks. You may need information and
assistance from your IT department. Your computer must have two Ethernet connections.
If it does not, use a router or a switch.
Procedure
1. Connect the analyzer to the computer using the Ethernet cable.
2. On the computer, open Data Transfer.
3. Click the Enable Device menu and select your analyzer.
A device status box with an icon, name, and status appears in the workspace.
4. If more than one analyzer is enabled, click a device status box to select an analyzer.
5. Click the Options icon to expand the Options pane.
6. Set the connection type to Ethernet/Wireless on the analyzer and in Data Transfer.
7. On the analyzer, open a program and select Connect For Transfer using a path below.
Choose the program that corresponds to the file type you want to transfer.
40
Program Key sequence to Connect for Transfer option
Analyze Home > F7 Analyze > ALT > F9 Connect For Transfer
Page 47

Transfer files with CSI 2140
Program Key sequence to Connect for Transfer option
Balance Home > F9 Balance > F12 Job Manager > F7 Connect For Transfer
ODS/Modal Home > F12 ODS/Modal > F8 Job Manager > F7 Connect For Transfer
Program Manager Home > F6 Program Manager > F8 Connect For Transfer
Route Home > F8 Route > ALT > F9 Route Mgnt > F7 Connect For Transfer
Transient Home > F11 Adv. Transient > F8 Job Manager > F7 Connect For Transfer
Note
If you experience issues when trying to connect, press the F9 IP/release/renew option to reset
the DHCP process.
Both the analyzer and AMS Machinery Manager display a message indicating the
connection was made. You can now transfer files between the opened program and
AMS Machinery Manager.
Connect to a remote AMS Machinery Manager database using Ethernet
Prerequisites
• Ensure the CSI Data Transfer Service is running on the AMS Machinery Manager
server.
• Contact technical support to configure the analyzer to connect to the CSI Data
Transfer Service.
Procedure
1. Connect the Ethernet cable to the analyzer and to an Ethernet switch or port.
2. On the analyzer, open a program and select Connect For Transfer using a path below.
Choose the program that corresponds to the file type you want to transfer.
Program Key sequence to Connect for Transfer option
Analyze Home > F7 Analyze > ALT > F9 Connect For Transfer
Balance Home > F9 Balance > F12 Job Manager > F7 Connect For Transfer
ODS/Modal Home > F12 ODS/Modal > F8 Job Manager > F7 Connect For Transfer
Program Manager Home > F6 Program Manager > F8 Connect For Transfer
Route Home > F8 Route > ALT > F9 Route Mgnt > F7 Connect For Transfer
Transient Home > F11 Adv. Transient > F8 Job Manager > F7 Connect For Transfer
3. Press Dump Data.
4. Log in using your user name and your password.
The password is case-sensitive, so use the up and down arrows to change the case.
41
Page 48

Transfer files with CSI 2140
Tip
Store your login. The next time you connect, press Recall Login and enter your four-digit pin.
The analyzer displays your stored login information.
5. Enter your four-digit pin, and press Enter.
3.3.8 Wireless connection
If your analyzer supports wireless, you can use it to connect to AMS Machinery Manager
Data Transfer to transfer files. To use the wireless functionality, you must enable the
wireless radio in your analyzer and connect to a wireless network. After you connect to a
wireless network, you can use wireless to connect the analyzer to an AMS Machinery
Manager computer. You may need to work with your network administrator or IT group to
set up a wireless connection.
Enable or disable the wireless radio in the analyzer
To connect to a wireless network, you must first enable the wireless radio in the analyzer.
Procedure
1. Press Home > F5 Comm Setup > F1 Set Connect Port.
2. Use the up and down arrow keys to select Wireless.
3. Press Enter.
When the radio is enabled, the wireless LED on the top of the analyzer turns on and
the wireless icon appears in the upper corner of the screen.
Wireless icons
When you enable the wireless radio in your analyzer or connect to a wireless network, the
wireless icon in the upper corner of the screen shows the status of the connection. See the
table below for the icons and the descriptions.
Icon Meaning
The wireless radio is enabled, but the analyzer is not connected to a
network.
The analyzer is connected to a wireless network.
No icon The wireless radio is disabled/off.
42
Connect to a wireless network
Prerequisites
Ensure the wireless radio in the analyzer is enabled.
Page 49

Transfer files with CSI 2140
Ensure your wireless network uses one of the security types below. If your wireless network
has a different security type, the analyzer may not connect to your network.
• Open (no encryption/authentication)
• WEP (Wired Equivalent Privacy)
• WPA - PSK (WiFi Protected Access and Pre-Shared Key)
• WPA2 - PSK (WiFi Protected Access 2 and Pre-Shared Key)
Procedure
1. Press Home > F5 Comm Setup > F8 Wireless Setup.
The analyzer scans for available networks.
2. Use the up and down arrow keys to select a wireless network, if more than one is
listed.
3. Press F7 Connect.
If you connect to a secure network, you are prompted to enter the appropriate
network security credentials. A checkmark appears next to the network name when
the radio is communicating with the router. The wireless icon appears in the
upper corner of the screen when the analyzer connects to the network.
Connect to AMS Machinery Manager using wireless
Prerequisites
Ensure the analyzer is connected to a wireless network.
Procedure
1. On the computer, open Data Transfer.
2. Click the Enable Device menu and select your analyzer.
A device status box with an icon, name, and status appears in the workspace.
3. If more than one analyzer is enabled, click a device status box to select an analyzer.
4. Click the Options icon to expand the Options pane.
5. Set the connection type to Ethernet/Wireless on the analyzer and in Data Transfer.
6. On the analyzer, press Home > F5 Comm Setup > F6 Set Host Info.
7. Enter the following information, if necessary.
Note
The Set Host Info options apply to both the Ethernet and Wireless connection types.
43
Page 50

Transfer files with CSI 2140
8. Press Enter.
9. On the analyzer, open a program and select Connect For Transfer using a path below.
Option Description
F4 Set Host
Name
F5 Set IP
Address
F6 Set Host
Port
Enter the host name of your computer. This computer should be on your
wireless network and it should have AMS Machinery Manager installed. This
value must match what is set in AMS Machinery Manager for the CSI 2140
Setup Options.
If your network includes a DHCP server (DHCP enabled), enter the
computer name. Otherwise, enter the IP Address of the computer. For
additional text tools, press the ALT key and different set of characters
appears.
Enter the IP address of the host computer.
Enter the TCP/IP port number to use to establish communication between
the analyzer and the host computer. This value must match what is set in
AMS Machinery Manager for the CSI 2140 Setup Options. Use the default
value (10077) unless otherwise directed by technical support.
Choose the program that corresponds to the file type you want to transfer.
Program Key sequence to Connect for Transfer option
Analyze Home > F7 Analyze > ALT > F9 Connect For Transfer
Balance Home > F9 Balance > F12 Job Manager > F7 Connect For Transfer
ODS/Modal Home > F12 ODS/Modal > F8 Job Manager > F7 Connect For Transfer
Program Manager Home > F6 Program Manager > F8 Connect For Transfer
Route Home > F8 Route > ALT > F9 Route Mgnt > F7 Connect For Transfer
Transient Home > F11 Adv. Transient > F8 Job Manager > F7 Connect For Transfer
Note
If you experience issues when trying to connect, press the F9 IP/release/renew option to reset
the DHCP process.
Both the analyzer and AMS Machinery Manager display a message indicating the
connection was made. You can now transfer files between the opened program and
AMS Machinery Manager.
Manually add a wireless network
You can manually set up a wireless network in the analyzer without being in range of the
wireless signal. You can then connect to the network when your analyzer is within range.
44
Prerequisites
Ensure the wireless radio in the analyzer is enabled.
Page 51

Transfer files with CSI 2140
Procedure
1. Press Home > F5 Comm Setup > F8 Wireless Setup > F9 Manage Networks > F1 Add Network.
2. Enter the following information.
Option Description
F2 Network Name
(SSID)
F3 Infrastructure Mode Select Ad Hoc to connect the analyzer to the computer directly
F4 Security Select the type of security used for the wireless network. Select Open if
F5 Encryption Type Select the type of encryption mode. This option is available only if you
F6 Security Key Enter the security key (passphrase) for the wireless network. This
Enter the name of the wireless network that you want to add.
through a peer-to-peer wireless connection through each device's
wireless adapter. Select Standard to connect to the computer through
a standard network with a wireless router.
no authentication is required.
select WPA-PSK or WPA2-PSK for the Security option.
option is available only if you select WPA-PSK, WEP (Open), or WPA2-PSK
for the Security option.
3. Press Enter.
The wireless network appears on the Manage Networks screen.
Remove a wireless network
You can remove a wireless network from the list of networks in the analyzer. If the analyzer
is connected to the network, the analyzer disconnects from the network when you press
the Remove Network option.
Procedure
1. Press Home > F5 Comm Setup > F8 Wireless Setup > F9 Manage Networks.
2. Use the up and down arrow keys to select the wireless network you want to remove.
3. Press F2 Remove Network.
4. Press Enter.
The network is removed from the list of networks in your analyzer.
View the network information
You can view the settings and information about a wireless network.
Procedure
1. Press Home > F5 Comm Setup > F8 Wireless Setup.
The analyzer scans for available networks.
45
Page 52

Transfer files with CSI 2140
2. Use the up and down arrow keys to select a wireless network, if more than one is
listed.
3. Press F8 Network Info.
3.4 Routes and jobs
3.4.1 Load a route from AMS Machinery Manager into the analyzer
Prerequisites
Ensure the same connection type is set on the analyzer and in Data Transfer. The Ethernet
and Wireless options may require additional setup to connect to the desired computer.
See the Ethernet and Wireless sections and your IT group for more information.
Note
You can connect multiple analyzers to AMS Machinery Manager at one time. Each analyzer has a tab
on the Data Transfer tab labeled with its ID or name.
Procedure
1. Use the appropriate cable to connect your analyzer to a computer where AMS
Machinery Manager is installed, if you are using a wired connection.
2. On the computer, open Data Transfer.
3. On the analyzer, press Home > F8 Route > ALT > F9 Route Mgnt.
The Route Management screen displays.
Note
If you have not loaded or activated a route, the Route Management screen opens when you
press F8 Route from the analyzer Home screen.
4. Press F7 Connect For Transfer.
The analyzer connects to AMS Machinery Manager, and a new tab with the analyzer
Device ID displays in the Data Transfer tab.
5. To load a route using AMS Machinery Manager:
a. Select the appropriate database in the Navigator - Data Transfer pane.
b. Drag and drop or copy and paste the desired route to the connected analyzer in
the Data Transfer tab.
46
The Data Transfer Notification pane displays the progress of the transfer.
6. To load a route using the analyzer:
Page 53

Transfer files with CSI 2140
a. Press F1 Set Storage Location to select internal memory or a SD memory card to
store the route.
b. Press F7 Load Routes.
c. Press F8 or F9 to select a database.
d. Press F10 or F11 to select an area within the database.
e. Press F4 Select Area.
f. Press F8 or F9 to select a route and press F1 Select.
You can select multiple routes.
g. Press F7 Load Route.
If the route is already in the analyzer, an error message appears. Press Enter to
continue and overwrite the existing route. You will lose any data stored in the
existing route.
7. After the transfer completes, press the Back key to disconnect from AMS Machinery
Manager.
3.4.2 Load multiple routes from AMS Machinery Manager to the analyzer
Load a Multiple Route Load (MRL) file containing multiple routes from an AMS Machinery
Manager database. MRL files help you efficiently load multiple routes at one time. Create a
MRL file in AMS Machinery Manager.
After you load the routes, the analyzer does not group them using the MRL file. The routes
are individual files that you individually transfer back to AMS Machinery Manager after you
collect data.
Note
AMS Standalone Data Transfer cannot transfer MRL files.
Prerequisites
Ensure the same connection type is set on the analyzer and in Data Transfer. The Ethernet
and Wireless options may require additional setup to connect to the desired computer.
See the Ethernet and Wireless sections and your IT group for more information.
Procedure
1. Use the appropriate cable to connect your analyzer to a computer where AMS
Machinery Manager is installed, if you are using a wired connection.
2. On the computer, open Data Transfer.
3. On the analyzer, press Home > F8 Route > ALT > F9 Route Mgnt.
The Route Management screen displays.
47
Page 54

Transfer files with CSI 2140
4. Press F7 Connect For Transfer.
5. To load a MRL using AMS Machinery Manager:
6. To load a MRL using the analyzer:
Note
If you have not loaded or activated a route, the Route Management screen opens when you
press F8 Route from the analyzer Home screen.
The analyzer connects to AMS Machinery Manager, and a new tab displays the
analyzer ID.
a. Click the File Transfer icon.
b. On the File Transfer pane at the bottom of the screen, click the Multiple Route Load
tab.
c. Drag and drop or copy and paste the desired MRL file to the connected analyzer
in the Data Transfer tab.
The download begins.
a. Press F1 Set Storage Location to select internal memory or a SD memory card.
b. Press F7 Load Routes.
c. Press F8 or F9 to select MRL File List.
d. Press F10 or F11 to select a MRL file.
e. Press F4 Select MRL File.
The download begins.
7. After the download completes, press Back to disconnect from AMS Machinery
Manager.
3.4.3 Load a Balance job from AMS Machinery Manager into the analyzer
Prerequisites
Ensure the same connection type is set on the analyzer and in Data Transfer. The Ethernet
and Wireless options may require additional setup to connect to the desired computer.
See the Ethernet and Wireless sections and your IT group for more information.
Procedure
1. Use the appropriate cable to connect your analyzer to a computer where AMS
Machinery Manager is installed, if you are using a wired connection.
2. On the computer, open Data Transfer.
3. On the analyzer, press Home > F9 Balance > F12 Job Manager > F7 Connect For Transfer.
48
The analyzer connects to AMS Machinery Manager.
Page 55

Transfer files with CSI 2140
4. To load a job using AMS Machinery Manager:
a. Select the appropriate database in the Navigation - Data Transfer pane.
b. Drag and drop or copy and paste the desired job to the connected analyzer in the
Data Transfer tab.
The Data Transfer Notification pane displays the progress of the transfer.
5. To load a job using the analyzer:
a. Press F1 Set Storage Location to select internal memory or a SD memory card.
b. Press F7 Load Jobs.
c. Press F8 or F9 to select a database.
d. Press F10 or F11 to select an area within the database.
e. Press F4 Select Area.
f. Press F8 or F9 to select a job and press F1 Select.
g. Press F7 Load Jobs.
6. After the transfer completes, press the Back key to return to the Job Manager
screen.
3.4.4 Dump a job from the analyzer to AMS Machinery Manager
You can transfer jobs created in the analyzer's programs to the AMS Machinery Manager
database.
Prerequisites
Ensure the same connection type is set on the analyzer and in Data Transfer. The Ethernet
and Wireless options may require additional setup to connect to the desired computer.
See the Ethernet and Wireless sections and your IT group for more information.
Procedure
1. Use the appropriate cable to connect your analyzer to a computer where AMS
Machinery Manager is installed, if you are using a wired connection.
2. On the computer, open Data Transfer.
3. On the analyzer, press the Connect For Transfer option in the program for the desired
job.
Program Key sequence to Connect for Transfer option
Analyze Home > F7 Analyze > ALT > F9 Connect For Transfer
Balance Home > F9 Balance > F12 Job Manager > F7 Connect For Transfer
ODS/Modal Home > F12 ODS/Modal > F8 Job Manager > F7 Connect For Transfer
Transient Home > F11 Adv. Transient > F8 Job Manager > F7 Connect For Transfer
49
Page 56

Transfer files with CSI 2140
4. To transfer the job using AMS Machinery Manager:
5. To transfer the job using the analyzer:
The analyzer connects to AMS Machinery Manager.
a. Select the appropriate database in the Navigation - Data Transfer pane.
b. Drag and drop or copy and paste the desired job to the database in the Data
Transfer tab.
The Data Transfer Notification pane displays the progress of the transfer.
a. Press F8 Dump Data.
The analyzer lists the default database at the top of the screen.
b. Select one or more jobs you want to transfer, and press F1 Select.
c. To send the jobs to a different database, press F6 Clear Database Info.
d. Press F7 Begin Data Dump.
e. If prompted, select a database and an area in the database, and press F4 Select
Area.
f. If prompted, select the desired equipment, and press F7 Select.
6. After the transfer completes, press the Back key to disconnect from AMS Machinery
Manager and return to the program's Job Manager or ALT2 screen.
3.4.5 Dump a route from the analyzer to AMS Machinery Manager
Unless you specify a different database, the analyzer transfers the route back to the same
database, area, equipment, and measurement.
Prerequisites
Ensure the same connection type is set on the analyzer and in Data Transfer. The Ethernet
and Wireless options may require additional setup to connect to the desired computer.
See the Ethernet and Wireless sections and your IT group for more information.
Procedure
1. Use the appropriate cable to connect your analyzer to a computer where AMS
Machinery Manager is installed, if you are using a wired connection.
2. On the computer, open Data Transfer.
3. On the analyzer, press Home > F8 Route > ALT > F9 Route Mgnt > F7 Connect For Transfer.
The analyzer connects to AMS Machinery Manager.
50
4. To transfer a route using AMS Machinery Manager:
a. Select the appropriate database in the Navigator - Data Transfer pane.
Page 57

Transfer files with CSI 2140
b. Drag and drop or copy and paste the desired route to the database in the Data
Transfer tab.
The Data Transfer Notification pane displays the progress of the transfer.
5. To transfer a route using the analyzer:
a. Press F8 Dump Data.
The analyzer lists the default database at the top of the screen.
b. Select the routes to transfer and press F1 Select.
c. To send the routes to a different database, press F6 Force Into Database, and select
a new database.
d. Press F7 Begin Data Dump.
6. After the transfer completes, press the Back key to disconnect from AMS Machinery
Manager and return to the Route Management screen.
3.4.6 Dump a route or job from the analyzer to a folder on a computer
Transfer a file to a folder on your computer using AMS Machinery Manager.
Prerequisites
Ensure the same connection type is set on the analyzer and in Data Transfer. The Ethernet
and Wireless options may require additional setup to connect to the desired computer.
See the Ethernet and Wireless sections and your IT group for more information.
Procedure
1. Use the appropriate cable to connect your analyzer to a computer where AMS
Machinery Manager is installed, if you are using a wired connection.
2. On the computer, open Data Transfer.
3. In AMS Machinery Manager, click the File Transfer icon.
The File Transfer pane appears at the bottom of the screen.
4. Click the Analyzer Files tab.
5. Click the Working Directory link, and select a folder on the computer to store the file.
6. Click OK.
7. On the analyzer, open a program and select Connect For Transfer using the path
below. Select the program based on the type of route or job you want to transfer.
Program Key sequence to Connect for Transfer option
Analyze Home > F7 Analyze > ALT > F9 Connect For Transfer
Balance Home > F9 Balance > F12 Job Manager > F7 Connect For Transfer
51
Page 58

Transfer files with CSI 2140
Program Key sequence to Connect for Transfer option
ODS/Modal Home > F12 ODS/Modal > F8 Job Manager > F7 Connect For Transfer
Route Home > F8 Route > ALT > F9 Route Mgnt > F7 Connect For Transfer
Transient Home > F11 Adv. Transient > F8 Job Manager > F7 Connect For Transfer
The analyzer connects to AMS Machinery Manager.
8. On the computer, copy and paste or drag and drop one or more files from the top
pane displaying the analyzer files to the File Transfer pane at the bottom of the
screen.
The file appears in the File Transfer pane and is saved to the folder.
3.5 Analyzer firmware and programs
3.5.1 View the version numbers of the installed firmware and programs
View the versions to identify when you can upgrade the firmware or programs.
Procedure
1. Press Home > ALT > F1 Version.
2. Review the File Name and File Version columns.
File name Program
XShell.exe Firmware and main menu
Analyze2140.exe Analyze and Advanced Analyze
Balance2140.exe Balance
Route2140.exe Route
Transient2140.exe Transient
ODSModal2140.exe ODS/Modal
3. Press Enter.
3.5.2 Upgrade the firmware in the analyzer
52
Note
Updates to the analyzer programs are not included in the firmware upgrade. You must update the
programs separately from the firmware. Call technical support to see if any updates are available.
Page 59

Transfer files with CSI 2140
Prerequisites
Ensure the same connection type is set on the analyzer and in Data Transfer.
Procedure
1. Copy the new firmware to a folder on your computer.
2. Connect the analyzer to the computer using the USB cable.
3. On the computer, open Data Transfer.
4. In the Options pane, set the Key Table and Firmware fields to the firmware folder
you created in step 1.
a. Click the Options icon.
b. Click Browse next to the Key Table field and select the folder containing the
firmware.
c. Click Browse next to the Firmware field and select the folder containing the
firmware.
d. Click Apply.
5. Turn off the analyzer.
6. Press and hold the Home key and then quickly press the Power key on the analyzer.
The CSI Special Functions Menu appears.
7. Press F2 Update Device Firmware via the USB Port.
The firmware upgrade begins. Follow the prompts. If the analyzer does not make the
connection, turn off the analyzer and go back to step 1.
3.5.3 Add or upgrade the programs in the analyzer
You can add or upgrade multiple programs at one time.
Prerequisites
• Ensure the same connection type is set on the analyzer and in Data Transfer. The
Ethernet and Wireless options may require additional setup to connect to the
desired computer. See the Ethernet and Wireless sections and your IT group for
more information.
• Update the firmware, if an update is available. You may see an error message if you
try to update or add programs before the firmware is updated.
Procedure
1. Copy the new programs to a folder on your computer.
2. Use the appropriate cable to connect your analyzer to a computer where AMS
Machinery Manager is installed, if you are using a wired connection.
3. On the computer, open Data Transfer.
4. In the Options pane, set the Key Table and Firmware fields to the firmware folder
you created in step 1.
53
Page 60

Transfer files with CSI 2140
5. On the analyzer, press Home > F6 Program Manager > F8 Connect For Transfer.
6. Press F11 Program or F12 Program or use the up and down arrow keys to highlight a
7. Press F9 Start Download.
a. Click the Options icon.
b. Click Browse next to the Key Table field and select the folder containing the
firmware.
c. Click Browse next to the Firmware field and select the folder containing the
firmware.
d. Click Apply.
The analyzer displays a message indicating "Host Computer Connected" and lists the
options under the Programs Available for Download section.
Note
If the following message appears, you must update your firmware before continuing: "The
host computer has a newer version of the base firmware. You should follow the procedure in
your user's manual for loading new base firmware before you load any new programs". The
analyzer will not open any programs until you update the firmware. The analyzer may prompt
you to update the firmware after you load or update the programs.
program, and press F10 Select/Unselect Program to select a program.
Wait until all programs in the analyzer are up to date. The download typically takes a
few minutes.
8. Press Enter or Reset.
Postrequisites
View the version number for the firmware and programs to ensure the updates were
successful.
3.6 Screen captures
3.6.1 Take a screen capture
Prerequisites
• On the analyzer, press Home > ALT > F2 General Setup > F6 Set Print Mode and ensure the
default print mode is set to Send to PC.
• Ensure the same connection type is set on the analyzer and in Data Transfer. The
Ethernet and Wireless options may require additional setup to connect to the
desired computer. See the Ethernet and Wireless sections and your IT group for
more information.
54
Page 61

Transfer files with CSI 2140
Procedure
1. Use the appropriate cable to connect your analyzer to a computer where AMS
Machinery Manager is installed, if you are using a wired connection.
2. On the computer, open Data Transfer.
3. On the analyzer, press Home > ALT > F7 Connect For Printing.
AMS Machinery Manager connects to the analyzer.
4. Go to the desired screen on the analyzer.
5. In AMS Machinery Manager, click Capture from the toolbar.
Capture buttonFigure 3-1:
6. Save the screen capture when it appears on your screen.
3.7 Splash screens
3.7.1 Change the default Home screen image (splash screen)
You can change the image (splash screen) on the Home screen to another image, such as
your company's logo.
Prerequisites
• Ensure the same connection type is set on the analyzer and in Data Transfer. The
Ethernet and Wireless options may require additional setup to connect to the
desired computer. See the Ethernet and Wireless sections and your IT group for
more information.
• Save the image as "splash.bmp" and with 430 (width) x 380 (height) pixels.
• Save the file to a folder on your PC.
• Limit the color palette for the image to the 256 color (8-bit) palette.
Procedure
1. Use the appropriate cable to connect your analyzer to a computer where AMS
Machinery Manager is installed, if you are using a wired connection.
2. On the computer, open Data Transfer.
55
Page 62

Transfer files with CSI 2140
3. In Data Transfer, click the Options icon and set the Firmware field to the folder
containing the new image.
4. On the analyzer, press Home > F6 Program Manager > F8 Connect For Transfer > F2 Load
New Splash Screen.
5. Press Enter.
3.7.2 Delete the Home screen image (splash screen)
If you added a custom image to the Home screen, you can delete it and return to the
default image.
Procedure
1. Press Home > F6 Program Manager > F2 Delete Splash Screen.
The analyzer deletes the splash screen.
2. Press Enter.
3.8 Printing
3.8.1 Create a cover page in Device Offline Printing
Prerequisites
Disconnect the analyzer from AMS Machinery Manager.
Procedure
1. In AMS Machinery Manager, select File > Device Offline Printing.
2. Select Destination > Include Cover Page > New.
The Cover Page Editor dialog appears.
3. To remove a field, select Field and choose the field to remove.
The Report Date and Report fields cannot be removed.
4. To change the image, select Image > Change.
5. To save the cover page, select Save and specify a name and location for the file.
The file is saved with a .CPF file extension.
Postrequisites
56
Select Destination > Include Cover Page > Existing to select a cover page you have already saved.
Page 63

3.8.2 Print a plot
Prerequisites
• On the analyzer, press Home > ALT > F2 General Setup > F6 Set Print Mode and ensure the
default print mode is set to Send to PC.
• Ensure the same connection type is set on the analyzer and in Data Transfer. The
Ethernet and Wireless options may require additional setup to connect to the
desired computer. See the Ethernet and Wireless sections and your IT group for
more information.
Procedure
1. Use the appropriate cable to connect your analyzer to a computer where AMS
Machinery Manager is installed, if you are using a wired connection.
2. On the computer, open Data Transfer.
3. On the analyzer, display the plot.
4. Press F7 Print Plot.
The analyzer connects to AMS Machinery Manager. The plot is displayed.
Transfer files with CSI 2140
5. Click the print icon in the AMS Machinery Manager toolbar to send the plot to the
printer.
57
Page 64

Transfer files with CSI 2140
58
Page 65

4 Route
Topics covered in this chapter:
• Route overview
• Manage routes
• Set data collection and display parameters
• Tachometers
• Multiple inputs and measurements
• Collect route data
• Notes
• Plot data
• Run Analyze to collect data for a route measurement point
• View the measurement point setup and history
• Route reports
Route
4.1 Route overview
The Route program lets you collect route data using your analyzer. A route is a list of
equipment and measurement points that you select from an area in the AMS Machinery
Manager database. A route is not an AMS Machinery Manager database. The route file lets
you save collected measurements for the equipment. Arrange the list of equipment and
measurement points to provide an efficient path (route) for you to collect data. You can
simultaneously collect one, two, three, and four channel waveform and spectra data.
To use the Route program:
1. Load a route into your analyzer from AMS Machinery Manager Data Transfer or
Standalone Data Transfer.
2. Activate the route in the analyzer.
3. Ensure the data collection parameters are set up properly.
4. Ensure the tachometer, if applicable, is set up properly. Define the sensors when you
create the route in AMS Machinery Manager.
5. Collect the data for each measurement point. The analyzer displays each machine
and measurement point in the defined order for the route.
6. (Optional) Plot the data to analyze the data.
7. (Optional) Open Analyze from the measurement point to do further analysis.
8. Transfer the route back to AMS Machinery Manager for storage or further analysis.
4.1.1 Open or close the Route program
1. To open Route, press F8 Route from the Home screen.
59
Page 66

Route
2. To close Route, press ALT > F7 Exit Route.
4.1.2 Route Data Collection screen and options
Route Data Collection is the main menu for Route. After you activate a route, the analyzer
displays the Route Data Collection screen.
Route Data Collection screenFigure 4-1:
60
A. Displays the live and collected data.
B. Status field for measurements, notes, and field alerts.
C. Date and overall value of the last data collected on this point.
D. Measurement reading (overall vibration level).
E. Measurement point description.
F. Equipment description.
G. Measurement point number.
H. Equipment ID.
I. Group and channel number of the measurement point.
J. Three-character measurement point ID.
K. An alternate (ALT) screen includes additional options.
Page 67

ALT1 keys
Option Description
F1 Prev Point Move to the previous measurement point on the equipment. If the first
point on the equipment displays and you press F1 Prev Point, the analyzer
displays the last point on the previous equipment.
F2 Prev Equip Move to the previous equipment in the route. If the first equipment
displays and you press F2 Prev Equip, the analyzer displays the last
equipment.
F3 Equip List View all equipment and measurement points in a route.
F4 Notes Create, add, or delete notes.
F5 Plot Data View the collected data on one or more plots.
F6 Clear Data Delete data from the current measurement point.
F7 Next Point Move to the next measurement point on the equipment. If the last point
on the equipment displays and you press F7 Next Point, the analyzer
displays the first point on the next equipment.
F8 Next Equip Move to the next equipment in the route. If the last equipment displays
and you press F8 Next Equip, the analyzer displays the first equipment.
F9 Listen To Live Data Listen to vibration using headphones.
F10 Field Alert Add or remove a field alert from a measurement point. Use field alerts to
identify a point for further investigation.
F11 View Parms View the Analysis Parameter Set with measured values, percent of fault, and
any parameters that may be in alert.
F12 Run Analyze Open the Analyze program to collect additional data on the current
measurement point.
Route
ALT2 keys
Option Description
F1 User Setup Set options for your route. You can set the plots to display live and
collected data, parameters to collect route data, and the amount of route
data to store.
F2 Override Control Set up a different sensor than what is specified for the route.
F3 Out Of Service Label equipment as out of service and skip the measurement.
F4 Intentionally blank.
F5 Tach Setup Set up and save a tachometer configuration. You can also open, edit,
delete, or rename a configuration.
F6 New RPM Enter a new RPM or load for equipment using a different value than
defined in the route.
F7 Exit Route Close Route and return to the Home screen.
F8 Intentionally blank.
61
Page 68

Route
Option Description
F9 Route Mgnt Load, delete, or activate routes. You can also connect to AMS Machinery
F10 View Trend History Display trend data for the current point in a graphical format. The data
F11 Print Route Report Send a route report to the memory card or to AMS Machinery Manager,
F12 More Point Info View information about the route and the current measurement point.
4.1.3 Route setup
Note
You cannot create or modify routes using the analyzer. Use AMS Machinery Manager to create or edit
routes.
Manager Data Transfer.
includes both historical data downloaded from the database and new data
collected with the analyzer.
depending on the default print mode for the analyzer.
• A route includes information from one area and is tagged to that area.
• A route does not need to include all equipment in an area or all points on the
equipment.
• Equipment can appear in more than one route, but cannot appear in the same route
more than once.
• The order of equipment in a route can differ from its order in the database area.
• The route points do not have to be in the same order as listed on the equipment.
• The route structure stores a list of equipment and measurement point IDs as they
are defined in the database. When you transfer a route, AMS Machinery Manager
searches the area for the equipment and points that match the route. The route
does not recognize points if their IDs are modified in the database. Loading the
route could cause problems.
4.2 Manage routes
4.2.1 Route Management
The Route Management screen lets you manage the routes in your analyzer. If you do not
have any routes activated, the Route Management screen appears when you open Route.
Otherwise, access it from the Route Data Collection ALT2 screen.
62
You can do the following:
• Load routes into the analyzer from AMS Machinery Manager Data Transfer.
• View routes saved in the analyzer.
• Activate a route.
Page 69

• Delete routes from the analyzer.
• Delete route data.
• Transfer routes back to AMS Machinery Manager.
Note
You cannot create or modify routes using the analyzer.
4.2.2 View all loaded routes
You can view the routes loaded or saved in your analyzer.
Procedure
1. From the Route Data Collection screen, press ALT > F9 Route Mgnt.
The Route Management screen displays the routes with the following information.
Note
If you have not activated a route, the Route Management screen opens when you press F8
Route from the analyzer Home screen.
Route
Option Description
Location Where the route file is stored on the analyzer.
Route Description The content of the route.
Status The number of completed measurements and total measurements for the
route.
Date The last date you activated the route.
2. Press F12 More Info to view information about the source of the route in AMS
Machinery Manager.
3. To sort the routes, press ALT > F1 Sort by Alphabet or ALT > F3 Reverse Sort Order.
4.2.3 Activate a route
Activating a route lets you collect data for the equipment and measurement points
defined in the route. It is similar to opening a file.
Prerequisites
Load a route into the analyzer.
Procedure
1. From the Route Data Collection screen, press ALT > F9 Route Mgnt.
The Route Management screen displays.
63
Page 70

Route
Note
If you have not activated a route, the Route Management screen opens when you press F8
Route from the analyzer Home screen.
2. From the Route Management screen, use the up and down arrow keys to select a
route in the list.
3. Press F1 Select/Unselect Route to select the route.
A checkmark appears next to the selected route.
4. Press F3 Activate Route.
The Route Data Collection screen appears. The first equipment and measurement
point defined in the route are activated and displayed.
Activate equipment in a route
By default, the analyzer activates the first equipment and measurement point in the route.
You can activate other equipment in a route without collecting data for the previous
equipment.
Procedure
1. Activate a route.
2. From the Route Data Collection screen, press F3 Equip List.
3. Press F8 or F9 to select other equipment.
Under Measurement Points, a checkmark shows the points with data. You can also
activate a specific point for the selected equipment.
4. Press F2 Activate Equip.
The Route Data Collection screen appears. The selected equipment and its first
measurement point display.
Activate the next unmeasured point on the equipment
1. Activate a route.
2. From the Route Data Collection screen, press F3 Equip List.
3. Ensure the appropriate equipment is selected in the top pane.
Under Measurement Points, a checkmark appears next to each point that has
collected data.
4. Press F6 Next Un-Measured Point.
64
The Route Data Collection screen appears.
Page 71

Route
4.2.4 View the equipment and measurement points in a route
1. Activate the route.
2. From the Route Data Collection screen, press F3 Equip List.
The equipment appears on the top half of the screen, and the measurement points
appear on the bottom half.
3. Press F8 or F9 to scroll through the equipment list.
4. Press F11 or F12 to scroll through the measurement points for the selected
equipment.
A checkmark indicates the point has data.
5. Press Enter.
4.2.5 Delete all data from a route
Only the collected data, including any Analyze data, is removed. The equipment and
measurement points remain in the route.
Procedure
1. From the Route Data Collection screen, press ALT > F9 Route Mgnt.
2. Use the up and down arrow keys to select a route.
3. Press F1 Select/Unselect Route or F2 Select/Unselect All.
4. Press F5 Delete Route Data.
5. Press Enter.
4.2.6 Delete a route from the analyzer
You can delete a route and its data. You can also use the File Utility on the analyzer Home
screen to delete a route.
Note
Use caution with the Delete Selected Routes option. Deleted data cannot be recovered.
Procedure
1. From the Route Data Collection screen, press ALT > F9 Route Mgnt.
2. Use the up and down arrow keys to select a route.
3. Press F1 Select/Unselect Route or F2 Select/Unselect All.
4. Press F6 Delete Selected Routes.
5. Press Enter.
65
Page 72

Route
4.3 Set data collection and display parameters
You can set the data collection and display parameters for an activated route. The default
values are appropriate for most data collection, but you can change them at any time. All
routes in your analyzer use these parameters.
4.3.1 Set the plot type for collected data
The Select Data Display option applies only to collected data on the Route Data Collection
screen and the data plot. It does not affect the plots displaying during data collection.
Procedure
1. Activate a route.
2. From the Route Data Collection screen, press ALT > F1 User Setup > F2 Select Data
Display.
3. Use the up and down arrows to select a plot type.
Option Description
None No plot is displayed on the Route Data Collection screen. This option has
the fastest data acquisition. When you plot the data, a spectrum
displays.
Parameters Display the analysis parameters for the measurement point as text.
When you plot the data, a spectrum displays.
Bar Graph-labeled Display the analysis parameters as a bar graph with labels. When you
plot the data, a spectrum displays.
Bar Graph-no labels Display the data as a bar graph without labels. When you plot the data, a
spectrum displays.
Spectrum Display a spectrum for each point.
Waveform Display a waveform for each point.
Dual Display a waveform and spectra for each point.
4. Press Enter.
4.3.2 Enable or disable Point Advance to automatically move to the next measurement point
When you enable Point Advance, the analyzer automatically moves to the next point in the
route after a set amount of time. Set the number of seconds you need to review the point's
data before moving to the next point.
Note
If you grouped points together in your route, the analyzer collects data for those points before
letting Point Advance go to the next point outside the group. For example, if you grouped points 1 and
3, the analyzer collects data for those two points and then Point Advance goes to point 2.
66
Page 73

Procedure
1. Activate a route.
2. From the Route Data Collection screen, press ALT > F1 User Setup > F3 Point Advance
Mode.
3. Enter the number of seconds between 0 and 30.
To disable the feature, enter 0. The default is 0.
4. Press Enter.
4.3.3 Set High Frequency Detection averages
For analysis parameters with HFD or VHFD defined as the parameter type, Set HFD Avgs
lets you set the number of averages the analyzer uses when making these measurements.
A value of 16 or larger is recommended. Averaging helps reduce noise.
Procedure
1. Activate a route.
2. From the Route Data Collection screen, press ALT > F1 User Setup > F4 Set HFD Avgs.
3. Enter a number between 1 and 99.
Route
The default is 25.
4. Press Enter.
4.3.4 Set the route data storage mode
Data Storage Mode sets how the analyzer saves collected data. You can set the analyzer to
save all data or to overwrite the previous data.
Procedure
1. Activate a route.
2. From the Route Data Collection screen, press ALT > F1 User Setup > F5 Data Storage
Mode.
3. Press F5 Data Storage Mode to scroll through the options.
Option Description
Always Overwrite Save one set of route data per measurement point, and overwrite any old
data. The default is Always Overwrite.
Query Overwrite Save only one set of route data per point, and ask before overwriting data.
Save All Data Save new route data and keep old data stored on a measurement point.
You can keep multiple sets of data collected for a point.
67
Page 74

Route
4.3.5 Set the overlap
Percent Overlap sets how much each new average overlaps the previous average when
taking a measurement. The higher the overlap percentage, the less newly acquired data is
needed to create a spectrum. A higher percentage decreases the data collection time.
The default overlap, 67 percent, is acceptable for most situations.
Procedure
1. Activate a route.
2. From the Route Data Collection screen, press ALT > F1 User Setup > F6 Percent Overlap.
3. Enter a percent between 0 and 99.
The default is 67 percent.
4. Press Enter.
4.3.6 Set the plot type for live data
Select Live Display sets the type of plot to display on the Route Data Collection screen during
data collection.
Procedure
1. Activate a route.
2. From the Route Data Collection screen, press ALT > F1 User Setup > F8 Select Live
Display.
3. Use the up and down arrow keys to select an option.
Option Description
Status Display the overall and average count. This option has the fastest acquisition. The
default is Status.
Spectrum Display a spectrum for each point.
Waveform Display a waveform for each point.
Dual Displays a waveform and spectrum for each point.
4. Press Enter.
4.3.7 Set the overall mode
Overall mode includes additional frequencies in your measurement points.
68
You can set the Overall mode in AMS Machinery Manager. If the setting for Overall is
different in the analyzer, the setting defined in AMS Machinery Manager is used.
Procedure
1. Activate a route.
Page 75

Route
2. From the Route Data Collection screen, press ALT > F1 User Setup > F9 Set Overall Mode.
3. Use the up and down arrow keys to select an option.
Option Description
Analog The analyzer includes frequencies from 1 Hz to 80 kHz.
Digital The analyzer includes frequencies between the lower and upper cutoff
frequency (Fmax) as defined in the AMS Machinery Manager database. The
default is Digital.
True Peak The analyzer records the highest and lowest peaks from the entire data
collection period in the waveform, uses the total value, and divides it by 2.
Select this option for trending PeakVue technology data.
Average Peak As each waveform is collected, the analyzer records the highest and lowest
value from anywhere within the block and divides this value by 2. After all
blocks are collected, the analyzer averages these individual peak values to
calculate the final Average Peak.
4. Press Enter.
4.3.8 Set the integrate mode
Integrate mode lets you select the units to store the waveform and spectra in the route. You
can also set the Integrate mode in AMS Machinery Manager. If the setting for Integrate mode is
different in the analyzer, the setting defined in AMS Machinery Manager is used.
Procedure
1. Activate a route.
2. From the Route Data Collection screen, press ALT > F1 User Setup > F10 Set Integrate
Mode.
3. Press F10 Integrate Mode to scroll through the options.
Option Description
Time Domain Save the waveform and spectrum in the integrated units. Time Domain
generally provides more accuracy and less low-frequency noise. The default
is Time Domain.
Frequency
Domain
4. Press Enter.
Save the waveform in sensor units and the spectrum in integrated units. If
you analyze slow-speed equipment or move the accelerometer during data
collection, a ski-slope effect or integration leg on the low end of the
spectrum may occur.
69
Page 76

Route
4.3.9 Enable or disable multi-channel group data collection
Keep this option enabled, unless you cannot collect the route data due to a problem with
your multi-axis sensor or multiple sensors. For example, use this option if a route is set up
to use a triaxial accelerometer, but the sensor is unavailable. Disabling multi-channel
groups lets you collect the data with a single one-axis sensor on input A (channel 1).
Only groups set up with multiple channels can be unlinked. Groups with points set up with
channel 1 for a vibration measurement and an additional PeakVue measurement on the
same channel are not unlinked.
Procedure
1. Activate a route.
2. From the Route Data Collection screen, press ALT > F1 User Setup > ALT > F2 Multi
Channel Groups.
Press F2 Multi Channel Groups to enable or disable the option. The default is Enabled.
4.3.10 Display a summary of data collected for grouped measurement points
After you collect data for grouped points, a summary page displays an overview of the data
collected. You can change how long the summary page displays before returning to the
route.
When the group status information is displayed and you use the arrow keys to select a
point, press the Enter key to go to that point within the group.
Procedure
1. Activate a route.
2. From the Route Data Collection screen, press ALT > F1 User Setup > ALT > F3 Group
Status Timer.
3. Enter a number between 0 and 30 seconds.
A 0 disables this feature. The default is 10 seconds.
4. Press Enter.
4.3.11 View or hide warning alarms on the Route Data Collection screen
Warning alarms include baseline ratio (Br), maximum deviations (Bs), and weak side
(Lo/Hi) alarms. You can hide warning alarms during data collection. Even though the
alarms do not appear on the screen, all alarms are saved with the measurement and are
transferred to the AMS Machinery Manager database. Even if you disable Warning alarms,
the Fault and Alert parameter alarms are enabled and display during data collection.
70
Page 77

Procedure
1. Activate a route.
2. From the Route Data Collection screen, press ALT > F1 User Setup > ALT > F5 Warning
Alarms.
3. Press F5 Warning Alarms to enable or disable the option.
The default is Enabled.
4. Press Enter.
4.3.12 Restore default values for route data collection and display parameters
From the Route Data Collection screen, press ALT > F1 User Setup > ALT > F8 Set To Defaults to
restore the default setup.
4.3.13 Override the sensor setup for a route
Route
You can change the sensor if it does not match the sensor setup in the AMS Machinery
Manager database for the measurement point. For example, you may need to change the
sensitivity, or you may not need the analyzer to power the sensor.
Procedure
1. Activate a route.
2. From the Route Data Collection screen, press ALT > F2 Override Control.
3. Set the sensor sensitivity.
a. Press F8 or F9 to select the type of sensor you are using.
b. Press F4 Sensor Sens Override to override the sensor sensitivity defined in AMS
Machinery Manager Dbase.
c. Press F6 Set New Sens and enter a new sensitivity value between 0 and 100.
4. Set the sensor power.
a. Press F10 Sensor Power Override to override the defined sensor power setting.
b. Press F12 New Sensor Power.
5. Press Enter.
Note
The changes apply to only the active route.
4.3.14 Enter new speed or load for a measurement point
If the equipment is running at a different speed or load than specified in the route, you can
override the speed in the route. Change the speed to ensure you collect accurate data.
71
Page 78

Route
You can use a tachometer or CSI 430 SpeedVue Sensor to input the RPM.
Note
If the measurement point is set up for FPM, you are prompted to enter the FPM value rather than the
RPM.
Procedure
1. Activate a route.
2. From the Route Data Collection screen, press ALT > F6 New RPM.
3. Enter a new load value between 0 and 900,000, and press Enter.
4. Press F10 Manual Speed Entry.
5. Enter a new RPM value between 0 and 100,000, and press Enter.
4.4 Tachometers
4.4.1 Set up a tachometer
Note
By default, the analyzer is set up to use the CSI 404 tachometers. The analyzer supports
tachometer/RPM measurements up to 100,000 RPM.
Procedure
1. From the Route Data Collection screen, press ALT > F5 Tach Setup.
The Tachometer Setup screen appears.
2. Set the following options as necessary.
Option Description
F2 Pseudo Tach Enable Pseudo Tach for time synchronous averaging or order tracking
intermediate shafts in gearboxes that cannot be accessed directly. Use the
Pseudo Tach to produce the turning speed signal. The analyzer uses the
following formula: (Incoming tachometer frequency) X ((tach frequency X
the number of teeth on the tached shaft)/number of teeth on the pseudo
shaft). Disable Pseudo Tach when you can use the tachometer directly on a
shaft. The default is Disabled.
F3 Tached Shaft (Only available when Pseudo Tach is enabled.) If the reflective tape is on the
input shaft, enter the number of teeth on the tached shaft, which is the
shaft with the tachometer. The default is 1.
72
Page 79

Route
Option Description
F4 Pseudo Shaft (Only available when Pseudo Tach is enabled.) Enter the number of teeth on
the internal shaft. The analyzer calculates the pseudo tach frequency based
on the number of teeth specified for the tached shaft and pseudo shaft.
The default is 1.
F5 Tach Power Set the analyzer to power the tachometer. If you enable this option, you
can leave the switch on for the CSI 430 SpeedVue sensor during the Laser
Speed Detection Analysis Expert. The default is On.
F7 Set Trigger
Edge
F8 Set Trigger
Level
F9 Set Edge
Delay
F10 Show RPM
F10 Hide RPM
F12 Set Defaults Restore the default values for all tachometer setup options on the screen.
Set the trigger to occur on the rising edge or falling edge of a waveform.
The default is Rising Edge.
Enter the value between -100 and 100 required to start a tachometer
pulse. For Level measurement, set the input that is the source of the
trigger. The default is 2.0 Volts.
Enter the number of seconds between 0 and 16 that occurs between each
tachometer pulse. This helps prevent double triggering. The default is 0.0
seconds.
View or hide the last RPM the tachometer read and the time between each
reading. A last time value of 0 indicates the tachometer is continuously
reading the RPM.
3. Press F6 Save / Recall Setup to save the setup, or press Enter to use the setup without
saving it.
4.4.2 Save a tachometer setup
The saved setup is accessible from all other programs on the analyzer.
Procedure
1. From the Route Data Collection screen, press ALT > F5 Tach Setup.
2. From the Tachometer Setup screen, press F6 Save / Recall Setup.
3. Use the up and down arrow keys to select Empty or another tachometer setup.
4. Press F2 Store Setup.
5. Enter up to 27 characters for the name.
6. Press Enter.
4.4.3 Open a saved tachometer setup
You can open and reuse a setup in any program on the analyzer.
Procedure
1. From the Route Data Collection screen, press ALT > F5 Tach Setup.
2. From the Tachometer Setup screen, press F6 Save / Recall Setup.
3. Use the up and down arrow keys to select a setup.
73
Page 80

Route
4. Press F3 Recall Setup.
The setup appears on the Tachometer Setup screen.
5. Press Enter.
4.4.4 Rename a saved tachometer setup
1. From the Route Data Collection screen, press ALT > F5 Tach Setup.
2. From the Tachometer Setup screen, press F6 Save / Recall Setup.
3. Use the up and down arrow keys to select a saved setup.
4. Press F4 Edit Setup Desc.
5. Enter up to 27 characters for the name.
6. Press Enter.
4.4.5 Delete a tachometer setup
1. From the Route Data Collection screen, press ALT > F5 Tach Setup.
2. From the Tachometer Setup screen, press F6 Save / Recall Setup.
3. Use the up and down arrow keys to select a saved setup.
4. Press F5 Delete Setup.
5. Press Enter.
4.5 Multiple inputs and measurements
Use the multi-channel functionality and the triaxial accelerometer to quickly collect data.
The triax lets you simultaneously collect horizontal, vertical, and axial measurements
without having to move the sensor. This makes your data collection faster and more
efficient.
Set up multiple input measurements
The analyzer supports one, two, three, and four input measurements. Set up and acquire
four-channel measurements the same way as two-channel measurements to get
simultaneous four spectrums or waveforms, or dual orbits for detailed analysis. You cannot
set up these measurements in the analyzer. In AMS Machinery Manager Database Setup,
set up multi-input measurements as individual measurement points that are grouped with
the Signal Group Number field but with a different channel. The measurement points must be
on the same equipment, but they do not need to be sequential in the measurement point
list. Use the AMS Machinery Manager Route Management to add the measurement points
to a route.
When making a multi-channel measurement, the analyzer must display one of the channel
points. Data for each point is acquired simultaneously when that is possible.
74
Page 81

Multiple measurements from a single sensor
The analyzer can acquire data on measurement points, even when the acquisition
parameters are different, using one sensor connected to both inputs. Set up the
measurement points as grouped points, the same way as regular dual points, but change
the points to use the same input.
Data collected simultaneously on the same sensor have the same date and time. This
allows both AMS Machinery Manager and the analyzer to display orbit plots. These plots
are not true orbits because the data is from a single sensor. True orbit plots are displayed
from data collected simultaneously using two or four inputs.
4.6 Collect route data
Prerequisites
• Attach the appropriate sensors to the top of the analyzer and the equipment
measurement point.
• Load a route into the analyzer.
• Activate the route.
• Ensure the route data collection and display parameters are set up properly.
Route
Procedure
1. From the Route Data Collection screen, press Enter to collect data for the displayed
measurement point.
The screen displays the number of averages remaining and the Overall value, if Analog
is selected. The data is automatically saved to the measurement point.
Note
To stop a measurement without saving data, press Reset. Press Enter to restart the
measurement.
2. Move your sensor to the next measurement point. If you enabled Point Advance Mode,
wait for the analyzer to select the next point, or press F7 Next Point or the up arrow to
go to the next point.
3. After you collect the points for the first equipment, press F8 Next Equip to move the
next equipment in the route.
4. Repeat the steps above for all measurement points and equipment in the route.
4.6.1 Listen to live vibration data in Route
After you pair and connect to a Bluetooth device, you can listen to live vibration signal with
headphones. See Section 2.13.4.
75
Page 82

Route
Note
The audio is not stored or recorded.
Procedure
1. From the Route Data Collection screen, press F9 Listen To Live Data. You can also
access Listen To Live Data from a waveform or spectrum plot screen.
The Bluetooth Listener screen appears. You are now listening to the vibration signal.
Note
The Home key is disabled while you are listening to data.
2. Set up the following options as necessary.
Option Description
F1 Volts Accel Select the audio to come from the acceleration input or the volts input.
The default is the input for the active measurement point when you
selected Listen To Live Data.
F2 Input Select the input you want to listen to by selecting input A, B, C, or D. The
default is the input for the active measurement point when you selected
Listen To Live Data.
F4 Acquire Data Begin collecting data and stop listening to vibration data.
Note
If you selected Listen To Live Data from a plot screen, F4 Acquire Data is not
available.
F6 Test Headset Play a test sound to verify the Bluetooth connection to the headphones.
The analyzer generates a test sound for several seconds.
F8 Filter Set the filter for the audio signal. You can select Off (no filter), 2000 Hz High
Pass, or 8000 Hz High Pass.
F9 Gain Increase the amplitude of the audio signal before broadcasting the signal
to the headphones. The signal gain affects the volume. You can also use
the up arrow key.
F10 Gain Decrease the amplitude of the audio signal before broadcasting the signal
to the headphones. The signal gain affects the volume. You can also use
the down arrow key.
F12 Stop or F12
Start
Stop or restart broadcasting the audio to the headphones.
4.6.2 Redo a measurement
1. From the Route Data Collection screen, select the desired point.
2. Press Enter.
76
Page 83

The analyzer collects new data.
4.6.3 Skip equipment or points in a route
1. To skip equipment in a route, press F8 Next Equip on the Route Data Collection
screen.
The equipment listed at the top of the screen changes.
2. To skip a measurement point, press F7 Next Point on the Route Data Collection
screen.
The measurement point listed at the top of the screen changes.
4.6.4 Label equipment as out of service
This label indicates the equipment is shutdown and you could not collect data. The
analyzer applies the label to all measurement points on the equipment and does not let
you collect data. When you transfer the route back to AMS Machinery Manager, the label is
included with the route.
Route
Procedure
1. Activate a route.
2. Ensure the desired equipment is displayed in the route.
3. On the Route Data Collection screen, press ALT > F3 Out Of Service.
The Status field changes.
4. To remove the label, press F3 Out of Service again.
4.6.5 Add or remove a field alert
A field alert places a warning message in the Status field on the Route Data Collection
screen. The field alert is saved with the measurement point and is a reminder to perform
special analysis in AMS Machinery Manager.
When you add a field alert, any previous status messages are removed.
Procedure
1. Activate a route.
2. Ensure the desired measurement point is displayed.
3. From the Route Data Collection screen, press F10 Field Alert.
The Status field displays FIELD ALERT if you collected data on the point. If you did not
collect data, FIELD ALERT displays after you collect data.
4. To remove the field alert, press F10 Field Alert again.
77
Page 84

Route
4.6.6 Delete route data from the current measurement point
Delete data if you collected data for the wrong measurement point or have bad data.
Procedure
1. Activate a route.
2. Ensure the desired measurement point is displayed.
3. From the Route Data Collection screen, press F6 Clear Data.
4. Press Enter.
The Status field displays "Not Measured".
4.6.7 Status messages
Status messages may appear in the Status field on the Route Data Collection screen for a
measurement point. The values that cause these status messages are set in the Analysis
Parameter set in AMS Machinery Manager.
Option Description
Bad Reading The value is lower or higher than the valid signal range of the measurement
point. Check these settings from the Point Setup screen in the AMS
Machinery Manager Database Setup application.
Bad Sensor The voltage level is below or above a certain level, the sensor or cable is not
connected, or the sensor is electrically open or shorted. Press Enter to
collect data anyway, or press Back to stop the measurement. The data is
marked as collected with a bad sensor.
Note
You must set up AMS Machinery Manager Data Transfer to accept bad
sensor data before you can download this data to the AMS Machinery
Manager database.
Field Alert You added a field alert.
High Alarm 1 The overall Alert value exceeded Dual Upper Absolute and Out of Window
Absolute alarms.
High Alarm 2 The overall Fault value exceeded Dual Upper Absolute and Out of Window
Absolute alarms.
High Signal The signal is less than the upper validity limit of the sensor signal and
greater than the weak side value. In Dual Lower Delta alarms, the high
signal can occur when the baseline value plus the weak side value is
exceeded, but the value is less than the upper sensor validity range.
Low Alarm 1 For Dual Lower Delta type alarms, the baseline value minus the Alert value
was exceeded. For Dual Lower Absolute alarms, the Alert value was
exceeded.
78
Page 85

Route
Option Description
Low Alarm 2 For Dual Lower Delta type alarms, the baseline value minus the Alert value
was exceeded. For Dual Lower Absolute alarms, the Fault value was
exceeded.
Low Signal Measured value is less than the weak side setup but greater than the lowest
valid signal level for a Dual Upper Absolute and Out of Window Absolute
type alarm.
Not Measured No measurements were made on this measurement point.
Notes You added a note. Other status messages may override the Notes message.
OK All measurements are within normal amplitude values.
Out Of Service You labeled equipment as out of service. No route data is collected, and the
out of service note is transferred with the route point.
Warning For DU-A type alarms, the baseline value was exceeded but has not reached
the alert level.
Window Alarm The measured values are outside the valid alarm window for an In Window
Absolute Alarm. This is used when a parameter must stay outside a set
range.
Vib Alarm One of the parameters exceeded an alarm level.
4.7 Notes
Notes let you make comments and observations about the equipment you are monitoring. The analyzer saves notes with your measurement data. When you transfer the route to AMS Machinery Manager, the note is included with the measurement point.
You can create up to 25 notes on the analyzer. You can also use pre-defined notes created
in AMS Machinery Manager that are included with the route. This lets you quickly add
common notes to a route. Notes are organized by groups, so you can scroll through
groups of similar notes.
4.7.1 Create a note in the analyzer
You can create and modify up to 25 notes in the analyzer. User-defined notes are stored in
internal memory, and they are not removed when you delete routes or route data.
Procedure
1. Activate a route.
2. From the Route Data Collection screen, press F4 Notes > F2 User Defined Notes > F1
Create User Note.
3. Enter up to 32 characters for the note.
4. Press ALT to view and enter special characters, if necessary.
5. Press Enter.
79
Page 86

Route
The new note appears under the User Defined Notes section on the Notes screen.
4.7.2 Delete a note from the analyzer
You can delete user-defined notes from your analyzer.
Procedure
1. Activate a route.
2. From the Route Data Collection screen, press F4 Notes > F2 User Defined Notes.
3. Press F8 or F9 to select a note.
4. Press F7 Delete User Note.
5. Press Enter.
4.7.3 Add a note to a measurement point
1. Activate a route.
2. Ensure the desired measurement point is displayed.
3. From the Route Data Collection screen, press F4 Notes.
4. Press F7 Next Group to view the groups of predefined notes, or press F2 User Defined
Notes to select a note you created.
5. Press F8 or F9 to select a note.
6. Press F3 Add To Point.
The selected note appears under Assigned Notes.
7. Press Enter.
"Notes" appears in the Status field for your measurement point if you did not collect
data.
4.7.4 Delete notes from a measurement point
1. Activate a route.
2. Ensure the desired measurement point is displayed.
3. From the Route Data Collection screen, press F4 Notes.
4. To remove one note, press the up and down arrows to select a note, and press F5
Remove From Point.
5. To remove all notes, press F6 Clear All Notes.
6. Press Enter.
The Status field is updated.
80
Page 87

4.8 Plot data
You can plot collected data as a waveform or a spectrum, if you set up your route for this in
AMS Machinery Manager. While viewing the spectrum, you can view any fault frequency
information downloaded with route.
Procedure
1. Activate a route.
2. Go to the desired measurement point.
3. From the Route Data Collection screen, press F5 Plot Data.
A graph of the collected data appears. If multiple plots appear, a red box surrounds
the active plot.
4. Modify the plot as necessary.
5. Press Enter to return to the Route Data Collection screen.
Route
4.9 Run Analyze to collect data for a route measurement point
If you see unusual data for a measurement point, you can open the Analyze program to
collect additional data to troubleshoot the problem. Press the F12 Run Analyze key on the
Route Data Collection screen to open Analyze.
The Analyze main menu shows the route name, equipment name, area, and the
measurement point. Collect data using predefined measurements called Analysis Experts or
set up measurements in Manual Analyze. If you open Analyze from Route, the analyzer may
prompt you to use your route parameters.
Note
Emerson recommends collecting route data and marking a frequency on a plot with a cursor before
you select an Analysis Expert or measurement in Analyze.
When you open Analyze from Route, there are several limitations:
• Alarms or parameter sets for the route are not applied to the data you collect in
Analyze.
• Job data is not trended.
• Two and four channel measurements are unavailable, unless your measurement
points are set for these measurements.
Note
After you collect the data, store it. The analyzer does not automatically save the collected data from
Analysis Experts to a route or job. You can temporarily view data from the Review Data option in Analyze.
81
Page 88

Route
4.9.1 Open Analyze from a route measurement point
1. Activate a route.
2. Ensure the desired route measurement point is displayed on the Route Data
Collection screen.
3. Press F12 Run Analyze.
The Analyze menu main appears and lists the route information at the top of the
screen.
4.10 View the measurement point setup and history
4.10.1 View the data stored to a measurement point
When you view the data, you can also delete the data set, plot the data for that point, or
view the Analysis Parameters set.
Procedure
1. Activate a route.
2. Ensure the desired measurement point is displayed.
3. From the Route Data Collection screen, press ALT > F12 More Point Info > F2 View Stored
Data.
The Stored Data screen displays the time and type of data stored.
4. You can plot the data, delete the data, or view the Analysis Parameters.
5. Press Enter.
4.10.2 View a status summary of all points in the current group
1. Activate a route.
2. Ensure the desired measurement point is displayed.
3. From the Route Data Collection screen, press ALT > F12 More Point Info > F3 Show Group
Status.
The Group Summary screen displays point ID, reading, and the status.
4. Press Enter.
4.10.3 View the trend history for a measurement point
82
If you enabled trend data in AMS Machinery Manager Data Transfer, you can view the
previous measurements for a route measurement point as a trend graph. The data
includes both historical data from the AMS Machinery Manager database and data
collected from the analyzer.
Page 89

Procedure
1. Activate a route.
2. Ensure the desired measurement point is displayed.
3. From the Route Data Collection screen, press ALT > F12 More Point Info > F4 View Trend
History.
A plot appears.
4. Modify the plot as necessary.
5. Press Enter.
4.10.4 View the sensor setup for a measurement point
You can view the sensor parameters for the active route measurement point. If necessary,
you can override this setup on the analyzer if the appropriate sensor is not available. See
Section 4.3.13. You cannot change the values from the Sensor Setup screen on the
analyzer.
Procedure
Route
1. Activate a route.
2. Ensure the desired measurement point is displayed.
3. From the Route Data Collection screen, press ALT > F12 More Point Info > F8 Sensor
Setup.
The Sensor Setup screen displays the sensor type, sensitivity, power, signal
coupling, and accelerometer configuration display.
4. Press Enter.
4.10.5 View the dB reference values
You can view the dB reference values downloaded from AMS Machinery Manager Data
Transfer with the route.
Procedure
1. Activate a route.
2. Ensure the desired measurement point is displayed.
3. From the Route Data Collection screen, press ALT > F12 More Point Info > F9 View dB Ref.
4. Press Enter.
4.10.6 View parameters in the Analysis Parameters (AP) set
You can view the parameters set up in the Analysis Parameter set in AMS Machinery
Manager. This includes the measured value, percent of fault, and any parameters that may
be in alert or fault.
83
Page 90

Route
Procedure
1. Activate a route.
2. Ensure the desired measurement point is displayed.
3. From the Route Data Collection screen, press F11 View Parms.
A list of parameters appears under the Status field. The background color of the
alarm status indicates the severity relative to the alarm level.
4. Press F1 or F7 to move to another measurement point in the route, if necessary.
5. Press Enter.
4.11 Route reports
You can create and send route reports to AMS Machinery Manager or to a memory card
inserted into your analyzer. The route report displays information for all equipment and
their measurement points in the active route.
4.11.1 Print a route report to AMS Machinery Manager
A route report displays information for all equipment and their measurement points for
the active route. When you print a report from the analyzer, the report is saved to a file on
the AMS Machinery Manager computer.
Prerequisites
• On the analyzer, press Home > ALT > F2 General Setup > F6 Set Print Mode and ensure the
default print mode is set to Send to PC.
• Ensure the same connection type is set on the analyzer and in Data Transfer. The
Ethernet and Wireless options may require additional setup to connect to the
desired computer. See the Ethernet and Wireless sections and your IT group for
more information.
Procedure
1. Use the appropriate cable to connect your analyzer to a computer where AMS
Machinery Manager is installed, if you are using a wired connection.
2. On the computer, open Data Transfer.
3. Activate a route.
4. From the Route Data Collection screen, press ALT > F11 Print Route Report.
5. Select the data to include in the report.
84
Option Description
F1 Set To Current Equip Set the first and last point to match the points on the current
equipment.
F2 Starting Point Enter the first point.
Page 91

Option Description
F3 Ending Point Enter the last point.
F4 Route Data Select the route data to print.
F5 Bar Graph Options Print a bar graph with or without labels.
F10 Notes Option Include or exclude notes.
F11 Plots Option Include or exclude spectrum and waveform plots.
F12 Analyze Data Include or exclude data collected with Analyze.
6. Press F7 Print to send the files to AMS Machinery Manager.
The analyzer displays the progress. Wait until the transfer completes.
Note
Press Reset to cancel.
4.11.2 Print a route report to a memory card
Route
A route report displays information for all equipment and their measurement points for
the active route. You can print the report to a memory card inserted into your analyzer.
See Section 2.12.1 for more information on inserting a memory card.
Prerequisites
On the analyzer, press Home > ALT > F2 General Setup > F6 Set Print Mode and ensure the
default print mode is set to Store as BMP on CARD or Store as JPG on CARD.
Procedure
1. Activate a route.
2. From the Route Data Collection screen, press ALT > F11 Print Route Report.
3. Select the data to include in the report.
Option Description
F1 Set To Current Equip Set the first and last point to match the points on the current
equipment.
F2 Starting Point Enter the first point.
F3 Ending Point Enter the last point.
F4 Route Data Select the route data to print.
F5 Bar Graph Options Print a bar graph with or without labels.
F10 Notes Option Include or exclude notes.
F11 Plots Option Include or exclude spectrum and waveform plots.
F12 Analyze Data Include or exclude data collected with Analyze.
4. Press F7 Print.
85
Page 92

Route
5. Enter up to 8 characters for a file name.
6. Press Enter.
The analyzer begins creating and saving the file to the memory card. The progress is
displayed on the screen.
86
Page 93

5 Plots
Topics covered in this chapter:
• View a full screen version of the plot
• Select an active plot
• Switch the plot type
• Add or remove a cursor
• Change the cursor type
• Change the scale of the x and y axis
• Expand or compress the X axis
• View the highest frequency peaks on the spectrum plot
• Set RPM
• View fault frequencies
Plots
When you collect or review data, the analyzer displays the information as one or more
plots. You can modify the plots at any time. Use plotting tools to examine your data. Mark
frequencies with a cursor, determine harmonics, and expand or compress the axis with the
plot functions. The following chapter describes the plot functions available in all programs
on the analyzer.
Each program lets you display data as a waveform and spectrum. You can display multiple
graphs at one time.
5.1 View a full screen version of the plot
When you select full screen view, the plot displays on the entire screen and the function
keys do not display.
Procedure
1. Plot the data.
2. With a plot displayed, press F4 Full Screen.
3. Press Back to close the full screen view.
5.2 Select an active plot
Any keys you press or changes you make apply to only the active plot.
Procedure
1. Plot the data.
87
Page 94

Plots
2. With a plot displayed, press F5 Change Active Plot.
A red box surrounds the active plot on the screen.
5.3 Switch the plot type
You can change the type of plot used to display the collected data. The available options
vary based on the type of data you collected. For example, if you used two inputs for
collecting spectrum data, an orbit plot may be available.
Note
If you collected single channel data, Switch Plot Type cycles through spectrum, waveform, or
spectrum and waveform. If you collected two or four channel data, the Switch Plot Type menu lists all
available plots for the acquired data.
Procedure
1. Plot the data.
2. With the plot displayed, press F6 Switch Plot Type.
3. Select the desired plot type.
5.4 Add or remove a cursor
Cursors help you analyze a plot by displaying the value of a point.
Procedure
1. Plot the data.
2. Add a cursor by doing one of the following:
• Press the left or right arrow key.
• Touch the plot on the screen. Slide your finger across the screen to jump peaks
with the cursor.
• Press F10 Cursor Mark.
A red square appears on the active plot to show the current point. The amplitude,
frequency, or time values of the selected point are displayed at the bottom of the
plot.
3. Move the cursor to the desired location by doing one of the following:
a. Touch the plot or use the left and right arrow keys to move the cursor to the
desired location on the plot.
b. Press ALT > F3 Cursor Home to move the cursor to the beginning of the plot.
c. Press ALT > F9 Cursor End to move the cursor to the right side of the plot.
d. Press ALT > F4 Clear Cursor to remove the cursor.
88
Page 95

5.5 Change the cursor type
You can change the type of cursor to display different types of information on a plot. The
types of cursors vary based on the selected plot type.
Procedure
1. Plot the data.
2. With a plot displayed, press ALT > F2 Cursor Type.
3. Press F2 Cursor Type until the appropriate cursor type appears.
Option Description
Delta Time The amplitude and time of the current location are shown just below the plot.
When you press the Mark key, the current location is marked. As you move
the cursor, the time difference (Delta-T) between the marked point and the
new cursor position displays in the upper right corner of the plot. The screen
displays a frequency (Delta-F), which is calculated as the reciprocal of the
time difference. This is useful for waveforms.
Difference
Family
Harmonic The primary cursor is red and all harmonics related to the primary frequency
Harmonic
Family
Moving
Harmonic
Normal An individual cursor appears on the plot. The frequency and amplitude
Sideband Displays the Delta-F and values between a reference and active cursor (Delta-
The difference families of the data are calculated and the first family is used
to draw the difference cursors. This is similar to the “Sideband” cursors, but
the “Next Peak” key changes to a “Next Family” key. This lets you jump
through the calculated difference families, and increases the number of
sideband cursors.
are displayed with black square boxes.
The harmonic families of the data are calculated and the first family is used to
draw the harmonic cursors. This is similar to the Moving harmonic option,
except that you can jump to the next family of harmonics rather than the
next peak.
Similar to the Harmonic cursor, but the fundamental frequency is not
stationary. As you move the cursor, the harmonic markers move to reflect
the harmonic frequencies of the current cursor location.
update as you move the cursor.
A).
Plots
5.6 Change the scale of the x and y axis
You can change the x or y axis to a linear or log plot and the maximum and minimum x and
y values. You can also slide your finger up on the plot to increase the Y scaling.
Procedure
1. Plot the data.
2. Press ALT > F6 Set Axis Scales.
89
Page 96

Plots
3. Press the appropriate key to select the x or y axis and enter the new values.
4. Press Enter.
5. Press Enter to return to the plot.
5.7 Expand or compress the X axis
You can zoom in or zoom out of a plot. If a cursor is active, the plot centers on the cursor
position. If no cursor is active, the new scale expands from the left side of the plot.
Procedure
1. Plot the data.
2. With a plot displayed, press F11 Expand X Axis or the up arrow key on the analyzer to
zoom in on the data.
Press F11 Expand X Axis until the active plot displays the correct level of data.
3. Press F12 Compress X Axis or the down arrow key to zoom out.
5.8 View the highest frequency peaks on the spectrum plot
1. Plot the data.
2. With the spectrum plot displayed, press ALT > F7 List Peaks.
A list of the 20 highest peaks, based on amplitude, appears on the plot.
3. Use the function keys to scroll through the list of peaks.
4. Press Enter to return to the plot.
The cursor moves to the peak selected in the previous step.
5. If necessary, press F8 Next Peak to move the cursor to each peak on the plot.
Note
If you use a Harmonic Family cursor, the F8 key is labeled Next Family and the cursor moves to
the next family of frequencies.
5.9 Set RPM
90
Set RPM only works if additional Analyze data is collected for a route point. The RPM
marked becomes the new speed for the next route point.
Page 97

The Order selection is only available if Analyze data is collected for a route point setup.
After the RPM is set, press the F5 X-Axis Units to toggle from Hz, CPM, and Orders.
Procedure
1. Plot the data.
2. Press ALT > F1 Set RPM.
5.10 View fault frequencies
Note
If the input is configured as a gearbox with multiple shafts, all the information may not display on the
plot due to limited space. Press F1 Fault Freq List to view more data. The exact fault frequency is
highlighted in the entry list and a checkmark is next to the fault ID.
Fault frequencies can help you pinpoint which part of the equipment has a problem.
Procedure
Plots
1. Plot the data.
2. With a plot displayed, press F1 Fault Freq List.
3. Use the F8 or F9 keys to select a fault frequency entry.
4. Press F5 Select/Unselect.
A checkmark appears next to the ID. The ID and description are the fault associated
with the fault frequency entry.
5. Press F10 Change Units to change the base frequency units.
6. Press Enter.
The active plot is updated.
7. Press F8 Next Fault Freq or F2 Prev Fault ID to view IDs in the fault entry list.
F8 Next Fault Freq selects IDs from the beginning of the list, and F2 Prev Fault Freq starts
at the bottom of the list. If a single fault ID was added, the previous fault ID is cleared
and replaced with the next ID. If multiple fault IDs were added, the plot is cleared
and replaced with the first fault ID from the list.
91
Page 98

Plots
92
Page 99

Analyze and Advanced Analyze
6 Analyze and Advanced Analyze
Topics covered in this chapter:
• Analyze overview
• Manage jobs
• Set display parameters
• Multi-input measurements
• Sensors and inputs
• Tachometers
• Common data collection parameters
• Collecting data using an Analysis Expert
• Collect data using Manual Analyze
• Listen to live vibration data in Analyze
• Redo a measurement
• Store data to a route or a job
• Review collected data
• Print an Analyze plot to AMS Machinery Manager
• Print an Analyze plot to a memory card
• Reset Analyze defaults
6.1 Analyze overview
The Analyze program lets you collect data to troubleshoot a problem. You can collect data
for a route point, or create a job that is not associated with a route. Collect data using
predefined measurements called Analysis Experts or create your own measurements in
Manual Analyze.
Each Analysis Expert, such as a Bump Test, has a set of predefined parameters to minimize
setup. The parameters can include Fmax, averaging, and lines of resolution. The
parameters should be appropriate for most measurements. In Manual Analyze, you must set
up all the parameters for your measurements.
Note
For best results, collect route data and use a cursor to mark a frequency in the spectrum before
running an Analysis Expert.
To use the Analyze or Advanced Analyze program:
1. Create a job, open a job, or open Analyze from a route measurement point. You must
use a job or open Analyze from Route to save your data.
2. Set up the sensors or tachometer.
93
Page 100

Analyze and Advanced Analyze
3. Select an Analysis Expert or mode in Manual Analyze to collect the desired type of data.
4. Modify any data collection parameters in Manual Analyze. The data collection
parameters vary based on the selected Analysis Expert or Manual Analyze mode.
5. Collect the data.
6. View the plot.
7. Store the data to a job or route.
6.1.1 Open or close the Analyze program
1. To open Analyze, do one of the following:
• From the Route Data Collection screen, press F12 Run Analyze.
• From the Home screen, press F7 Analyze or F7 Adv. Analyze.
2. To close Analyze, press ALT > F7 Exit Analyze.
6.1.2 Analyze main menu
If you open Analyze from a route, the Analyze main menu looks different from the image
below. The screen will display the route name, equipment, the route area, and the
measurement point.
94
 Loading...