

Page 1

026-1724 Rev 0 12-MAY-2008
Copeland®
PerformanceAlert™
Gateway System
Installation and
Operation Manual
Page 2

Page 3

1640 Airport Road, Suite 104
Kennesaw, GA 30144
Phone: (770) 425-2724
Fax: (770) 425-9319
ALL RIGHTS RESERVED.
The information contained in this manual has been carefully checked and is believed to be accurate. However, Computer Process Controls, Inc. assumes no responsibility for any inaccuracies that may be contained herein. In no event will
Computer Process Controls, Inc. be liable for any direct, indirect, special, incidental, or consequential damages resulting
from any defect or omission in this manual, even if advised of the possibility of such damages. In the interest of continued
product development, Computer Process Controls, Inc. reserves the right to make improvements to this manual, and the
products described herein, at any time without notice or obligation.
Page 4

Page 5

Table of Contents
1 OVERVIEW ................................................................................................................................................................... 1
1.1. T
HE PERFORMANCEALERT™ GATEWAY SYSTEM ....................................................................................................... 1
1.2. T
HE PERFORMANCEALERT™ GATEWAY BOARD......................................................................................................... 1
1.3. T
HE PERFORMANCEALERT™
D
IAGNOSTIC MODULE ........................................................................................................................................................... 1
1.4. H
AND-HELD TERMINAL ............................................................................................................................................... 2
2 GATEWAY BOARD MOUNTING ............................................................................................................................. 3
3 GATEWAY POWER
WIRING............................................................................................................................................................................... 4
4 NETWORKING............................................................................................................................................................. 5
4.1. C
ONNECTING THE PERFORMANCEALERT™ MODULES TO THE GATEWAY BOARD..................................................... 5
4.1.1. PerformanceAlert™ Module MODBUS Wiring ................................................................................................... 5
4.1.2. PerformanceAlert™ Module MODBUS Addressing ............................................................................................ 6
4.1.3. Gateway MODBUS Wiring................................................................................................................................... 6
4.1.4. MODBUS Termination ......................................................................................................................................... 6
4.2. C
ONNECTING THE GATEWAY TO THE RS485 I/O NETWORK ....................................................................................... 6
4.2.1. Gateway Board Numbering .................................................................................................................................. 7
4.2.1.1. Setting the Gateway Address Switch .................................................................................................................................. 7
4.2.2. Setting the Baud Rate Dip Switches ...................................................................................................................... 7
4.2.3. Gateway Board RS485 I/O Termination............................................................................................................... 8
5 GATEWAY SOFTWARE SETUP............................................................................................................................... 9
6 PERFORMANCEALERT™
I/O SUMMARY................................................................................................................................................................. 10
6.1. E2 I/O B
6.2. I/O S
OARD SETUP ................................................................................................................................................. 10
ETUP FOR CONDENSED MODE ............................................................................................................................ 10
6.2.1. Condensed Mode Point Setup ............................................................................................................................. 10
6.3. I/O S
ETUP FOR EXPANDED MODE .............................................................................................................................. 11
6.3.1. Expanded Mode Point Setup ............................................................................................................................... 11
7 OPERATION ............................................................................................................................................................... 14
7.1. P
ERFORMANCEALERT™ STAT SUMMARY ................................................................................................................. 14
7.1.1. Screen 1: Comm Status ....................................................................................................................................... 14
7.1.2. Screen 2: PF Alert Alarm Status......................................................................................................................... 14
7.1.3. Screens 3 through 6: Firmware Versions ........................................................................................................... 15
7.2. I
NDIVIDUAL PERFORMANCEALERT™ MODULE STATUS............................................................................................ 15
7.2.1. Individual Module Status .................................................................................................................................... 15
7.2.1.1. Screen 1............................................................................................................................................................................. 15
7.2.1.2. Screen 2............................................................................................................................................................................. 16
7.2.1.3. Screen 3............................................................................................................................................................................. 16
7.2.1.4. Screen 4............................................................................................................................................................................. 16
7.2.1.5. Screen 5............................................................................................................................................................................. 16
7.2.2. Individual Module History .................................................................................................................................. 16
7.2.2.1. Screens 1 and 2 ................................................................................................................................................................. 16
7.2.2.2. Screens 3 through 11......................................................................................................................................................... 16
7.2.2.3. Screens 12 and 13 ............................................................................................................................................................. 17
7.2.2.4. Screen 14........................................................................................................................................................................... 17
026-1724 Rev 0 12-MAY-2008 Table of Contents • v
Page 6

7.2.2.5. Screens 15 through 17....................................................................................................................................................... 17
7.2.2.6. Screen 18 and 19............................................................................................................................................................... 17
7.2.3. Individual Module Configuration........................................................................................................................ 17
7.2.3.1. Screen 1: Rack # and Install Date ..................................................................................................................................... 17
7.2.3.2. Screen 2: Date of Installation............................................................................................................................................ 18
7.2.3.3. Screen 3: Customer Code ................................................................................................................................................. 18
7.2.3.4. Screen 4: Compressor Model............................................................................................................................................ 18
7.2.3.5. Screen 5: Serial Number ................................................................................................................................................... 18
7.2.3.6. Screen 5: Setpoints............................................................................................................................................................ 18
7.2.3.7. Screens 6 through 8: Lockout Setpoints ........................................................................................................................... 18
7.2.4. Communication Statistics.................................................................................................................................... 19
7.2.5. Resets................................................................................................................................................................... 19
7.2.5.1. Clear History Log ............................................................................................................................................................. 19
7.2.5.2. Reset PerformanceAlert™ Module................................................................................................................................... 19
8 E2 APPLICATIONS .................................................................................................................................................... 20
8.1. P
ASSING PERFORMANCEALERT™ ALARM DATA TO THE E2 ADVISORY LOG........................................................... 20
8.1.1. Generic Alarming Setup...................................................................................................................................... 20
8.1.2. Alarm Parameter Settings ................................................................................................................................... 20
8.1.2.1. Digital Alarms................................................................................................................................................................... 20
8.1.2.2. Analog Alarms .................................................................................................................................................................. 21
8.1.3. Advisory Values and Priorities ........................................................................................................................... 22
8.1.4. How the Alarm Appears in the E2 Advisory Log ................................................................................................ 22
8.2. U
SING PERFORMANCEALERT™ CURRENT TRANSDUCER VALUES AS COMPRESSOR PROOFS................................... 22
8.2.1. Creating Analog Sensor Control Applications.................................................................................................... 22
8.2.2. Programming Analog Sensor Control Applications ........................................................................................... 22
8.2.2.1. General.............................................................................................................................................................................. 23
8.2.2.2. Inputs ................................................................................................................................................................................ 23
8.2.2.3. Setpoints............................................................................................................................................................................ 23
8.2.3. Setting Up Proofing in Suction Group Applications........................................................................................... 23
vi • PerformanceAlert Gateway I&O Manual 026-1724 Rev 0 12-MAY-2008
Page 7
1 Overview
1.2. The PerformanceAlert™
The PerformanceAlert™ Gateway is designed to allow
the Emerson Climate Technologies Retails Solutions family of site controllers (E2, Einstein, and REFLECS) to in-
terface directly with up to 14 Copeland
®
PerformanceAlert™ Diagnostic Modules.
The Gateway uses two network ports: one, a MODBUS
port used to connect the Gateway with the PerformanceAlert™ modules, and the second an I/O network port
that connects the Gateway to the I/O network of an E2 or
Einstein control system (or COM A/D of a REFLECS network).
The Gateway mimics the behavior of a MultiFlex 16 input board, passing along data from the PerformanceAlert™
modules about compressor behavior to the site controller in
the form of virtual board/point addresses. The Gateway’s
board/point addresses may be used by the site controller for
I/O control, logging, and alarming.
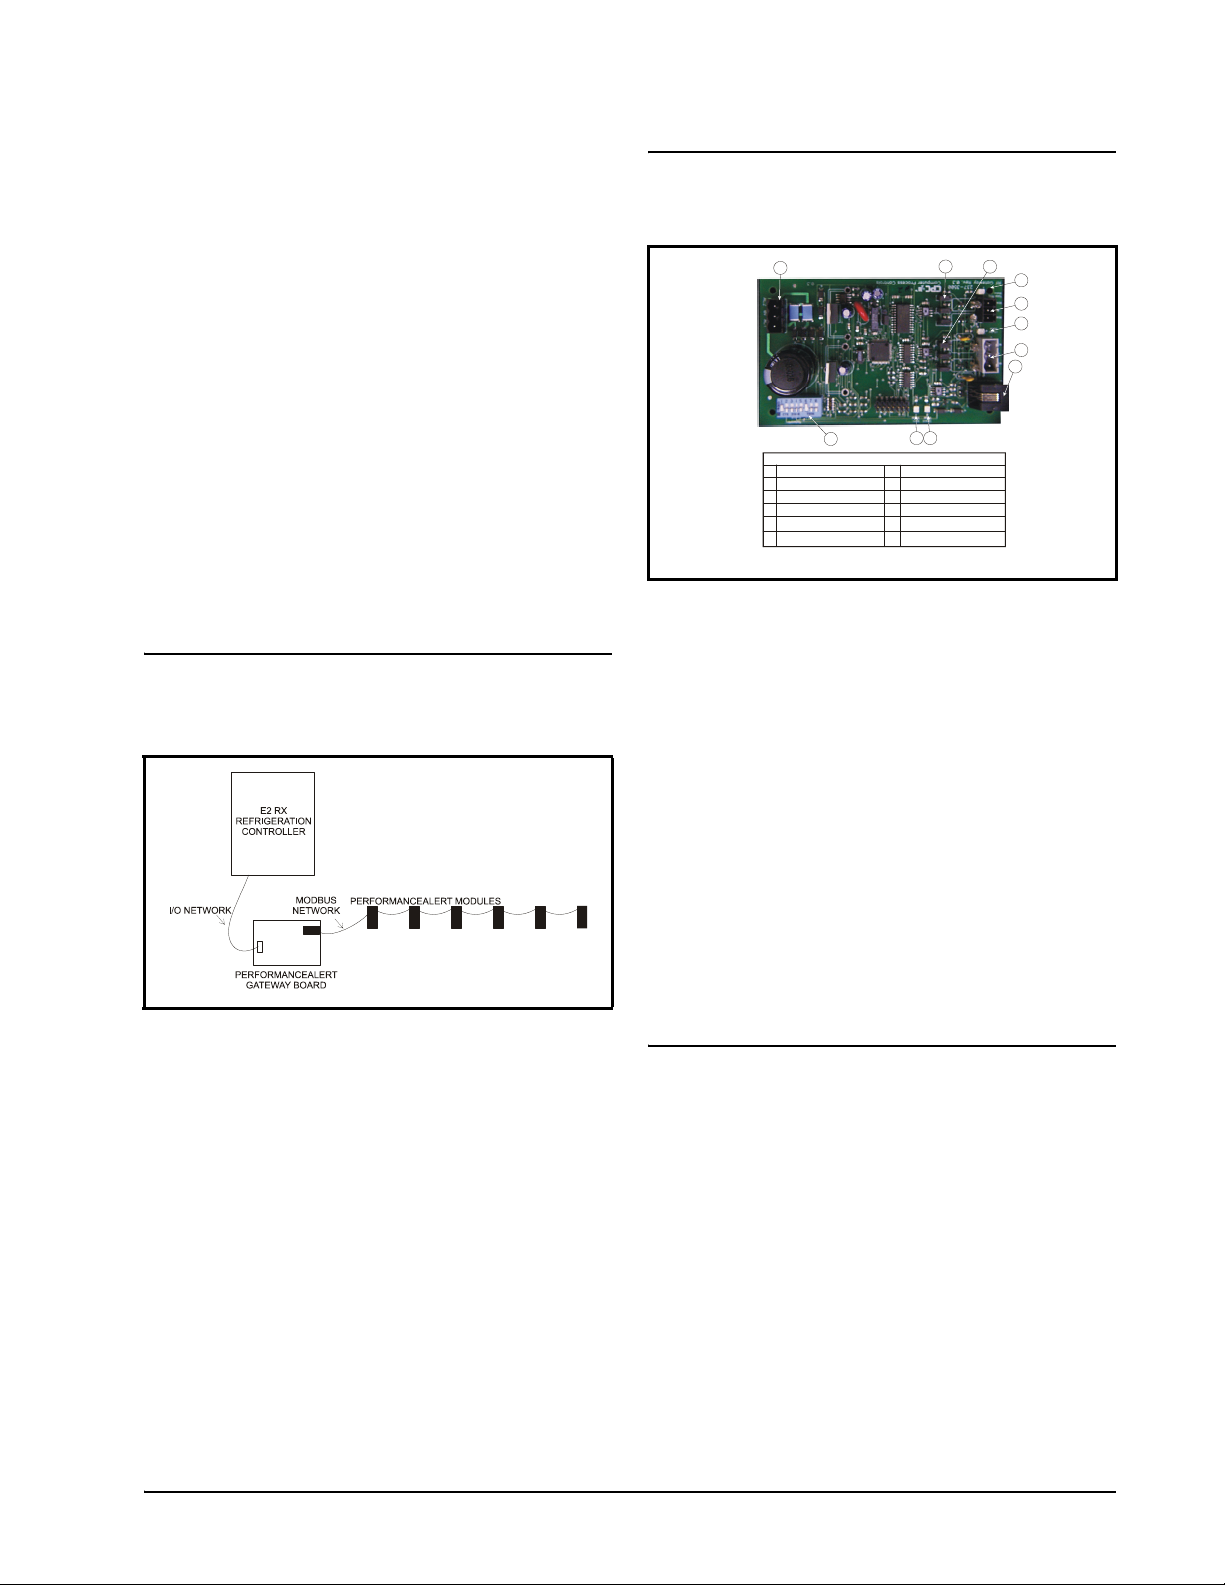
1.1. The PerformanceAlert™
Gateway System
Gateway Board
5
9
7
1
Hand-Held Terminal Jack
2
RS485 I/O Network
3
RS485 Receiver Bus Net
I/O Net Term Jumpers
4
5
Receiver Bus Term Jumpers
6
General Status LED
LEGEND
7
Alarm Status LED
Dip Switch
8
Power Connector
9
I/O Net Status LED
10
Receiver Bus Status LED
11
Figure 1-2 - Gateway Board
The PerformanceAlert™ Gateway (Figure 1-2) allows
you to connect up to fourteen (14) PerformanceAlert™ Diagnostic Modules. On the I/O network, the Gateway board
mimics the behavior of one or more 16AI boards, which
use virtual 16AI board/point addresses to pass along information from the modules to the E2.
The PerformanceAlert™ Gateway is capable of operating in one of two different modes: a Condensed Mode,
which maps a single 16AI point to the alarm status of each
PerformanceAlert™ module, and an Expanded Mode,
which maps sixteen 16AI points for each module, including alarm status for all alarm types, current transducer values, and discharge line temperature.
4
11
3
10
2
1
68
26502044
In Condensed Mode, the PerformanceAlert™ Gateway
mimics the equivalent of one 16AI board. In Expanded
Mode, the PerformanceAlert™ Gateway mimics the equiv-
Figure 1-1 - Typical Layout of PerformanceAlert™ Modules and Gateway Board
A typical layout of a CPC-controlled Perfor-
manceAlert™ network configuration is shown in Figure 1-
alent of up to fourteen 16AI boards.
1.3. The PerformanceAlert™
Diagnostic Module
1. Each compressor in each rack is equipped with one PerformanceAlert™ Diagnostic Module. All modules are
wired together in a single MODBUS daisy-chain and connected to the PerformanceAlert™ Gateway board. The
Gateway Board is also connected to the E2 via the I/O network, where it mimics the behavior of a MultiFlex input
board (16AI) and sends values from the modules to the E2
as virtual board/point addresses.
The Copeland® PerformanceAlert™ Diagnostic Module is a breakthrough innovation for troubleshooting refrigeration system faults. The module can be installed in the
electrical box of the condensing unit near the compressor
contactor or in the electrical panel of a refrigeration rack
system. By monitoring and analyzing data from the Cope-
®
land
brand compressors, the module can accurately detect
the cause of electrical and system related issues.
The PerformanceAlert™ Gateway System Overview • 1
Page 8
The PerformanceAlert™ Gateway is compatible with
the following PerformanceAlert™ module part numbers:
P/N
®
Application
®
Perfor-
Copeland
943-0059-00 1-phase Scroll
943-0057-00 3-phase Scroll
943-0053-00 1-phase Reciprocating
943-0055-00 3-phase Reciprocating
Table 1-1 - Copeland® PerformanceAlert™ Module Part Numbers
Installation and operation of the Copeland
manceAlert™ Diagnostic Module is documented and supported by Copeland
®
, and is beyond the scope of this
document. For more information, visit www.EmersonClimate.com or contact Emerson Climate Technologies, Inc.
at 1-888-EMR-9950.
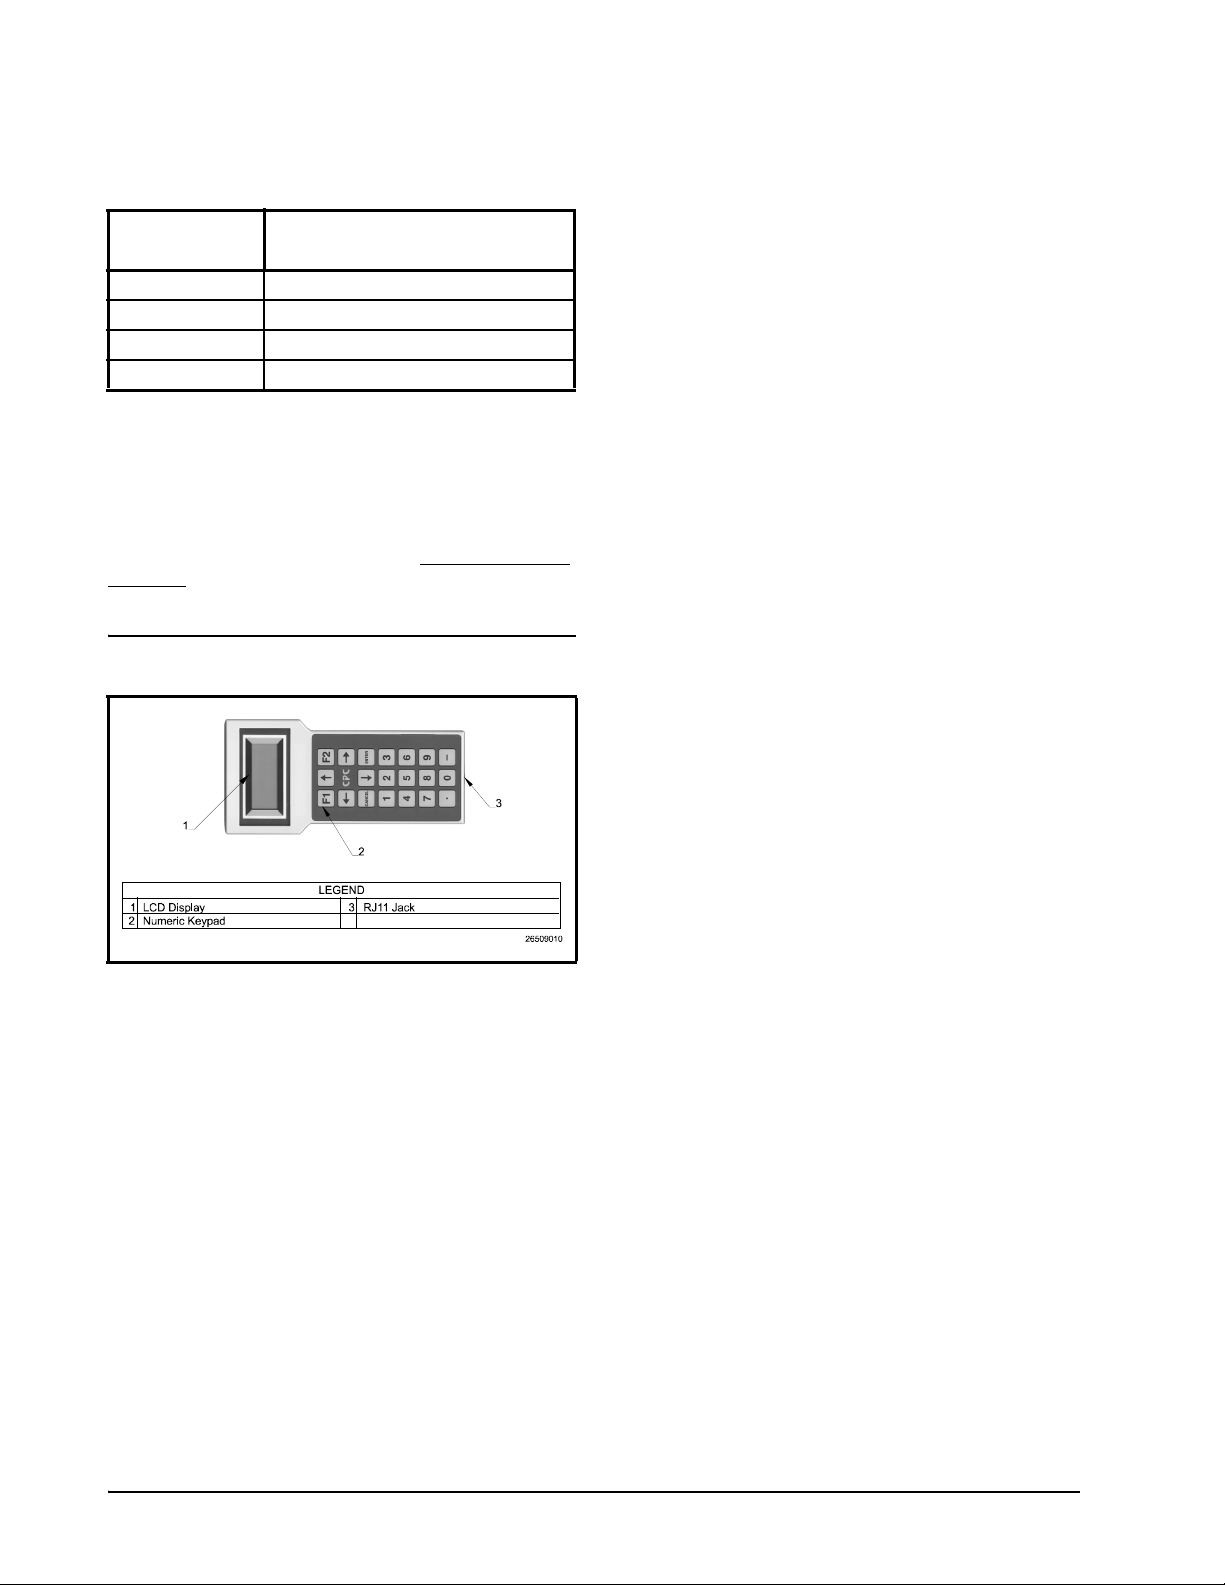
1.4. Hand-Held Terminal
Figure 1-3 - Hand-Held Terminal (HHT)
The Hand-Held Terminal (HHT) (P/N 811-3110),
shown in Figure 1-3, connects directly to the RJ11 jack on
the Gateway and is used to configure and view status for
the Gateway and its associated modules.
2 • PerformanceAlert Gateway I&O Manual 026-1724 Rev 0 12-MAY-2008
Page 9
2 Gateway Board
Mounting
The Gateway is typically mounted in the same area as
the site controller, near the controller’s 16AI, 8RO, and
other RS485 Network peripherals. The Gateway is designed to fit into a standard 3" snap track (supplied with the
board) or may be mounted in a panel or on stand-offs. Follow the dimensions in Figure 2-1 for panel mounting.
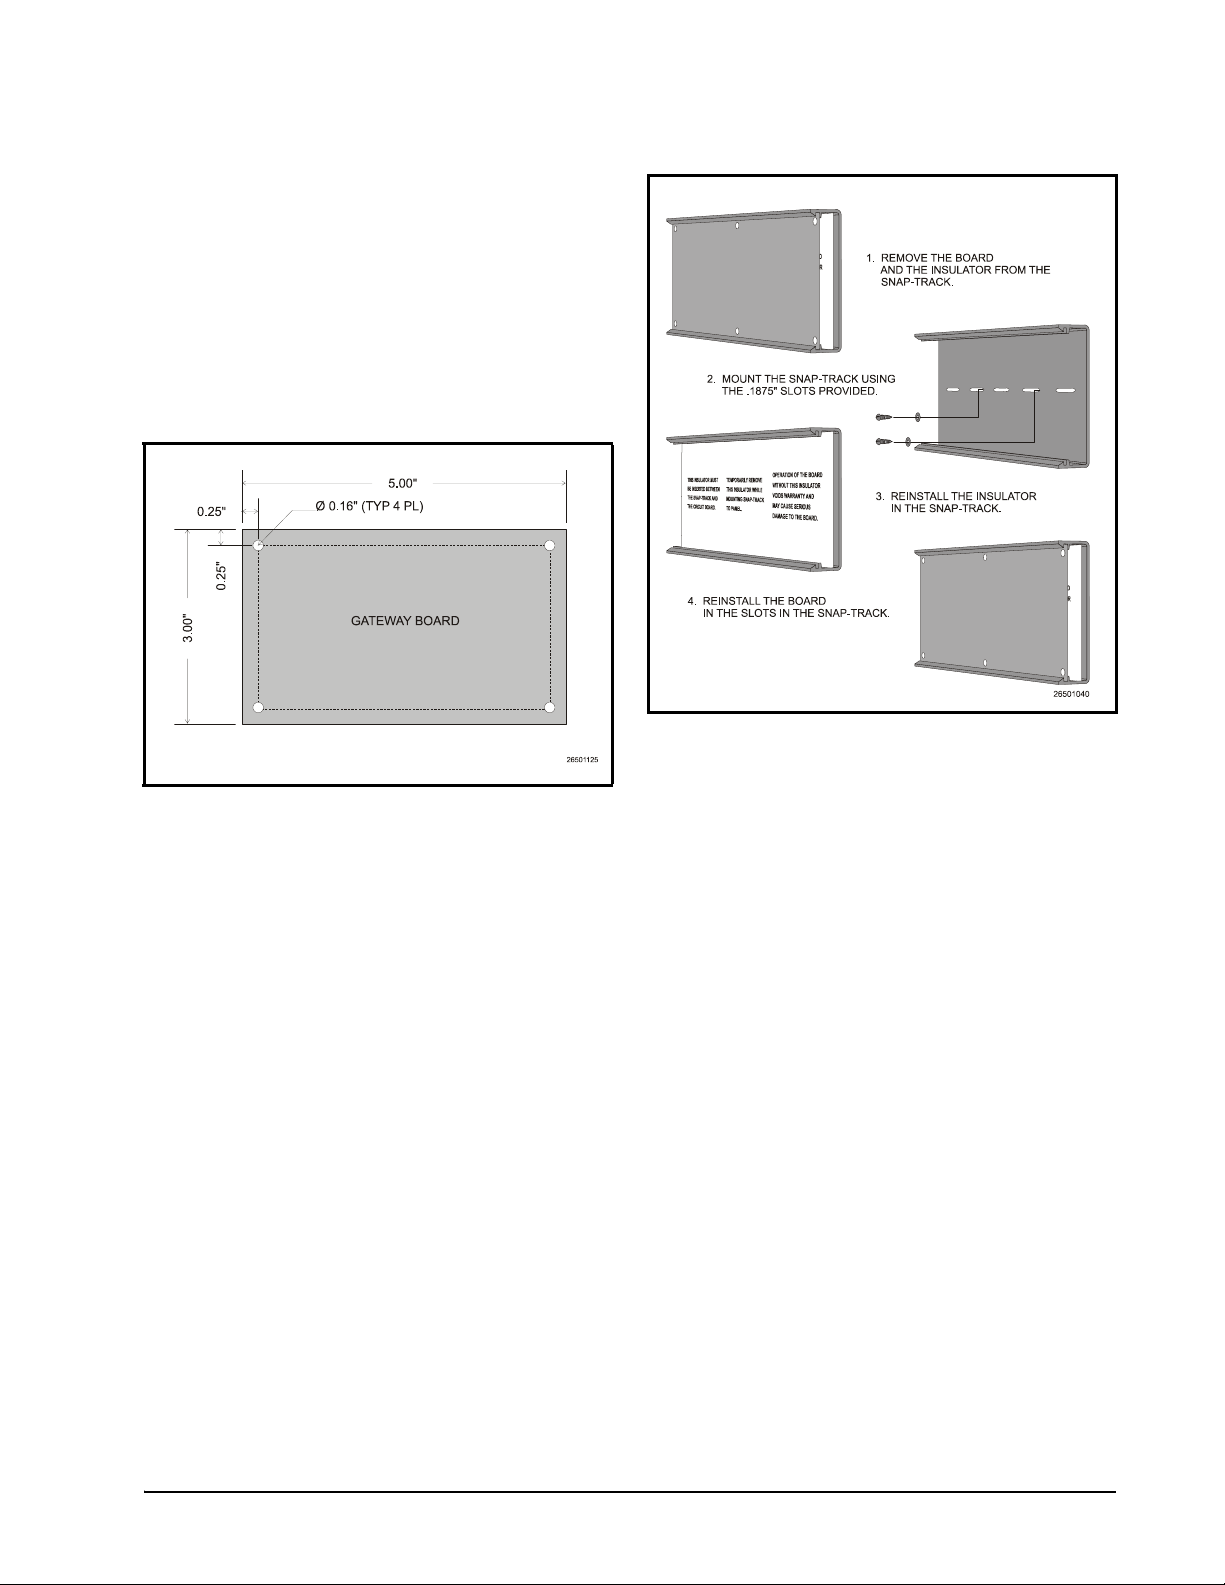
Figure 2-2 - Snap-Track Installation
Figure 2-1 - Gateway Board Mounting Dimensions
The Gateway should be mounted in an environment
with ambient temperature between -40°F and 150°F, with a
non-condensing relative humidity between 5% and 95%.
Gateway boards are not supplied with an enclosure but
come with a snap-track for easy installation. The insulation
sheet and I/O board must be removed from the track before
the track is mounted. The snap-track is mounted using the
0.1875” mounting slots. Figure 2-2 shows this installation
procedure.
Hand-Held Terminal Gateway Board Mounting • 3
Page 10

3 Gateway Power
Wiring
Input Voltage
Power
Table 3-1 - Gateway Power Requirements
The Gateway requires 24VAC power from a Class 2
center-tapped transformer.
Emerson Climate Technologies Retail Solutions supplies several sizes of center-tapped transformers for powering multiple 16AIs, 8ROs, and other RS485 peripheral
boards of the E2, Einstein, and REFLECS systems.
Refer to your controller’s user manual for information
on how to use the center-tapped transformers listed in Ta-
ble 3-1 to power multiple RS485 I/O devices for the US and
Canada.
Figure 3-1 shows how to connect the 56VA and 80VA
transformers to the Gateway power connector.
P/N
Power Rating
Table 3-1-US and Canada Power Ratings for CPC Transformers
24VAC, Class 2, 50/60Hz
5VA
Three-Board Six-Board
640-0056 640-0080
5 6 VA 8 0 VA
Figure 3-1 - Pinout for the 56VA (640-0056) and 80VA (640-
0080) Transformers
4 • PerformanceAlert Gateway I&O Manual 026-1724 Rev 0 12-MAY-2008
Page 11

4 Networking
Networking the PerformanceAlert™ Gateway System
requires interconnecting the Gateway with all PerformanceAlert™ modules on the MODBUS network, as well
as connecting the Gateway to the E2 via the RS485 I/O network port.
Cable Type
Emerson Climate Technologies Retail Solutions specifies all RS485 I/O and MODBUS wiring used by the E2
must be Belden 8641 (24AWG, 300V, CPC P/N 135-
8641); Belden 8761 (22 AWG, 300V not stocked by CPC);
or a 600V-shielded 22AWG equivalent stocked by CPC (P/
N 135-0600). These are two-connector shielded twisted
pair cable that support a maximum daisy chain cable distance of 4000 feet (1219 m) between the E2 and the end device on the network.
4.1. Connecting the Perfor-
manceAlert™ Modules To
the Gateway Board
MODBUS network devices must be installed using a
daisy-chain network structure. A daisy-chain connects the
Gateway and all associated PerformanceAlert™ modules
in a single unbranched network segment, with termination
resistance applied to the network at the two end devices.
Figure 4-1 shows two diagrams of valid daisy-chain network structures, one with the Gateway at the beginning of
the network segment, and one with the Gateway in the middle of a network segment.
4.1.1. PerformanceAlert™ Module MODBUS Wiring
Figure 4-2 - PerformanceAlert™ MODBUS Wire Connection
The MODBUS connector for the PerformanceAlert™
module is located as shown in Figure 4-2. Connect the
MODBUS network cable segment(s) so that the BLACK
wire connects to all positive (+) terminals and the WHITE
wire connects to all negative (-) terminals. Connect the
SHIELD wire to the GND terminal of the connector.
The GND terminal of each module must also be connected to a separate solid earth ground, using a 14AWG
wire no more than six (6) inches in length.
The best earth ground sources to use are listed below, in
priority order:
• A large metal panel or plate that is connected to a
good electrical ground. A panel or plate that is at
least 3 feet by 3 feet (0.9 m by 0.9 m) is desirable.
• Earth grounded steel rack.
• Water pipes (metal, assuming there are no plastic
sections).
• Electrical system earth ground.
Note: If grounding against a metal plate or
panel that is coated or painted, scrape away
the coating to expose the bare metal before
making the ground attachment.
Figure 4-1 - MODBUS Daisy Chain Structures
Connecting the PerformanceAlert™ Modules To the Gateway Board Networking • 5
Page 12

4.1.2. PerformanceAlert™ Module MODBUS Addressing
Figure 4-3 - PerformanceAlert™ MODBUS Addressing
Jumpers AD1 through AD4 on the PerformanceAlert™
module set the MODBUS device address. Modules should
be uniquely numbered in sequence starting with 1 and continuing in numerical order up to 14. Refer to Figure 4-3 for
jumper settings for each address number.
4.1.3. Gateway MODBUS Wiring
4.1.4. MODBUS Termination
Figure 4-4 - Gateway Board MODBUS Wiring
Connect the Gateway to the MODBUS network as
shown in Figure 4-4. Connect the BLACK wire to
RS485+, the WHITE wire to RS485-. Connect the
SHIELD wire to the middle (0v) terminal.
For convenience, when the Gateway is not the end of
the daisy-chain, the MODBUS connector has a second set
of terminals.
Figure 4-5 - MODBUS Termination
To minimize network interference on the MODBUS
network, the daisy chain must be terminated at both endpoints, with all devices in between left unterminated. Refer
to the diagram in Figure 4-1 for diagrams showing the daisy chain endpoints.
The PerformanceAlert™ module is terminated by placing a jumper across the TRMNTR pins. The Gateway
board is terminated by setting the three jumpers next to the
MODBUS connector to the TERMINATION setting as
shown in Figure 4-5.
4.2. Connecting the Gateway to
the RS485 I/O Network
Connect the RS485 I/O Network wire to the three-terminal connector on the Gateway board as shown in Figure
4-6. For further information about how RS485 networks
are configured, refer to your site controller’s user manual.
6 • PerformanceAlert Gateway I&O Manual 026-1724 Rev 0 12-MAY-2008
Page 13

Figure 4-6 - Connecting the Gateway to the RS485 Network
4.2.1. Gateway Board Numbering
The E2, Einstein, or REFLECS controller interprets the
PerformanceAlert™ Gateway board as one or more 16AI
Analog Input boards. The number of virtual "boards" is dependent on two things: the setting of the board’s address
DIP switch, and whether the PerformaceAlert Gateway
will operate in "Condensed" or "Expanded" data mode.
In Condensed mode, the Gateway behaves in the same
manner as one 16AI board whose address is equal to the
address set by the DIP switches (see Figure 4-7 on page 7).
In Expanded mode, the Gateway assigns each PerformanceAlert™ module a 16AI address equal to its MODBUS address. For example, when modules 1 through 8 are
enabled through the Gateway in Expanded mode, the Gateway behaves as eight 16AI boards numbered 1 through 8.
The address DIP switches have no function when the Gateway is set to Expanded mode.
4.2.1.1. Setting the Gateway Address Switch
MODBUS
BAUD
RATE
Figure 4-7 - Gateway Dip Switch Numbering
If using the PerformanceAlert™ Gateway in Condensed Mode, set the address DIP switches to the virtual
16AI board address you wish the Gateway to use (Figure
4-7). The Gateway in Condensed mode behaves in the
same manner as one 16AI board whose address is equal to
the address set by the DIP switches.
4.2.2. Setting the Baud Rate Dip Switch-
es
Dip switches 6 and 7 (Figure 4-8) control the baud rate
at which the Gateway communicates with the site controller on the RS485 Network. These switches must be set to
the same baud rate setting as the E2, Einstein, or REFLECS
(usually 9600 baud).
Dip switch 8 controls the baud rate on the MODBUS
network. Since the PerformanceAlert™ module communicates at 9600 baud only, set this switch to the DOWN position to select 9600 baud (see Figure 4-8).
Connecting the Gateway to the RS485 I/O Network Networking • 7
Page 14

G
ATEWAY
S
DIP SWITCH
I/O NETWORK OR
COM A AND D
BAUD RATE
2345678
1
I/O NET BAUD RATE SETTINGS
9600 19200
MODBUS BAUD RATE SETTINGS
Figure 4-8 - Dip Switch Setting for Numbering Gateway
MODBU
BAUD
RATE
9600
4.2.3. Gateway Board RS485 I/O Termination
Figure 4-9 - Gateway RS485 I/O Network Termination
If the Gateway board will be an end device on the
RS485 I/O network daisy chain, set the three jumpers next
to the I/O Network connector to the TERMINATION position as shown in Figure 4-9.
8 • PerformanceAlert Gateway I&O Manual 026-1724 Rev 0 12-MAY-2008
Page 15

5 Gateway Software
Setup
When the Gateway and all PerformanceAlert™ modules are correctly powered up and networked, the Gateway
firmware must be configured with a Hand-Held Terminal
(HHT) to set the Gateway’s data mode, enable used PerformanceAlert™ MODBUS addresses, and disable unused
MODBUS addresses.
1. Plug the HHT into the HHT jack. The Opening Screen will be shown.
PF ALERT GATEWAY
810-3730
VER: 1.10B07 02
(PRESS )
2. From the opening screen, press the DOWN
ARROW key to display the Main Menu
screen.
SELECT: 1
1=INDIVIDUAL
2=STAT SUMMARY
3=GW SETUP
repeat until all are set correctly.
PF ALERT-1 : ENB
PF ALERT-2 : ENB
PF ALERT-3 : ENB
PF ALERT-4 : ENB
IMPORTANT: Always set unused addresses to "DIS." In Expanded Mode, this
will allow the 16AI board number to be
used by other I/O network devices (see
Section 6.3., I/O Setup for Expanded Mode).
5. To move to the next screen, press DOWN
ARROW until the cursor moves off the bottom of the HHT screen, then press DOWN
ARROW one more time. The next screen,
showing PF ALERT-5 through 8, will be
shown.
6. Repeat steps 4 and 5 until all PF ALERT
fields are set. From the fourth and last PF
ALERT field screen, press the DOWN ARROW key to scroll to the next config screen,
the Data Mode screen.
PF ALERT DATA:
CONDENSED
3. Press RIGHT ARROW to move the cursor to
the SELECT field, then press 3 to choose GW
SETUP. Press the DOWN ARROW key
twice to enter your selection and view the PF
Alert Enable screens.
PF ALERT-1 : UNK
PF ALERT-2 : UNK
PF ALERT-3 : UNK
PF ALERT-4 : UNK
The four PF Alert Enable screens have a total of fourteen fields numbered PF ALERT-1 through PF ALERT-14.
These fields correspond to the addresses of the connected
PerformanceAlert™ modules. The field values represent
whether the module at that address is enabled (ENB), disabled (DIS), or unknown (UNK) meaning no module with
that address is currently communicating with the gateway.
For each address, if a module is connected and is using that
address, the PF ALERT field corresponding to that number
must be set to ENB (enable). All others must be set to DIS
or left in the UNK state.
4. Press the RIGHT ARROW key to move the
cursor to the PF ALERT 1 field at the top of
the screen. Use the MINUS (-) key to change
the field’s value from DIS (if no module is
connected that uses this address) or ENB (if a
module will use this address). Use the UP
ARROW and DOWN ARROW keys to move
the cursor to other fields on the screen, and
7. Press RIGHT ARROW to move the cursor to
the Data Mode field. Use the MINUS (-) key
to toggle between CONDENSED and EXPANDED mode. Refer to Section 6.2., I/O
Setup for Condensed Mode, and Section 6.3.,
I/O Setup for Expanded Mode, for a complete
description of both modes. When finished,
press DOWN ARROW twice to save changes
and move to the next screen.
8. The final screen under the GW SETUP menu
option is a read-only status screen showing
the configuration of the I/O and MODBUS
networks. The first two lines, IONET ADDRESS and IONET BAUD, show the board
number and baud rate as set by the Gateway
board’s DIP switches. The last two lines,
MOD BAUD and MOD PARITY, will always read 9600 and NONE respectively,
since the Gateway’s MODBUS port needs to
be set to 9600 baud with no parity. If MOD
BAUD reads 19200, the Gateway dip switch
is set wrong and must be switched to the
DOWN position (see Figure 4-8 on page 8)
IONET ADDR:1
IONET BAUD:9600
MOD BAUD :9600
MOD PARITY:NONE
Connecting the Gateway to the RS485 I/O Network Gateway Software Setup • 9
Page 16

6 PerformanceAlert™
I/O Summary
6.2. I/O Setup for Condensed Mode
During operation, the PerformanceAlert™ Gateway
serves two main functions:
• Communicating with, and collecting information
from, the PerformanceAlert™ modules, and
• Passing along information from the modules to the
site controller in the form of virtual 16AI point values.
This section will show how to map data points from the
Gateway to I/O points in the site controller for both data
modes (Condensed and Expanded).
6.1. E2 I/O Board Setup
The E2 must be configured to communicate with the
Gateway by adding the board(s) to the system configuration.
Log in to the E2 with an access level high enough to
change configuration, and press
Connected I/O Boards and Controllers screen.
I to open the
Note: If you will be using the PerformanceAlert™ Gateway in Expanded Mode,
skip this section and follow the instructions in
Section 6.3., I/O Setup for Expanded Mode.
In Condensed Mode, the Gateway behaves as a single
16AI board address whose address is set by the board’s address DIP switches (see Section 4.2.1.1., Setting the Gate-
way Address Switch).
Points 1 through 14 of this virtual board correspond to the overall alarm status of PerformanceAlert™ modules #1 through #14. The point will be ON as long as one or more of the following failure conditions are active:
1. The PerformanceAlert™ module is not communicating with the Gateway, OR
2. Alert code 4, 5, 6, 7, 8, and/or 10 are active,
OR
3. The compressor is in lockout
6.2.1. Condensed Mode Point Setup
To set up the Gateway’s virtual 16AI points for use in
logging, alarming, and I/O control, press
PUT DEFINITIONS) to access the Input Status screen.
Sixteen rows in the Input Status table will have the
same number in the Brd field as the virtual 16AI address of
the Gateway board. These rows correspond to "points" 1
through 16 on the Gateway. Since 15 and 16 are invalid
PerformanceAlert™ module addresses, these points will be
unused and will always be OFF.
I (IN-
To make a point ready for use by the E2, you must set
the input name and type from this screen:
4. Use the arrow keys until the cursor highlights
the Application field in the row corresponding to the point you wish to set up.
Figure 6-1 - Connected I/O Boards Screen
Add as many 16AIs as are necessary to cover the board
number(s) used by the PerformanceAlert™ Gateway. The
E2 will add the specified number of 16AI boards, numbered 1 through the number you entered, to the network
configuration. Press
After adding the board(s), press
LINE STATUS) to view the current status of the network.
Verify that the address(es) used by the PerformanceAlert™
Gateway are shown in this list and read "Online."
10 • PerformanceAlert Gateway I&O Manual 026-1724 Rev 0 12-MAY-2008
Jto save and exit.
I (ON-
5. Press
6. When prompted to select the data type, select
A - SETUP
- Digital. The Digital Input setup screen
will be displayed.
7. In the Point Name field, enter a unique name
that will help you & others easily know the
function of this point. For example, if setting
up point 1, which will be the alarm status of
PerformanceAlert™ module #1, an appropriate name would be PF ALERT CMP1.
8. Press
J to save the name and return to
Page 17

the Input Status screen. The point will now
display a "D" (for digital) in the Type column, and will also display the current value
of the point in the Value field (ON or OFF).
9. Repeat steps 1 through 5 until all points are
defined.
When finished, the points are ready for use in E2 applications. If you wish to set up the Condensed Mode points
so that alarms from PerformanceAlert™ are written to the
E2 Advisory Log, refer to Section 8.1.1., Generic Alarm-
ing Setup.
You may wish to use the Gateway points as inputs for
Digital Sensor control applications, where you may set up
output control. Refer to the E2 User’s Guide (P/N 026-
1610) for Digital Sensor Control setup instructions.
6.3. I/O Setup for Expanded
Mode
If you will be using the PerformanceAlert™
Gateway in Condensed Mode, skip this section
and follow the instructions in Section 6.2., I/O
Setup for Condensed Mode.
NOTE: Expanded Mode may not be used if
networking the Gateway to an RMCC. The
RMCC will only support Condensed Mode.
and functions are fixed and are the same for each module.
Table 6-1 lists the point numbers and their data types and
functions.
Point # Type Function
1 Digital High DLT Warning
2 Digital System Component Trip
3 Digital Compressor Short Cycle
4 Digital Compressor Locked Rotor
5 Digital Open Circuit
6 Digital Missing Phase
7 Digital 3 Phase Circuit Failure
8 Digital Welded Contactor
9 Digital Low Voltage Notice
10 Digital Communication Failure
11 Digital DLT Open/Short Failure
12 Digital Relay State
13 Analog T1 Current (0-655 Amps)
14 Analog T3 Current (0-655 Amps)
15 Analog Discharge Line Temperature
(-58°F—266°F)
16 Digital Digital Summary (same as alarm
summary output in Condensed
mode (Section 6.2.) )
Table 6-1 - PerformanceAlert™ Gateway Expanded Mode Input Map
In Expanded mode, for every PerformanceAlert™
module address set to "enable" (ENB) in the Gateway (see
step 4 of the Gateway Setup instructions in Section 5), the
Gateway board will emulate a 16AI board whose board
number is the same number as the PerformanceAlert™
module. When a PerformanceAlert™ module is set to "disable" (DIS) in the Gateway, the Gateway board does not
use this board number, meaning it may be used by other
MultiFlex input boards.
Each virtual 16AI board address shares sixteen data
points corresponding to alarm states and sensor values
from the PerformanceAlert™ module. The point numbers
Points 1 through 11 are alarm states. They will be ON
whenever the corresponding alarm type is active on the
PerformanceAlert™ module, and OFF when the alarm type
is not active.
Point 12 represents the digital state of the PerformanceAlert™’s compressor relay (ON when the compressor relay is ON, and OFF when the compressor is OFF).
Points 13 and 14 are the measured currents through T1
and T3 respectively.
Point 15 is the measured temperature read from the discharge line temperature sensor.
Point 16 has the same function as the alarm state point
in Condensed Mode. It is ON whenever any alarm is active
on the PerformanceAlert™ module. Consequently, whenever any of the points from 1 through 11 are ON, point 16
will be ON as well.
6.3.1. Expanded Mode Point Setup
To set up the Gateway’s virtual 16AI points for use in
logging, alarming, and I/O control, press
PUT DEFINITIONS) to access the Input Status screen.
I (IN-
I/O Setup for Expanded Mode PerformanceAlert™ I/O Summary • 11
Page 18

For every board number used by the PerformanceAlert™ Gateway, there will be sixteen rows in the
Input Status table corresponding to "points" 1 through 16
on the Gateway. To make a point ready for use by the E2,
you must set the input name and type from this screen.
Setup for Digital Points (1-12, 16)
1. Use the arrow keys until the cursor highlights
the Application field in the row corresponding to the point you wish to set up.
2. Press
3. When prompted to select the data type, select
A - SETUP
- Digital. The Digital Input setup screen
will be displayed.
4. In the Point Name field, enter a unique name
that will help you & others easily know the
function of this point. For example, if setting
up point 1 on board #3, which will be the
High DLT warning for PerformanceAlert™
module #3, an appropriate name would be
HIGH DLT CMP3.
5. Press
6. Repeat steps 1 through 5 until all digital
Setup for Points 13 and 14 (Current Transducers)
1. Use the arrow keys until the cursor highlights
2. Press
3. When prompted to select the data type, select
J to save the name and return to
the Input Status screen. The point will now
display a "D" (for digital) in the Type column, and will also display the current value
of the point in the Value field (ON or OFF).
points are defined.
the Application field in the row corresponding to the point you wish to set up.
A - SETUP
- Analog. The Analog Input setup screen
will be displayed.
4. In the Point Name field, enter a unique name
that will help you & others easily know the
function of this point. For example, if setting
up point 13 on board #3, which will be the T1
current for PerformanceAlert™ module #3,
an appropriate name would be T1 AMPS
CMP3.
5. In the Sensor Type field, press F4 to access
the Look-Up table. Highlight "Linear" as the
sensor type, and press
6. In the Select Eng. Units field, press F4 to access the Look-UP table. Highlight "A" as the
unit type, and press
7. The Low Eng Units and High Eng Units
> to select.
> to select.
fields near the bottom of the screen must be
set to 0 and 655.5 respectively. The Low Eng
Units by default should read 0 and will not require modification. Move the cursor to the
High Eng Units field and enter 655.5 as the
new value.
8. Press
9. Repeat steps 1 through 8 until all current
Setup for Point 15 (Discharge Line Temp)
1. Use the arrow keys until the cursor highlights
2. Press
3. When prompted to select the data type, select
J to save the name and return to
the Input Status screen. The point will now
display a "A" (for digital) in the Type column, and will also display the current value
of the point in the Value field (ON or OFF).
transducer points have been defined.
the Application field in the row corresponding to the point you wish to set up.
A - SETUP
- Analog. The Analog Input setup screen
will be displayed.
4. In the Point Name field, enter a unique name
that will help you & others easily know the
function of this point. For example, if setting
up point 15 on board #1, an appropriate name
would be DLT CMP1.
5. In the Sensor Type field, press F4 to access
the Look-Up table. Highlight "Linear" as the
sensor type, and press
6. In the Select Eng. Units field, press F4 to access the Look-UP table. Highlight "DF" (if
using °F on this E2) or "DC" (if using °C on
this E2) as the unit type, and press
lect.
7. Set the Low Eng Units and High Eng Units.
• If using °C (DC) as the unit, enter -50 as
the Low Eng Unit and 130 as the High Eng
Unit.
• If using °F (DF) as the unit, enter -58 as the
Low Eng Unit and 266 as the High Eng
Unit.
8. Press
When finished, the points are ready for use in E2 applications. You may wish to use the Gateway points as inputs
for Analog and Digital Sensor control applications, where
J to save the name and return to
the Input Status screen. The point will now
display a "D" (for digital) in the Type column, and will also display the current value
of the point in the Value field (ON or OFF).
> to select.
> to se-
12 • PerformanceAlert Gateway I&O Manual 026-1724 Rev 0 12-MAY-2008
Page 19

you may set up logging, alarming, and (if desired) output
control. Refer to the E2 User’s Guide (P/N 026-1610) for
Analog and Digital Sensor Control setup instructions.
I/O Setup for Expanded Mode PerformanceAlert™ I/O Summary • 13
Page 20

7 Operation
During normal operation the operating status of the PerformanceAlert™ modules can be viewed in either of three
ways:
• Through E2 appliction status screens,
• Through PerformanceAlert™ Software loaded on a
laptop computer, and
• Through the Hand-Held Terminal interface on the
Gateway board.
The means for checking status on the E2 will depend on
how you have configured the Gateway board points. If you
created Sensor Control applications for each point, you
may view the PerformanceAlert™ status using the Sensor
Control status and summary screens. Refer to the E2 User’s
Guide (P/N 026-1610) for more details.
The PerformanceAlert™ Software is a utility which
connects the PerformanceAlert™ module to an RS232 or
USB port on the computer and allows direct viewing of a
module’s diagnostics information and setpoints. This tool
is documented and supported by Copeland
the scope of this document. For more information, visit
www.EmersonClimate.com
Technologies, Inc. at 1-888-EMR-9950.
The Hand-Held Terminal can be used to look at the
overall online and alarm summary of all modules (Section
7.1.) as well as the status of an individual PerformanceAlert™ module (Section 7.2.).
or contact Emerson Climate
7.1. PerformanceAlert™ Stat
Summary
1. Plug the HHT into the Gateway board’s HHT
jack.
2. Press the DOWN ARROW key to move to
the Main Menu.
SELECT: 2
1=INDIVIDUAL
2=STAT SUMMARY
3=GW SETUP
®
, and is beyond
7.1.1. Screen 1: Comm Status
COMM STATUS:
12345678901234
111111XXXXXXXX
E2: ACTIVE
Comm Status. The list of characters on Line 3 of the
HHT display, which are numbered 1 through 14 by the
numbers above them on Line 2, represent the online status
of modules 1 through 14. For each module, this character
will display one of the following states:
• 1 - PerformanceAlert™ module is communicating
with the Gateway.
• 0 - PerformanceAlert™ module is not communicating with the Gateway
• X - This address is set to “disable” (DIS) and thus
not communicating (see step 4 of Section 5).
E2 Status. The bottom line of the HHT display shows
the current state of communication between the Gateway
and the E2. This field will read ACTIVE when the Gateway
and E2 are communicating, or NO COMM when they are
not communicating.
7.1.2. Screen 2: PF Alert Alarm Status
PF ALERT ALARM
STATUS:
1234567901234
000000XXXXXXX
The list of characters on Line 4, numbered 1 through 14
by the numbers above them on Line 3, show the current
alarm active status of the PerformanceAlert™ modules.
For each module, this character will display one of the following states:
• 1 - Active alarm, following the same criteria as the
alarm status outputs (see Section 6.2. for ON criteria)
• 0 - No alarms are active on the PerformanceAlert™
module
• X - This address is set to “disable” (DIS) and thus
not communicating (see step 4 of Section 5).
3. Press RIGHT ARROW and then 2 to select
"STAT SUMMARY." Press the DOWN ARROW key two times to navigate to the first
stat summary screen.
The six screens under the Stat Summary heading will
show you online status, alarm status, and firmware version
for the PerformanceAlert™ modules.
14 • PerformanceAlert Gateway I&O Manual 026-1724 Rev 0 12-MAY-2008
Page 21

7.1.3. Screens 3 through 6: Firmware Versions
1 ON [2.00B02]
2 ON [2.00B02]
3 ON [2.00B02]
4 ON [2.00B02]
5 ON [2.00B02]
6 ON [2.00B02]
7 OFF [ ]
8 OFF [ ]
9 OFF [ ]
10 OFF [ ]
11 OFF [ ]
12 OFF [ ]
13 OFF [ ]
14 OFF [ ]
field, enter the number of the PerformanceAlert™ module you wish to view.
Press DOWN ARROW twice.
PF ALERT 1-14
SELECT: 1
You may only select a PerformanceAlert™ address for
a module that is set to ENABLE and is communicating
with the Gateway. If a module is not enabled or is not communicating, an error message will be given.
If the address selected is on-line, the Individual Module
Menu will be shown.
7.2.1. Individual Module Status
SELECT: 1
1=STATUS 4=STATS
2=HISTORY5=RESET
3=CONFIG
These screens show the enable/disable status of all 14
PerformanceAlert™ module addresses, and the firmware
versions of the connected PerformanceAlert™ modules.
Addresses set to enable will be shown as ON or OFF in
these screens, while disabled module addresses will be
shown as DIS.
Any time a module is enabled and communicated with
a PerformanceAlert™ Gateway, its firmware revision
number is recorded by the Gateway and displayed in this
screen. In most cases, this means enabled modules will be
shown with firmware revision numbers, and disabled ones
will be shown without revision numbers between the
brackets. If a module is later removed or disabled, however, its revision number will remain in its address slot.
7.2. Individual Perfor-
manceAlert™ Module Status
1. Plug the HHT into the Gateway board’s HHT
jack.
2. Press the DOWN ARROW key to move to
the Main Menu.
SELECT: 1
1=INDIVIDUAL
2=STAT SUMMARY
3=GW SETUP
To view the status screens, press RIGHT ARROW to move the cursor to the Select field. Press 1 and then DOWN ARROW twice.
7.2.1.1. Screen 1
PF ALERT: 1
ONLINE
ALARM: NONE
This screen shows the on-line status and alarm status of
the module.
The on-line status will read ONLINE, OFFLINE, or
DISABLE.
The alarm status will read NONE when no alarm is active. It will read ACTIVE when one or more of the following conditions are true:
• The module is offline,
• The PerformanceAlert™ module has shut down the
compressor (see Copeland
Application Engineering Bulletin and Section
7.2.3.7., or
• Alert codes 4 (Locked Rotor Alarm), 5 (Open Circuit Detected), 6 (Missing Phase Alarm), 7 (Open
Circuit/Reverse Phase), 8 (Welded Contactor
Alarm), and/or 10 (Lost Communication) are active.
®
PerformanceAlert™
3. Press RIGHT ARROW and then 1 to select
“INDIVIDUAL.” Press the DOWN ARROW
key two times.
4. Press the RIGHT ARROW key. In the Select
Individual PerformanceAlert™ Module Status Operation • 15
Page 22

7.2.1.2. Screen 2
IN ST: 00000000
OUT ST: 00000000
SYS ST:0 0000
FLAGS : 00000000
7.2.2.1. Screens 1 and 2
LAST 10 ALARMS:
A1 -MOST RECENT
A10-PAST 24H
A1: 10 A2: 4
This status screen shows the input, output, system, and
warning flag status displayed as bits.
7.2.1.3. Screen 3
POWER V : 0.00
CT1 (A) : 1.04
CT2 (A) : 0.96
LRA PEAK: 0.00
This status screen shows the module’s input power (in
volts), the value of CT1 and CT2 (in amps), and the LRA
Peak (in amps).
7.2.1.4. Screen 4
PK RMS A : 1.0
LINE TEMP: 78.00
NOW ALERT: 0
This status screen shows the peak RMS current (in
amps), the current discharge line temperature (in degrees
Farrenheit), and the alarm code of the current alert being
displayed. If any alert is being displayed, its alert description will be shown in Line 4 of the display; otherwise, Line
4 will be blank.
7.2.1.5. Screen 5
PAST ALERT: 10
NO COMMUNICATION
This status screen shows the code number and description of the last alert that occurred in the module (not the one
currently active, if an alert is currently active).
7.2.2. Individual Module History
SELECT: 2
1=STATUS 4=STATS
2=HISTORY5=RESET
3=CONFIG
To view the status screens, press RIGHT ARROW to move the cursor to the Select field. Press 2 and then DOWN ARROW twice.
A3:6 A4 :4
A5:6 A6 :4
A7:6 A8 :8
A9:10 A10:1
Screens 1 and 2 show the last 10 alert condition codes
that have occured on this module in the past 24 hours
(counting back from the current time). The alarm codes are
shown from most recent (A1) to least recent (A10).
7.2.2.2. Screens 3 through 11
HIGH DISCHARGE
DAYS: C1234567
NNNNYNNN
COUNT: 3
Screens 3 through 11 show the 7-day history of each of
the alarm codes from 1 through 9, showing which days they
have occurred. The current "day," which represents the period of time between the current time and 24 hours ago, is
displayed under the "C." The remaining seven fields represent alarm occurrences from 1 to 7 days previous to the current time.
If one or more alarms have occurred during any of the
days displayed on this screen, a Y will appear under the day
the alarm or alarms occurred. Otherwise, an N will be
shown, meaning no alarms of that type occurred on that
day.
The Count field at the bottom of each screen shows the
cumulative total of alarms that have occurred on this module in its entire time of operation.
Table 7-1 shows the order of the screens for each alarm
code type.
Screen # Alarm Code
3 HIGH DISCHARGE (Code 1)
4 COMPONENT TRIP (Code 2)
5 SHORT CYCLING (Code 3)
6 LOCKED ROTOR (Code 4)
7 OPEN CKT COMPR (Code 5)
8 MISSING PHASE (Code 6)
9 REVERSE PHASE (Code 7)
10 WELDED CONTACTS (Code 8)
11 LOW VOLTAGE (Code 9)
Table 7-1 - Alarm Status Screen Order (By Code)
16 • PerformanceAlert Gateway I&O Manual 026-1724 Rev 0 12-MAY-2008
Page 23

7.2.2.3. Screens 12 and 13
WF0 HI DLT OFF
WF1 LCK ROT OFF
WF2 OPEN CIR OFF
WF3 LOW V OFF
7.2.2.6. Screen 18 and 19
TRIP HISTORY:
DAYS: C1234567
NNNNNNNN
COUNT : 0
WF4 MMC OFF
WF5 DLT OPEN OFF
WF6 DLT SHOR OFF
WF7 OFF
Screens 6 and 7 shows the current state of the warning
flags 0 through 7.
7.2.2.4. Screen 14
NOW ALERT : 0
LAST ALERT: 10
Screen 8 shows the current alert code active in the module (NOW ALERT), and the alert code that was active previous to the current one (LAST ALERT).
7.2.2.5. Screens 15 through 17
CMPR: START RUN
DAY1: 0 0
DAY2: 0 0
DAY3: 0 0
CMPR: START RUN
DAY4: 0 0
DAY5: 0 0
DAY6: 0 0
CMPR: START RUN
DAY7: 0 0
STARTS: 0
RUN : 0
The Day1 through Day7 fields show the number of
times the compressor has started and the runtime (in minutes) for the current day (Day1) and the previous 6 days
(Day2 through Day7).
BYPASS HISTORY:
DAYS: C1234567
NNNNNNNN
COUNT : 0
Screens 18 and 19 show the 7-day history of trip conditions and bypass conditions, showing which days they have
occurred. Screen 18 shows the history of trip conditions,
while screen 19 shows the history of bypass conditions.
The current "day," which represents the period of time
between the current time and 24 hours ago, is displayed under the "C." The remaining seven fields represent alarm occurrences from 1 to 7 days previous to the current time.
If one or more trips or bypasses have occurred during
any of the days displayed on this screen, a Y will appear under the day the trip(s) or bypass(es) occurred. Otherwise, an
N will be shown, meaning no trips or bypasses occurred on
that day.
The Count field at the bottom of each screen shows the
cumulative total of trips or bypasses that have occurred on
this module in its entire time of operation.
7.2.3. Individual Module Configuration
SELECT: 3
1=STATUS 4=STATS
2=HISTORY5=RESET
3=CONFIG
To view the status screens, press RIGHT ARROW to move the cursor to the Select field. Press 3 and then DOWN ARROW twice.
7.2.3.1. Screen 1: Rack # and Install Date
PF ALERT: 1
RACK : 2
The Starts and Run fields on Screen 17 show the total
number of compressor starts and the total runtime (in minutes) since the last time statistics were cleared in the module.
Individual PerformanceAlert™ Module Status Operation • 17
On this screen, you may enter a rack number . This
number is stored in the module memory for reference purposes.
Page 24

7.2.3.2. Screen 2: Date of Installation
DATE OF
INSTALLATION:
DATE: 08-15-0
7.2.3.6. Screen 5: Setpoints
DLT TTP : 230.0
SEVERE ALERT
OFF TIME : 20
LO V SP: 217.0
On this screen, you may enter the date the compressor
was installed. This date is stored in the module memory for
reference purposes.
7.2.3.3. Screen 3: Customer Code
CUSTOMER CODE
CODE: 000
On this screen, you may enter a three-character customer code number. This code is stored in the module memory
for reference purposes.
7.2.3.4. Screen 4: Compressor Model
COMPRESSOR MODEL
This screen enables you to enter a description of the
compressor model the PerformanceAlert™ module is attached to. Press the RIGHT ARROW key to make the cursor appear in Line 3 of the display. To enter text on this
line, for each character use the POINT "." and MINUS "-"
keys to scroll through the alphanumeric characters until the
desired character is shown. Press RIGHT ARROW to
move to the next character. When finished, press DOWN
ARROW to enter the name, and DOWN ARROW again to
save changes and exit to Screen 4.
7.2.3.5. Screen 5: Serial Number
COMPRESSOR S/N
S/N: 1234567890
On this screen, you may enter a ten-character string of
text. This code is stored in the module memory for reference purposes.
The DLT TTP is the high temperature setpoint for tripping on high discharge line temperature. When the discharge line temperature is above the DLT TTP setpoint (in
degrees Farrenheit), a HIGH DISCHARGE alert will occur.
The Severe Alert OFF Time is the minimum number of
minutes the compressor will remain OFF when a trip occurs as a result of an alarm code 1, 4, 6, or 7. When one of
these alarm codes occurs, the compressor will not reset until the Severe Alert OFF Time delay has elapsed.
The LO V STP is the setpoint for low voltage trip. An
voltage below this value will cause a LOW VOLTAGE
alert to occur. This setpoint is a fixed value and may not
be altered.
7.2.3.7. Screens 6 through 8: Lockout Setpoints
DISABLED = 255
C1 LOUT CNT: 2
C2 LOUT CNT: 2
C3 LOUT CNT: 2
DISABLED = 255
C4 LOUT CNT: 2
C6 LOUT CNT: 1
C7 LOUT CNT: 1
OPEN CDT : 90
MIN ON TM : 0.10
MIN OFF TM: 0.10
CAUTION! Setting an Cx LOUT CNT field
to any number other than 255 will allow the
PerformanceAlert™ to shut down the compressor under severe conditions.
NOTE - For lockout to be enabled, the PerformanceAlert™ module’s Lockout Jumper must
be properly set. See the Copeland
manceAlert™ Application Engineering Bulletin for more information about this jumper and
how to set it.
®
Perfor-
For alert codes 1,2,3,4,6, and 7, the LOUT CNT field
with the number corresponding to the alert code number
sets the maximum number of times per day the alert must
occur before a lockout will occur. For example, C1 LOUT
18 • PerformanceAlert Gateway I&O Manual 026-1724 Rev 0 12-MAY-2008
Page 25

CNT will be the number of times a HIGH DISCHARGE
PROTECTION alert must occur in a single 24-hour period
to cause a lockout.
If you wish to set a lockout setpoint for an alert code,
enter the desired maximum number of daily occurrences in
the field. If you do not wish to lockout for an alert code, set
the field value to 255. Table 7-2 shows the minimum and
maximum values for each field.
Property Min # of
Occurrences
C1 LOUT CNT 2 6
C2 LOUT CNT 2 10
C3 LOUT CNT 2 240
C4 LOUT CNT 2 10
C6 LOUT CNT 1 10
C7 LOUT CNT 1 10
Table 7-2 - Min/Max Field Values for LOUT CNT Parameters
The Open CDT field sets the delay time (in minutes) of
the lockout that will occur when an open circuit condition
is present. Enter a desired lockout time between 60 and 180
minutes.
The Minimum ON Time and Minimum OFF Time
fields set the minimum ON and OFF times of the compressor (in minutes or tenths of a minute). Specify the desired
minimum times from 0.1 to 15.0 minutes.
Max # of
Occurrences
7.2.4. Communication Statistics
SELECT: 4
1=STATUS 4=STATS
2=HISTORY5=RESET
3=CONFIG
The Communication Statistics screen is designed to
help troubleshoot potential network problems between the
Gateway and a PerformanceAlert™ module. From the Individual Menu, select 4 to view the Communication Statis-
tics screen.
MSG SNT: 45520
NO RESP: 2
BAD CRC: 0
INVALID:0 MX:1
MSG SNT: The total number of messages sent.
NO RESP: The number of messages that resulted in no
response.
BAD CRC: The number of messages received that had
a bad CRC.
INVALID: The number of messages that resulted in an
unexpected response (such as a MODBUS exception)
MX: The maximum number of consecutive times an er-
ror condition was detected in responses.
To clear all counts on this screen, press the CANCEL
key. The MSG SNT, NO RESP, BAD CRC, INVALID,
and MX counts will all reset to zero.
7.2.5. Resets
SELECT: 5
1=STATUS 4=STATS
2=HISTORY5=RESET
3=CONFIG
From the "Reset" menu option, you may clear a PerformanceAlert™ module’s history log or reset the module itself. From the Individual Menu, select 5 to view the Reset
Menu.
7.2.5.1. Clear History Log
SELECT: 1
1=CLEAR HISTORY
2=RESET PF ALERT
Performing a "Clear History" operation will erase all
history statistics for the selected PerformanceAlert™ module (see Section 7.2.2.). Select 1 from the Reset menu to
clear history.
THIS WILL CLEAR
THE HISTORY LOG.
CLR HISTORY: NO
Press RIGHT ARROW to move the cursor to the Clr
History field, and press the MINUS "-" key to toggle the
field from "NO" to "YES." Press RIGHT ARROW and UP
ARROW to execute the change and return to the Reset
menu. The history will be erased.
7.2.5.2. Reset PerformanceAlert™ Module
SELECT: 2
1=CLEAR HISTORY
2=RESET PF ALERT
By selecting "Reset PF Alert" you may force a reset of
the PerformanceAlert™ module. Select 2 from the Reset
menu to reset the module.
THIS RESTARTS
THE PF ALERT.
RESET UNIT : NO
Press RIGHT ARROW to move the cursor to the Reset
Unit field, and press the MINUS "-" key to toggle the field
from "NO" to "YES." Press RIGHT ARROW and UP ARROW to execute the change and return to the Reset menu.
The module will reset.
Individual PerformanceAlert™ Module Status Operation • 19
Page 26

8 E2 Applications
The PerformanceAlert™ Gateway provides a means
for E2 to use data from the PerformanceAlert™ modules
for general logging, alarming, and control purposes. For
convenience, this section will cover some of the most common and useful applications of PerformanceAlert™ data in
E2 applications.
8.1. Passing Perfor-
manceAlert™ Alarm Data to
the E2 Advisory Log
The E2 features many advanced alarm control capabilities, all of which are centered around the collection of
alarms kept in the E2 Advisory Log. Though the PerformanceAlert™ Gateway passes alarm information from
PerformanceAlert™ modules to the E2, it only does so as
I/O point data, not as alarms written to the E2 Advisory
Log.
In order to write PerformanceAlert™ alarm data to the
E2 Advisory Log, you must set up Generic Alarming parameters on the Gateway’s virtual I/O points.
points set up:
Figure 8-1 - Input Status Screen (Condensed Mode Shown)
3. Highlight the point you want to set up. Press
A: SETUP. The Digital Input or Analog
Input screen will be displayed.
4. Press
A: SET ALARMS. The Digital
Alarm Setup or Analog Alarm Setup screen
will appear.
8.1.1. Generic Alarming Setup
Setting up Generic Alarming for PerformanceAlert™
Gateway I/O points is done from the E2 Input Status
Screen.
1. Log in to the E2 and press
Definitions).
2. If you have not yet done point setup for the
Gateway’s virtual I/O points, follow the steps
outlined in Section 6.2.1., Condensed Mode
Point Setup or Section 6.3.1., Expanded
Mode Point Setup. When point setup is com-
plete for all PerformanceAlert™ Gateway
virtual I/O points, you should see the letter
"D" next to each PerformanceAlert™ input
point. In the example (Figure 8-1), the Gateway is operating in Condensed Mode designated as 16AI board #1, with all fourteen I/O
I (Input
Figure 8-2 - Digital Alarm Setup Screen
After completing Step 4, complete generic alarm setup
by following the instructions appropriate for the input type
(Digital or Analog).
8.1.2. Alarm Parameter Settings
8.1.2.1. Digital Alarms
For all Condensed Mode data points, and for all Expanded Mode data points except 13, 14, and 15, digital
alarming may be set up so that an alarm will be generated
when the point transitions to the ON state.
Continuing from step 4 of Section 8.1.1., Generic
Alarming Setup:
5. Set the Advisory Method field to "Select
Methods."
6. In the "Alarm On an" field, set this field to
"Yes" and press
the right of the cursor where you may choose
which digital state will trigger the alarm. Set
this field to ON.
>. A field will appear to
20 • PerformanceAlert Gateway I&O Manual 026-1724 Rev 0 12-MAY-2008
Page 27

7. In the Report Delay and Report Priority
Fields, you must decide three things: whether
you want a PerformanceAlert™ advisory to
be an ALARM or NOTICE in the E2 Advisory log; what report priority you want the
alarm to be; and how long the PerformanceAlert™ alarm must be active before
the alarm will be generated.
Of these analog points, it is not necessary to set up generic alarming on points 13 and 14. On point 15, the discharge line temperature, alarming already occurs with high
discharge causes a trip condition to occur (in Expanded
Mode, Generic Alarming should be set up for this condition
on point 1). If desired, you may use Generic Alarming to
generate a warning when discharge line temperature runs
too close to the trip setpoint.
In the example shown in Figure 8-3, the advisoryis configured to be an ALARM generated after a ten minute delay with a report
priority of 20. You will generally want to set
up critical alarms such as Locked Rotor or
Phase Fail as ALARM advisories with a priority of 20 or above. To keep a point from
generating notices, the Report Priority under
the Notice column is set to 0
To make an advisory appear as a low-priority
notice, enter a 99 in the Report Priority "Notice Levels" column and a 0 in the Report Priority "Alarm Levels" column.
Figure 8-3 - Digital Alarm Settings
8. Press
J to save changes and return to the
Digital Input Setup screen. Note the OUTPUT fields at the bottom of the screen now
has the additional letter "A" at the end. This
signifies that this point has active generic
alarming parameters.
Continuing from step 4 of Section 8.1.1., Generic
Alarming Setup:
5. Set the Advisory Method field to "Absolute
Levels."
6. Set the Advisory Use field to "Instantaneous."
7. In the "Notice Levels" column, highlight the
"Occupied Hi" field, and enter the desired
warning temperature threshold. This value
should not be higher than the programmed
DLT trip setpoint in the PerformanceAlert™.
8. In the "Notice Levels" column, set the Report
Delay to the desired amount of time (in
HH:MM) the discharge line temperature
must remain at or above the Occupied Hi
field value to cause the advisory to occur.
9. In the "Notice Levels" column, set the Report
Priority to 99 (the lowest possible priority
level).
10. In the "Notice Levels" column, highlight the
Return to Normal Delta field, and enter the
number of degrees the discharge line temperature must fall below the value in the Occupied Hi field to set the advisory status to
"return-to-normal."
11. In the "Alarm Levels" column, highlight the
Report Priority field and change its value to
zero to disable generation of ALARM advisories.
9. Press
8.1.2.2. Analog Alarms
The only analog values on the PerformanceAlert™
Gateway are points 13, 14, and 15 of each virtual 16AI
board that represents a PerformanceAlert™ module when
the Gateway is operating in Expanded Mode. Points 13 and
14 are current values; point 15 is the discharge line temperature.
Passing PerformanceAlert™ Alarm Data to the E2 Advisory Log E2 Applications • 21
J to return to the Input Status
screen. Repeat steps 1 through 8 for the remaining digital PerformanceAlert™ Gateway points until all digital points are set up
for alarming.
Page 28

When finished, the Analog Alarm Setup screen should
appear similar to Figure 8-4. Press
and exit to the Input Status screen.
Figure 8-4 - Analog Alarm Setup Parameters
J to save changes
8.1.3. Advisory Values and Priorities
When setting up Generic Alarming, you will want to
choose advisory types and advisory priorities that are appropriate to the overall alarm filtering and reporting settings for the E2. When alarm dial-outs or annunciation
devices are being used, the E2 will generally be set up to
filter out low-priority alarms and notices. Refer to the E2
User’s Guide for more information about alarm reporting
and dial-out settings.
8.1.4. How the Alarm Appears in the E2
Advisory Log
Because Generic Alarming is not designed specific to
PerformanceAlert™ Gateway, the alarm message generated when a PerformanceAlert™ alarm occurs will not specifically say anything about PerformanceAlert™. Digital
alarm messages will read "State Switched ’ON’", and analog alarm messages will read "Occupied Hi Limit Exceeded." The only indicator of which PerformanceAlert™
module generated the alarm will be from the point name
you entered during point setup, which will be shown in the
alarm’s "Property or Board/Point" column in the alarm log
(Figure 8-5).
In the example in Figure 8-5, since point #1 of the PerformanceAlert™ gateway was named "PF COMP 1" when
the point was set up in Section 6.2.1., the origin of the
alarm can be seen in the application name.
8.2. Using PerformanceAlert™
Current Transducer Values
as Compressor Proofs
When the PerformanceAlert™ Gateway is used in Expanded Mode, the T1 and T3 compressor current values
passed in points 13 and 14 of each virtual 16AI board can
be used to verify a compressor is running when commanded to run and OFF when commanded to be OFF.
For each compressor with a PerformanceAlert™ module installed, one Sensor Control application must be created and programmed to read the current values from the
PerformanceAlert™ Gateway and turn an output ON or
OFF depending on whether the current values signify the
compressor is ON or OFF. This Sensor Control output will
be used as the compressor proof and tied to the appropriate
Suction Group compressor proof input.
8.2.1. Creating Analog Sensor Control
Applications
1. Log in to the E2 and press I (Add
Application).
2. In the "Type" field, select "Analog Sensor
Control." In the "How many?" field, enter the
number of compressor proofs you will be creating.
3. Press
4. Press
8.2.2. Programming Analog Sensor Control Applications
>. The applications will be created.
Press
* when E2 asks if you want to edit
new applications.
H to return to the home screen.
5. Press I (Configured Applications).
6. Press
7. From the Sensor Control summary screen,
8. Press
Figure 8-5 - Example of Advisory Log with "State switched On" Advisory
22 • PerformanceAlert Gateway I&O Manual 026-1724 Rev 0 12-MAY-2008
to select "Sensor Controls" from the
Configured Applications menu.
highlight the name of the analog sensor control you wish to edit, and press
Sensor Control’s Status Screen will be
shown.
>. The
E (Setup) to begin editing.
Page 29

8.2.2.1. General
8.2.2.3. Setpoints
Figure 8-6 - Analog Sensor Control Compressor Proofing General Screen
In the Name field, enter "CMP x PRF" (where x is the
address of the PerformanceAlert™ module whose current
transducer values will be using for proofing by this application). Set all other values in this screen as shown in Fig-
ure 8-6:
Num Inputs: 2
Eng Units: A
Comb Method: MIN
Show Advanced: No
8.2.2.2. Inputs
Figure 8-7 - Analog Sensor Control Compressor Proofing Inputs Screen
In the Inputs tab, enter the board and point address of
the T1 and T3 currents from the PerformanceAlert™ Gateway in the Input1 and Input2 fields. The board number
should correspond to the address number of the PerformanceAlert™ module. T1 will always be point #13 and T3
will always be point #14.
Figure 8-8 - Analog Sensor Control Compressor Proofing Setpoints Screen
In the Setpoints tab, enter 3.0 in the CUTIN field and
2.5 in the CUTOUT field. These setpoints will result in the
sensor control output being ON when the current is above
3 amps and OFF whenever it falls below 2.5 amps. Leave
the Cut In Delay and Cut Out Delay fields set to 0:00:00.
8.2.3. Setting Up Proofing in Suction Group Applications
After entering the CUTIN and CUTOUT setpoints in
the Setpoints tab (Section 8.2.2.3.), press ) to save changes
and exit. You are now ready to configure the compressor in
the suction group to use the output of the sensor control application as its proof.
The instructions below assume the compressor rack is
already set up in a pre-existing Enhanced Suction group application. Refer to the E2 User’s Guide for information on
setting up a suction group.
1. Press
2. Press
3. If more than one Suction Group application is
4. From the suction group’s Status Screen, press
I (Configured Applications).
to select "Suction Groups" from the
Configured Applications menu.
present, highlight the suction group the compressor belongs to, and press
>.
Using PerformanceAlert™ Current Transducer Values as Compressor Proofs E2 Applications • 23
Page 30

E: SETUP.
Figure 8-9 - Analog Sensor Control Compressor Proofing Inputs Screen
APPLICATION: Choose the name
(CMPR x PROOF) you entered for the Analog Sensor Control application
OUTPUT: Choose COMMAND OUT
5. Press
6. Locate the compressor stage for which you
7. Press
Figure 8-10 - Analog Sensor Control Compressor Proofing Setpoints Screen
8. The Proof tab should have a blank Board/
9. For each field in the Controller/Application/
4+ to navigate to the Stage Setup
tab (Figure 8-9).
wish to set up proofing. For this stage, change
the value of the Proof field from "No" to
"Yes."
4+ to bring up the Additional Tabs
menu. Press
Point definition named COMP PROOF with
a number next to the name equal to the number of the compressor stage. Move the cursor
to highlight the Board field of this COMP
PROOF definition, and press
change the definition type from a Board/
Point to a Controller/Application/Output type
definition.
Output, use the Look-Up Table (
point the COMP PROOF input to the output
of the Analog Sensor Control application.
CONTROLLER: Name of this E2
) to select the "Proof" tab.
C to
D) to
Figure 8-11 - Defined Compressor Proof Output
If defined correctly, the proof should look similar to
Figure 8-11. Press
Repeat the process outlined in this section to create all
necessary compressor proofs.
J to save changes and exit.
24 • PerformanceAlert Gateway I&O Manual 026-1724 Rev 0 12-MAY-2008
 Loading...