


Static electricity meter
GAMA 100
G1B.xxx
User manual
Version 2.3b
(G1BEN23b)
“ELGAMA – ELEKTRONIKA” Ltd., Lithuania 2016


“ELGAMA-ELEKTRONIKA”
Static electricity meter
GAMA 100
G1B.xxx
USER MANUAL
"ELGAMA-ELEKTRONIKA" Ltd.
2 Visorių str.
LT-08300 Vilnius
Ph.: +370 5 2375000
Fax: +370 5 2375020
E-mail: info@elgama.eu

REVISION HISTORY
Version Date Comments
1.0 2010-07-19 First release
1.1 2010-09-20 Information update
1.2 2011-09-01 Description of functional possibility added (Internal mains Relay, Shunt and
RS485 interface)
1.3 2012-01-04 Synchronization of internal clock (RTC) and control algorithm of internal
main relay was added
1.4 2012-05-14 Description of functional possibility added (current measurement in neutral
and Wired M-Bus interface was added)
1.5 2012-11-12 Control algorithm of Internal main relay by specified time and date, and by
current over limit was added. Encryption and Authentication.
2.0 2014-03-07 Description of internal PLC modem and firmware upgrade functionality was
added.
2.1 2014-04-29 Description of internal PRIME PLC modem (modification H2) and firmware
upgrade functionality was added.
2.2 2015-03-04 Tariff program update. LCD list updated and removed inaccessible
features. Bi-stable internal relay functionality updated.
2.2a 2015-04-18 New modification of optional LCD was added. Wireless M-Bus was added.
2.2b 2015-08-21 Description of internal PLC modem (modifications H3, H4), THD
measurement and Second Load Profile (Network profile) was added
2.3a 2015-08-25 DLMS/COSEM protocol Logical name (LN) referencing, non-transparent
meter case and Extended LCD was added
2.3b 2016-03-04 Information about power consumption of meter with external power supply
for modem was added. Bi-stable internal relay functionality updated.
Wireless MBus interface was added. Meter status on LCD update

S
TATIC ELECTRICITY METER
GAMA 100. U
SER MANUAL
Contents
Contents .................................................................................................................................................................. 5
About this document ................................................................................................................................................ 8
1 Safety .............................................................................................................................................................. 8
1.1
Safety requirements ............................................................................................................................... 8
1.2
Transportation and storage rules ........................................................................................................... 8
1.3
Prevention and elimination of malfunctions............................................................................................ 9
1.3.1 Exterior inspection ............................................................................................................................. 9
1.3.2 Inspection of connection and parametrization constants ................................................................... 9
1.3.3 Procedure of meter returning to manufacturer ................................................................................... 9
1.3.4 Proper disposal of product ................................................................................................................. 9
2 Designation ...................................................................................................................................................10
3 Meter modifications .......................................................................................................................................11
3.1
Modifications ........................................................................................................................................11
3.2
Technical specifications .......................................................................................................................11
4 Functional possibilities ..................................................................................................................................12
4.1
Current, voltage, frequency ..................................................................................................................12
4.2
Additional functions ..............................................................................................................................13
4.3
Sealed button functions ........................................................................................................................13
4.4
Backup power source ...........................................................................................................................14
4.5
Communication, inputs/outputs ............................................................................................................14
4.6
Voltage and current circuit separation ..................................................................................................15
4.7
Internal bi-stable mains Relay ..............................................................................................................15
4.8
LCD options ..........................................................................................................................................15
4.9
Internal PLC modem ............................................................................................................................15
5 Construction ..................................................................................................................................................16
5.1
Case .....................................................................................................................................................16
5.2
Nameplate ............................................................................................................................................16
5.3
Terminal block ......................................................................................................................................17
5.4
Operation principle ...............................................................................................................................18
5.4.1 Measurement module ......................................................................................................................18
5.4.2 Signal conversion .............................................................................................................................18
5.4.3 Micro-controller ................................................................................................................................18
5.4.4 Non-volatile memory ........................................................................................................................18
5.5
Display (LCD) .......................................................................................................................................18
5.5.1 Default LCD (Option #1) ..................................................................................................................19
5.5.2 Optional LCD (Option #2) ................................................................................................................20
5.5.3 Extended LCD (Option #3) ...............................................................................................................21
5.6
Internal clock ........................................................................................................................................22
5.6.1 Synchronization of internal clock (RTC) ..........................................................................................22
5.7
Sliding voltage link ................................................................................................................................23
6 Communication .............................................................................................................................................23
6.1
Optical communication interface ..........................................................................................................23
6.2
Electrical interface ................................................................................................................................23
6.3
Controller MCL 5.XX with internal GSM/GPRS modem ......................................................................24
6.4
PLC modem .........................................................................................................................................25
6.4.1 Internal PLC modem ........................................................................................................................26
6.5
Wired M-Bus module ............................................................................................................................26
6.6
Wireless M-Bus interface .....................................................................................................................27
6.7
Plug & Play ...........................................................................................................................................27
6.8
Outputs/Inputs ......................................................................................................................................27
6.8.1 Optical test output (red LED) ...........................................................................................................27
6.8.2 S0 outputs ........................................................................................................................................27
6.8.3 Relay output .....................................................................................................................................27
6.9
Power supply ........................................................................................................................................28
6.9.1 Power supply for external modem ...................................................................................................28
6.10 Push buttons ........................................................................................................................................28
6.10.1
Scroll push button and optical scroll key .....................................................................................28
6.10.2
Sealed push-button .....................................................................................................................29
7 Data registers ................................................................................................................................................29
7.1
Energy registers ...................................................................................................................................29
7.2
Demand registers .................................................................................................................................30
5

7.3
Maximum demand registers .................................................................................................................31
8 Data profiles ..................................................................................................................................................31
8.1
Billing profile .........................................................................................................................................31
8.2
Load profile ...........................................................................................................................................33
8.3
Second load profile ...............................................................................................................................34
8.4
Wired M-Bus load profile ......................................................................................................................34
8.5
Event log...............................................................................................................................................34
8.5.1 Power failure (outage) event log ......................................................................................................35
8.5.2 Voltage swell (over-voltage) event log .............................................................................................35
8.5.3 Voltage sag (under-voltage) event log .............................................................................................35
8.5.4 Event log of internal mains relay ......................................................................................................35
8.5.5 Power over-limit event log ................................................................................................................36
8.5.6 Reverse current flow event log ........................................................................................................36
8.5.7 Over-current event log .....................................................................................................................36
8.5.8 Neutral current balance event log ....................................................................................................37
8.5.9 Magnetic field influence event log ....................................................................................................37
8.5.10
Opening of meter cover event log ...............................................................................................37
8.5.11
Opening of terminal cover event log ............................................................................................37
8.5.12
Clock change (setting) event log .................................................................................................37
8.5.13
Parameterisation (Parameter change) event log .........................................................................38
8.5.14
Security failure (failed authentication) log ...................................................................................38
8.5.15
Meter (internal) error event log ....................................................................................................39
8.5.16
Tariffs event log ...........................................................................................................................39
8.5.17
Load profiles reset log .................................................................................................................39
8.5.18
Firmware update event log ..........................................................................................................39
9 Data monitors ................................................................................................................................................39
9.1
Demand monitor ...................................................................................................................................39
9.2
Current monitor ....................................................................................................................................40
9.3
Over-voltage monitor ............................................................................................................................41
9.4
Under-voltage monitor ..........................................................................................................................41
10 Tariff program ................................................................................................................................................42
10.1 Day tariff programs ...............................................................................................................................42
10.2 Week tariff program ..............................................................................................................................43
10.3 Tariff seasons .......................................................................................................................................43
10.4 List of special days ...............................................................................................................................43
10.5 “Emergency” tariff .................................................................................................................................44
10.6 Tariff timers ..........................................................................................................................................44
11 Data reading ..................................................................................................................................................44
11.1 Reserved-automatic (RA) display sequence ........................................................................................47
11.2 Main automatic (MA) display sequence ...............................................................................................48
11.3 Main manual (MM) display sequence ..................................................................................................48
11.4 Indication of abnormal states on LCD ..................................................................................................48
11.4.1
Internal meter errors ....................................................................................................................48
11.5 Data reading via communication interfaces .........................................................................................49
12 Parametrization .............................................................................................................................................49
13 Data protection ..............................................................................................................................................51
13.1 Physical protection ...............................................................................................................................51
13.2 Software protection ..............................................................................................................................51
13.2.1
Data access security ...................................................................................................................51
13.2.2
Passwords ...................................................................................................................................51
13.2.3
Encryption and Authentication .....................................................................................................52
13.2.4
Firmware/hardware identifiers .....................................................................................................52
13.2.5
User’s identifiers ..........................................................................................................................52
13.2.6
Blocking of optical communication interface ...............................................................................52
13.2.7
Parameterization ID .....................................................................................................................53
13.2.8
Event log, security alerts .............................................................................................................53
13.3 Firmware upgrade ................................................................................................................................53
14 Internal bi-stable main relay ..........................................................................................................................54
14.1 Action “disconnect by remote control command” .................................................................................55
14.2 Action “disconnect by contractual power exceeded” ............................................................................55
14.3 Action “disconnect by phase current limit exceeded” ...........................................................................56
14.4 Action “disconnect by swings of network voltage” ...............................................................................57
14.5 Action “allow to connect by remote control command” ........................................................................58
6

14.6 Action “allow to connect by end of billing period” .................................................................................58
14.7 Action “allow to connect by end of event” ............................................................................................59
14.8 Action “connect by Menu button” .........................................................................................................59
14.9 Action “connect by the mains switch of the internal electrical installation” ..........................................59
15 Installation .....................................................................................................................................................60
Annex A. Dimensions of the meter ........................................................................................................................61
Annex B. Screw torques used in G1B meters .......................................................................................................62
Annex C. List of data objects .................................................................................................................................63
7

About this document
This User Manual presents a description of a static electricity meter GAMA 100 (G1B.xxx)
and its instruction. Please read this instruction prior to the use of the meter. The
manufacturer does not give any guaranty in case meter is damaged during the exploitation
that contravenes with the instructions and requirements of safety stated in the manual and
meter passport.
The manufacturer is not responsible for the loss in case the meter is parameterized without
accordance with the instructions and recommendations presented in the software description
as well as with tariff order defined by the State. It does not carry the responsibility for the
unprofessional acts of responsible persons in case of full or partial loss of billing data.
User manual presents the description of all possible characteristics, functions and auxiliary
outputs of electricity meter. A concrete meter may not comply with all characteristics
introduced in this manual; however, meter passport defines a precise meter configuration,
possibilities and auxiliary outputs as well as a concrete connection scheme.
The manufacturer has a right to change the information presented in this manual without the
warning. In addition, any copying, transmission and publication of full or partial meter
documentation is forbidden without a written permission of “ELGAMA-ELEKTRONIKA” Ltd.
1 Safety
1.1 Safety requirements
1. Installing, uninstalling, parameterization and verification can be performed only by
authorized organizations that have qualified technicians. Only qualified persons should
install meters.
2. Meter’s connection or disconnection from network should be done when voltage in the
network is turned off. A protection from accidental network voltage connection must be
established.
3. No accessories can be hung on a meter, it is forbidden to hit or strike meter’s case.
4. Precautions must be taken in battery changing procedure: 1) meter has to be
disconnected from electricity network, a protection from accidental network voltage
connection must be assured; 2) use pincers or similar instruments to change battery
(connection/disconnection of a plug).
1.2 Transportation and storage rules
1. Prior to the usage meter must be kept in a closed room in a transportation packing,
where the temperature ranges from 5°C to 40°C and average area humidity is up to
80% when temperature being 25°C. The room must be without harmful gas or steam.
Meter must be kept and exploited in premises protected from dust, aggressive vapors
and gas.
2. Unpacked meters can be kept only in repair workshop. The temperature must range
from 10°C to 35°C, average area humidity must not exceed 80% when temperature
being 25°C.
3. During wintertime meters must be kept in a heated room for 6 hours or more, before
they are used.
4. Meters are to be transported only in closed vehicles (carriage, container, hold). Shake
acceleration is to be up to 30m/s², 80-120 strikes per minute. The temperature must
range from -40°C to +70°C, average area humidity must not exceed 98% when
temperature being 35°C.
8

1.3 Prevention and elimination of malfunctions
If suspected that meter works improperly, the following actions should be performed:
1.3.1 Exterior inspection
Before applying voltage to the meter makes sure its case has no mechanical damages, there
are no signs of overheating, and all wires are properly connected.
Do not plug a meter into network if it is mechanically damaged. This can cause
staff injuries and destroy meter as well as other equipment!
Before switching on network voltage, it is necessary to check if sliding voltage
link is connected (see chapter 5.7 Sliding voltage link).
1.3.2 Inspection of connection and parametrization constants
Installing, uninstalling, parametrization and verification can be performed only by authorized
organizations that have qualified technicians. After plugging a meter into electric network
technician should check whether date and time are correct, whether meter shows right
energy direction, valid tariff time zone and calendar, tariff seasons.
1. If meter shows wrong date and time, a representative from the organization in charge of
the meter installation should be informed.
2. If LCD indicator shows a warning note ‘Er’, the meter should be uninstalled and passed
for repair works.
3. If energy direction is wrong, technician should check whether inputs are connected
properly to terminal block.
4. If meter calendar season, season time name or valid tariff time zone does not correspond
to real situation, meter’s parameterization data has to be checked and errors has to be
corrected by repeated meter’s parameterization.
1.3.3 Procedure of meter returning to manufacturer
In case malfunctions cannot be eliminated on the spot, the meter should be returned to the
manufacturer for repair or replacement. Meters on their return to manufacturer must have
their Passport with notices of organization in charge of their exploitation and short description
of meter’s malfunctioning.
1.3.4 Proper disposal of product
This sign indicates, that this product cannot be thrown out with any other
waste when its validity period is over if this sign is on the product or it is
included in product’s description. In order to prohibit possible harm for
environment and human health because of uncontrolled waste
elimination, please separate this product from other forms of waste, and
if it is possible use this product or its parts repeatedly in recycling
process. Home users can contact product manufacturer or local
administration for information about product utilization and recycling
without any harm to the environment. Enterprises must contact their own
providers to revise product’s validity terms and conditions stated in
purchase agreements. This product cannot be thrown out with any other
waste of different kind.
9

2 Designation
The static meter of direct connection GAMA 100 (G1B.xxx) is designated for measurement of
active or active and reactive electrical energy in alternate current networks. G1B meters can
measure active energy in both directions (+A and –A, as well as |A|) simultaneously and measure
reactive energy in directions (+R and -R), as well as in four quadrants (R1, R2, R3, R4)
simultaneously.
G1B.xxx meters can register maximum demand on daily and monthly bases, measure
instantaneous values as well as record load profile and event log.
Meters can be either single-rate or multi-rate. The rates are controlled by internal real-time clock.
G1B.xxx meters have S0 output(s) and optionally can have optical and electrical communication
interfaces for local and remote data transmission.
Meter G1B.xxx conforms to the following requirements of directives and standards:
- Directive 2004/22/EC of the European Parliament and of the Council of 31 March 2004 on
measuring instruments;
- Directive 2004/108/EC of the European Parliament and of the Council of 15 December 2004
on the approximation of the laws of the Member States relating to electromagnetic
compatibility and repealing Directive 89/336/EEC;
- EN 50470-3:2006 “Electricity metering equipment (a.c.) – Static meters for active energy
(class indexes A, B and C)”;
- EN 50470-1:2006 “Electricity metering equipment (a.c.) – General requirements, tests and
test conditions – Metering equipment (class indexes A, B and C)”;
- IEC 62053-21:2003 “Electricity metering equipment (a.c.) – Static meters for active energy
(classes 1 and 2)”;
- IEC 62053-23:2003 “Electricity metering equipment (a.c.) – Static meters for reactive
energy (classes 2 and 3)”;
- IEC 62052-11:2003 “Electricity metering equipment (a.c.) – General requirements, tests and
test conditions. Part 11: Metering equipment”;
- IEC 62052-21:2003 “Electricity metering equipment (a.c.) – General requirements, tests and
test conditions. Part 21: Tariff and load control equipment”;
- IEC 62054-21:2004 “Electricity metering equipment (a.c.) – Tariff and load control. Part 21:
Particular requirements for time switches”;
- IEC 62056-21:2002 “Electricity metering – Data exchange for meter reading, tariff and load
control. Part 21: Direct local data exchange”;
- IEC 529 “Degrees of protection provided by enclosures”
- IEC 61334-4-41 “Distribution automation using distribution line carrier systems – Part 4:
Data communication protocols – Distribution line message specification”
- IEC 62056-46 Data link layer using HDLC protocol;
- IEC 62056-53 DLMS/COSEM Application Layer;
- IEC 62056-61 DLMS/COSEM Obis code;
- IEC 62056-62 DLMS/COSEM Interface Classes.
- EN 13757-2:2005 Communication systems for and remote reading of meters - Part 2:
Physical and link layer;
- EN 13757-3:2005 Communication systems for and remote reading of meters - Part 3:
Dedicated application layer;
- EN 50065-1 Signalling on low-voltage electrical installations in the frequency range 3 kHz to
148,5 kHz -- Part 1: General requirements, frequency bands and electromagnetic
disturbances.
Note: Tables and Figures in this User manual may present measurement values and pulse outputs
in all possible energy and power directions. Actual number of measured values and pulse outputs
of a certain meter modification are indicated in meter passport.
10
XXX.
X
1 X
5 X
Accuracy class:
Reference voltage U
, V:
Operating voltage range, % from U
:
Reference I
(maximum I
) current, A:
Starting current, % from I
:
Reference frequency, Hz:
Power consumption, VA:
Meter constant, imp/kWh, imp/kva
rh:
Internal clock (IEC 62
052-21
, IEC 62054
-21):
Tariff module functions:
S0 outputs (IEC 62053
-
31):
3 Meter modifications
3.1 Modifications
Meter G1B is multi-tariff meter (measures active and reactive energy).
Detailed explanation of meter modification is presented in Table 3-1.
Table 3-1 GAMA 100 meter modifications
Type explanation example:
Construction
G1B (LCD, multi-tariff, active energy or active and reactive energy, max demand, extended
functionality)
Accuracy class
A (EN 50470-3), 2.0 (IEC 62053-21) 0
B (EN 50470-3), 1.0 (IEC 62053-21) 1
Measurement circuits
1 elements, 2 wire 5
2 elements (current measurement in neutral), 2 wire 6
In/Imax, Iref/Imax
1:8 0
1:10 1
1:12 2
1:16 3
1:20 4
G1B.
G1B
2
Example: G1B.152 is G1B construction meter that conforms to the requirements of accuracy class B and 1.0. Meter is
designated for measurement of energy in 2 wire alternate current networks; it has 1 measurement element. It is directconnected meter with maximum current up to 60 A. Ratio of reference current and maximum current is 1:12.
3.2 Technical specifications
Table 3-2 Technical specifications
n
ref
Operation duration using only backup power supply (Li-ion battery) > 10 years
max
ref
Active energy measurement B (EN 50470-3), 1.0 (IEC 62053-21)
Reactive energy measurement 2.0 (IEC 62053-23)
n
In voltage circuits <1.0 VA (<0.5 W)
In current circuits < 0,05
Error < 0,5 s/24 h (T=23°C),
Backup power supply for clock Li-ion battery and/or supercapacitor
Number of energy tariffs Programmable (T1 T6)
“Emergency” tariff Programmable (T1 T6)
Number of maximum demand tariffs Programmable (M1 M6)
Data storage duration when voltage disconnected
Number 1
Output constant, imp/kWh (imp/kvarh) 50150000
See Table 4-2
-20... +15
See Table 3-1 and Table 4-2
0,4 (class B)
50
<4.0 VA (<1.3 W) with +5V power
supply for external modem
<10 VA (<1.0 W) with PLC module
<10 VA (<1.3 W) with PLC and wired
MBus modules
<10 VA (<2.2 W) with PLC and wireless
MBus modules
50150000
< 0,15 s/°C/24 h
>20 years
11
Relay output:
Internal mains relay:
Communication interfaces:
Isolation:
Magnetic field sensiti
vity
Protection against dust and water
Temperature range:
Mass, kg:
Dimensions, mm
Average service life
Code:
X X X.
FXX.
BX. PX. CXXX.
VX. RX. LX. HX
Reference current
Reference voltage
Reference frequency
F -
additional Functions
B -
sealed Button functions
P -
backup Power source
C -
Communication, I/O
V -
voltage and current circuit separation
R -
internal main relay
L -
LCD options
H –
internal PLC modem
Code:
X X X.
Reference current
Reference voltage
Reference frequency
Pulse duration, ms 30
Programmable (1 2)
Maximum commutation voltage, V 250
Maximum commutation current, mA 120
Bi-stable
Max switching current (Imax)
Max switching voltage (115% Unom)
Max switching power (1.15×Unom×Imax)
Mechanical endurance
Electrical endurance
Optical interface IEC 62056-21, DLMS/COSEM
Electrical interface – CL (20mA current loop) IEC 62056-21, DLMS/COSEM
RS485 IEC 62056-21, DLMS/COSEM
Wired M-Bus/ Wireless M-Bus EN 13757-2; EN 13757-3
Pulse voltage tests (IEC 60060-1) 6 kV (1,2/50 µs)
Alternating voltage tests 4 kV @ 50 Hz, 1 minute
Immunity against permanent magnetic fields
Immunity against electromagnetic HF fields
Operation:
For meters with battery and for meters without power backup source
For meters with supercapacitor
Storage, transportation: - 40 +70°C
with usual terminal cover
with special terminal cover for GSM/GPRS modem
Option #1 Option #2 Option #3
≤ 40A
≤265 V
≤10,6 kW
1×10⁵
5×10³
PLC EN 50065-1 (CENELEC A (3–95 kHz))
> 3.5 mT
≤ 300 mT (current sensor – shunt)
≤ 30 V/m (80 - 2000 MHz)
IP53 default
IP54 (optional)
- 40 +70°C (3K7)
- 25 +70°C
< 0,9
180 x 130 x 65 (see Figure A-0-1)
200 x 130 x 80 (see Figure A-0-2)
16 years
≤ 80A
≤265 V
≤21,2 kW
1×10⁵
5×10³
≤ 100A
≤265 V
≤26,5 kW
1×10⁵
5×10³
4 Functional possibilities
G1B meters can have different functional possibilities which are described below.
Table 4-1 Ordering code
Section No.
1
2
3
4
5
6
7
8
9
4.1 Current, voltage, frequency
G1B meters may differ in current, voltage and frequency. Choices are denoted with the first three
digits in ordering code and are listed in Table 4-2.
Table 4-2 Possible code choices for current, voltage and frequency
No.
Section 1
5 A 2
10 A 3
100 V, 120 V, 127 V 1
220 V, 230 V, 240 V 2
50 Hz 0
See chapter 4.1
See chapter 4.1
See chapter 4.1
See chapter 4.2
See chapter 4.3
See chapter 4.4
See chapter 4.5
See chapter 4.7
See chapter 4.8
See chapter 4.9
See chapter 4.6
12

F -
Energy measurement, instantaneous values, loa
d profiles
Code:
FX X.
Energy measurement
F3
F4
DLMS/COSEM protocol
-
8
B-sealed Button functions
Code:
BX.
4.2 Additional functions
Along with unidirectional and bidirectional active energies, G1B meters may measure reactive
energy and maximum demand, store registers of up to 16 billing periods in billing profile, measure
instantaneous values and record load profile. Choices for energy measurement and programmable
functions are denoted with letter “F” and two digits in ordering code and are listed in Table 4-3.
Table 4-3 Possible code choices for energy measurement, instantaneous values and load profiles
No.
Section 2
Billing and load profile, instantaneous values and maximum demand
Billing and load profile, instantaneous values and maximum demand, reactive energy
Short name (SN) referencing
Logical name (LN) referencing
Table 4-4 List of instantaneous values.
12.7.0 Instantaneous RMS voltage (V)
11.7.0 Instantaneous RMS current (A) in phase
15.7.0
16.7.0 Instantaneous active power ±P (kW)
3.7.0 Instantaneous reactive power +Q (kvar)
4.7.0 Instantaneous reactive power –Q (kvar)
13.7.0
14.7.0 Frequency (Hz)
91.7.0 Instantaneous RMS current (A) in neutral
12.7.124 Instantaneous THD for voltage
11.7.124 Instantaneous THD for current
Harmonics analysis is performed by using a digital band-pass filter, tuned to 50 Hz (narrow band).
Total Harmonic Distortion (THD) for current and voltage is calculated by formulas:
Wide band RMS values are measured up to 21st harmonics (21 × 50 Hz = 1050 Hz).
Maximum demand registration is explained in chapter 7.3. For more information about billing
profile refer to chapter 8.1. List of measured instantaneous values is presented in Table 4-4.
Instantaneous data can be readout via all available communication interfaces.
Please note: meters that do not contain reactive energy registers (Code F3), do not measure
instantaneous reactive power, as well as power factor cos(φ). For more information about load
profile refer to chapter 8.2.
Instantaneous active power |P| (kW)
cos ϕ
THD−=
I
22
II
NBWB
2
I
NB
THD−=
U
U
2
NB
22
UU
NBWB
IWB – RMS value of current, measured in wide frequency band;
INB – RMS value of current, measured in narrow frequency band (50 Hz);
UWB – RMS value of voltage, measured in wide frequency band;
UNB – RMS value of voltage, measured in narrow frequency band (50 Hz).
The sample rate is Fs = 2184.53 Hz (32768 Hz/15).
4.3 Sealed button functions
G1B meters may have sealed button, which may perform one of the functions described below.
Choices of sealed button functions are denoted with letter “B” and one digit in ordering code and
are listed in Table 4-5. More about button functions in chapter 6.10.2.
Table 4-5 Possible code choices for sealed button functions
No.
Section 3 Without Billing period reset B1
Communication unblock for parameterization B2
Billing period reset and communication unblock for parameterization B4
13

No. P -
backup Power source
Code:
PX.
C -
Communication, I/O
Code:
CX X X.
Optical and
electrical interfaces
Outputs/inputs
Control outputs
4.4 Backup power source
G1B meters may have different backup power sources. Backup power source choices are denoted
with letter “P” and one digit in ordering code and are listed in Table 4-6.
Table 4-6 Possible code choices for backup power source
Section 4 Without
Supercapacitor
Unchangeable battery
Changeable battery P3
Changeable battery and supercapacitor P4
Unchangeable battery and supercapacitor P5
P1
P2
Unchangeable battery is mounted on the top right corner of the PCB. Changeable battery is
mounted on the top right corner of the meter under the sealable battery cover and under silicone
protection. Battery cover with sealing option is available on the top right corner of both meters with
changeable and with unchangeable meter. Sealed button is placed under the cover. It is
accessible only when battery cover is opened.
Changing of battery:
• Ensure conditions for meter LCD to be turned-off (do not push scroll button or do not allow
to pass light to optical scroll key);
• Open changeable battery cover and remove silicone protection;
• Make ready new battery for old battery’s replacement;
• Disconnect old battery’s connector, remove the battery;
• Place new battery into old one’s location and connect plug to the corresponding meter
socket;
• Put in silicone protection and close the battery cover;
• After pushing scroll button, meter must display data. Appearance of data is a sign of correct
battery changing process.
4.5 Communication, inputs/outputs
G1B meters may have optical (see chapter 6.1) and electrical interfaces (see chapter 6.2). Meters may
have S0 outputs for transmission of information about measured energy (see chapter 6.8.2). G1B
meters may also have relay output (see chapter 6.8.3). Choices of communications, inputs/outputs are
denoted with letter “C” and three digits in ordering code and are listed in Table 4-7.
Table 4-7 Possible code choices for communications, inputs/outputs
No.
Section 5
Without interfaces C0
Optical interface C1
Optical and 20 mA “current loop” interface C2
Optical and RS485 interface C3
Optical, RS485 and M-Bus C6
Optical, M-Bus and RS485 (PLC duplication) C7
Optical and wireless M-Bus (868 MHz) C9
Optical and wireless M-Bus (169 MHz) CA
Optical and USB host CB
Without 0
S0 out (A) 1
Without
Relay output 1
Two relay outputs 2
0
14
V -
voltage and current circuit separation
Code:
VX.
R -
internal bi
-
stable mains relay
Code:
RX.
L -
LCD options
Code:
LX.
H –
Internal PLC modem
Code:
HX
4.6 Voltage and current circuit separation
G1B meters may be manufactured with or without voltage and current circuit separation. Choices
of circuit separation denoted with letter “V” and one digit in ordering code and are listed in Table
4-8.
Table 4-8 Possible code choices for circuit separation
No.
Section 6 The voltage and current circuits separated by sliding voltage link The voltage and current circuit not separated V1
4.7 Internal bi-stable mains Relay
G1B meters may be manufactured with or without internal mains relays. Choices of internal mains
relay are denoted with letter “R” and one digit in ordering code and are listed in Table 4-9. More
information about internal main relay is in chapter 14.
Table 4-9 Possible code choices for internal main relay
No.
Section 7 Without relay With relay R1
4.8 LCD options
G1B meters may be manufactured with or without function of LCD backlight. Backlight of LCD can
be switched on and turned off by locally and remotely. Choices of LCD options are denoted with
letter “L” and one digit in ordering code and are listed in Table 4-10. Optional LCD display supports
indication of up to 6 (six) tariffs. Extended LCD displays OBIS code by means of 6 symbols, while
default LCD and optional LCD possess only 4 symbols for LCD (see chapter Error! Reference
source not found.).
Table 4-10. Possible code choices for LCD options
No.
Section 8 (LCD Option #1) Default LCD (4 tariffs, 4 symbols for OBIS code) (LCD Option #1) Default LCD with backlight L1
(LCD Option #2) Optional LCD (6 tariffs, 4 symbols for OBIS code) L2
(LCD Option #2) Optional LCD with backlight L3
(LCD Option #3) Extended LCD (4 tariffs, 6 symbols for OBIS code) L4
(LCD Option #3) Extended LCD with backlight L5
4.9 Internal PLC modem
G1B meters may be manufactured with or without internal PLC modem. Choices of internal PLC
modem are denoted by letter “H” and one digit in ordering code, and are listed in Table 4-11. See
chapter 6.4 for further details.
Table 4-11. Possible code choices for internal PLC modem
No.
Section 9 Without internal PLC modem -
With internal PLC modem (DCSK modulation) H1
With internal PLC modem (PRIME) H2
With internal PLC modem (PRIME) and RS485 (PLC duplication) H3
With internal PLC modem (G3) and RS485 (PLC duplication) H4
NOTE: If an option with character “-” is chosen, that function will not be included in the ordering
code.
15
1
6
2
7
3
8
4
9
5
10
5 Construction
5.1 Case
Meter case, fixing holes and terminal block conform to the requirements of standard DIN 43857.
Meter case can be made from transparent highly mechanically resistant and fire retardant
insulation material – polycarbonate, stabilized by ultraviolet rays or molded of non-transparent
polycarbonate with transparent polycarbonate windows for LCD, optical interface and optical test
output. It protects meter interior parts and its nameplate. Main cover (transparent and nontransparent parts of main cover) is fixed to the base by two sealing screws. Removal of main cover
of mounted meter could be done only after terminal cover removal. An option of special sealing
bolts preventing disassemble of meter is available. Terminal cover is fastened with 1 sealing screw
(suspended seal). Access to the terminals without terminal cover removal is excluded. This affords
additional level of security to the customer. Terminal cover has a hole for threading sealing wire to
sealing screw. The possibility to touch the meter terminals with sealing wire while sealing the
terminal cover is prevented.
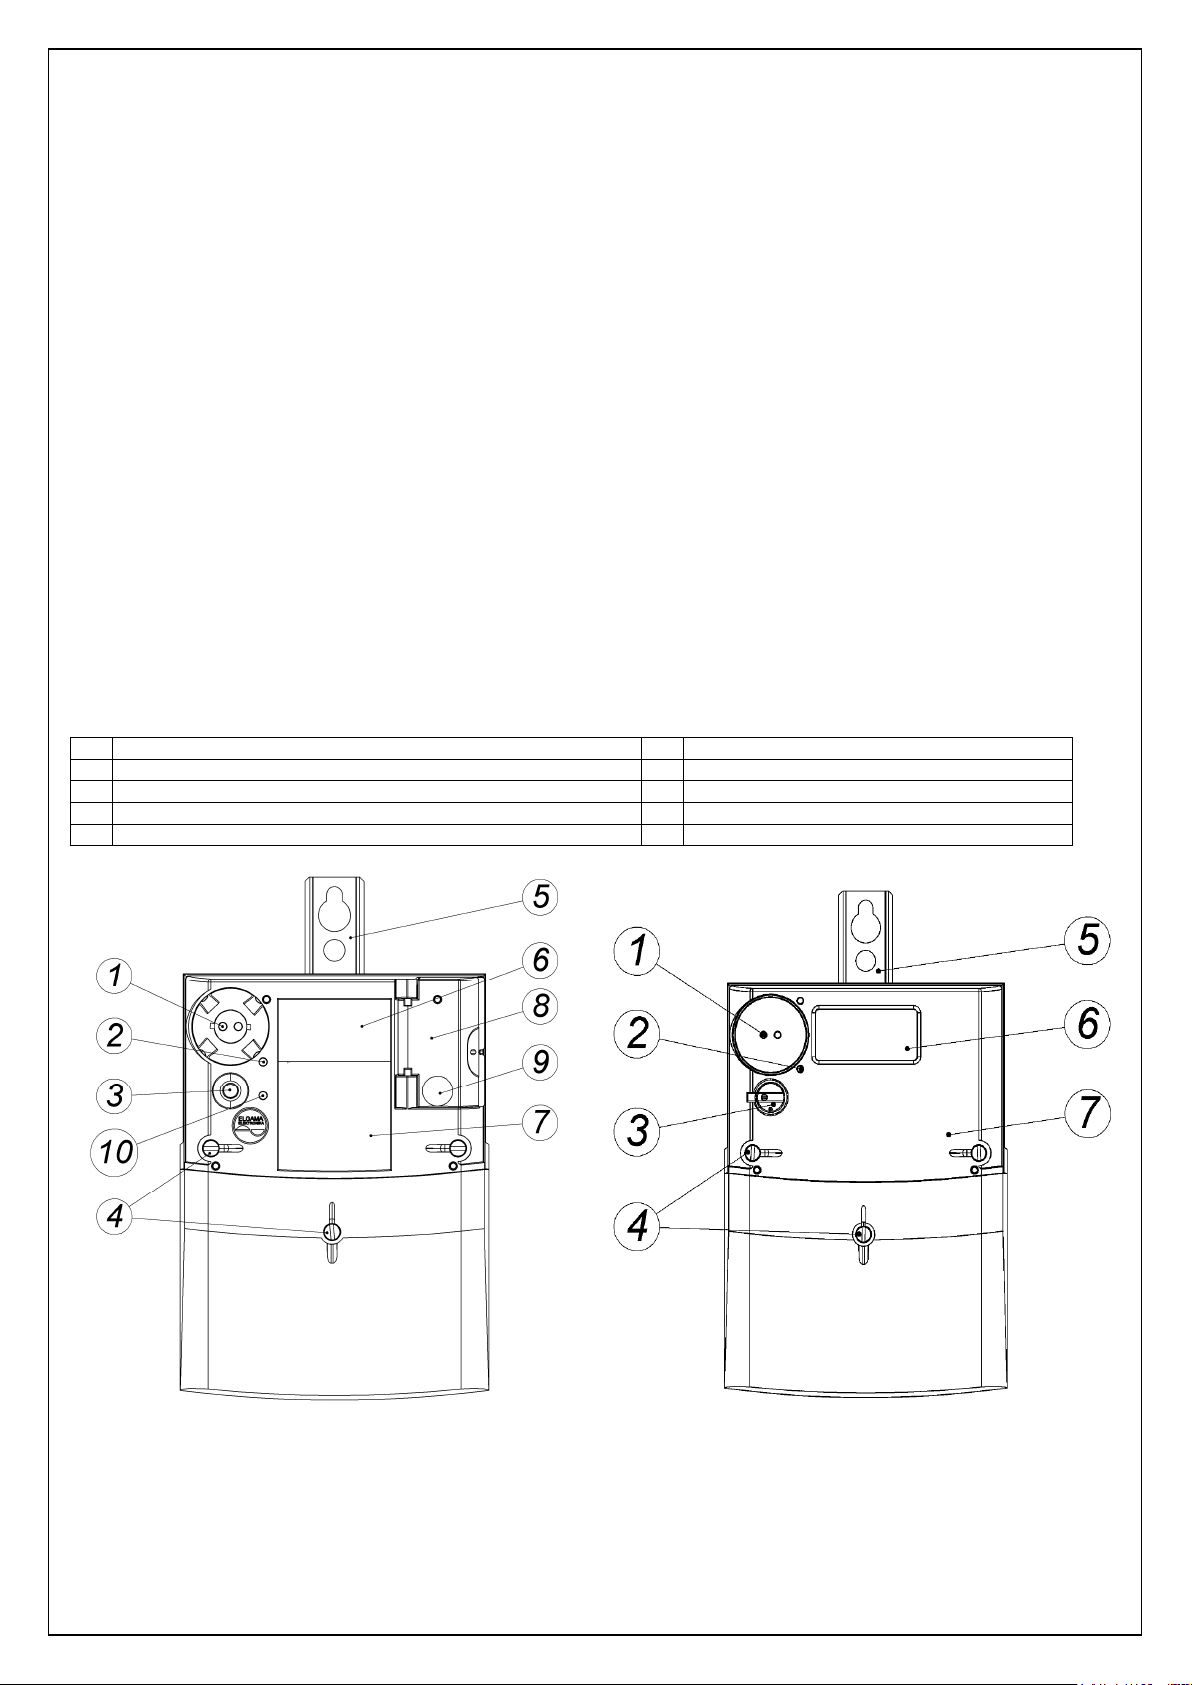
Figure (See Figure 5-1) presents meter exterior parts and allotment of control elements. For case
dimensions and allotment of fixing holes see Figure A-0-1.
There is a liquid crystal display (LCD), optical communication interface, optical scroll key for
display control, sealable and not sealable buttons on the main cover of the meter. See chapter 11
for the explanation of display control commands, and chapter 6.10 for the description of push
buttons.
Table 5-1 Explanation of Figure
Optical Interface
Optical test output [imp/kWh]
Scroll push-button or Multifunctional (two-position) button
Sealing screws of main cover and terminal cover
Eyelet
LCD
Nameplate
Changeable battery cover
Sealed push-button
Status indicator (LED) of internal mains relay
Figure 5-1 G1B meter exterior view with transparent cover Figure 5-2 G1B meter exterior view with non-transparent cover
5.2 Nameplate
Nameplate for meter, with transparent cover, is printed on plates made of PET material during the
meter manufacturing process. This ensures that all marks and inscription are clear, non-erasable
16
Error!
and non-transferable. Nameplate for meters with non-transferable cover is marked on the nontransparent part of main cover by means of laser marking technology during the meter
manufacturing process. This ensures that all marks and inscription are clear, non-erasable and
non-transferable.
The nameplate bears all the necessary information according to EN 50470-1 and Directive
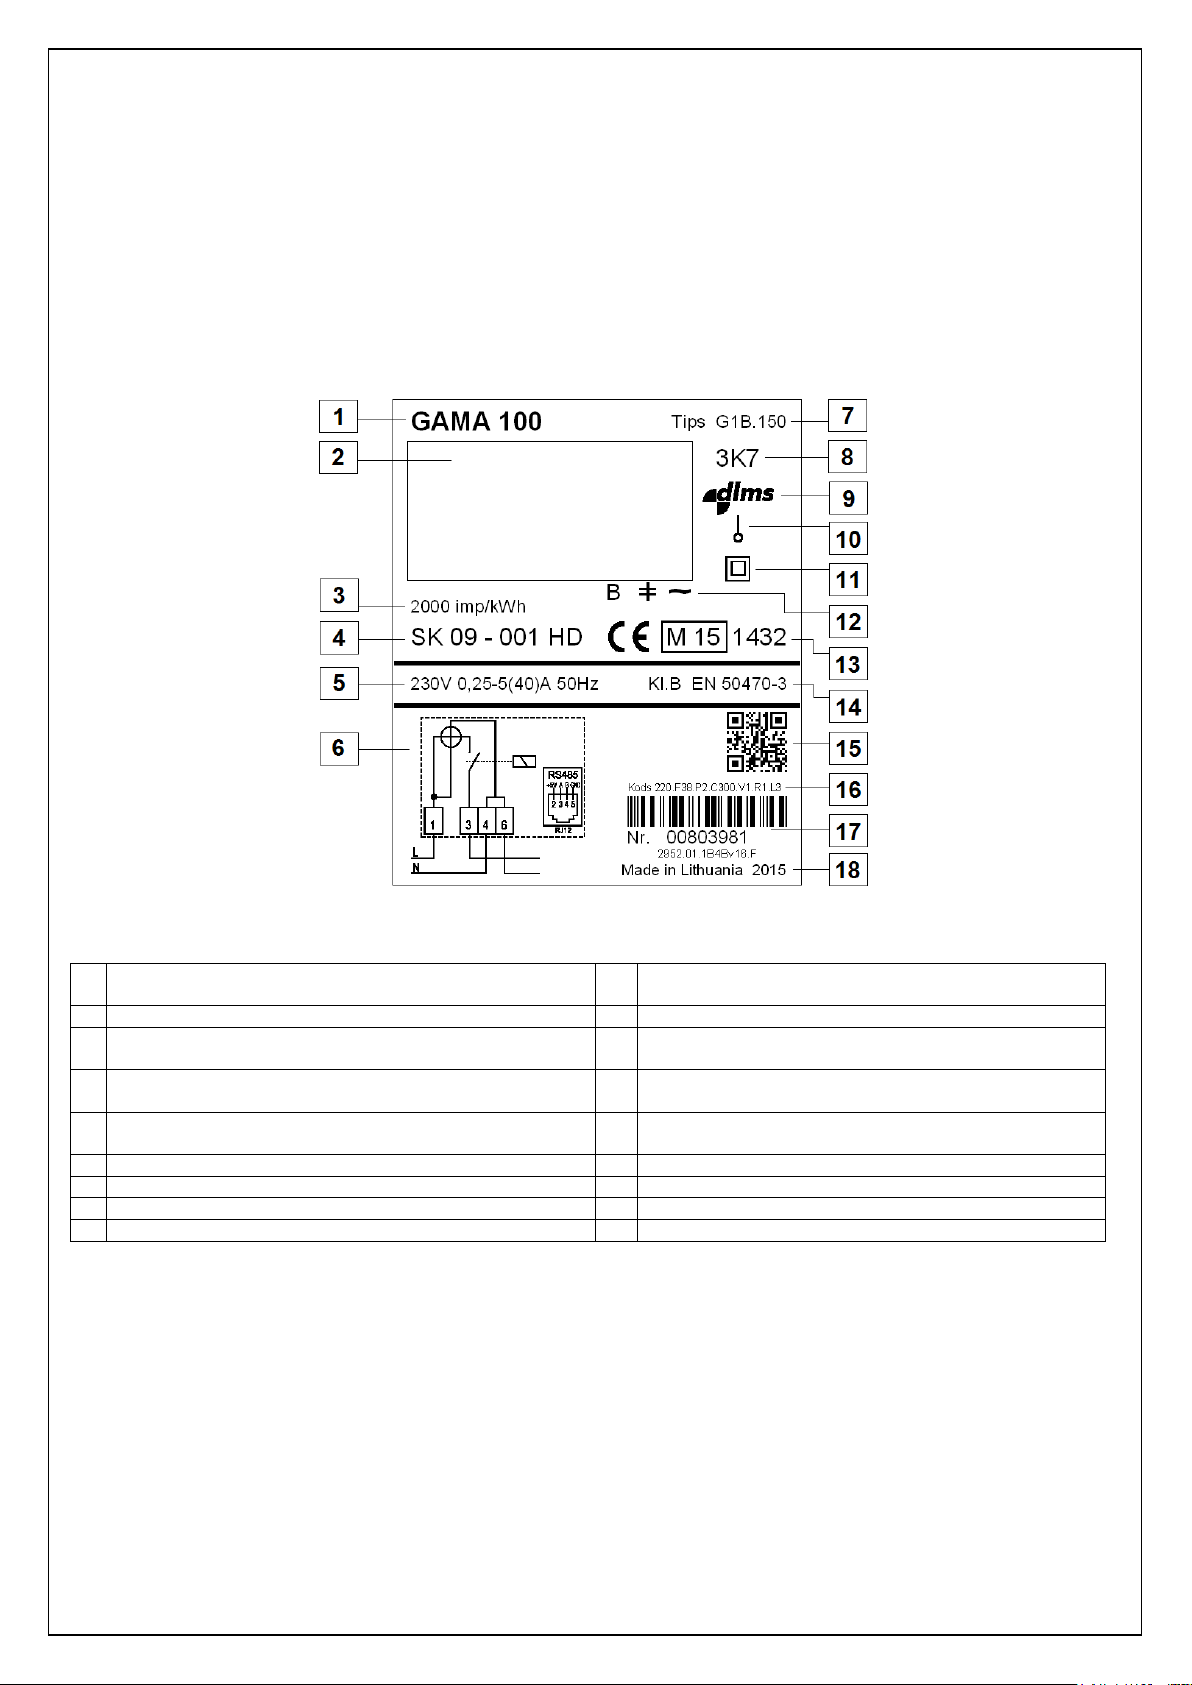
2004/22/EC, as well as identification of main data, displayed on LCD. Example of nameplate is
provided in Figure 5-3. Meter serial number is displayed as barcode (by default, barcode type
Interleaved 2/5). Additional QR (DataMatrix) code which contains the meter technical information is
printed on the nameplate.
Figure 5-3 G1B meter nameplate
Table 5-2 Explanation of Figure 5-3
1 Meter family (Gama 100) 10 The number of phases and the number of wires
(graphical symbols given in EN 62053-52)
2 Meter LCD 11 The sign of protective class II
3 The meter constant (imp/kWh) 12
4 Approval mark (number of the EC design examination
certificate)
5 Reference voltage, current measuring range, reference
frequency
6 Connection diagram or explanation of OBIS codes 15 QR code (contains the meter technical information)
7 Meter type 16 Ordering code and barcode
8 The environmental class 17 The serial number, firmware version
9 DLMS logo 18 Place and year of manufacture
Notification of LCD segments (refer to chapter
Reference source not found.)
13 The conformity marking “CE” and “M”, number of
notified body
14 The class index of the meter
5.3 Terminal block
The terminal block with all meter connections is situated behind the terminal cover. Terminal block
made from highly mechanically resistant and fire retardant insulation material and conform to the
requirements of standard DIN 43857. One utility seal in the fixing screw of the terminal cover
prevent unauthorized access to the phase connections and therefore also prevent unrecorded
energy consumption.
Current and voltage terminals can be made of zinc-plated iron or nickel-plated brass (copper) and
it provides the ability to add copper or aluminium wires without oxidation process. Terminal
assures the same quality of the contact irrespective of the shape of the connection conductor (a
compact wire, a stranded wire, greater or smaller cross-sections).
17
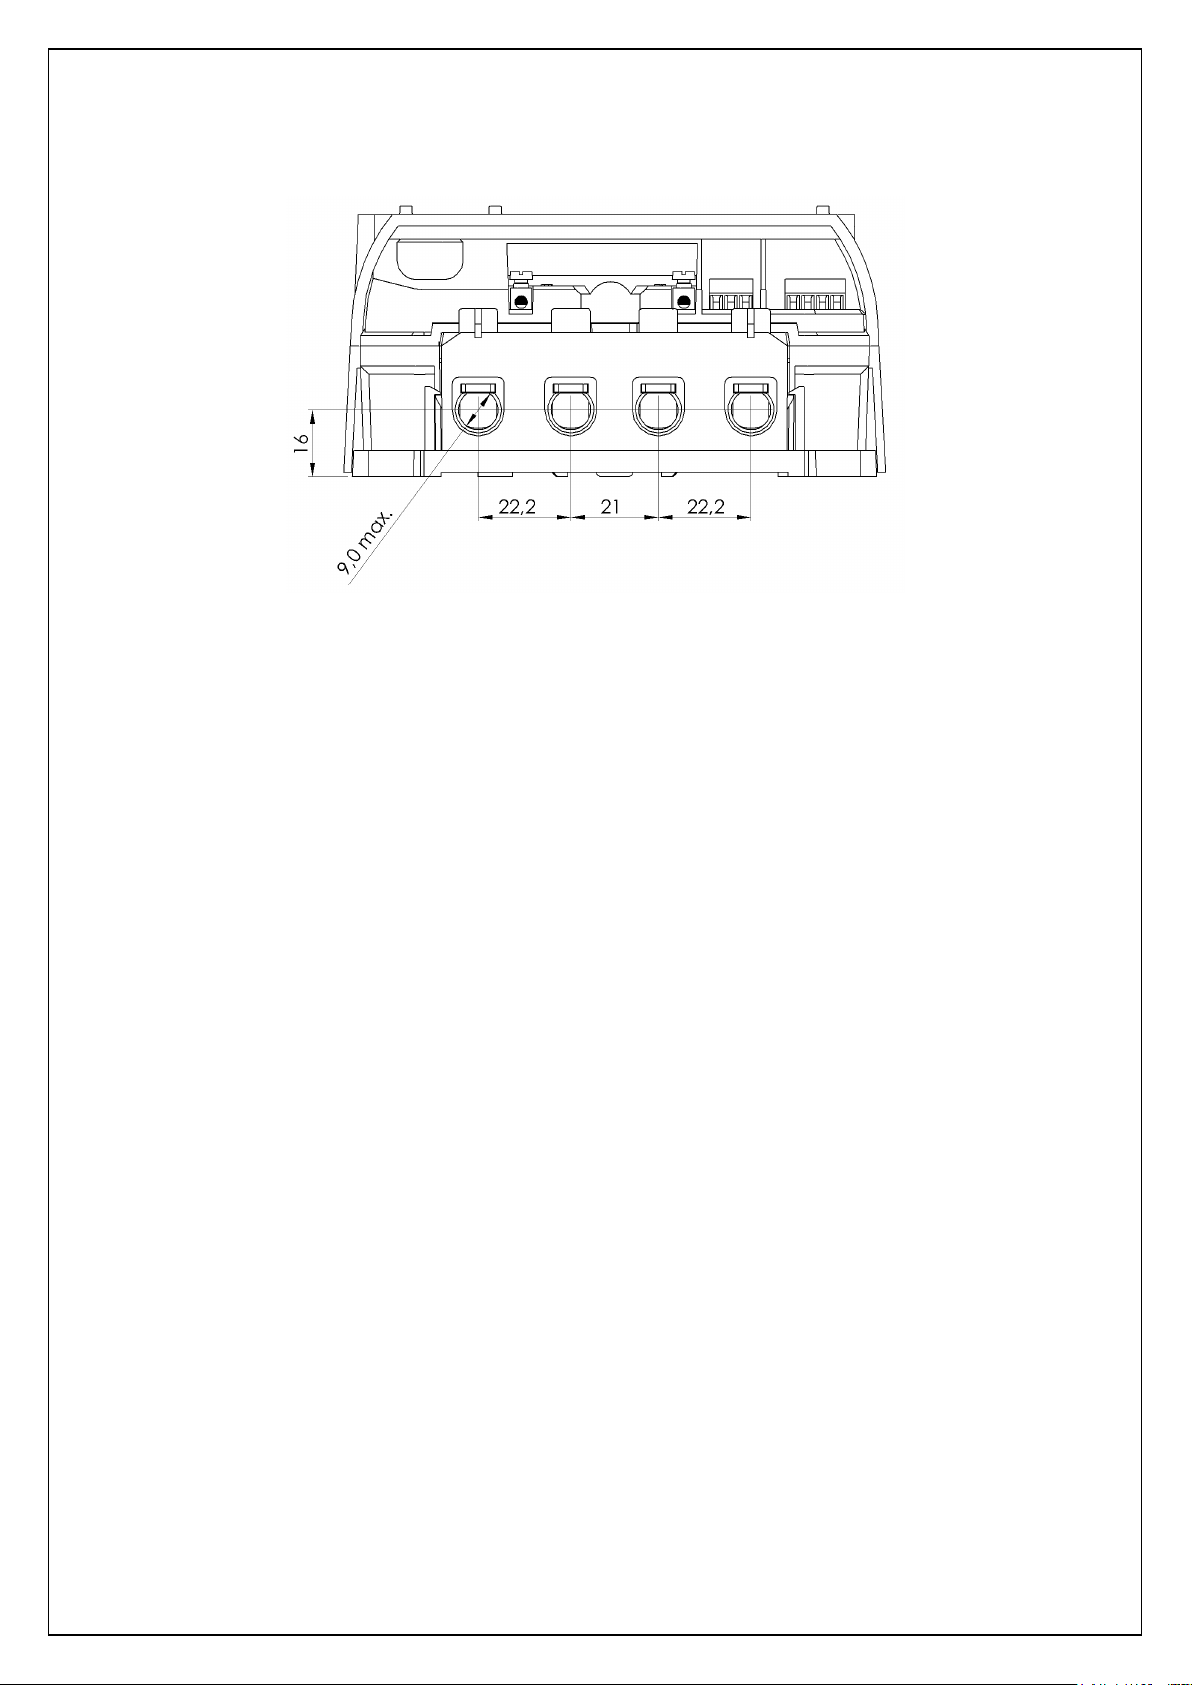
Current terminals for current up to 100 A are with 9 mm hole diameter and wires cross sectional
area at 2.5 mm2 to 60 mm2.
Figure 5-4 Meter terminal block (wires cross sectional area at 2.5 mm2 to 60 mm2)
5.4 Operation principle
5.4.1 Measurement module
In measurement module, current and voltage values of each phase are transformed into
proportionally analogous signals.
Precise current transformers, shunts or di/dt current sensors are used for current measurement in
phase circuit. In case meter contains two measurement elements (i.e. type G1B.x6x carries out
current measurement in neutral as well), current measurement in neutral circuit is based on
different type of current sensor (current transformers or shunts). For voltage measurement,
resistant voltage dividers are employed.
5.4.2 Signal conversion
Analogous signals are transformed into digital codes by three-channel Sigma - Delta converter.
Digital signal processor (DSP) calculates average power values P(t) and Q(t), as well as
instantaneous RMS values of current and voltage. Furthermore, DSP outputs values of RMS
current in neutral and electricity network frequency.
5.4.3 Micro-controller
By integrating power values, micro-controller accumulates import and export energy values.
Energy values are registered to corresponding energy and demand tariff registers in accordance
with the valid tariff program.
Furthermore micro-controller controls liquid crystal display, communication interface, meter
outputs, tariff program and internal clock.
5.4.4 Non-volatile memory
G1B meters contain non-volatile flash memory of different capacity (2048 kB). Flash memory is
used for data profiles and parameter storage. Memory retains data for 20 years and more.
5.5 Display (LCD)
Gama 100 meters are provided with a liquid crystal display (LCD). The display can be provided
with backlight for easier reading (read chapter 4.8). LCD backlight may be configured (only by
manufacturer) for one of two work modes and can work permanently or can be switched on by
18
pressing one of the buttons and is extinguished automatically after a short time if no further button
is pressed. LCD backlight can be switched on and turned off locally or remotely.
Default liquid crystal display of G1B meter contains 115 controlled segments (marked in dark
colour in Figure 5-5 - Figure 5-7). Vertical dimension of main digits is 10 mm. LCD displays
majority of data accumulated in meter and parameterization constants.
LCD divided into 7 information fields which description is not changeable and
status indication
fields (▼).
An arrow symbols
(▼)
are an additional status indication for load, billing reset block, fraud,
alarm, etc. The arrow points to a status description on the nameplate and can be allocated in
different positions for meters with default LCD (
option #1), optional LCD (option #2), and
extended LCD (option #3).
5.5.1 Default LCD (Option #1)
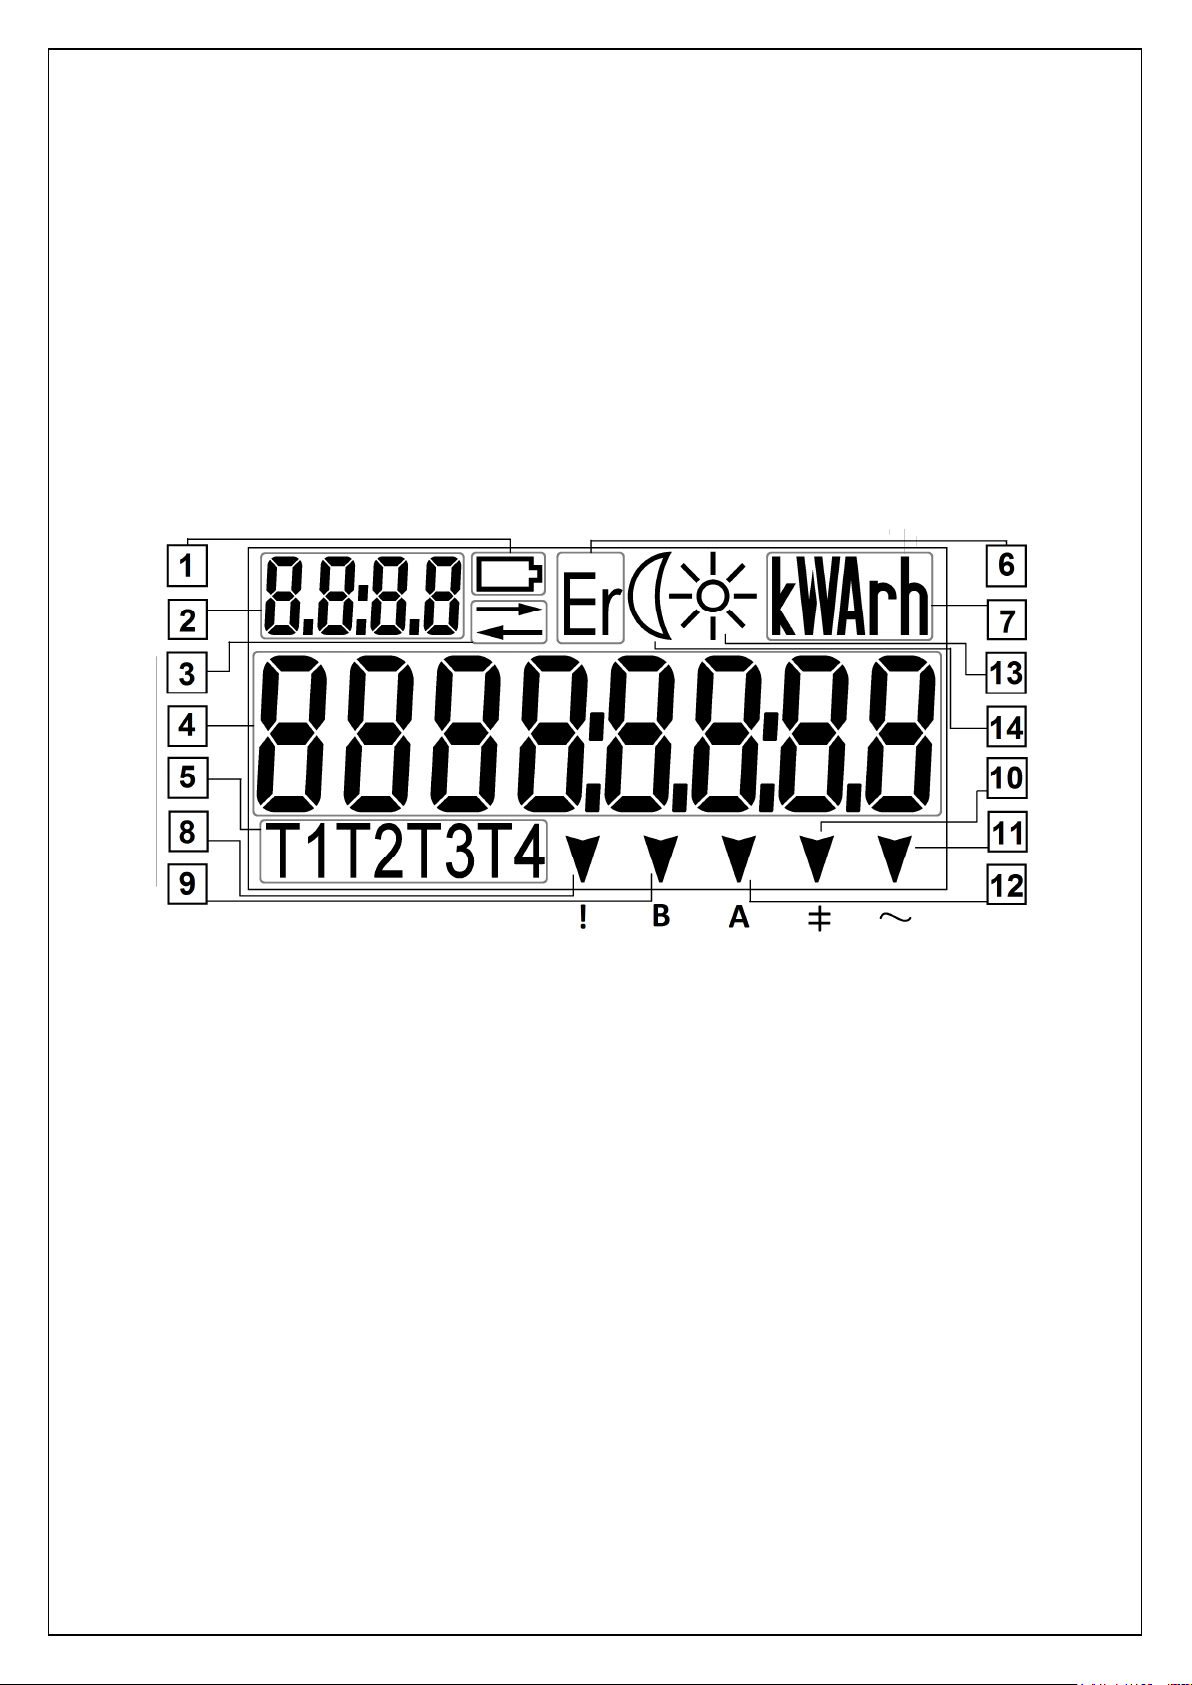
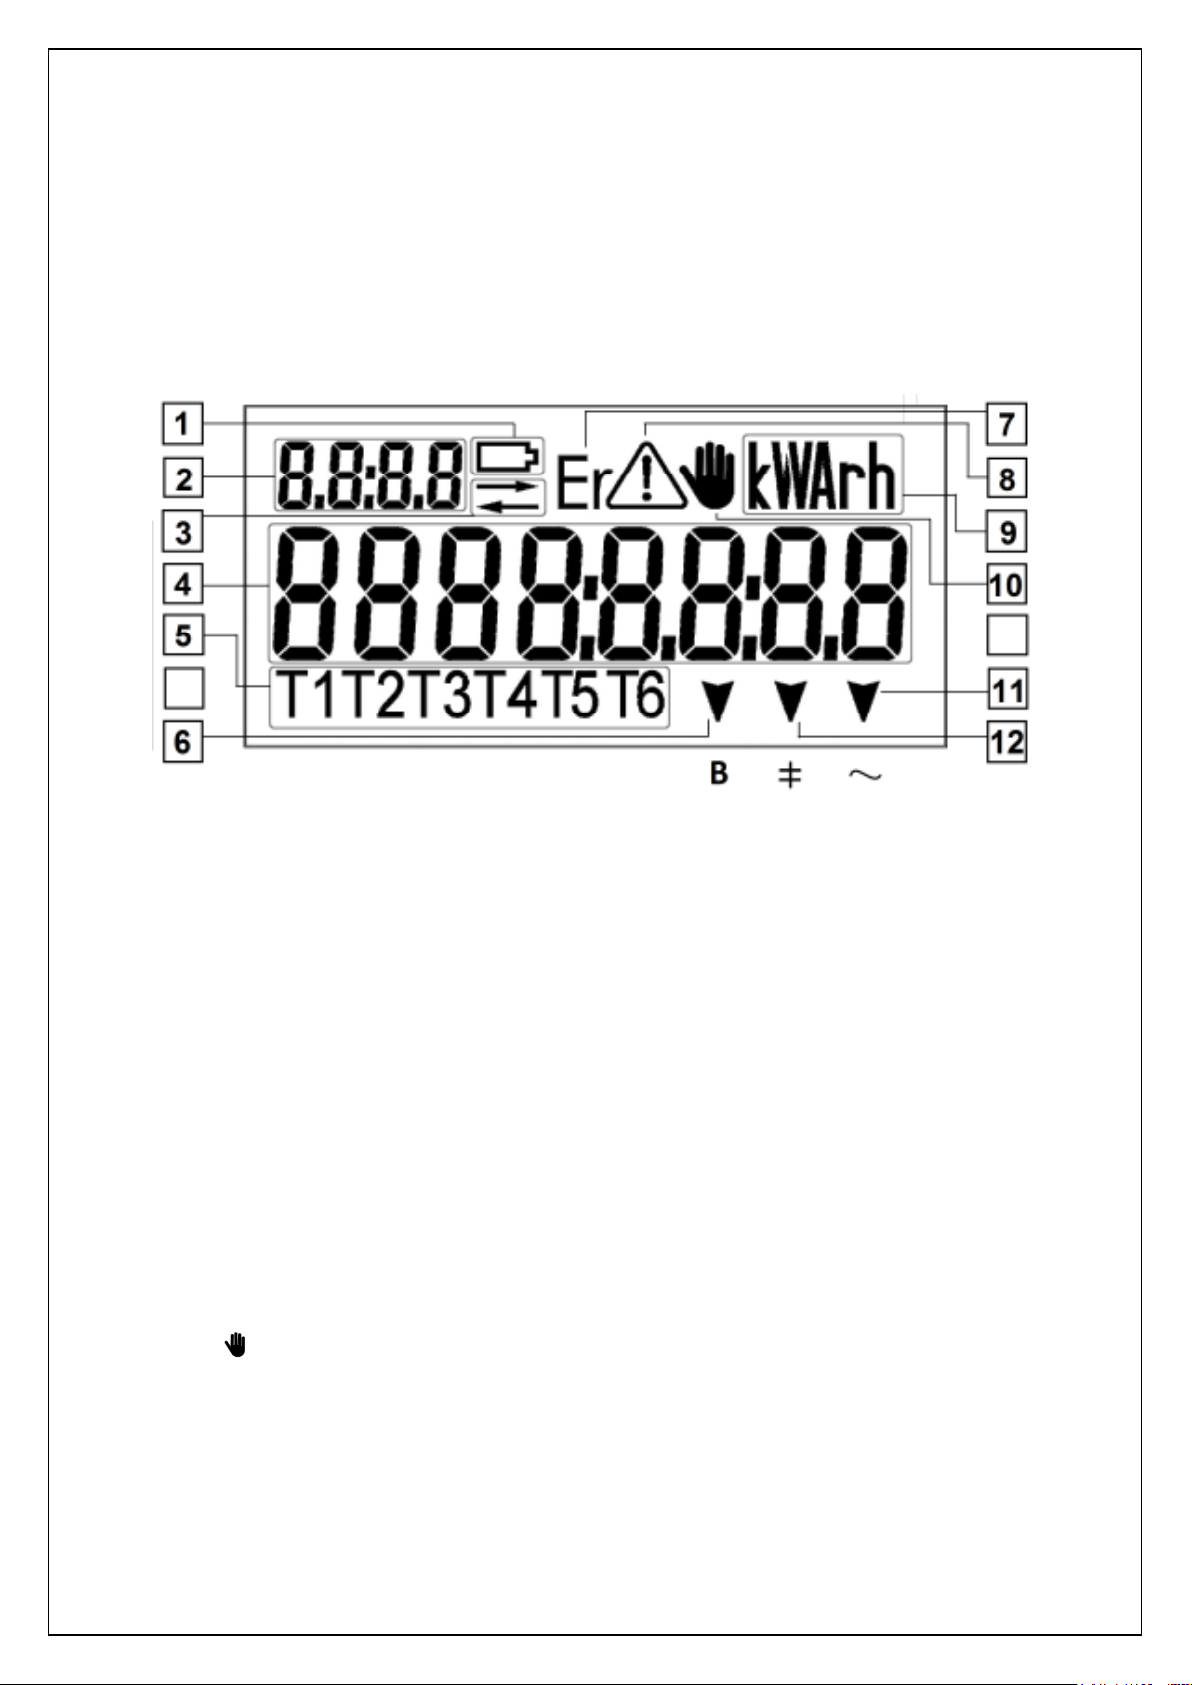
LCD supports indication of up to four tariffs and four symbols for OBIS code (Figure 5-5).
Figure 5-5. Segments and fields of default G1B liquid crystal display
1. Battery state indicator. The symbol appears if the voltage of battery is to low and warns
when battery has to be replaced;
2. Index field. Identifies measured data code (OBIS* code). Explanation of OBIS codes (for
basic data) can be printed on meter’s nameplate;
3. Communication indicator. Indicates when communication operates via optical or electrical
communication interface;
4. Main value field. Shows the measured value (up to 8 digit values are displayed);
5. Tariff field (T1 T2 T3 T4). Shows current energy tariff (only one segment is turned on). Lit
segment indicates active energy tariff, blinking segment indicates active emergency tariff for
energy;
6. Internal fault field (Err). Shows when internal meter error occurs;
7. Measurement unit. Shows units of measured value kW(h), kvar(h), VA, V, A, Hz;
8. Alarm (!).Warns if a contractual power limit is exceeded or neutral current imbalance
(symbol “!” is printed on the nameplate under corresponding segment);
9. Billing period reset (B). Warns about the availability to re-reset billing period. Segment is
not lit – manual billing period reset is available; segment is lit – influence by magnetic field is
registered, segment is blinking – Billing period was just reset recently and sealed pushbutton is currently blocked for some time period (symbol “B” is printed on the nameplate
under corresponding segment).
19
10. Reactive demand (╪). Segment is lit in case of reactive load (±Q). Segment is not lit in
case there is no reactive load (symbol “╪” is printed on the nameplate under corresponding
segment).
11. Active demand (~). Segment is lit in case of positive active load (+P). Segment blinks in
case of negative active load (-P). Segment is not lit in case there is no active load (symbol
“~” is printed on the nameplate under corresponding segment);
12. Fraud (A). Warns if either main cover or terminal cover was opened (symbol “A” is printed
on the nameplate under corresponding segment);
13. Reserved.
14. Reserved.
5.5.2 Optional LCD (Option #2)
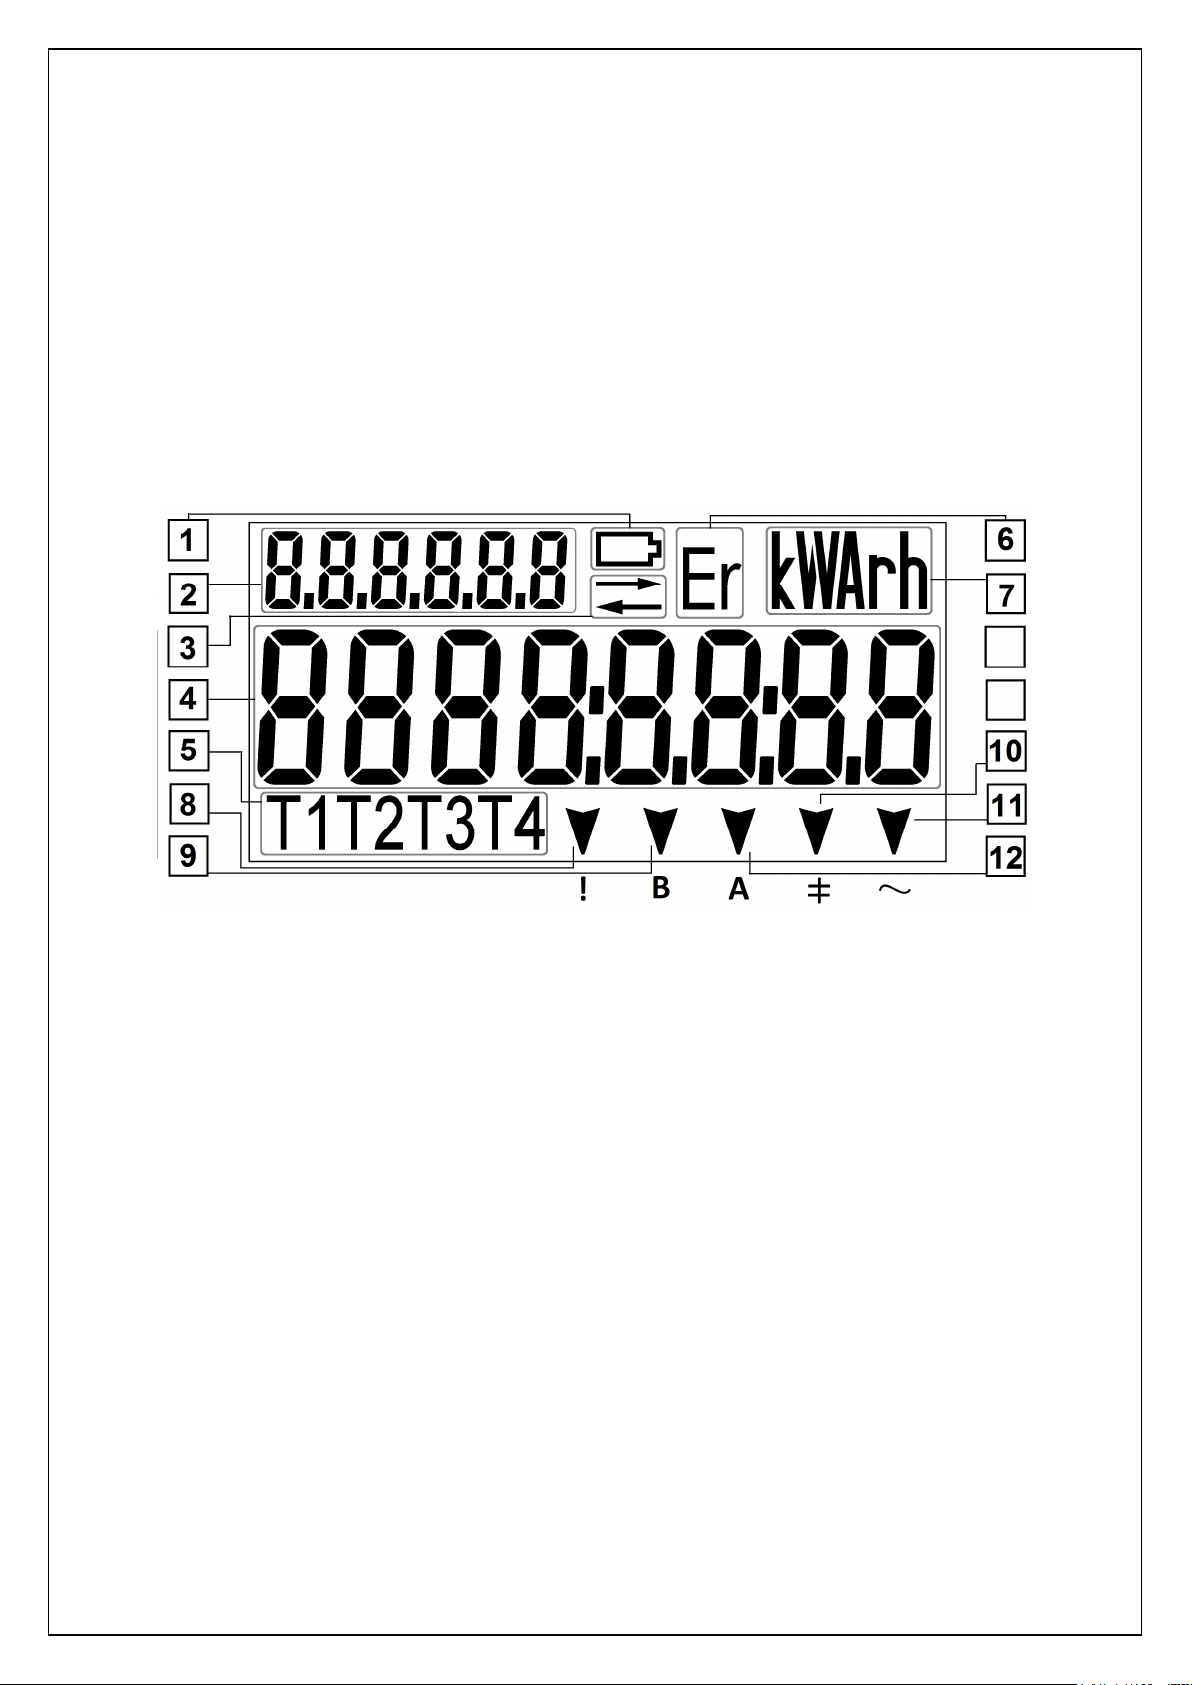
LCD supports indication of up to four tariffs and six symbols for OBIS code (Figure 5-6).
Figure 5-6. Segments and fields of optional G1B liquid crystal display
1. Battery state indicator. The symbol appears if the voltage of battery is to low and warns
when battery has to be replaced;
2. Index field. Identifies measured data code (OBIS* code). Explanation of OBIS codes (for
basic data) can be printed on meter’s nameplate;
3. Communication indicator. Indicates when communication operates via optical or electrical
communication interface;
4. Main value field. Shows the measured value (up to 8 digit values are displayed);
5. Tariff field (T1 T2 T3 T4). Shows current energy tariff (only one segment is turned on). Lit
segment indicates active energy tariff, blinking segment indicates active emergency tariff for
energy;
6. Internal fault field (Err). Shows when internal meter error occurs;
7. Measurement unit. Shows units of measured value kW(h), kvar(h), VA, V, A, Hz;
8. Alarm (!).Show wen influence by magnetic field is registered (symbol “!” is printed on the
nameplate under corresponding segment);
9. Billing period reset (B). Warns about the availability to re-reset billing period. Segment is
not lit – manual billing period reset is available; segment is blinking – Billing period was just
reset recently and sealed push-button is currently blocked for some time period (symbol “B”
is printed on the nameplate under corresponding segment);
10. Reactive demand (╪). Segment is lit in case of reactive load (±Q). Segment is not lit in
case there is no reactive load (symbol “╪” is printed on the nameplate under corresponding
segment);
20
11. Active demand (~). Segment is lit in case of positive active load (+P). Segment blinks in
case of negative active load (-P). Segment is not lit in case there is no active load (symbol
“~” is printed on the nameplate under corresponding segment);
12. Fraud (A). Warns if either main cover or terminal cover was opened or a contractual power
limit is exceeded or neutral current imbalance (symbol “A” is printed on the nameplate under
corresponding segment);
5.5.3 Extended LCD (Option #3)
LCD supports indication of up to six tariffs and four symbols for OBIS code (Figure 5-7).
Figure 5-7. Segments and fields of extended G1B liquid crystal display
1. Battery state indicator. The symbol appears if the voltage of battery is to low and warns
when battery has to be replaced;
2. Index field. Identifies measured data code (OBIS* code). Explanation of OBIS codes (for
basic data) can be printed on meter’s nameplate;
3. Communication indicator. Indicates when communication operates via optical or electrical
communication interface;
4. Main value field. Shows the measured value (up to 8 digit values are displayed);
5. Tariff field (T1 T2 T3 T4 T5 T6). Shows current energy tariff (only one segment is turned
on). Lit segment indicates active energy tariff, blinking segment indicates active emergency
tariff for energy;
6. Billing period reset (B). Warns about the availability to re-reset billing period. Segment is
not lit – manual billing period reset is available; segment is lit – influence by magnetic field is
registered, segment is blinking – Billing period was just reset recently and sealed pushbutton is currently blocked for some time period (symbol “B” is printed on the nameplate
under corresponding segment);
7. Internal fault field (Err). Shows when internal meter error occurs;
8. Alarm (!). Warns if a contractual power limit is exceeded or neutral current imbalance;
9. Measurement unit. Shows units of measured value kW(h), kvar(h), VA, V, A, Hz;
10. Fraud ( ). Warns if either main cover or terminal cover was opened;
11. Active demand (~). Segment is lit in case of positive active load (+P). Segment blinks in
case of negative active load (-P). Segment is not lit in case there is no active load (symbol
“~” is printed on the nameplate under corresponding segment);
12. Reactive demand (╪). Segment is lit in case of reactive load (±Q). Segment is not lit in
case there is no reactive load (symbol “╪” is printed on the nameplate under corresponding
segment);
21

Date format
While network voltage is disconnected, micro-controller operates in energy saving mode, thus,
indicator is not active. When G1B meter is disconnected, data still may be reviewed by affecting
optical scroll key by long light signal or by pushing a scroll push button for 2 to 5 seconds. For
more information see chapter 11.1.
*- The OBject Identification System (OBIS) defines the identification codes (ID-codes) for commonly used data items in
electricity metering equipment. OBIS provides a unique identifier for all data within the metering equipment, including
not only measurement values, but also abstract values used for configuration or obtaining information about the
behaviour of the metering equipment (IEC 62056-61 Electricity metering – Data exchange for meter reading, tariff and
load control – Part 61: Object identification system (OBIS)).
5.6 Internal clock
Meter contains internal clock of real time, which counts years, months, weekdays, hours, minutes
and seconds. Clock information is used to change energy and maximum demand tariffs to form
demand intervals and to register events with date and time stamp. Clock is stabilized by quartz
resonator. Temperature drift is compensated by software (only when network voltage supplies
meter).
Table 3-2 presents the main clock characteristics. Clock can be automatically adjusted to daylight
saving changes. There are different ways to define time and date of daylight saving changes. They
are listed in Table 5-3.
Table 5-3 Possible clock adjustments
[MMDD.hh]
0000.00 No adjustment for daylight saving changes
Clock is adjusted for summer time on the last Sunday of a month MM at 2 a.m. by winding the clock 1 hour
MM00.00
MM00.hh
MMDD.hh
forward;
Clock is adjusted for standard time on the last Sunday of a certain month MM at 3 a.m. by winding the clock 1
hour backward;
Clock is adjusted for summer time on the last Sunday of a specified month on the time specified by winding the
clock 1 hour forward;
Clock is adjusted for standard time on the last Sunday of a specified month on the time specified by winding the
clock 1 hour backward;
Clock is adjusted for summer time on the time and date specified by winding the clock 1 hour forward;
Clock is adjusted for standard time on the time and date specified by winding the clock 1 hour backward;
5.6.1 Synchronization of internal clock (RTC)
In G1B meters it is possible to synchronize internal clock of the meter. There are two concepts in
G1B meter – clock synchronization and clock setting. Clock synchronization is considered when
clock adjustment value is less than ±9 seconds. If meter receives clock synchronization command
with <±9s, then internal clock is adjusted with corresponding value and this event is not recorded
in event logs nor in load profile. Otherwise, when meter receives clock synchronization command
with >±9s value, such event is considered as clock setting and meter adjusts internal clock with
corresponding value and this event is recorded into event log and an entry is made in load profile
with corresponding status byte. Maximum value of clock synchronization command can be ±60s.
There are some security measures implemented in G1B meters in order to prevent attempts of
corrupting the measurements of the meter. There are no limitations of how many clock
synchronization commands could be send to the meter within a day, but there is a limitation, than
single clock synchronization command can be accepted within integration period and a total
correction value cannot exceed ±600s over single year. If there are several attempts of
synchronizing the meter during single integration period or total synchronization value exceeds
±600s, then meter will ignore this command and no clock adjustments will be made (return error
message). Time synchronization can be carried out via all available communication interfaces.
Date and time of clock adjustment
22

5.7 Sliding voltage link
A sliding voltage link is intended for fast and simple separation of the meter current and voltage
circuits for calibration or accuracy testing. A special slider that can be shifted side to side by
means of a screwdriver is built in a terminal block.
Meter main cover enables two options (option is selected during the moulding process by means
of changeable inserts in the mould):
1) Voltage link is secured (covered) by main cover;
2) Voltage link accessible via hole in the main cover.
Picture (see Figure 5-8) illustrates option – voltage link is accessible via hole in the main cover.
When a voltage link is disconnected (slider shifted to the left side), it means that a voltage circuit
is separated from a current circuit, while connected (slider shifted to the right) it means that it is
closed.
Remark: sliding voltage link is absent, when shunt is used as current sensor in phase circuit, and
meter current and voltage circuits are connected permanently.
Figure 5-8 Sliding voltage link (connected)
6 Communication
The meter supports two-way communication via various interfaces: data reading at the request, as
well as transfer of various commands to the meter (e.g. billing period reset) or from the meter (e.g.
alarms).
6.1 Optical communication interface
Optical communication interface meets the requirements of the standards IEC 62056-21,
DLMS/COSEM and is used to download data locally into PC or hand held terminal by means of
optical head. Interface is also used for parameterization of a meter. Data transmission speed
3009600 Baud. G1B meters maintain the interface blocking function, which prevents
unauthorized data reading and parameter changes. Read more about this function in chapter
13.2.6.
6.2 Electrical interface
G1B meters may have primary electrical communication interface - 20mA current loop, RS485 or
M-Bus (either wired, or wireless). Communication protocols for these electrical interfaces are listed
in Table 3-2. Maximum data rate is 19200 Baud. Simultaneous data transmission via optical and
electrical interfaces is possible.
23

6.3 Controller MCL 5.XX with internal GSM/GPRS modem
GAMA 100 meters may be equipped with a controller MCL 5.XX with electrical interface (CL or
RS485). Controller is manufactured by “ELGAMA SISTEMOS” Ltd. and is used in AMI (Advanced
Metering Infrastructure) systems for remote automated data reading, parameterization and
firmware update of electricity meters.
GSM radio network with CSD/GPRS/EGDE/3G technology and TRANSPARENT DATA TCP/IP
protocols is used for data transmission to dispatcher offices. Controller supports two-direction data
exchange (data reading, parameterization and firmware update) with communication protocols IEC
62056-21 or DLMS/COSEM. Controller can be assembled with internal antenna (located under
terminal cover) as well as with external one (with an extended cable).
Controller can be mounted in terminal covers of electricity meters manufactured by “ElgamaElektronika” Ltd. (see Figure A-0-2) as well as fixed to DIN rail separately. For more information
please refer to modem’s instruction.
Meter is equipped with RJ12 connector for easy controller connection. Controller (depends on his
construction) can be powered from RJ12 connector or can be powered from mains, therefore
power supply terminals of controller have to be connected to voltage terminals (terminals 2 and 5)
of electricity meter (see Figure 6-1 and Figure 6-2).
Controller can be mounted under the transparent terminal cover, therefore LED indicators of
controller (LEDs “Signal strength” and “Operation”) are visible to user (see Figure 6-3).
Controller supports Plug&Play functionality. It enables automatic registering on network, therefore
additional configuration of communication device is not needed during the installation process.
Furthermore, meter can send alarm messages in case of special events (e.g. tampering). For more
information about Plug&Play functionality see section 6.7.
Figure 6-1. Controller without internal 220V power supply is
powered from RJ12 connector
Figure 6-2. Connection of external modem with internal 220V
power supply
24

Figure 6-3. Controllers under the transparent terminal cover
6.4 PLC modem
GAMA 100 meters may be equipped with a Power Line Communication (PLC) modem. PLC
modem is supplied in the following options:
• As an external modem, connected via electrical interface (CL or RS485). Modem can be
mounted in terminal cover of electricity meter manufactured by “Elgama-Elektronika” Ltd.
(see Figure A-0-2), as well as fixed to DIN rail separately.
• As an internal modem, installed under the main cover of meter (see section 4.9 and section
6.4.1).
Modem is manufactured by “ELGAMA-Elektronika” Ltd. and is used in metering systems for
automated remote data reading, parameterization, as well as firmware update of electricity meters
by means of DLMS COSEM protocol. Open specification (Specification for PowerLine Intelligent
Metering Evolution, version 1.3.6), defined by Power Line Intelligent Metering Evolution (PRIME),
is used for PLC communication. PLC modem employs OFDM (Orthogonal Frequency-Division
Multiplexing) modulation technology for data transmission over low voltage power lines. Please
refer to official web site of the PRIME Alliance (http://www.prime-alliance.org/) for further
information.
Modem is based on chipset (processor C2000 and analog front end AFE031) reference design
and software (Prime PLC service node), provided by Texas Instruments. Texas Instruments Prime
PLC solution is certified for PRIME Compliance.
PLC modem operates in CENELEC A-band (3 – 95 kHz), which is exclusively devoted for energy
suppliers. PLC signal strength complies with standard EN 50065-1 emission requirements.
Raw data rate depends on available transmission conditions on the network, and it is automatically
selected in the range 2164 Kbps, as described in Prime specification.
Prime PLC solution supports tree topology structure of communication network. Data Concentrator
(Base Node) is at the root of the tree and acts as master node that provides connectivity to the
network. Any other node (electricity meter) of the network is a Service Node. Service Nodes are
either leafs of the tree or branch points of the tree. These nodes (electricity meters) carry out two
responsibilities: connecting themselves to the network and retransmitting the data of their
neighbours (more remote meters) in order to propagate connectivity.
25

Since complying with Prime PLC specification, electricity meter G1B with PLC modem can
communicate to any Data Concentrator, supporting Prime PLC. Manufacturer recommends Data
Concentrator DMDC, produced by Elgama Sistemos Ltd.
Prime PLC modems support Plug&Play functionality. It enables automatic registering on network,
therefore additional configuration of communication devices is not needed during the installation
process. Furthermore, meter can send alarm messages in case of special events (e.g. tampering).
For more information about Plug&Play functionality see section 6.7.
6.4.1 Internal PLC modem
GAMA 100 meters may be equipped with internal PLC modem, installed under the main cover of
meter. This feature is available in modification, marked by code “H2” or “H3” (see section 4.9).
Internal PLC modem support functionality, described in section 6.4. Maximum self-consumption of
PLC modem is presented in Table 6-1. Internal PLC modem can be disabled (switched-off) by
special configuration command. This is usually carried out, when meter is connected to AMI
system by means of another modem (e.g. GSM/GPRS modem).
Table 6-1. Maximum self-consumption of internal PLC modem
Maximum self-consumption: Value Remark
in standby mode 0.6 W
during transmission 10 W @1Ω network impedance
Status of internal PLC modem can be monitored on the LCD display of meter. Object “PLC status”
(OBIS = C.62.5) should be included in the display sequence, during parameterization of meter.
PLC status can be in one of the following states:
• “PLC ---“ – meter is not connected to PLC network (see Figure 6-4);
• “PLC On” – meter is connected to PLC network (see Figure 6-5);
• “PLC Off” – internal PLC modem is switched off (see Figure 6-6).
Figure 6-4. PLC status “PLC ---“
Figure 6-5. PLC status “PLC On
Figure 6-6. PLC status “PLC Off”
6.5 Wired M-Bus module
GAMA 100 meters may be equipped with wired M-Bus Master interface for automated remote data
reading from gas and water meters. M-Bus interface is implemented according to EN-137757-2
and EN13757-3 standards. Hourly consumption data of water and gas meters is stored in M-Bus
load profile (see chapter 8.4).
26

6.6 Wireless M-Bus interface
G1B meters may be equipped with wireless M-Bus interface for automated remote data reading
from gas and water meters, as well as for billing data transmission to In-Home-Displays. Wireless
M-Bus interface is implemented according to EN-137757-2 and EN13757-4 standards. Wireless
M-Bus interface is available in two frequency range options: 169 MHz and 868 MHz. The same
hardware platform – SPIRIT1 transceiver from STMicroelectronics – is used for both frequency
ranges.
6.7 Plug & Play
G1B meters have Plug&Play software functionality which helps to speedup installation process, as
well, indicates whenever meter was logged out (power failure, communication disorders). This
software feature is implemented in following way: after start-up of the meter, it starts sending alarm
message over electrical interface (after some random delay from start-up). An external modem
(GSM, PLC) has to be connected and corresponding communication network must be functional in
order for Plug&Play could be implemented. External modem has to be configured with server
(base station) connection settings, so that alarm message could reach dedicated destination.
Corresponding alarm message is UI frame that contains serial number to identify the caller and
login new meter into the billing system. Alarm message is send every hour, until the first request
from billing system is received. Meter changes its status to offline when there is no request from
billing system for more than 24 hours, or after every start-up.
Plug&Play function over PLC is ensured by means of PLC communication provider and data
concentrator (DMDC). New meters in PLC network are registered in DMDC, whenever there is
stable PLC communication and event is passed to MDMS system. This rapid process allows
detecting new meters in short time and allows verifying correctness of installation easily.
6.8 Outputs/Inputs
6.8.1 Optical test output (red LED)
Meters contain optical test output - red LED, which produce light impulses for meter calibration
with frequency proportional to measured energy. Only the manufacturer is permitted to program
meter’s constant (imp/kWh) and pulse duration (30 ms).
6.8.2 S0 outputs
Meters have S0 output for transmission of information about measured energy. Output is
galvanically isolated by optocouple. Constant of pulses is programmed in the interval from 50 to
150000 imp/kWh (imp/kvarh). Maximum commutation voltage is 24 V, maximum commutation
current is 100 mA.
6.8.3 Relay output
G1B meters may have up to two relay outputs (first output is programmable, second can be
controlled only by external command). Relay output can switch direct and alternating 120 mA
current and voltage up to 250 V.
Relay operation may be programmed in three modes (only first relay output):
• normally disconnected contacts are connected when specified energy tariff is valid;
• normally disconnected contacts are connected during two programmed intervals per day
(interval start and end time is set in 15 minute steps);
• normally disconnected contacts are connected when average power of integration period
exceeds contractual power limit.
27

6.9 Power supply
Pulse mode power supply is mounted in GAMA 100 meters. It guarantees stable functioning of
meter when supply voltage ranges from -20 ... +15% of nominal voltage.
In case of power outages, micro-controller switches into energy saving mode, where Li-ion battery
or supercapacitor supplies only internal clock. Li-ion battery may supply energy for not less than 10
years without main power supply.
When main power supply is in operation, energy of Li-ion battery is not consumed and/or
supercapacitor is charged.
6.9.1 Power supply for external modem
An isolated internal d.c. supply to power the modem is provided via the RJ12 socket.
sufficient to support a GSM/GPRS/3G modem with nominal voltage +5V and mean load
≤500mA.
If a modem is installed which draws too much power from the meter, the modem power supply
is limited/disabled to prevent resetting of the meter.
fault condition is removed.
For more information about modems read chapter 6.3.
Power supply recovers automatically after
The power is
6.10 Push buttons
User interface of the meter contains two push buttons: sealed push-button and scroll pushbutton and can have optical scroll key, which interprets pulses of light beam as LCD control
commands. Position of push-buttons depends on modification of meter cover, transparent or nontransparent meters cover is used (see Figure 5-1 and Figure 5-2).
Meter with transparent cover have two additional push-buttons, sealed push-button which located
under changeable battery cover on the right side, and scroll push-button which located on the left
side.
Non-transparent meter cover possess sealable multifunctional (two-position) push-button on the
left side of main cover (see Figure 6-7).
Scroll push-button (position A). In this position,
button can be pressed without removing seal.
Sealed push-button (position B). In this position,
button can be pressed only after removing the seal.
There is possibility to seal button in position A so,
that switching to position B without removing of seal
is impossible.
Figure 6-7 Multifunctional (two-position) push-button
6.10.1 Scroll push button and optical scroll key
Scroll push button and optical scroll key are designed for data scrolling. The control is carried out
on the basis of three commands:
• Short signal (scroll push-button is pressed for <2 seconds);
• Long signal (scroll push-button is pressed for duration between 2 and 5 seconds);
• Very long signal (scroll push-button is pressed for >5 seconds)
Read chapter 11 to find out more about data scrolling.
Optical scroll key is designated for the same function as scroll push button. It reacts on short and
long light signals. By means of optical scroll key, data can be scrolled on LCD without having
mechanical contact to meter.
28

6.10.2 Sealed push-button
Sealed push-button is designed for several functions:
• Communication unblock – meter blocks optical interface for parameterization (see chapter
13.2.6);
• Billing period reset- reset signal triggers the storage of the billing data to the appropriate
area of non-volatile memory and new billing period starts (chapter 8.1);
Customer may choose between some of these functions (communication unblock and billing
period reset) during ordering process. For more information about sealed button functions read
chapter 4.3.
7 Data registers
7.1 Energy registers
G1B meter may measure active and reactive electrical energy. All measured values are stored in
appropriate registers since the beginning of operation of meter:
Table 7-1. Energy registers.
Total energy Billing period energy
1.8.T +A 1.9.T +A
2.8.T -A 2.9.T -A
15.8.T |A| 15.9.T |A|
3.8.T +R 3.9.T +R
4.8.T -R 4.9.T -R
5.8.T R1 5.9.T R1
6.8.T R2 6.9.T R2
7.8.T R3 7.9.T R3
8.8.T R4 8.9.T R4
In normal operation mode, the energy values are displayed in kWh (in kvarh for reactive energy)
with 1 digit after the decimal point, while in test mode three digits after the decimal point are
displayed (see Figure 7-1).
The testing mode is required for the correct meter dosage inspection within the shortest possible
time. It can be activated in the following ways:
• By control buttons;
• By a command via communication interface.
In the test mode the energy registers’ values are indicated with maximum number of decimal
figures.
The test mode can be deactivated in the following ways:
• Automatically (after 72 hours or in case of voltage disconnection).
• By a command via communication interface.
Energy tariff number T=[06], “0” – the
sum of all tariffs
Figure 7-1 Example of energy register display (normal mode)
29

Figure 7-2 Example of energy register display (test mode)
7.2 Demand registers
G1B meter calculates average power over integration period and stores it in appropriate
registers:
Table 7-2 Demand registers
Demand of current integration period Demand of last integration period
1.4.0 +P 1.5.0 +P
2.4.0 -P 2.5.0 -P
15.4.0 |P| 15.5.0 |P|
3.4.0 +Q 3.5.0 +Q
4.4.0 -Q 4.5.0 -Q
5.4.0 Q1 5.5.0 Q1
6.4.0 Q2 6.5.0 Q2
7.4.0 Q3 7.5.0 Q3
8.4.0 Q4 8.5.0 Q4
Demand values are displayed in kW (in kvar for reactive demand) with three digits after the
decimal point (see Figure 7-4). Furthermore, demand value of current integration period is
displayed together with minutes elapsed of the current integration period (see Figure 7-3).
Minutes elapsed from
the beginning of current
integration period
Demand value with
three digits after the
decimal point
Figure 7-3. Display of demand of current integration period
Demand value with
three digits after the
Figure 7-4 Display of demand of last integration period
30

1 2 3
7.3 Maximum demand registers
G1B meter detects and stores the values of maximum demand over a billing period in a
separate register. Meter can register cumulative maximum demands as well. Maximum
demand values of each tariff time zone are stored in maximum demand register with their
respective timestamps:
Table 7-3 Maximum demand and cumulative maximum demand registers
1.2.M +P [kW] cumulative maximum demand in tariff M
1.6.M +P [kW] maximum demand in tariff M
2.2.M -P [kW] cumulative maximum demand in tariff M
2.6.M -P [kW] maximum demand in tariff M
15.2.M |P| [kW] cumulative maximum demand in tariff M
15.6.M |P| [kW] maximum demand in tariff M
3.2.M +Q [kvar] cumulative maximum demand in tariff M
3.6.M +Q [kvar] maximum demand in tariff M
4.2.M -Q [kvar] cumulative maximum demand in tariff M
4.6.M -Q [kvar] maximum demand in tariff M
5.6.M Q1 [kvar] maximum demand in tariff M
6.6.M Q2 [kvar] maximum demand in tariff M
7.6.M Q3 [kvar] maximum demand in tariff M
8.6.M Q4 [kvar] maximum demand in tariff M
Demand tariff number M=[06], “0” - max. demand off all the tariff zones.
Maximum demand is displayed automatically in three steps (see
Figure 7-5): [1] maximum demand value; [2] date of maximum demand [YY-MM-DD]; [3] time
of maximum demand [hh:mm].
Figure 7-5 Maximum demand scrolling cycle
8 Data profiles
Meter contains the following data profiles:
• Billing profile;
• Load profile;
• Second load profile (network profile);
• Wired M-bus load profile;
• Event log.
Each data profile is organized as a FIFO (First-In-First-Out) buffer in non-volatile memory.
When the buffer is full the oldest entry is overwritten by the most resent entry.
8.1 Billing profile
Billing profile stores values of all energy registers and values of all maximum demand
registers. Values are written to billing profile at each billing period reset. Billing period reset is
done:
• automatically (periodically at predefined date and time),
• manually (by pressing sealed push-button, when LCD operates in main automatic data
scroll cycle),
• remotely (via communication interface).
Automatically it may be reset at parametrized periods (up to 6 different periods). Possible
cases for every one of these 6 periods:
• disabled;
31

• on certain date (year [YYYY], month [MM], day [DD] and time [hh:mm] must be
specified);
• on certain day in a year (month [MM], day [DD] and time [hh:mm] must be specified);
• on certain day every month (day [DD] and time [hh:mm] must be specified);
• on certain day every week (weekday [WD] and time [hh:mm] must be specified);
• on daylight saving changes (start or end of daylight saving must be chosen);
• on every day (time [hh:mm] must be specified).
Table 8-1 Billing period reset examples
Case
Period No.
1
2
3
4 5 6 -
Every decade:
A case „on certain day
every month (day [DD] and
time [hh:mm] must be
specified)“ is chosen
YYYY-MM-01 00:00, YYYY-01-01 01:00 Friday 00:00 Every day 00:00
YYYY-MM-11 00:00, YYYY-03-01 01:00 Sunday 00:00 Every day 03:00
YYYY-MM-21 00:00. YYYY-05-01 01:00 - Every day 09:00
5 times in year, on
certain dates
A case „on certain day in a
year (month [MM], day [DD]
and time [hh:mm] must be
specified)“ is chosen
YYYY-07-01 01:00 - Every day 12:00
YYYY-09-01 01:00 - Every day 18:00
- - Every day 23:00
2 times in week,
every week
A case „on certain day
every week (weekday
[WD] and time [hh:mm]
must be specified)“ is
chosen
Every day at different
times
A case „• on every day
(time [hh:mm] must be
specified)“ is chosen
Energy and maximum demand values of up to 16 last billing periods are stored in billing
profile. Up to 16 newest values (depends on parameterization) may be reviewed in meter’s
LCD. All data stored in billing profile may be downloaded to computer via communication
interfaces. Values of billing profile are identified by OBIS code in meter LCD:
Table 8-2 Billing profile data list
F.F Fatal error
0.0.0 Serial number Billing period energy
0.0.1 User ID 1.9.T*VV +A
0.0.2 Location ID 2.9.T*VV -A
C.1.0 Serial number 15.9.T*VV |A|
0.9.1 Time 3.9.T*VV +R
0.9.2 Date 4.9.T*VV -R
Maximum demand 5.9.T*VV R1
1.2.M*VV +P 6.9.T*VV R2
1.6.M*VV +P 7.9.T*VV R3
2.2.M*VV -P 8.9.T*VV R4
2.6.M*VV -P 0.1.0 Billing period counter
15.2.M*VV |P| 0.1.1 Number of available billing periods
15.6.M*VV |P| 0.1.2*VV Time stamp of the billing period
3.2.M*VV +Q
3.6.M*VV +Q
4.2.M*VV -Q
4.6.M*VV -Q
5.6.M Q1
6.6.M Q2
7.6.M Q3
8.6.M Q4
Total energy
1.8.T*VV +A
2.8.T*VV -A
15.8.T*VV |A|
3.8.T*VV +R
4.8.T*VV -R
5.8.T*VV R1
6.8.T*VV R2
7.8.T*VV R3
8.8.T*VV R4
• Demand tariff number M=[06], “0” - max. demand off all
the tariff zones
• Energy tariff number T=[06], where “0” denotes the sum of
all tariffs
• “VV” – is value billing period counter, it may obtain value
from 00 to 99. Every time billing period is reset, certain
energy and maximum demand values are stored in billing
profile and the billing period counter is incremented by one.
When “VV” reaches the highest value, the numbering starts
over again from “00”. However only energy and maximum
demand values of 16 last billing periods may be stored in
billing profile, so only 16 “VV” of certain data will be visible in
billing profile data list.
↓↓↓
32

8.2 Load profile
Load profile stores values of different registers at regular intervals. G1B meter may store up to 16
channels (up to 16 different data values) in load profile. Any demand (e.g. 1.5.0), total energy (e.g.
1.8.0) or average value per integration period may be assigned to any of 16 load profile channels.
Values of chosen registers are saved to load profile at regular intervals of time (integration period).
Load profile data can be readout via all available communication interfaces. Registers that may be
assigned to load profile channels are listed below:
Table 8-3 Load profile data list
Demand of last integration period Billing period energy
1.5.0 +P 1.9.T*VV +A
2.5.0 -P 2.9.T*VV -A
15.4.0 |P| 15.9.T*VV |A|
3.4.0 +Q 3.9.T*VV +R
4.4.0 -Q 4.9.T*VV -R
5.4.0 Q1 5.9.T*VV R1
6.4.0 Q2 6.9.T*VV R2
7.4.0 Q3 7.9.T*VV R3
8.4.0 Q4 8.9.T*VV R4
Total energy (All tariffs) Average values per integration period
1.8.0 +A 12.5.0 Instantaneous RMS voltage (V)
2.8.0 -A 11.5.0 Instantaneous RMS current (A) in phase
15.8.0 |A| 91.5.0 Instantaneous RMS current (A) in neutral
3.8.0 +R 15.5.0 Active power ±P (kW)
4.8.0 -R 3.5.0 Reactive power +Q (kvar)
5.8.0 R1 4.5.0 Reactive power –Q (kvar)
6.8.0 R2 13.5.0
7.8.0 R3 14.5.0 Frequency (Hz)
8.8.0 R4
Storage interval (in days) of load profile depends on integration period chosen.
Integration period may obtain values of 1, 2, 3, 4, 5, 6, 10, 12, 15, 20, 30 and 60 minutes.
Storage interval is calculated by means of formula:
M
l ×
=
10
sc
+×
l - Storage interval (in days)
M - Memory capacity (in bytes), dedicated for load profile;
c - Number of channels [116]
s - Entry size
• 4 bytes for x.5.0 demand registers
• 6 bytes for x.8.0 energy registers
• 2 bytes for instantaneous value registers
p – Integration period (1, 2, 3, 4, 5, 6, 10, 12, 15, 20, 30 and 60 minutes)
Example #1, if load profile is parameterized to store 1 energy value (i.e. 1 channel of 6 bytes)
every 15 minutes, the storage interval would be:
231000
+×
1
−
1440
1061
Example #2, if load profile is parameterized to store 2 energy values [+A, -A] (i.e. 2 channels of 6
bytes) every 30 minutes, the storage interval would be:
231000
+×
1
−
1440
1062
Power factor cos ϕ
p
1
−
1440
15
=×
30
=×
days150
days218
33

NOTE: energy registers (see section
7.1
) as well as demand and energy values in load profile and billing
NOTE:
On special reques
t, the capacity of non
-
volatile memory can be reassigned in different proportions for
profile are stored with the same resolution, therefore monthly billing data is always equal to sum of load
profile data.
load profile, billing profile and event logs.
8.3 Second load profile
On special request, G1B meters may have second load profile (Network profile) with independent
integration period [160] minutes, where the following network values can be captured in
additional channels. Network profile (OBIS 99.2.0) stores 5 quantities presented in Table 8-4.
Table 8-4 Second load profile data
Average values
11.5.0 Average current [A]
12.5.0 Average voltage [V]
71.5.124 Average current THD
72.5.124 Average voltage THD
14.5.0 Average frequency [Hz]
Storage interval (in days) of second load profile (network profile) depends on integration period
chosen. Integration period may obtain values of 1, 2, 3, 4, 5, 6, 10, 12, 15, 20, 30 and 60 minutes.
Second load profile data can be readout via all available communication interfaces. Second load
profiles possess storage for 15 days in case of 10 minutes integration period.
8.4 Wired M-Bus load profile
The wired M-Bus interface is employed to collect data from up-to four multi-utility (water, gas)
meters. Electricity meter reads multi-utility (water, gas) billing data at certain intervals and store in
M-Bus load profile. Along with consumption data, other details are stored, such as meter serial
number and manufacturer's information. G3B meter may store up to 168 hourly values (up to 1
week) of each of four multi-utility meters in load profile.
8.5 Event log
Meter contains separate event logs (i.e. independent FIFO buffers) to store information about
various events. Event log data can be readout via all available communication interfaces.
• Electricity network events:
o Power failure (outage) log (OBIS = P.97.0);
o Voltage swell (over-voltage) log (OBIS = P.98.12);
o Voltage sag (under-voltage) log (OBIS = P.98.13);
o Internal main relay event log (OBIS = P.98.14).
• Load events:
o Power over-limit log (OBIS = P.98.20);
o Reverse current flow log (OBIS = P.98.21);
o Over-current log (OBIS = P.98.22);
o Neutral current imbalance log (OBIS = P.98.23);
• Tampering events:
o Magnetic field influence log (OBIS = P.98.30);
o Case opened (opening of meter cover) log (OBIS = P.98.31);
o Mains cover opened (opening of terminal cover) log (OBIS = P.98.32);
• Communication interface events:
o Clock change (setting) log (OBIS = P.98.40);
o Parameterization (parameter change) log (OBIS = P.98.41);
o Security failure (failed authentication) log (OBIS = P.98.43);
34

• Internal meter state events:
o Meter error (internal error) log (OBIS = P.98.50);
o Tariff events log (OBIS = P.98.51);
o Load profiles reset log(OBIS = P.98.52);
o Firmware update log (OBIS = P.98.60);
8.5.1 Power failure (outage) event log
Power outage event log registers power outages. Each power outage creates two entries in the
event log: the first entry marks begin of power outage, the second one notifies the end of power
outage.
Power outage event log stores 60 entries, i.e. date and time of last 30 power outages.
Furthermore, a dedicated counter (OBIS = C.7.5) counts the total number of occurrences
[0.9999] of power outages, as well as a dedicated timer (OBIS = C.61.10).measures the total
duration [099,999,999 s] of all power outage events.
Every entry of the log book is expressed as a string (example for IEC 62056-21):
P.97.0*##(ST)(Timestamp), where ## - event number, ST-status bits:
0001 – power outage,
0000 – power start-up.
8.5.2 Voltage swell (over-voltage) event log
Over voltage event log registers over-voltage events. Meter measures effective (RMS) voltage (U)
data. If average voltage value of 10 minutes are over defined range (for example: +10% from
230V) then average values of U are saved with time and date stamp. Algorithm is explained in
chapter 9.3. Event log “Over-voltage” stores up to 60 entries. Each entry contains time stamp and
status, indicating level (above or below limit) of voltage. Furthermore, a dedicated counter (OBIS =
C.60.12) counts the number of occurrences [0.9999] of “over-voltage” events, as well as a
dedicated timer (OBIS = C.61.12) measures the total duration [099,999,999 s] of all “overvoltage” events.
Every entry of the log book is expressed as a string (example for IEC 62056-21):
P.98.12*##(ST)(Timestamp), where ## - event number, ST-status bits:
0C01 – over-voltage event,
0C00 – end of over-voltage event.
8.5.3 Voltage sag (under-voltage) event log
Under-voltage event log registers under-voltage events. Meter measures effective (RMS) voltage
(U). If average voltage value of 10 minutes are under defined range (for example: -10% from
230V) then average values of U are saved with time and date stamp. Algorithm is explained in
chapter 9.4. Event log “Under-voltage”, stores up to 60 entries. Each entry contains time stamp
and status, indicating level (below or above limit) of voltage. Furthermore, a dedicated counter
(OBIS = C.60.13) counts the number of occurrences [0.9999] of “under-voltage” events, as well
as a dedicated timer (OBIS = C.61.13) measures the total duration [099,999,999 s] of all “undervoltage” events.
Every entry of the log book is expressed as a string (example for IEC 62056-21):
P.98.13*##(ST)(Timestamp), where ## - event number, ST-status bits:
0D01 – under-voltage event,
0D00 – end of under-voltage event.
8.5.4 Event log of internal mains relay
Internal relay state event log registers changes of relay states by making corresponding entries
with the cause of event (status byte) and a timestamp of an event. An entry to Internal relay state
event log is made when internal state of relay state is changed (from “connected” to
“disconnected” and etc.).
35

P.98.14*##(ST)(Timestamp)(Active Energy), where ## - number, ST-status bits:
0E00 – consumer reconnected manually (by pressing Menu button);
0E10 – consumer reconnected by control command over communication interfaces;
0E11 – consumer disconnected by control command over communication interfaces;
0E12 – ready for reconnection by control command over communication interfaces;
0E21 – consumer disconnected because of exceed of contractual power event;
0E22 – ready or reconnection because of end of integration period;
0E31 – consumer disconnected because of over-voltage event;
0E32 – ready for reconnection because of end of over-voltage event;
0E41 – consumer disconnected because of under-voltage event;
0E42 – ready for reconnection because of end of under-voltage event;
0E61 – consumer disconnected because of over-current event;
0E62 – ready for reconnection because of end of over-current event;
0E71 - consumer disconnected by control command over communication interfaces with
defined disconnection time;
0E72 - ready for reconnection by control command over communication interfaces with
defined allowing for reconnection time.
8.5.5 Power over-limit event log
Power over-limit event log registers power over-limit events. Algorithm is explained in chapter 9.1.
Event log “Power over-limit” stores up to 60 entries, i.e. up to 30 power over-limit events (start +
end). Furthermore, a dedicated counter (OBIS = C.60.20) counts the number of occurrences
[0.9999] of “Power over-limit” events, as well as a dedicated timer (OBIS = C.61.20) measures
the total duration [099,999,999 s] of all “Power over-limit” events.
Every entry of the log book is expressed as a string (example for IEC 62056-21):
P.98.20*##(ST)(Timestamp), where ## - event number, ST-status bits:
1401 – contractual power over-limit start,
1400 – contractual power over-limit end.
8.5.6 Reverse current flow event log
Reverse current flow event log registers negative flow direction of current in phase. Event log
“Reverse current flow” stores up to 60 entries, i.e. up to 30 reverse current flow events (start +
end). Furthermore, a dedicated counter (OBIS = C.60.21) counts the number of occurrences
[0.9999] of “Reverse current flow” events, as well as a dedicated timer (OBIS = C.61.21)
measures the total duration [099,999,999 s] of all “Reverse current flow” events.
Every entry of the log book is expressed as a string (example for IEC 62056-21):
P.98.21*##(ST)(Timestamp), where ## - event number, ST-status bits:
1501 – reverse current flow start,
1500 – reverse current flow end.
8.5.7 Over-current event log
Over-current event log registers over-current events in phase, as well as in neutral. Algorithm is
explained in chapter 9.2. Event log “Over-current” stores up to 60 entries, i.e. up to 30 over-current
events (start + end). Each entry contains time stamp and status, indicating level (above or below
limit) of current. Furthermore, a dedicated counter (OBIS = C.60.22) counts the number of
occurrences [0.9999] of “Over-current” events, as well as a dedicated timer (OBIS = C.61.22)
measures the total duration [099,999,999 s] of all “Over-current” events.
Every entry of the log book is expressed as a string (example for IEC 62056-21):
P.98.22*##(ST)(Timestamp), where ## - event number, ST-status bits:
1601 – over-current event,
1600 – end of over-current event.
36

I
n
<
I
ph
I
n
>
I
ph
8.5.8 Neutral current balance event log
Neutral current balance event log registers neutral current imbalance events. Each imbalance
event creates entry in the event log. Entry contains date and time of event, as well as status
indicating type of event. Neutral current balance event log stores 20 entries, i.e. date and time of
last 20 events. Furthermore, a dedicated counter (OBIS = C.60.23) counts the total number of
errors [0.9999].
P.98.23*##(ST)(Timestamp), where ## - number, ST-status bits:
1710 – neutral current is lower than phase current
1720 – neutral current is higher than phase current
,
.
8.5.9 Magnetic field influence event log
Influence of magnetic (see Table 3-2) field event log registers tampering attempts to influence
metering results by external magnetic field. Although meter is immune to external DC magnetic
fields of 400 mT, it registers >5mT tampering attempts by means of Hall effect sensor. Event log
stores up to 60 entries, i.e. up to 30 magnetic field events (start + end). Furthermore, a dedicated
counter (OBIS = C.60.30) counts the number of occurrences [0.9999] of “Magnetic field” events,
as well as a dedicated timer (OBIS = C.61.30) measures the total duration [099,999,999 s] of all
“Magnetic field” events.
Every entry of the log book is expressed as a string (example for IEC 62056-21):
P.98.30*##(ST)(Timestamp), where ## - event number, ST-status bits:
1E01 – influence of magnetic field start;
1E00 – influence of magnetic field end.
8.5.10 Opening of meter cover event log
Opening of meter cover event log registers tampering attempts to open main meter cover. Event
log stores up to 60 entries, i.e. up to 30 meter cover opening events (open + close). Furthermore,
a dedicated counter (OBIS = C.60.31) counts the number of occurrences [0.9999] of “Meter
cover opening” events, as well as a dedicated timer (OBIS = C.61.31) measures the total duration
[099,999,999 s] of all “Meter cover opening” events.
Every entry of the log book is expressed as a string (example for IEC 62056-21):
P.98.31*##(ST)(Timestamp), where ## - event number, ST-status bits:
1F01 – opening of meter cover event start;
1F00 – opening of meter cover event end.
8.5.11 Opening of terminal cover event log
Opening of terminal cover event log registers tampering attempts to open terminal cover of the
meter. Event log stores up to 60 entries, i.e. up to 30 terminal cover opening events (open +
close). Furthermore, a dedicated counter (OBIS = C.60.32) counts the number of occurrences
[0.9999] of “Terminal cover opening” events, as well as a dedicated timer (OBIS = C.61.32)
measures the total duration [099,999,999 s] of all “Terminal cover opening” events.
Every entry of the log book is expressed as a string (example for IEC 62056-21):
P.98.32*##(ST)(Timestamp), where ## - event number, ST-status bits:
2001 – Opening of terminal cover event start;
2000 – Opening of terminal cover event end;
2081 – Opening of terminal cover event start (opened in fraud suspended mode);
2080 – Opening of terminal cover event end (opened in fraud suspended mode).
8.5.12 Clock change (setting) event log
Clock setting event log stores entries in case date and/or time of real time clock was changed, It
happens regardless date and/or time was changed via communication interface or manually via
37

user interface by means of push buttons. Each change of date and/or time invokes two entries in
event log: the first one contains old time stamp, another contains new time stamp.
Clock setting event log stores 60 entries, i.e. date and time of last 30 clock changes. Furthermore,
a dedicated counter (OBIS = C.60.40) counts the total number of occurrences [0.9999] of clock
setting events.
Every entry of the log book is expressed as a string (example for IEC 62056-21):
P.98.40*##(ST)(Timestamp), where, ## - event number, ST-status bits:
2801 – Clock setting start/from (old timestamp);
2800 – Clock setting end/to (new timestamp);
2802 – Summer time activation;
2804 – Summer time deactivation;
2840 – Battery charged;
2880 – Battery empty.
8.5.13 Parameterisation (Parameter change) event log
Parameter change event log registers parametrization events. Each successful parametrization
session creates entry in the event log. Entry contains date and time of event, as well as status
indicating which group of parameters was modified. Parameter change event log stores 60 entries,
i.e. date and time of last 30 parametrization events. Furthermore, a dedicated counter (OBIS =
C.2.0) counts the total number of occurrences [0.9999] of parametrization sessions.
Every entry of the log book is expressed as a string (example for IEC 62056-21):
P.98.41*##(ST)(Timestamp), where ## - event number, ST-status HEX code:
00000001 – changing metrology relevant parameters: setting auto billing end changed, load profile
content changed, power limit changed, 0.8.4 changed, 0.8.5 changed, overvoltage, under-voltage, overcurrent thresholds, billing denied timeout changed, S0 pulse length changed, LED/S0 impulse constant
changed;
00000002 – change baud-rate, password, communication timeout;
00000004 – end billing period, begin test mode, end test mode, change external relays state;
00000008 – change identification number 0.0.#, C.1.1, C.1.2;
00000010 – change lists content (LCD scroll, standard, battery; IEC1107 user readout tab);
00000020 – change tariff identification 0.2.2, C.55.2; change tariff seasons, profiles, special days;
00000040 – set date or time;
00008000 – clear load profile because of new 0.8.4 or new load profile content;
40000000 – firmware update;
80000000 – GamaLink license ID received.
Any legal and successfully installed user software generates a unique 8-symbol HEX [0...9, A...F]
registration code. The registration code is assigned to the concrete version of the user software
and the concrete computer hardware. The registration code can be viewed using user software, it
is transferred to the meter at the beginning of each parameterization session. If the registration
code is not transferred, the meter will not accept the parameters, even if the password is correct.
Only the registration code of the last parameterization is stored. It can be read via communication
interfaces (OBIS = 96.70.1). Registration code can also be displayed on the meter LCD.
8.5.14 Security failure (failed authentication) log
Event log registers meter authentication attempts to the network. Each unsuccessful attempt
creates entry in the event log. Entry contains date and time of event. Event log stores 60 entries,
i.e. date and time of last 60 attempts.
P.98.43*##(ST)(Time stamp), where ## - number, ST-status bits:
2B11 Failed authentication of Collector client (optical interface);
2B12 Failed authentication of Management client (optical interface);
2B14 Failed authentication of FW update client (optical interface);
2B21 Failed authentication of Collector client (electrical interface);
38

2B22 Failed authentication of Management client (electrical interface);
2B24 Failed authentication of FW update client (electrical interface).
8.5.15 Meter (internal) error event log
Internal error event log registers internal errors of meter. Each error creates entry in the event log.
Entry contains date and time of event, as well as status indicating type of error. Internal error event
log stores 60 entries, i.e. date and time of last 30 errors. Furthermore, a dedicated counter (OBIS
= C.60.50) counts the total number of errors [0.9999].
P.98.50*##(ST)(Timestamp), where ## - number, ST-status bits:
3201 – internal error event start;
3200 – internal error event end.
8.5.16 Tariffs event log
Tariffs event log registers tariff table changing of meter. Each tariff table changing creates entry in
the event log. Entry contains date and time of event, as well as status indicating type of changing.
Event log stores 60 entries, i.e. date and time of last 60 changes. Furthermore, a dedicated
counter (OBIS = C.60.51) counts the total number of changes [0.9999].
P.98.51*##(ST)(Timestamp), where ## - number, ST-status bits:
3300 – Tariff table has changed automatically;
3301 – Tariff table was changed by parameterise.
8.5.17 Load profiles reset log
Load profiles reset log registers Load profiles resets of meter. Each reset creates entry in the
event log. Entry contains date and time of event, as well as status indicating type of reset. Load
profiles reset event log stores 60 entries, i.e. date and time of last 60 resets. Furthermore, a
dedicated counter (OBIS = C.60.52) counts the total number of resets [0.9999].
P.98.52*##(ST)(Timestamp), where ## - number, ST-status bits:
3400 – Load profile was cleared;
3401 – Second (RMS) load profile was cleared.
8.5.18 Firmware update event log
Event log registers firmware upgrade attempts. Each attempt (regardless of the success) creates
entry in the event log. Entry contains date and time of event, as well as new and old firmware
version ID. Firmware upgrade event log stores 15 entries, i.e. date and time of last 15 attempts.
P.98.60*##(ST)(Time stamp)(New firmware)(Old firmware), where ## - number, ST-status bits:
3C01 – Successful installation of new firmware.
9 Data monitors
Meter contains the following data monitors:
• Demand monitor;
• Current monitor;
• Over-voltage monitor;
• Under-voltage monitor.
9.1 Demand monitor
Meter monitors active average power Pav of current integration period (register OBIS = 1.4.0) and
registers events, when average power exceeds contractual (OBIS = C.69.1) power limit P
Average power Pav of current integration period is calculated as a ratio of active energy ∆A,
consumed over the current integration period, and duration ∆t of integration period:
39
lim
.

t
∆
P
A
=
av
∆
If at certain moment of current integration period, average power Pav exceeds contractual power
limit (Pav>P
), meter registers “Power over-limit” event (see Figure 9-1). Event lasts until the end
lim
of current integration period. These events (including time stamps of start and end) are recorded in
a separate event log “Power over-limit” (see chapter 8.5.5). Furthermore, a dedicated counter
counts the number of occurrences [0.9999] of “Power over-limit” events, as well as a dedicated
timer measures the total duration [099,999,999 s] of all “Power over-limit” events.
As soon as the first “Power over-limit” event is registered in the current billing period, an
appropriate alarm cursor “A” (see Figure 5-5) is indicated on the meter LCD. Alarm cursor stays
active until the end of billing period, i.e. the alarm cursor is reset by billing period reset.
Signal output (relay output) of the meter can be configured to signal “Power over-limit” events (see
chapter 6.8.3). Relay output connects contacts from the beginning until the end of “Power overlimit” event (i.e. until the end of integration period). Contractual power limit P
is parameterized in
lim
W (Watt) units.
Figure 9-1 Algorithm of demand monitor
9.2 Current monitor
Meter monitors RMS value of current I
I
. RMS value of current I
lim
exceeds current limit (I
rms>Ilim
is measured every second. If at certain moment current value I
rms
), meter registers event “Over-current” (see Figure 9-2). As soon as
the current value drops below limit-hysteresis level (I
indicating end of over-current. Such kind of events is recorded in a dedicated event log “Overcurrent” (see chapter 8.5.7). Each entry contains time stamp and status, indicating level (above or
below limit) of current. Furthermore, a dedicated counter counts the number of occurrences
[0.9999] of “over-current” events, as well as a dedicated timer measures the total duration
[099,999,999 s] of all “over-current” events.
Limit values Ilim and Ilim-hyst can be parameterized independently in Amperes [A] units.
and registers events, when current exceeds current limit
rms
rms<Ilim-hyst
), another event is registered,
40
rms

I
, A
rms
I
, A
lim
I
, A
lim-hyst
t
Timer, s
t
Counter
0
Event log entry
1
t
0001 0000 0000
t
Figure 9-2 Algorithm of current monitor
9.3 Over-voltage monitor
Meter monitors RMS value of voltage U
voltage limit U
voltage value U
. RMS value of voltage U
over
exceeds over-voltage limit (U
rms
(algorithm is similar to over-current, presented in Figure 9-2). As soon as the voltage value drops
below limit-hysteresis level (U
rms<Uover-hyst
voltage. Such kind of events is recorded in a dedicated event log “Over-voltage” (see chapter
8.5.2). Each entry contains time stamp and status, indicating level (above or below limit) of
voltage. Furthermore, a dedicated counter counts the number of occurrences [0.9999] of “overvoltage” events, as well as a dedicated timer measures the total duration [099,999,999 s] of all
“over-voltage” events.
Limit values U
over
and U
over-hyst
can be parameterized independently in V (Volts) units.
and registers events, when voltage exceeds over-
rms
is measured every second. If at certain moment
rms
rms>Uover
), meter registers event “Over-voltage”
), another event is registered, indicating end of over-
9.4 Under-voltage monitor
Meter monitors RMS value of voltage U
voltage limit U
voltage value U
. RMS value of voltage U
under
drops below under-voltage limit (U
rms
voltage” (see Figure 9-3). As soon as the voltage value exceeds limit+hysteresis level
(U
rms>Uunder+hyst
), another event is registered, indicating end of under-voltage. Such kind of events
is recorded in a dedicated event log “under-voltage” (see chapter 8.5.3). Each entry contains time
stamp and status, indicating level (below or above limit) of voltage. Furthermore, a dedicated
counter counts the number of occurrences [0.9999] of “under-voltage” events, as well as a
dedicated timer measures the total duration [099,999,999 s] of all “under-voltage” events.
Limit values U
under
and U
under+hyst
can be parameterized independently in V (Volts) units.
and registers events, when voltage drops below under-
rms
is measured every second. If at certain moment any
rms
rms<Uunder
), meter registers event “under-
41

Day tariff programs
1st
day program
2nd
day program
3rd
day program
Q
nth
day program
Tariff change No.
Time
Tariff
Time
Tariff
Time
Tariff
Time
Tariff
U
, V
rms
U
U
Event log entry
under+hyst
, V
under
Timer, s
Counter
0
, V
t
t
1
t
001 000 000
t
Figure 9-3 Algorithm of under-voltage monitor
10 Tariff program
Tariff program can control up to four energy and four demand tariffs. Meters, with optional LCD,
supports up to six energy and six demand tariffs. There are two types of tariff program: active and
passive. Active tariff program is the one that is active at the current moment and passive tariff
program is the one that will become active at a certain date and time.
Tariff program contains three levels:
• Day tariff program (day profile table);
• Week tariff program (week profile table);
• Tariff seasons (season profile).
Separate day tariff programs, week tariff programs and season profiles may be set for energy
tariffs and/or demand tariffs independently. It can be set or readout via all available communication
interfaces.
Day tariff programs (see Table 10-1) describe times of tariff changes during 24-hour interval. Up to
10 tariff changes may be described in one tariff program. Up to 20 day tariff programs can be
programmed in G1B meter.
Table 10-1 Example of day tariff programs
1 07:00 T2 07:00 T2 07:00 T2 07:00 T1
2 08:00 T1 08:00 T1 08:00 T3 08:00 T2
3 11:00 T2 11:00 T2 11:00 T2 11:00 T3
4 18:00 T1 18:00 T1 18:00 T4 18:00 T4
5 20:00 T2 20:00 T2 23:00 T4 20:00 T2
6 23:00 T1 21:00 T1 - - 23:00 T1
7 - - 22:00 T3 - - - 8 - - 23:00 T6 - - - -
There are some rules to follow describing tariff changes in day tariff programs:
10.1 Day tariff programs
42

1st WP
2nd WP
3rd WP
Q
nth WP
Season number
Season start date
Assigned week tariff program
Special day number
Special day (MM/dd)
Special day number
Special day (yy/MM/dd)
• Time of each tariff change must be later then time of previous tariff change;
• If no tariff changes are described in day tariff program, all the data are assigned to
emergency tariff (refer to chapter 10.5).
10.2 Week tariff program
Week tariff program (see Table 10-2) indicates what day tariff program becomes active on
separate days and special days. Up to 12 week tariff programs can be created in meter G1B.
Table 10-2 introduces an example of week tariff programs (WP).
Table 10-2 Example of week profiles
Day tariff
program
number
Monday Tuesday Wednesday Thursday Friday Saturday Sunday Special days
1 1 1 1 1 1 1 1
2 2 2 2 2 1 1 1
3 3 3 3 3 1 1 1
2 2 2 2 2 2 2 2
10.3 Tariff seasons
Tariff seasons (see Table 10-3) allow activating the specified week tariff program on the specified
date (MM.dd). A year can be divided in up to 12 tariff seasons.
Table 10-3 List of tariff seasons
1 01.01 1
2 02.01 3
3 03.01 2
n 12.01 1
10.4 List of special days
There are two lists of special days in the meter. One list is composed of permanent special days
(the same date each year) and the other list contains leap-special-days (different date each year).
Both lists in total may contain up to 128 special days. Meter LCD displays all special days,
furthermore, they may be reviewed in a computer when meter parameters are read via
communication interface.
When a new day begins, the meter addresses to the special days list and checks whether that day
is in that list. If the day is specified in either special day list, the tariff module activates day profile
for special day.
Table 10-4 Special days list
1 01/01
2
12/25
n* 12/26
Table 10-5 Leap-special-days list
1 09/04/13
2 10/04/05
m* 23/04/10
*the following condition must be followed - (n + m) ≤ 128
43

No. OBIS
Description
10.5 “Emergency” tariff
In case of meter clock failure, data are stored into the “emergency” tariff. Any active tariff (T1T6)
can be programmed as an “emergency” tariff. For example: if there are two tariffs in the meter,
then “emergency” tariff can be programmed to tariff T1 or T2. When meter switches to a
“emergency” tariff a corresponding indicator on LCD starts to blink (see Figure 5-5).
10.6 Tariff timers
In order to control duration, the meter has registered energy in one or another tariff, dedicated
timers (OBIS = C.8.T, where T=[16]) measures the total duration [099,999,999 s] of each tariff.
Furthermore there is a dedicated timer (OBIS = C.8.0), which measures the overall operation time
[099,999,999 s] of meter.
11 Data reading
G1B meter data may be reviewed in LCD. There are four types of display sequences: reserved
automatic (RA), main automatic (MA), main manual (MM) and service manual (SM).
Table 11-1 Data that can be reviewed on LCD in different display sequences
RA MA MM
1 0.0.0 Meter serial number - + +
2 0.1.0 Billing period counter - + +
3 0.1.1 Number of entries in billing profile - + +
4 0.1.2 Time stamp of last billing period - + +
5 0.2.0 Firmware version - + +
6 0.2.2 Name of active tariff program - + +
7 0.3.0 Constant [imp/kWh] of test output LED - + +
8 0.3.3 Constant [imp/kWh] of S0 output - + +
9 0.8.4 Integration period - + +
10 0.9.1 Current time + + +
11 0.9.2 Current date + + +
12 0.9.5 Day of week [1...7] - + +
13 1.2.M Cumulative maximum demand +P [kW] of tariff M=[16] - + +
14 1.4.0 Average demand +P [kW] of current integration period - + +
15 1.5.0 Average demand +P [kW] of last integration period - - +
16 1.6.M Maximum demand +P [kW] of tariff M=[16] in current billing period - + +
17 1.6.M*VV Maximum demand +P [kW] of tariff M=[16] in previous billing period VV - - +
18 1.8.0 Total energy +A [kWh], current value + + +
19 1.8.0*VV Total energy +A [kWh], value at the end of previous billing period VV - - +
20 1.8.T Total energy +A [kWh] of tariff T=[16], current value - - +
21 1.8.T*VV Total energy +A [kWh] of tariff T=[16], value at the end of previous billing period VV - + +
22 1.9.0 Billing period energy +A [kWh], current value - + +
23 1.9.0*VV Billing period energy +A [kWh], value of previous VV billing period - - +
24 1.9.T Billing period energy +A [kWh] of tariff T=[16], current value - + +
25 1.9.T*VV Billing period energy +A [kWh] of tariff T=[16], value of previous VV billing period - - +
26 2.2.M Cumulative maximum demand -P [kW] of tariff M=[16] - + +
27 2.4.0 Average demand -P [kW] of current integration period - + +
28 2.5.0 Average demand -P [kW] of last integration period - - +
29 2.6.M Maximum demand -P [kW] of tariff M=[16] in current billing period - + +
30 2.6.M*VV Maximum demand -P [kW] of tariff M=[16] in previous billing period VV - - +
31 2.8.0 Total energy -A [kWh], current value - + +
32 2.8.0*VV Total energy -A [kWh], value at the end of previous billing period VV - - +
33 2.8.T Total energy -A [kWh] of tariff T=[16], current value - + +
34 2.8.T*VV Total energy -A [kWh] of tariff T=[16], value at the end of previous billing period VV - - +
35 2.9.0 Billing period energy -A [kWh], current value - + +
36 2.9.0*VV Billing period energy -A [kWh], value of previous VV billing period - - +
37 2.9.T Billing period energy -A [kWh] of tariff T=[16], current value - + +
38 2.9.T*VV Billing period energy -A [kWh] of tariff T=[16], value of previous VV billing period - - +
39 15.2.M Cumulative maximum demand |P| [kW] of tariff M=[16] - + +
40 15.4.0 Average demand |P| [kW] of current integration period - + +
41 15.5.0 Average demand |P| [kW] of last integration period - - +
42 15.6.M Maximum demand |P| [kW] of tariff M=[16] in current billing period - + +
44

No. OBIS
Description
43 15.6.M*VV Maximum demand |P| [kW] of tariff M=[16] in previous billing period VV - - +
44 15.8.0 Total energy |A| [kWh], current value + + +
45 15.8.0*VV Total energy |A| [kWh], value at the end of previous billing period VV - - +
46 15.8.T Total energy |A| [kWh] of tariff T=[16], current value - + +
47 15.8.T*VV Total energy |A| [kWh] of tariff T=[16], value at the end of previous billing period VV - - +
48 15.9.0 Billing period energy |A| [kWh], current value - + +
49 15.9.0*VV Billing period energy |A| [kWh], value of previous VV billing period - - +
50 15.9.T Billing period energy |A| [kWh] of tariff T=[16], current value - + +
51 15.9.T*VV Billing period energy |A| [kWh] of tariff T=[16], value of previous VV billing period - - +
52 3.2.M Cumulative maximum demand +Q [kvar] of tariff M=[16] - + +
53 3.7.0 Instantaneous power +Q [kvar] - + +
54 3.8.0 Total energy +R [kvarh], current value - + +
55 3.8.0*VV Total energy +R [kvarh], value at the end of previous billing period VV - - +
56 3.8.T Total energy +R [kvarh] of tariff T=[16], current value - + +
57 3.8.T*VV Total energy +R [kvarh] , value at the end of previous billing period VV - - +
58 3.4.0 Average demand +Q [kvar] of current integration period - + +
59 3.5.0 Average demand +Q [kvar] of last integration period - - +
60 3.6.M Maximum demand +Q [kvar] of tariff M=[16] in current billing period - + +
61 3.6.M*VV Maximum demand +Q [kvar] of tariff M=[16] in previous billing period VV - - +
62 3.9.0 Billing period energy +R [kvarh], current value - + +
63 3.9.0*VV Billing period energy +R [kvarh], value of previous VV billing period - - +
64 3.9.T Billing period energy +R [kvarh] of tariff T=[16], current value - + +
65 3.9.T*VV Billing period energy +R [kvarh] of tariff T=[16], value of previous VV billing period - - +
66 4.2.M Cumulative maximum demand -Q [kvar] of tariff M=[16] - + +
67 4.7.0 Instantaneous power -Q [kvar] - - +
68 4.8.0 Total energy -R [kvarh], current value - + +
69 4.8.0*VV Total energy -R [kvarh], value at the end of previous billing period VV - - +
70 4.8.T Total energy -R [kvarh] of tariff T=[16], current value - + +
71 4.8.T*VV Total energy -R [kvarh], value at the end of previous billing period VV - - +
72 4.4.0 Average demand -Q [kvar] of current integration period - + +
73 4.5.0 Average demand -Q [kvar] of last integration period - - +
74 4.6.M Maximum demand -Q [kvar] of tariff M=[16] in current billing period - + +
75 4.6.M*VV Maximum demand -Q [kvar] of tariff M=[16] in previous billing period VV - - +
76 4.9.0 Billing period energy -R [kvarh], current value - + +
77 4.9.0*VV Billing period energy -R [kvarh], value of previous VV billing period - - +
78 4.9.T Billing period energy -R [kvarh] of tariff T=[16], current value - + +
79 4.9.T*VV Billing period energy -R [kvarh] of tariff T=[16], value of previous VV billing period - - +
80 5.8.0 Total energy R1 [kvarh], current value - + +
81 5.8.0*VV Total energy R1 [kvarh], value at the end of previous billing period VV - - +
82 5.8.T Total energy R1 [kvarh] of tariff T=[16], current value - + +
83 5.8.T*VV Total energy R1 [kvarh], value at the end of previous billing period VV - - +
84 5.4.0 Average demand Q1 [kvar] of current integration period - + +
85 5.5.0 Average demand Q1 [kvar] of last integration period - - +
86 5.6.M Maximum demand Q1 [kvar] of tariff M=[16] in current billing period - + +
87 5.6.M*VV Maximum demand Q1 [kvar] of tariff M=[16] in previous billing period VV - - +
88 5.9.0 Billing period energy R1 [kvarh], current value - + +
89 5.9.0*VV Billing period energy R1 [kvarh], value of previous VV billing period - - +
90 5.9.T Billing period energy R1 [kvarh] of tariff T=[16], current value - + +
91 5.9.T*VV Billing period energy R1 [kvarh] of tariff T=[16], value of previous VV billing period - - +
92 6.8.0 Total energy R2 [kvarh], current value - + +
93 6.8.0*VV Total energy R2 [kvarh], value at the end of previous billing period VV - - +
94 6.8.T Total energy R2 [kvarh] of tariff T=[16], current value - + +
95 6.8.T*VV Total energy R2 [kvarh], value at the end of previous billing period VV - - +
96 6.4.0 Average demand Q2 [kvar] of current integration period - + +
97 6.5.0 Average demand Q2 [kvar] of last integration period - - +
98 6.6.M Maximum demand Q2 [kvar] of tariff M=[16] in current billing period - + +
99 6.6.M*VV Maximum demand Q2 [kvar] of tariff M=[16] in previous billing period VV - - +
100 6.9.0 Billing period energy R2 [kvarh], current value - + +
101 6.9.0*VV Billing period energy R2 [kvarh], value of previous VV billing period - - +
102 6.9.T Billing period energy R2 [kvarh] of tariff T=[16], current value - + +
103 6.9.T*VV Billing period energy R2 [kvarh] of tariff T=[16], value of previous VV billing period - - +
104 7.8.0 Total energy R3 [kvarh], current value - + +
105 7.8.0*VV Total energy R3 [kvarh], value at the end of previous billing period VV - - +
106 7.8.T Total energy R3 [kvarh] of tariff T=[16], current value - + +
RA MA MM
45

No. OBIS
Description
107 7.8.T*VV Total energy R3 [kvarh], value at the end of previous billing period VV - - +
108 7.4.0 Average demand Q3 [kvar] of current integration period - + +
109 7.5.0 Average demand Q3 [kvar] of last integration period - - +
110 7.6.M Maximum demand Q3 [kvar] of tariff M=[16] in current billing period - + +
111 7.6.M*VV Maximum demand Q3 [kvar] of tariff M=[16] in previous billing period VV - - +
112 7.9.0 Billing period energy R3 [kvarh], current value - + +
113 7.9.0*VV Billing period energy R3 [kvarh], value of previous VV billing period - - +
114 7.9.T Billing period energy R3 [kvarh] of tariff T=[16], current value - + +
115 7.9.T*VV Billing period energy R3 [kvarh] of tariff T=[16], value of previous VV billing period - - +
116 8.8.0 Total energy R4 [kvarh], current value - + +
117 8.8.0*VV Total energy R4 [kvarh], value at the end of previous billing period VV - - +
118 8.8.T Total energy R4 [kvarh] of tariff T=[16], current value - + +
119 8.8.T*VV Total energy R4 [kvarh], value at the end of previous billing period VV - - +
120 8.4.0 Average demand Q4 [kvar] of current integration period - + +
121 8.5.0 Average demand Q4 [kvar] of last integration period - - +
122 8.6.M Maximum demand Q4 [kvar] of tariff M=[16] in current billing period - + +
123 8.6.M*VV Maximum demand Q4 [kvar] of tariff M=[16] in previous billing period VV - - +
124 8.9.0 Billing period energy R4 [kvarh], current value - + +
125 8.9.0*VV Billing period energy R4 [kvarh], value of previous VV billing period - - +
126 8.9.T Billing period energy R4 [kvarh] of tariff T=[16], current value - + +
127 8.9.T*VV Billing period energy R4 [kvarh] of tariff T=[16], value of previous VV billing period - - +
128 13.7.0
129 14.7.0 Frequency [Hz] - + +
130 15.7.0 Instantaneous power |P| [kW] - + +
131 16.7.0 Instantaneous power ±P [kW]
132 3.7.0 Instantaneous power +Q [kvar] - + +
133 4.7.0 Instantaneous power -Q [kvar] - + +
134 11.7.0 Instantaneous RMS value of current [A] - + +
135 12.7.0 Instantaneous RMS value of voltage [V] - + +
136 91.7.0 Instantaneous RMS value of current [A] in neutral - + +
137 11.5.0 Average current [A]
138 12.5.0 Average voltage [V]
139 71.5.124 Average current THD
140 72.5.124 Average voltage THD
141 14.5.0 Average frequency [Hz]
142 C.1.0 Meter serial number (same as OBIS = 0.0.0) - + +
143 C.1.1 Meter type - + +
144 C.1.2 Ordering code - + +
145 C.2.0 Parametrization counter - + +
146 C.5.0 Internal operating status - + +
147 C.7.5 Power outage counter - + +
148 C.8.0 Time of operation - + +
149 C.8.T Time of operation of tariff T=[16] - + +
150 C.50.1*NN Active day program NN of energy tariffs - + +
151 C.50.2*NN Active week program NN of energy tariffs - + +
152 C.50.2*NN Active seasons NN of energy tariffs - + +
153 C.51.1*NN Active day program NN of demand tariffs - + +
154 C.51.2*NN Active week program NN of demand tariffs - + +
155 C.51.2*NN Active seasons NN of demand tariffs - + +
156 C.52.1*NN Passive day program NN of energy tariffs - + +
157 C.52.2*NN Passive week program NN of energy tariffs - + +
158 C.52.2*NN Passive seasons NN of energy tariffs - + +
159 C.53.1*NN Passive day program NN of demand tariffs - + +
160 C.53.2*NN Passive week program NN of demand tariffs - + +
161 C.53.2*NN Passive seasons NN of demand tariffs - + +
162 C.54.0*NN Permanent special days NN - + +
163 C.54.1*NN Leap-special-days NN - + +
164 C.55.0 Tariff configuration bits - + +
165 C.55.1 Date and time of activation of passive tariff table - + +
166 C.55.2 Name of passive tariff table - + +
167 C.60.12 Event counter: over-voltage - + +
168 C.60.13 Event counter: under-voltage - + +
169 C.60.20 Event counter: power over-limit - + +
170 C.60.21 Event counter: reverse current flow - + +
Power factor cos(ϕ)
RA MA MM
- + +
46

No. OBIS
Description
171 C.60.22 Event counter: over-current - + +
172 C.60.23 Event counter: neutral current imbalance - + +
173 C.60.30 Event counter: influence of magnetic field - + +
174 C.60.31 Event counter: opening of meter cover - + +
175 C.60.32 Event counter: opening of terminal cover - + +
176 C.60.40 Event counter: clock setting - + +
177 C.60.50 Event counter: internal error - + +
178 C.61.10 Event timer: power outage - + +
179 C.61.12 Event timer: over-voltage - + +
180 C.61.13 Event timer: under-voltage - + +
181 C.61.20 Event timer: power over-limit - + +
182 C.61.21 Event timer: reverse current flow - + +
183 C.61.22 Event timer: over-current - + +
184 C.61.23 Event timer: neutral current imbalance - + +
185 C.61.30 Event timer: influence of magnetic field - + +
186 C.61.31 Event timer: opening of meter cover - + +
187 C.61.32 Event timer: opening of terminal cover - + +
188 C.69.1 Contractual power limit P
189 C.70.0 Check sum of the firmware - + +
190 C.70.1 Parametrization ID - + +
191 C.70.3 Firmware execution rate (diagnostics parameter) - + +
192 C.81.0 Baud rate settings of communication interfaces - + +
193 C.90.1 User configuration bits - + +
194 C.90.2 Display and IEC 62056-21 communication formats - + +
195 C.90.3 S0 ports configuration - - 196 C.90.4 Billing period end denied time - - 197 C.90.9 Meter relays output state - - 198 F.F.0 Error code - + +
199 P.1.0 Load profile - + +
200 P.97.0 Power failure (outage event) log - + +
201 P.98.12 Voltage swell (Over-voltage) event log - + +
202 P.98.13 Voltage sag (Under voltage) event log - + +
203 P.98.14 Internal main relay event log - + +
204 P.98.20 Power over limit event log - + +
205 P.98.21 Reverse current flow event log - + +
206 P.98.22 Over-current event log - + +
207 P.98.23 Neutral current imbalance event log - + +
208 P.98.30 Influence of magnetic field event log - + +
209 P.98.31 Opening of meter cover event log - + +
210 P.98.32 Opening of terminal cover event log - + +
211 P.98.40 Clock setting event log - + +
212 P.98.41 Parameter change event log - + +
213 P.98.43 Failed authentication log - + +
214 P.98.50 Internal error event log - + +
215 P.98.51 Tariff changing event log - + +
216 P.98.52 Load profiles resets event log - + +
217 P.98.60 Firmware upgrade event log - + +
- + +
lim
RA MA MM
Current date (OBIS = 0.9.2) may be indicated with different date delimiters: “·” or “ ” (e.g.
YY·MM·DD or YY MM DD). Delimiter may be chosen during meter parameterization. You
may find different delimiters in different examples further in this manual.
Even if G1B meter is disconnected from network voltage, data still may be reviewed: press and
hold scroll push-button for 2 to 5 seconds, and RA will start. LCD test, time, date and total energy
register value (OBIS 1.8.0 or 15.8.0 –depends on meter modifications) will be indicated on LCD.
11.1 Reserved-automatic (RA) display sequence
47

•
Figure 11-1 Example of RA display sequence
11.2 Main automatic (MA) display sequence
When meter is connected to network voltage, “P_on” is displayed for a few seconds and MA
display sequence starts. What data will be indicated in this sequence is chosen during meter
parameterization as well as data scroll duration. For more information on data that can be
indicated on LCD see Table 11-1.
11.3 Main manual (MM) display sequence
When meter is connected to network voltage (MA display sequence is active), use short signal –
automatic display sequence will be interrupted and LCD test screen will be shown in display. Use
short signal one more time and you will access MM display sequence. With a help of short signals
select “Std_dAtA” and use long signal to access MM display sequence. For more information on
data that can be indicated on LCD in this sequence see Table 11-1.
You can scroll between MM data with a help of short signals, if you want to exit user menu scroll to
the “End” screen and use long signal.
There are two user interface types used for data scrolling: optical scroll key (interprets pulses of light beam as LCD
control commands) and scroll push-button.
Before proceeding further, let us remember LCD control commands:
• short signal. Light signal with duration of < 2 s or push of the scroll push-button for < 2 s;
• long signal. Light signal with duration of between 2 and 5 seconds or push of the scroll push-button for 2 to
5 seconds.
very long signal. Light signal with duration of > 5 s or push of the scroll push-button for > 5 s;
Marking, which will be used in the pictures for LCD control commands:
11.4 Indication of abnormal states on LCD
If meter detects internal failures or events and abnormal state in network, it provides to LCD
following messages:
Er - fatal failure of the meter. Further exploitation of the meter is not allowed. If this message
occurs, meter must be uninstalled. As failure occurs meter writes failure code with time and date to
event log. Failure code with time and date can be read through communication interfaces or
reviewed in LCD (OBIS = F.F).
- voltage of backup power supply felt below critical level. It means battery must be changed.
For more information see chapter Error! Reference source not found..
11.4.1 Internal meter errors
Periodically every 5 minutes meter calculates checksum (CRC) of meter firmware and issues
internal meter error in case of firmware corruption. In that case error code is F.F(00000100).
48

Description
Level
Calibration cons
tants
Measuring module settings
Security settings
Identificators
Internal clock settings
11.5 Data reading via communication interfaces
For data reading via optical interface, an optical head is used to connect meter to serial port of PC.
Manufacturer provides software for data reading via optical interface, database management and
graphical representation of metering data.
Note: appropriate software version for concrete meter is indicated in meter’s passport.
For data reading via electrical interface, an appropriate “20 mA current loop”, RS485 or M-Bus
converter is used. Electrical interfaces are used for meter connection to an AMR (Automated Meter
Reading) system. Data transmission meets specification of IEC 62056-21, DLMS/COSEM and EN
13757-2, EN 13757-3 protocols.
For more information about automated data reading systems, with GAMA 100 meters installed,
and the related software, please contact your local dealer or you can directly contact the
manufacturer “ELGAMA-ELEKTRONIKA” Ltd. (http://www.elgama.eu).
12 Parametrization
Parameterization of the meter allows configuration of meter settings via optical or electrical
communication interfaces. There are two kinds of meter parameterization.
• Initial parameterization in the factory. Writes to the meter serial meter number and
calibration constants. Initial parameterization is performed while meter is assembled and
while major repairs of the meter. Initial parameters are presented in meter passport.
• Adoptable parameterization is performed to adopt meter settings to the requirements of
utility. Adoptable parameterization is permitted to utility representatives only.
Meters (parameters) are protected by password (see chapter 13.2.1). New meters do not contain
password. Utility is in charge to set and manage passwords for the meter.
For detailed information on using parameterization software refer to it’s user manual.
Different users may change different parameters of meter depending on their access levels (see
Table 12-1):
Table 12-1 Parameter change and command access levels: U – User (collector); O – Operator (management), M - Manufacturer, H
- Hardcoded.
Measuring calibration constants M
Clock calibration constants M
Energy register configuration H
Decimal places for energy registers M
Constant [imp/kWh] of test output LED M
Transformation coefficients O
Power factor tg ϕ threshold
Parameter access rights H
User password (write-only) O
Operator password (write-only) O
Parameter blocking function activation M
Meter serial number M
Meter type M
Firmware version H
Ordering code M
User ID #1 (user name) O
User ID #2 (location) O
O
49

Description
Level
Load profile
Billing
profile
Day profile
Event log settings
Tariff table settings
LCD options
Communication
interface settings
Input
/
output
settings
Electricity
network p
arameters
Date and time O
Day of week -
Daylight saving O
Number of entries H
Integration period O
Captured object list O
Number of entries H
Billing period end time O
Captured object list H
Number of entries H
Captured object list H
Number of entries in each event log H
Tariff configuration O
Name of active tariff table O
Name of passive tariff table O
Special day list O
Tariff seasons O
Week tariff programs O
Day tariff programs O
Passive tariff table activation time O
List of objects in main automatic data scrolling cycle O
List of objects in manual data scrolling cycle O
List of objects in main “Reserved” automatic data scrolling cycle O
Automatic data scrolling cycle period O
Manual data scrolling cycle duration O
Date identification format O
Decimal places in energy register indication O
Season mark identification O
Optical interface communication protocol H
Electrical interface communication protocol H
Auxiliary electrical interface communication protocol H
Data rate for optical interface O
Data rate for electrical interface O
Data rate for auxiliary electrical interface O
EN 62056-21 settings O
S0 output constant O
S0 output settings H
Relay output settings O
Control input settings H
Minimal electricity supply disconnection time H
Contractual power O
Neutral current limit O
Phase current limit O
Overvoltage threshold O
50

Description
Level
Operator settings
Undervoltage threshold O
Billing period end O
Clock synchronization O
Synchronization by external pulse settings O
Test mode activation O
Tariff timer reset O
Event log reset O
LCD backlight activation (if LCD is equipped with this function) O
User configuration bits
Date format, small date delimiters, season flag in date, LCD backlight and relay may be
parametrized (C.90.1).
LCD settings
Decimal point for energy registers, scroll list timeout, menu timeout may be changed (C.90.2).
13 Data protection
There is a data protection system against unauthorized data reading and parameter changes:
• physical protection;
• software protection.
13.1 Physical protection
Main cover and terminal cover are sealed in order to secure them from opening. Communication
unblocks and/or billing period reset function is sealed also (if there is a sealed button under the
battery cover).
13.2 Software protection
13.2.1 Data access security
Meter data can be accessed only via secured communication interfaces. As it is defined by DLMS
COSEM protocol, three data access security levels are provided in the meter:
• Lowest level security (no security) - does not require any peer authentication;
• Low Level Security (LLS) - authentication of clients by verifying the password;
• High Level Security (HLS) - mutual authentication of the client (Central System) and the
server (meter).
Data access security concerns role based access to data. The following roles are specified:
• Public (P) client (Client ID = 0x10) with lowest security (no security). Public client is used
only for test purpose. It is not allowed to read metering data or perform any programming,
and only non-personal data can be accessed (read only), e.g. meter serial number,
firmware version, current time and date.
• Management (M) client (Client ID = 0x01) with High Level Security (HLS). Management
client is allowed to read metering data and perform any programming.
• Collector (C) client (Client ID = 0x20) with High Level Security (HLS). Collector is allowed to
read metering data, but not to perform any programming.
• Firmware update (F) client (Client ID = 0x30) with High Level Security (HLS). Firmware
update client is used exceptionally for firmware update purposes.
13.2.2 Passwords
While Low Level Security (LLS) is enabled in meter, unauthorized data readouts and
parameterizations are prevented by password. Meter contains the following passwords:
• Collector password for optical interface (only read of data);
51

• Collector password for electrical interface (only read of data);
• Management password for optical interface (read of data and parameterization);
• Management password for electrical interface (read of data and parameterization).
Password is limited to a sequence of 8 ASCII symbols.
A system of prevention from password guessing is implemented. If the meter registers more than
four cases of entering wrong password in sequence, optical communication interface is blocked for
24 hours. During this time the meter does not accept even the correct password.
Passwords are write-only. Password can be changed only by providing old password via
communication interface or password can be erased by special command only after opening of
main cover. In that case registered (stored) data is kept non-violated.
13.2.3 Encryption and Authentication
In case public communication channel (e.g. PLC) is used for remote meter readout and/or
parameterization, it is highly recommended to enable High Level Security (HLS) in the meter. HLS
allows mutual authentication of the client (Central System) and the server (meter) participating in
the communication session, as well as encryption of data transmitted. Authentication and
encryption is implemented in meter according to DLMS/COSEM protocol specifications. The
Galois/Counter Mode (GCM) with AES-128 coding is employed as cryptographic algorithm. Meter
contains the following keys:
• Encryption key for Collector client (only read of data);
• Authentication key for Collector client (only read of data);
• Encryption key for Management client (read of data and parameterization);
• Authentication key for Management client (read of data and parameterization);
• Encryption key for Firmware update client;
• Authentication key for Firmware update client;
• Master key for wrapping of encryption keys and authentication keys.
Keys are 16 byte long write-only. For delivery, they are wrapped using the AES-128 key wrap
algorithm and the master key. Individual master keys for each meter are generated at the factory
and delivered to the customer in the form of encrypted file. After High Level Security was enabled
in the meter, it cannot be downgraded to Low Level Security, without opening main cover of meter.
13.2.4 Firmware/hardware identifiers
Each meter is identified by a unique meter serial number, which is presented on the nameplate
(see Figure 5-3), as well as available on LCD display and communication interfaces (OBIS = 0.0.0
and OBIS = C.1.0).
Furthermore, meter hardware is identified by meter type (OBIS = C.1.1) and ordering code (OBIS
= C.1.2). Meter type and ordering code are presented on the nameplate (see Figure 5-3).
Firmware of the meter is identified by firmware version, which is hardcoded into the meter firmware
and can be readout via communication interfaces (OBIS = 0.2.0). Furthermore, meter verifies
periodically the check sum of the firmware (OBIS = C.70.0) and registers internal error in case of
corrupted check sum (see chapter 11.4.1).
13.2.5 User’s identifiers
There can be written two user’s identifiers (OBIS = 0.0.1 and OBIS = 0.0.2) into the GAMA 100
meters. Every identifier is a string of up to 16 ASCII symbols. Identifiers are set by means of
parameterization software.
13.2.6 Blocking of optical communication interface
Meter blocks optical interface for parameterization only. Parameterization is prohibited via optical
interface at all time. Interface can be unblocked. It is done, when meter enters service display
sequence by pressing sealed push-button. Note, that pressing the sealed push-button,
52

when meter is in main automatic display sequence, closes billing period.
Service display sequence can be accessed as follows:
1. Press scroll push-button once (short signal). LCD test display is activated.
2. Press and hold (for 2 seconds) sealed push-button.
3. Communication indicator flashes for 5 seconds. Communication unblock procedure is
successful.
Parameterization is enabled for one whole hour after entry to service display sequence. In case of
power outage event, meter returns to communication blocking mode. Steps 1 and 2 must be
repeated after power reconnection to the meter in order to continue parameterization of meter.
13.2.7 Parameterization ID
Any legal and successfully installed user software generates a unique 8-symbol HEX [0...9, A...F]
registration code. The registration code is assigned to the concrete version of the user software
and the concrete computer hardware. The registration code can be viewed using user software,
and it is transferred to the meter at the beginning of each parameterization session. Each
parameterization sessions has to be started by sending registration code (in other words
parameterization ID, OBIS = C.70.1) to the meter. If the registration code is not transferred, the
meter will not accept the parameters, even if the password is correct. Meter memorizes registration
code as an identifier of last parameterization author. Only the registration code of the last
parameterization is stored. It can be read via communication interfaces (OBIS = 96.70.1).
Registration code can also be displayed on the meter LCD.
13.2.8 Event log, security alerts
Extraordinary events, induced by electricity network, load properties, tampering attempts,
communication interfaces or abnormal meter state, are time stamped and captured in event log.
Please refer to chapter 8.5 for more details. Each event log can be configured to generate security
alert in case of event occurrence, i.e. meter initiates communication session and sends alarm to
Central System, if certain type of event is registered. By default, tampering events (influence of
magnetic field, opening of terminal cover and main cover) are configured for security alerts.
13.3 Firmware upgrade
G1B meters can be manufactured with firmware upgrade possibility. Both metering part of the
firmware (legally relevant software) as well as firmware of internal communication modules (e.g.
internal PLC modem) can be upgraded. The entire firmware of the meter is legally controlled (there
is no software separation). The download of legally relevant firmware follows recommendations
outlined in WELMEC 7.2 Software Guide (http://www.welmecwg7.ptb.de/).
Firmware upgrade may be started instantly, or can be done at predefined time and date. Settings
are carried out by the manufacturer Program “Gamalink”, where just need to set firmware image
activation date (for more information read “Gamalink” user manual).
During download and the subsequent installation of downloaded firmware, correct measurement is
guaranteed. Meter is capable of detecting if the download or installation fails. If the download or
installation is unsuccessful or is interrupted, the original status of the meter stays unaffected.
Authentication of downloaded firmware is carried out through the use of firmware update key. Key
matching is done automatically. Integrity of downloaded firmware is checked by performing a
checksum (32 bit length CRC with secret initial vector) over the legally relevant firmware and
comparing it against the checksum attached to the firmware. The CRC initial vector is stored in the
fixed firmware part. Traceability of legally relevant firmware download is guaranteed by means of
event logger (see chapter 8.5) that automatically records the date and time of the download,
identification of the downloaded legally relevant software, and an entry of the success. An entry is
generated for each download attempt regardless of the success. After having reached the limit of
the event logger, it is ensured that further downloads are impossible. Event log may only be
erased by breaking a physical seal and opening the main cover of meter.
53

14 Internal bi-stable main relay
Remark: Internal main relay are present only in meters with ordering code R1 (see Table
4-9).
G1B meter is equipped with internal bi-stable main relay which enables to disconnect (reconnect)
a load (a consumer) from power grid. All possible options of internal relays are described in
chapter 3.2. Disconnection control of consumer (load) is performed according to relay control
scenario which enables certain actions from listed below. Internal relay can be:
• Disconnected – this state can be set by “disconnect” command from any other state.
Disconnect command can by issued from following sources:
o Remote - control command;
o Local - control command;
o Manual (Consumer) - Menu button;
o when contractual power is exceeded;
o when limit of phase current is exceeded;
o during swings of network voltage (under-voltages and over-voltages);
• Ready to reconnect – this state can be set by “allow to connect” command from
“disconnected” state only. “Allow to connect” command can be issued from following
sources:
o Remote - control command;
o Local – control command;
o Manual (Consumer) - Menu button;
o end of billing period in case of disconnect reason power or current limit exceeded;
o network voltage normalized after under-voltage or over-voltage condition.
• Connected – this state can be set by “connect” command from “allow to connect” state
only. “Connect” command can be issued from following sources:
o Remotely - by remote control command;
o Local – be remote control command;
o Manual (Consumer) – by Menu button;
o Manual (Consumer) - by the mains switch of the internal electrical installation.
There are three states of internal relay:
• disconnected – relay is open and consumer is disconnected if any of disconnection
condition is valid;
• ready for reconnection – disconnection condition is no longer valid, but relay remains open,
consumer is disconnected and consumer is allowed to reconnect;
• connected – consumer performed manual or over remote control command reconnection
action, relay is closed and consumer is reconnected to power grid.
When meter is in any of listed states, billing data from the meter can always access by the
consumer by manual data review (see chapter 11) – when entering “standard_data” menu a total
and tariff energies registers can be displayed. When meter is powered of and switched on again,
an internal state of relay remains the same as is it was before power off. If internal relay was
disconnected by either “contractual power exceed” or by swings of network voltage (undervoltages and over-voltages) algorithms and these algorithms are disabled during parametrization,
then internal state of relay is changed to “ready for reconnection”. The principle of the algorithm is
shown below (see Figure 14-1).
54

Remote control
command
Swings of
network voltage
Contractual
power limit
Relay status
Relay connected
remote disconnect
allow for reconnection
Swings of network
voltage is out of limits
Relay connected
Ready for
reconnect
Network voltage is
within normal limits
Contractual power
is exceeded
Relay connected
Ready for
reconnect
Normal load
Button pressing
Relay disconnected
Button is pressed
Relay disconnected
Figure 14-1 Algorithm of priority of internal main relays
14.1 Action “disconnect by remote control command”
Relay disconnection by remote command workflow:
1. Relay can be disconnected by sending “disconnect” command over any of these interfaces:
• Optical interface (IEC 62056-21 and DLMS protocols) with password;
• Electrical interface (DLMS) with password.
2. After receiving command “remote disconnect”, meter switches to internal state
“disconnected”: internal relay is open, relay state LED (see Figure 5-1) is on, corresponding
message (Load
OBIS code area (....
optical interface if it was received from it, if command was sent from electrical interface –
entry is made accordingly;
3. Internal state can be changed from “disconnected” to “ready to connect” after “allow to
connect” command is received from source allowed by main relay control plan;
Load:oFF
:oFF) is displayed on LCD and a source of disconnection is displayed in
LoadLoad
:oFF:oFF
....). Entry is made to event register that “disconnect” request came from
........
14.2 Action “disconnect by contractual power exceeded”
Relay disconnection by “contractual power exceeded” is based on such principles:
1. Meter measures average active power over period of integration Pav [W], as ratio of active
power A [Wh] over period of integration and duration of integration period ∆t:
2. When “contractual power exceeded” algorithm is enabled and average power of integration
period Pav [W] exceeds defined limit Plim [W], meter switches to internal state
“disconnected”: internal relay is opened, relay status LED (see Figure 5 -1) is on,
corresponding message (Load:oFF
displayed in OBIS code area (P-hi
request came from “contractual power exceeded” event;
3. Internal state can be changed from “disconnected” to “ready to connect” after “allow to
connect” command is received from source allowed by main relay control plan;
Load:oFF) is displayed on LCD and a source of disconnection is
Load:oFFLoad:oFF
P-hi). Entry is made to event register that “disconnect”
P-hiP-hi
55

4. Dedicated LCD segment “A” (▼) indicates whether contractual power was exceeded.
Operation of this segment is independent of relay control algorithms and state of internal
relay – if contractual power was exceeded this segment is lighted and remains on until the
end of billing period;
5. The limit of contractual power Plim [W] can be parameterized within range [0...100] kW. The
same value of contractual power is used independently of valid tariff. The principle of the
algorithm is shown below (see Figure 14-2).
Pav, kW
P
, kW
lim
∆t∆t
Relay status
Relay connected
Relay disconnected
Button status
∆t ∆t ∆t ∆t ∆t ∆t
Relay connected
Ready for reconnect
Relay disconnected
Ready for reconnect
Figure 14-2 Relay control algorithm “contractual power exceeded”
14.3 Action “disconnect by phase current limit exceeded”
Relay disconnection by “current limit exceeded” (Figure 14-3) is based on such principles:
1. Meter measures RMS value of current every second. There is configurable limit in the
meter, which defines the maximum value of RMS current, and if this limit is exceeded an
over-current event is registered;
2. There is a parameter in the meter, which defines reaction time to an over-current – the
duration of reaction time is denoted in seconds and indicates how many seconds of
continuous over-current should go on until such event is registered (protection from short
term big current consumption);
3. When over-current event is registered, meter switches to internal state “disconnected”:
internal relay is opened, relay status LED is on, corresponding message (Load:off
displayed on LCD and a source of disconnection is displayed in OBIS code area (I-hi
Entry is made to event register that “disconnect” request came from “current limit exceeded”
event;
4. Internal state can be changed from “disconnected” to “ready to connect” after “allow to
connect” command is received from source allowed by main relay control plan;
Load:off) is
Load:offLoad:off
I-hi).
I-hiI-hi
56

Figure 14-3 Relay control algorithm “phase current limit exceeded”
14.4 Action “disconnect by swings of network voltage”
Relay disconnection by “swings of network voltage” (Figure 14-4) is based on such principles:
1. Meter measures averaged instantaneous voltage every second. There are configurable
limits in the meter, which defines the value of limits of instantaneous voltages and if these
limits are exceeded an under-voltage or over-voltage event is registered;
2. There is a parameter in the meter, which defines reaction time to a swing of network voltage
– the duration of reaction time is denoted in seconds and indicates how many seconds a
continuous voltage swing event (under-voltage or over-voltage) should go on until such
event is registered (protection from short term voltage swings);
3. When network voltage swing event (under-voltage or over-voltage) is registered (relay
control algorithm “swings of network voltage” is enabled) meter switches to internal state
“disconnected”: internal relay is opened, relay status LED (see Figure 5-1) is on,
corresponding message (Load:oFF
displayed in OBIS code area (U-hi
“disconnect” request came from “swings of network voltage” event;
4. Internal state can be changed from “disconnected” to “ready to connect” after “allow to
connect” command is received from source allowed by main relay control plan;
Load:oFF) is displayed on LCD and a source of disconnection is
Load:oFFLoad:oFF
U-hi or U-Lo
U-hiU-hi
U-Lo). Entry is made to event register that
U-LoU-Lo
57

U
, V
rms
U
over+hyst
U
over
t
reaction
t
reaction
U
under
U
under+hyst
Relay status
Relay connected
Ready for
reconnect
Relay disconnected
Button
pressing
Button is pressed
Figure 14-4 Relay control algorithm “swings of network voltage”
Relay connected
Ready for
reconnect
Relay disconnected
14.5 Action “allow to connect by remote control command”
Relay allow to connect by remote command workflow:
1. Relay can be allowed to connect by sending “allow to connect” command over any of these
interfaces:
• Optical interface (IEC 62056-21 and DLMS protocols) with password;
• Electrical interface (DLMS) with password.
2. After receiving command “allow to connect”, meter switches to internal state “ready to
connect”: internal relays remain open, relay state LED starts blinking and corresponding
message (Load:SET
is displayed (....
from optical interface if it was received from it, if command was sent from electrical interface
– entry is made accordingly;
3. Internal relay can be reconnected after “connect” command is received from source allowed
by main relay control plan;
Load:SET) is displayed on LCD and in OBIS code area a source of disconnection
Load:SETLoad:SET
....). Entry is made to event register that “ready to connect” request came
........
14.6 Action “allow to connect by end of billing period”
Relay allow to connect by end of billing period workflow:
1. Relay can be allowed to connect by end of billing period if disconnect reason was
“contractual power exceeded”.
2. When integration period is over, meter switches to “ready for reconnection” state: internal
relays remain open, relay state LED starts blinking and corresponding message (Load:SET
is displayed on LCD and in OBIS code area a source of disconnection is displayed
58
Load:SET)
Load:SETLoad:SET

(P-hi
P-hi).Entry is made to event register that “ready to connect” request came because end of
P-hiP-hi
billing period was reached;
3. Internal relay can be reconnected after “connect” command is received from source allowed
by main relay control plan;
14.7 Action “allow to connect by end of event”
Relay allow to connect by end of event workflow:
1. Relay can be allowed to connect by end of current limit exceeded if disconnect reason was
“current limit exceeded” or “swings of network voltage”.
2. Internal state “disconnected” lasts only until effect which issued “disconnect” command is
valid then meter is switched to internal state “ready for reconnection”: internal relays
remains open, relay state LED starts blinking and corresponding message (Load:SET
displayed on LCD and in OBIS code area a source of disconnection is displayed
(I-hi
I-hi, U-hi
U-hi or U-Lo
I-hiI-hi
U-hi U-hi
because disconnect event effect ended;
3. Internal relay can be reconnected after “allow connect” command is received from source
allowed by main relay control plan;
U-Lo). Entry is made to event register that “ready to connect” request came
U-LoU-Lo
Load:SET) is
Load:SETLoad:SET
14.8 Action “connect by Menu button”
Relay connect by button event workflow:
1. After pressing Menu button more than >5s (special timer appears on LCD) meter switches
to internal state “connected”: internal relay is closed, relay state LED is off, corresponding
message (Load:on
Entry is made to event register that “connect” request came from menu button press event;
Load:on) is displayed for 2 seconds and meter switches to normal scroll mode.
Load:onLoad:on
14.9 Action “connect by the mains switch of the internal
electrical installation”
For reconnection by the mains switch of the internal electrical installation, when the load is
disconnected, actions is required as follows:
1. The central system transmits a command “allow to connect” and enabling the meter to
reconnect;
2. After receiving command “allow to connect”, meter switches to internal state “ready to
connect”: internal relays remain open, relay state LED starts blinking and corresponding
message (Load:SET
3. Consumer opens (OFF state) for >2s the general switch of the internal electrical installation,
which is detected by the meter. Subsequently, the consumer closes his general switch (ON
state);
4. After turning consumer load back “ON” meter switches to internal state “connected”: internal
relay is closed, relay state LED is off, corresponding message (Load:on
seconds and meter switches to normal scroll mode. Entry is made to event register that
“connect” request came from consumer mains switch (General switch trigger) event.
Load:SET) is displayed on LCD;
Load:SETLoad:SET
Load:on) is displayed for 2
Load:onLoad:on
59

15 Installation
Only a person who has an adequate qualification and has read this User’s manual may perform
installation, uninstallation and verification of meter. Example of wiring diagram of meter is
presented in Figure 15-1 -Figure 15-4. Wiring diagram of particular meter is in its passport.
Figure 15-1 GAMA 100 connection diagram with 1 current measurement element (current transformer or shunt),
S0 output and RS 485 interface
Figure 15-2 GAMA 100 connection diagram with 2 current measurement elements (in phase and neutral circuits)
Figure 15-3 GAMA 100 connection diagram with 1 current
measurement element, M-Bus and RS 485 interfaces
Figure 15-4 Connection diagram with bi-stable main relay
(1 current measurement element, RS485 interface with +5V power
supply to external modem)
60

Annex A. Dimensions of the meter
Figure A-0-1 Dimensions of the meter and fixing holes
Figure A-0-2 Dimensions of the meter with special terminal cover for GSM/GPRS modem
61

Annex B. Screw torques used in G1B meters
Table B-0-1 Screw torques used in GAMA 100 meters
No Name Thread Material Screw torque, Nm
1 Voltage contact screw M2,5 Brass 0,32
Steel 0,43
2 Voltage link screw M3 Steel 0,76
3 Contact screw M5 Brass 2
Steel 2,7
4 Sealing bolt M4 Brass 1,3
Figure B-0-1 Screws used in direct connected GAMA 100 meters
62

No. OBIS
Description
P M C F
DLMS/COSEM
Annex C. List of data objects
Every object is identified by OBIS code. Furthermore, it is indicated whether particular data
object is available on LCD, as well as accessible for read („r“) and write („w“) operations via
IEC 652056-21 and DLMS/COSEM communication protocols. Some objects are marked by
„c“(capture), which means that objects are not available as separate data objects, but their
values are captured in data profiles. In DLMS/COSEM protocol different access rights are
specified for different client roles: P (Public), M (Management), C (Collector) and F (Firmware
upgrade). Furthermore, for DLMS/COSEM protocol, each data object is identified by special
interface class ID (according to IEC 62056-62):
• (class_id=1) „Data“;
• (class_id=3) „Register“;
• (class_id=4) „Extended register“;
• (class_id=5) „Demand register“;
• (class_id=7) „Profile generic“;
• (class_id=8) „Clock“;
• (class_id=9) „Script table“;
• (class_id=11) „Special days table“;
• (class_id=12) „Association SN“;
• (class_id=18) “Image transfer”;
• (class_id=20) „Activity calendar“;
• (class_id=22) „Single action schedule“;
• (class_id=72) „M-Bus client“;
• (class_id=74) „M-Bus Master port setup“.
Table C-0-1 List of data objects
LCD
62056-21
1. 0.0.0 Meter serial number r r 1r
2. 0.0.1 User ID #1 (user name) - rw 1-
3. 0.0.2 User ID #2 (location) - rw 1-
4. 0.1.0 Billing period counter r r 3-
5. 0.1.1 Number of entries in billing profile r r 3-
6. 0.1.2 Time stamp of last billing period r r 3-
7. 0.2.0 Firmware version r r 1r
8. 0.2.2 Name of active tariff program r rw 1-
9. 0.3.0 Constant [imp/kWh] of test output LED r r 1-
10. 0.3.3 Constant [imp/kWh] of S0 output r rw 1-
11. 0.8.4 Integration period r rw 1-
12. 0.9.1 Current time rw rw 1r
13. 0.9.2 Current date rw rw 1r
14. 0.9.5 Day of week [1...7] r r 1r r r r
15. 1.0.0 Clock object - - 1r
16. 1.2.M Cumulative maximum demand +P [kW] of tariff M=[16] r r 4-
17. 1.4.0 Average demand +P [kW] of current integration period r r 5-
18. 1.5.0 Average demand +P [kW] of last integration period r r 3-
19. 1.6.M Maximum demand +P [kW] of tariff M=[16] in current billing
period
20. 1.6.M*VV Maximum demand +P [kW] of tariff M=[16] in previous billing
period
21. 1.8.0 Total energy +A [kWh], current value r r 3- r r -
22. 1.8.0*VV Total energy +A [kWh], value at the end of previous billing period r r 3- r r -
23. 1.8.T Total energy +A [kWh] of tariff T=[16], current value r r 3- r r -
24. 1.8.T*VV Total energy +A [kWh] of tariff T=[16], value at the end of
previous billing period
25. 1.9.0 Billing period energy +A [kWh], current value r r 3- r r -
r r 4-
r r 4-
r r 3- r r -
r r r
rw r rw r r r r r r r r r r
rw r r r rw r rw r r r r
r r r
rw r r
r r r r r r r r -
r r -
63

No. OBIS
Description
P M C F
DLMS/COSEM
LCD
62056-21
26. 1.9.0*VV Billing period energy +A [kWh], value of previous VV billing period r r 3- r r -
27. 1.9.T Billing period energy +A [kWh] of tariff T=[16], current value r r 3- r r -
28. 1.9.T*VV Billing period energy +A [kWh] of tariff T=[16], value of previous
billing period
29. 2.2.M Cumulative maximum demand -P [kW] of tariff M=[16] r r 4-
30. 2.4.0 Average demand -P [kW] of current integration period r r 5-
31. 2.5.0 Average demand -P [kW] of last integration period r r 3-
32. 2.6.M Maximum demand -P [kW] of tariff M=[16] in current billing period r r 4-
33. 2.6.M*VV Maximum demand -P [kW] of tariff M=[16] in previous billing
period
34. 2.8.0 Total energy -A [kWh], current value r r 3- r r -
35. 2.8.0*VV Total energy -A [kWh], value at the end of previous billing period r r 3- r r -
36. 2.8.T Total energy -A [kWh] of tariff T=[16], current value r r 3- r r -
37. 2.8.T*VV Total energy -A [kWh] of tariff T=[16], value at the end of
previous billing period
38. 2.9.0 Billing period energy -A [kWh], current value r r 3- r r -
39. 2.9.0*VV Billing period energy -A [kWh], value of previous billing period r r 3- r r -
40. 2.9.T Billing period energy -A [kWh] of tariff T=[16], current value r r 3- r r -
41. 2.9.T*VV Billing period energy -A [kWh] of tariff T=[16], value of previous
billing period
42. 15.2.M Cumulative maximum demand |P| [kW] of tariff M=[16] r r 4-
43. 15.4.0 Average demand |P| [kW] of current integration period r r 5-
44. 15.5.0 Average demand |P| [kW] of last integration period r r 3-
45. 15.6.M Maximum demand |P| [kW] of tariff M=[16] in current billing
period
46. 15.6.M*VV Maximum demand |P| [kW] of tariff M=[16] in previous billing
period
47. 15.8.0 Total energy |A| [kWh], current value r r 3- r r -
48. 15.8.0*VV Total energy |A| [kWh], value at the end of previous billing period r r 3- r r -
49. 15.8.T Total energy |A| [kWh] of tariff T=[16], current value r r 3- r r -
50. 15.8.T*VV Total energy |A| [kWh] of tariff T=[16], value at the end of
previous billing period
51. 15.9.0 Billing period energy |A| [kWh], current value r r 3- r r -
52. 15.9.0*VV Billing period energy |A| [kWh], value of previous billing period r r 3- r r -
53. 15.9.T Billing period energy |A| [kWh] of tariff T=[16], current value r r 3- r r -
54. 15.9.T*VV Billing period energy |A| [kWh] of tariff T=[16], value of previous
billing period
55. 3.2.M Cumulative maximum demand +Q [kvar] of tariff M=[16] r r 4-
56. 3.4.0 Average demand +Q [kvar] of current integration period r r 5-
57. 3.7.0 Instantaneous power +Q [kvar] r r 3- r r -
58. 3.5.0 Average demand +Q [kvar] of last integration period r r 3-
59. 3.6.M Maximum demand +Q [kvar] of tariff M=[16] in current billing
period
60. 3.6.M*VV Maximum demand +Q [kvar] of tariff M=[16] in previous billing
period
61. 3.8.0 Total energy +R [kvarh], current value r r 3- r r -
62. 3.8.0*VV Total energy +R [kvarh], value at the end of previous billing period r r 3- r r -
63. 3.8.T Total energy +R [kvarh] of tariff T=[16], current value r r 3- r r -
64. 3.8.T*VV Total energy +R [kvarh] of tariff T=[16], value of previous billing
period
65. 3.9.0 Billing period energy +R [kvarh], current value r r 3- r r -
66. 3.9.0*VV Billing period energy +R [kvarh], value of previous billing period r r 3- r r -
67. 3.9.T Billing period energy +R [kvarh] of tariff T=[16], current value r r 3- r r -
68. 3.9.T*VV Billing period energy +R [kvarh] of tariff T=[16], value of previous
billing period
69. 4.2.M Cumulative maximum demand -Q [kvar] of tariff M=[16] r r 4-
70. 4.4.0 Average demand -Q [kvar] of current integration period r r 5-
71. 4.5.0 Average demand -Q [kvar] of last integration period r r 3-
72. 4.6.M Maximum demand -Q [kvar] of tariff M=[16] in current billing
period
73. 4.6.M*VV Maximum demand -Q [kvar] of tariff M=[16] in previous billing
period
r r 3- r r -
r r r r r r r r -
r r 4-
r r 3- r r -
r r 3- r r -
r r 4-
r r 4-
r r 3- r r -
r r 3- r r -
r r 4-
r r 4-
r r 3- r r -
r r 3- r r -
r r 4-
r r 4-
r r -
r r r r r r r r -
r r -
r r r r -
r r r r -
r r -
r r r r r r r r -
r r -
64

No. OBIS
Description
P M C F
DLMS/COSEM
LCD
62056-21
74. 4.7.0 Instantaneous power -Q [kvar] r r 3- r r -
75. 4.8.0 Total energy -R [kvarh], current value r r 3- r r -
76. 4.8.0*VV Total energy -R [kvarh], value of previous billing period r r 3- r r -
77. 4.8.T Total energy -R [kvarh] of tariff T=[16], current value r r 3- r r -
78. 4.8.T*VV Total energy -R [kvarh] of tariff T=[16], value of previous billing
period
79. 4.9.0 Billing period energy -R [kvarh], current value r r 3- r r -
80. 4.9.0*VV Billing period energy -R [kvarh], value of previous billing period r r 3- r r -
81. 4.9.T Billing period energy -R [kvarh] of tariff T=[16], current value r r 3- r r -
82. 4.9.T*VV Billing period energy -R [kvarh] of tariff T=[16], value of previous
billing period
83. 5.4.0 Average demand Q1 [kvar] of current integration period r r 5-
84. 5.5.0 Average demand Q1 [kvar] of last integration period r r 3-
85. 5.6.M Maximum demand Q1 [kvar] of tariff M=[16] in current billing
period
86. 5.6.M*VV Maximum demand Q1 [kvar] of tariff M=[16] in previous billing
period
87. 5.8.0 Total energy R1 [kvarh], current value r r 3- r r -
88. 5.8.0*VV Total energy R1 [kvarh], value at the end of previous billing period r r 3- r r -
89. 5.8.T Total energy R1 [kvarh] of tariff T=[16], current value r r 3- r r -
90. 5.8.T*VV Total energy R1 [kvarh] of tariff T=[16], value of previous billing
period
91. 5.9.0 Billing period energy R1 [kvarh], current value r r 3- r r -
92. 5.9.0*VV Billing period energy R1 [kvarh], value of previous billing period r r 3- r r -
93. 5.9.T Billing period energy R1 [kvarh] of tariff T=[16], current value r r 3- r r -
94. 5.9.T*VV Billing period energy R1 [kvarh] of tariff T=[16], value of previous
billing period
95. 6.4.0 Average demand Q2 [kvar] of current integration period r r 5-
96. 6.5.0 Average demand Q2 [kvar] of last integration period r r 3-
97. 6.6.M Maximum demand Q2 [kvar] of tariff M=[16] in current billing
period
98. 6.6.M*VV Maximum demand Q2 [kvar] of tariff M=[16] in previous billing
period
99. 6.8.0 Total energy R2 [kvarh], current value r r 3- r r -
100. 6.8.0*VV Total energy R2 [kvarh], value at the end of previous billing period r r 3- r r -
101. 6.8.T Total energy R2 [kvarh] of tariff T=[16], current value r r 3- r r -
102. 6.8.T*VV Total energy R2 [kvarh] of tariff T=[16], value of previous billing
period
103. 6.9.0 Billing period energy R2 [kvarh], current value r r 3- r r -
104. 6.9.0*VV Billing period energy R2 [kvarh], value of previous billing period r r 3- r r -
105. 6.9.T Billing period energy R2 [kvarh] of tariff T=[16], current value r r 3- r r -
106. 6.9.T*VV Billing period energy R2 [kvarh] of tariff T=[16], value of previous
billing period
107. 7.4.0 Average demand Q3 [kvar] of current integration period r r 5-
108. 7.5.0 Average demand Q3 [kvar] of last integration period r r 3-
109. 7.6.M Maximum demand Q3 [kvar] of tariff M=[16] in current billing
period
110. 7.6.M*VV Maximum demand Q3 [kvar] of tariff M=[16] in previous billing
period
111. 7.8.0 Total energy R3 [kvarh], current value r r 3- r r -
112. 7.8.0*VV Total energy R3 [kvarh], value at the end of previous billing period r r 3- r r -
113. 7.8.T Total energy R3 [kvarh] of tariff T=[16], current value r r 3- r r -
114. 7.8.T*VV Total energy R3 [kvarh] of tariff T=[16], value of previous billing
period
115. 7.9.0 Billing period energy R3 [kvarh], current value r r 3- r r -
116. 7.9.0*VV Billing period energy R3 [kvarh], value of previous VV billing period r r 3- r r -
117. 7.9.T Billing period energy R3 [kvarh] of tariff T=[16], current value r r 3- r r -
118. 7.9.T*VV Billing period energy R3 [kvarh] of tariff T=[16], value of previous
billing period
119. 8.4.0 Average demand Q4 [kvar] of current integration period r r 5-
120. 8.5.0 Average demand Q4 [kvar] of last integration period r r 3-
121. 8.6.M Maximum demand Q4 [kvar] of tariff M=[16] in current billing r r 4-
r r 3- r r -
r r 3- r r -
r r r r -
r r 4-
r r 4-
r r 3- r r -
r r 3- r r -
r r 4-
r r 4-
r r 3- r r -
r r 3- r r -
r r 4-
r r 4-
r r 3- r r -
r r 3- r r -
r r -
r r -
r r r r r r -
r r -
r r r r r r -
r r -
r r r r r r -
65

No. OBIS
Description
P M C F
DLMS/COSEM
LCD
62056-21
period
122. 8.6.M*VV Maximum demand Q4 [kvar] of tariff M=[16] in previous billing
period
123. 8.8.0 Total energy R4 [kvarh], current value r r 3- r r -
124. 8.8.0*VV Total energy R4 [kvarh], value at the end of previous billing period r r 3- r r -
125. 8.8.T Total energy R4 [kvarh] of tariff T=[16], current value r r 3- r r -
126. 8.8.T*VV Total energy R4 [kvarh] of tariff T=[16], value of previous billing
period
127. 8.9.0 Billing period energy R4 [kvarh], current value r r 3- r r -
128. 8.9.0*VV Billing period energy R4 [kvarh], value of previous billing period r r 3- r r -
129. 8.9.T Billing period energy R4 [kvarh] of tariff T=[16], current value r r 3- r r -
130. 8.9.T*VV Billing period energy R4 [kvarh] of tariff T=[16], value of previous
billing period
131. 10.0.1 Billing period reset - w -
132. 11.0.0 Special days table - - 11- r r -
133. 13.0.0 Activity calendar - - 20- r r -
134. 13.7.0 Power factor cos(φ) r r 3-
135. 14.7.0 Frequency [Hz] r r 3-
136. 15.7.0 Instantaneous power |P| [kW] r r 3-
137. 16.7.0 Instantaneous power ±P [kW] r r 3-
138. 3.7.0 Instantaneous power +Q [kvar] r r 3-
139. 4.7.0 Instantaneous power -Q [kvar] r r 3-
140. 11.7.0 Instantaneous RMS value of current [A] r r 3-
141. 12.7.0 Instantaneous RMS value of voltage [V] r r 3-
142. 91.7.0 Instantaneous RMS value of current [A] in neutral r r 3-
143. 11.5.0 Average current [A] r r 3-
144. 12.5.0 Average voltage [V] r r 3-
145. 71.5.124 Average current THD r r 3-
146. 72.5.124 Average voltage THD r r 3-
147. 14.5.0 Average frequency [Hz] r r 3-
148. C.1.0 Meter serial number (same as OBIS = 0.0.0) r r 1r
149. C.1.1 Meter type r r 1r
150. C.1.2 Ordering code r r 1r
151. C.2.0 Parameterization counter r r 3-
152. C.5.0 Internal operating status r r 3- r r -
153. C.7.5 Power outage counter r r 3-
154. C.8.0 Time of operation r r 3-
155. C.8.T Time of operation of tariff T=[16] r r 3-
156. C.50.1*NN Active day program NN of energy tariffs r rw 1-
157. C.50.2*NN Active week program NN of energy tariffs r rw 1-
158. C.50.3*NN Active seasons NN of energy tariffs r rw 1-
159. C.51.1*NN Active day program NN of demand tariffs r rw 1-
160. C.51.2*NN Active week program NN of demand tariffs r rw 1-
161. C.51.3*NN Active seasons NN of demand tariffs r rw 1-
162. C.52.1*NN Passive day program NN of energy tariffs r rw 1-
163. C.52.2*NN Passive week program NN of energy tariffs r rw 1-
164. C.52.3*NN Passive seasons NN of energy tariffs r rw 1-
165. C.53.1*NN Passive day program NN of demand tariffs r rw 1-
166. C.53.2*NN Passive week program NN of demand tariffs r rw 1-
167. C.53.3*NN Passive seasons NN of demand tariffs r rw 1-
168. C.54.0*NN Permanent special days NN r rw 1-
169. C.54.1*NN Leap-special-days NN r rw 1-
170. C.55.0 Tariff configuration bits r rw 1-
171. C.55.1 Date and time of activation of passive tariff table r rw 1- rw r -
172. C.55.2 Name of passive tariff table r rw 1- rw r -
173. C.60.11 Event counter: change in number of phases r r 3-
174. C.60.12 Event counter: over-voltage r r 3-
175. C.60.13 Event counter: under-voltage r r 3-
176. C.60.14 Event counter: internal main relay r r 3-
177. C.60.20 Event counter: power over-limit r r 3-
178. C.60.21 Event counter: reverse current flow r r 3-
r r 4-
r r 3- r r -
r r 3- r r -
r r -
- - -
r r r r r r r r r r r r r r r r r r r r r r r r r r r r r r r
r r r
r r r
r r -
r r r r r r rw r rw r rw r rw r rw r rw r rw r rw r rw r rw r rw r rw r rw r rw r rw r -
r r r r r r r r r r r r -
66

No. OBIS
Description
P M C F
DLMS/COSEM
LCD
62056-21
179. C.60.22 Event counter: over-current r r 3-
180. C.60.30 Event counter: influence of magnetic field r r 3-
181. C.60.31 Event counter: opening of meter cover r r 3-
182. C.60.32 Event counter: opening of terminal cover r r 3-
183. C.60.40 Event counter: clock setting r r 3-
184. C.60.50 Event counter: internal error r r 3-
185. C.61.10 Event timer: power outage r r 3-
186. C.61.12 Event timer: over-voltage r r 3-
187. C.61.13 Event timer: under-voltage r r 3-
188. C.61.20 Event timer: power over-limit r r 3-
189. C.61.21 Event timer: reverse current flow r r 3-
190. C.61.22 Event timer: over-current r r 3-
191. C.61.30 Event timer: influence of magnetic field r r 3-
192. C.61.31 Event timer: opening of meter cover r r 3-
193. C.61.32 Event timer: opening of terminal cover r r 3-
194. C.62.10 Event status: power outage - - 3-
195. C.62.11 Event status: change in number of phases - - 3-
196. C.62.12 Event status: over-voltage - - 3-
197. C.62.13 Event status: under-voltage - - 3-
198. C.62.20 Event status: power over-limit - - 3-
199. C.62.21 Event status: reverse current flow - - 3-
200. C.62.22 Event status: over-current - - 3-
201. C.62.30 Event status: influence of magnetic field - - 3-
202. C.62.31 Event status: opening of meter cover - - 3-
203. C.62.32 Event status: opening of terminal cover - - 3-
204. C.62.40 Event status: clock setting - - 3-
205. C.62.41 Event status: parameter change - - 3-
206. C.69.1 Contractual power limit P
207. C.69.2*0 Limit values for over-voltage and under-voltage - rw 1-
208. C.69.2*1 Limit values for over-current in phase terminals - rw 1-
209. C.69.2*2 Limit values for over-current in neutral - rw 1-
210. C.70.0 Check sum of the firmware r r 1r
211. C.70.1 Parameterization ID r r 1-
212. C.70.2 Check sum of parameters r r 1-
213. C.80.0 User (collector) password for optical (local) interface - w 1-
214. C.80.1 User (collector) password for electrical (remote) interface - w 1-
215. C.80.2 Operator (management) password for optical (local) interface - w 1-
216. C.80.3 Operator (management) password for electrical (remote) interface - w 1-
217. C.81.0 Baud rate settings of communication interfaces r rw 1-
218. C.90.1 User configuration bits r rw 1- rw r -
219. C.90.2 Display and IEC 62056-21 communication formats r rw 1- rw r -
220. C.90.3 S0 ports configuration - rw 1- rw r -
221. C.90.4 Billing period end denied time - rw 1- rw r -
222. C.90.9 Mains relay output state r rw 1- rw r -
223. C.130.5 Daylight saving time - rw 1-
224. C.131.2 Capture list of load profile - rw 1-
225. C.132.0*N Display list N - rw 1-
226. C.133.0 Activation of display list - w 1-
227. C.134.0 Schedule of automatic billing period reset - rw 1-
228. F.F.0 Error code r r 3r
229. L.1.0*126 Billing profile - - 7-
230. P.1.0 Load profile r r 7-
231. P.97.0 Power failure (outage) event log r r 7-
232. P.98.11 Change in number of phases event log r r 7-
233. P.98.12 Voltage swell (Over-voltage) event log r r 7-
234. P.98.13 Voltage sag (Under voltage) event log r r 7-
235. P.98.14 Internal main relay event log r r 7-
236. P.98.20 Power over limit event log r r 7-
237. P.98.21 Reverse current flow event log r r 7-
238. P.98.22 Over-current event log r r 7-
239. P.98.30 Influence of magnetic field event log r r 7-
r rw 1-
lim
r r r r r r r r r r r r r r r r r r r r r r r r r r r r r r c c c c c c c c c c c c c c c c c c c c c c c c rw r rw r rw r rw r r r r
rw r r r w w w w w - w - rw r -
rw r rw r rw r w - rw r r r r
r r r r r r r r r r r r r r r r r r r r r r -
67

No. OBIS
Description
P M C F
DLMS/COSEM
LCD
62056-21
240. P.98.31 Opening of meter cover event log r r 7-
241. P.98.32 Opening of terminal cover event log r r 7-
242. P.98.40 Clock setting event log r r 7- r r -
243. P.98.41 Parameter change event log r r 7-
244. P.98.43 Failed authentication log r r 7-
245. P.98.50 Internal error event log r r 7-
246. P.98.51 Tariff changing event log r r 7-
247. P.98.52 Load profiles resets event log r r 7-
248. P.98.60 Firmware upgrade event log r r 7- r r r
249. 0.0.24.6.0 M-Bus speed - - 74- r r -
250. 0.0.24.6.128 M-Bus status - - 74- r r -
251. 0.1.24.1.0 1 M-Bus device settings - - 72- r r -
252. 0.1.24.2.1 1 M-Bus device register - - 4- r r -
253. 0.1.24.3.1 1 M-Bus device profile - - 7- r r -
254. 0.2.24.1.0 2 M-Bus device settings - - 72- r r -
255. 0.2.24.2.1 2 M-Bus device register - - 4- r r -
256. 0.2.24.3.1 2 M-Bus device profile - - 7- r r -
257. 0.3.24.1.0 3 M-Bus device settings - - 72- r r -
258. 0.3.24.2.1 3 M-Bus device register - - 4- r r -
259. 0.3.24.3.1 3 M-Bus device profile - - 7- r r -
260. 0.4.24.1.0 4 M-Bus device settings - - 72- r r -
261. 0.4.24.2.1 4 M-Bus device register - - 4- r r -
262. 0.4.24.3.1 4 M-Bus device profile - - 7- r r -
263. 0.5.24.1.0 5 M-Bus device settings - - 72- r r -
264. 0.5.24.2.1 5 M-Bus device register - - 4- r r -
265. 0.5.24.3.1 5 M-Bus device profile - - 7- r r -
266. 0.6.24.1.0 6 M-Bus device settings - - 72- r r -
267. 0.6.24.2.1 6 M-Bus device register - - 4- r r -
268. 0.6.24.3.1 6 M-Bus device profile - - 7- r r -
269. 0.7.24.1.0 7 M-Bus device settings - - 72- r r -
270. 0.7.24.2.1 7 M-Bus device register - - 4- r r -
271. 0.7.24.3.1 7 M-Bus device profile - - 7- r r -
272. 0.8.24.1.0 8 M-Bus device settings - - 72- r r -
273. 0.8.24.2.1 8 M-Bus device register - - 4- r r -
274. 0.8.24.3.1 8 M-Bus device profile - - 7- r r -
r r r r -
r r r r r r r r r r -
68
 Loading...