

Page 1
Henson 9000
Elektron Eye Technology Ltd.
Page 2

HENSON 9000
Elektron Eye Technology Ltd.
All rights reserved. No parts of this work may be reproduced in any form or by any
means - graphic, electronic, or mechanical, including photocopying, recording, taping,
or information storage and retrieval systems - without the written permission of the
publisher.
Products that are referred to in this document may be either trademarks and/or
registered trademarks of the respective owners. The publisher and the author make no
claim to these trademarks.
While every precaution has been taken in the preparation of this document, the
publisher and the author assume no responsibility for errors or omissions, or for
damages resulting from the use of information contained in this document or from the
use of programs and source code that may accompany it. In no event shall the
publisher and the author be liable for any loss of profit or any other commercial
damage caused or alleged to have been caused directly or indirectly by this document.
Printed: May 2018
The HENSON 9000 is manufactured in the United Kingdom by
Elektron Eye Technology Ltd.
Broers Building
J.J. Thomson Avenue
Cambridge
Cambridgeshire
CB3 0FA
Tel : 01223 371 000
Email: info@elektroneyetechnology.com
at our manufacturing site in South West London.
Elektron Eye Technology Ltd.
29 Central Avenue
West Molesey
Surrey
KT8 2RF
Page 3

Table of Contents
3Contents
Part I
............................................................................................................... 81
............................................................................................................... 92
............................................................................................................... 103
............................................................................................................... 124
............................................................................................................... 135
Part II
............................................................................................................... 151
............................................................................................................... 162
............................................................................................................... 173
............................................................................................................... 184
Part III
............................................................................................................... 201
............................................................................................................... 372
Welcome
Elektron company notices
Im portant warnings
Revision history
Help/Manual information
Acknowledgements
Quick start
Smart Supra Single Stimulus test
Smart Supra Multiple Stimulus test
ZATA Threshold test
Esterman Binocular Driving test
Visual field tests
Smart Supra tests
Multiple Stimu lu s
Pa tient instructio ns
Presenting and selecting different multiple st imulus
pattern s
Missed stimu li in multiple stimulus suprathreshold
test
Single Stimu lus
Standard a nd Mu lti-s ampling Algorithms
Pa tient instructio ns
Settin g the test in tensity
Single Stimu lus a lgo rithm
Multiple Stimu lu s algorithm
Test O pti on s
Exten din g th e test
Adding and correctin g presentations
Changin g the supra-th reshold increment
Analysing the res ults
Toolbar
ZATA Threshold test
Blind spot
Exten din g th e 24-2 test
Fovea mea su remen t
Global In dices
Mean D efect
Standard Deviation
Hemifield Test
Outpu ts
Threshold/gray sca le
Total Deviation
Pa ttern Deviation
Prin tou t
7
14
19
21
22
23
24
25
26
27
28
29
30
31
32
33
34
35
36
38
39
40
41
42
43
44
45
46
47
48
50
© 2 01 8 E le kt ro n Ey e Te ch n o l o g y© 2 01 8 E le kt ro n Ey e Te ch n o l o g y
Page 4

Henson 9000 Perimeter User Manual 4
............................................................................................................... 603
Part IV
............................................................................................................... 661
............................................................................................................... 702
............................................................................................................... 713
............................................................................................................... 724
............................................................................................................... 735
............................................................................................................... 746
............................................................................................................... 757
............................................................................................................... 768
............................................................................................................... 779
............................................................................................................... 7810
............................................................................................................... 7911
............................................................................................................... 8012
............................................................................................................... 8113
............................................................................................................... 8214
Pro gression: Rate o f chang e
GSS II
Prin tin g
Pa tient instructio ns
Stimulus locatio ns
Entering patien t details
ZATA con trols
Esterman Binocular Driving tests
Pa tient Instruction s
Options
Stimulus locatio ns
General information
Preparing the patient
Ali gn in g th e patient
Pa tient Instruction s
Refractive correction
Auto timing
Catch trials
Changing eyes
Demonstrating the test
Entering patient data
Entering the patient's date of birth
Fixation targets
Help facility
Help Rx
Printing the results of a field test
Response button
Saving visual field data
Video camera
51
53
54
55
56
57
59
61
62
63
64
67
68
69
Part V
............................................................................................................... 841
............................................................................................................... 862
............................................................................................................... 873
............................................................................................................... 884
............................................................................................................... 895
............................................................................................................... 906
............................................................................................................... 917
............................................................................................................... 928
............................................................................................................... 939
Part VI
............................................................................................................... 961
............................................................................................................... 972
............................................................................................................... 983
Options program
Tests
Computer
Database
Backup
Video setup
Integration
PDF
Save/Cancel
Registration and licencing
Database program
Backup copy of the database
Changing the active database
Deleting a record from the database
83
95
© 2 01 8 E le kt ro n Ey e Te ch n o l o g y
Page 5

5Contents
............................................................................................................... 994
............................................................................................................... 1005
............................................................................................................... 1016
............................................................................................................... 1027
............................................................................................................... 1038
............................................................................................................... 1049
............................................................................................................... 10510
............................................................................................................... 10611
............................................................................................................... 10712
............................................................................................................... 10813
Part VII
............................................................................................................... 1111
............................................................................................................... 1122
............................................................................................................... 1133
............................................................................................................... 1144
............................................................................................................... 1155
............................................................................................................... 1166
Editing data in the database
Visual field chart
Finding a record in the database
List/Tree views
Im port records
Moving through the database
Im age files
Printing a database record
Saving records in database
Progression analysis
Glaucoma Staging System: GSS II
Utilities program
Opening an existing visual field database
Creating a new visual field database
Copying a visual field database
Merging databases
Transferring records between databases
Im port Henson 6000 records
109
110
Part VIII
Appendix 1 - 9000 technical
specification
Part IX
Appendix 2 - 9000 connection
details
Part X Appendix 3 - Installation
Part XI Appendix 4 - Maintenance and
warranty
............................................................................................................... 1281
............................................................................................................... 1322
............................................................................................................... 1333
............................................................................................................... 1344
............................................................................................................... 1355
............................................................................................................... 1366
............................................................................................................... 1377
Regular inspection and m aintenance
Upgrading the software
Cleaning
Preventative maintenance
Replacement parts
Repairs and recalibration
Warranty
Part XII Appendix 5 - Troubleshooting
............................................................................................................... 1391
............................................................................................................... 1402
............................................................................................................... 1413
............................................................................................................... 1424
............................................................................................................... 1435
Background out of tolerance
Bowl error
LED error
Chinrest
Key violation
117
120
121
127
138
© 2 01 8 E le kt ro n Ey e Te ch n o l o g y© 2 01 8 E le kt ro n Ey e Te ch n o l o g y
Page 6

Henson 9000 Perimeter User Manual 6
............................................................................................................... 1446
Part XIII
Part XIV
Part XV
Database errors
Test n ot recognised
Database B ackup not ava ilable
Appendix 6 - License file
Appendix 7 - Networking
Appendix 8 - Practice
management integration
Index
145
146
147
148
149
153
© 2 01 8 E le kt ro n Ey e Te ch n o l o g y
Page 7
7Welcome
To find out more about Henson perimeters visit our website:
http://www.elektron-eye-technology.com
or scan the QR code opposite.
1
Welcome
Henson 9000 Perimeter
E le k tr o n E ye T ec h n o lo g y 2 0 18
Page 8

8
Henson 9000 Perimeter User Manual
1. 1
Elektron company notices
The Henson 9000 is manufactured in the United Kingdom by
Elektron Technology UK Ltd.,
Broers Building,
J.J. Thomson Avenue,
Cambridge.
CB3 0FA
The Henson unit must be used in accordance with the operating instructions.
Please read the instructions before attempting operation.
The instructions in this guide are to be viewed as an accompaniment to correct training on this
equipment.
Contact your sales agent for details of on-site training or contact the manufacturer for details of
training videos and webinar training sessions.
The results of a test are only to be analysed by a suitable qualified person, and it is the
responsibility of the practice manager/owner to ensure that only suitably trained personnel are
operating this equipment.
The only warranties for Elektron Eye Technology UK Ltd. products and services are set forth in
the express warranty statements accompanying such products and services. Nothing herein
should be construed as constituting an additional warranty.
This symbol on the product or on its packaging indicates that to preserve the
environment, this product must be recycled after its useful life as required by law and must not
be disposed of with your household or commercial waste. It is your responsibility to dispose of
your waste electrical and electronic equipment by handing it over to a designated collection
point for the proper recycling of such equipment. The separate collection and recycling of your
waste equipment at the time of disposal will help to conserve natural resources and ensure that
it is recycled in a manner that protects human health and the environment. For more
information about the authorised collection location nearest to you, please contact your local
city office, your household waste disposal service or the agent from whom you purchased the
product.
E le k tr o n E ye T ec h n o lo g y 2 0 18
Page 9
9Welcome
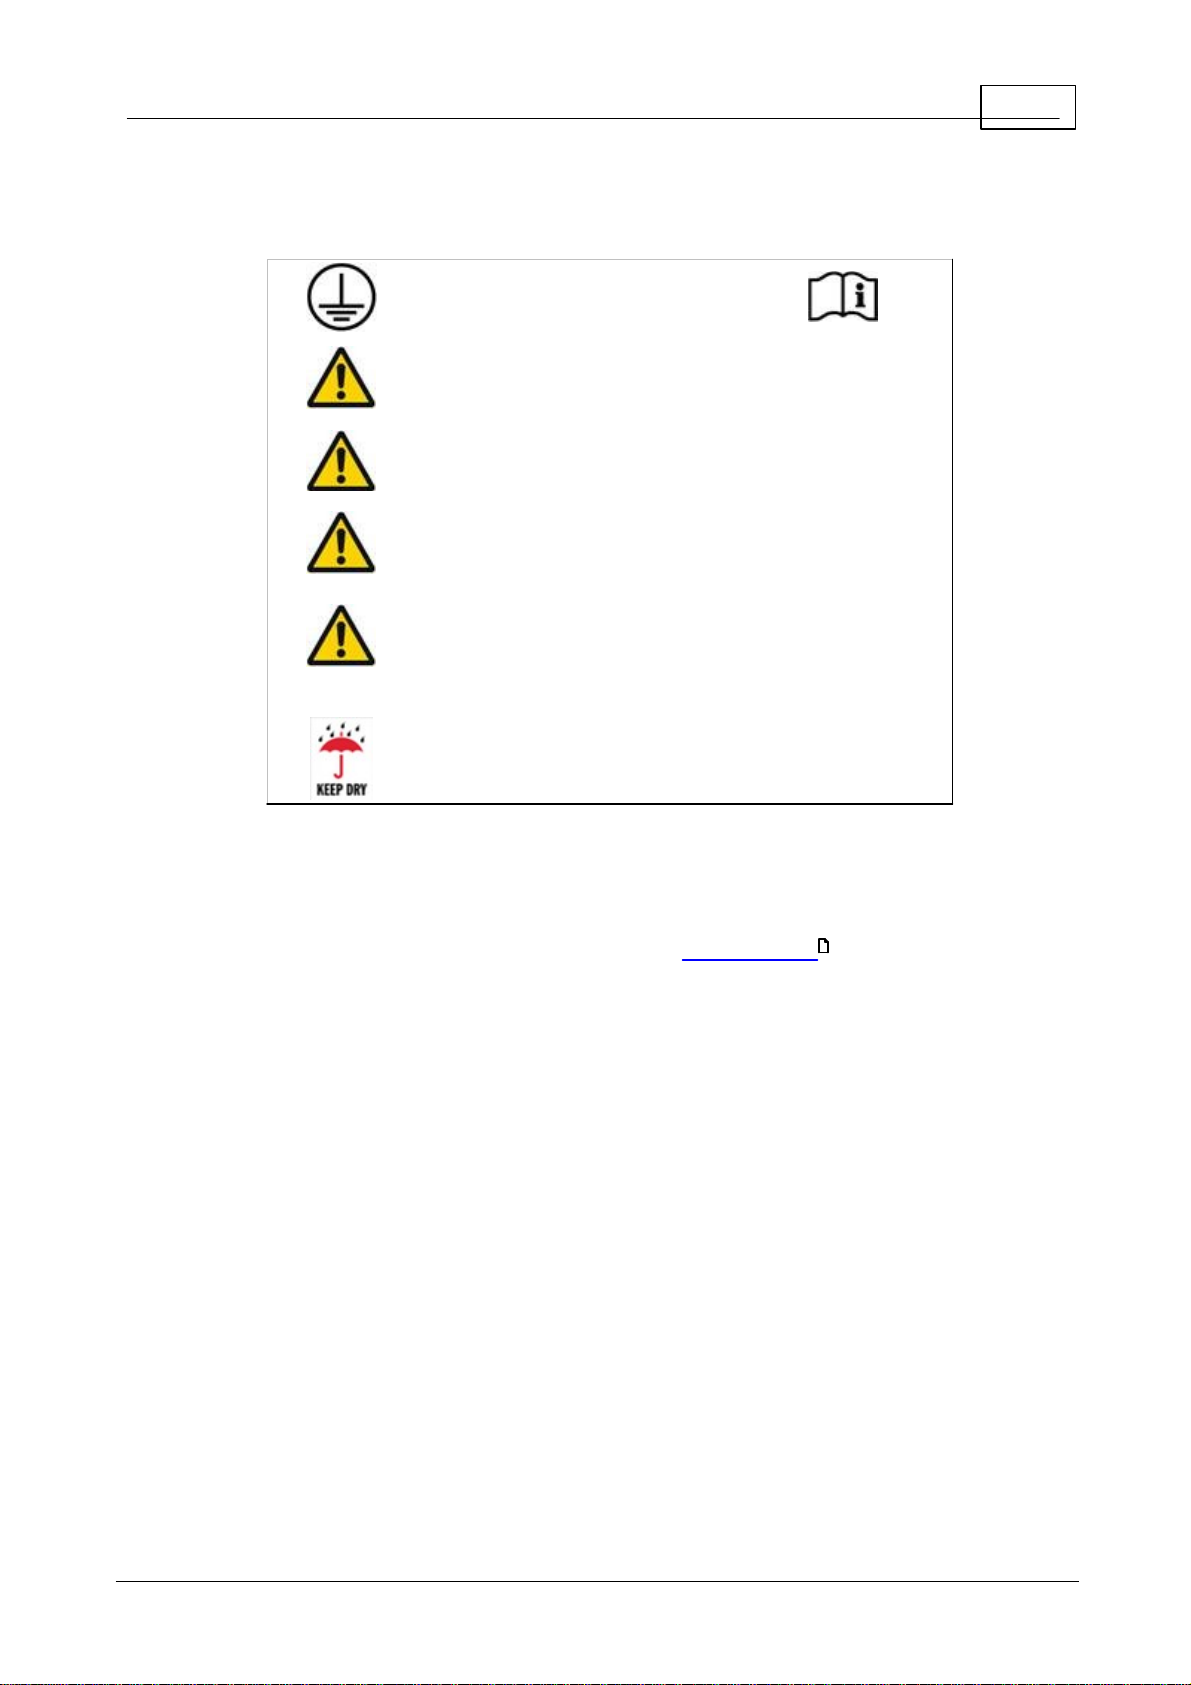
This unit must be connected
to an earthed electricity
supply
Hazardous voltages are
present inside this unit. No
user-serviceable parts inside
No modification of this
equipment is allowed
This equipment is not
suitable for use in an oxygen
rich environment
The instrument is not
suitable for operation in
environments where
handling of fluids is normal
use.
This equipment should be
kept dry at all times
1. 2
Important warnings
Backing up your data
It is strongly recommended that you regularly back up the database of patient records on an
external hard drive, or other suitable removable media, to avoid any possibility of data loss.
This simple procedure is described later in this manual in Database Backup .
96
Allergy advice
The chin and head rest pads are made from a low allergy Silicone, but you should check with
the patient that the do not have an allergy to silicone before allowing them to touch the
Henson.
E le k tr o n E ye T ec h n o lo g y 2 0 18
Page 10
10
Release
Date
Change
Version 1.0
August 2013
New version for V2.0 software
Version 1.1
May 2014
For version 2.1 onwards software
Version 1.2
July 2014
Additional Installation Information
added
Version 1.3
October 2014
Updated information on supra
threshold tests, database operations
and general formatting.
Version 1.4
May 2015
Changes to patient instructions in
the first person. Additional
formatting changes and corrections.
Version 1.5
November
2015
Added Progression information to
coincide with Version 3.4 Software
release
Version 1.6
April 2017
Changes for Version 3.5 Software
release - addition of integration,
changes to Database images,
additional language support.
Version 1.7
May 2018
Changes for Version 4.0 Software
release - new GUI for all test
programs, changes to suprathreshold programs. Elektron Eye
Technology branding applied.
Henson 9000 Perimeter User Manual
1. 3
Revision history
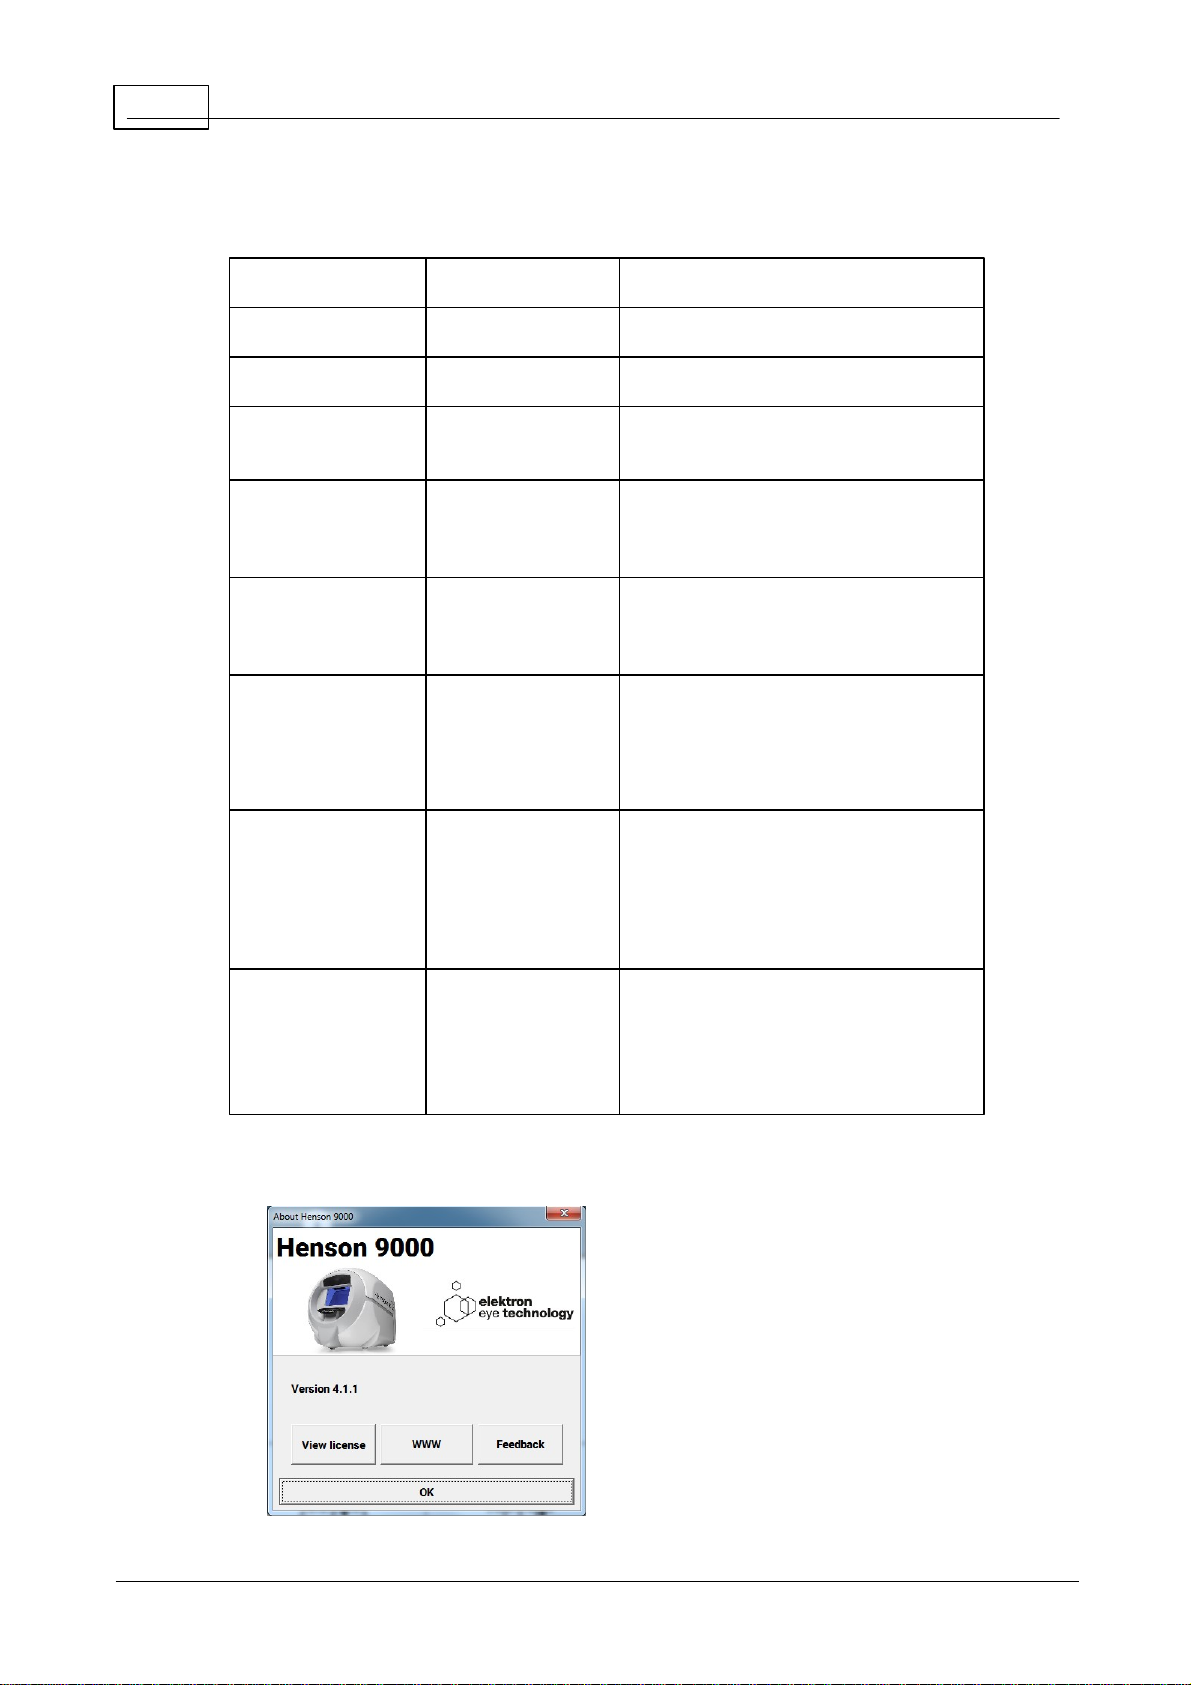
To determine the version of installed software, click ABOUT on the main menu.
E le k tr o n E ye T ec h n o lo g y 2 0 18
Page 11

To send Feedback, click the feedback button and enter details in the box.
Pressing send will generate an email with the files attached.
Information for the software Versions after the 3.5 release
The release version of software called 3.5 contained some important changes to the way
the software operates. These may not affect your operation of the instrument if you do not
use the database or have any practice management integration, but it is important that you
understand them if you do.
The previous versions of the software stored a PDF copy of the printout alongside the
database in an images folder.
The image stored is now a JPEG picture file. The database will operate in the same way as
before except that the 2 eyes plots (threshold tests) are shown on different tabs.
11Welcome
The quality of the JPEG picture file can be set in the options program.
If you currently use the PDF file for another reason, and the JPEG file cannot be substituted
then an additional PDF file can still be created when saving. The location for this can be set
in the options program (PDF tab )
91
E le k tr o n E ye T ec h n o lo g y 2 0 18
Page 12
12
Consult manual
WEEE Directive
0
1
Power Off (0)
Power On (1)
Type B Applied Part
Hazardous voltage
CE mark
USB
Protective earth
AC Mains
Henson 9000 Perimeter User Manual
1. 4
Help/Manual information
Many of the images in this help manual have 'hot spots'. If you place the cursor over one of
these and click then you will jump to a new page giving further information on a topic.
Some of the screen shots in this manual may differ slightly from the software installed on your
machine.
The information contained in this manual is subject to change without notice.
All rights reserved. Reproduction, translation, or adaptation of this manual without prior written
permission of Elektron Technology UK Ltd. is prohibited, except as allowed under copyright
laws.
Elektron Technology UK Ltd. shall not be liable for technical or editorial errors or omissions
contained herein.
The following symbols are used in the manual and on the instrument.
E le k tr o n E ye T ec h n o lo g y 2 0 18
Page 13

13Welcome
1. 5
Acknowledgements
Microsoft, Windows, Windows 7 and Windows 8 and Windows 10 are registered trademarks of
Microsoft Corporation.
Adobe and Acrobat (R) reader(R) are registered trademarks of Adobe systems.
E le k tr o n E ye T ec h n o lo g y 2 0 18
Page 14

14
Henson 9000 Perimeter User Manual
2
Quick start
To start a visual field test or one of the menu bar items click over that item on the start-up
screen.
To get more help on an item in the start-up screen click that item on the image below.
See Appendix 3 for installing and setting up the software.
121
E le k tr o n E ye T ec h n o lo g y 2 0 18
Page 15
15Quick start
2. 1
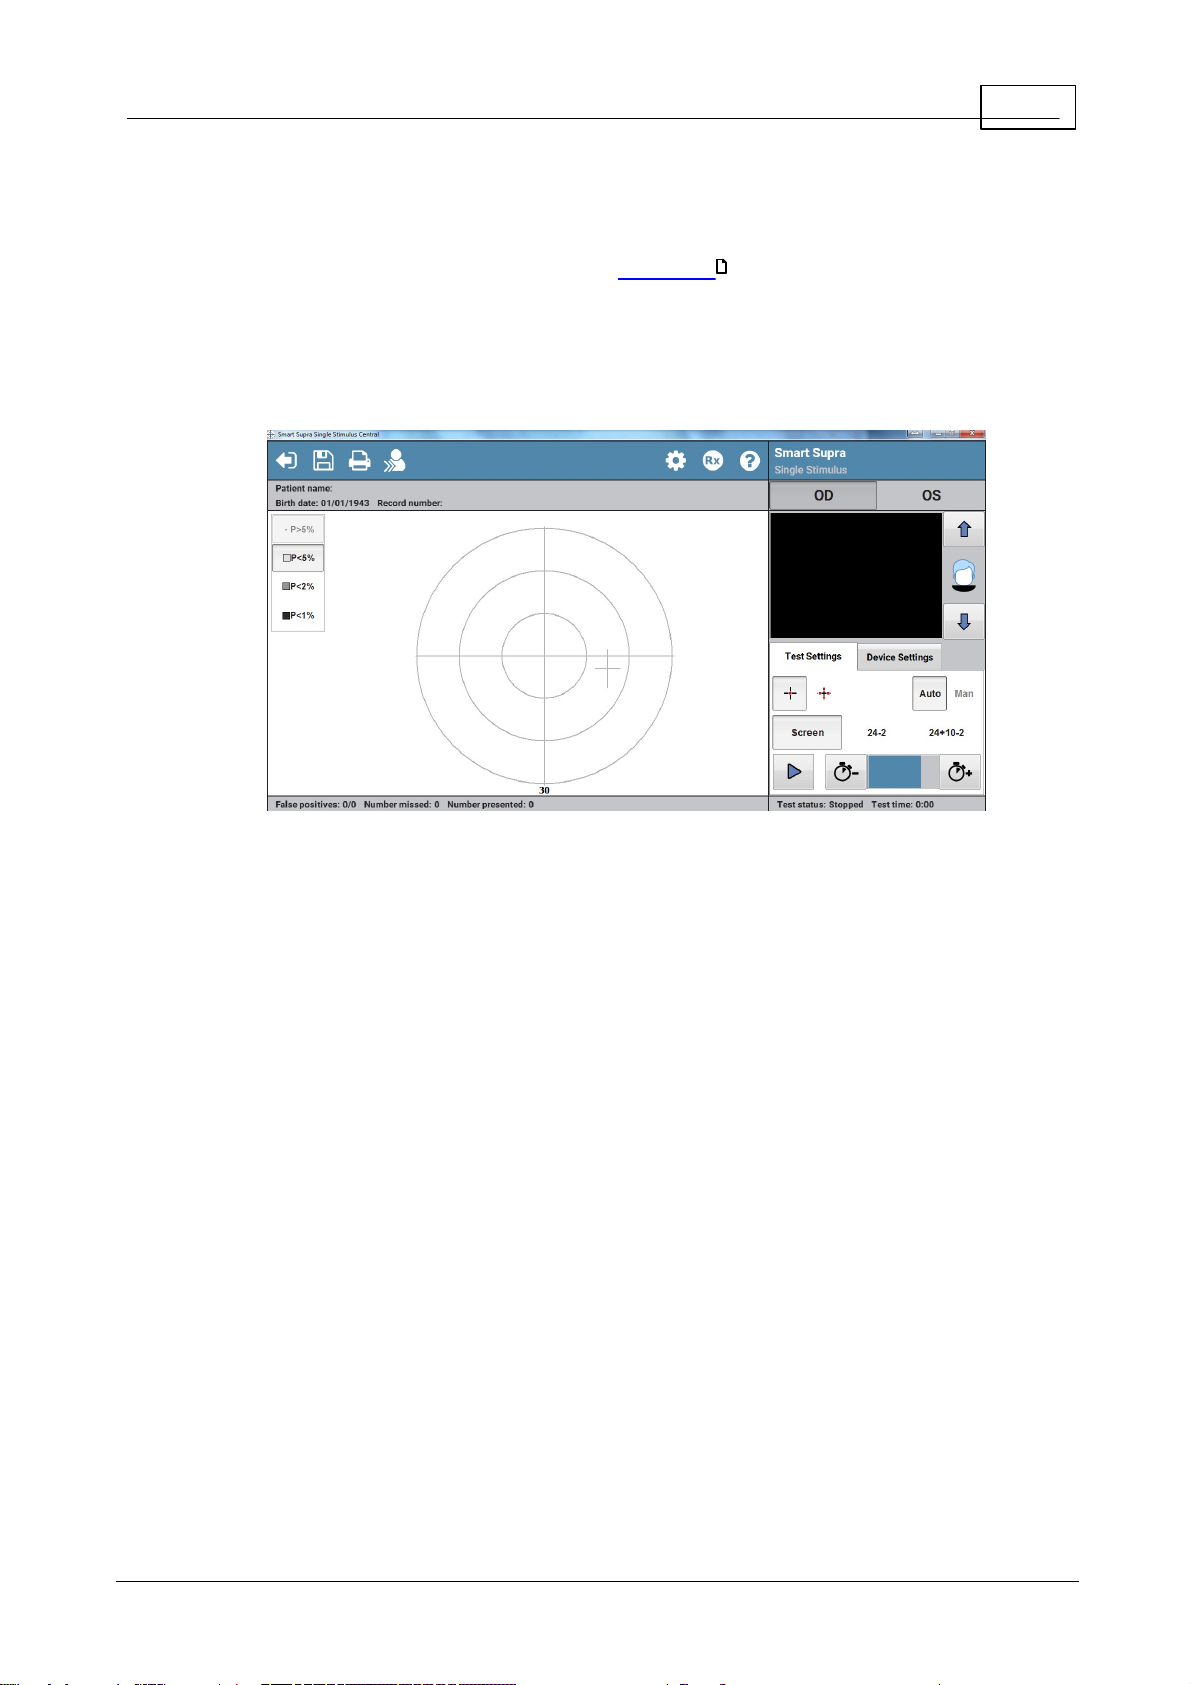
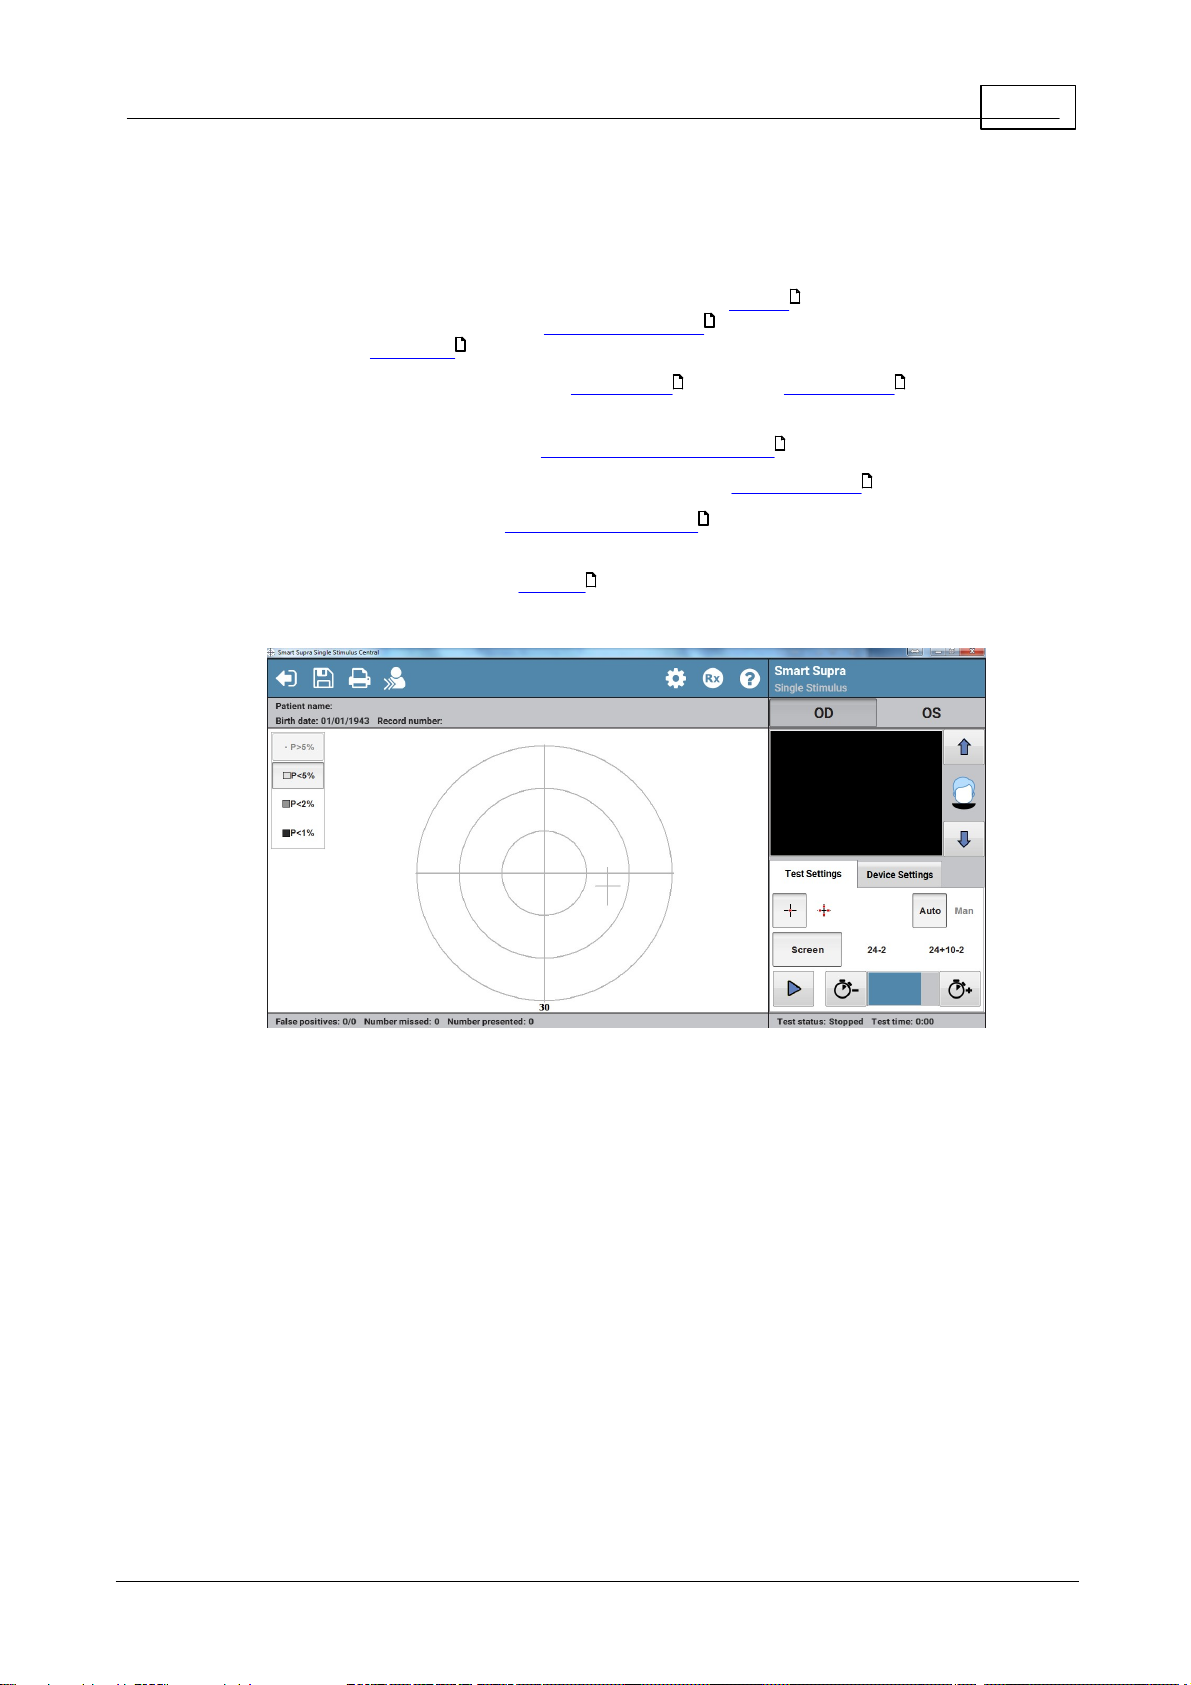
Smart Supra Single Stimulus test
After selecting the test and entering the patient's date of birth you will be presented with
the Smart Supra Single Stimulus test screen below.
75
To get m ore help on a test screen item click over the item in the im age below.
E le k tr o n E ye T ec h n o lo g y 2 0 18
Page 16
16
Henson 9000 Perimeter User Manual
2. 2
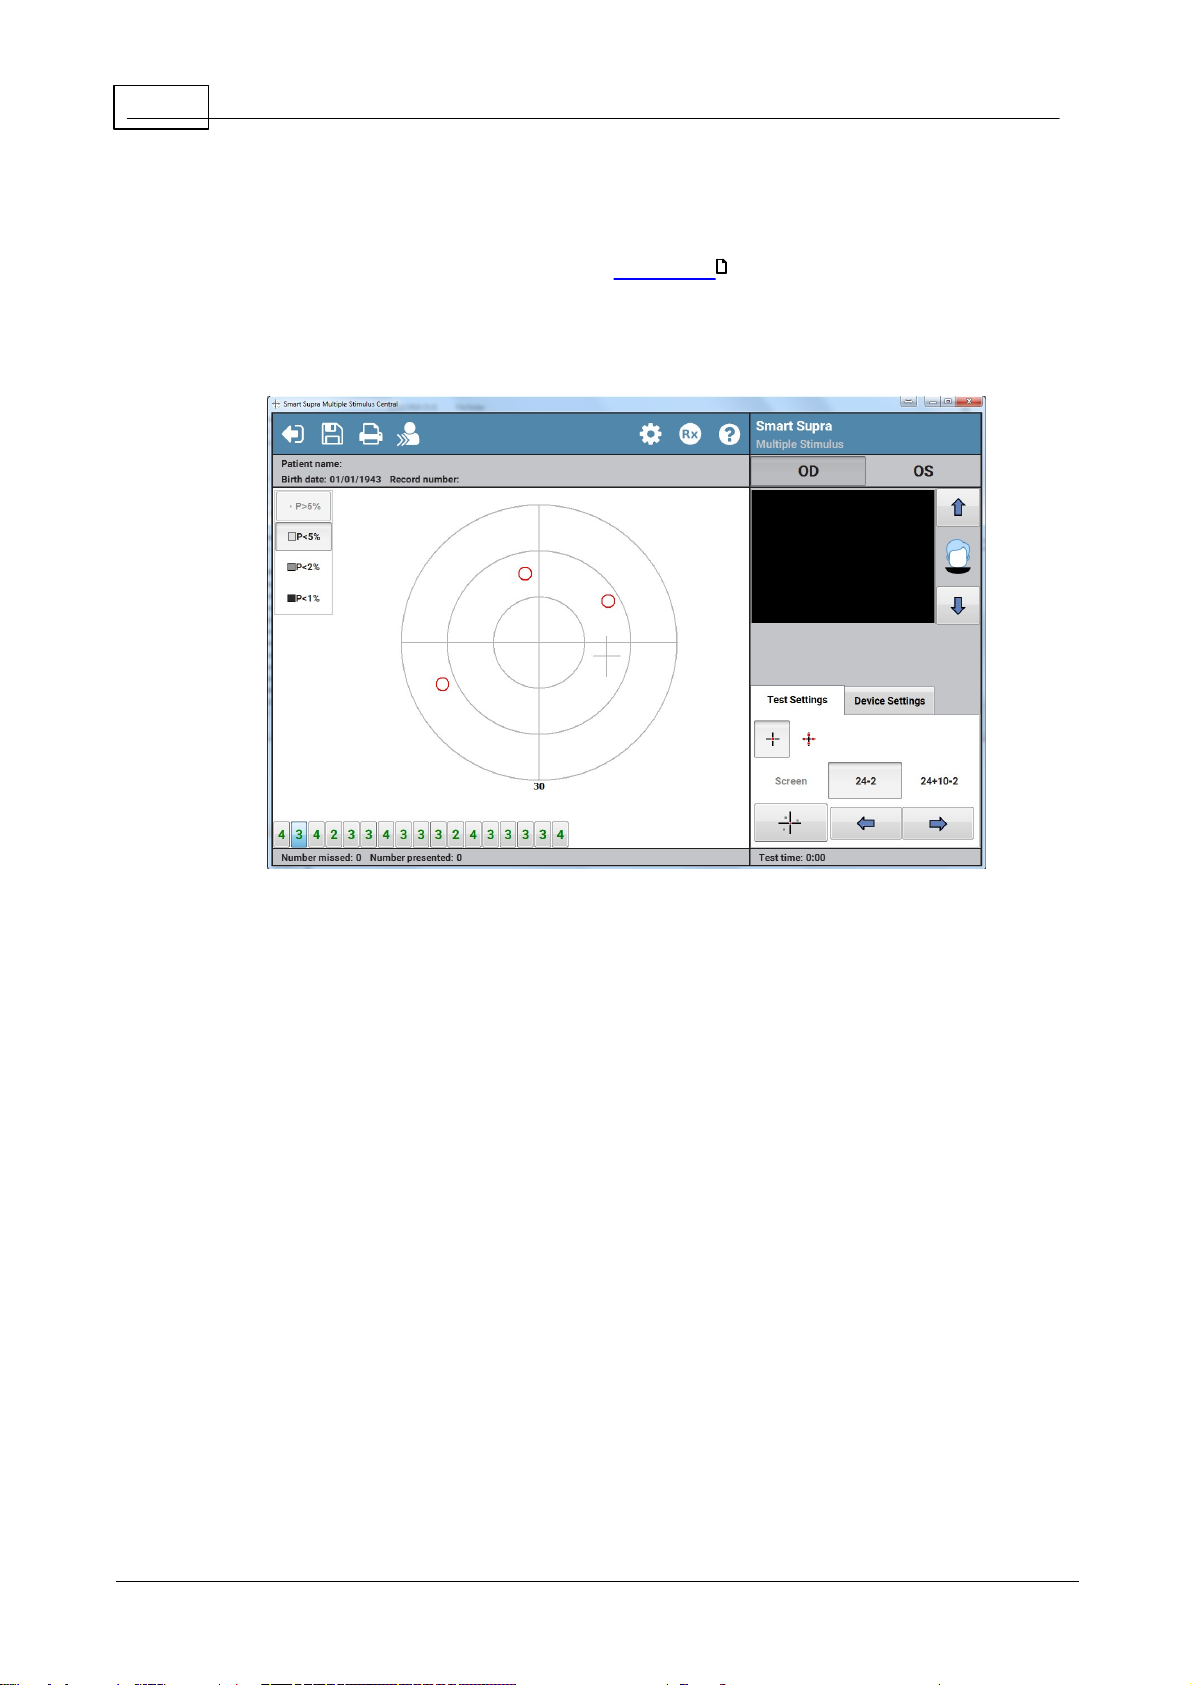
Smart Supra Multiple Stimulus test
After selecting the test and entering the patient's date of birth you will be presented with
the Smart Supra Multiple Stimulus test screen below.
75
To get m ore help on a test screen item click over the item in the im age below.
E le k tr o n E ye T ec h n o lo g y 2 0 18
Page 17
17Quick start
2. 3
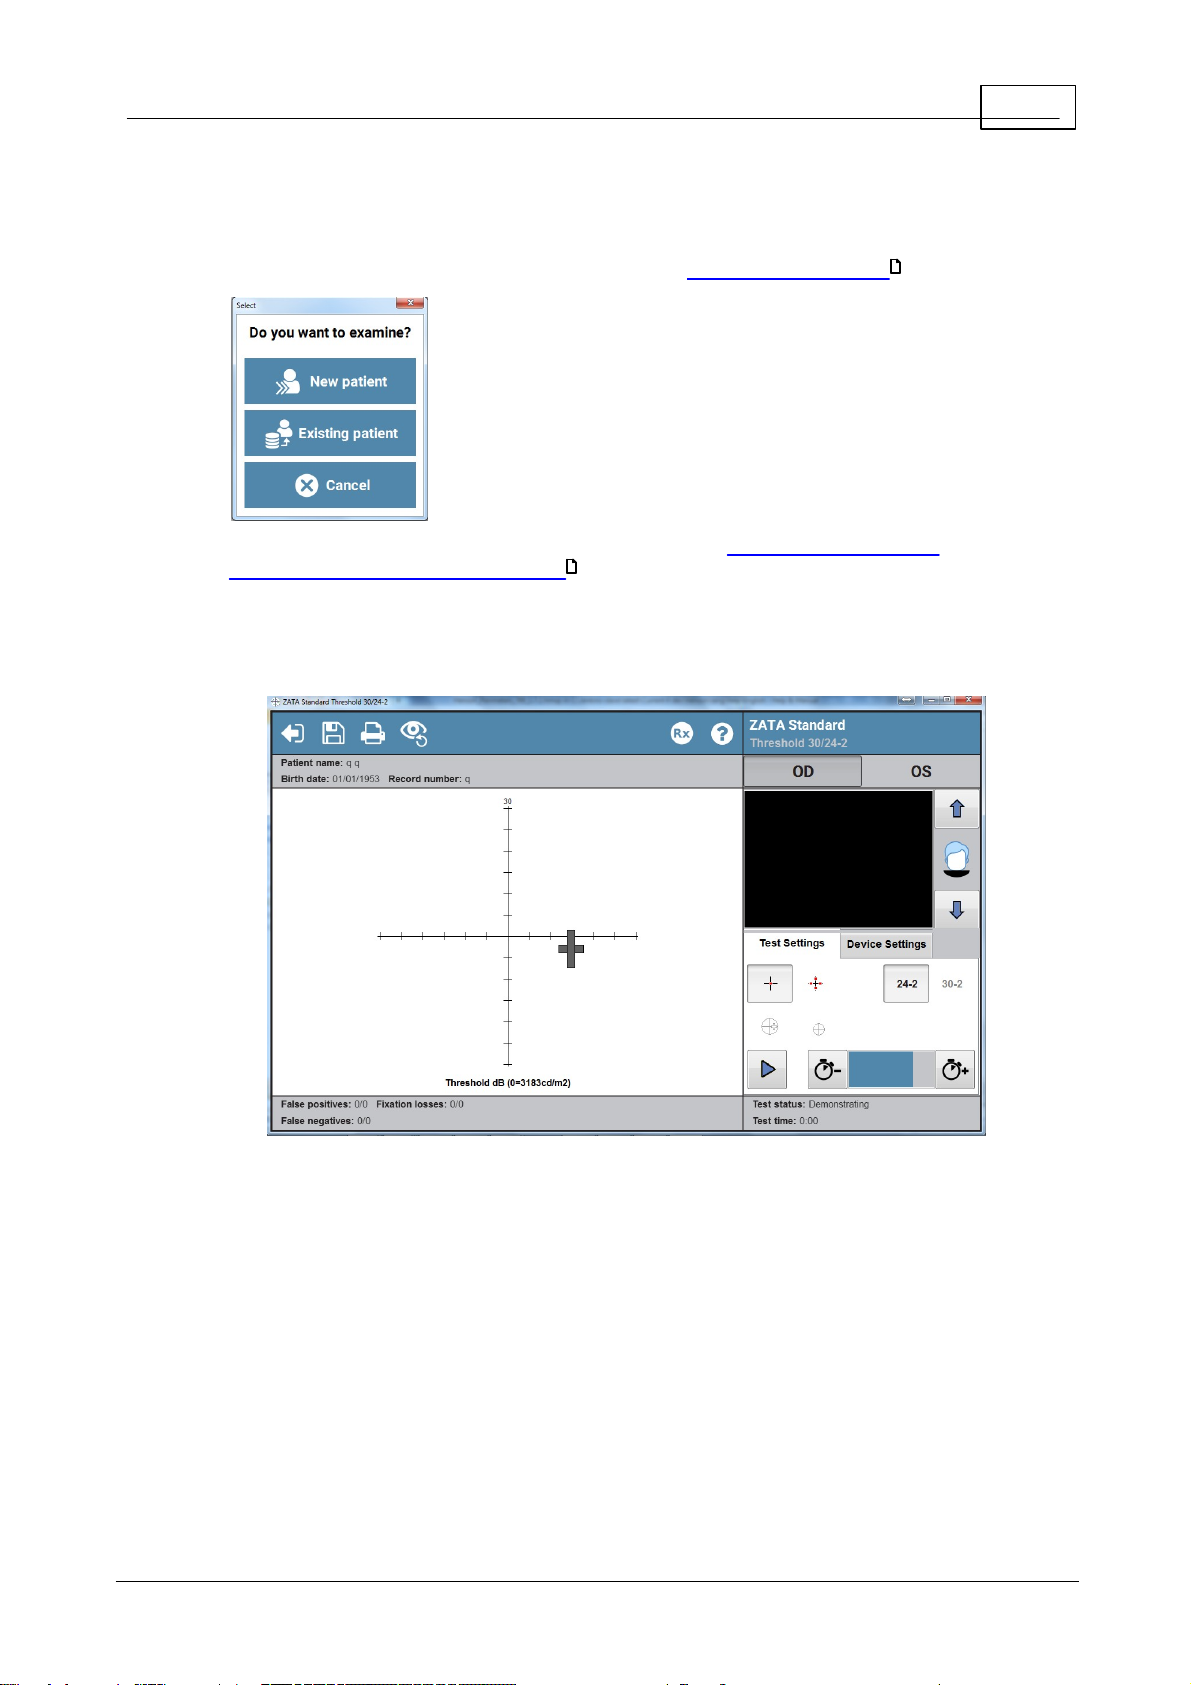
ZATA Threshold test
After selecting the test, you will be asked whether this is a new or an existing patient .
Depending on your response you will then either need to enter patient details or select the
specific patient's details from the database . Once this has been done you will be presented
57
with the ZATA Threshold test screen below.
57
To get m ore help on a test screen item click over the item in the im age below.
E le k tr o n E ye T ec h n o lo g y 2 0 18
Page 18
18
Henson 9000 Perimeter User Manual
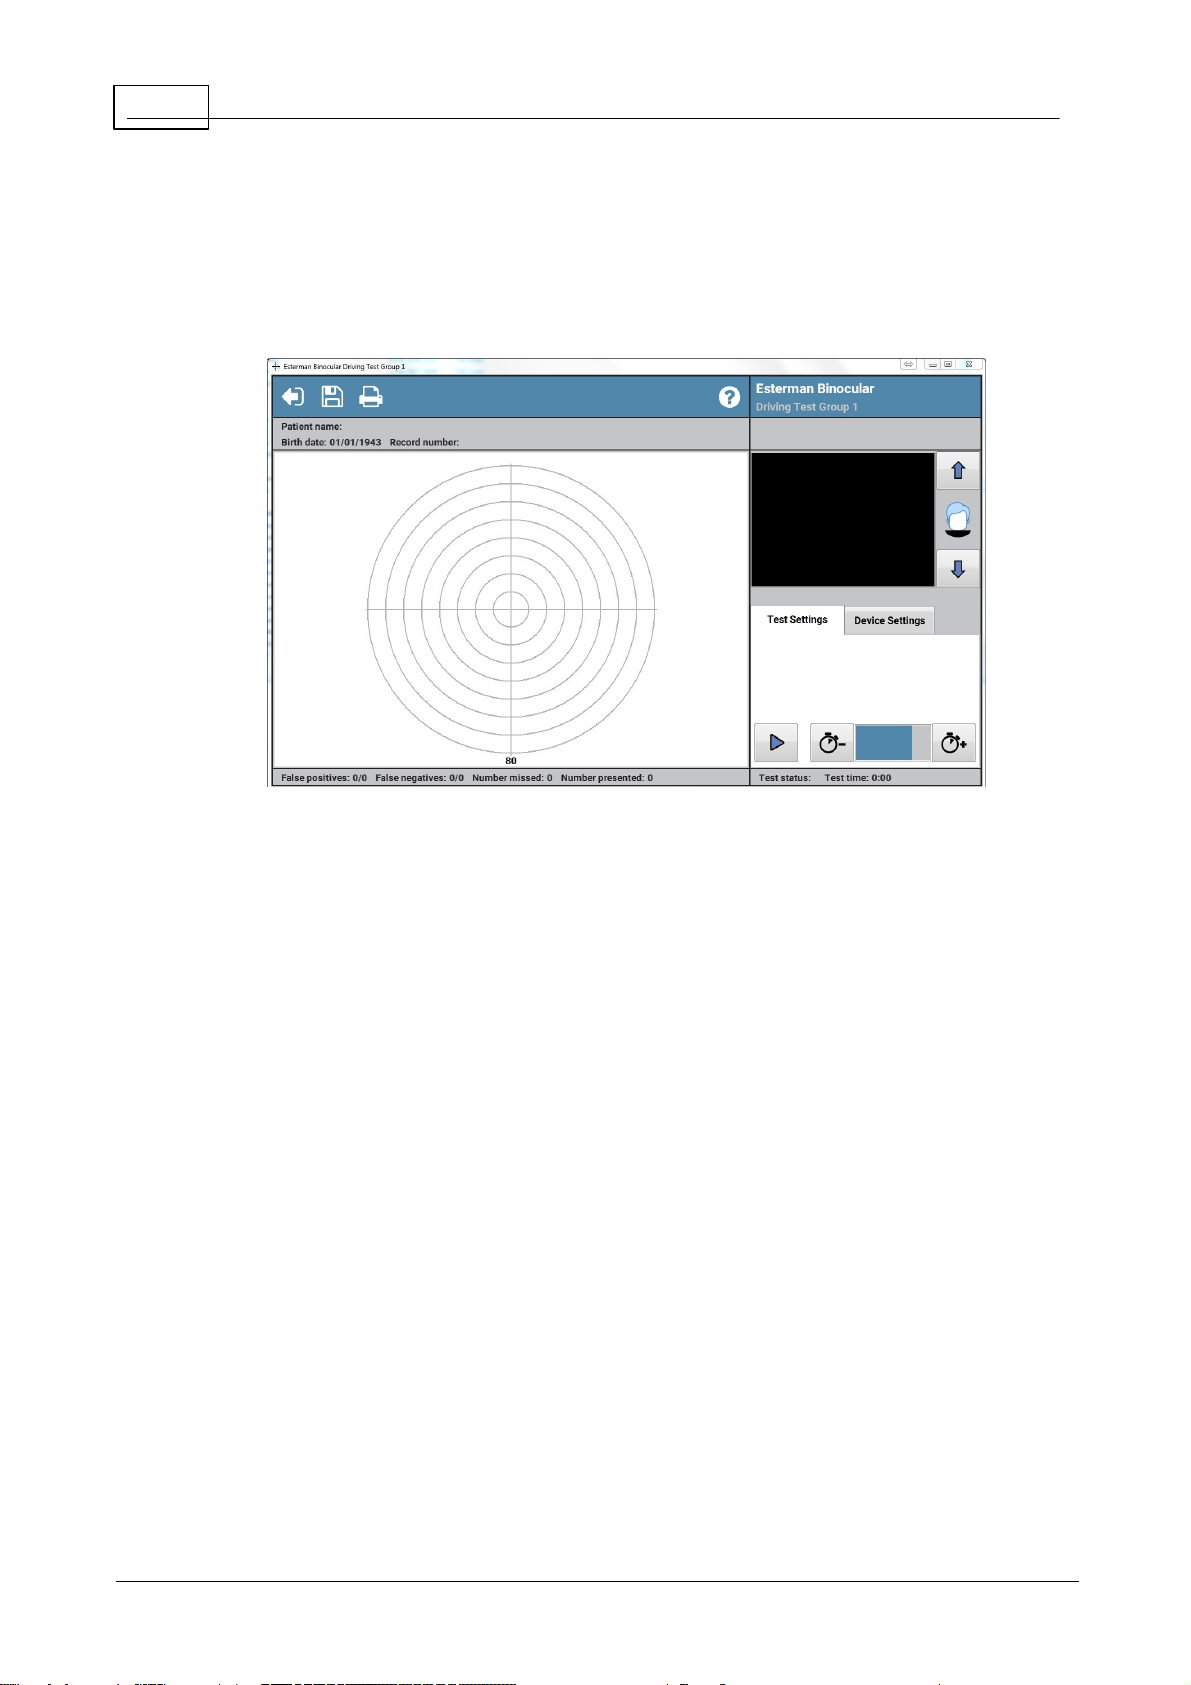
2. 4
Esterman Binocular Driving test
After selecting the relevant Group 1 or Group 2 test you will be presented with the test screen
below.
To obtain more help on a test screen item click over the item in the image below.
E le k tr o n E ye T ec h n o lo g y 2 0 18
Page 19
19Visual field tests
3
Visual field tests
The following visual field tests are available with the Henson 9000:
Smart Supra Single Stimulus : Choose this test to screen large
25 25
numbers of patients. It is a fully automated test where the patient presses a response
button every time they see a stimulus.
Smart Supra Multiple Stimulus : Choose this if speed is important.
80
21 21
It is approximately twice as fast as the single stimulus strategy in patients with little or
no defect. This is a Semi-Automated test.
ZATA Threshold (Zippy Adaptive Threshold Algorithm): This strategy
37
replaces the classic Full threshold algorithm. It is much faster than the Full and Fast
Threshold programs and will normally be the program of choice for monitoring visual
field loss. The ZATA program uses a Bayesian algorithm and adaptive terminating
criteria to make the best use of prior data. This is a fully automated test where the
patient presses a response button every time they see a stimulus.
Esterman Binocular Driving Test : The Drivers Test program is
80
60
designed to see whether or not a patient meets the UK DVLA visual field requirements
for Group 1 and Group 2 driving. Again, this is a fully automated test where the patient
presses a response button every time they see a stimulus.
80
E le k tr o n E ye T ec h n o lo g y 2 0 18
Page 20
20
Henson 9000 Perimeter User Manual
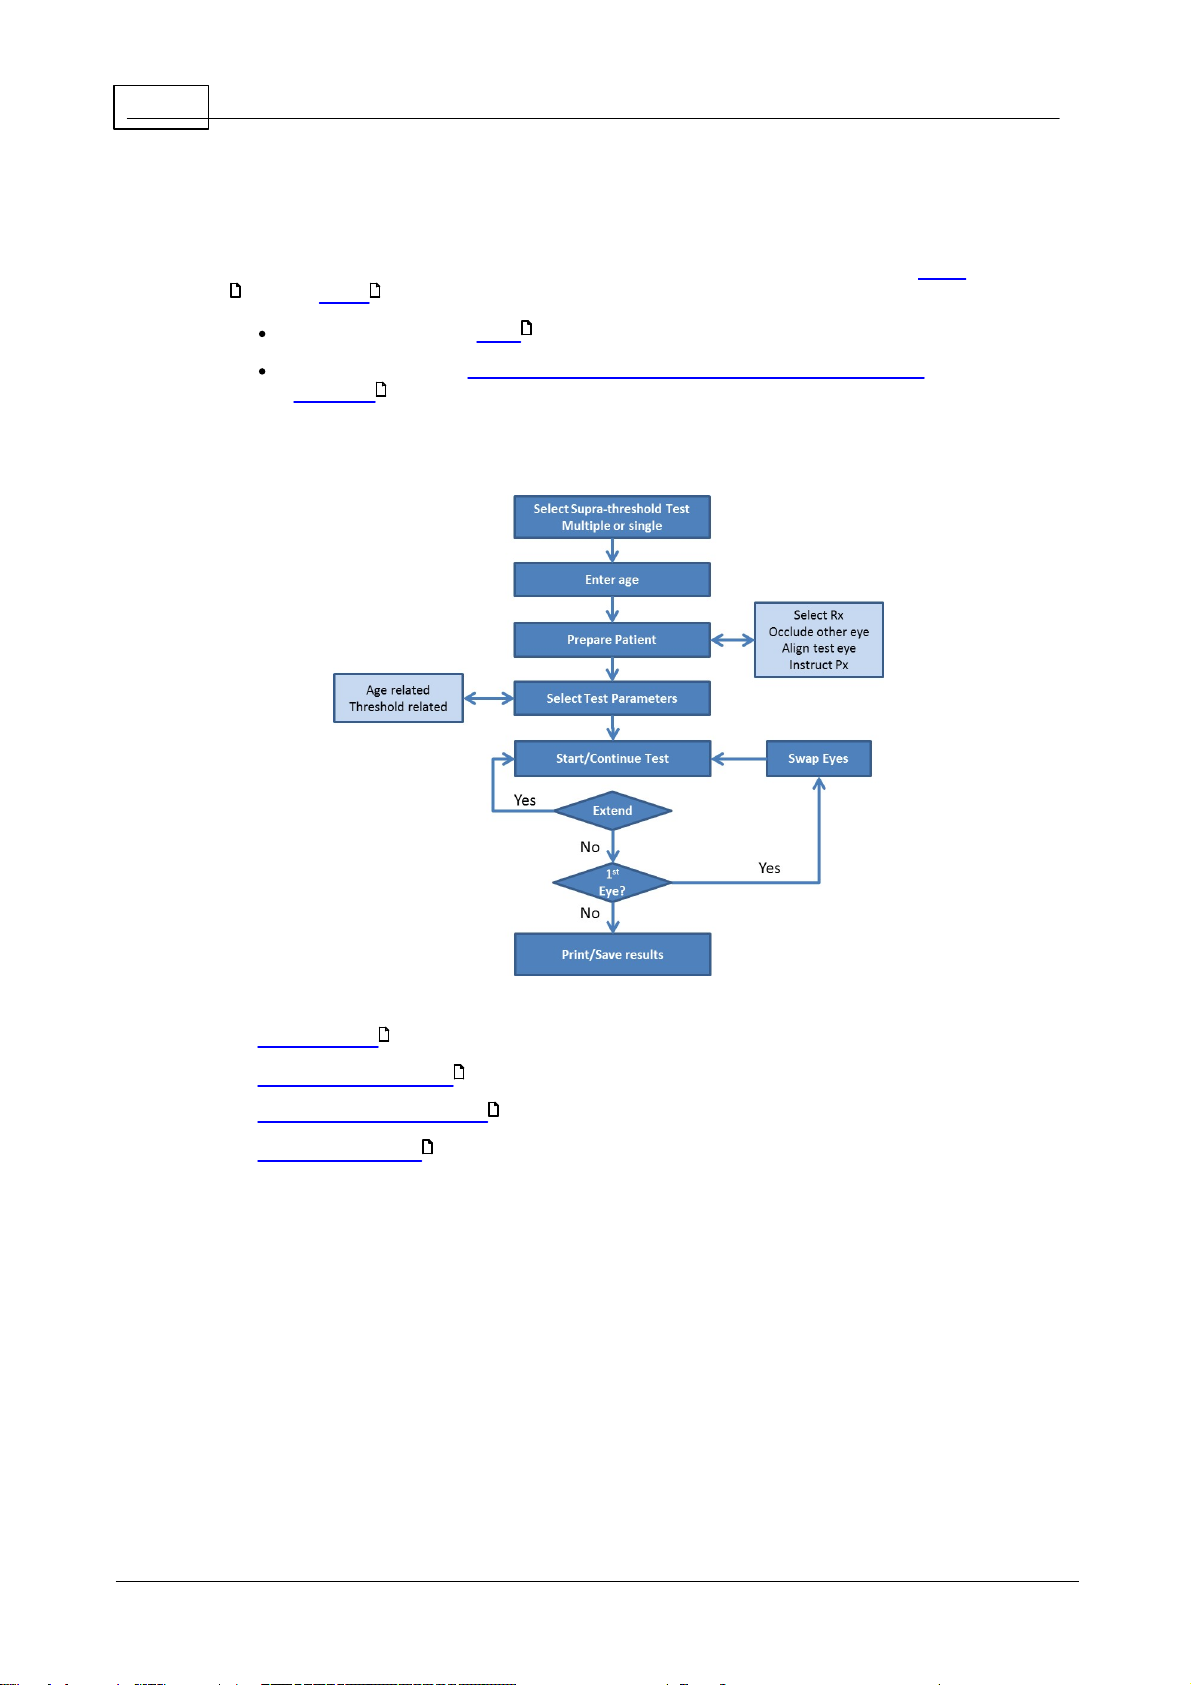
3. 1
Smart Supra tests
There are two different Supra-Threshold tests provided with the Henson 9000 software, Single
25 21
and Multiple stimulus:
Both incorporate three levels of testing.
Both can be run in an age-related (Total Deviation) or threshold-related (Pattern
Deviation) mode.
28
The flow chart below gives the different stages of a Supra-Threshold test.
32
See also:
Fixation targets
76
Default threshold setting
Establishing the test intensity
Analysing the results
28
28
35
E le k tr o n E ye T ec h n o lo g y 2 0 18
Page 21
21Visual field tests
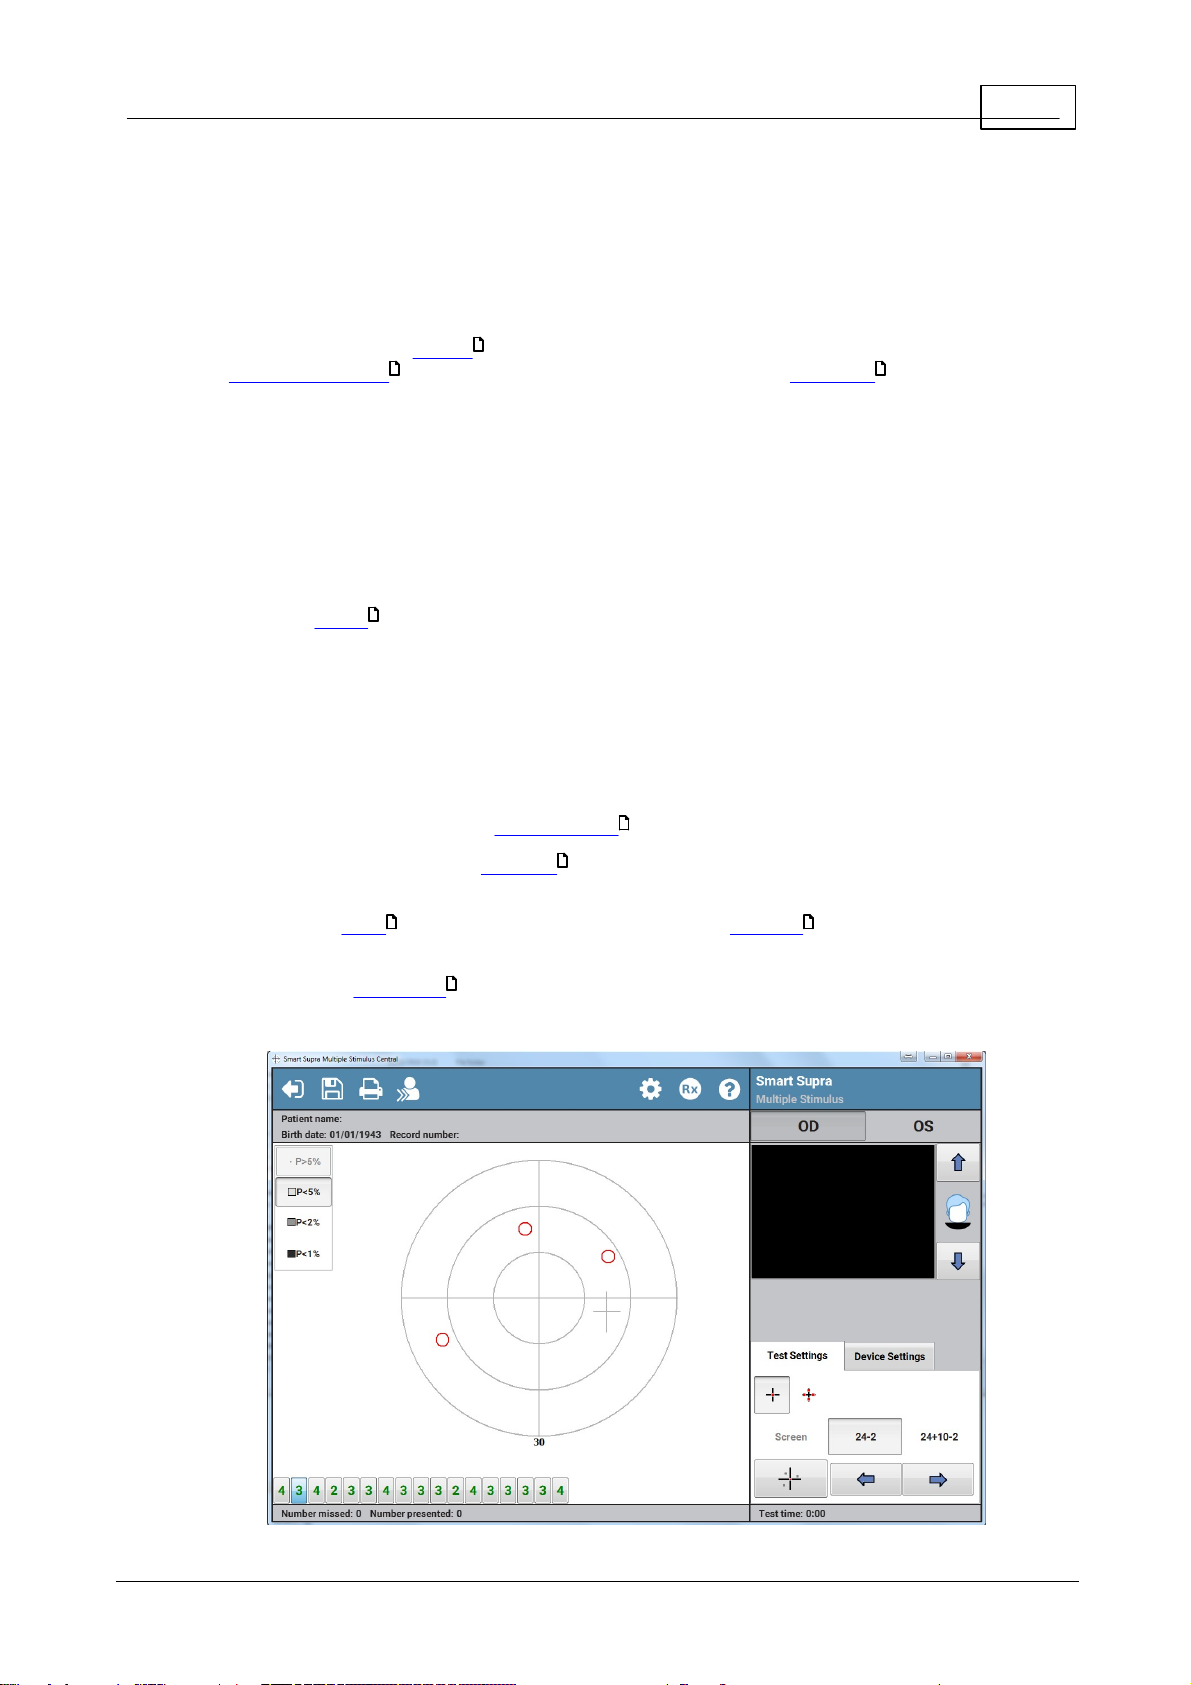
3.1 .1
Multiple Stimulus
The Smart Supra Multiple Stimulus test is used to rapidly screen the visual field. The test is
semi-automated but requires more perimetrist involvement than the single stimulus equivalent.
With a skilled perimetrist this can result in more reliable results with less variability.
The perimetrist should instruct the patient on what to do, ensure that they have the correct
refractive correction in front of their eye and that they are correctly positioned and
69 66
27
comfortable
Each presentation is composed of a pattern of 2, 3 or 4 stimuli.
1. After each presentation the patient tells the perimetrist how many stimuli they saw.
2. If the patient gives the wrong number then the perimetrist should repeat the
presentation.
3. If on the second presentation the patient still reports the wrong number, the perimetrist
asks the patient where the stimuli they saw were. Any missed stimuli are then marked
as misses . It is often useful when trying to establish which stimuli were missed to
33
ask the patient to report the clock hour positions of the seen stimuli.
4. If on the second presentation the patient reported the correct number then the
perimetrist should proceed to the next pattern. In this case it is assumed that the error
in the first presentation was a false one.
5. If there is some doubt, the perimetrist can re-present the pattern. There is no limit to
the number of times it can be presented.
Missed locations can be tested at higher intensity levels to quantify the depth of any defect.
At the beginning of the test the threshold is determined. Stimuli are then initially presented
30
34
at an intensity that 95% of patients with no field loss should see.
The test has 3 levels , it starts testing just 26 points. It can be extended to 54 and 86
32 32
locations.
The test can be customised with the addition of extra stimulus locations.
33
To get m ore help on a test screen item click over the item in the im age below.
E le k tr o n E ye T ec h n o lo g y 2 0 18
Page 22

22
Henson 9000 Perimeter User Manual
3.1 .1.1
Patient instructions
It is important that the patient understands what they need to do during the test.
Below is a set of instructions that we have found work well.
The eye not being tested should be occluded and the test eye must be correctly aligned with
the patient sitting comfortably.
Threshold set by age
The test is going to take about 2 minutes.
You must look at the central red light and keep your eye as still as possible.
The technician is going to present patterns of 2, 3 or 4 light spots.
Not all of the spots will be the same intensity.
After each presentation he/she will ask you how many you saw.
The technician may ask you where you saw the lights.
Add when setting the threshold by measurement
To begin with, the lights will be fairly bright.
They will then get dimmer and dimmer until they cannot be seen.
You should not guess. If unsure it is advisable to say "none".
E le k tr o n E ye T ec h n o lo g y 2 0 18
Page 23
23Visual field tests
3.1 .1.2
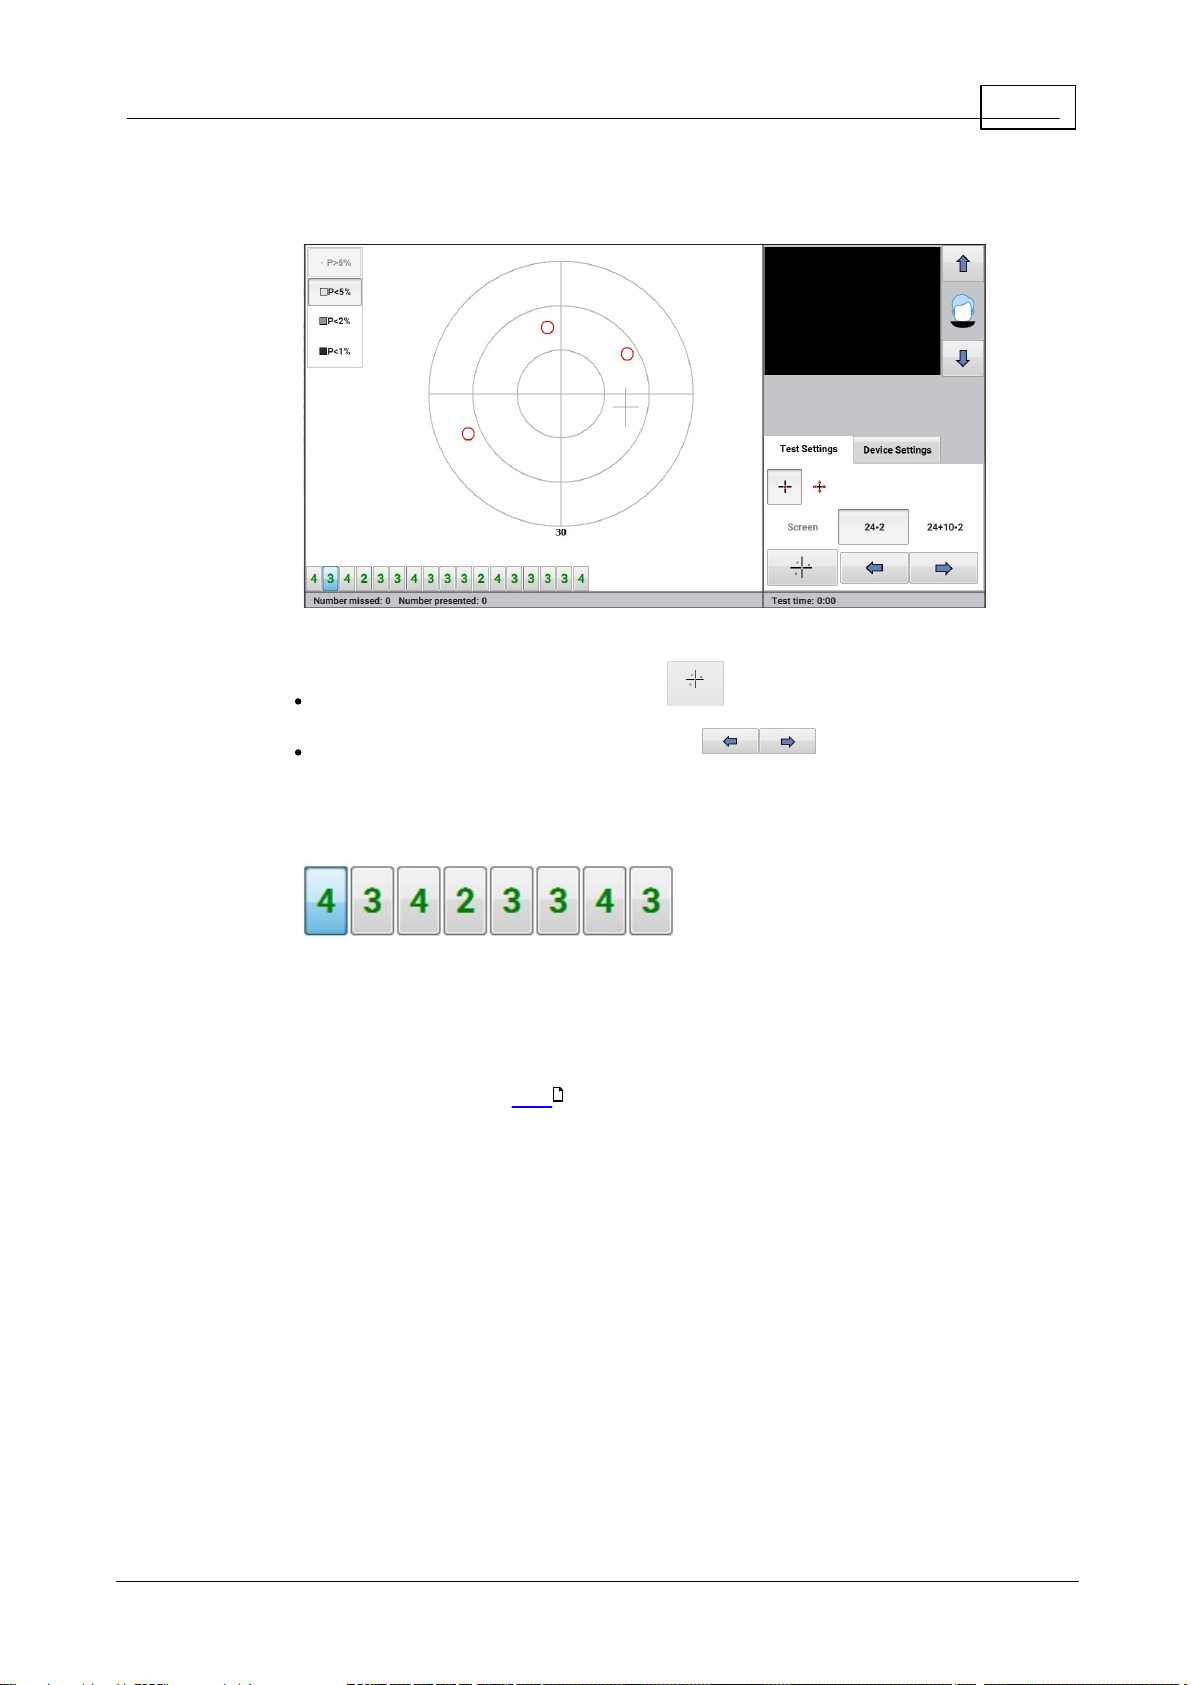
Presenting and selecting different multiple stimulus patterns
The currently selected multiple stimulus pattern is represented on the screen by the red circles.
To present this pattern to the patient click or press the space bar.
To go forward or back to another pattern click or press the left or
right arrow keys on the keyboard.
All the patterns within the current test level are represented by a line of buttons along the
bottom of the screen:
To select a specific pattern click the pattern button.
Each pattern button shows the number of stimuli in the pattern.
The number on the button is initially green and turns black once the pattern has been
presented. If there is a missed stimulus in the selected pattern then the number is shown in red.
When extending the test to a higher level , additional pattern buttons will appear.
32
E le k tr o n E ye T ec h n o lo g y 2 0 18
Page 24
24
Henson 9000 Perimeter User Manual
3.1 .1.3
Missed stimuli in multiple stim ulus suprathreshold test
It is not unusual for a patient with no visual field loss to miss the occasional stimulus. To
differentiate between these and misses due to genuine field loss, the pattern should be
presented a second time.
If the incorrect number is given twice then establish which stimuli were missed by:
1. Asking the patient where they saw stimuli. It is often helpful at this stage to tell the
patient to consider the bowl as a clock face and to give the hour positions of the
stimuli.
2. To mark a location as missed move the mouse to the missed location, click the left
button and from the pop up select .
To correct mistakes (i.e. remove stimuli marked as missed) repeat 2 but select .
E le k tr o n E ye T ec h n o lo g y 2 0 18
Page 25
25Visual field tests
3.1 .2
Single Stimulus
The Smart Supra Single Stimulus test is ideal for screening the visual field.
The fully automated test requires no intervention other than to instruct the patient on what
to do, ensure that they have the correct refractive correction in front of their eye and that
they are correctly positioned and comfortable.
66
The test intensity is derived either from the patient's age or from a measurement taken
69
28 28
27
at the beginning of the test.
There are two different test algorithms, Standard and Multi-sampling
The patient responds to each seen presentation by pressing the response button .
This test incorporates a number of false positive catch trails that help to discourage the
71
26
80
patient from predicting the next presentation.
The test can be customised with the addition of extra stimulus locations.
33
To get m ore help on a test screen item click over the item in the im age below.
E le k tr o n E ye T ec h n o lo g y 2 0 18
Page 26
26
Henson 9000 Perimeter User Manual
3.1 .2.1
Standard and Multi-sampling Algorithms
Smart Supra test algorithms define what the patient has to do for a test location to be marked
as seen or missed.
The single stimulus test offers two different algorithms, Standard and Multi-sampling.
When your machine was installed one of these algorithms would have been set as the default
within the Options program.
You can change the test algorithm at the onset of a test by clicking
83
31
Standard algorithm
In this algorithm the patient has to miss a flash at each test location twice, or see it once, before
it is marked as missed or seen. Having to miss the stimulus twice before the location is marked
as a miss reduces the number of false positives misses. This algorithm has been part of the
Henson software for many years.
Multi-sampling algorithm
In this algorithm the patient has to miss a flash at each test location twice, or see it twice before
it is marked as seen or missed. This algorithm is new to the Henson 9000 and takes a little
longer, as there are more presentations, but is more robust to response errors and is less
variable.
E le k tr o n E ye T ec h n o lo g y 2 0 18
Page 27
27Visual field tests
3.1 .2.2
Patient instructions
It is important that the patient understands what they need to do during the test.
Below is a set of instructions that we have found work well.
The eye not being tested should be occluded and the test eye must be correctly aligned with
the patient sitting comfortably.
Threshold set by age
The test is going to take about 2 minutes.
You should press the response button when you see a light flash.
Not all of the flashes of light are the same intensity.
Some presentations are deliberately blank so do not press the button unless you
are sure you saw a light flash.
You must keep looking at the central red light and keep your eye as still as possible.
If you want to take a break, you can hold down the response button. The test will
pause until the response button is released.
The first few presentations are a demonstration, so do not worry if you make a
mistake at the beginning.
Add when setting the threshold by measurement
At the beginning of the test the light will be very dim.
Do not worry if you do not see many lights
Only press the button when you are sure.
The lights will brighten up later on.
E le k tr o n E ye T ec h n o lo g y 2 0 18
Page 28
28
Henson 9000 Perimeter User Manual
3.1 .3
Setting the test intensity
The Smart Supra tests present stimuli at intensities that are above the patients estimated
threshold. It uses one of two techniques to establish the patient's threshold:
Age related (Total Deviation). The level is set by the age of the patient.
This is the fastest method but can lead to errors when a patient's threshold departs
from the average value for their age, e.g. when there are media opacities.
Threshold related (Pattern Deviation). The level is set by a series of
measurements taken at the onset of the test. The algorithm is different for Single
and Multiple Stimulus tests.
30
When your machine was installed one of these techniques would have been set as the default
method within the Options program.
83
You can change the method at the onset of a test by clicking the Test Options button which
presents the following options form.
29
The perimeter will revert to the default method for the second eye or when starting a new
patient.
E le k tr o n E ye T ec h n o lo g y 2 0 18
Page 29
29Visual field tests
3.1 .3.1
Single Stimulus algorithm
The threshold sensitivity is measured at four test locations, one in each quadrant. The
locations are displaced 9 degrees from the vertical and horizontal meridians.
At each location a repetitive bracketing algorithm (1dB steps, six presentations) is
undertaken.
The average intensity of the last four presentations, at each of the four test locations, is
then taken as the threshold. To guard against the inclusion of data from locations
where the threshold is abnormally depressed, the algorithm excludes data from
locations where the average of the last four presentations is below the 95% confidence
limits of the expected age setting. If all test locations are excluded, the threshold is set
at 4dB below the age setting.
Ten demonstration presentations are made prior to the collection of data.
73
E le k tr o n E ye T ec h n o lo g y 2 0 18
Page 30
30
Henson 9000 Perimeter User Manual
3.1 .3.2
Multiple Stimulus algorithm
Perimetrist task.
1. Present the current pattern by clicking Present .
2. Ask the patient how many stimuli they saw, the pattern can be repeated if necessary.
3. Click either or depending on whether or not they saw any stimuli.
4. Keep repeating 1-3 until the threshold has been established when the test will
automatically jump to the Supra-Threshold testing mode.
Notes:
The algorithm starts by presenting a pattern that should be easily seen. At each subsequent
presentation it reduces the intensity until the patient reports (twice) that none are seen.
If none were seen on the first presentation then the algorithm increases the test intensity.
It is important to tell the patient what is going to happen, i.e. that the patterns are going to get
dimmer and dimmer until they cannot see any of the stimuli. This helps to put the patient at
ease when the stimuli get too dim to see.
E le k tr o n E ye T ec h n o lo g y 2 0 18
Page 31

31Visual field tests
3.1 .4
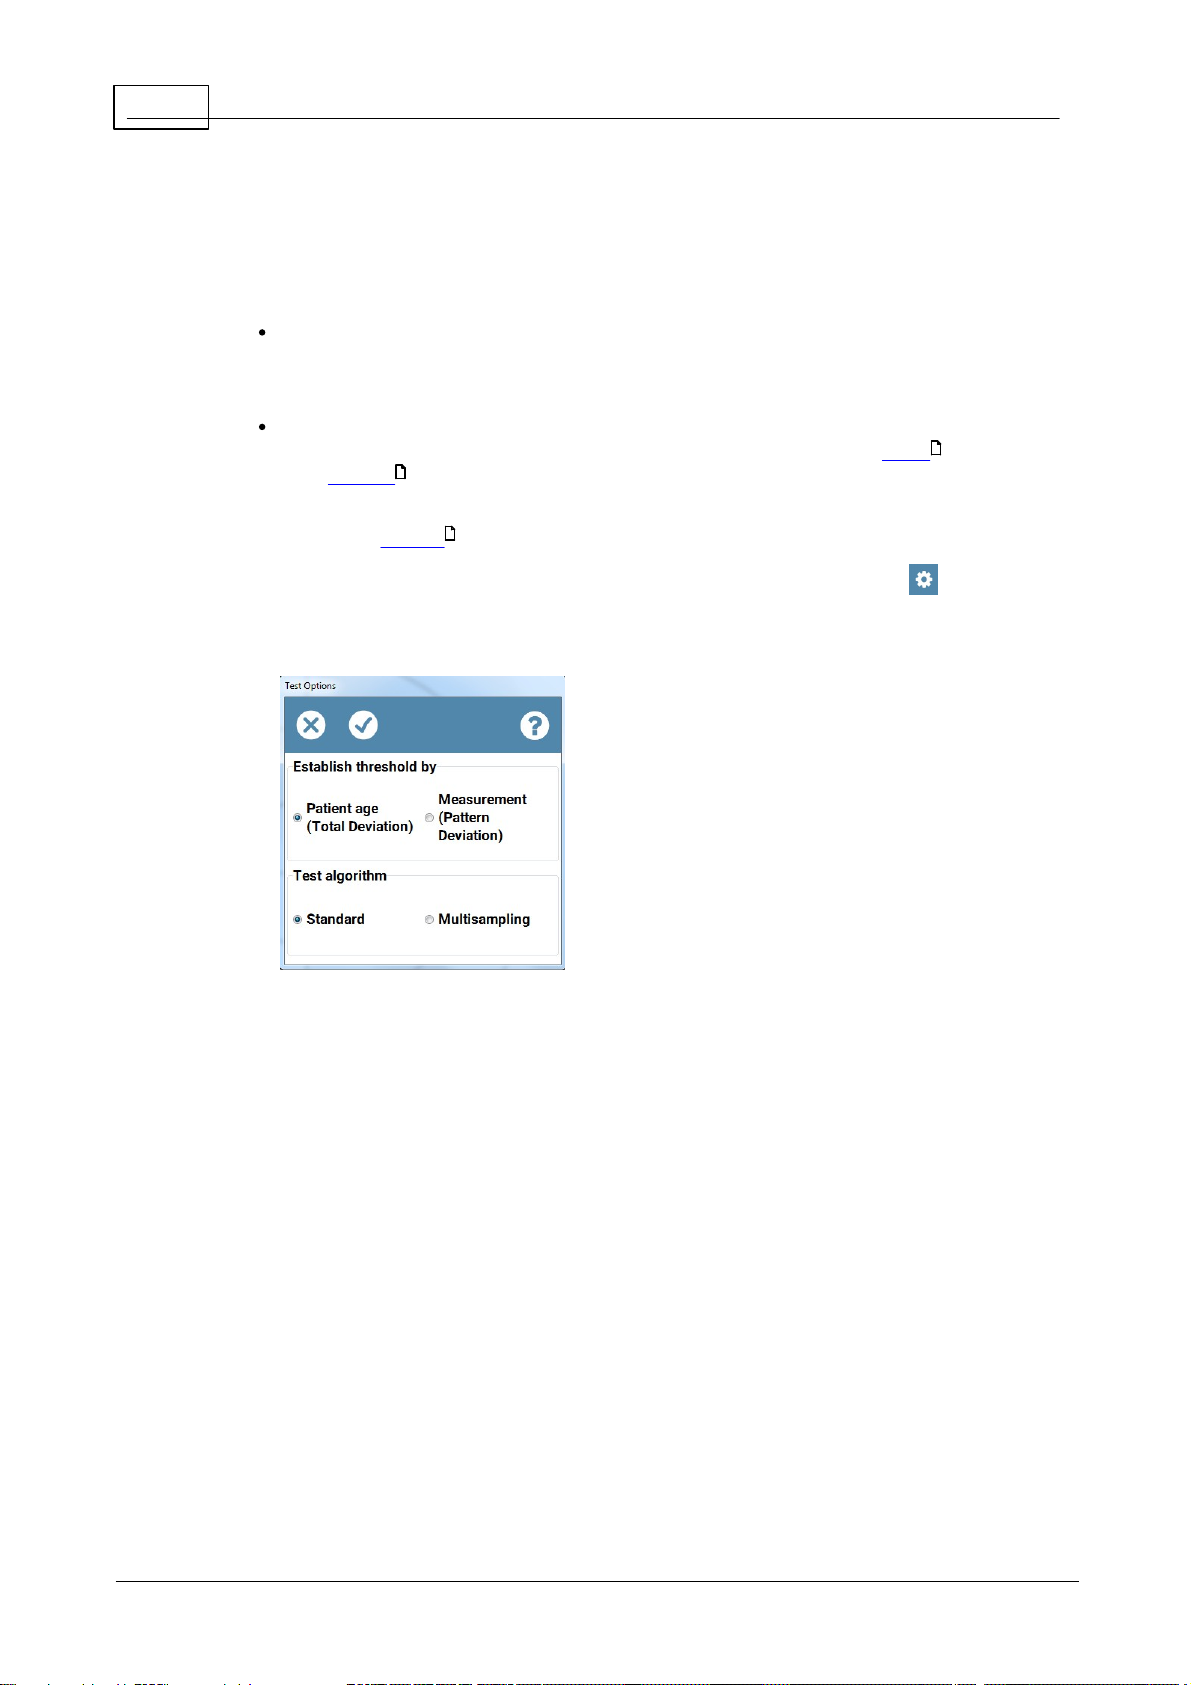
Test Options
Clicking allows you to change the Supra-Threshold Test Options the default values of
which are set in your Options file
62
For the Multiple and Single Stimulus tests you can select to test on the basis of the
patients age or from a measurement taken at the beginning of the test.
For the Single Stim ulus test only you can also select the Standard or Multi-sampling test
28
26
algorithm.
Once you have made your selection click
Click to exit without changing the settings
E le k tr o n E ye T ec h n o lo g y 2 0 18
Page 32

32
Henson 9000 Perimeter User Manual
3.1 .5
Extending the test
Each Smart Supra test is composed of three levels.
The first level is a quick screening of 26 locations which are a subset of the 24-2 test
pattern.
The second level is a 24-2 test (54 locations).
The third level is a 24-2 and 10-2 test (86 locations).
The selected level is highlighted in blue and the level can be increased at any stage of the test.
The figure below shows the distribution of stimuli across each of the three levels.
Additional stimuli can be presented manually .
33
The perimetrist does not have to decide on how many stimuli to test at the onset of the
examination. They can start off with a simple screening test and then opt to test more locations
during or at the end of the test.
E le k tr o n E ye T ec h n o lo g y 2 0 18
Page 33

33Visual field tests
3.1 .6
Adding and correcting presentations
In the Supra-Threshold tests it is possible to add extra test locations, re-test locations, mark a
location as missed or re-classify a missed location as seen.
This can be done at any stage of the test.
In the Multiple Stimulus test:-
1. Move the cursor to the location you wish to test
2. Click the left mouse button and the following pop up will appear
3. Click over the 1st icon to present a stimulus (you can do this as many times as you like).
4. If seen Click over the 2nd icon
5. If missed click over the 3rd icon
6. To remove a miss click over the 4th icon.
In the Single Stimulus test:-
1. Select Manual operation
2. Move the cursor to the location you wish to test.
3. Click the left mouse button to present the stimulus.
4. The resulting display will change according to whether the patient presses the response
button or not.
E le k tr o n E ye T ec h n o lo g y 2 0 18
Page 34

34
Henson 9000 Perimeter User Manual
3.1 .7
Changing the supra-threshold increment
There are three different Smart Supra test increments that correspond to the 95, 98 and 99%
chance of a stimulus presentation being seen by a person with no field loss.
The currently selected increment has a blue background.
Single Stimulus
In the single stimulus test the increment is adjusted automatically. If a stimulus is missed the
program will come back to the location and re-test it at the same intensity. If it is missed a
second time it will test it at the 98% level and if missed at this level than at the 99% level.
Multiple stimulus
In the Multiple Stimulus test the program starts off testing at the 95% level. If the patient reports
fewer than the correct number of stimuli then the pattern should be repeated. If they still report
fewer than the correct number then:-
1. Ask the patient where they saw the stimuli.
2. Move the cursor to the missed location and click the left mouse button to display the
following pop up
3. Selects the missed icon . Repeat if more than one location missed.
4. Test at higher intensity (98 or 99%) and repeat 1-4.
E le k tr o n E ye T ec h n o lo g y 2 0 18
Page 35

35Visual field tests
3.1 .8
Analysing the results
The number of seen/missed stimuli in the status bar at the bottom of the screen, see below.
At the end of a 24-2 test a cumulative histogram is presented giving the number of location
missed at each level.
At the end of a 24-2 plus 10-2 test an additional cumulative histogram is presented giving the
number of 10-2 locations missed at each level, see below.
E le k tr o n E ye T ec h n o lo g y 2 0 18
Page 36

36
Exit the program and return to main menu.
Save current visual field data (both eyes).
Print results (both eyes).
Start new Patient (same test).
Open the Help file (context-sensitive).
Open Help on the correct Rx to use.
Henson 9000 Perimeter User Manual
3.1 .9
Toolbar
81
79
77
E le k tr o n E ye T ec h n o lo g y 2 0 18
Page 37

37Visual field tests
3. 2
ZATA Threshold test
ZATA (Zippy Adaptive Threshold Algorithm) is a new threshold program that is faster and more
accurate than earlier threshold tests (Full Threshold, Fast Threshold). Shorter test times are
important in perimetry, as patients find it hard to maintain their attention much beyond three
minutes and loss of attention is associated with increased variability.
When possible the ZATA program uses the data from a previous visual field test to seed
starting values. When no prior data is available it starts from age-dependent normal values.
Starting from prior threshold estimates not only makes the test faster but also improves the
accuracy of the threshold estimates.
The ZATA test can use either the 30-2, 24-2 or 10-2 pattern of test stimuli.
56
ZATA Fast and ZATA Standard. ZATA Fast differs from ZATA Standard in that it has looser
terminating criteria. The terminating criteria dictate how accurate the threshold estimate must
be before the program stops testing each location. Looser terminating criteria mean that the
ZATA Fast test will be quicker than ZATA Standard, although the accuracy of each threshold
estimate will be reduced by a small amount. ZATA Fast is appropriate for patients where less
accurate estimates are acceptable. i.e. those with no established loss.
The ZATA program presents one stimulus at a time and the patient responds to each seen
presentation by pressing a response button.
80
At the end of the test the results can be viewed in a variety of different ways.
The standard printout includes, threshold values (numeric and gray scale), defect values
50
(age and pattern related), probability values (age and pattern related) along with a series of
global indices (MD, PSD, Hemifield), test details and patient demographics.
57
45
To get m ore help on a test screen item click over the item in the im age below.
E le k tr o n E ye T ec h n o lo g y 2 0 18
Page 38

38
Henson 9000 Perimeter User Manual
3.2 .1
Blind spot
After the demonstration at the beginning of a ZATA test the Henson 9000 searches for the blind
spot.
It starts off by presenting a Supra-Threshold stimulus at the most likely location of the blind
spot. If this is not seen, this location is stored as the blind spot. If it is seen then a stimulus is
presented at the next most likely location. This is repeated until either the patient does not see
one of the stimuli or until all the potential blind spot locations have been tested.
The blind spot location is used throughout the test to check of fixation. Every now and again a
stimulus is presented at the blind spot and if the patient sees this stimulus (presses the
Response button) it is assumed that they were not fixating accurately. The number of blind spot
tests and the number of times the stimulus was seen in the blind spot are displayed as fixation
losses on the status bar (see below) and printout .
50
In a reliable patient fixation losses should not exceed 20%.
Occasionally, the perimeter may fail to find the patient's blind spot, i.e. the patient presses the
response button for every potential blind spot location. This is usually the result of a false
positive response by the patient (they pressed the response button in error when the stimulus
was presented in their blind spot).
When this occurs, a message will ask if you want to repeat the search or to continue without
blind spot checking during the test.
It is possible to repeat a search for the blind spot during the test by clicking
E le k tr o n E ye T ec h n o lo g y 2 0 18
Page 39

39Visual field tests
3.2 .2
Extending the 24-2 test
The ZATA 24/30-test starts off testing the 24-2 locations .
56
The test can be extended, either during or at the end of the 24-2 test, to include the 30-2
locations by clicking the 30-2 button
The current level is highlighted in blue.
E le k tr o n E ye T ec h n o lo g y 2 0 18
Page 40

40
Henson 9000 Perimeter User Manual
3.2 .3
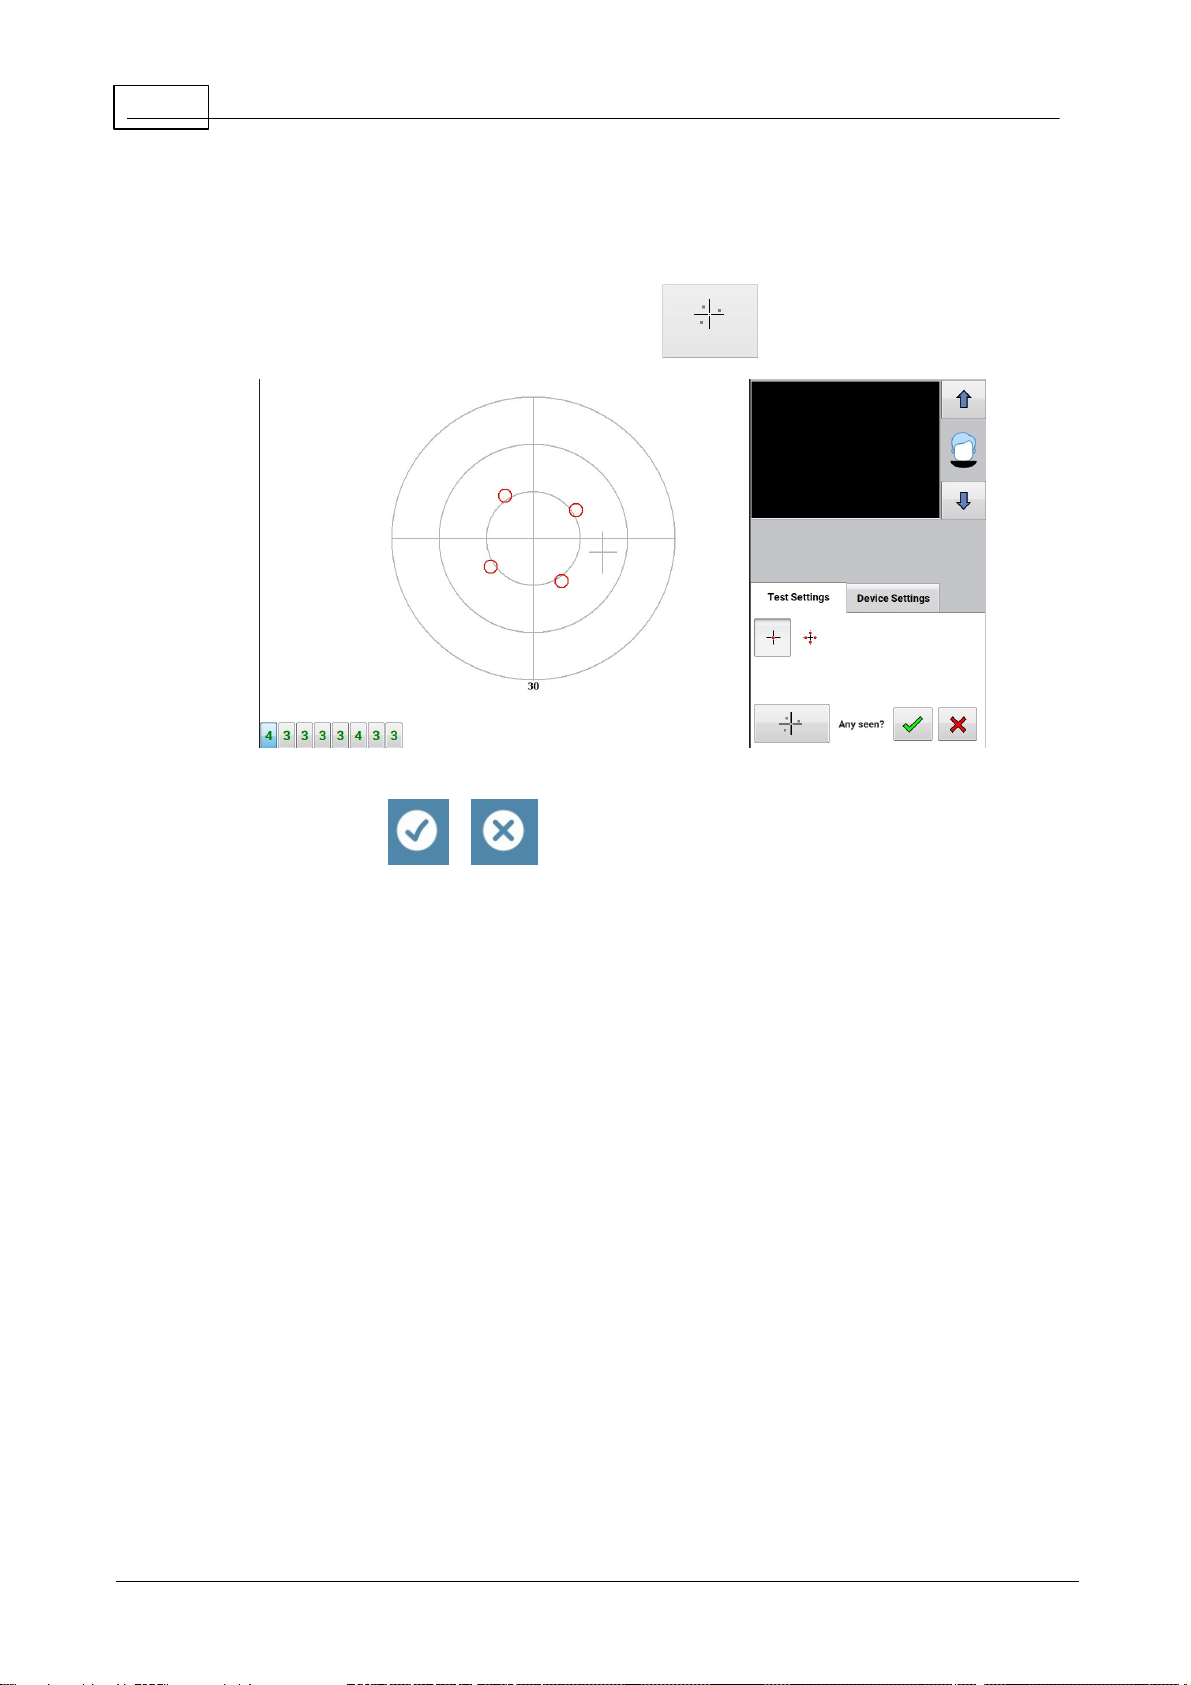
Fovea measurement
In a ZATA test it is possible to measure the sensitivity of the eye at the fovea. For this
measurement the patient fixates the centre of a four-point pattern of lights positioned below
the normal central fixation light.
The software uses a 4-2 staircase algorithm to obtain three measurements of the foveal
threshold, and then takes the average of these three readings to give the final estimate. The 3
measurements are intertwined to avoid any obvious sequences.
1. Click and then confirm in the pop up window.
2. Instruct the patient to look at the centre of the four lights, and to press the response
button when they see a light flash at the centre of the pattern. the operator should
emphasise that many of the presentations will not be seen. If the patient is not sure
they saw a stimulus presentation they should not press the response button.
3. Click to start testing.
E le k tr o n E ye T ec h n o lo g y 2 0 18
Page 41

41Visual field tests
3.2 .4
Global Indices
Global indices are single numbers that characterize the whole visual field. They are used to
monitor the extent of loss over time.
There are three provided with the ZATA Threshold test:
Mean Defect.
Standard Deviation.
Hemifield Test.
E le k tr o n E ye T ec h n o lo g y 2 0 18
Page 42

42
Henson 9000 Perimeter User Manual
3.2 .4.1
Mean Defect
The Mean Defect value, on the printout, gives the clinician an estimate of the extent of
damage.
A more negative value indicates a less sensitive eye. Mean Defect values are sensitive to both
scotoma and media opacities. The value will go down if a patient has a glaucomatous field
defect and if they have a cataract.
The Mean Defect score is based on the average of all the defect values, excluding those
47
from the blind spot area. However, as some test locations are more variable than others, it is
weighted to give more importance to the less variable locations (those nearer the centre of the
tested field).
A P-value is given when the probability of the MD value coming from a normal patient is below
10% (possible outputs are <10%; <5%; <2%; <1%; <0.5%). When it is above 10% then the
message
Within Norm al Limits
will be displayed.
The figure above show s the global indices as th ey appear on the standard p rin t
out.
E le k tr o n E ye T ec h n o lo g y 2 0 18
Page 43

43Visual field tests
3.2 .4.2
Standard Deviation
The Pattern Standard Deviation of the defect values is a measure of their variability. Large
47
values are indicative of localised scotoma. This global index can be used to monitor progression
where increases in the index indicate a deepening or enlargement of localised loss.
The index is insensitive to overall shifts in sensitivity that may occur due to cataract etc.
The index is sensitive to lens rim artefacts and droopy lids.
A P-value is given when the probability of the SD value coming from a normal patient is below
10% (possible outputs are <10%; <5%; <2%; <1%; <0.5%). When it is above 10% then the
message
Within Norm al Limits
will be displayed.
The figure above show s the global indices as th ey appear on the standard p rin t
out.
E le k tr o n E ye T ec h n o lo g y 2 0 18
Page 44

44
Henson 9000 Perimeter User Manual
3.2 .4.3
Hem ifield Test
The Hemifield Test compares the defect values in the superior hemifield to those in the inferior
hemifield and reports on whether this falls within normal limits.
The test is very sensitive to the early changes that occur in glaucoma which are often restricted
to either the superior or inferior hemifields. The output from this analysis is either Within
Normal Limits, Borderline or Outside Normal Limits. In cases where the result is Borderline or
Outside Normal Limits it also gives a p-value (<10, <5%, <2%, <1% <0.5%).
The figure above show s the global indices as th ey appear on the standard p rin t
out.
E le k tr o n E ye T ec h n o lo g y 2 0 18
Page 45

45Visual field tests
3.2 .5
Outputs
At the end of a ZATA test the following three buttons will appear on the menu bar.
The currently displayed format is represented by the button with a blue background.
displays the results in a gray scale format.
displays the threshold values (dB).
displays the defect values (dB).
46
47
46
E le k tr o n E ye T ec h n o lo g y 2 0 18
Page 46

46
Henson 9000 Perimeter User Manual
3.2 .5.1
Threshold/gray scale
Threshold and gray scale values are displayed on the standard printout . Threshold values
are given in decibels of attenuation where 0 corresponds to 3183 cd/m
50
2
(10000 asb).
The above figure shows the Threshold (left) and gray scale (right) values from a 24-2 field test as
seen in the standard printout.
E le k tr o n E ye T ec h n o lo g y 2 0 18
Page 47

47Visual field tests
3.2 .5.2
Total Deviation
Total Deviation values are the difference between the measured threshold and that expected
from an age-matched normal eye.
They are presented in two different forms:
Absolute values in decibels (dB).
Symbols representing the probability that the threshold measure comes from a normal
eye. The probability values take into account the variability in threshold estimates at
each test location.
Positive values indicate a higher than average sensitivity.
The above figu re show s the Total Deviation (left) and Pattern Deviation (righ t)
va lu es as s een in the stand ard printout. Absolute values a t the top a nd
probability symbols b elow .
Example:
If the measured threshold was 25dB in a person of 40 years of age and the normal value for that
location was 30dB, then the Total Deviation value would be -5dB.
Total Deviation values appear on the standard printout .
79
E le k tr o n E ye T ec h n o lo g y 2 0 18
Page 48

48
Henson 9000 Perimeter User Manual
3.2 .5.3
Pattern Deviation
Pattern Deviation values remove the effect of overall shifts in sensitivity to better expose the
pattern of any field loss.
At the end of a test the software calculates, for each test location, the Total Deviation values
47
(the differences between the test result and that of an age-matched normal). To then derive the
Pattern Deviation values it offsets the Total Deviation values according to the overall height of
the patient's hill of vision. If the patient has a less sensitive eye than that of an age-matched
normal (maybe they have some media opacities) then the Pattern Deviation values will be lower
than the Total Deviation values.
The offset is calculated from an analysis of the most sensitive regions of the visual field and has
a maximum amplitude of 6dB in either direction.
When there is a particularly large amount of visual field loss, the Pattern Deviation calculations
become inaccurate and are not displayed.
The Pattern Deviation values are presented in two different forms:
Absolute values in decibels (dB).
Symbols representing the probability that the threshold measure comes from a normal
eye. The probability values take into account the variability in threshold estimates at
each test location.
The above figu re show s the Total Deviation (left) and Pattern Deviation (righ t)
va lu es as s een in the stand ard printout. Absolute values a t the top a nd
probability symbols b elow .
E le k tr o n E ye T ec h n o lo g y 2 0 18
Page 49

49Visual field tests
E le k tr o n E ye T ec h n o lo g y 2 0 18
Page 50

50
Henson 9000 Perimeter User Manual
3.2 .6
Printout
Below is an example printout from the ZATA Threshold test.
Patient demographics and details of the field test used are given at the top of the chart.
You can get further help on the different elements of the print out by clicking over that item in
the image below.
E le k tr o n E ye T ec h n o lo g y 2 0 18
Page 51

51Visual field tests
3.2 .7
Progression: Rate of change
You can monitor the rate of change in the visual field in the Database program.
The progression screen below shows two graphs (one for each eye) that display the global
indices Mean Defect and Pattern Standard Deviation versus the age of the patient. As a visual
field defect gets worse the Mean Defect will become more negative and the Pattern Standard
Deviation more positive. Each data point represents a visual field record (collected or imported)
and when there are 4 or more data points a best fitting (least squares linear regression) line is
drawn through the points.
The Mean Defect rate of change (dB/year) is given below the plots along with its 95%
confidence limits. In the example shown the rate of change is -0.49dB/year in the RE while the
confidence limits are +/-0.36dB/year. As the rate is higher than the confidence limits the
progression is significant at the 95% limit.
The three vertical lines on each plot represent the time points that correspond to the three gray
scale images shown above each graph. When first entering the analysis these will be the last
three visits. You can move to different visits by clicking the left/right arrows to either side of the
gray scales.
Outliers in the data series can have a large effect upon the gradient of the regression lines. They
can be removed by clicking over the data point. Clicking a second time re-introduces the data
point.
The data can also be presented on a Glaucoma Staging System II (GSS) chart by clicking the
109
button.
The GSS II chart plots Mean Defect versus Pattern Standard Deviation and divides the plotted
area into seven stages (Normal, Borderline and five levels of loss).
Click to return to the database. On return visual field chart on the right hand side of the
screen will be replaced by an image of the last progression screen.
This can then be printed by pressing
54
E le k tr o n E ye T ec h n o lo g y 2 0 18
Page 52

52
Henson 9000 Perimeter User Manual
Clicking any other record will revert the right hand display to a visual field chart.
E le k tr o n E ye T ec h n o lo g y 2 0 18
Page 53

53Visual field tests
3.2 .7.1
GSS II
It is often helpful when reviewing visual field data to have a means to scale the extent of loss.
The Henson 9000 uses the GSS II system developed by Paolo Brusini. It is based upon the Mean
Defect and Pattern Standard Deviation and plots these 2 global measures against each other.
The plot area is divided in to seven regions, Normal, Borderline and 5 stages of loss. Stage 1
being early loss while stage five is advanced loss.
Using both Mean Defect and Pattern Standard Deviation is better than using either index in
48
isolation. Pattern Standard Deviation is more sensitive than Mean Defect to early localised loss
while Mean Defect is more sensitive when defects become advanced.
The progression software plots each visual field result as a point on a GSS II chart and connects
the points together with a line. The first records point is coloured blue while the last one is
coloured red. Ideally you would like to see all the points clustered together indicating that there
has been very little change. Movement towards the lower right hand corner (towards stage five)
indicates progressive loss.
E le k tr o n E ye T ec h n o lo g y 2 0 18
Page 54

54
Henson 9000 Perimeter User Manual
3.2 .7.2
Printing
To obtain a print of the progression analysis:
1. Exit the progression analysis by clicking
2. The right hand panel will contain the progression analysis, see below.
3. Click
The image shows a maximum of six gray scales. When there are more than six data points the
gray scales from the first two and last three will be displayed.
Any changes made while in the progression analysis (e.g. excluding an outlier) will be
duplicated in the image which will display either the line plot or GSS II plot depending on which
was active on exit.
E le k tr o n E ye T ec h n o lo g y 2 0 18
Page 55

55Visual field tests
3.2 .8
Patient instructions
It is important that the patient understands what they need to do during the test.
Below is a set of instructions that we have found work well.
The eye not being tested should be occluded and the test eye must be correctly aligned with
the patient sitting comfortably.
The test is going to take about 4 minutes.
Press the response button when a light flash is seen.
Some presentations are deliberately blank.
Do not guess. You must ONLY press when you are sure.
You must keep looking at the central red light and keep your eye as still as possible.
If you want to take a break hold down the response button. The test will pause until
you release.
The first few presentations are a demonstration so do not worry if you make a
mistake at the beginning..
As the test proceeds, fewer and fewer lights can be seen; this is normal.
E le k tr o n E ye T ec h n o lo g y 2 0 18
Page 56

56
Stimulus locatio ns. Left 30-2 (24-2 excludin g red location s). Rig ht 10-2.
Henson 9000 Perimeter User Manual
3.2 .9
Stimulus locations
The ZATA test can use either the 30-2, 24-2 or 10-2 patterns of test stimuli. The 30-2 and 24-2
test pattern presents stimuli on a 6 degree square matrix displaced 3 degrees from the vertical
and horizontal mid-lines and covers an area of either 30 or 24 degrees (the 30-2 is an extension
of the 24-2 test that can be selected during or at the end of a 24-2 test). The 10-2 pattern
presents stimuli on a 3 degree square matrix within the central 10 degrees.
E le k tr o n E ye T ec h n o lo g y 2 0 18
Page 57

57Visual field tests
If you select Existing Patient (one with a previous record in the database) the software
will display the table of records.
1. Scroll through the table to find the patient, or use the Search function.
2. Highlight the required record (usually the last record for the patient) and then
click
3. The patient's name, record number, date of birth etc. will be loaded and, if the
selected test is the same threshold test, the threshold data will be loaded ready
to start testing from prior values.
If you select a new patient the following data entry form will appear. You must enter the
patients name, date of birth and record number before clicking to continue.
3.2 .10
Entering patient details
At the start of a ZATA tests the following form appears.
101
E le k tr o n E ye T ec h n o lo g y 2 0 18
Page 58

58
Using prior data reduces test times and increases the precision of the threshold
estimates.
Henson 9000 Perimeter User Manual
Notes:
E le k tr o n E ye T ec h n o lo g y 2 0 18
Page 59

59Visual field tests
Start/stop the test
Exit the test program and return to main menu.
Save current visual field data (both eyes).
Print results (both eyes).
Open the help file (context-sensitive).
Start this eye again. Any data already collected will be lost unless
saved.
Tested eye has blue background. Changing eyes can be done at
any time without losing data.
Blind Spot re-locate.
Extend test .
Test fovea .
Fixation targets .
Display format.
This symbol will appear on the menu bar when the patient
response button is depressed.
3.2 .11
ZATA controls
81
50
77
38
39
40
76
45
80
E le k tr o n E ye T ec h n o lo g y 2 0 18
Page 60

60
Henson 9000 Perimeter User Manual
3. 3
Esterman Binocular Driving tests
The Henson 9000 provides two visual field tests for Driving. The first, Group 1, meets the
standard set by the UK Driver and Vehicles Licensing Agency (DVLA) for drivers of cars and
motorcycles. The second, Group 2, is for drivers of HGV and public service vehicles.
Both Driving' tests are binocular with a fixed intensity stimulus (10dB, 318.4cd/m2) with the
Goldmann equivalent background intensity of 10cd/m2.
When performing a Driving test the patient's forehead should be placed in the middle of the
head rest and they should be allowed to turn their head to follow the fixation point.
The Driving' tests are single stimulus tests and the patient responds to each seen presentation
by pressing a response button.
80
The Driving' tests incorporate a number of false positive and false negative catch trials .
These are used to give a measure of reliability.
63
71
To get m ore help on a test screen item click over the item in the im age below.
E le k tr o n E ye T ec h n o lo g y 2 0 18
Page 61

61Visual field tests
The test is going to take about 4 minutes.
Press the response button when a light flash is seen.
Some presentations are deliberately blank and you will not see a flash. If you
repeatedly press the response button when there is no flash you will fail the
test.
Keep looking at the central red light.
On occasions the red light will move to a new position; you must follow it
with your eyes and, if necessary, turn your head.
You must keep your eyes as still as possible.
If you want to take a break hold down the response button. The test will
pause until the button is released.
The first few presentations are a demonstration only and do not form part of
the final result.
3.3 .1
Patient Instructions
It is important that the patient understands what they need to do during the test.
Below is a set of instructions that we have found to work well.
E le k tr o n E ye T ec h n o lo g y 2 0 18
Page 62

62
Henson 9000 Perimeter User Manual
3.3 .2
Options
The Options program has a Tests tab with an option to maintain a minimum value for the
62
beep volume. (Min volume On).
The UK DVLA require that a beep is made when a stimulus is presented so this option should be
selected when testing patients within the UK.
For use in countries where there is no such requirement leave the check box empty. This will
allow the beep to be turned off completely using the slider.
E le k tr o n E ye T ec h n o lo g y 2 0 18
Page 63

63Visual field tests
3.3 .3
Stimulus locations
The patterns of the stimuli in the Group 1 and Group 2 Driving Tests are shown below:
Group 1-120 point test Group 2-124 point test
E le k tr o n E ye T ec h n o lo g y 2 0 18
Page 64

64
Henson 9000 Perimeter User Manual
4
General information
The Henson visual field tests are very fast:
The Smart Supra Multiple Stimulus test takes <60 seconds per eye.
The Smart Supra Single Stimulus test takes a little longer - approximately 90 seconds per
eye.
The ZATA Threshold test is one of the fastest threshold tests available due to its use of
prior data and variable terminating criteria.
The 26 point Smart Supra tests use test locations that have been optimized for the early
detection of glaucoma .
The overall speed of Henson 9000 tests is further improved with:
A fast start-up time - the 9000 uses LEDs which do not need to be warmed up.
The printing and storage of both eyes as a single record - you do not need to print and/
or store each eye individually.
The use of multiple stimulus presentations in its Smart Supra test.
Rapid response times to operator commands.
Rapid access to database records.
25 21
25
37
Click and touch screen operation.
Single click operation for common operations, e.g. when you have finished a Smart
Supra test just click to start a new test.
Windows™ operating system
Henson perimeters use the Windows™ operating system. Most users will already be familiar
with many of the screen layouts and operations. Printing can be handled by any Windows
enabled printer and the Henson 9000 can be easily networked, either wireless or wired, using
standard procedures built into most Windows™ based computers.
148
External PC
Utilising an external PC means that you are not confined to having the operator on one side of
the perimeter and many different layout options are available.
Extendable tests
All tests can be extended . You do not need to start a new test when early results look
suspicious. Supra-Threshold tests can be extended from the 26 point screening test to a 54
point 24-2 test and then onto a combined 86 point 24-2 and 10-2 test. The ZATA 24-2 test can
be extended to a 30-2 test.
32
E le k tr o n E ye T ec h n o lo g y 2 0 18
Page 65

Repeating/adding new test locations
65General information
Supra-Threshold tests allow stimuli to be re-presented to confirm a response. You can also
33
add new locations by placing the cursor over the location you wish to test and clicking the
mouse button or touch pad. Existing presentations can be retested and updated in the same
way.
On-line help
Advanced context sensitive help facility.
Advanced analysis routines
The ZATA Threshold test includes Total Defect, Pattern Standard Defect and Probability
maps that match those of the Humphrey Perimeter. It also includes the global indices, Mean
Defect and Pattern Standard Deviation that again match those of the Humphrey Perimeter. It
includes a Hemi-field analysis for the early detection of glaucomatous loss with probability
measures.
When you have a series of threshold tests from a patient, either collected or imported, these can
be analyzed to see if there is any progression . An example of this analysis is given below.
51
41
E le k tr o n E ye T ec h n o lo g y 2 0 18
Page 66

66
Henson 9000 Perimeter User Manual
4. 1
Preparing the patient
Before undertaking a visual field test the patient needs to be carefully instructed on what
the test is about and how they need to respond.
They need to be carefully positioned at the instrument, have the correct refractive
correction in front of the eye under test and an occluder in front of the other eye.
69
67
68
E le k tr o n E ye T ec h n o lo g y 2 0 18
Page 67

67General information
4.1 .1
Aligning the patient
The patient should be seated comfortably with their forehead touching the headrest.
The patients test eye should be looking through the centre of any trial lens which should be
positioned as close as possible to the eye. The chin rest should be raised to support their chin
using the on-screen up/down buttons (see below). Do not try to lift a patient's head with the
chin rest as this can cause excessive loading of the mechanism.
NOTE: The chin rest buttons are disabled when the test is running
E le k tr o n E ye T ec h n o lo g y 2 0 18
Page 68

68
Henson 9000 Perimeter User Manual
4.1 .2
Patient Instructions
It is important that the patient fully understands what they need to do during the test.
Suggested instructions for the different tests can be found by following the links below:
a. Smart Supra Multiple Stimulus
b. Smart Supra Single Stimulus
c. ZATA
55
d. Esterman Binocular (Driving)
22
27
61
E le k tr o n E ye T ec h n o lo g y 2 0 18
Page 69

69General information
Patient's age
Add
40-44
+1.50
45-49
+2.00
50-54
+2.50
55-59
+3.00
60-64
+3.50
>65
+4.00
4.1 .3
Refractive correction
It is important that the patient wears the correct refractive correction (suitable for a 25cm test
distance) during the visual field test.
Following the version 4.0 software update the Henson 9000 is now fitted with a full aperture trial
lens holder. Place the correct lenses in the holder and with the patient correctly aligned move
the holder as close to the patients eye as possible. Earlier Henson 9000s were designed to be
used with a special perimetric lens set and head mounted frame. The integral lens holder is
intended to be an improvement on this solution. [Note: This holder is available to retro-fit
should you require one for your instrument].
An occluder is placed in front of the eye not being tested.
Recommended additions (lens power to be added to the patient's current distance prescription)
are given in the table below.
E le k tr o n E ye T ec h n o lo g y 2 0 18
Page 70

70
Henson 9000 Perimeter User Manual
4. 2
Auto timing
In single stimulus tests the speed of presentations changes according to how fast the patient
presses the response button .
If the patient responds quickly, the speed of presentations increases.
If they respond slowly the speed of presentations will decrease.
The perimetrist can adjust the speed by clicking the arrows at either end of the scale.
80
E le k tr o n E ye T ec h n o lo g y 2 0 18
Page 71

71General information
4. 3
Catch trials
Single stimulus tests incorporate catch trials to give the clinician an estimate of the patient's
reliability.
False positives: when no stimulus is presented.
False negatives (only in threshold and Driving tests): when a repeat
presentation is made at an already seen location.
Catch trials occur at random intervals and the results are given, as a fraction and percentage,
on the status bar at the bottom of the test screen.
The faction numerator is the number of errors and the denominator the number of catch trials.
For example, 3/10 false positives would indicate that the test had made 10 false positive trials
and the patient had, in error, responded to 3 of them.
Normally the number of false positives should be less than 15% and the number of false
negatives less than 30%. False negatives increase if there is a visual field defect.
This is due to the increased variability of the patient in areas of reduced sensitivity.
The relationship between catch trial responses and test-retest variability is biased towards the
patients reliability and the results from these trials should only act as a guide.
E le k tr o n E ye T ec h n o lo g y 2 0 18
Page 72

72
Henson 9000 Perimeter User Manual
4. 4
Changing eyes
The selected eye has a blue background
You can change eyes at any time by clicking the unselected button. Swapping during a test will
not result in any loss of data.
Being able to swap is particularly useful when screening the visual field. If the first eye was OK
and the second eye showed a defect then it is possible to go back to the first eye and test some
more locations now that the suspicion of a defect has been raised by the result from the second
eye.
E le k tr o n E ye T ec h n o lo g y 2 0 18
Page 73

73General information
4. 5
Demonstrating the test
All the single stimulus tests begin with a demonstration. This consists of series of presentations
where the responses of the patient are not saved.
During the demonstration stage the test status indicator will show
It is a good idea to tell the patient not to be concerned if they make some errors at the
beginning of the test as the first few presentations do not count.
E le k tr o n E ye T ec h n o lo g y 2 0 18
Page 74

74
Henson 9000 Perimeter User Manual
4. 6
Entering patient data
Prior to saving your data in the database and, depending on your set up options prior to
printing the results, the following form will ask you to enter patient details.
Use either the on-screen keyboard or an external keyboard to enter/edit the data in the fields.
Only use the following characters: letters A-Z, numbers 0-9 and hyphen -
87
E le k tr o n E ye T ec h n o lo g y 2 0 18
Page 75

75General information
4. 7
Entering the patient's date of birth
To enter the patient's date of birth at the beginning of each test.
Click over the correct day, month and year using the vertical sliders when necessary and then
click to continue.
Clicking will exit the test.
E le k tr o n E ye T ec h n o lo g y 2 0 18
Page 76

76
Henson 9000 Perimeter User Manual
4. 8
Fixation targets
The Henson 9000 has two fixation targets:
A small central red spot.
Four peripheral spots located 6 degrees from the central point along the 0, 90, 180 and
270 meridians. The four peripheral spots are provided for patients who have lost central
vision. The patient should be instructed to look at the centre of the four-point pattern.
The selected target is highlighted in blue and can be changed at any stage of the
test.
E le k tr o n E ye T ec h n o lo g y 2 0 18
Page 77

77General information
4. 9
Help facility
Clicking opens up the on-line help.
Opening and closing the Help facility will not affect the test programs. You can keep the help
program open while continuing with a field test.
An example of a help page is shown below. On many pages clicking over an item within an
image will jump to a new help page where additional information will be available.
E le k tr o n E ye T ec h n o lo g y 2 0 18
Page 78

78
Patient's age
Add
40-44
+1.50
45-49
+2.00
50-54
+2.50
55-59
+3.00
60-64
+3.50
>65
+4.00
Henson 9000 Perimeter User Manual
4. 10
Help Rx
Recommended additions (lens power to be added to the patient's current distance prescription)
are given in the table below.
E le k tr o n E ye T ec h n o lo g y 2 0 18
Page 79

79General information
4. 11
Printing the results of a field test
Click to print your results.
If your Options are set to enter patient information on the printout then you will be
presented with the window below.
83
Use either the on-screen keyboard or an external keyboard to enter/edit the data in the fields.
Only use the following characters: letters A-Z, numbers 0-9 and hyphen -
Click to print, (the menu bar icon will change when called for printing)
to return without printing.
Notes:
1. You should test both eyes before printing unless you are only testing one eye or
printing the results of an Esterman Binocular Driving test.
2. The print will be generated as a PDF file which will be opened in your default PDF
viewer.
E le k tr o n E ye T ec h n o lo g y 2 0 18
Page 80

80
Henson 9000 Perimeter User Manual
4. 12
Response button
The Patient Response Button is used in the single stimulus tests.
The patient needs to click the response button each time they see a stimulus.
The test is paused if the button is held down. This is useful if the patient needs to temporarily
stop the test.
will appear on the tool bar when the button is pressed.
E le k tr o n E ye T ec h n o lo g y 2 0 18
Page 81

81General information
4. 13
Saving visual field data
To save the results of a visual field test Click to open up the database entry form.
Use either the on-screen keyboard or an external keyboard to enter/edit the data in the fields.
Only use the following characters: letters A-Z, numbers 0-9 and hyphen -
Click to save, to return without saving.
Notes:
Both eyes are saved in a single database record. You should, therefore, test both eyes before
clicking save unless you are intending to test only one eye or are saving the Esterman
Binocular Driving test.
The date of test, time of test, date of birth and type of test are automatically entered. The
date and time of test come from the PCs internal clock, which needs to be correctly set via
the Windows Control Panel.
A JPEG or DICOM image of the printed output is automatically saved with the database.
A PDF version can also be saved.
105
91
E le k tr o n E ye T ec h n o lo g y 2 0 18
Page 82

82
Henson 9000 Perimeter User Manual
4. 14
Video camera
The Henson 9000 is fitted with a video camera for monitoring fixation. The camera is set up
within the Options program.
89
The intensity and contrast can be adjusted during a test by clicking over the appropriate
buttons (see above).
E le k tr o n E ye T ec h n o lo g y 2 0 18
Page 83

83Options program
5
Options program
The Options program allows you to customize the test and associated programs.
To make changes close ALL Henson programs, including the Start-up screen, and then run the
Options program from the Windows desktop icon
The tabbed form below will then pop-up. On each tab there are a series of controls. On the first
tab (shown below) you can enter the name and address of your practice. This will appear on the
printed field charts.
Once you have made changes click Changes on all tabs will be saved.
To get help on other tabs click over that tab on the im age
below.
E le k tr o n E ye T ec h n o lo g y 2 0 18
Page 84

84
Henson 9000 Perimeter User Manual
5. 1
Tests
The Tests tab of the Options program allows you to customize certain characteristics of the
Smart Supra and Driving tests.
You can select whether:
Smart Supra
the threshold is set by age (Total Deviation) or by measurement (Pattern
Deviation).
the program starts off with the 26 point screening tests or the 54 point 24-2 test.
the program auto extends from 26 point screening to 54 point 24-2.
the Smart Supra single stimulus test uses the Standard or Multi-sampling algorithm
29
30
Driving test
the beep has a minimum volume, required by UK DVLA.
E le k tr o n E ye T ec h n o lo g y 2 0 18
Page 85

85Options program
E le k tr o n E ye T ec h n o lo g y 2 0 18
Page 86

86
Henson 9000 Perimeter User Manual
5. 2
Computer
The Computer tab of the options program allows you to select the perimeter's USB device, the
software language and whether to run in software only mode.
In software only mode messages are not sent to the perimeter. This facility is available for those
who wish to access the database on a separate computer.
Additional language files may be available to download, check the website www.elektron-eye-
technology.com/support for more details
E le k tr o n E ye T ec h n o lo g y 2 0 18
Page 87

87Options program
5. 3
Database
The Database tab of the Options program allows you to specify the name and path of the
default database . This is where:
Visual field records will be stored when you click
Records will be recalled when you open the database program.
Records for the selection of prior data will be recalled when opting to start from existing
data.
95
The default setting of the database stores JPEG images. If you select DICOM images then you
will require additional licensing, contact Info@elektroneyetechnology.com for details.
The location is selected with the drive, directory and database boxes at the bottom of the
screen. The Drive will normally be the internal C: drive. The selected path and file name will be
displayed in the 'Current Database' box.
If you wish to reset to the default database, (C:\Henson9000\data\fld8.db), press the Reset
Default button.
The quality of the stored JPEG image can be set to a value between 75 and 300. The higher the
number the better the quality and the more memory used.
If the "Patient details on printout" box is ticked, you will be prompted to enter details when you
press the print button.
The VA format can be set.
You can auto create any missing image files. This is useful if you have upgraded to this version
of software and already have entries in the database. Versions prior to 3.5 stored PDF image files
with the database rather than JPEG files.
E le k tr o n E ye T ec h n o lo g y 2 0 18
Page 88

88
Henson 9000 Perimeter User Manual
5. 4
Backup
The Backup tab of the Options program allows you to specify the database backup path.
Normally this will be a network or removable drive fitted to your computer.
If you have access to a network, then the backup location can be a mapped drive on another
computer/server.
The backup folder should be on a different drive to the default database , e.g E:
\Henson_backups\
87
Only the location needs to be specified, the database name will be the same as the current
database.
The location is selected with the drive and folder boxes at the bottom of the screen.
There is an option to include a copy of the image file(s) with the backup. This is normally the
default option, but if you are short of memory space on the backup drive, you can un-tick the
box. The images can be re-created when needed.
NOTE: From Version 3.5 the backup system now uses a rolling 10 copy backup. The backup file
will be called <database name>_BKUPN.db where the N is an increasing number from 1 to 10.
After the 10th backup is made then the first one will be overwritten. This means that any fault in
the database that occurs when saving will not propagate to the previous backups.
You can make additional copies of the database using the Utilities program.
110
E le k tr o n E ye T ec h n o lo g y 2 0 18
Page 89

89Options program
5. 5
Video setup
The Video tab of the Options program allows you to select the Henson camera and optimize the
image.
Select the correct video device from the Video Input Device drop-down menu.
With a patient correctly positioned and looking through any trial lens, use the +/-
buttons to adjust the image zoom, the up/down/left/right buttons to position the
image in the video window.
66
Adjust the Brightness and Contrast sliders to optimize the image (these can also be adjusted
when running a test program).
E le k tr o n E ye T ec h n o lo g y 2 0 18
Page 90

90
Henson 9000 Perimeter User Manual
5. 6
Integration
This tab of the Options program is used for practice management integration.
When integrated with practice management software the Henson 9000 can be set up to will
import patient data.
There are 2 methods of integration:
1: Passing parameters using programmable buttons, these need to be set up at instillation.
There are no selectable options.
2: Text files. The Henson 9000 will automatically use data placed into a text file by a practice
management software if present. The Henson9000 needs to be told where the text file is
located. Use the Drive and Directory lists to select the location and enter the file name into the
file name box - remembering it must end in ".txt". See Appendix 8 for details of the required
149
contents of the file.
See Appendix 8 - Practice management Integration for more details.
149
E le k tr o n E ye T ec h n o lo g y 2 0 18
Page 91

91Options program
5. 7
PDF
The Henson 9000 automatically saves either a JPEG or DICOM image of the chart. The PDF
tab of the Options program allows you to archive an additional copy of the printout in a PDF
format. This facility is provided for practice management system that require a PDF format.
105
Use the drive and folder boxes at the bottom of the screen to browse to the required path.
File names are based on the patient details.
E le k tr o n E ye T ec h n o lo g y 2 0 18
Page 92

92
Henson 9000 Perimeter User Manual
5. 8
Save/Cancel
In the Options program each tab has a Save, Cancel and Help button.
Click on any of the tabbed pages to save the changes made on all tabs.
Click to return without saving any changes.
Click to obtain on-line help.
E le k tr o n E ye T ec h n o lo g y 2 0 18
Page 93

93Options program
5. 9
Registration and licencing
The Henson software needs to be licenced in order to continue to work after the 30 day
evaluation period.
The licence key supplied is a single use licence and cannot be used for multiple computers.
Once the software is activated it does not have to be repeated unless the software is required to
be moved to another computer in which case the licence needs to be released first.
As with the software installation the licencing must be carried out under an administrator
account.
In order to activate the software the postcode of the site needs to be entered and the computer
ID is obtained to validate the license.
The licensing is carried out here in the Licencing tab of the options.
There are 2 options to register the software.
Online - if your computer has an internet connection then you can register it directly
Offline - if your computer does not have an internet connection then registration can be done
using a smart phone that has a data plan.
In both cases a licence number will be required - this is either supplied with your Henson 9000
device (check the rear of the unit for a licence number label) or was purchased as part of an
upgrade. The licence number is in the form of a 25 digit number separated by hyphens.
for example. 12345-12345-12345-12345-12345
For online registration just enter the licence number and the postcode of the practice and
press the Activate button on the online tab (already selected).
The options program will then contact the licencing server online and activate the software.
If an internet connection is not available you will receive notification and can switch over to
offline registration if an internet connection cannot be established.
For offline registration enter the licence number and postcode and select the offline tab
E le k tr o n E ye T ec h n o lo g y 2 0 18
Page 94

94
Henson 9000 Perimeter User Manual
and then press the Get activation code button.
A QR code (as shown below) will be displayed which should be scanned with a smart phone
device with a data connection.
The QR code is a link to a website which will then display the licence activation key for you to
enter in the boxes below the QR code.
Once entered press the Activate button and the software will check the response and activate
the software if the number is correct.
If there is any error in the process then the reason will be displayed.
To Release the licence for example to use it on another computer, just navigate to this tab
and press the release button in either the online or offline tabs.
If in the offline tab, another QR code will be displayed that should be scanned with a data
enabled smart phone to release the licence.
E le k tr o n E ye T ec h n o lo g y 2 0 18
Page 95

95Database program
6
Database program
Visual field data from all test programs are saved in a powerful Windows database. To view this
data exit any test programs and from the start-up screen click on the menu bar.
The location of the database is set within the Options file.
14
62
To get m ore help on a Database item click over that item on the image.
Note: To print records you will need to have a PDF viewer installed on the computer.
E le k tr o n E ye T ec h n o lo g y 2 0 18
Page 96

96
Henson 9000 Perimeter User Manual
6. 1
Backup copy of the database
The Henson 9000 automatically keeps a backup copy of the database that is updated every time
you save or modify a record. This backup copy should be on a different drive (e.g. external disc
or network drive). The location of backup copy is defined in the Options file.
This backup will ensure that you do not lose your data in the unlikely event of a drive failure.
The backup uses a rolling 10 copy system. Each successive backup is appended with an
increasing number from 1 to 10 before it goes back and overwrites backup 1.
Im portant:
You should periodically make an additional copy of the database and store it in
a safe location away from the Computer attached to the Henson. This will
ensure that if the computer is damaged (e.g. a fire) you still have a copy of the
database. T o m ake an additional copy go to the Copy facility of the Utilities
110
program.
88
113
E le k tr o n E ye T ec h n o lo g y 2 0 18
Page 97

97Database program
6. 2
Changing the active database
The Henson 9000 can access and use many different database tables. Each one might contain
data from a specific study, or a group of patients. On start-up the database program displays
data stored in the table defined in the Options program.
To view data stored in a different database:
1. Click to see the Window (below).
62
2. Select the drive, folder and database name, then click .
Note:
When you next collect and save data, the program will revert to the default database specified
in the Options program.
83
E le k tr o n E ye T ec h n o lo g y 2 0 18
Page 98

98
Henson 9000 Perimeter User Manual
6. 3
Deleting a record from the database
To delete a record from a database:
1. Select the record to be deleted.
2. Click
3. When prompted, confirm delete.
The database will be updated along with the backup.
Once deleted, a record can only be retrieved by recovering it from the previously numbered
backup file.
104
E le k tr o n E ye T ec h n o lo g y 2 0 18
Page 99

99Database program
6. 4
Editing data in the database
To edit a record click to display the screen below.
Use either the on-screen keyboard or an external keyboard to enter/edit the data in the fields.
Only use the following characters: letters A-Z, numbers 0-9 and hyphen -
Click to save your changes, to return without saving.
Note: To correct the stored image file after modifying a record you will need to click
E le k tr o n E ye T ec h n o lo g y 2 0 18
Page 100

100
Henson 9000 Perimeter User Manual
6. 5
Visual field chart
The stored image of the visual field chart for the selected record is shown in the right hand panel.
101
To obtain a magnified image of a section move your mouse to the section and hold down the left
button.
No rmal view Zo omed view
E le k tr o n E ye T ec h n o lo g y 2 0 18
 Loading...