

Electro Industries/GaugeTech Shark 250 Installation And Operation Manual

V.1.02
October 9, 2018

This page intentionally left blank.

Electro Industries/GaugeTech
The Leader In Power Monitoring and Smart Grid Solutions
Electro Industries/GaugeTech
The Leader In Power Monitoring and Smart Grid Solutions
Shark® 250 Meter Installation and Operation Manual Version 1.02
Published by:
Electro Industries/GaugeTech (EIG)
1800 Shames Drive
Westbury, NY 11590
Copyright Notice
All rights reserved. No part of this publication may be reproduced or transmitted in
any form or by any means, electronic or mechanical, including photocopying, recording, or information storage or retrieval systems or any future forms of duplication, for
any purpose other than the purchaser's use, without the expressed written permission
of Electro Industries/GaugeTech.
© 2018 Electro Industries/GaugeTech
All information contained herein is, and remains the property of Electro Industries/
GaugeTech and its suppliers, if any. The intellectual and technical concepts contained
herein including, but not limited to, programming code, database structures, etc., are
proprietary to Electro Industries/Gauge Tech and its suppliers and may be covered by
U.S. and Foreign Patents, patents in process, and are protected by trade secret or
copyright law. Dissemination of this information or reproduction of this material is
strictly forbidden unless prior written permission is obtained from Electro Industries/
Gauge Tech.
Shark® is a registered trademark of Electro Industries/GaugeTech. The distinctive
shapes, styles, and overall appearances of all Shark® meters are trademarks of
Electro Industries/GaugeTech. Communicator EXT
TM
and V-SwitchTM are trademarks
of Electro Industries/GaugeTech.
Modbus® is a registered trademark of Schneider Electric, licensed to the Modbus
Organization, Inc.
Doc# E169701 i

Electro Industries/GaugeTech
The Leader In Power Monitoring and Smart Grid Solutions
Electro Industries/GaugeTech
The Leader In Power Monitoring and Smart Grid Solutions
Customer Service and Support
Customer support is available 8:00 am to 8 pm, Eastern Standard Time, Monday
hrough Friday. Please have the model, serial number and a detailed problem descrip-
t
tion available. If the problem concerns a particular reading, please have all meter
readings available. When returning any merchandise to EIG, a return materials
authorization number is required. For customer or technical assistance, repair or
calibration, phone 516-334-0870 or fax 516-338-4741.
Product Warranty
Electro Industries/GaugeTech (EIG) warrants all products to be free from defects in
material and workmanship for a period of four years from the date of shipment.
During the warranty period, we will, at our option, either repair or replace any product
that proves to be defective.
To exercise this warranty, fax or call our customer-support department. You will
receive prompt assistance and return instructions. Send the instrument, transportation prepaid, to EIG at 1800 Shames Drive, Westbury, NY 11590. Repairs will be made
and the instrument will be returned.
This warranty does not apply to defects resulting from unauthorized modification,
misuse, or use for any reason other than electrical power monitoring. The Shark
meter is not a user-serviceable product.
®
250
THIS WARRANTY IS IN LIEU OF ALL OTHER WARRANTIES, EXPRESSED
OR IMPLIED, INCLUDING ANY IMPLIED WARRANTY OF MERCHANTABILITY OR FITNESS FOR A PARTICULAR PURPOSE. ELECTRO INDUSTRIES/
GAUGETECH SHALL NOT BE LIABLE FOR ANY INDIRECT, SPECIAL OR
CONSEQUENTIAL DAMAGES ARISING FROM ANY AUTHORIZED OR
UNAUTHORIZED USE OF ANY ELECTRO INDUSTRIES/GAUGETECH
PRODUCT. LIABILITY SHALL BE LIMITED TO THE ORIGINAL COST OF
THE PRODUCT SOLD.
Doc# E169701 ii

Electro Industries/GaugeTech
The Leader In Power Monitoring and Smart Grid Solutions
Electro Industries/GaugeTech
The Leader In Power Monitoring and Smart Grid Solutions
Use Of Product for Protection
Our products are not to be used for primary over-current protection. Any protection
feature in our products is to be used for alarm or secondary protection only.
Statement of Calibration
Our instruments are inspected and tested in accordance with specifications published
by Electro Industries/GaugeTech. The accuracy and a calibration of our instruments
are traceable to the National Institute of Standards and Technology through
equipment that is calibrated at planned intervals by comparison to certified standards.
For optimal performance, EIG recommends that any meter, including those manufactured by EIG, be verified for accuracy on a yearly interval using NIST traceable accuracy standards.
Disclaimer
The information presented in this publication has been carefully checked for
reliability; however, no responsibility is assumed for inaccuracies. The information
contained in this document is subject to change without notice.
This symbol indicates that the operator must refer must to an
important WARNING or CAUTION in the operating instructions.
Please see 4.1: Considerations When Installing Meters on page 41, for important safety information regarding installation and
hookup of the Shark® 250 meter.
Dans ce manuel, ce symbole indique que l’opérateur doit se référer à un important
AVERTISSEMENT ou une MISE EN GARDE dans les instructions opérationnelles. Veuillez consulter 4.1: Considerations When Installing Meters on page 4- 1, pour des informations importantes relatives à l’installation et branchement du compteur.
The following safety symbols may be used on the meter itself:
Les symboles de sécurité suivante peuvent être utilisés sur le compteur même:
This symbol alerts you to the presence of high voltage, which can
cause dangerous electrical shock.
Ce symbole vous indique la présence d’une haute tension qui peut
provoquer une décharge électrique dangereuse.
Doc# E169701 iii

Electro Industries/GaugeTech
The Leader In Power Monitoring and Smart Grid Solutions
Electro Industries/GaugeTech
The Leader In Power Monitoring and Smart Grid Solutions
This symbol indicates the field wiring terminal that must be connected
to earth ground before operating the meter, which protects against
electrical shock in case of a fault condition.
Ce symbole indique que la borne de pose des canalisations in-situ qui doit être
branchée dans la mise à terre avant de faire fonctionner le compteur qui est protégé
contre une décharge électrique ou un état défectueux.
This symbol indicates that the user must refer to this manual for
specific WARNING or CAUTION information to avoid personal injury or
damage to the product.
Ce symbole indique que l'utilisateur doit se référer à ce manuel pour AVERTISSEMENT
ou MISE EN GARDE l'information pour éviter toute blessure ou tout endommagement
du produit.
About Electro Industries/GaugeTech (EIG)
Founded in 1975 by engineer and inventor Dr. Samuel Kagan, Electro Industries/
GaugeTech changed the face of power monitoring forever with its first breakthrough
innovation: an affordable, easy-to-use AC power meter.
More than forty years since its founding, Electro Industries/GaugeTech, the leader in
power monitoring and control, continues to revolutionize the industry with the highest
quality, cutting edge power monitoring and control technology on the market today.
An ISO 9001
t
roind.com/about-electro-industries/), EIG sets the industry standard for advanced
certified company (certificate on the EIG website at https://elec-
power quality and reporting, revenue metering and substation data acquisition and
control. EIG products can be found on site at mainly all of today's leading manufacturers, industrial giants and utilities.
EIG products are primarily designed, manufactured, tested and calibrated at our facility in Westbury, New York.
Doc# E169701 iv

Electro Industries/GaugeTech
The Leader In Power Monitoring and Smart Grid Solutions
Electro Industries/GaugeTech
The Leader In Power Monitoring and Smart Grid Solutions
Table of Contents
Copyright Notice i
Customer Service and Support ii
Product Warranty ii
Use Of Product for Protection iii
Statement of Calibration iii
Disclaimer iii
About Electro Industries/GaugeTech (EIG) iv
1.1: The Shark® 250 High Accuracy Revenue Meter 1 - 1
Table of Contents
1.1.1: Hookup Connections and Measurements 1 - 1
1.1.2: Ordering Codes 1 - 2
TM
1.1.3: V-Switch
1.1.4: Measured Values 1 - 6
1.1.5: Utility Demand 1 - 7
1.2: Advanced Measurement Functionality 1 - 7
1.2.1: Advanced Revenue Billing Capability 1 - 7
1.2.2: Communications and I/O Capabilities 1 - 10
1.2.3: Meter Display 1 - 12
1.3: Shark® 250 Meter Accuracy 1 - 13
1.4: Shark® 250 Meter Specifications Overview 1 - 14
Key Technology 1 - 3
1.5: DNP V 3.0 Protocol Implementation 1 - 21
1.6: Time Synchronization Alternatives 1 - 21
2: Using the Shark® 250 Meter 2 - 1
Doc# E169701 TOC - 1

Table of Contents
Electro Industries/GaugeTech
The Leader In Power Monitoring and Smart Grid Solutions
Electro Industries/GaugeTech
The Leader In Power Monitoring and Smart Grid Solutions
2.1: Introduction 2 - 1
2.1.1: Understanding Meter Face Elements 2 - 1
2.1.2: Understanding Meter Face Buttons 2 - 2
2.2: Using the Front Panel 2 - 3
2.2.1: Understanding Startup and Default Displays 2 - 3
2.2.2: Using the Main Menu 2 - 4
2.2.3: Using Reset Mode 2 - 5
2.2.4: Entering a Password 2 - 7
2.2.5: Using Configuration Mode 2 - 8
2.2.5.1: Configuring the Scroll Feature 2 - 10
2.2.5.2: Configuring CT Setting 2 - 11
2.2.5.3: Configuring PT Setting 2 - 12
2.2.5.4: Configuring Connection Setting 2 - 13
2.2.5.5: Configuring the RS485 Communication Port Setting 2 - 13
2.2.6: Using Operating Mode 2 - 15
2.3: Understanding the % of Load Bar 2 - 16
3: Mechanical Installation 3 - 1
3.1: Introduction 3 - 1
3.2: ANSI Installation Steps 3 - 3
3.3: DIN Installation Steps 3 - 4
3.4: Transducer Installation 3 - 6
4: Electrical Installation 4 - 1
4.1: Considerations When Installing Meters 4 - 1
Doc# E169701 TOC - 2

Table of Contents
Electro Industries/GaugeTech
The Leader In Power Monitoring and Smart Grid Solutions
Electro Industries/GaugeTech
The Leader In Power Monitoring and Smart Grid Solutions
4.2: CT Leads Terminated to Meter 4 - 4
4.3: CT Leads Pass Through (No Meter Termination) 4 - 5
4.4: Quick Connect Crimp-on Terminations 4 - 6
4.5: Voltage and Power Supply Connections 4 - 7
4.6: Ground Connections 4 - 7
4.7: Voltage Fuses 4 - 7
4.8: Electrical Connection Diagrams 4 - 8
4.9: Extended Surge Protection for Substation Instrumentation 4 - 21
5: Communication Installation 5 - 1
5.1: Shark® 250 Meter Communication 5 - 1
5.1.1: USB Port (Com 1) 5 - 1
5.1.2: RS485 / KYZ Output (Com 2) 5 - 4
5.1.2.1: Using the Unicom 2500 5 - 8
6: Using the I/O Option Cards 6 - 1
6.1: Overview 6 - 1
6.2: Installing Option Cards 6 - 2
6.3: Configuring Option Cards 6 - 4
6.4: 1 mA Output Card (1mAOS) 6 - 4
6.4.1: Specifications
6.
4.2: Default Configuration: 6 - 5
6 - 4
6.4.3: Wiring Diagram 6 - 6
6.5: 20 mA Output Card (20mAOS) 6 - 7
6.5.1: Specifications 6 - 7
Doc# E169701 TOC - 3

Table of Contents
Electro Industries/GaugeTech
The Leader In Power Monitoring and Smart Grid Solutions
Electro Industries/GaugeTech
The Leader In Power Monitoring and Smart Grid Solutions
6.5.2: Default Configuration 6 - 8
5.3: Wiring Diagram 6 - 9
6.
6.6: Digital Output (Relay Contact) / Digital Input Card (RO1S) 6 - 10
6.6.1: Specifications 6 - 10
6.6.2: Wiring Diagram 6 - 12
6.7: Pulse Output (Solid State Relay Contacts) / Digital Input Card (P01S) 6 - 13
6.7.1: Specifications 6 - 13
6.7.2: Default Configuration
6.
7.3: Wiring Diagram 6 - 15
6 - 14
6.8: Fiber Optic Communication Card (FOSTS; FOVPS) 6 - 16
6.8.1: Specifications 6 - 16
6.8.2: Wiring Diagram 6 - 17
6.9: 10/100BaseT Ethernet Communication Card (INP100S) 6 - 18
6.9.1: Specifications 6 - 18
6.9.2: Default Configuration 6 - 19
6.9.3: Wiring Diagram 6 - 19
6.10: IEC 61850 Protocol Ethernet Network Card (INP300S) 6 - 20
6.10.1: Specifications 6 - 20
6.10.2: Default Configuration 6 - 21
6.10.3: Wiring Diagram 6 - 21
6.11: RS232/RS485 Card (RS1S) 6 - 22
6.11.1: Specifications 6 - 22
6.11.2: Default Configuration 6 - 23
Doc# E169701 TOC - 4

Table of Contents
Electro Industries/GaugeTech
The Leader In Power Monitoring and Smart Grid Solutions
Electro Industries/GaugeTech
The Leader In Power Monitoring and Smart Grid Solutions
6.11.3: Wiring Diagram 6 - 24
7: Using the Ethernet Card (INP100S) 7 - 1
7.1: Overview 7 - 1
7.2: Hardware Connection 7 - 1
7.3: Performing Network Configuration 7 - 2
7.4: INP100S Ethernet Card Features 7 - 2
7.4.1: Ethernet Communication 7 - 3
7.4.2: Embedded Web Server 7 - 3
7.4.2.1: Upgrading the Ethernet Card’s Firmware 7 - 14
7.4.2.2: Resetting the Ethernet Card 7 - 16
7.4.2.3: Email Notification 7 - 17
7.4.2.4: Data Push 7 - 23
7.4.3: NTP Time Server Synchronization 7 - 27
7.4.4: Modbus and DNP3 over Ethernet 7 - 27
7.4.5: Keep-Alive Feature 7 - 27
8: Data Logging 8 - 1
8.1: Overview 8 - 1
8.2: Available Logs 8 - 1
9: Using the INP300S IEC 61850 Protocol
Card 9 - 1
9.1: Overview 9 - 1
9.2: Overview of IEC 61850 9 - 1
9.2.1: Relationship of Clients and Servers in IEC 61850 9 - 3
9.2.2: Structure of IEC 61850 Network 9 - 5
Doc# E169701 TOC - 5

Table of Contents
Electro Industries/GaugeTech
The Leader In Power Monitoring and Smart Grid Solutions
Electro Industries/GaugeTech
The Leader In Power Monitoring and Smart Grid Solutions
9.2.2.1: Elements of an IEC 61850 Network 9 - 7
9.2.3: Steps in Configuring an IEC 61850 Network 9 - 8
9.2.4: EIG’s Implementation of the IEC 61850 Protocol Server 9 - 10
9.2.4.1: Shark® 250 Server Configuration 9 - 12
9.2.5: Reference Materials 9 - 13
9.2.6: Free Tools for IEC 61850 Start-up 9 - 14
9.2.7: Commercial Tools for IEC 61850 Implementation 9 - 14
9.3: Using the Shark® 250 Meter’s IEC 61850 Protocol Ethernet
Network Card 9 - 15
9.3.1: Overview 9 - 15
9.3.2: Installing the IEC 61850 Protocol Ethernet Network Card 9 - 17
9.3.3: Configuring the IEC 61850 Protocol Ethernet Network Card 9 - 17
9.3.3.1: Configuring the Device Profile IEC 61850 Protocol
Ethernet Network Card Settings 9 - 17
9.3.3.2: Configuring the Meter on the IEC 61850 Network 9 - 21
9.4: Viewing the IEC 61850 Protocol Ethernet Network Card’s
System Log 9 - 27
9.5: Upgrading the IEC 61850 Protocol Ethernet Network Card’s
Firmware 9 - 28
9.6: Resetting the IEC 61850 Protocol Ethernet Network Card 9 - 29
9.7: Keep-Alive Feature 9 - 30
9.8: Testing 9 - 30
9.10: Error Codes 9 - 31
10: Time of Use Function 10 - 1
10.1: Introduction 10 - 1
Doc# E169701 TOC - 6

Table of Contents
Electro Industries/GaugeTech
The Leader In Power Monitoring and Smart Grid Solutions
Electro Industries/GaugeTech
The Leader In Power Monitoring and Smart Grid Solutions
10.2: The Shark® 250 Meter's TOU Profile 10 - 3
10.3: TOU Prior Season and Month 10 - 3
10.4: Updating, Retrieving and Replacing the TOU Profile 10 - 3
10.5: Daylight Savings and Demand 10 - 4
11: Meter Calculations 11 - 1
11.1: Measurements and Calculations 11 - 1
11.2: Demand Integrators 11 - 5
12: Performing Meter Testing 12 - 1
13: Transformer Loss Compensation 13 - 1
13.1: Introduction 13 - 1
13.2: Shark® 250 Meter's Transformer Loss Compensation 13 - 3
13.2.1: Loss Compensation in Three Element Installations 13 - 5
13.2.1.1: Three-Element Loss Compensation Worksheet 13 - 6
A: Shark® 250 Meter Navigation Maps A - 1
A.1: Introduction A - 1
A.2: Navigation Maps (Sheets 1 to 4) A - 1
B: Three-Phase Power Measurement B - 1
B.1: Three-Phase System Configurations B - 1
B.1.1: Wye Connection B - 1
B.1.2: Delta Connection B - 4
B.1.3: Blondel’s Theorem and Three Phase Measurement B - 6
B.2: Power, Energy and Demand B - 8
B.3: Reactive Energy and Power Factor B - 12
Doc# E169701 TOC - 7

Electro Industries/GaugeTech
The Leader In Power Monitoring and Smart Grid Solutions
Electro Industries/GaugeTech
The Leader In Power Monitoring and Smart Grid Solutions
B.4: Harmonic Distortion B - 14
B.5: Power Quality B - 18
C: Shark® 250 Meter DNP Mapping C - 1
C.1: Overview C - 1
C.2: Configuration C - 1
C.3: Communication C - 1
C.4: Classes C - 3
C.5: Events C - 3
C.6: Time Synchronization C - 4
Table of Contents
C.7: Link Layer Functions C - 5
C.8: Application Layer Functions C - 5
C.9: Errors C - 5
C.10: Object Specifics C - 6
C.10.1: Object 0 - Device Attributes C - 6
C.10.2: Object 1 - Binary Inputs Status C - 8
C.10.3: Object 2 - Binary Input Change C - 9
C.10.4: Object 10 - Binary Output States C - 10
C.10.5: Object 12 - Relay Output Block C - 11
C.10.6: Object 20 - Binary Counters C - 13
C.10.7: Object 21 - Frozen Counters C - 14
C.10.8: Object 22 - Binary Counter Event C - 15
C.10.9: Object 30 - Analog Inputs C - 16
C.10.10: Object 32 - Analog Inputs Change C - 17
Doc# E169701 TOC - 8

Table of Contents
Electro Industries/GaugeTech
The Leader In Power Monitoring and Smart Grid Solutions
Electro Industries/GaugeTech
The Leader In Power Monitoring and Smart Grid Solutions
C.10.11: Object 34 - Analog Input Dead-Band C - 18
C.10.12: Object 50 - Time C - 19
C.10.13: Object 60 - Class Objects C - 20
C.10.14: Object 80 - Internal Indications C - 21
C.10.15: Object 110 - Strings C - 22
C.11: Default Values C - 22
C.12: Use Cases C - 29
C.12.1: Case 1 - Primary of 14.4 KV and Secondary of 120 V C - 29
C.12.2: Case 2 - Primary of 138 KV and Secondary of 120 V C - 36
C.12.3: Case 3 - Read Power in the Range of 6000 Kilowatt C - 40
C.12.4: Case 4 - Read Power in the Range of 60000 Kilowatt C - 44
C.12.5: Case 5 - Read Power in the Range of 120000 Kilowatt C - 45
C.12.6: Case 6 - Reading Energy of Approximately 12345.678 kWh C - 46
C.12.7: Case 7 - Frequency of 59.95 Hz C - 50
D: Transformer Loss Compensation Spreadsheet and Examples E - 1
D.1: Calculating Values E - 1
D.2: Excel Spreadsheet with Example Numbers E - 1
Doc# E169701 TOC - 9

Table of Contents
Electro Industries/GaugeTech
The Leader In Power Monitoring and Smart Grid Solutions
Electro Industries/GaugeTech
The Leader In Power Monitoring and Smart Grid Solutions
This page intentionally left blank.
Doc# E169701 TOC - 10
1: Meter Overview
Electro Industries/GaugeTech
The Leader In Power Monitoring and Smart Grid Solutions
1: Meter Overview
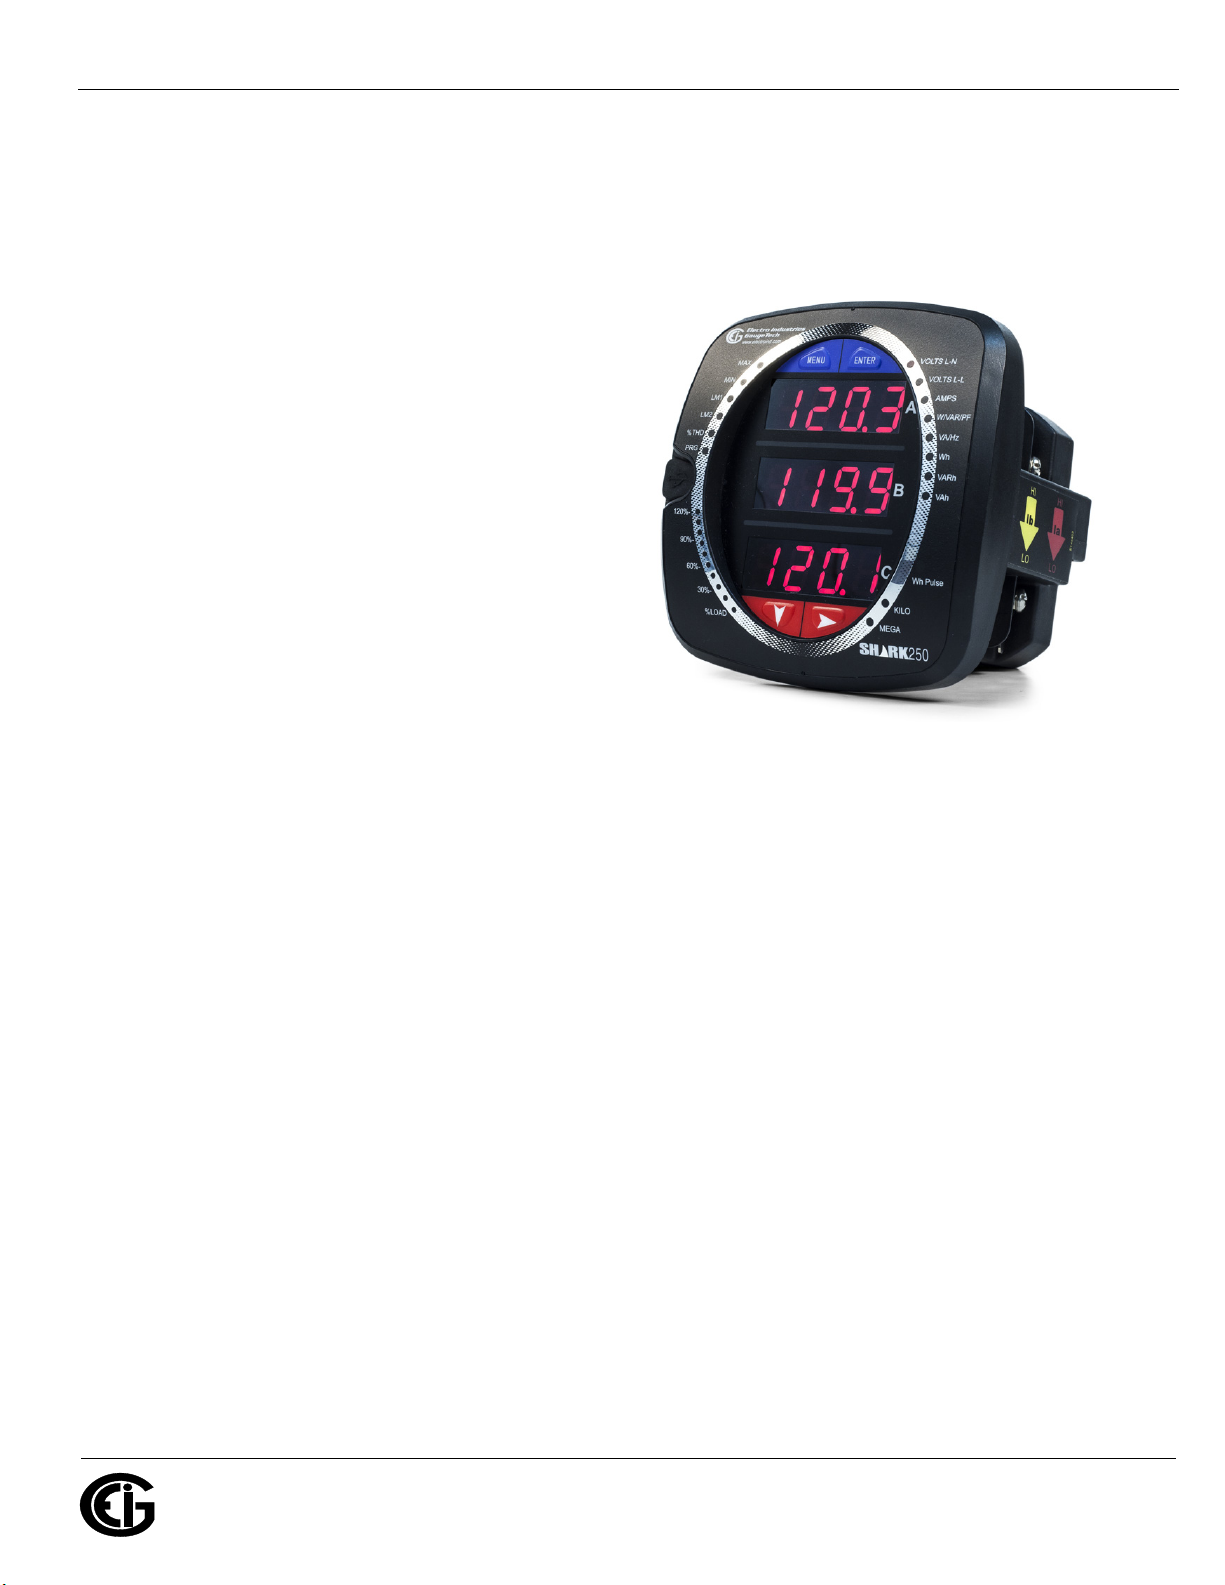
1.1: The Shark® 250 High Accuracy Revenue Meter
The Shark® 250 is a multifunction, datalogging revenue meter for both critical
meter applications and basic commercial/
industrial metering applications. The
Shark® 250 meter is a full four quadrant,
bidirectional revenue meter that can also
be used for inter-tie metering. Its 0.2%
metrology accuracy meets all the accuracy requirements of ANSI C12.20 Class
0.2% and IEC 62053-22 CL 0.2S. The
meter has advanced revenue metering
features that allow it to be used not only
for measuring basic energy, but also for
providing a full complement of necessary
tools, such as instrument transformer compensation, CT/PT compensation, advanced
test mode, perpetual TOU, and extensive logging for interval energy storage.
There is also a transducer only version of the meter, the Shark® 250T transducer,
which has the same functionality as the meter, except that it doesn’t have the faceplate or the USB port.
1.1.1: Hookup Connections and Measurements
See 1.4: Shark® 250 Meter Specifications Overview, on page 1-14.
Doc# E169701 1-1

Electro Industries/GaugeTech
The Leader In Power Monitoring and Smart Grid Solutions
1.1.2: Ordering Codes
1: Meter Overview
Pack
V1
V2
V3
V4
TM
Power
Supply
D2
Universal,
(90 to
265) V AC
@ 50/60
Hz
D
(18-60) V
DC
Option Card 1
Type*
X
None
PO1S
4 Pulses/4
Status Inputs
RO1S
2 Relay Out-
puts/2 Digital
Inputs
1mAOS
4 Channel
Analog Output
0-1 mA
bi-directional
20mAOS
4 Channel
Analog Output
4-20 mA
INP100S
100BaseT
Ethernet
FOSTS
Fiber Optic
Output ST
Term in ate d
Option Card
2 Type*
None
PO1S
4 Pulses/4
Status Inputs
RO1S
2 Relay Out-
puts/2 Digital
Inputs
1mAOS
4 Channel
Analog Output
0-1 mA
bi-directional
20mAOS
4 Channel
Analog Output
4-20 mA
INP100S
100BaseT
Ethernet
FOSTS
Fiber Optic
Output ST
Term in ate d
Model Frequency
Option
Numbers:
E.g: Shark250 - 60 - 2 - V2 - D - INP100S - X
Shark® 250
Revenue Meter
Shark® 250T
Trans duc er O nly
50
50 Hz System
60
60 Hz System
Current
Class
2
2 A
Secondary
10
10 A
Secondary
V-Switch
Multifunction
Meter
V1 + 2 MB
Memory
V2 + 10 MB
Memory and 128
Samples/Cycle
Waveform
Recording
V3 + 128 MB
Memory and 512
Samples/Cycle
Waveform
Recording
X
FOVPS
Fiber Optic
Output
Versatile Link
Term in ate d
INP300S
IEC 61850
Protocol
Ethernet
RS1S
RS232/RS485
Card
FOVPS
Fiber Optic
Output
Versatile Link
Term in ate d
INP300S
IEC 61850
Protocol
Ethernet
RS1S
RS232/RS485
Card
Doc# E169701 1-2
Electro Industries/GaugeTech
The Leader In Power Monitoring and Smart Grid Solutions
1.1.3: V-SwitchTM Key Technology
The Shark® 250 meter is equipped with V-SwitchTM key technology, a virtual
firmware-based switch that lets you enable meter features through software
communication. V-Switch
without removal from service.
Multifunction Measurement * * * *
Programmable Display * * * *
Time of Use ****
System Events * * *
Input Status Change * * * *
Limits ****
Harmonics * * * *
TM
key technology allows meter upgrades after installation
Features V1 V2 V3 V4
1: Meter Overview
2 MB Memory** (3 Historical logs) *
10 MB Memory** (6 Historical logs) *
128 MB Memory** (6 Historical logs) *
Waveform 128 samples *
Waveform 512 samples *
CT/PT Compensation * * * *
TLC Compensation * * * *
IEC 61850 Protocol * * *
DNP3 ****
Modbus Protocol*** * * * *
** Note that some memory is reserved for internal operations.
*** See the Shark® 250 Meter Modbus Protocol Application Guide for instructions on
using Modbus with the meter.
Doc# E169701 1-3

1: Meter Overview
Electro Industries/GaugeTech
The Leader In Power Monitoring and Smart Grid Solutions
Obtaining a V-SwitchTM Key:
Contact EIG’s inside sales staff at sales@electroind.com or by calling (516) 334-0870
(USA) and provide the following information:
1. Serial number(s) of the meter(s) you are upgrading. Use the number(s), with leading zeros, shown in the Communicator EXT
TM
Communicator EXT
2. Desired V-Switch
Main screen, click Tools>Device Status).
TM
key.
3. Credit card or Purchase Order number. EIG will issue you the V-Switch
TM
Enabling the V-Switch
1. Open Communicator EXT
Key:
TM
software.
TM
Device Status screen (from the
TM
key.
2. Power up your meter.
TM
3. Connect to the Shark® 250 meter through Communicator EXT
software.
4. Download all meter logs and then reset them - see chapters 16 and 20 in the
Communicator EXT
TM
4.0 and MeterManager EXT Software User Manual for instruc-
tions on doing this; you can access the manual by clicking Help>Contents from the
Menu Bar at the top of the software’s Main screen.
5. Click Tools>Change V-Switch from the Menu Bar. A screen opens, requesting the
encrypted key.
6. Enter the V-Switch
TM
key provided by EIG.
Doc# E169701 1-4

1: Meter Overview
Electro Industries/GaugeTech
The Leader In Power Monitoring and Smart Grid Solutions
7. Click the Update button. The V-SwitchTM key is enabled and the meter resets.
TM
8. Configure the log sizes - see Chapter 28 in the Communicator EXT
4.0 and Meter-
Manager EXT Software User Manual for instructions.
Doc# E169701 1-5

1: Meter Overview
Electro Industries/GaugeTech
The Leader In Power Monitoring and Smart Grid Solutions
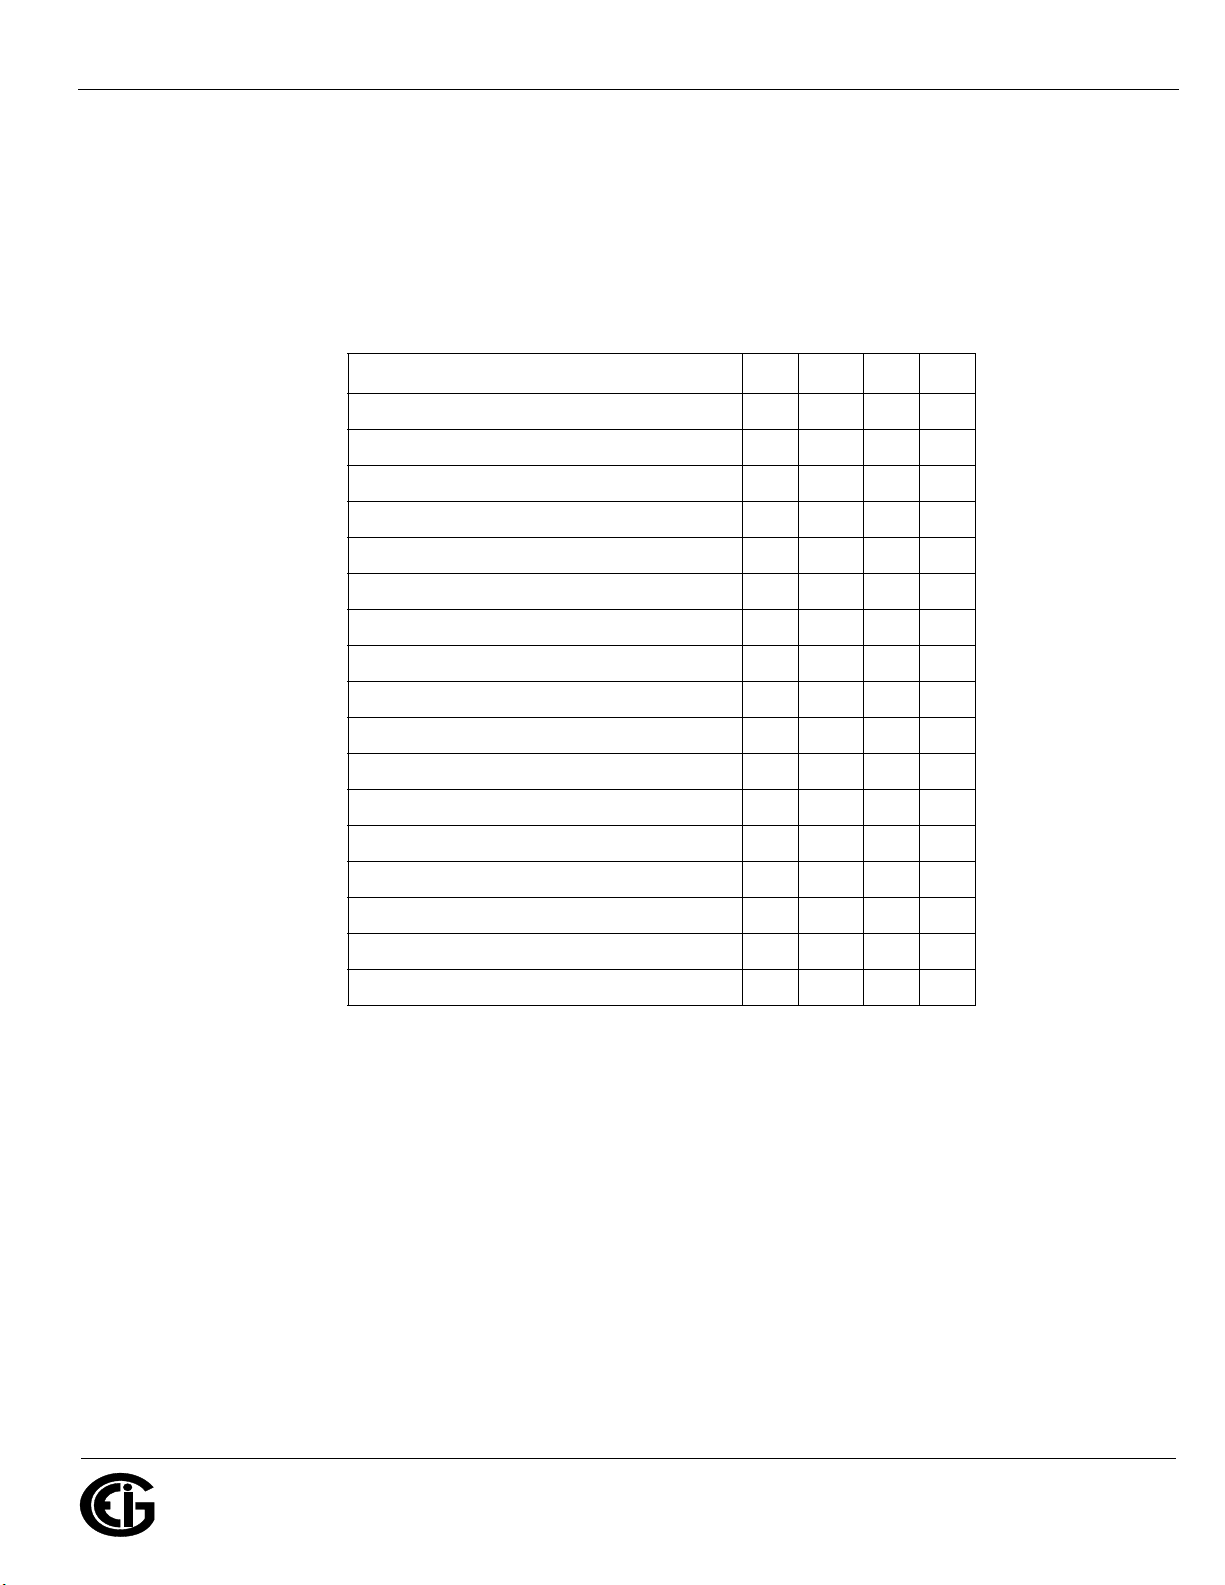
1.1.4: Measured Values
The following table shows the primary measurements of the Shark® 250 meter.
Measured Values Instantaneous Avg Max Min
Voltage L-N X XXX
Voltage L-L X XXX
Current per Phase X XXX
Current Neutral X X X X
Watt (A,B,C,Total) X X X X
VAR (A,B,C,Total) X X X X
VA (A,B,C,Total) X X X X
PF (A,B,C,Total) X X X X
+Watt Hour (A,B,C,Total) X
-Watt Hour (A,B,C,Total) X
Watt Hour Net X
+VAR-Hour (A,B,C,Total) X
-VAR-Hour (A,B,C,Total) X
VAR-Hour Net (A,B,C,Total) X
VA-Hour (A,B,C,Total) X
Frequency X X X
Harmonics to the 40th Order X
THD X X X
Voltage Angles X
Current Angles X
Waveform Scope X
TDD X X X
K Factor X X X
Q X XXX
Q-Hours X
Symmetrical Components X X X
Voltage Unbalance X X X
Current Unbalance X X X
Doc# E169701 1-6

Electro Industries/GaugeTech
The Leader In Power Monitoring and Smart Grid Solutions
1.1.4.1: Update Rate
Instantaneous power W, VA, VAR
and energy Wh, VAh, VARh readings: Every 6 cycles.
All other parameters: Every 60 cycles.
1.1.5: Utility Demand
The Shark® 250 meter provides user-configured Block (Fixed) window or Rolling
window Demand modes. This feature lets you set up a customized Demand profile.
Block window Demand mode records the average demand for time intervals you
define (usually 5, 15 or 30 minutes). Rolling window Demand mode functions like
multiple, overlapping Block windows. You define the subintervals at which an average
of Demand is calculated. An example of Rolling window Demand mode would be a 15minute Demand block using 5-minute subintervals, thus providing a new Demand
1: Meter Overview
reading every 5 minutes, based on the last 15 minutes. Utility Demand features can
be used to calculate W, VAR, VA and PF readings.
NOTES:
• If the meter loses power, average for the Demand interval is computed based on
energy readings for the time the meter was online.
• If there are multiple instances of power loss during an Demand interval, Cold Load
functionality is available only once for Demand computation for that interval. See
page 9 for an explanation of cold Load.
1.2: Advanced Measurement Functionality
The following sections describe the Shark® 250 meter’s measurement features in
detail.
1.2.1: Advanced Revenue Billing Capability
The Shark® 250 device is a full four-quadrant power and energy meter with 0.2
Accuracy class. Energy measurements include: kWh Delivered & Received, kVARh
Delivered & Received, kVAh, kVARh, kWh in each quadrant and Total kVAh. The meter
measures instantaneous power and provides multiple, simultaneous demand measurements, including time-stamped maximum and minimum readings.
Doc# E169701 1-7

1: Meter Overview
Electro Industries/GaugeTech
The Leader In Power Monitoring and Smart Grid Solutions
Time of Use
The Shark® meter’s Time of Use functionality offers the following standard
capabilities:
• 16 TOU schedules.
• Bidirectional consumption and Demand.
• 4 seasons/year and up to 12 months/year.
• Season may be customized for daily or weekly use.
• Perpetual calendar.
• 4 accumulation rates and a totalizer rate.
• Prior month and prior season readings for each schedule.
• Prior month and prior season for each accumulation rate, for each defined data set.
• Current month and current season readings for each schedule.
• Current month and current season for each accumulation rate, for each defined
data set.
• Total-to-date readings for each month.
• Total-to-date readings for each season.
• Cumulative Demand with continuous Cumulative Demand option.
• Configurable auto self-read for season and months, or manual read.
NOTE: If you make changes to either the current/voltage ratio, energy scaling or
similar format settings in the meter's profile; or the configuration of TOU datasets,
rates, schedules or day types, the data in the meter may no longer be consistent with
the previous accumulated data. Any time you change these values you should reset
the TOU data by performing a Master TOU reset action (see the Communicator EXT
TM
4.0 and MeterManager EXT Software User Manual for instructions.)
Doc# E169701 1-8

1: Meter Overview
Electro Industries/GaugeTech
The Leader In Power Monitoring and Smart Grid Solutions
Multiple Demand Windows
The Shark® 250 meter simultaneously calculates four quadrant demand with the
following features:
• Block Window Demand or Rolling Window Demand averaging, divided into of up to
4 subintervals.
• Cumulative Demand.
• Continuous Cumulative Demand.
• Total Demand Distortion.
• Cold Load Pickup.
• Programmable Interval length of 5 minutes, 15 minutes, 30 minutes and 60
minutes.
• End of Interval Pulse Output (with optional 4PO1 card).
• End of Interval Pulse Input (with optional 4PO1 or 4RO1 card).
Cold Load Pickup/Demand Forgiveness
The meter offers Cold Load Pickup/Demand Forgiveness, so that in case a power system outage or excessive power system voltage drop occurs, when normal service is
resumed, the customer will not be billed for the initial surge or in-rush of power to
feed its “cold loads.” During the initial time period immediately following the return of
normal electric service, the demand is not computed in the Demand Registers if the
two threshold conditions described below are met, so the customer is not billed for
possible excessive demand due to “cold load pickup.”
• A power system outage which drops the metering potential inputs to the meter (to
below a programmed threshold) and also drops the meter’s power.
• A power system outage which drops the metering potential inputs to the Meter (to
below a programmed threshold), but the meter’s external power remains supplied
by an alternate source (e.g., station battery, station service, etc.), that is, the
meter continues to operate.
Doc# E169701 1-9

1: Meter Overview
Electro Industries/GaugeTech
The Leader In Power Monitoring and Smart Grid Solutions
Note that energy is always continuously measured and is also recorded in the Power
Profile Logs, if so configured. See Chapter 28 in the Communicator EXT
TM
4.0 and
MeterManager EXT Software User Manual, for instructions.
Time Stamped Max/Min Readings
The unit gathers time stamped Max/Min Demands for all power values. Each of the
following values is date/time stamped:
• W Demand, Delivered & Received, Max/Min.
• VAR Demand, Delivered & Received, Max/Min.
• VA Demand, Max/Min.
• Amps Demand, Max/Min.
• Voltage, Max/Min.
Transformer Loss Compensation
Transformer Loss Compensation adjusts for both copper and iron losses with a simple
user setup.
1.2.2: Communications and I/O Capabilities
The Shark® 250 meter features advanced communication which utilizes multiple Com
ports using open protocols. The meter’s multi-port design allows multiple communication connections simultaneously. The Shark® 250 meter’s system provides a direct
digital link, allowing selected data to be gathered without affecting the meter or your
data. All of the advanced features of the 250 are made available through industrystandard Modbus or DNP3 protocols. No proprietary or closed protocols are used.
Standard Communication
• USB port, supporting Modbus ASCII, fixed at 57600 bps, 8 data bits, 1 stop bit,
parity set to None.
• RS485 serial port, supporting Modbus RTU/ASCII, DNP3 Level 2, speeds from 1200
bps through 57600 bps, 8 data bits, 1 stop bit, configurable parity.
Doc# E169701 1-10

1: Meter Overview
Electro Industries/GaugeTech
The Leader In Power Monitoring and Smart Grid Solutions
Optional Communication
The Shark® 250 meter allows you to select up to two optional cards for the following
uses:
• INP100S optional Ethernet Option card communicating Modbus TCP and DNP3 over
Ethernet.
• INP300S optional Ethernet card with Modbus TCP and embedded IEC 61850 Protocol server.
• FOSTS: Fiber Optic Output ST Terminated.
• FOVPS: Fiber Optic Output Versatile Link Terminated.
• RS1S: RS485/RS232 Serial Communication Option card.
Both the INP100S and the INP300S cards offer enhanced security through the
Exclusive Client feature. This feature lets you Whitelist an IP and/or MAC address.
When that address is used to connect to the meter, all other network communication
with the meter, though the same Network card, is suspended. This ensures that anything being done, e.g., updating programmable settings, while the Whitelist address is
being used to communicate with the meter, is secure. You set up this feature through
Communicator EXT
TM
software - see Chapter 28 in the Communicator EXTTM 4.0 and
MeterManager EXT Software User Manual for instructions.
The INP100S card also supports data push of up to 15 meter readings to cloud services using the JSON structure, such as Lucid BuildingOS® Data Push. For instructions on setting up the meter to perform data push, see 7.4.2.4: Data Push, on
page 7-22.
I/O (Input and Output) capability is available in conjunction with all metering functions:
• Optional 4 high-speed status inputs for status detect or for use as load aggregation/universal metering inputs.
• Optional pulse outputs which can be programmed to pulse for any accumulated
reading. One of the pulse outputs can also be set for an End-of-Interval Sync Pulse.
Doc# E169701 1-11

1: Meter Overview
Electro Industries/GaugeTech
The Leader In Power Monitoring and Smart Grid Solutions
Upgradeable Optional I/O
The user can select from the following optional I/O cards:
• Analog Outputs (0 +/- 1 mA or 4-20 mA).
• Pulse Outputs/Digital Inputs.
• Relay/Digital Inputs.
Control Options
Relay Control provides user-definable control outputs:
• Action and/or alarm on abnormal or other user-set conditions.
Doc# E169701 1-12

1: Meter Overview
Electro Industries/GaugeTech
The Leader In Power Monitoring and Smart Grid Solutions
1.2.3: Meter Display
The Shark 250 meter features a three line LED display for easy to use faceplate
programming and viewing of meter readings. Refer to Chapter 2 for details on the
meter’s display.
1.3: Shark® 250 Meter Accuracy
For 23 oC +/- 5 oC, 3 Phase balanced Wye or Delta load, at 50 Hz or 60 Hz (as per
order), Class 20 and Class 2 unit, accuracy as follows:
Parameter Accuracy Accuracy Input Range
Voltage L-N [V] 0.1% of reading (57 to 480) V
Voltage L-L [V]
Current Phase [A]
Current Neutral (calculated) [A]
Active Power Total [W]
Active Energy Total [Wh]
Reactive Power Total [VAR]
Reactive Energy Total [VARh]
Apparent Power Total [VA]
Apparent Energy Total [VAh]
Power Factor
0.2% of reading
0.1% of reading
2% of Full Scale
0.15% of reading
0.15% of reading
0.2% of reading
0.2% of reading
0.2% of reading
0.2% of reading
0.2% of reading
2
1, 3
1
1, 2
1, 2
1, 2
1, 2
1, 2
1, 2
1, 2
(100 to 720) V
(1 to 100)% of Current Class (CL)
(1 to 100)% of CL
I: (1.25 to 50)% of CL
V: (57 to 480) V
PF: +/-(0.5 to 1) lag/lead
I: (1.25 to 50)% of CL
V: (57 to 480) V
PF: +/-(0.5 to 1) lag/lead
I: (1.25 to 50)% of CL
V: (57 to 480) V
PF: +/-(0 to 0.8) lag/lead
I: (1.25 to 50)% of CL
V: (57 to 480) V
PF: +/-(0 to 0.8) lag/lead
I: (1.25 to 50)% of CL
V: (57 to 480) V
PF: +/-(0.5 to 1) lag/lead
I: (1.25 to 50)% of CL
V: (57 to 480) V
PF: +/-(0.5 to 1) lag/lead
I: (1.25 to 50)% of CL
V: (57 to 480) V
PF: +/-(0.5 to 1) lag/lead
Frequency [Hz] +/- 0.007 Hz (45 to 65) Hz
Harmonic Distortion (1 to
99.99)% [%]
+/- 2%
1, 4
I: (2.5 to 50)% of CL
V: (57 to 480) V
Doc# E169701 1-13

1: Meter Overview
Electro Industries/GaugeTech
The Leader In Power Monitoring and Smart Grid Solutions
1
For 2.5 element programmed units, degrade accuracy by an additional 0.5% of
reading.
• For 1 A (Class 2) Nominal, degrade accuracy to 0.5% of reading for watts and
energy; all other values 2 times rated accuracy.
• For 1 A (Class 2) Nominal, the input current range for accuracy specification is
20% of the values listed in the table.
2
For unbalanced Voltage inputs where at least one crosses the 150 V auto-scale
threshold (for example, 120 V/120 V/208 V system), degrade the accuracy to 0.4%
of reading.
3
With regard to current readings, reference Voltage applied (V A, V B, or V C).
Otherwise, degrade accuracy to 0.2%. See hookup diagrams in 4.8: Electrical
Connection Diagrams, on page 4-8.
4
At least one Voltage input (minimum 20 V AC) must be connected for THD
measurement on current channels.
1.4: Shark® 250 Meter Specifications Overview
Sense Inputs Electrical Ratings
Current
• The current inputs are transformer rated and only to be connected to external CTs.
• Programmable current to any CT ratio.
• Transformer rated.
• The meter will operate using 2, 2.5, or 3 element measurements.
• Class 10: (00.005 to 11) A, 5 A nominal.
• Class 2: (0.001 to 2) A, 1 A nominal.
• Burden: 0.005 VA per phase at 11 A.
• Pickup Current: 0.1% of nominal - Class 10: 5 mA; Class 2: 1 mA (0.2% of nominal
is using current only mode, with no connection to the voltage inputs).
• Continuous maximum ratings (for screw terminated or pass-through connections):
Class 10: 20 A AC; Class 2: 5 A AC.
Doc# E169701 1-14
 Loading...