

Page 1
FastBreak
Version 6.x
Edge Ware, Inc.
www.edge-ware.com
Page 2

Disclaimer and License Agreement
The information that FastBreak and FastBreak Pro provide is only part of the information
needed for a good investment program. Consult your investment representative before
buying or selling any fund or stock. Read the prospectus to determine whether an investment meets your objectives.
EDGE WARE, INC. DOES NOT RECOMMEND SPECIFIC INVESTMENTS
SUITABLE FOR YOUR PERSONAL OBJECTIVES BUT IS LIMITED TO PROVIDING INFORMATION FROM THE BEST AVAILABLE SOURCES. HOWEVER, THESE SOURCES ARE KNOWN TO CONTAIN ERRORS, AND EDGE
WARE, INC. DOES NOT ASSUME LIABILITY FOR ERRORS IN INFORMATION. THIS PRODUCT IS DISTRIBUTED “AS IS” WITHOUT WARRANTIES
OF ANY KIND, EITHER EXPRESSED OR IMPLIED. NEITHER EDGE WARE,
INC. NOR ANYONE ELSE INVOLVED IN CREATING, PRODUCING, OR DISTRIBUTING THIS PRODUCT SHALL BE LIABLE FOR ANY DIRECT, INDIRECT, INCIDENTAL, SPECIAL OR CONSEQUENTIAL DAMAGES ARISING
FROM THE USE OF THIS PRODUCT.
Program and documentation copyright 2009 by Edge Ware, Inc. All rights are reserved.
The software packaged with this manual is not copy-protected. Duplication of this software is limited to one backup copy. No part of this manual may be reproduced or transmitted in any form without written consent from Edge Ware, Inc.
FastBreak, FastBreak Pro, FastGraph, and Edge Ware logo are trademarks of Edge Ware,
Inc.
FastTrack is a trademark of Investors FastTrack.
Windows 95, Windows 98, Windows NT, Windows 2000, Windows Me, Windows XP,
Windows Vista, Microsoft Office, Notepad, and Excel are trademarks of Microsoft Corporation
2
Page 3

Table of Contents
1.0 Preface..........................................................................4
2.0 Introduction ..................................................................5
3.0 Upgrade Notes..............................................................6
4.0 FastBreak Trading System..........................................13
5.0 Technical Support and Upgrades................................16
6.0 Installing FastBreak....................................................18
7.0 FastBreak Options and Functions...............................21
8.0 FastBreak Examples ...................................................64
9.0 Analyzing FastBreak Output ......................................68
10.0 Building Market Timing Signals ..............................73
11.0 FastBreak Calculation Details ..................................75
12.0 Suggestions on Improving Trading Strategies..........79
13.0 Trading using FastBreak...........................................80
14.0 Batch System Processing..........................................81
15.0 Frequently Asked Questions.....................................83
16.0 Resources..................................................................87
Appendix A - Technical Discussion.................................88
3
Page 4

1.0 Preface
Note: A PDF copy of this manual is on your installation disk. We recommend you put
a copy on your computer so you will always have a copy available.
This manual supports both Standard FastBreak and FastBreak Pro. FastBreak Pro users
will see additional icons on the icon tool bar and two extra pull down menus. The additional FastBreak Pro screens, and optimizer functionality activated by these icons, are
covered in the second manual that comes with the FastBreak Pro software. When we refer to FastBreak in this manual it will always apply to both Standard FastBreak and FastBreak Pro unless otherwise noted. Also, when we refer to mutual funds in the manual
this will also apply to stocks unless otherwise noted.
Don’t let all the parameter boxes, icons, and fancy techno terms intimidate you. We can
tell you that if you read the manuals and run the examples provided you will quickly develop an appreciation for FastBreak.
Anyone who has attended a FastTrack user group meeting or conference knows that FastTrack users span a very wide range of experience levels. Using FastBreak requires
knowledge of computers, investing terminology, FastTrack, as well as FastBreak. With
this variation in the audience knowledge base, it is always a struggle to know the right
amount of detail to address all these issues. We can never make the software and manual
simple enough for the new investor, and never add enough complexity for the “power
user.” We have put options in FastBreak that many users will never use and there is
nothing wrong with that. If there is an option you don’t understand on the initial reading
of the manual, don’t activate it; come back to it at a later time as your experience grows.
One mistake some users of FastBreak make is to start out activating all the options and
choosing the most complicated strategies. A considerable amount of error checking of
user inputs has been incorporated to make the software crash resistant, but it is possible to
get errors and crashes. If you start out making several changes to a run and then get an
error, it will be very difficult to determine what went wrong. We provide examples that
are good starting places. Start slowly. You can setup the examples with a minimum
amount of effort, make one or two small changes to customize to your needs, and be on
your way.
As you want to go deeper into designing trading systems you may want to checkout the
resources we listed in the Resources chapter.
4
Page 5

2.0 Introduction
An early version of FastBreak was reviewed in the July 1999 issue of Technical Analysis
of STOCKS & COMMODITIES, the premier technical analysis investment magazine.
Their review, in part, said, “This is easily the most elaborate fund switching software
we’ve run across, and it’d be worth the time to check it out.” The latest version of Fast-
Break you have in your hands is far more advanced than the version reviewed.
FastBreak is an investment tool that relies on the Investors FastTrack database. For those
not familiar with FastTrack, it is a mutual fund & stock database and software analysis
package. The database is updated each day the market is open with the closing prices of
thousands of mutual funds, stocks and indexes. Users of FastBreak must be subscribers
to FastTrack and have the FastTrack software and databases installed prior to installing
FastBreak. Call Investors FastTrack at 800-749-1348 or visit their web site
www.fasttrack.net to subscribe. Do not call FastTrack for information relat-
ing to FastBreak. We have a good working relationship with FastTrack but we are
completely separate companies.
The authors of FastBreak have completed a large number of studies using the software
and you may ask, “Why not just make the results available?” The simple answer is that
our investment objectives and risk tolerance may not be the same as yours. Also, with the
evolution of market conditions and the availability of new mutual funds and the deletion
of old funds these strategies can become dated. We have built an easy to use tool that
will allow any user to back test and study trading strategies.
FastBreak has been used by hundreds of investors since 1996, and some of our best enhancements have come from user suggestions. Thank you for your support, and we wish
you profitable trading.
Edge Ware, Inc
5
Page 6

3.0 Upgrade Notes
Maintaining Existing FastBreak Trading Strategies
If you have existing FastBreak strategies that you like we recommend that you keep the
old version of FastBreak on your computer until you have verified that the strategies produce the same results with the new version. Prior to installing the new version of FastBreak go to the folder where the existing version is located, typically ftbreak (ftbreakp for
Pro users), and find the file ftbreak.exe (ftbreakp.exe for Pro users). Rename this file
ftbreakVx.exe (ftbreakpVx.exe) where Vx represents your current version
(ftbreakV6.2.exe for example). Now put a shortcut to this file on your desk top.
We also recommend that if you are making a major upgrade, i.e. from Version 5 to Version 6, then install the new version in a new folder, e.g., ftbreak6 (ftbreakp6 for Pro users). This will allow you to segregate your new files and systems that are associated with
this new major version.
If you see significant changes in favorite trading strategies then continue to run these
strategies in your old version of FastBreak until you have a chance to create new strategies in the new version. You can have multiple versions of FastBreak installed on a computer so there is no problem running these old strategies.
Changes for FastBreak Pro Version 6.5
Note: There was no Standard FastBreak Version 6.3 or Version 6.4. The FastBreak
Pro V6.3 releases only affected changes to FastBreak Pro. The change (Combine/Complementary Systems) in FastBreak Pro V6.4 was primarily a capability that is
useful for Pro users and we didn’t build a Standard V6.4. The changes in V6.5 affect
both Standard and Pro. We want to keep version numbers consistent when functionality affects both versions, which is the case for V6.5.
Combine/Complementary Systems
This was a capability added in V6.4 of FastBreak Pro but we are adding it as part of the
V6.5 Standard FastBreak upgrade; however, the full power of the capability can only be
realized in FastBreak Pro. In FastBreak Pro the optimizer will try to build a new system
to complement an existing system or two systems. In Standard FastBreak the capability
allows a user to combine a trading system in conjunction with one or two existing trading
systems and show the Summary results and FNU for the combined system. One purpose
of this capability is to build complementary systems that may reduce the MDD or volatility of an entire portfolio that is trading multiple systems.
As an example, perhaps the investor has developed a system that trades ETFs. The annual return of this system may be excellent but has significant drawdowns on a regular
basis. This is often the case with a system that trades based on very long term trends
6
Page 7

without the benefit of tight stops. FastBreak now allows you to import the equity curve
(FNU file) from this existing system and combine it with a complementary system that
reduces the overall MDD when the two systems are traded together.
This functionality can also be used to combine FastBreak trading systems that complement non-FastBreak trading systems.
Bug Fix and Better Error Checking on Early Start Date
V6.5 fixes a problem when the Correlation Check option is used. Sometimes the correlation check wasn’t properly being applied.
As more and more users use ETFs that have a limited price history that would result in
errors if a user selected a start date that is too early. We have made changes that will result in fewer errors/crashes if an early start date is chosen. A user should still try to select
a start date that is relevant to the beginning of price data for funds in the trading family.
BOOM (Breakout Optimization Method) with Linear Slope Ranking
Long term FastBreak users are familiar with the BOOM option for ranking. Read the description for the option later in the manual. We have made BOOM available to use with
the Linear Slope ranking method. In recent years we have found that Linear Slope is a
great ranking method for stocks and ETFs. This ranking method appears to help adjust
for the greater volatility of stocks/ETFs vs. the less volatile mutual funds so allowing
BOOM to be used with Linear Slope was a natural extension.
Buying Weakness and Selling Strength
FastBreak Pro V6.5 adds two new capabilities (RAT and BAT) for buying and selling
into what may be permanent or temporary strength. Some of the changes are intended to
build systems that are complementary to traditional FastBreak systems that always buy
into strength. This will become clear as each of the new options is explained. Note: The
new options will only work with Linear Slope ranking. We will give only a brief overview here in the upgrade notes. More information can be found later in the manual
with calculation details in the Appendix.
RAT (Return Advance to Trend)
Typical FastBreak trading systems usually buy maximum price strength/momentum.
Trading systems can take a different approach and successfully take advantage of buying
temporary price weakness or selling into short term price strength. RAT is an option to
take advantage of these temporary moves. The assumption is that the move is temporary
and the price will revert to the trend.
BAT (Breakout Above Trend)
Sometimes a stock will have a good positive long term price trend, but for various reasons new buying will come into the stock and an even better trend will be established.
This is different from the BOOM option which tries to determine when a stock that has
been falling breaks out to the upside.
7
Page 8

Changes in Version 6.2
This section will cover enhancements in FastBreak Version 6.2 and is of interest to users
of previous versions of Standard FastBreak. Note: For users of previous versions of
FastBreak Pro see the Upgrade Notes in the supplemental FastBreak Pro manual.
Version 6.2 (V6.2) is the first release version of V6.X. It has exactly the same functionality of beta V6.1.
V6.1 of Standard FastBreak was a beta version that could be run by users of V5. We
made the beta available free of charge for V5 users. V6.1 will continue to function; however, going forward we will not maintain the beta version. Now that V6.2 is the official
release version any future enhancements or bug fixes will build upon V6.2. Users of versions prior to Version 6 will need to upgrade if they want to take advantage of any future
builds. Our policy is to provide technical support to the most two recent versions, e.g.,
V5.X and V6.X.
Note: There wasn’t a V6.0 of Standard FastBreak.
Trendline Stop and Buy Filters
Version 6 provides trendline Buy Filters and Sell Stops. Trendlines are one of the oldest
and still most useful technical analysis tools. Trendlines can be used to determine when a
stock or mutual fund has broken down in an upward move, i.e., used as a sell Stop, or
trendlines can be used to determine if a downward move has ended and it is safe to buy,
i.e., Buy filter. The vast majority of trendline users use a manual method to draw the
trendline on a paper chart or a computer screen. Programming a computer to calculate a
trendline that a human brain can draw in a few seconds is a daunting task; however, there
is a tendency when manually drawing trendlines to “force” the line to other expectations.
A mathematical algorithm is not subject to such expectations, but at the same time cannot
“see” other potential complications and complexities.
Adding trendlines to the Buy Filter and Stops required changes in the layout to three tabs:
Strategy, Stop Loss, and Buy Filter tabs, but you should quickly become comfortable with
the new layout.
Details of the Trendline algorithm are provided in the Appendix A.
NOTE: The algorithm to determine trendlines is very computer time intensive. If you
are using a very large trading family you will notice a long delay to evaluate the strategy. More about this in the Appendix A discussion.
Changes in Version 5
8
Page 9

This section will cover enhancements in FastBreak Version 5 and is of interest to users of
previous versions of Standard FastBreak. Note: For users of previous versions of Fast-
Break Pro see the Upgrade Notes in the supplemental FastBreak Pro manual.
You may ask how Version 5 of Standard FastBreak is different from previous versions
and if you should reread the manual. The answer is that the changes are extensive and we
suggest you read the entire manual to understand the enhancements. The examples are
for the most part unchanged and you can skip these sections if you are a veteran FastBreak user. The following list of changes covers upgrades from Version 4 to Version 5.
Some users may be upgrading from a very old version and a section follows to cover upgrades from Version 2. Note: There wasn’t a Version 3 of Standard FastBreak.
Changes between Version 4 and Version 5
Capability to build market timing systems and signal files.
o We believe this is the most exciting new functionality. This functionality was
developed, in large part, to better trade individual stocks. Over the years we
have found that FastBreak stock trading systems have the potential for fantastic returns, but we have also found that controlling drawdown is a challenge in
bear markets. We have found that even in severe bear markets there will be
stocks that rally strongly, however, these rallies often fail resulting in a whipsaw trades. We saw the need for market timing signals that would keep the
trading system out of the very worst of markets. There are numerous market
timing signals available but so many of these are not robust and fail the test of
time. Also, we wanted to develop our own signals that met our needs, e.g.,
switches per year, drawdown, markets traded etc.
o One disadvantage of the many market signals available is that they are devel-
oped for a specific index, e.g., S&P 500 Index. Often, there is a divergence in
different stock indexes, i.e., small cap stocks performing well while large cap
stocks are not. FastBreak allows the use to combine multiple indexes (or any
stock, fund, FNU file) into a family. This allows the user to build signals that
stay in a buy mode if any of the indexes are in an uptrend and will only signal
a sell signal if all are in a down trend.
o We have used this capability to build signals for trading diversified mutual
funds and individual stocks. We have also used it to build market sector specific signals; for example, we have built signals to build trading systems for
energy stocks.
o Signal file building systems can be run like a regular FastBreak trading sys-
tem, except the output is a FastTrack signal file. This signal file can then be
used in a FastBreak trading system or other FastTrack applications.
Rank using Ulcer Performance Index (UPI). This option will tend to purchase high-
UPI funds and produce strategies that have a high UPI equity curve.
9
Page 10

Rank using Sharpe Ratio. This option will tend to purchase high Sharp Ratio funds
and produce strategies that have a high Sharp Ratio equity curve.
Removed the Long Rank + Short Rank momentum ranking option. This option had
the tendency to give ambiguous ranking order because the value produced was an integer (whole) number and more than one fund could have the same value.
Removed the Families/Individual option on the Funds/Index tab. This option was
never very useful.
Changed the logic in the Harnsberger option. Previously, Harnsberger would only
trigger a sell if you were not holding the top Buy ranked fund. This made sense on
early versions of the program when we didn't have buy filters. Now, it is very common for you not to hold the #1 Buy ranked fund because of the filters. Also, with
some users having large numbers of funds or stocks in their trading families, the difference in rate of change between the #1 Buy ranked fund and the Nth Buy ranked
fund may be very small. However, the Nth ranked fund may meet all your buy criteria
when the #1 fund does not. We changed the logic so that it will always try to buy a
top ranked fund that meets your buying criteria. The fund sold must meet your minimum holding period value. This is now very similar to setting the top % to zero percent. One difference is that if more than one fund can be sold on a given day the
Harnsberger option will sell the weakest (as measured by Sell ranking) fund. We now
put an H in the Why Detail file column to indicate a Harnsberger sell.
Stop loss using a short/long Exponential Moving Average (EMA) crossover. This is
similar to the current EMA stop except that the fund NAV is smoothed with a short
term EMA.
Buy filter using a short/long Exponential Moving Average (EMA) crossover. This is
similar to the current EMA Buy filter except that the fund NAV is smoothed with a
short term EMA.
The next four enhancements are all similar in that they allow the user to modify stop
or buy filter options according to market conditions or a user defined input file. The
modification is triggered when an index (or any user defined fund or FNU file) drops
below its user defined EMA line. For example, if the S&P is used as the index then
the parameters are not modified as long as the index stays above a user defined EMA
line. If the S&P falls below its EMA line then a factor is applied to the standard
value. A simple example is that when the market is in a strong uptrend high beta
funds may be a good investment option. However, when the market is in a downturn
or trading market it may be prudent to purchase low beta funds.
o Adjust the Trailing Stop Loss value based on market conditions or external
file input.
o Adjust the EMA Stop value based on market conditions or external file input.
10
Page 11

o Adjust the Beta Buy filter value based on market conditions or external file
input.
o Adjust the EMA Buy filter value based on market conditions or external file
input
Beta buy filter can now be a non-correlated beta as an option. Beta is the ratio of the
volatility of a fund divided by the volatility of an index (typically the S&P 500), multiplied by a correlation value between the fund and the index. If a fund has a low correlation to the index it can have a low beta but be a very volatile fund. An example
would be a gold fund. Gold funds have a low or even negative market correlation and
yet are very volatile. Filtering on standard beta may not filter out a gold fund. Using
the non-correlated beta filter allows a user to mix a wide range of fund types including those that may not have a high market correlation value, e.g., bonds, international
etc., in a trading family and have the ability to filter those with high volatility.
Improved the BOSS stop option to be more effective with some ranking methods.
Ability to begin the effectiveness of a stop option later than the first day. Previous
versions required the stop to be in effect on the first day a fund was purchased. Some
users have the requirement to hold a fund for a fixed number of days after purchase.
They can now start a stop after this number of days.
Ability to search the Buy and Sell ranking list by fund symbol. Some users have very
large trading families and it is difficult to locate a particular issue in the ranking list.
This option allows the user to do an efficient search for the fund symbol.
Additional Changes between Version 2 and Version 5
Note: You can load trading systems developed with Version 2 of FastBreak into this
new version, however, the first time you load an old trading system you must input the
beta /correlation index and calculation period on the Funds/Index tab. After you have
entered this information you will need to resave the DFT file.
Load all three FastTrack databases at the same time
Batch mode
Alpha ranking
Breakout Optimization Method (BOOM)
Better Opportunity Sell Signal (BOSS)
RSI stop
Numerous buy filters: EMA, parabolic, RSI, beta, and correlation
New information in summary and detail files
Enhancements to adjustment factor options
Because of changes in program calculation logic you may see changes in results from
your trading systems developed with prior versions of FastBreak. This is why we rec-
11
Page 12

ommend you keep the old version of FastBreak on your computer until you verify your
systems haven’t changed. Here are just a few reasons why strategies my give different
results with the new version:
In previous versions of Standard FastBreak if a stop was hit, but the fund hitting the
stop was still the top ranked fund, the detail file would show the fund being sold and
then repurchased. New logic always checks to determine if the fund being purchased
was the one just sold. If that is the case the sell is negated.
We removed the Adaptive Moving Average as a stop option. This was done because
we never found the AMA to be a particularly effective stop option and we wanted to
make room on the Stops tab for a much more effective new option called BOSS.
Change in the logic for the Rate of Return Sell stop. We now check a candidate fund
prior to purchase for this stop to verify that it exceeds the stop parameters specified.
12
Page 13

4.0 FastBreak Trading System
FastBreak uses a trading system method that buys mutual funds showing strong relative
trends in price and sells funds that are showing poor relative trends in price. You may
hear traders refer to this type of trading system using many names: market sector upgrading, momentum investing, trend following, fund ranking, and relative strength trading.
We will take a quick look at each of these concepts, because there are small differences,
and explain how FastBreak works.
Market Sector Upgrading (MSU) The simple explanation of MSU is moving your investment out of a sector of the market that is showing poor relative strength and into a
sector of the market that is showing the best or better relative strength. For purposes of
this discussion, the word “sector” refers to industry groups that make up the market, for
example, health care, transportation, technology, etc. An example of MSU would be a
move from the energy sector into the health care sector if health care funds are showing
better price strength relative to energy funds.
MSU tends to be a fully invested trading strategy that relies on being in the strongest sector of the market for good performance rather than using market timing. However, in
bear markets, money market funds can be a considered a strong sector for investing.
Many investors using MSU use the Fidelity Investments Select Funds, but there are other
mutual funds offered that concentrate on a narrow sector of the market, for example, Rydex and ProFunds have a large number of sector funds.
Why do different sectors of the market rotate in and out of favor? There is probably no
single answer to this question. Some of the rotation may be due to the economic cycle
(The All Season Investor by Martin J. Pring is an excellent book on this subject) or presidential election cycle. Political climate can be another influence. Health care funds were
impacted in 1993 with the debate on a national health care plan but bounced back with
excellent gains in 1994 and 1995 when that plan was abandoned.
Momentum Investing Momentum investing (not to be confused with earnings momentum) buys funds showing a surge in price with the thought that the price will continue to
move upward. This system is not limited to any particular type of fund.
Trend Following Trend following systems rely on longer term, major up trends in price.
Trend following systems usually don’t get in at the start of a major up trend or get out at
the top of an up trend. The system usually waits until an up trend is firmly established before purchasing a fund and often waits until the trend is clearly ended before selling. The
system is not limited to any particular type of fund.
Relative Strength Trading and Ranking Strategies Trading systems based on relative
strength or ranking are very similar. Relative strength usually compares the price action
13
Page 14

of a fund to an index and buys the fund that is showing the strongest strength compared to
the index. Ranking strategies compare the price action of a fund to a group or “family” of
other funds. The fund showing the greatest percentage change in price is purchased.
There are obvious similarities in all these systems. FastBreak uses the Ranking method to
select the funds to buy and sell. The how or why a sector or fund is rotating in or out of
favor is not as important as making an accurate determination that the rotation is happening, and the trend will continue long enough so that the movement is tradable.
There are many good technical tools available to help determine when the trend has
changed, such as trend line analysis, RSI, moving averages and AccuTrack. Some techniques only help predict a trend for a specific fund that may be changing: trend line analysis and moving averages are examples. Other tools and indicators not only give buy and
sell indications but can show relative strength between different funds, AccuTrack for
example.
No technical analysis technique is perfect. Many techniques require the user to “interpret”
or make a value judgment. Others require considerable amounts of time to calculate or
evaluate changing trends. Finally, if many different funds give a buy signal, there is always the question of which funds should be purchased for the best return?
Many FastTrack users have been using “fund ranking” to determine the particular fund to
buy or sell, and this is the system FastBreak uses. Fund ranking is a very simple concept
to explain, but refer to the FastTrack manual for a complete description. First, the investor makes a family of the funds under consideration for trading. The family is then
“ranked” for gain over a given period (15 market days for example) using the blue pole
and the “Rank” command. The funds are listed using the “List” command. The investor
typically sells a fund that has dropped out of some predetermined top percent of the
ranked funds (50% is common). The investor then buys the top “ranked” fund. As an
example, if the investor makes a 15 day rank on 20 sector funds, and the fund being held
is more than 10 places down on the ranked list the fund is sold and the money rolled into
the first fund on the ranked list. The following table is used to illustrate the example.
The table is a 15 market day FastTrack rank list. Assume this list contains all the funds in
the trading family. Any fund below FSVLX on the list would be sold. The fund to purchase is FSELX.
SELECT Family Ranked from 01/10/96 to 01/31/96 ending 01/31/96
No Symbol Fund Name Gain
---- ----- ------------------------------- ---- ---- ---- ---- -----1 FSELX Fidelity Sel Electronics/008 13.8
2 FSPTX Fidelity Sel Technology/064 10.0
3 FDCPX Fidelity Sel Computers/007 9.7
4 FIDSX Fidelity Sel Financial Svc/066 9.6
5 FSLBX Fidelity Sel Broker & Inv/068 9.6
6 FSRBX Fidelity Sel Regional Bank/507 9.0
14
Page 15

7 FBIOX Fidelity Sel Biotechnology/042 8.5
8 FSCPX Fidelity Sel Consumer Prod/517 8.4
9 FSCSX Fidelity Sel Software-Comp/028 8.2
10 FSVLX Fidelity Sel Home Finance/098 7.3
11 FSHCX Fidelity Sel Medical/505 7.0
12 FSCGX Fidelity Sel Indus Equip/510 6.7
13 FDFAX Fidelity Sel Food & Agric/009 6.6
14 FSPHX Fidelity Sel Health Care/063 6.6
15 FSPCX Fidelity Sel Insurance/045 5.9
16 FSDCX Fidelity Sel Develop Comm/518 5.8
17 FSPFX Fidelity Sel Paper & Forest/50 5.1
18 FSDAX Fidelity Sel Defens & Aero/067 4.8
19 FSCHX Fidelity Sel Chemicals/069 4.7
20 FSDPX Fidelity Sel Indus Material/50 4.6
This is a simple concept; however, there are many questions an investor could ask. It was
these questions that lead to developing FastBreak. The following list has a few of the
questions FastBreak allows the user to run historical analysis on:
What if the buy ranking period is different from the sell ranking period?
What if the fund has a minimum holding period to avoid transaction fees?
What if a strategy has a stop loss, even if there is a transaction fee?
What if more than one fund is held?
What if there is a change in the point a fund drops in the ranked list before it is sold, i.e.
top 50%, 30%, 20%....?
What has been the historical maximum draw down for a strategy?
What are the Ulcer Index and Ulcer Performance Index for a strategy?
What happens to the historical performance if funds are added or removed from a trading
family?
What if I want to add a fund or stock into my strategy using the FastTrack FNU file format?
What if I use a market timing signal in my strategy?
Warning, back testing is no guarantee of future results, but it can provide
very useful information when developing trading systems.
15
Page 16

5.0 Technical Support and Upgrades
Note: Do not call Investors FastTrack for technical support.
Do not use the 800 order line number for technical support. This is a commercial
order line that only takes orders and they are not equipped to answer any questions.
Any messages left with the order line will not be returned.
Please read this entire manual and check the FAQ chapter before contacting support. We
have tried to make this software and documentation as user-friendly as possible. You
should have a basic working knowledge of Windows, i.e., how to copy and move files,
change directories, select drives, etc.
Technical support is typically provided by email. You will usually receive a response
within 24 hours.
We can be contacted at email2ew@edge-ware.com. This address will send your note to
both Ken and Nelson and will help you receive a timely response. We recommend that
you always use this address. If one of us is traveling or otherwise unavailable your note is
likely to be answered sooner if it is sent to both of us.
If your support issue can’t be handled by email we will arrange for telephone support.
We charge $25 for replacement installation CDs.
There is no charge for most technical support. Problems with reinstalling FastBreak is
our number one tech support problem. We receive a large number of support requests
from users reinstalling FastBreak because of hard drive failures, purchase of new computers, etc. We reserve the right to charge $50 to assist in reinstallation of the product,
starting six months after purchase. If you follow the following steps you shouldn’t have
any problem reinstalling.
Reinstalling FastBreak
You MUST use the installation CD to reinstall. We have had a number of users just try
to copy files to the new computer or hard drive. This will not work. Here are the steps:
Install FastTrack first
Do at least one download and update of FastTrack data
Verify that the FastTrack account number on this computer matches the account
number on the FastBreak CD
Install FastBreak using the installation CD
Go to our web site and download the latest upgrade, if one exists
16
Page 17

Upgrades
We provide minor upgrades to FastBreak on our web site, and if you encounter an error,
we suggest you download the latest version of the software because this will often solve
the problem. The Edge Ware Internet Web site (www.edge-ware.com) always has the
latest version for download along with release notes.
FastBreak is constantly improving, and we try very hard to get those improvements in the
hands of our users as fast as possible. As we make changes new versions are often placed
on our web site for free downloading. This creates problems with keeping documentation
up-to-date for the latest version because it isn’t practical to rewrite the manual each time
we make a change. In most cases, the installation you receive will actually be the most
recent version, and there may be an addendum in this manual that will describe how the
recent version is different from what is described in the main body of the manual.
17
Page 18
6.0 Installing FastBreak
Note: If you computer doesn’t have a CD drive you can still install FastBreak. If you can
get access to a computer with a CD drive then copy all the installation files on the CD to a
memory card. Load the files on the new computer into a temporary folder. C
To install FastBreak:
Note: Windows 7 Installation Note – During installation on a computer with Windows
7 you may get an error during installation (the error may mention mcf40.dll) If this
occurs, click Ignore and the installation will complete properly.
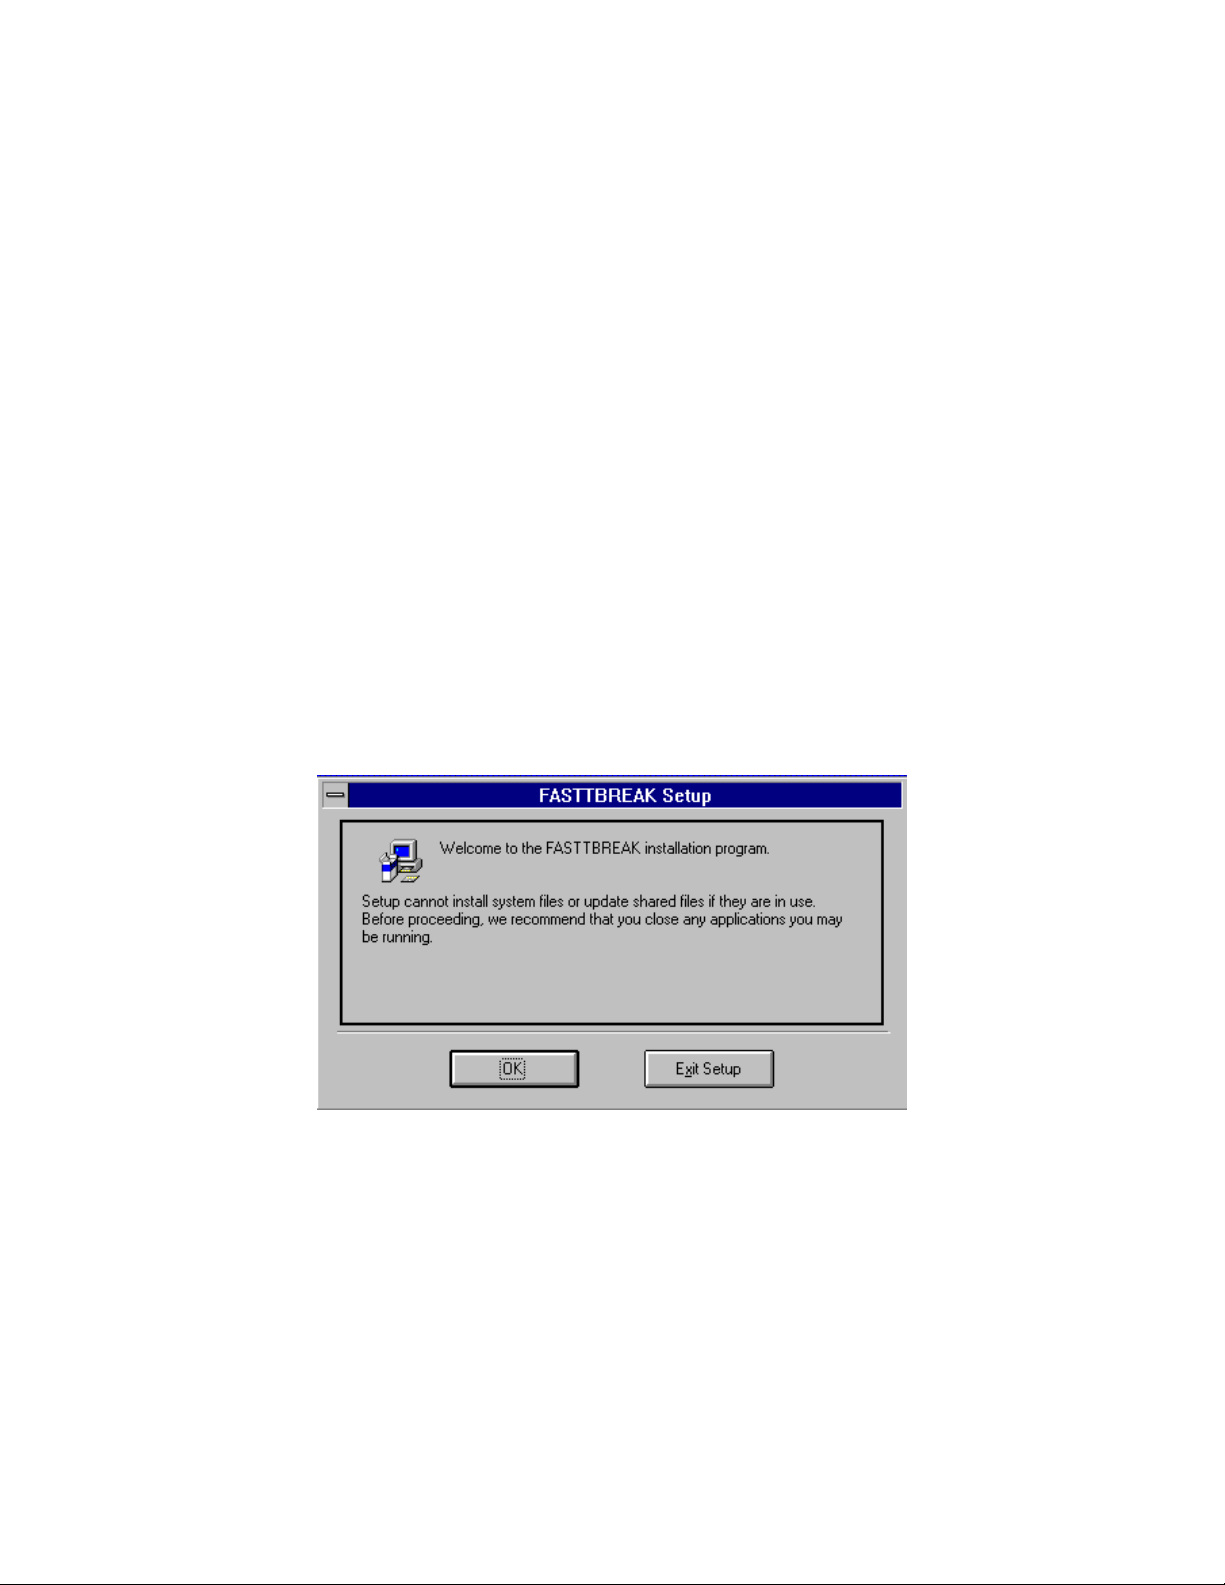
1) Stop any application that may be running. Note: We have had a number of users call
with installation problems because Microsoft Office was running in the background.
2) Insert the installation CD and double click the SETUP.EXE file to start the installation.
(Note, there are other “Setup” files on the CD so be sure to click only the SETUP.EXE
file)
3) The first screen you will see is:
This is a warning to close any applications you may have running. The various versions
of Windows have different methods for determining applications that are running. Consult your Windows manual to determine how your version works. If you don’t have applications running select OK otherwise, exit Setup and close the applications.
18
Page 19
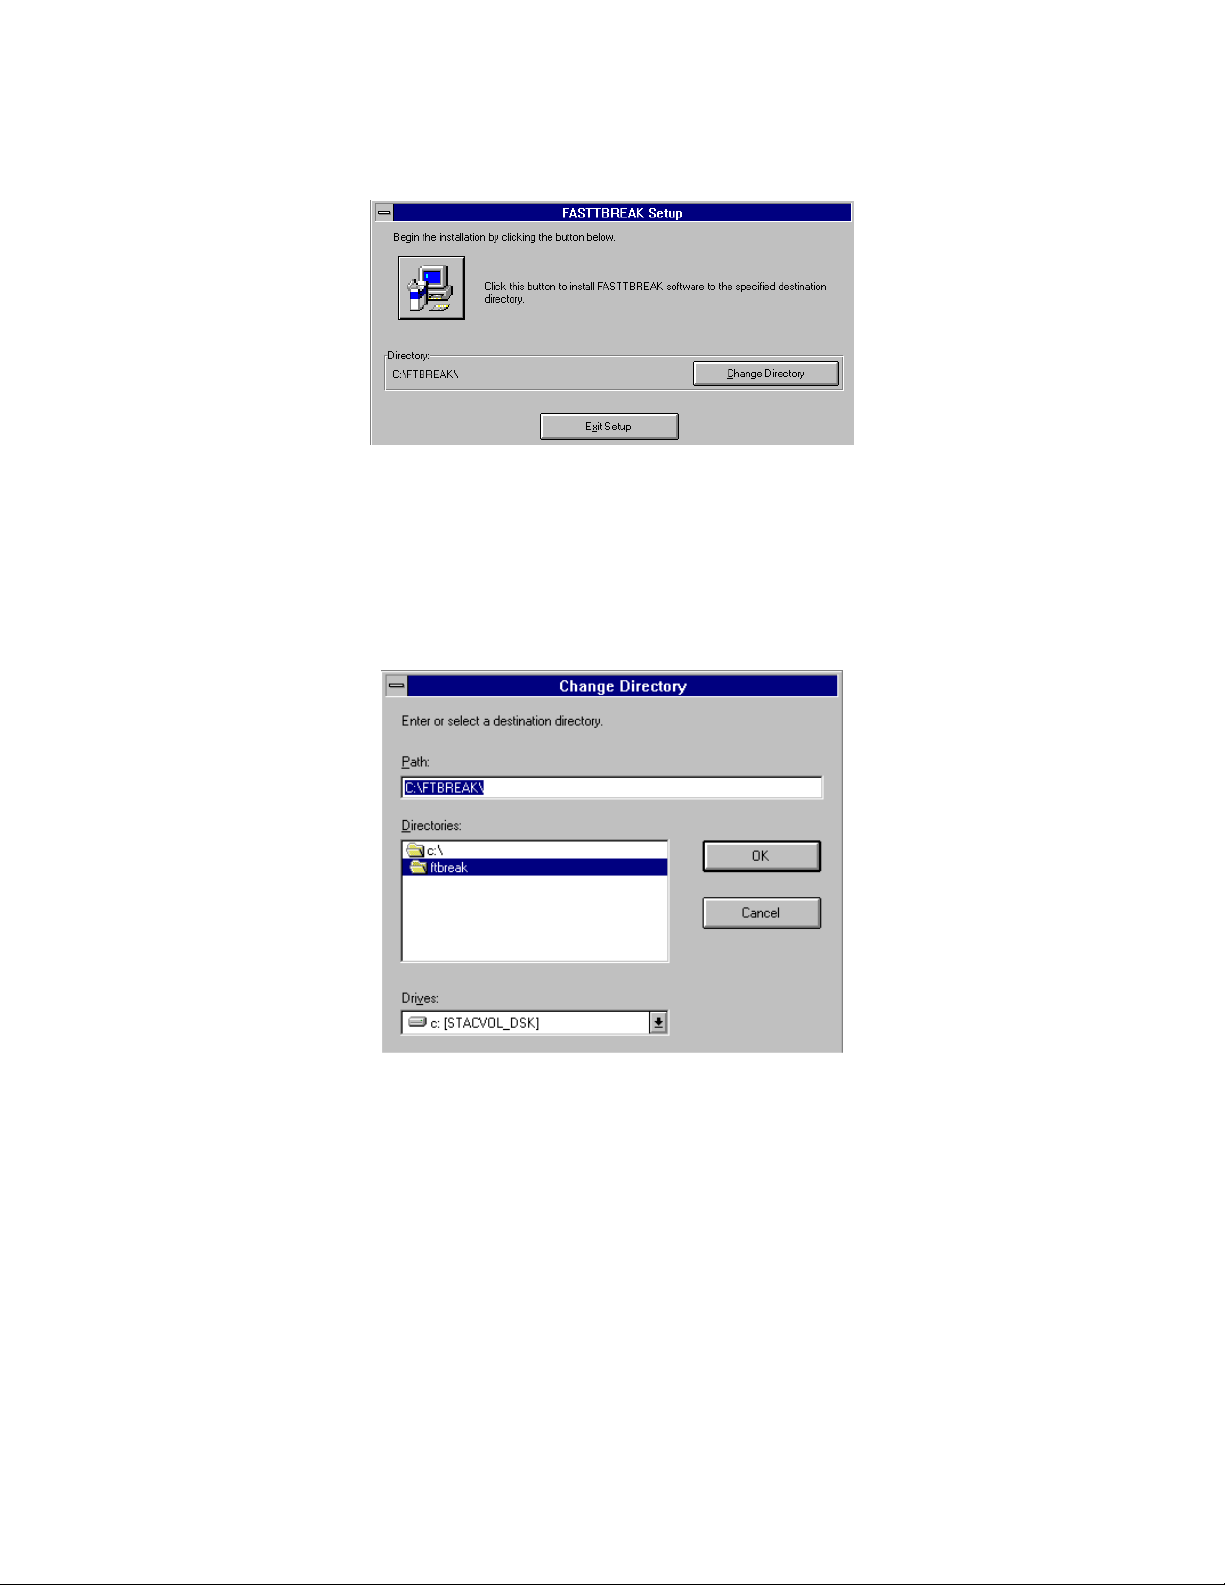
4) The second screen you will see is:
The setup program is asking the name of the drive and directory where FastBreak is to be
installed. The default is C:\FTBREAK (FTBREAKP for Pro), and we suggest that you
use the default directory name. If the default is acceptable click on the button that resembles a computer.
5) If you need to change the drive letter or directory path click the Change Directory but-
ton and the following screen will appear:
This screen allows you to change the drive and/or the path and directory. If you need to
change the drive, click on the Drives pull down arrow button to get a list of your drives to
select from. Once you have selected a drive, click on the drive folder to see a list of existing directories for installation or type a directory name in the Path box, then click the OK
button.
6) A FastBreak icon will be created in your Windows Programs environment.
19
Page 20

Reinstalling FastBreak
Note: Windows 7 Installation Note – During installation on a computer with Windows
7 you may get an error during installation (the error may mention mcf40.dll) If this
occurs, click Ignore and the installation will complete properly.
Reinstalling FastBreak is our number one tech support problem. Users crash hard drives,
buy new computers, new laptops, etc. You MUST use the installation CD to reinstall.
We have had a number of users just try to copy files to the new computer or hard drive.
This will not work. Here are the steps:
Install FastTrack first
Do at least one download and update of FastTrack data
Verify that the FastTrack account number on this computer matches the account num-
ber on the FastBreak CD
Install FastBreak using the installation CD
Go to our web site and download the latest upgrade, if one exists
20
Page 21
7.0 FastBreak Options and Functions
FastBreak is run from the Windows environment, and your installation should have created an icon when you click on the Windows Start button and go to Programs. If you
want to put an icon on your Windows desktop find the ftbreak.exe (ftbreakp.exe for Pro)
and put a shortcut to this file on your desktop. Refer to your Windows manual for guidance on how to do this. Click the icon as you would to launch any application. The first
time FastBreak is run, it will check your C: drive for the FastTrack database. If the data
is not found, a window is displayed that lets you pick the drive and directory where the
FastTrack data is located. See the installation chapter for details on how to complete installation.
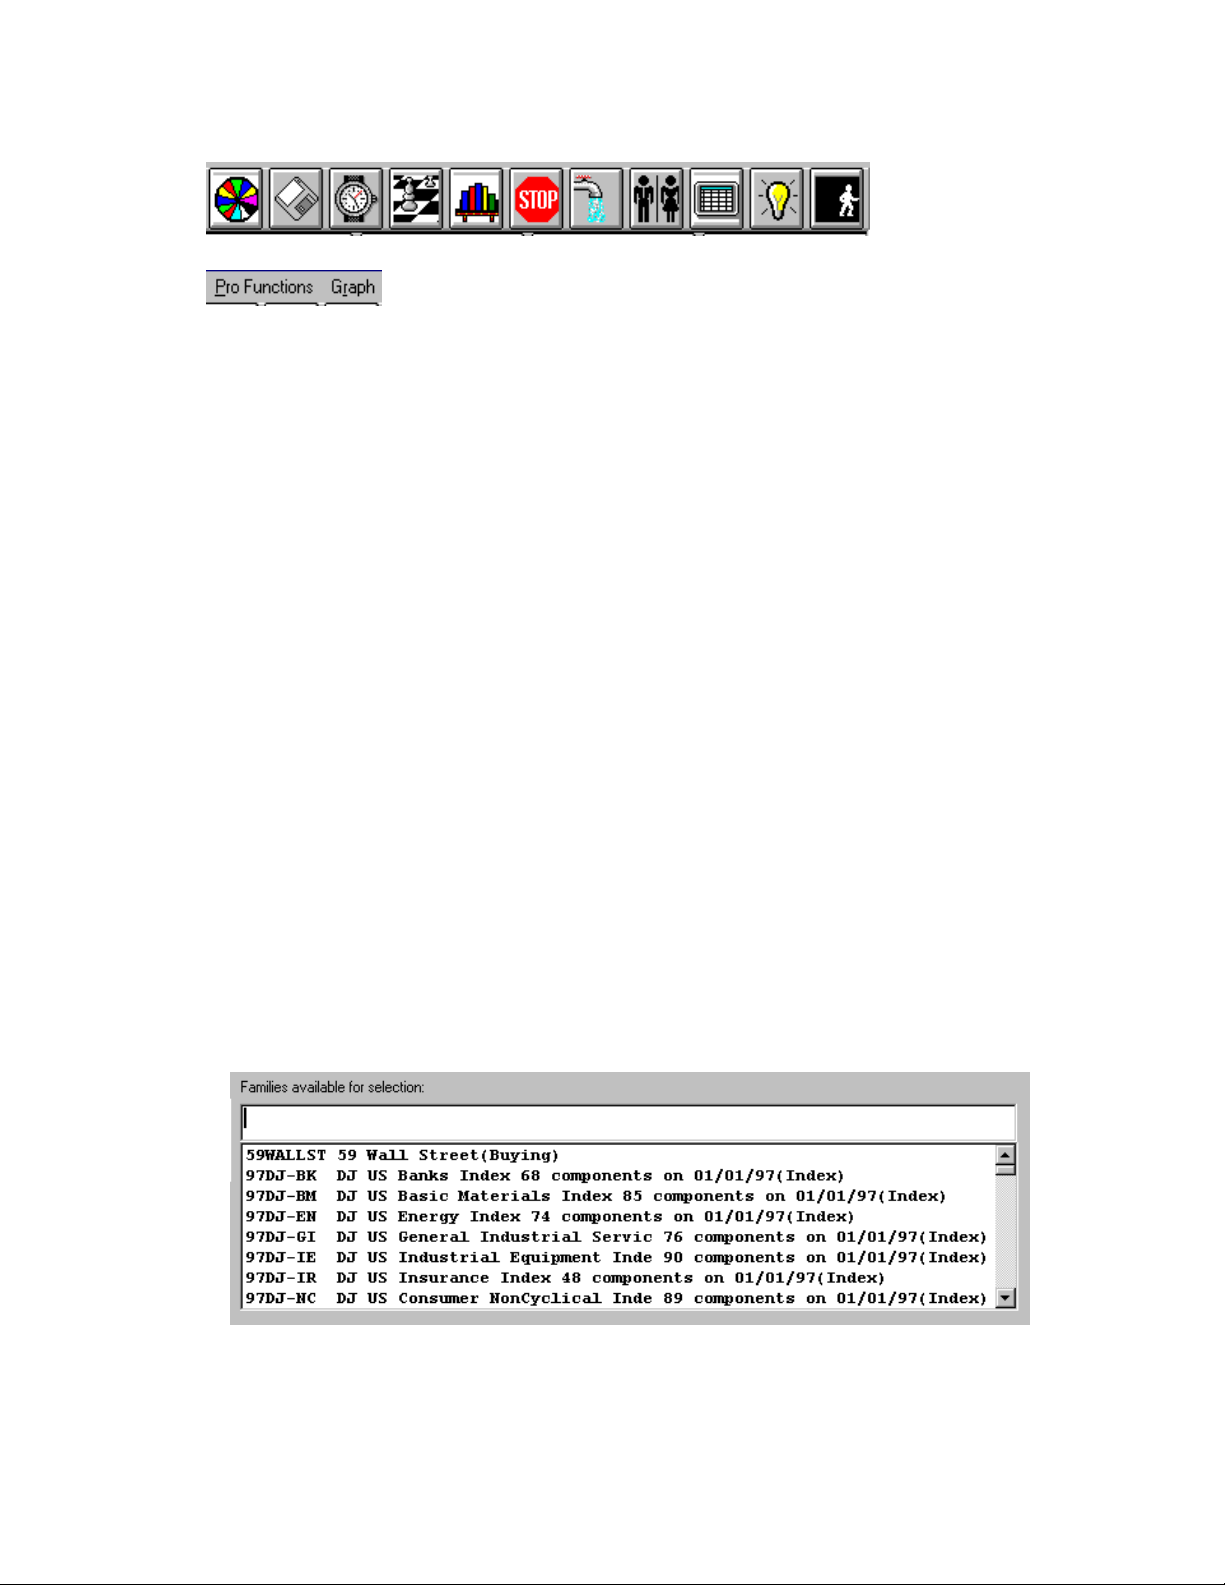
When FastBreak is launched the main menu will appear:
Note: All the full screen prints in this manual are from FastBreak Pro. Standard
FastBreak will not have the following icons and pull down menus (Pro Functions and
Graph). This manual will only address functions common to both Standard FastBreak
and FastBreak Pro. These icons and menus control functionality unique to FastBreak
Pro:
21
Page 22
When FastBreak is launched, it will read all the family names in your FastTrack directories (Ft\Ftdef, Ft\Userdef, and Ft\Ft4win\Sftdef), including user created families, and load
all the fund names including your FNU files. If FastBreak hits an error during the loading of your FNU files this indicates you have a corrupt FNU file. You will need to move
all your FNU files from your FastTrack (FT) folder to a temporary location. Now, try to
restart FastBreak. If FastBreak launches you will need to determine which of your FNU
files is corrupted. This can be done by moving the files one at a time from the temporary
location and launching FastBreak after each transfer.
The menu may initially look very complicated but is quite logical and user friendly. We
will step through each menu item and describe each feature. FastBreak uses the very
common Windows Tab and Tool Bar method of presenting functions and data.
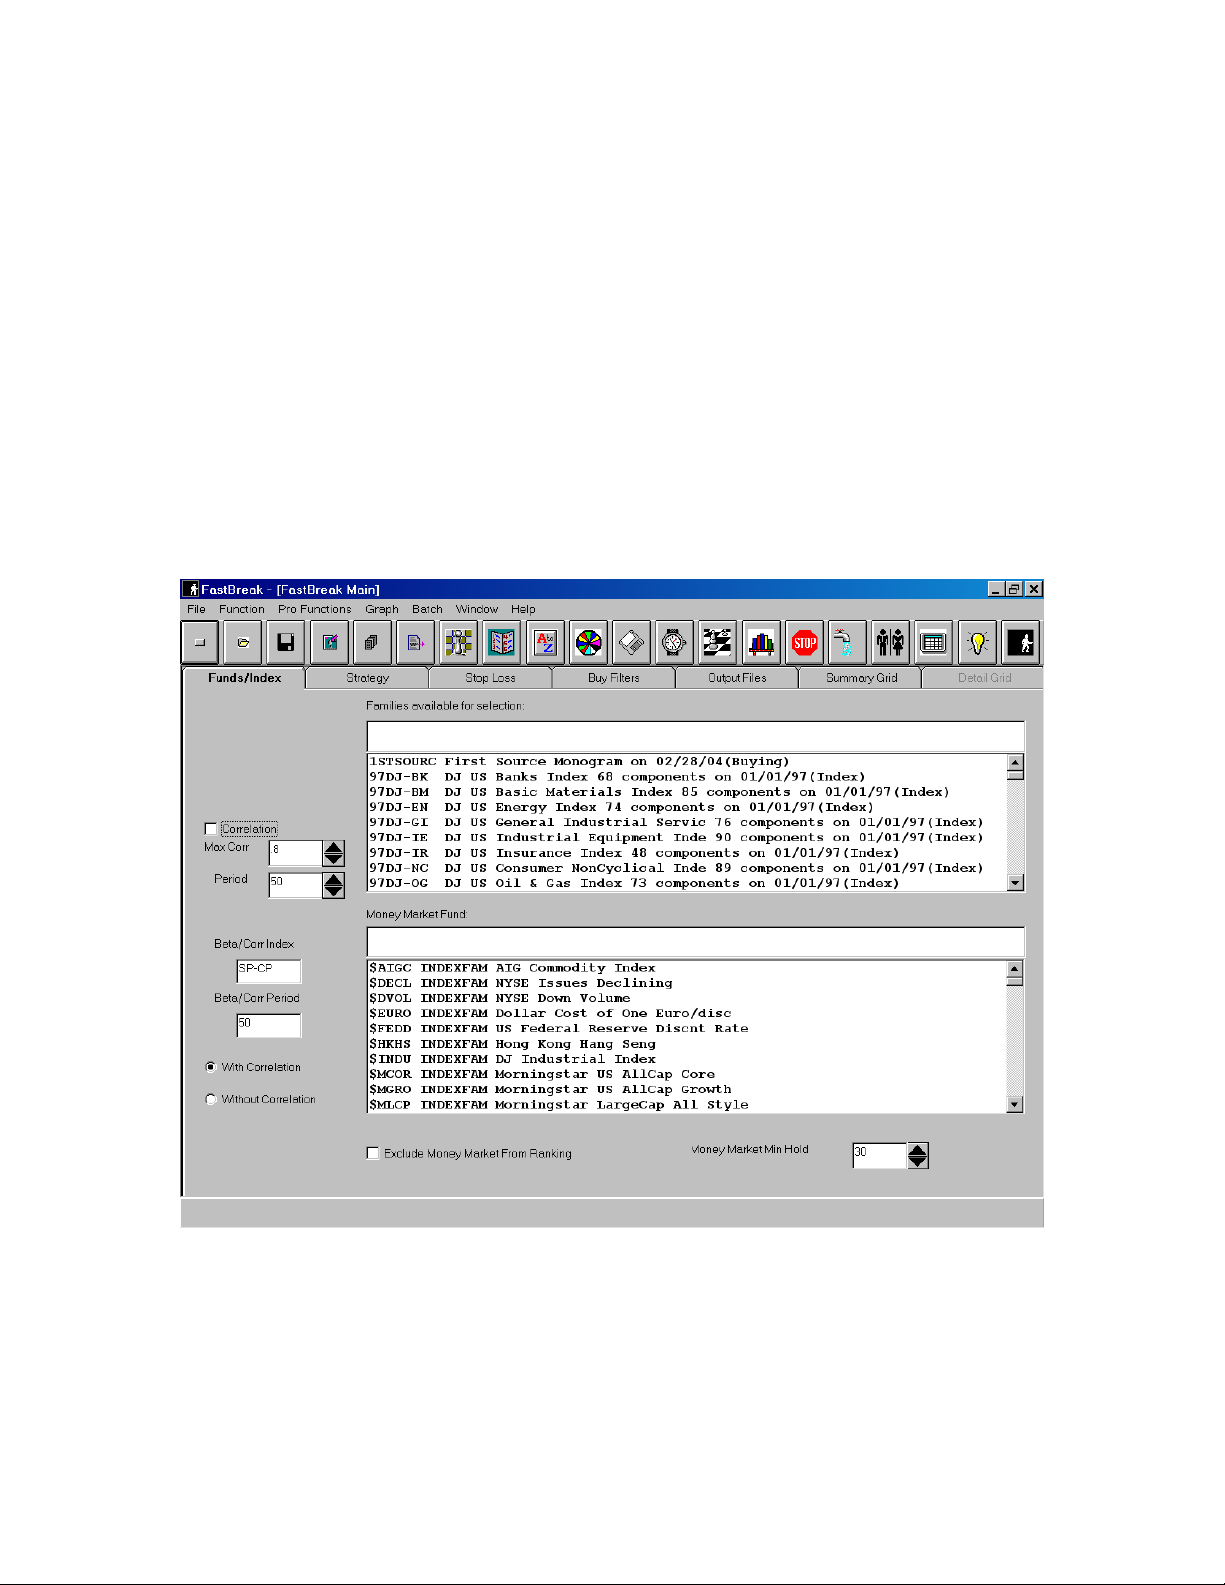
Funds/Index Tab
When FastBreak launches the Funds/Index Tab is on top. See the previous page. This
screen is used to select your Trading Family and Money Market Fund to use in the trading
strategy.
Selecting your strategy trading family
FastBreak allows selection of a prebuilt family of funds, either a family built by FastTrack or user-built family. See your FastTrack manual on how to build a trading family.
All the available families will be shown in the top Families available for selection box.
Put the cursor in the empty line just above the first family name and start to type the name
of the family to be traded. FastBreak will find the family as the name is typed. Note:
The indexing may have problems if you have family names starting with unusual
22
Page 23
characters such as ~,@ etc. You can also use the slider bar to the right of the family
names to find the family of interest. Once the family is located, use the cursor and left
mouse button to click the family. It will highlight as in the above screen. Note: The
highlighted family will NOT appear in the box where you started to type the name.
Note: FastBreak will read all your FNU files. When these files are made part of your
trading family, FastBreak will include them in the trading strategy. See the FastTrack
manual for information on FNU files.
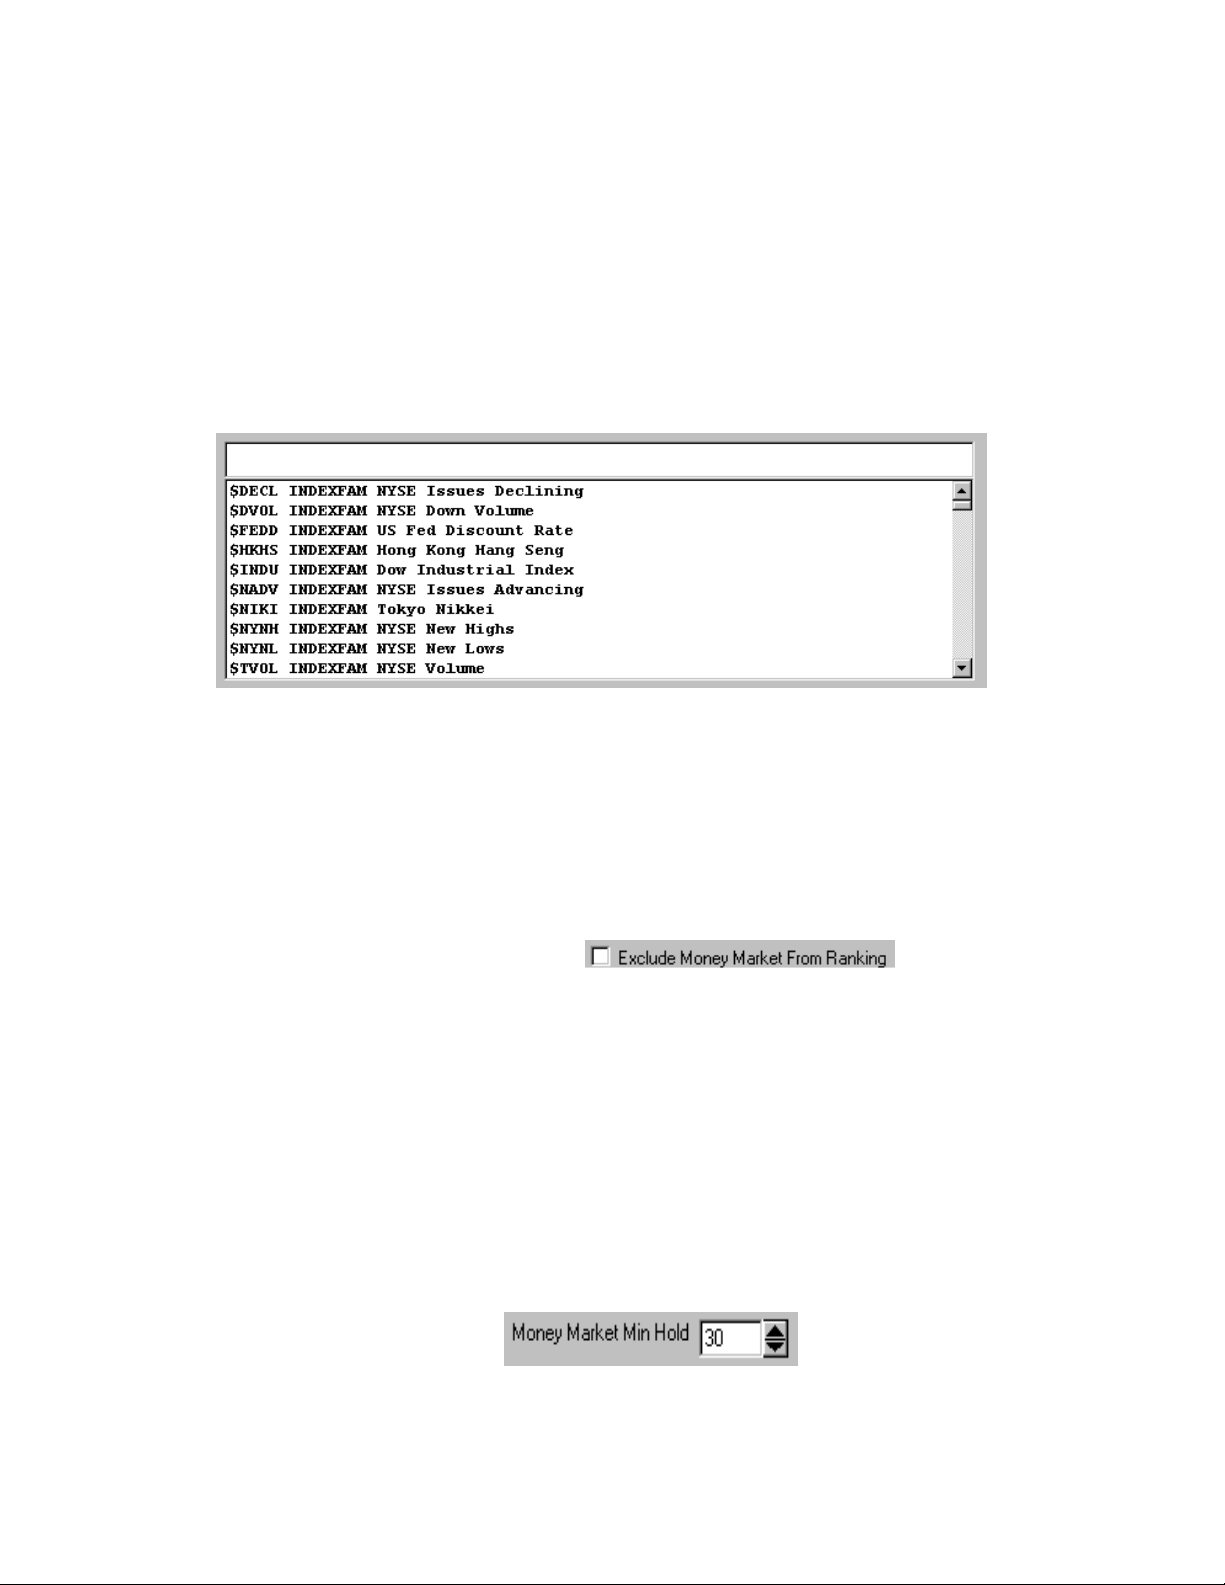
Money Market Fund Selection
Next, select a money market fund from the list of fund names just to the right of the
“Money Market Fund” label. Any fund, stock or FNU file can be selected as a money
market fund and the selection is made in the same way families and funds are selected.
Notes: When selecting a money market fund make certain the fund is available the entire time period you are planning to test. FastBreak will give you a warning notice if
the fund doesn’t span the testing period. When building trading families in FastTrack,
do not put your money market into the trading family.
Exclude Money Market from Ranking
Many users only want to go into the designated money market fund when using a market
timing signal file. Clicking this option will prevent the money market fund from being
selected as part of the ranking strategy, but on a signal file “sell” the money market will
be used. Note: Even if you use this option you may sometimes find that FastBreak has
purchased the money market fund even when not on a signal file sell. If FastBreak is
trying to purchase a fund but none of the funds in your trading family meet your buying criteria, then money market will be purchased as a last resort. For example, perhaps you are using the Exponential Moving Average buy filter, but all the funds are
below the specified moving average, FastBreak will purchase the money market fund
as a last resort.
Money Market Minimum Hold
23
Page 24
If using money market in a ranking strategy, this menu item will allow you set a minimum holding period for the money market fund before it can be sold. Many users like to
set this to a short value because money market funds usually do not have a minimum hold
period or short term trading fees. If you use a substitute fund in place of a money market
fund, remember that FastBreak does not apply any short term trading fees to the money
market. Note: The period is in calendar days not market days.
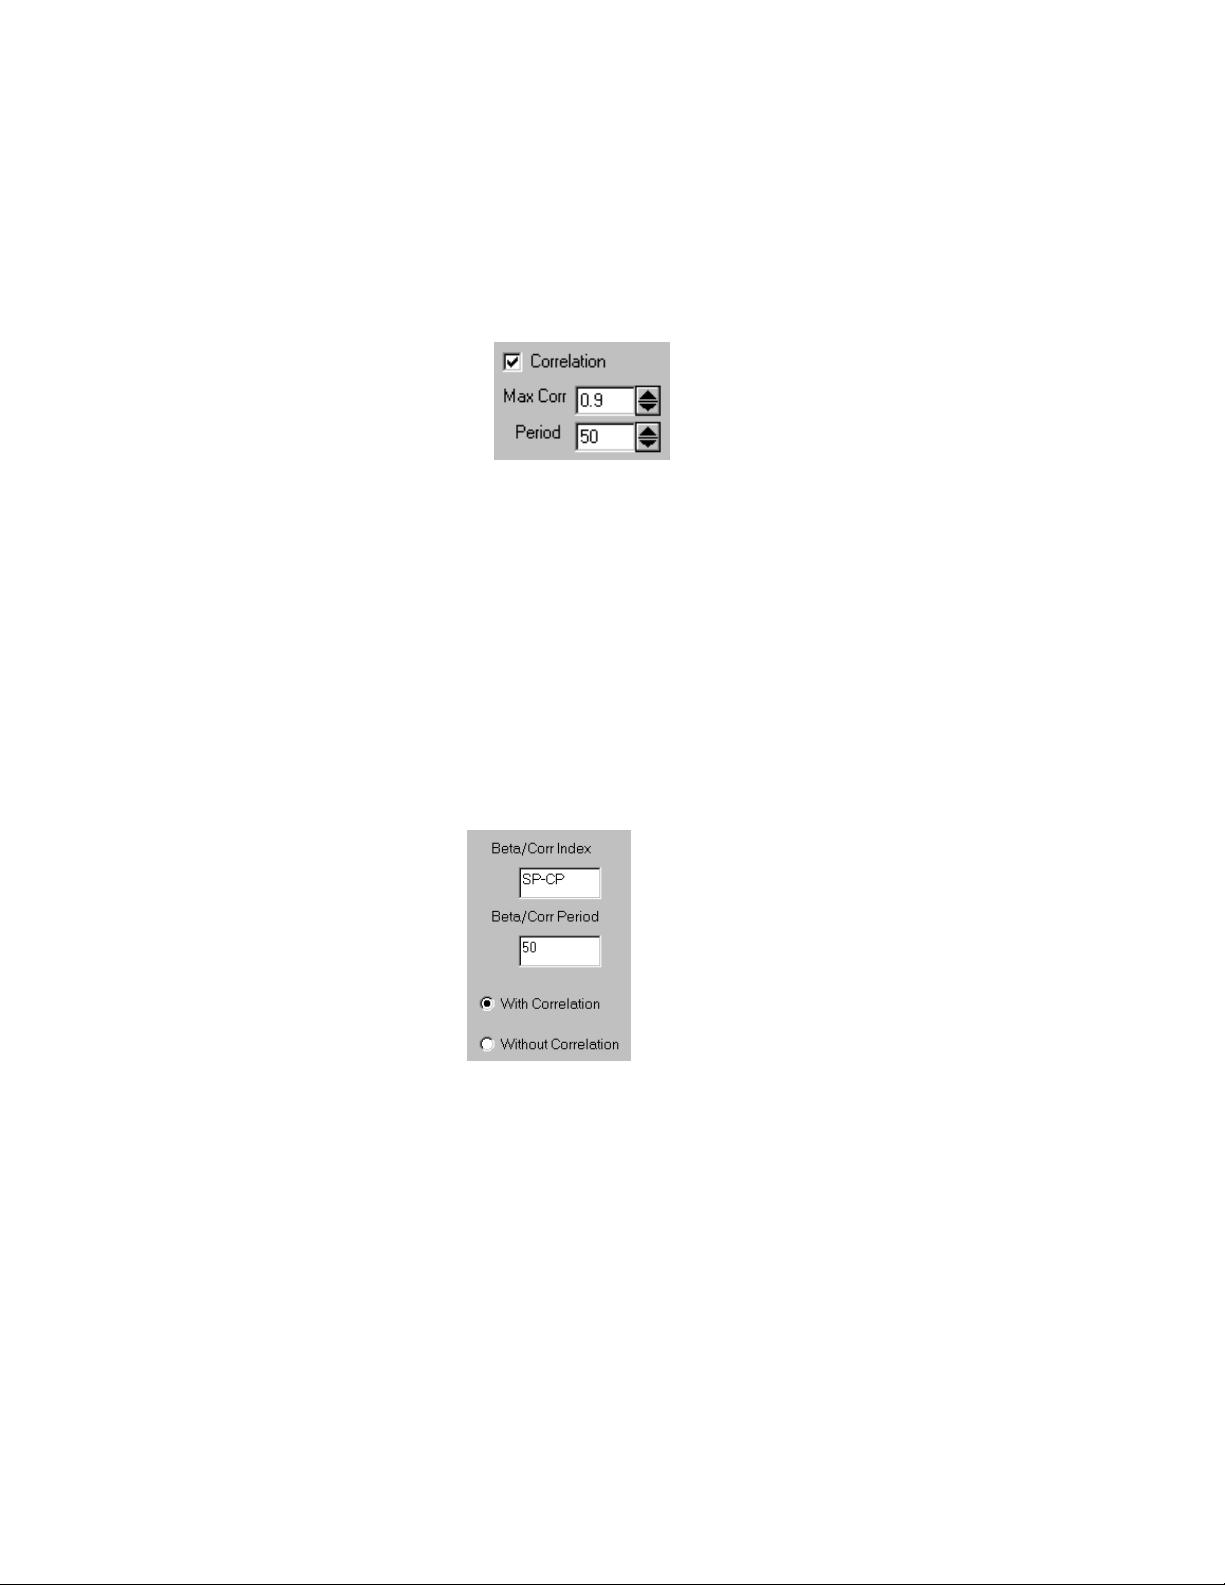
Maximum Correlation Check
This option allows a strategy to avoid buying and holding similar funds at the same time.
If the correlation option is checked, the fund under consideration for purchase will be
compared in correlation to the other funds currently held by the strategy. If the fund under consideration is correlated greater than the specified value, then the fund will be rejected for purchase and the next highest ranked fund will be considered. The correlation
is calculated over a user defined period. We recommend that at least 50 trading days be
used for the calculation. Correlation can range from -1.0, negative correlation, to perfect
correlation of 1.0 Note: Many funds will become highly correlated over short periods
even though they may have low correlation over long time periods. For this reason the
correlation value should be set to a high value. A reasonable maximum correlation
value would be 0.9 or higher.
Statistics Index and Period
FastBreak calculates a variety of statistics on your trading system, including Beta and
Correlation. These statistics will be covered in the Output section of the manual. To calculate some of these statistics, FastTrack requires an index to be specified. The default
index is the S&P 500 index (SP-CP in the FastTrack database). If you want statistics calculated using a different index, you must specify the FastTrack symbol here. A period, in
market days, is required for the calculation. The default is 50 days. We don’t recommend periods shorter than 50 days, but longer periods are certainly reasonable. Finally,
the user has a choice of calculating the beta using correlation, which is the traditional
method, or without correlation. When choosing Without Correlation, the beta calculated
isn’t actually beta, but is the ratio of the equity curve daily standard deviation and the index daily standard deviation.
24
Page 25
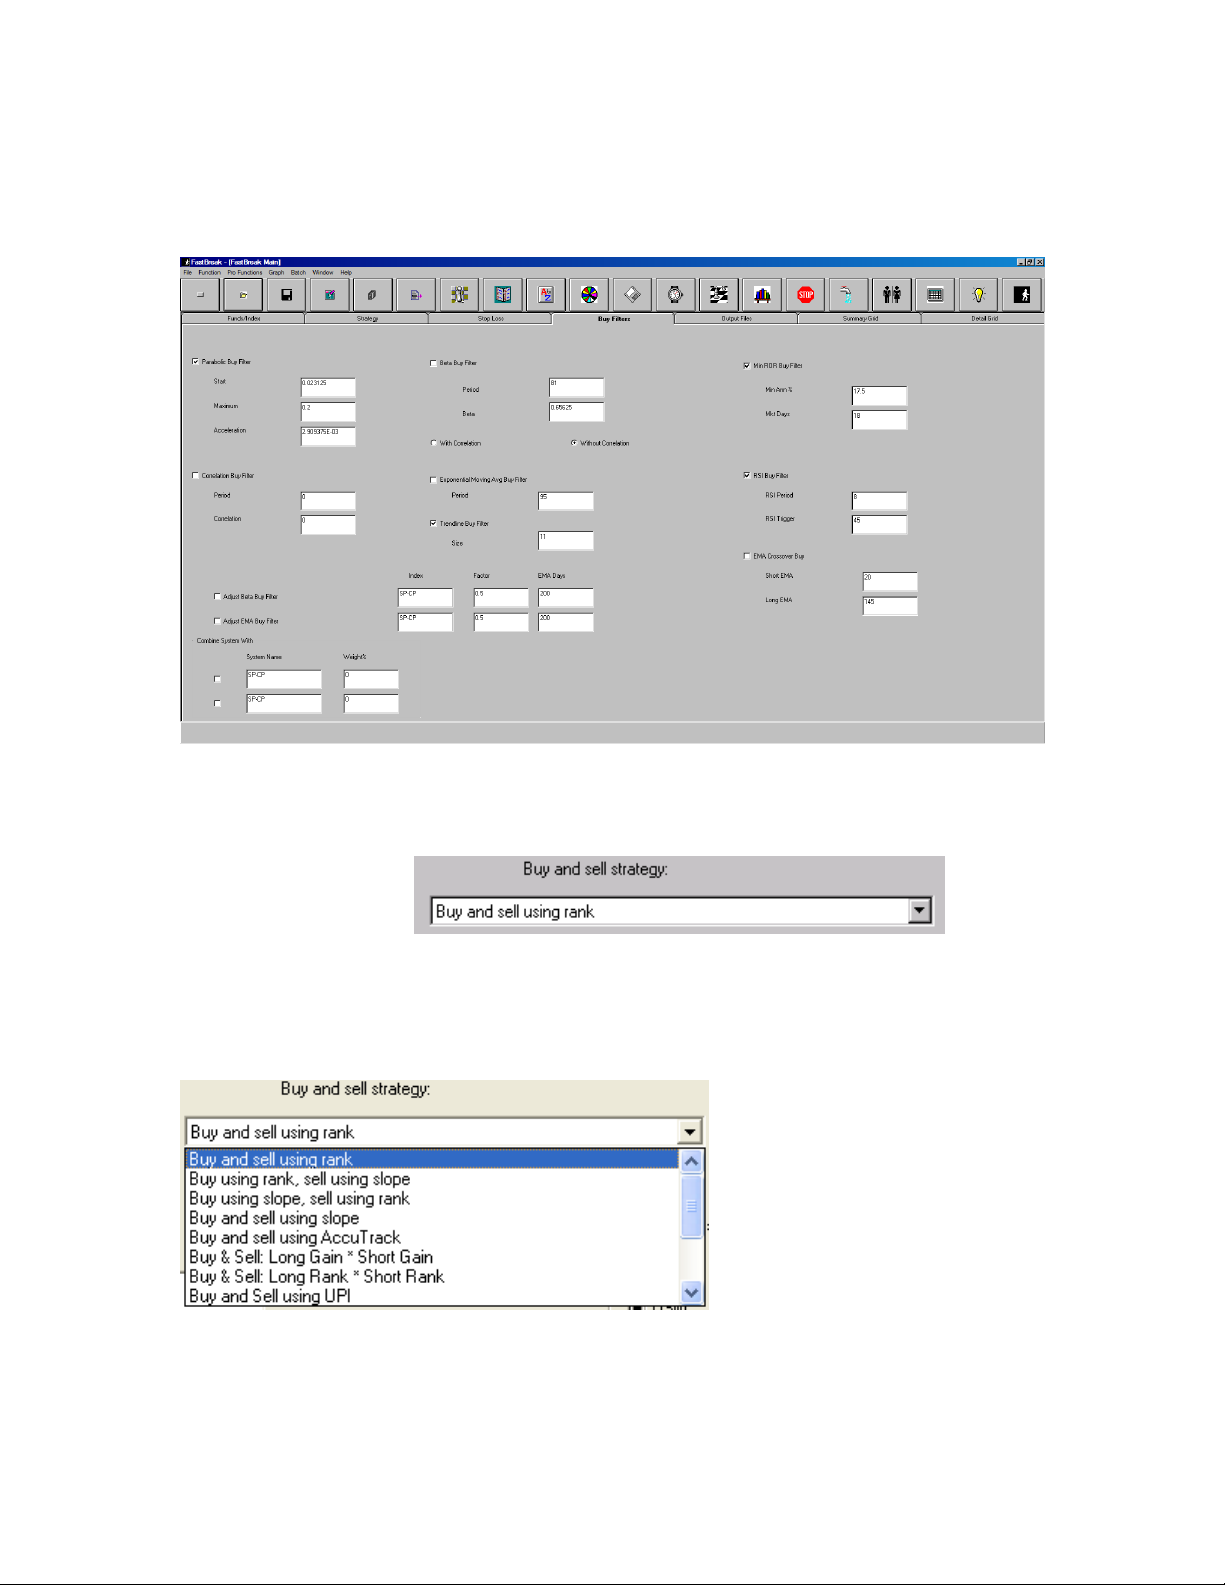
Strategy Tab
Next, click on the Strategy Tab to bring up the following screen:
This is the most complicated menu screen in FastBreak. This tab sets up the majority of
the trading strategy parameters.
Buy and Sell Strategy
This may be the most difficult part of FastBreak to understand. The “Buy and sell strategy” menu is a pull down menu. Click the down arrow button just to the right of the box
below the line that reads “Buy and sell strategy” to see all the trading options available.
Each choice is described below:
25
Page 26

Buy and sell using rank - This is the most often used strategy. A simple FastTrack type
ranking is made on the funds in the selected family. The ranking produces a list of funds
in order of decreasing gain over some specified time period. This is equivalent to using
the blue pole and rank function in FastTrack. FastBreak will “buy” a fund if it is the top
ranked fund and will “sell” a held fund if it drops out of the top part of the family of
funds during a ranking.
Buy using rank and sell using slope - FastBreak will “buy” using a simple ranking but
“sell” if the slope of a “normalized” price chart for a held fund drops in relation to the
slope for all the other funds in the family. This is more fully explained in Appendix A.
The slope can be calculated using a variety of curve fit methods that will be selected using a soon to be described selection menu. Using a curve fit of the daily price data will
smooth the data and tend to filter out short term price volatility. The number of daily
price points used to determine the slope is set by a parameter to be described later.
Buy using slope and sell using slope - This is similar to the above strategy except the
strategy does a curve fit on the daily price data for each fund in determining “buying” and
“selling” funds.
AccuTrack buy and AccuTrack sell - This is the most difficult strategy to understand
and is one the slowest from a computer run time prospective. The user may want to own
a very fast computer before using this strategy! Some users have referred to this as an
“AccuTrack Bubble Sort.” The AccuTrack indicator should be familiar to all FastTrack
users and is described in the FastTrack manual. It is an indicator that can be used to find
the relative strength between two funds. Typically, one of the funds is made the AccuTrack index. FastBreak will select two of the funds in your family making one the
“fund” and the other the “index.” Next, a determination is made on which is the stronger
fund based on the AccuTrack value. If the value is greater than 50, the fund is stronger.
If the AccuTrack value is less than 50 the index is the strongest. If the “fund” is stronger,
FastBreak will make it the new index and go to the next fund in your family to repeat the
calculation. This is done for all the funds in the trading family. The fund that is in the
“index” position at the end is considered the strongest fund. The process is repeated over
again and again for the remaining funds. The funds are ranked by this technique from
strongest to weakest. Selecting this strategy option will cause a change in some of the
other screen options. AccuTrack trading parameters will replace the ranking buy and sell
ranking parameters. This will be explained later in this chapter.
Buy & Sell: Long Gain * Short Gain - This option combines a long ranking period gain
with a short ranking period gain by multiplying them together. This method will give
weight to both long term price performance and short term price performance. For example, if testing a long period of 40 market days and a short period of 5 market days the program will first take the ratio of the NAV of the fund today and 40 days ago. Next, the
ratio of the NAV of the fund today and 5 days ago is calculated. The final step is to multiply these two ratios together. Putting numbers to this example - we will assume a fund
has a current NAV of $18.00, a $17.75 NAV five days ago, and a $17.45 NAV forty days
26
Page 27

ago. The long period NAV ratio is: 18.00/17.45=1.0315, and the short period NAV ratio
is: 18.00/17.75=1.014. Multiplying these two ratios together: 1.0315 X 1.014= 1.046.
This is done for each fund, and the multiplied ratio results are used to do a ranking with
the fund having the largest value as the #1 fund.
When this option is selected four new boxes appear on the screen, Min Long, Max Long,
Min Short, and Max Short. This allows a range of long and short combinations to be
tested. This will be explained shortly.
Buy & Sell: Long Rank * Short Rank - This option also combines long and short term
price performance to rank funds. A ranking of the family is made over a long look-back
period and then a second ranking is made over a short look-back period. The actual ranking positions are multiplied together, and this final result is used to make a third and final
ranking. For example, a fund may be ranked number 5 in the trading family over the past
40 market days and ranked number 8 over the past 5 market days. The result of multiplying these two ranking positions together is: 5 X 8 = 40. As you can see, the lower the
ranking value the smaller the final result, therefore, when the third and final ranking is
performed on this multiplication of two ranking periods the fund with the LOWEST
value is ranked number one.
When this option is selected four new boxes appear on the screen, Min Long, Max Long,
Min Short, and Max Short. This allows a range of long and short combinations to be
tested.
Buy & Sell: Buy and Sell using UPI – Calculation of Ulcer Performance Index (UPI) is
explained in the Appendix. Choosing this option ranks funds based on a short term UPI
value. This usually results in buying funds that have a smoother equity curve
Buy & Sell: Short EMA/Long EMA - This option creates a ratio of the Short Exponential Moving Average (EMA) divided by a Long EMA. If a fund is starting to move up,
the short EMA will be a larger number than the long EMA. The ratio for all the funds is
then ranked from largest to smallest. When a fund starts to turn down the ratio will become smaller.
Buy & Sell: General Anchored Momentum - This option is based on work by Rudy
Stefenel and published in Technical Analysis of Stocks & Commodities. See Appendix A
for a detailed description.
Buy & Sell: Most Anchored Momentum - This option is based on work by Rudy Stefenel and published in Technical Analysis of Stocks & Commodities. See Appendix A for
a detailed description.
Buy & Sell Using Alpha Ranking – This option ranks funds based on short term “alpha.” See Appendix A for a detailed description of alpha.
27
Page 28
Buy and Sell using Sharpe Ratio – This option ranks funds based on short term Sharpe
Ratio. Sharpe Ratio is a common measure of reward and risk. See FastTrack Help for a
description of Sharpe Ratio.
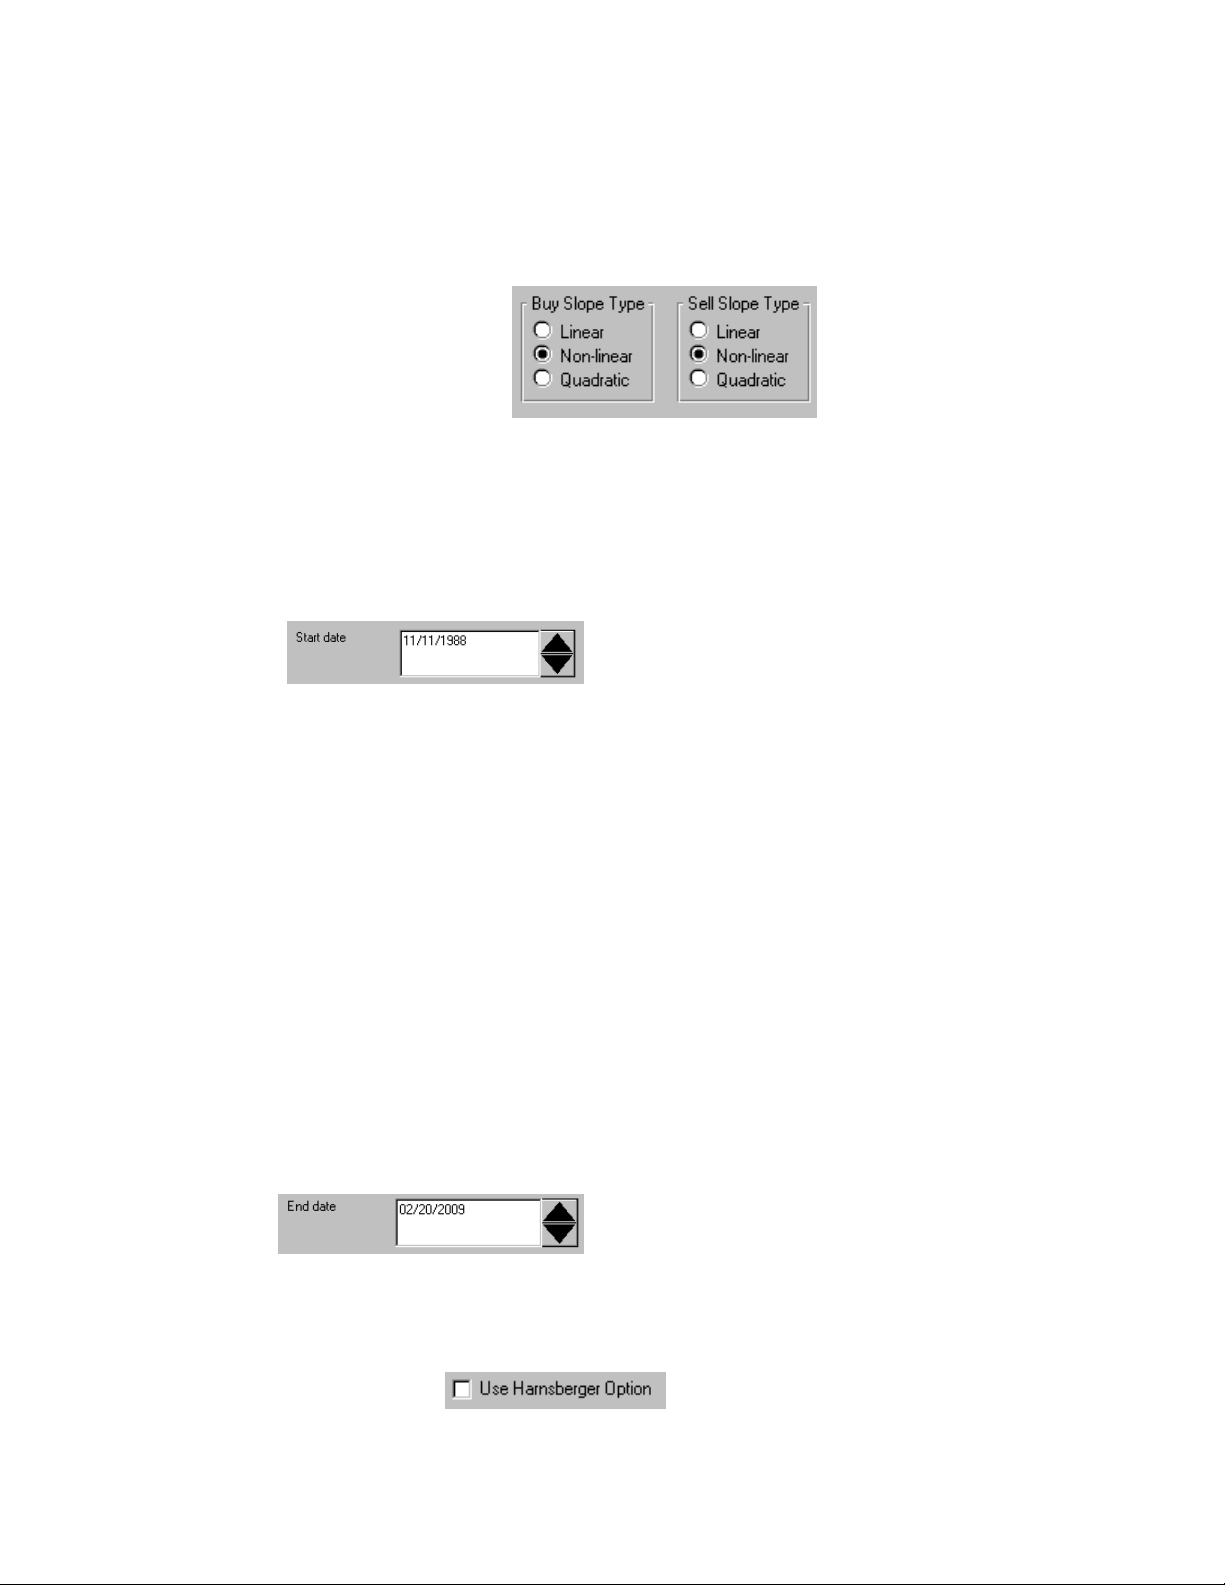
Buy Slope Type/Sell Slope Type
This button selection menu is used to select the type of slope to use when using a curve fit
strategy. Linear, Power (shown as Non-linear) or Quadratic curve fits can be used. Note,
when a strategy is selected that does not use a curve fit this menu “grays out” and prevents selection. If using a curve fit for buying and selling, different types of curve fits can
be selected. See the Appendix A for a description of each type of curve fit.
Start date
This is the date when FastBreak will start testing a strategy. Note: FastBreak uses 8 digits for dates. You must include all four digits in a year, and if a month or day is only
one digit (1-9) you must include a zero in front of the digit. One of the most common
mistakes that will result in run errors is not entering dates correctly. Note: FastBreak
will not let you set a date earlier than the first date data is available in the FastTrack
data base (typically 09/01/1988). Also, because ranking strategies are being used, you
must have data available for ranking proceeding the start date. FastBreak will default to a
start date that allows the number of days required for the maximum ranking period that is
expected in the strategy to be tested. For example, if a maximum ranking period of 50
days is to be tested, FastBreak will verify that there are 50 days of data preceding the Start
Date in the FastTrack data base. If you try to violate these rules FastBreak will “beep” at
you. Note: FastBreak does the same error check for other options, including stops and
filters that require a “period” of data. For example, if using the maximum correlation
check with a period of 100 trading days, then the start date will be adjusted to allow
100 days of data prior to the start date. It is important not to override the FastBreak
default date.
End date
This is the date FastBreak will use to end the testing. The default is the last day in the
FastTrack database.
Use Harnsberger Option
28
Page 29

The Harnsberger Option invokes a strategy developed in cooperation with Fritz Harnsberger, a money manager in Santa Barbara (see Resource chapter). Mr. Harnsberger
noted that the standard FastBreak ranking system is a “sell based” system in that it will
not buy a new fund until a currently held fund drops in relative strength and generates a
sell. Often there may be a fund or funds that are doing extremely well on the buy ranking
but can’t be purchased until a fund is sold.
The Harnsberger Strategy is a “buy based” system in that when a fund not held is highly
buy ranked, it is purchased and replaces the weakest fund held. The advantage of this
method is that a new fund leader is purchased as soon as possible.
Please see the chapter on FastBreak Calculation Details for additional details on the
Harnsberger Strategy.
Use POP (Persistence of Price)
Selecting this box activates the Persistence of Price function. See Appendix A for a complete description of how this function works.
Note: POP will work only with certain ranking options. See the table at the end of this
chapter. You may want to consider excluding Money Market from ranking when using this option because the option will have a tendency to purchase the money market
very often (money market funds never have drawdowns). However, for a more conservative strategy, leave the Money Market in the ranking.
Use Short Trading
Selecting this box activates short trading functionality. Some mutual funds, and stocks,
can be “sold short” and this option allows strategies to be tested that use relative strength
as a buy and sell criteria for short selling. In this case, the fund to be sold short is the one
showing the weakest relative strength. The short position is ended when the fund has
good relative strength compared to the other funds in the trading family.
When this option is selected, FastBreak creates an “inverse” fund for each fund in the
trading family. For example, if the real fund is down 2% one day, the inverse fund is up
2%. This inverse relationship is calculated for each day in the data base. All performance data will be created with the assumption that a “short position” is held in the fund.
Set sell rank = buy rank
If this box is checked the number of days used for a buy ranking period is also used for
the sell rank period. Notice that when this box is selected the “Sell min” and “Sell max”
selection boxes are not available because they become meaningless.
29
Page 30

Breakout Optimization Method (BOOM)
This is a very powerful proprietary option available only in FastBreak. The exact process
of how the option works is not fully disclosed at this time because of the proprietary nature. BOOM often allows a strategy to purchase a fund much earlier in an up-trend
breakout than would be captured by standard ranking methods. Note: The BOOM option
will not work with all ranking strategies. See the table at the end of this chapter.
This option is very effective and we recommend that you consider testing with the option.
There are three parameters required. From left to right we will call them Parameter 1, 2
and 3. Note: This option was designed with the intention that the optimizer in Fast-
Break Pro would find optimum parameter values. The method used in BOOM has little intuitive meaning, and suggesting reasonable values without the benefit of the optimizer in FastBreak Pro is very difficult. Here are some suggestions. Value for Parame-
ter 1 is 30, Parameter 2 is 5 and Parameter 3 is 1. If you find that a trading system is buying a fund too early on a breakout and you are buying too many false rallies, consider increasing Parameter 2. If rallies are purchased too late then consider decreasing Parameter
2.
Breakout Above Trend (BAT)
Sometimes a stock (or fund) will have a good positive long term price trend, but for various reasons new buying will come into the stock and an even better trend will be established. This is different from the BOOM option which tries to determine when a stock
that has been falling breaks out to the upside. The parameters used by BAT are very
similar to the way BOOM works. Note: This option was designed with the intention
that the optimizer in FastBreak Pro would find optimum parameter values. The
method used in BAT has little intuitive meaning, and suggesting reasonable values
without the benefit of the optimizer in FastBreak Pro is very difficult. See the guidance
for choosing parameters in the BOOM description above. Please refer to Appendix A
to see a much fuller explanation of how the BAT function works along with graphical
examples. The Appendix also explains how BAT can work in conjunction with Return
Advance to Trend (RAT).
Note: BAT (and RAT) will only work with Linear Slope ranking. See Appendix for explanation. Also, BAT will not work with the ranking Adjust option. Both of these options adjust the ranking periods and if you try to use them together they will conflict.
Return Advance to Trend (RAT)
30
Page 31

Typical FastBreak trading systems usually buy maximum price strength/momentum.
Trading systems can take a different approach and successfully take advantage of buying
temporary price weakness or selling into short term price strength. RAT is an option to
take advantage of these temporary moves. The assumption is that the move is temporary
and the price will revert to trend. Note: Please see Appendix for a much fuller explana-
tion of how RAT works along with graphical examples.
Note: RAT will only work with Linear Slope ranking. See Appendix for explanation.
Note: The next several parameter boxes do not have as much significance for users of
FastBreak Pro as they do for users of the Standard version. The genetic algorithm
optimizer in FastBreak Pro will determine values for all trading system parameters,
including the ranking parameters. However, FastBreak Pro users can use the following parameter options to “fine tune” the ranking periods in their trading systems. See
FastBreak Pro manual for more details.
Buy min, Buy max, and Buy Delta days
These three parameters define all the test cases that FastBreak will evaluate as buy ranking periods. The units are market days. For example, if Buy min = 2 , Buy max = 50,
and Buy Delta = 1, FastBreak will loop through all ranking periods between 2 days and
50 days or 49 test cases. Setting Buy Delta = 3, FastBreak will increment the test cases
by 3 days, i.e., 2, 5, 8 ... days and this can greatly reduce the run time. If Buy min and
Buy max are set to the same value all test cases will be evaluated using that value. Note:
These ranking periods are “market days” and not calendar days. You must understand the difference. This is the same method used in FastTrack for ranking period. If
you want to rank over the past month this will be about 21 market days.
When using a “buy using slope strategy,” these parameters are used to determine the
number of days over which the price data is curve fit. When using UPI or Sharpe Ratio
ranking, these values are the number of market days used to calculate either UPI or
Sharpe Ratio.
Sell min, Sell max, and Sell Delta
31
Page 32

These values are similar to Buy min and Buy max except they set the range for all sell
ranking periods to be tried. If Buy min = 2, Buy max = 50, Sell Delta = 1, Sell min = 2,
Sell max = 50 and Sell Delta = 1, FastBreak will loop through 2401 test cases (49X49).
As noted above, if “Set sell rank = buy rank” is checked, these three parameters are not
used and FastBreak will gray them out. Note: These ranking periods are “market days”
and not calendar days. You must understand the difference. This is the same method
used in FastTrack for ranking period. If you want to rank over the past month this
will be about 21 market days.
When using a “sell using slope strategy,” these parameters are used to determine the number of days over which the price data is curve fit. When using UPI or Sharpe Ratio ranking, these values are the number of market days used to calculate either UPI or Sharpe
Ratio.
Min AT 1, Max AT 1, Delta AT1
Min AT 2, Max AT 2, Delta AT2
Note: These parameters are only visible if Buy and Sell using AccuTrack has been selected. These parameters are very similar to the Buy and Sell parameters just discussed.
They are used to define the range of parameters when testing the AccuTrack trading strategy. AT 1 refers to the AccuTrack 1 Short Parameter, smoothing factor and AT 2 refers
to the AccuTrack 2 Long Parameter, moving average. See the FastTrack manual for a
description of these values.
Min Long, Max Long, Delta
Min Short, Max Short, Delta
Note: These parameters are only visible if Long Gain*Short Gain, Long Rank*Short
Rank, or Short EMA/Long EMA is selected. These parameters are very similar to the
Buy and Sell parameters just discussed. They are used to define the range of parameters
when testing trading strategies that combine short and long term look-back periods.
32
Page 33

Min Period, Max Period, Delta, and SMA Period
Min EMA, Max EMA, Delta
Note: These parameters are only visible if Buy and Sell using General Anchored Momentum has been selected. See Appendix A for a complete discussion of this strategy.
Min and Max Period describe the range of look-back periods to test. Delta is the size of
the increments to use in the testing range. SMA Period is the Simple Moving Average
Period used to smooth the price data centered on the look back period. Min and Max
EMA describe the range of Exponential Moving Average Periods used to smooth the current price.
Min Buy Period, Max Buy Period, Delta, and EMA Period
Min Sell Period, Max Sell Period, Delta
Note: These parameters are only visible if Buy and Sell using Most Anchored Momentum has been selected. See Appendix A for a complete discussion of this strategy. Min
and Max Buy Period describe the range of look-back periods to test for buying a fund.
Delta is the size of the increment to use in the testing range. Min and Max Sell Period
describe the range of the look-back period to test for selling a fund. Delta is the size of
the increment to use in the testing range. EMA Period is the Exponential Moving Average to use to smooth the most current price.
33
Page 34

Buy Min, Buy Max, Buy Delta, Alpha index
Sell Min, Sell Max, Sell Delta
Note: These parameters are only visible if Buy and Sell using Alpha has been selected.
See Appendix A for a complete discussion of this strategy. Min and Max Buy Period describe the range of look-back periods to calculate alpha for buying a fund. Delta is the
size of the increment to use in the testing range. Min and Max Sell Period describe the
range of the look-back period to calculate alpha for selling a fund. Delta is the size of the
increment to use in the testing range. Alpha index is the index to use to calculate alpha.
The default is the S&P 500 index (SP-CP in FastTrack); however, any index, fund, stock
or FNU file can be used. Note: You must select an index that is available from the Start
Date plus going back additional days to account for the maximum ranking period you
expect to test.
User Min Hold
This is the minimum number of days to hold a fund that has been purchased. Some funds
have short term trading fees if the funds are held less than a prescribed minimum number
of days. Setting Min hold to this number will force the trading strategy to hold the fund
for at least this minimum number and avoid the trading fee. Note: User Min hold is in
calendar days not market days.
There are two situations when Min hold will be violated. First, if a signal file is used and
a signal is given to sell, all held funds will be sold into the money market fund even if the
funds have been held less than the minimum number of days. Second, if a fund hits one
of the stop loss functions, the fund will be sold even if held less than the minimum number of days.
STRF Min hold
34
Page 35

This screen option allows you to select the Short Term Redemption Fee (STRF) minimum holding period. If the funds in your family apply a redemption fee if the fund is
traded within a minimum number of days, then use this option. For example, the Fidelity
Select funds have a 0.75% fee if traded within 30 days.
Short loss
This is the percent cost if a fund is sold before it is held the “STRF Min hold” number of
days. For example, some funds have a transaction fee of 0.75% if held less than 30 days.
FastBreak will subtract this fee from a sell trade for a fund that is held less than the
“STRF Min hold” period. The one exception is for the money market fund where Short
loss never applies. Short loss is input as a positive number.
Delay .
Note: Most users will use a 1 day delay. The zero day delay option is a bit archaic at this
point, but may be useful for those who trade stocks/ETFs at the next day open. The zero
day delay option was initially added at user request when Fidelity Select funds had
hourly pricing. Users wanted to trade the Select funds at the next day 10:00 am pricing
and the assumption was that the 10:00 am pricing would be close to the previous day
close. FastBreak assumes you can buy and sell funds on a given day at the 10:00 price
that is equal to the previous day’s closing price. The typical FastBreak user will update
FastTrack each evening and then run FastBreak. If a trade signal is given, the trade
would take place at tomorrow’s closing price when using mutual funds. This would be a
1 day delay. However, if the investor is trading stocks or ETFs then the investor may determine that tomorrow’s 10:00 am trading price may be close to today’s closing price.
FastBreak considers this a 0 day delay. Note: FastBreak uses the FastTrack data base
which contains ONLY closing prices. Therefore, FastBreak has no actual knowledge
of the trading prices other than daily close. Using the 0 delay is an estimation, and it
does not change the actual day that the trades are made.
FastBreak will only support delays of zero or one market day.
Top %
This value determines when to sell a fund or continue to hold. The value input is the percent of all funds available in the trading family that a held fund needs to sustain in order
to continue to be held. For example, assume a trading family containing 28 funds, and
each day all the funds are ranked over some time period. The funds are ranked in order of
strongest to weakest. If Top % is set to 50, then FastBreak will continue to hold the fund
35
Page 36

while it is in position 1-14 (Top 50%) in the rank list. If the fund falls in the range of 15
– 28, it will be sold. If the trading family contains 30 funds, but only 24 are available
early in the testing period, Top% is applied to 24 during that early time period. See FastBreak Calculation Details chapter for additional information.
# funds
This is simply the number of funds the investor wants to hold at any given time. Adding
additional funds to a strategy usually hurts return performance, but can decrease volatility
and reduce drawdown.
Use Log Trendline
Trendline generally come in two “flavors” e.g., logarithmic or arithmetic, and FastBreak
has both available. There are advantages and disadvantages to each. Logarithmic are
generally recommended, but see FastTrack Help for more information. If you check the
Use Log Trendline box then FastBreak will use logarithmic trendlines for BOTH the
Trendline Buy Filter and the Trendline Sell Stop options.
Trading Days
Use this option to determine how often you want your strategy to trade. Selecting Daily,
the most common choice, will allow the strategy to trade on any day. Selecting Weekly
will only allow the strategy to signal trades on Friday close only. Many users like this
option because the weekend is the only time when they have an opportunity to look at
their investments. Any signals given would then be executed on Monday. User Defined
Days allows the user to select any number of calendar days. For example, some users
only like to trade on an infrequent basis because of investment plan restrictions, for example. If you are interested in trades taking place only about one per month then use a
value of 30-31 days in this field. Note: This value is input in calendar days and not
market days. Also, this option does not affect the stop loss or signal file trades. A trade
due to a stop loss or signal file trade can be generated on any market day.
Use signal file
36
Page 37

Checking this box will open a file selection menu, and a standard FastTrack signal file
can be selected. The signal files are usually in a separate subdirectory in the FastTrack
directory. This signal file requires a “buy” before any fund, except money market, can be
purchased. When a signal file gives a “sell” funds will be sold ignoring all other rules
including the Min hold rule. All positions will be put into the selected money market
fund. Using a signal file allows the user to include market timing in a strategy. The percentage of the investment transferred into money market can be controlled using the
“Market Risk” box that appears. See the next section for a description of this option.
Checking the Use Signal File box will produce the following standard file selection
menu:
Notice that all the .sig files in the FastTrack sig directory are listed. This menu allows
you to change the Drive and Directory where your .sig files are stored. We recommend
that you keep them in the sig subdirectory in FastTrack. You can change the file type to
something other than .sig but, again, we recommend staying with the standard defaults.
Select a signal file with a left mouse click on the file name.
Market Risk
The option appears when using a signal file. When set to 0%, the most common user option, all funds will be transferred to the money market fund when the signal file gives a
sell. If set to 50% half of all funds will be transferred to the money market fund when the
signal file gives a sell. Any value between 0 and 100% can be used. Values other than
0% would be used for an investor who wants to reduce market exposure during a signal
file sell but keep a portion of funds invested. There is additional information on this option in the FAQ chapter. Note: When using this option with a value greater than zero, it
is very important that the Start Date occur during a time period when the signal file is
on a buy signal. FastBreak Pro users should also pick a date for the out-of-sample
start date that corresponds to a time period when the signal file is on a buy. If using a
market risk of zero (the most common option for most users) the start dates do not need
to be coordinated with signal buy periods.
37
Page 38

Balance Multiple Funds
This menu item allows the user to “Balance” the money among accounts if multiple funds
are being held. See the chapter on FastBreak Calculation Details for a detailed explanation of this feature. It is very important to understand this item if a fund other than an actual money market fund is selected as the “Money Market Fund.” Note: The balance op-
tion will not work if using a signal file and a market risk greater than zero.
Use Trade Signal
This option is for those users who want to trade only on specific dates. This option allows a user to build a signal file that forces a very specific trading system. For example,
if a user wants to test a strategy that trades only on the first day of each month then the
user will build a signal file that contains those dates. The format of this signal file is
nearly the same as the standard FastTrack signal file:
"314Monthly signals"
T,09/01/88
T,10/03/88
T,11/01/88
etc.
Only “T” (for Trade) values are used and not “B” or “S” values, as in the standard signal
file.
This file can be built in a text editor or built using the FastTrack signal file process and
then modified using a text editor.
Note: The dates used need to be market days to activate a trade. If the date is a weekend or market holiday, then the date will be ignored. Notice in the above example that
the 3rdof October is used rather than the 1st. This is because the 3rdis the first trading
day of October in 1988.
Other uses for this option are left to the imagination of the user.
38
Page 39

Dynamic Adjustment of Ranking Periods and Top%
This option allows adjusting some parameters as market conditions change. For example,
you may propose that ranking parameters should be longer when the general market is
trending up, and shorter parameters used when the market is moving sideways or moving
down. The way the option works is to apply the Adjust Factor when the Adjust Index
breaks (moves lower) than its Exponential Moving Average (EMA) specified by the Adjust EMA Days.
Use the S&P 500 Index as an example for the Adjust Index and 0.5 as the Adjust Buy Pct.
Suppose you are using a ranking parameter of 30 days for Buying. FastBreak will use
those parameters as long as the S&P 500 Index is above the EMA that you specified (100
days in the above example); however, if the Index moves lower than the 100 EMA or the
S&P 500 Index, then the 0.5 factor will be applied to the Buying ranking period, i.e.,
Buying ranking period will become 15. Note: The Detail tab and file will not reflect this
change. When the Index moves above the EMA, the ranking parameters will change
back to the specified long values. Adjustments can be applied to the ranking strategy
first parameter, the ranking strategy second parameter, and the Top% value. Adjustment
factors can be greater than 1.0 This will result in increasing the ranking parameters and
Top% when the specified index falls below the specified EMA. Note: We use the term
Strategy Parm1 and Strategy Parm2 to reference the parameters in the momentum
strategy. For example, with simple ranking this will be the number of days used in buy
and sell ranking. However, for strategies like GAM, Parm1 will refer to the buy and
sell period and Parm2 refers to the EMA value. We recommend you only use the Adjustment option with simple buy and sell momentum strategies, i.e., simple rank, UPI,
Sharpe Ratio, and slope ranking. The use of this option with AccuTrack ranking will
produce meaningless results.
39
Page 40

Summary of Option Combinations
The following table summarizes which options (POP, BOOM, and BOSS) are available
with which ranking strategies. For example, all three are available for simple ranking.
Note: BOSS is a stop option that will be covered in the Stop section of the manual.
Note: BOOM will only work with Linear form when using Slope ranking.
Ranking Strategy POP BOOM BOSS
Buy & Sell Rank
Buy Rank & Sell Slope
Buy Slope & Sell Rank
Buy & Sell Slope
Buy & Sell Linear Slope only
AccuTrack
Long Gain x Short Gain
Long Rank x Short Rank
UPI
Short EMA/Long EMA
GAM
MAM
Alpha
Sharp Ratio
X X X
X
X
X
X
X
X
X X
X
X
X X
X X
X X
40
Page 41

Stop Loss Tab
Click on the Stop Loss Tab to see the following screen:
A stop loss is used to close or “stop” out of a fund position because of a stop parameter
violation. FastBreak allows selection from many different stop loss functions or combinations of functions. If the fund has been held less than “STRF Min hold” when the stop
generates a sell the “Short loss” value will be subtracted from the strategy returns.
You can enter stop loss functions for two separate time intervals. For example, you may
want to have a very loose stop during the first 30 days of buying a Select fund (This will
help avoid getting stopped out and incurring the short term trading fee). After 30 days
you can use a tight stop to help preserve more of your gains. An example will be provided
below.
You do not need to use both time intervals. For example, if you want the same stop function value for the entire time you are holding a fund, then you do not need to use the second time interval. You only need to select the first time interval box and put a 1 in the
first time box and a large number (999) in the second time period box. An example will
be provided below.
Note: You can't use the second time interval without using the first time interval.
41
Page 42

Trailing Loss %
This is the maximum draw down an investor is willing to accept on any trade. The loss is
calculated based on maximum NAV after a fund purchase. For example, if the user sets
this value to 12%, and a fund is purchased for a NAV of $8.00 and later rises to a maximum value of $13.00, the fund will be sold if the NAV drops below $11.44 ($13.00$11.44)/$13.00 = 12%). Setting this parameter to a typical value of 5% to 15% in a trading system will often decrease total return performance but may provide a trading system
with less volatility.
Note: In real life, there is no way to prevent a fund from loosing more than a defined
Loss % because a fund is priced, at best, on an hourly basis and, more typically, a daily
basis. This parameter will result in giving a sell signal once “Loss %” has been violated.
If you want to use both time intervals the screen would resemble the following:
In this example, the trailing stop will be 10% for the first 30 days the fund is held and 6%
thereafter.
If you wanted a strategy that used 9% for the entire time the fund is held, the screen
would resemble the following:
Note: A stop doesn’t need to start on the first day purchased. For example, if you want
a 10% trailing stop to be effective starting on day 30 and then be permanently effective
the screen would look like the following:
42
Page 43

Parabolic
See Appendix A for an explanation of this stop function. FastBreak allows the user to set
the Start, Maximum, and delta value (shown as Acceleration on the screen) for the parabolic Acceleration Factor.
Note: When this option is selected, a fund trading below its parabolic will not be purchased even though it may be ranked very high in the trading family. This is done because it would instantly be sold the next day.
Kase Dev
See Appendix A for an explanation of this stop function. FastBreak allows the user to set
the period over which the Dev-Stop is calculated and the number of Standard Deviations
to apply.
Dynamic (Trailing Stop Loss)
This option is very similar to the Trailing Loss% except the stop is adjusted by the volatility of each fund. The user inputs a Nominal % trailing stop which is multiplied by a
fund’s daily standard deviation divided by the average daily standard deviation of all the
funds in a trading family. The standard deviation is calculated over a “Period” defined by
the user. For example, if the Nominal % is set to a 7% stop loss and a fund has a standard
deviation that is 50% greater than the average fund in the trading family (over a user defined number of trading days), then the stop loss will be 10.5% (1.5x7%) for this fund.
On the other hand, if a fund has a standard deviation that is 20% less than the average
fund in the trading family the fund’s stop will be 5.6% (0.8x7%).
The value of this stop option is to allow funds with high volatility to have more “maneuver room” while keeping a tight stop on funds that have less volatility. We recommend
43
Page 44

that the Period be set to at least thirty trading days to calculate a standard deviation that is
statistically significant.
Exponential Moving Average
This stop will sell a fund when it drops below its exponential moving average (EMA) that
is calculated over a user defined “Period”. For example, if a period of fifty (trading) days
is used, the fund will be sold when the NAV drops below the fifty day EMA. For a definition of EMA see FastTrack Help.
Note: When this option is selected, a fund trading below its exponential moving average will not be purchased even though it may be ranked very high in the trading family. This is done because it would instantly be sold the next day.
Better Opportunity Sell Signal (BOSS)
Every investor has at times seen a fund (“hot” fund”) increasing at a much faster rate than
the fund(s) currently held. The fund held continues to be held for a variety of reasons,
i.e., the minimum holding period hasn’t been reached or the fund hasn’t fallen out of the
Top%. The question is, “Should the fund held be sold and the “hot” fund purchased?”
Of course, if the stronger fund is increasing at only a slightly faster rate than the fund held
the answer is likely - No. If it is at a much greater rate, then the answer is likely - Yes.
The Value in BOSS is the difference in an annualized rate between the fund held and the
stronger fund. The rate is measured over the ranking period. For example, if the fund
held is increasing at the rate of 30% per year measured over the ranking period and BOSS
is set to 40, then a sell signal will be generated if a strong fund is increasing at the rate of
70% or more. Again, the rate is an annualized rate measured over the ranking period.
Note: The value put in BOSS is approximately an annualized rate for all but the simple
rank buy and sell option. The reason the value is only approximate is due to the way
data is smoothed in the different ranking techniques. The recommend value range for
BOSS is 50-100. This may seem quite high but setting to a lower value will result in a
great increase in switches without a corresponding increase in return. The Detail output will show when BOSS was used as a sell signal. If you find too many sells using
BOSS, then increase the value to a higher number. BOSS is not available with all
ranking options. See the summary table at the end of the previous chapter.
Min ROR Sell Filter
44
Page 45

This option will sell a fund that drops below a user defined minimum annualized rate of
return percentage over some user defined number of market days. For example, a user
may not be interested in holding a fund that has an annualized rate of return that is less
than a money market.
Note: When this option is selected, a fund trading at or below the specified ROR will
not be purchased even though it may be ranked very high in the trading family. This is
done because it would instantly be sold the next day.
Wilder RSI Stop
This stop option uses the very popular Wilder RSI (I chart in FastTrack) as a stop. This
stop is selected like most of the other available stops. The Period (this is commonly set
to 14 days, but some traders have found other periods to be very useful) and the trigger
point (many traders have found the 50% level to be a good sell point, but again, other
values have been found to be useful) must be set.
Note: When this option is selected, a fund trading at or below the specified RSI will not
be purchased even though it may be ranked very high in the trading family. This is
done because it would instantly be sold the next day.
EMA Crossover
This is the exponential moving average (EMA) crossover and is similar to the standard
EMA stop. It will sell a fund when the fund’s short EMA goes below its long EMA. For
example, if a short EMA of 5 (trading) days and a long EMA of 50 (trading) days is used,
the fund will be sold when the 5 day EMA drops below the 50 day EMA. For a definition
of exponential moving average see FastTrack Help.
Note: When this option is selected, a check is made before a fund is purchased to verify
that its short EMA is trading above its long EMA. This is done because it would instantly be sold the next day if this were not the case.
Trendline Stop
45
Page 46

This is the Trendline Stop option. It will sell a fund when the fund trades below its trendline. See the Appendix A for details of how FastBreak calculates trendlines. The Size
text box is used to control the significance of the price dips used to draw the trendline. If
a small value is used then smaller price dips will be considered significant and shorter
term trendlines will be drawn. If larger values are used then larger price dips are required
before they are determined to be significant enough to anchor the trendline and the trendlines will capture longer term trends. Reasonable values are 0 to 15 for size.
FastBreak can calculate either logarithmic or arithmetic trendlines. The type is determined by the Use Log Trendline option on the Strategy Tab.
The trendline calculation is very computational intensive and if you have a large trading
family you will notice a significant increase in the time it takes to evaluate a strategy
when using this option.
Note: When this option is selected, a check is made before a fund is purchased to verify
that it is above the trendline. This is done because it would instantly be sold the next
day if this were not the case.
Adjust Trailing Loss
This option is very similar to the Adjustment factor covered earlier on the Strategy tab.
The intent is to adjust the Trailing stop loss if market conditions are different. For example, in the above case SP-CP (S&P 500 index) is chosen as the index, with a 0.5 factor
and an EMA Days of 200. As long as SP-CP is trading above a 200 day EMA the user
defined Trailing Loss value will be used (16% for example). If, however, the SP-CP
drops below its 200 day EMA then the 0.5 adjustment factor will be applied, and the
Trailing Loss value will now be 8%. If the strategy uses both periods for the stop, then
the adjustment factor will be applied to both Trailing Stop Loss values.
Any index, fund, or user defined FNU file can be used in the Index.
Adjust EMA Stop
This option is very similar to the Adjust Trailing Loss option just covered. The only difference is that the adjustment factor is applied to the Exponential Moving Average stop
value. Note: This adjustment does not affect the EMA Crossover stop.
46
Page 47

Buy Filter Tab
This tab contains filters that can be applied to a fund prior to purchase.
As FastBreak considers a fund for purchase, the fund will need to pass any filters activated on this tab. These filters are not to be confused with the similar stops. The filters
are only considered during the fund purchase process. In the Stop Loss tab, a fund will be
checked against the stop during the purchase phase and each day the fund is held. It is
acceptable to use similar buy filters and stops with different values. For example, a 50
day EMA value could be used as a buy filter and a 150 day EMA used as a sell stop.
The intent of some of the filters is to help confirm that a fund is in an up trend. Other filters help control the volatility and other aspects of the trading system.
Parabolic Buy Filter
If this option is selected, the fund being considered for purchase must be above the parabolic curve prior to purchase.
47
Page 48

Beta Buy Filter
This option will prevent purchase of a fund that has a beta greater than specified by the
filter. The index used to calculate beta is specified on the Funds/Index Tab. This option
has at least two uses. One, it can be used to build trading systems that have low volatility.
The second use is to build trading systems that perform better in volatile or down markets. This is because high beta funds often move to the top of the buy rankings on short
term rallies during down markets, but the rallies are false rallies that fail very quickly.
There are often funds that have a low beta that continue to trend upward in the down
market, but they are “overshadowed” by the high beta fund.
There are two parameters for this option. A maximum beta and a period over which the
correlation is calculated (recommended range is 50-100 days). If the beta is set to a very
low value, the strategy may be unable to find a fund suitable for purchase. If this is the
case, the money market fund will be purchased.
A recommended way to use this option is to make a baseline strategy run and look at the
beta value in the Summary output. Typical mutual fund systems can have betas of 2-3.
After making the baseline run, use a beta filter value of 1.5 to make a second run and
compare the results with the baseline run.
The user can choose whether to calculate a true beta using correlation or without correlation. Beta is the ratio of the volatility of a fund divided by the volatility of an index (typically the S&P 500), multiplied by a correlation value between the fund and the index. If a
fund has a low correlation to the index it can have a low beta but be a very volatile fund.
An example would be a gold fund. Gold funds have a low or even negative market correlation and yet are very volatile. Filtering on standard beta may not filter out a gold fund.
Using the non-correlated beta filter allows a user to mix a wide range of fund types including those that may not have a high market correlation value, e.g., bonds, international
etc., in a trading family and have the ability to filter those with high volatility.
Min ROR Buy Filter
This option is closely related to Min ROR Sell Stop.
48
Page 49

This option will prevent the purchase of a fund that is not increasing in price at an annualized rate defined by the user. In the above example, if the user does not want to purchase
a fund that isn’t increasing at an annualized rate of at least 8% over the past 50 market
days (Mkt Days), this option will prevent buying a fund. A reason for using this option is
that the user may prefer to go into a money market that has an equivalent annualized rate
of return without the associated market risk.
Correlation Buy Filter
This option will prevent purchase of a fund that is too highly correlated with an index.
The index used to calculate the correlation is specified on the Funds/Index Tab. The most
common index used is the S&P 500 but any index, fund, or FNU file can be used. This
option allows users to build trading systems that have low correlation with the market.
There are two parameters for this option. A correlation value, which can vary from –1.0
to +1.0, and a period over which the correlation is calculated (recommended range is 50100 days). A correlation of 1.0 would be a perfect correlation with the specified index. If
the correlation is set to a very low value the strategy may be unable to find a fund suitable
for purchase. If that is the case, the money market fund will be purchased
Exponential Moving Average Buy Filter
Many investors use a moving average (EMA) to help confirm that a fund is in an up trend
prior to purchase. A fund’s NAV must be trading above its EMA, with the length of the
EMA defined by the user. A common value used is a 50 day moving average.
.
RSI Buy Filter
Many investors use the RSI to help confirm that a fund is in an up trend prior to purchase.
A common value used is a trigger of 50 days measured over 14 market days.
49
Page 50

EMA Crossover Buy
This option is very similar to the Exponential Moving Average Buy Filter except the fund
NAV is smoothed with a Short EMA value, and this Short EMA must be trading above
the Long EMA to be available for purchase.
Trendline Buy Filter
This is the Trendline Buy Filter option. It will only purchase a fund when the fund trades
above its trendline. See the Appendix A for details of how FastBreak calculates trendlines. The Size text box is used to control the significance of the price dips used to draw
the trendline. If a small value is used then smaller price dips will be considered significant and shorter term trendlines will be drawn. If larger values are used then larger price
dips are required before they are determined to be significant enough to anchor the trendline and the trendlines will capture longer term trends. Reasonable values are 0 to 15 for
size.
FastBreak can calculate either logarithmic or arithmetic trendlines. The type is determined by the Use Log Trendline option on the Strategy Tab.
The trendline calculation is very computational intensive and if you have a large trading
family you will notice a significant increase in the time it takes to evaluate a strategy
when using this option.
Adjust Beta Buy Filter
This option is very similar to the stop adjustment covered earlier. The intent is to adjust
the beta buy filter value based on when an index crosses below its EMA value. In the
above example if the SP-CP falls below its 200 day EMA then a factor of 0.5 will be applied to the user defined beta filter value. The factor can be greater or less than 1.
50
Page 51

Adjust EMA Buy Filter
This option is very similar to the Adjust Beta Buy Filter option. The intent is to adjust
the EMA Buy Filter value based on an index crossing below its EMA value. The factor
can be greater or less than 1.
Combine/Complementary Systems
Note: This function shouldn’t be considered a Buy Filter. It was placed on this screen
simply because there was room available. This functionality was primarily added to al-
low FastBreak Pro to automatically build a new trading system in conjunction with one or
two existing trading systems. See the FastBreak Pro manual for more details. One use of
this capability is to build complementary systems that may reduce the MDD or volatility
of an entire portfolio that is trading multiple systems. Standard FastBreak users can use
the capability in a manual manner to build systems or to determine how to balance allocations between two or three systems to meet risk goals.
As an example, perhaps the investor has developed a system that trades ETFs. The annual return of this system may be excellent but has significant drawdowns on a regular
basis. This is often the case with a system that trades based on very long term trends
without the benefit of tight stops. This capability allows you to import the equity curve
(FNU file) from this existing system(s) and combine it with the currently loaded system
(DFT file) and show the summary results when the systems are traded together.
The option is very simple to use. Perhaps you have already built two trading systems and
you want a complementary system that works together with these two systems. Let’s say
one of the existing systems outputs an FNU equity curve called ETF14 and a second system with an FNU equity curve called ETF17. Also, you know you want to invest 50% of
your portfolio in ETF14 and 30% in ETF17. Now, you want to invest the remaining 20%
of your portfolio in a new system that works together with ETF14 and ETF17. With
these assumptions the screen would look like the following:
FastBreak will look at the Weight% values you have entered and sum them, in the case of
our example that would be 80%. FastBreak then assumes when you execute the currently
loaded system it will have the remaining 20% weighting (20%= 100% - 80%).
51
Page 52

You can use one or two existing systems. Just check the box next to the System Name
text box to tell FastBreak Pro which system(s) to use.
The Summary tab will show the combined performance for the three systems in the
weights specified. The Switches per Year is a special case. FastBreak Pro has no knowledge of the number of switches per year for existing systems (ETF14 and ETF 17 in our
example) so the Summary tab will only show the switches for the DFT system you are
executing. The system FNU file will reflect the combined systems. FastBreak assumes
daily balancing between the systems and the new system for the purpose of determining
equity curve statistics. Using our example above, FastBreak Pro assumes each day that
ETF14 makes up 50% of the total portfolio, ETF17 is 30% and the new system being optimized makes up the final 20%.
52
Page 53

Output Files Tab
Select the Output Files Tab to bring up the following screen:
This screen allows the user to select a variety of outputs.
Summary file
The Summary file is the name of the file where FastBreak stores the trading strategy output. FastBreak always produces a Summary file. The user can define a path and name
for this file by clicking the small box to the left of the file path. A panel will appear allowing entry of a Drive, file name and path. A description of the Summary file contents
will be described later.
Create detail
Checking this box will create a detail file containing every trade made during a run. When
the box is checked a file selection menu appears to enter a file name and path. After a file
name and path has been selected a new box will appear on the main menu showing the
53
Page 54

name and path. A description of the Detail file contents will be described later. Note: It
is suggested that the detail file be created only when a single strategy is run; otherwise,
FastBreak will run slower and a very large file will be created.
Make Signal File
Checking this box will create a market timing signal file in the FastTrack signal file format. See the FastTrack manual for complete information on signal files. The signal file
can be read by FastBreak and FastTrack. Note: Do not create a signal file if more than
one strategy test case is to be run. All the test cases will append together into a single
signal file and FastTrack will not know what to do with this information.
When the box is checked, a file selection menu appears where a file name and path can be
selected. It is suggested that the path be set to the FastTrack SIG directory because this is
where FastTrack and FastBreak look for signal files. Once the file name and path have
been entered, a message box will appear asking the user to input a Title. This title will be
shown when the file is read into FastTrack and can be up to 40 characters long.
After a file name and title have been entered new boxes will appear on the Output Tab
screen showing the information.
Create FNU
Checking this box will create a FastTrack FNU file. See the FastTrack manual for complete information on FNU files. The FNU file can be read by FastTrack just like any
fund. The results from your trading strategy can then be compared to other funds or indexes in FastTrack. It is a great way to do additional analysis. Note: Do not create an
FNU file if more than one strategy test case is to be run. All the test cases will append
together into a single FNU file and FastTrack will not know what to do with this information.
When the box is checked, a file selection menu appears where a file name and path can be
selected. It is suggested that the path be set to the FastTrack directory because this is
where FastTrack looks for FNU files. Once the file name and path have been entered, a
message box will appear asking the user to input a Title. This title will be shown when
the FNU file is read into FastTrack and can be up to 40 characters long. After the title
has been entered, a final box will appear asking for a Symbol name and the symbol can be
up to 5 characters long and will appear on the top of the FastTrack screen.
After a file name, path, title and symbol have been selected new boxes will appear on the
Output Tab screen showing the information. See the example at the start of this section.
54
Page 55

Summary Grid Tab
The Summary Grid will appear while FastBreak is executing. After the run is complete,
select the Summary Grid Tab and the following screen will appear:
Move the bottom slide bar to the right to see the remainder of the file:
55
Page 56

The file contains the results from each test case. Note: When running a single trading
strategy, only one row will appear on this screen.
TEST CASE is the test case number, PARM1 is the period in days used in ranking to determine which fund to buy, PARM2 is the period in days used in ranking to determine
which fund to sell (If using the AccuTrack, or other trading strategies, these values refer
to their parameters), S/Y switches per year, AVG ANNUAL % is the compounded annual
percentage return using this strategy, MAX DRAW DOWN % is the maximum draw
down on the strategy, MDD DATE is the date the strategy realized the MAX DRAW
DOWN%, ULCER INDEX is an indication of strategy risk, ULCER PERF INDEX is an
indication of performance and risk, % WINNERS is the percentage of all trades that had
gains, % AVG GAIN PER BUY is the average gain on each trade, % AVG GAIN WINNERS is the average gain on winning trades, % AVG LOSS LOSERS is the average loss
on losing trades, and AVG STRF is the average number of Short Term Redemption Fee
trades per year. BETA is the maximum beta found for the trading system equity curve
measured over the period specified on the Funds/Index tab. CORR is the maximum correlation found for the trading system equity curve measured over the period specified on
the Funds/Index tab. Alpha is the alpha of the trading system equity curve over the entire
test period duration (measured from Start Date to End Date) of the trading system. Note:
See Appendix A for a more complete description of alpha. Also, beta and correlation
are the maximum values found at any point for the strategy equity curve measured
over the user defined period on the Funds/Index tab. Alpha, on the other hand, is
measured over the entire strategy life. It was felt that a low risk investor would always
want to be in a low risk strategy, i.e., low beta, during any time period. If you want to
know the beta or correlation over the life of the strategy this is found by loading the
strategy equity curve into FastTrack.
See Appendix A for a description of the Ulcer Index and Ulcer Performance Index.
Most of these values in the Summary Grid are self explanatory, but MAX DRAW
DOWN % may need additional explanation. Draw down is defined as the percentage reduction from a strategy high value to a strategy low value. This is not necessarily the
same as a loss of value invested. For an example using dollars - an initial investment of
$10,000 is traded in a strategy and the value of the investment increases to $20,000 over
time. The trading strategy goes into a losing period and reaches a low value of $17,500
before beginning to increase again. This represents a draw down of 12.5% (100*(20,00017,500)/20,000).
The summary file can be printed or imported into a spread sheet for further analysis and
charting. The Summary file can also be sorted by any field. See Function menu later in
the chapter.
A summary file that was previously created can be loaded back into FastBreak. Select the
Summary File button on the Output menu to bring up the file selection menu. Select an
56
Page 57

existing file from the listing. Select OK, then click on the Summary Grid Tab. This will
load the existing file data.
Detail Grid Tab
Selecting the Detail Grid Tab will show the following screen only if a Detail file was selected in the Output Grid Tab (Note: you must have executed a strategy to create a detail
file prior to trying to view the Detail Grid):
This file contains details on each trade made during execution of a strategy. The file contains the test TEST CASE number, BUY and SELL ranking periods, account ACC number to keep track if more than one fund is being held, BUY SIGNAL and SELL SIGNAL
(Note: This is the date a signal was generated. The actual trade will take place the next
market day.) DAYS HELD is the number of days the fund was held. Fund SYMBOL is
the symbol of the fund held.
57
Page 58

The WHY column contains the reason the trade was made. The following table contains
the explanation of the code:
Code Reason for Sell
M Momentum (Ranking)
L Trailing Stop Loss
P Parabolic Stop
K Kase Dev Stop
D Dynamic Stop
S Rate of Return Sell Stop
E Exponential Moving Average Stop
B Better Opportunity Sell Signal (BOSS)
R RSI Stop
H Harnsberger
T Trendline Stop
X Short/Long EMA Crossover Stop
Note: If there isn’t a trade, the last line in the Detail screen will always show an “M”
in WHY column for each account. Also, a fund may be sold for more than a single
reason, for example if it hits multiple stops. The WHY column only lists the first reason that FastBreak finds that will trigger a sell.
Percentage TRADE GAIN % while the fund was held. % IN ACCOUNT is the percent
of total funds held in this particular account. Percent of funds in money market % IN
MMKT, COMBINED RETURN% the percentage return from the start date for all accounts in the trading strategy.
The % IN MMKT column is used in two situations. First, if the Balance Multiple Funds
option is used, FastBreak will put “excess” proceeds into the designated money market
fund. This column is used to keep track of the percentage of total investment currently in
this situation. See FastBreak Calculation Details chapter on Account Balancing for additional information. The second condition that uses this column is when a “Market Risk”
other than zero is used when using a signal file. This column will show the percentage of
funds transferred to money market during a signal file sell. Note: If the ranking strategy
buys the money market fund, the proceeds will not show up in this column because this
buy is treated like any other fund holding, and the percentage will show up in the % IN
ACCOUNT column.
A detail file that was previously created can be loaded into FastBreak by clicking on the
Create Detail option on the Output menu. When the file selection menu is shown, click
on an existing file name. Say OK, and click on the Detail Grid to load the file.
Note: FastBreak anticipates when calculating the DAYS HELD. This means that on a
given day after the market closes, FastBreak knows that the earliest time a fund can be
sold is tomorrow and you will get credit for tomorrow. If the day is Friday, FastBreak
58
Page 59

knows the earliest you can sell is next Monday and it gives credit for three days. It
does not keep track of market holidays.
If you place the mouse cursor on the fund symbol of the fund that was traded and double
click, the fund name will be displayed:
When the bottom slide bar is moved to the far right of the Detail file, and the right side
slide bar is moved to the top, the following additional information is located:
59
Page 60

This part of the Detail file shows statistics on each fund that was traded in the strategy.
Funds in the trading family not traded are not included. # TIMES PURCHASED is the
total number of times a buy signal was generated on the fund, % WINNERS is the percentage of winning trades for the fund, % SUM OF GAINS is simply the summation of
the gains (losses) each time the fund was purchased, % MAX GAIN is the maximum gain
(loss) realized on a trade of the fund, % MIN GAIN is the minimum gain (loss) realized
on a trade of the fund, % AVG GAIN is the average gain of all trades for this fund, %
ANNUAL GAIN is the annualized gain for all trades of the fund.
This information can be used to help determine what funds are providing the best performance in a strategy and which funds should be considered for removal from the trading strategy. The % ANNUAL GAIN considers both the gain of trading the fund and the
time the fund is held. For instance, a fund that has an average gain of 10% per trade but
has very long holding periods may not be as valuable as a fund that has 6% per trade but
has very short trading periods. The % ANNUAL GAIN = 365 x % SUM OF GAINS/
total number of days the fund was held.
60
Page 61

File menu .
The File pull down menu is used to open and save default files, print summary and detail
files, and set preferences file. The exit menu item is used to exit from FastBreak.
Selecting the Save Defaults menu item opens the following screen:
This allows you to save all your trading strategy file settings into a file with a name and
path of your choice.
The Save Default menu item saves the settings in the file name you have previously created.
Once a Default file is created, it can be loaded using the Open Default menu item. Selecting this item brings up a screen similar to the Save Default screen, allowing you to select
and load an existing strategy file.
Selecting the Preferences menu item brings up a screen that contains the following menu
selection item:
61
Page 62

This example indicates that no specific set of defaults will load when FastBreak is
launched. If you push the small button, a default file selection menu will be launched. It
will list all your saved Default (*.dft) files. You can select a file from this list and it will
appear in the above blank box. The next time FastBreak is launched, the settings in this
file will be loaded. Note: This feature is often overlooked. If you have a favorite strat-
egy, you can use this panel to have it load automatically each time FastBreak is
launched.
Function menu
The function pull-down menu has three options. The Execute option starts the execution
of a strategy. The second option is Fund Rank. After a strategy is executed the final
ranking of a family can be viewed by selecting Fund Rank:
If the time period used ends on the latest market date, this ranking will be the current
ranking of the trading family. The *** indicates fund(s) currently held in the strategy.
Clicking on the fund symbol will show the fund name. The 28% shown above indicates
the cutoff point for a fund to be held, that is, if a held fund falls below the point (On sell
ranking list. The 28% point on the buy ranking list has no meaning) then it will be sold
(subject to minimum holding periods). This screen can only be used after a strategy has
been executed to get an indication that a fund sell and buy may be near.
There is a search aid available to help find a fund in a very long list. Type the fund symbol in the search box and click the Search button. This will take you to the correct line in
the Buy or Sell Rank list.
The final option is Sort Summary. This option can be selected only if the Summary Grid
is selected. Selecting this option brings up the following menu:
62
Page 63

This menu allows the user to sort the Summary Grid information in ascending or descending order by many of the fields in the Summary Grid. For example, the user may
want to sort all the test cases by descending annual gain or ascending maximum draw
down. Use the pull down arrow menu to select the field to use for sorting.
Tool Bar
The Tool Bar at the top of the FastBreak screen duplicates most of the functions found
under the File and Function pull down menus, and most users will quickly transition to
the icons. As the cursor is placed on each Tool Bar icon a small message box will indicate the function of the icon. Note: FastBreak Pro users will see additional icons on
the tool bar. These will be covered in the supplemental FastBreak Pro manual.
63
Page 64

8.0 FastBreak Examples
This chapter will run through two typical FastBreak studies, running the program, looking
at the output files and looking at the FNU file in FastTrack. Note: Your results may be
somewhat different because of changes in the trading family since the manual was
written.
Note: If you need to terminate a FastBreak run, use the Cancel button at the bottom of
the Summary Grid screen. There will be a delay as FastBreak finishes the current test
case. You will know the button has been selected because a message will be displayed.
Users may need to clear the Windows tool bar at the bottom of the screen to see the
Cancel button. See your Windows manual on how to move or hide the Window tool
bar.
First Run
This example will evaluate all ranking periods from 2 - 50 days using the Fidelity Select
family. The buy ranking period will be set equal to the sell ranking period using the “Set
sell rank = buy rank” parameter. No stops or buy filters will be used.
1. Launch FastBreak
2. Find the Fidelity Select family by typing “Select” in the Families available for selec-
tion box
3. Find the Fidelity money market fund by typing FDRXX in the Money Market Fund
box
4. Verify “Exclude Money Market from Ranking” is unchecked and set “Money Market
Min Hold” to 30 days
5. Go to the Strategy Tab
6. Use the “Buy and sell strategy” pull down menu to select Buy and sell using rank
7. Select 1 fund to hold in “# funds”
8. Set “STRF Min Hold” to 30 days (The Fidelity Select Funds have a transaction fee of
0.75% if held less than 30 days)
9. Set “User Min Hold” to 30 days. (We want to hold a fund for at lest 30 days to avoid
the short term redemption fee (STRF)
10. Select “Top %” of 50
64
Page 65

11. “Delay” of 1 day
12. “Short loss” any value will work (Without setting a stop, or using a signal file, Short
loss will not be used)
13. Check the “Set sell rank = buy rank”
14. “Start date” of 01/01/1989 (notice that FastBreak will change to 01/03/1989, the next
available trading day)
15. “End date” of 12/31/1995 (notice that this date is changed to 01/02/1996, the next
available trading day)
16. “Buy min” of 2 days
17. “Buy max” of 50 days
18. “Delta buy” of 1 day
19. Don’t check the “Use signal file” box
20. Check the “Balance” option (no effect because only one fund is held but this is good
practice)
21. Select the Output Tab
22. Check the Summary file box and enter a name for the summary output file
23. Don’t check “Create detail” (because many cases are being run)
24. Don’t check “Create FNU” because multiple cases are being run
25. Click the Execute button (left most button on Tool Bar)
You should see a window open on the menu showing what is going into the “Summary
file”.
After the execution is complete:
1. Look the Summary Grid Tab and look at the results of each test case.
2. Use the Sort Summary Tool Bar button to sort the summary output by descending an-
nual return.
65
Page 66

3. Notice that a 26 day ranking produced good results. This will be used for the next
run. Note: Your results may be different due to changes in the Select family since
this example was created.
4. Jump back to the Strategy Tab
Second Run
This run will be for a specific test case. From the first run, it was found that a 23 day
ranking period looked good. This case will be evaluated in detail by changing only a few
menu items from the first run.
1. Set “Min buy” and “Max buy” to 23 days
2. Go to the Output Tab screen
3. Click the Summary file box if you want to change the name of the summary output
file
4. Check the “Create detail” box and enter a file name
5. Check the “Create FNU” box and enter file name of test.fnu, a title of “Trade 1 fund
23 day rank”, and a symbol name of “test”
6. Click Execute button on Tool Bar
When the run has finished:
1. Go to the Detail Grid Tab and look at each trade and the information on each fund
traded (Remember: The individual fund information is in the upper right corner of the
Detail Grid)
2. Launch the Windows or DOS version of FastTrack. We use the Windows version
3. Look at the FNU file you created by typing the FNU file name “test.” Any of the
FastTrack functions can be used on this file. The chart in FastTrack will look similar
to the following when using DJ-30 as the index:
66
Page 67

67
Page 68

9.0 Analyzing FastBreak Output
Annual Gain, %
FastBreak summary files can be analyzed in spread sheets (or in a companion product
from Edge Ware called FastGraph) and this is where the real power of FastBreak can be
realized. This example will compare the effect of changing a single parameter on return
results of a trading strategy. Make sure you change the summary file name when making
the two runs.
Start by making two FastBreak runs, one of them can be the first example from the previous chapter. For the second run, change the # funds (number of funds held) from 1 to 2
funds.
Import the two summary files into your favorite spread sheet (Excel was used for the following examples). Each row of data is a test case evaluated by FastBreak.
Chart the Avg Annual % return as a function of Test Case number and you get the following chart:
Annual Gain
50
40
30
20
10
0
0 10 20 30 40 50
RankingPeriod, days
1fund 2funds
In this example, the diamond symbols are for the test cases run holding one fund and the
square symbols are when holding two funds. It is rather difficult to determine what is going on even with the polynomial curve fit lines added. However, there is a fix.
Sort the summary file data in order of decreasing annual return. This is usually done in a
spread sheet by selecting all the data in the spread sheet (except the Test Case column),
68
Page 69

then selecting the sort command. The effect is to put the cases in order of decreasing re-
Maximum Drawdown, %
sults. Do this for both summary files.
Now, re-chart the data, but only for the best 30 test cases, and the following chart will be
created:
Annual Gain
(best 30 cases)
45
43
41
39
37
35
33
31
Annual Gain, %
29
27
25
0 5 10 15 20 25 30
1 fund 2 funds
Test Case, best-worst
Now it becomes clear that holding one fund usually has better performance than holding
two funds, on the order of 2-3% per year.
Other parameters in the summary file can be charted in a similar manner. For example,
chart the maximum draw down for these two FastBreak runs and put polynomial curve
fits through the data:
Maximum Drawdown
35
30
25
20
15
10
0 10 20 30 40 50
2 funds 1 fund
Test Case, best-worst
69
Page 70

The difference between the curve fit lines is 2-5 % for the better performing test cases.
8
3
4
6
1
10
The trader would need to determine if 2-3% per year of performance is worth reducing
maximum draw down by 2-5%
Finally, what are the best parameters to use for buy and sell ranking? The values that
gave the best annual return may not be the best choice because that combination may
have bad characteristics, i.e., high draw down, too many switches per year, etc. The most
significant problem - the parameters may not be a good “general solution” and only a
“statistical fluke.” Stability is a requirement in your parameter choice. In other words, if
the parameters are changed slightly, there shouldn’t be a large change in annual trading
performance. You do not want to “curve fit” history.
Here is one method of selecting potentially good parameters.
Go into your spreadsheet that has been previously reordered in decreasing annual return
order. Next, make an X,Y scatter plot using the buy ranking period as the X parameter
and the sell ranking period as the Y parameter. Plot only the top ten best test cases. What
you will see is the following scatter chart:
50
45
40
35
30
25
20
15
10
5
Sell Ranking Period, days
0
0 10 20 30 40 50
10 Best Test Cases
9
2
Buy Ranking Period, days
7
5
The data points are numbered from 1-10, where 1 is the point with the best performance.
In this chart, there is a cluster of points around the 23 day ranking period. This cluster
implies that annual return does not have a large variation in this region of ranking parameters. There are other parameters, 42 and 46 days for example, that are isolated and
probably should be avoided. It is better to select a pair of buy and sell ranking periods
that have slightly less performance but provide a more general solution. Sometimes there
is the best of all worlds-best annual return and good parameter performance stability.
The sell ranking period and buy ranking period do not need to be set equal to each other.
If a large number of variations on buy and sell ranking parameters (39 buy ranking periods and 39 sell ranking periods will give 1524 total test cases), or AccuTrack parameters
70
Page 71

are run, only chart the top 5%-20% of the top best test cases by charting sell ranking and
buy ranking (or AccuTrack parameter 1 and parameter 2) to determine if clusters of
points are formed:
50
45
40
35
30
25
20
Sell Ranking Period, Days
15
10
10 15 20 25 30 35 40 45 50
Best 10% of Test Cases
Buy RankingPeriod, Days
Clusters of points are centered about a band from 14/40 through 25/40 day ranking periods as well as a smaller cluster at 19/35 day ranking periods. These would be areas for
additional analysis (draw down, switches per year etc.). Avoid points that are isolated
such as 20/25, even though this combination of parameters may have given the highest
annual return.
If you have access to a plotting package that can make contour plots, you can take all the
data produced, in this case 1524 test cases, and make the following chart:
71
Page 72

This chart was made using FastGraph. The way to interpret the chart is darker regions
have better performance than lighter regions. The chart is color on the monitor and much
more informative. This chart confirms the previous chart because there are dark contour
regions in the area where the points clustered in the above spreadsheet example. Although the answer is the same as the previous X, Y scatter chart, it is much easier to interpret.
Using FastGraph to make a similar contour of UPI:
We can confirm that the same range of parameters (lighter in color on this chart) give the
best risk adjusted returns.
It is clear from the above charts that buy ranking periods greater than 34 days and sell
ranking periods less than 30 days should be avoided. The chart could have been made
with delta days set to a larger value than one day to make FastBreak run faster. Once the
areas of general interest are found, a rerun with a finer delta day could be made.
There are no guarantees the ranking period that tested well in the past will work well in
the future; however, looking at the past performance may give an indication of what will
work in the future.
72
Page 73

10.0 Building Market Timing Signals
FastBreak can be used to develop market timing signal files. These signal files are in the
standard FastTrack DOS format, i.e., a buy “B” or sell “S” followed by a date. See FastTrack Help for additional details. The files look like the following and are usually found
in the FastTrack Sig folder:
B,09/01/1988
S,06/19/1989
B,06/27/1989
S,12/11/1989
B,05/15/1990
The best way to explain how a signal file is generated is to use an example. Build a trading family in FastTrack that contains SP-CP (S&P 500 index) and NDX-X (NASDAQ
100 Index). Now, launch FastBreak. Select your new family as the trading family. Select VMMXX as the money market. Now, create a simple strategy. The strategy will
hold SP-CP, NDX-X or money market.
Money market minimum hold = 30 days
Use the default start and end dates
Buy and Sell using Rank
Use a Buy and Sell ranking period = 60 days
User Min Hold = 30 days
Hold 1 fund
Top % = 1%
Under stops select the Exponential Moving Avg with a 200 day period from day 1 to 999
We will not use any Buy Filters.
On the Output tab:
Click the Create Detail File box and give this file the name Signal.DET
Click the Make Signal File box and give this file the name FB.SIG with a description of
“FB signal example.”
Now, execute FastBreak to run this single case, which should take just a second or two.
Next, click on the Detail Tab. You will see a series of buys and sells. The position held
will be one of the two indexes or the money market.
Now, go to the FastTrack Sig folder where the FB.SIG file was built. Click on the file
and it should open with Notepad. You will see a series of Buys and Sells.
73
Page 74

If you compare the signal file results with the Detail file results you will observe. Each
time FastBreak sells the money market fund a Buy, i.e., “B” in the signal file, is generated. Each time FastBreak moves from one of the indexes back to money market a Sell,
i.e., “S” is generated. If one index is sold and the other index purchased, no signal is generated. In other words, the FastBreak signal file stays on a Buy as long as you are in one
of the fund family positions. FastBreak only generates buys and sells when moving from
a fund to the money market or from the money market to a fund.
Once you have built a market timing signal strategy just save the strategy in a DFT file
like you would a regular FastBreak strategy. If you build a strategy that uses this market
timing signal you will need to load and run the signal strategy prior to running the actual
trading system strategy.
FastBreak can be used in a variety of ways to build signals. It can be used to switch between a single index and money market or between a family of different indexes and
money market. Why would an investor want a family of indexes? There are time periods
when large cap stocks do well, other times small caps or value stocks do well. If a market
timing signal is based on a single index, that index may move you out of the market when
other market segments are still performing well. It may be better to stay invested and let
a FastBreak strategy rotate you out of the weaker funds or stocks and into those funds and
stocks that are still advancing.
Investors can also use FastBreak to build sector specific market signals. For example, we
have had good experience with building signals that time the energy sector. A signal was
built that switched between an energy sector index and money market. The signal would
switch out of the energy sector when the overall sector was in a decline. This signal was
then used to build a FastBreak trading system that trades individual energy sector stocks.
Comments on Using Market Timing Signals
It has been our experience that FastBreak strategies don’t need “perfect” market timing
signals, that is, signals that catch each market rise and dip. In weaker markets there may
be large numbers funds or markets that are still in up trends. What we have found is that
in extremely poor markets, i.e., 2001 – 2002, it may be prudent to step aside. In a severe
bear market there may be strong rallies, especially for individual stocks. These strong
rallies may result in strategy purchases, even when using the trend confirming Buy Filters
available in FastBreak. The funds or stocks that are purchased during these strong bear
market rallies often don’t have sustainable trends and will quickly sell off because they
are pulled down by the overall market.
It is our advice that when building signals for use in FastBreak strategies, keep the number of signal switches to a minimum.
74
Page 75

11.0 FastBreak Calculation Details
Here are some details on the way FastBreak analyzes a trading strategy that may not be
obvious; but the user needs to be aware of these details.
Account Balancing
This option tries to mimic the way many investors would balance their fund accounts. If
the trading strategy holds more than one fund, FastBreak tries to “balance” the value of
the fund accounts if the Balance option is selected on the Strategy screen. For example, if
three funds are held, the assumption is that these are three different fund accounts. Each
time a signal is given for an account, FastBreak calculates the total “value” of all three
invested accounts and divides by three to obtain an average account size. If the account
being sold has greater than the calculated average, the excess is placed in money market.
If the account is sold and the account was smaller than the average, value is pulled from
money market to try to bring the account up to the calculated average. Without this process, large variations could be experienced in the different accounts. For example, one account could realize a large gain during a holding period, and when the fund is sold and
rolled into a new fund purchase this would put an extraordinary percentage of all assets in
a single fund. This would partially defeat the purpose of holding multiple funds. Funds
in money market are adjusted as the NAV of the money market changes. If money market has monetary value, this value is included in the total “value” of accounts for the purpose of calculating an average account value.
Funds Available
A fund family can be analyzed over a period of time even though all the funds in the family are not available for the entire testing period. For example, if the user is doing an
analysis on a family made up of the Fidelity Select Funds, beginning with the start of the
FastTrack data base (09/01/1988), not all Select funds had been created at the trading start
date. FastBreak will keep track of how many funds are available at each day of the period. Example, there may be 28 Selects available in the family at the beginning of the
period and 40 Selects at the end of the period. If the strategy is to hold a fund while in the
Top % = 50 of funds this will be 14 funds at the beginning of the testing period but will
be 20 at the end of the time period. This is why a percentage is used rather than a fixed
number of funds for a holding strategy. Note: FastBreak rounds the number of funds in
the top% to the nearest integer.
Holding more than one fund
You may ask, “If I have a trading strategy that holds more than one fund will FastBreak
“buy” the same fund twice if it is the top ranked fund?” The answer is NO, but there is an
exception for the fund selected as a money market fund. If FastBreak sells a fund it will
buy the number one fund in the buy ranking unless you already hold that fund in which
75
Page 76

case it checks the second ranked fund, etc. However, if the top ranked fund is money
market it can be bought again. This is considered a defensive position because money
market funds can move to the top of the ranking when the entire market is in a major decline.
Impact of Fund Distributions
The user needs to be aware of the impact of fund distributions on FastBreak. There is
usually at least a one day delay in adjusting the FastTrack data base for distributions.
Funds that have distributions can show significant drops on the Price chart until the distributions are included the next day. This drop in NAV can force FastBreak to make a
trade that isn’t accurate.
Note: Always use FastTrack to look at your funds before making a trade. If you see
something unusual, that could be a distribution or bad data, make sure you verify.
Harnsberger Strategy
The logic will always try to buy a top ranked fund that meets your buying criteria. The
fund sold must meet your minimum holding period value. This is very similar to setting
the Top % to zero percent. One difference is that if more than one fund can be sold on a
given day, the Harnsberger option will sell the weakest (as measured by Sell ranking)
fund. An H is placed in the Why Detail file column to indicate a Harnsberger sell.
A user can also use the Top% value to generate a sell signal. This allows currently held
funds to be sold, either by dropping out of the normal Top% of the fund family or by a
new fund reaching the top ranked buy positions.
Note: In all cases, a fund being sold must have exceeded its minimum hold period.
When the Harnsberger strategy holds several funds, the fund sold may be the next
weakest ranked fund. This is because the weakest fund has not exceeded the minimum
hold period.
The Harnsberger Strategy will sell a fund if any of the stop functions generate a sell.
Note: If a fund is sold because a stop was violated, then FastBreak will put proceeds
from that sell into money market until a new fund becomes the number one buy
ranked fund. This logic keeps cash available waiting for the next good buying opportunity.
Clarification on using Stops and Signal Files
In early versions of FastBreak, when a stop was hit the trade was always taken, even if the
same fund was repurchased –in the same position. This could happen because the fund
hitting the stop is still the highest Buy ranked fund. This would show up in the detail listing as selling and then buying the same fund. This was normally not a problem because it
76
Page 77

was not a frequent occurrence. However, it did happen enough that we changed the logic
in FastBreak to prevent it from happening. If a stop is hit, FastBreak does a check to determine if the same fund would be repurchased. If this is the case, FastBreak does not
take the trade. This makes the software run a little slower, but we feel it is a better representation of how a user would actually trade the system. It also has the added benefit of
not charging any redemption fees on the false trades.
There is a second similar situation to what was just explained that CAN occur. If you are
holding multiple positions, and get more than one position trade on the same day, you
may find position #1 selling a fund and position #3 buying the fund just sold by position
#1. For example:
Position #1 sells IJS and purchases ICS because it was a better fund. As the same
time it then frees up IJS.
Then position #3 sells IWS but now the best fund is IJS which just became avail-
able in the previous step.
Obviously, in real life you would sell IWS and buy ICS and just hold IJS.
Because FB works its way thought each position one at a time, we saw no way of “undoing” the IJS trade without a complete change in the program logic. Also, it would make
the program run much slower.
What was just described doesn’t happen very often, when it does occur it is usually in a
major market sell off when funds that are highly Buy ranked hit stops.
The major downside of the program working the way it does is that if you have a mutual
fund with a minimum holding period then the holding period clock gets reset on the fund
that gets sold/re-purchased. This isn’t a significant problem for ETFs, stocks, or funds
with flexible trading rules, but could be an issue for funds with lockup periods.
In previous versions, when using a signal file and the signal was on a sell, FastBreak
would check to determine if the money market fund was hitting any stops. This was
done in case the user was holding something other than a normal money market fund, i.e.,
a short fund such as Rydex Ursa. However, we found that this logic can cause problems
when using the Rate of Return Sell Filter (it was not a problem for other stops because a
typical money market is not affected). The filter would cause the money market fund to
be sold and repurchased when the signal file was on a sell. We have made a change in
the logic -- if a signal file puts you in the money market, the stops are all ignored, and the
system will stay in the money market until a signal file buy is given.
77
Page 78

Building Market Timing Signals
If you have an overall strategy with an MDD of say, 15%, then don’t make the market
signal too efficient. For example, when building the market timing signal use a goal of
perhaps 20-25% for the signal MDD. Then, when you use the resulting signal to build the
actual trading system, use the 15% MDD goal. The reason for this is that if the signal is
too efficient; no stops will be necessary in the actual trading strategy. It is usually a good
idea to have at least one stop activated because it is unlikely the signal will be perfect in
the future.
We have found it is very difficult to control the MDD of stock trading systems without
market timing signals. Even in a severe bear market there will be individual stocks that
rally strongly and result in whipsaw purchases. This is because a strong rally isn’t sustainable in a bear market. Just as “a strong bull market lifts all boats,” a strong bear market drags down good stocks. The market timing signal only needs to keep you out of the
worst markets. The signal may only average one or two switches per year. You can of
course control the switches per year with the optimizer.
We like signals that use a range of indexes in the trading family. In general, most indexes
move together, but there are times when some market segments will diverge. For example, small caps may be in an uptrend when the large caps are selling off or are flat. Have
the market timing signal keep you in the market, and let the FastBreak strategy built on
this signal rotate you into the right funds or stocks. We have built successful signals that
combined SP-CP, NDX-X and RUT-I in the signal family.
If you want to trade specific market sectors, such as energy stocks, you should build an
energy sector timing signal. We have built such a signal using Fidelity Select Energy Services fund (FSESX) alone in a family to build a signal. We also experimented with Fidelity Select Energy (FSENX) alone and combined with FSESX for the signal. We used
these different signals with a batch of energy and energy service stocks with very good
results.
The choice of a money market doesn’t need to actually be a money market fund. Any
fund, stock or FNU file can be used. Just remember that when the signal strategy switches
to the “money market” fund this generates a sell signal in the signal file. This opens up a
whole word of possibilities on building negative correlation timing signals.
78
Page 79

12.0 Suggestions on Improving Trading Strategies
See the Resources Chapter for a list of resources that may help you in developing your
trading strategies.
Precious metal funds do not normally work very well with ranking strategies. This has
been noted by other studies, and you may want to consider removing these funds from
your trading strategy.
Some funds have similar objectives - energy vs. energy services, energy vs. natural gas,
technology vs. electronics. Rather than using the maximum correlation option, you may
consider removing one of the similar funds from a trading family. This may help with
diversification. There is little benefit holding several different funds to diversify if they
all trade the same. If a similar fund is removed, try to remove the fund that is the weaker
fund. As an example, energy services tends to outperform energy when the energy sector
of the market is moving up. You can use the individual fund performance information in
the Detail file to help make this determination.
If you use a market timing signal file, consider adding a stop function for additional protection.
Develop different trading strategies for different types of markets. In a strong bull market
high beta funds tend to out perform; in bear or flat markets lower beta funds should be
considered. Look at developing different ranking periods for different markets. Use a
poor market such as 2000-2001 to test bear market strategies.
Any fund can be used for the money market. Some of the bear market funds, i.e., Rydex
Inverse S&P, could be used to short the market during major down turns. The fund
would rank high and be purchased in a down market, or if using a market timing signal,
the fund would be purchased as money market when a sell signal is given. Note: Be
aware of the account balancing feature if holding more than one fund. See Calculation Details chapter.
79
Page 80

13.0 Trading using FastBreak
Once you have determined your trading strategy and which parameters to use, you can
store them using the Save Default As command from the file menu under the File pull
down menu or the icon on the Tool Bar This menu item was discussed earlier. Note: Be
certain your strategy dft file builds a Detail file in the Output tab.
Each day you run FastBreak look at the Detail Grid Tab. This file will flag a fund to be
sold with an “*” and indicate the fund to roll the proceeds into. See the attached window:
In the above figure, on 01/23/2001 a fund, LLPFX, was signaled for selling and the replacement fund, DSCVX, to buy was indicated. If you double click on the fund to be sold
symbol, the fund name will be displayed. The same is true for the fund to be purchased.
80
Page 81

14.0 Batch System Processing
If you have several trading systems to be evaluated each day, you can now build a “batch”
file that will load, run, and save the results of all your systems. It will open a page in Microsoft Notepad that you can print.
Use the Batch pull down menu:
The menu choices are Run, Create, and Update. You must first create the batch file using
the Create option. You will get the following screen:
You choose from all your DFT files that you want to run in a batch mode and add them to
the right side of the screen using the Add button. If you make a mistake, you can select a
DFT file on the right side of the screen and use the Remove button.
If all you want is to run the systems and generate FNU files, then you do not need to select any of the options at the bottom of the screen. At this point, you would click the
Save button which brings up a screen to save the batch file name. However, most users
will want to see current positions, current Rank List, and Summary in a Notepad screen.
We recommend that you select all the options. When you check the Save Results File a
81
Page 82

screen will open that allows you to give a name to the Notepad text file. Note: If you
check the Include Detail option, the batch run will put the last ten lines from the Detail
file into the Notepad file. For this to happen, you will need to make certain your strategy creates a Detail file during strategy execution, i.e., you must have a detail file created on the Output tab.
To run your batch file, use the Run option under the Batch menu, which will bring up a
screen that allows you to select the batch file you just created. After selection of the
batch file name, FastBreak will execute all the strategies and present you with a Notepad
screen that you can review and print:
The screen will show you the strategy name, Summary file information, ten lines from the
Detail file, the current rank list.
The last ten lines of the Detail file may not show you all the trades that you need to make.
If you are holding many positions and there are several trades on a particular day, the last
ten lines may not capture all the trades. However, you can determine the current positions on the Ranking list.
82
Page 83

15.0 FrequentlyAsked Questions
Q) I crashed my hard drive (got a new computer, new laptop etc.) and I need to reinstall
FastBreak Pro.
A) This is our most common tech support call. You MUST use the installation CD to
reinstall. We have had a number of users just try to copy files to the new computer or
hard drive. This will not work. Here are the steps:
Install FastTrack first
Do at least one download and update of FastTrack data
Verify that the FastTrack account number on this computer matches the account
number on the FastBreak CD
Install FastBreak using the installation CD
Go to our web site and download the latest upgrade, if one exists
Q) I’m getting an error. What is the problem?
A) First, go to the web site and download the latest upgrade.
Next, verify you are inputting dates in the correct format. This is the most common problem. Finally, do not override the FastBreak determined start date to an earlier date.
Family names can only be 8 characters long and FNU output file names can only be 5
characters long.
Q) What trading parameters have you found that work best?
A) There is more than one answer here. Depending on the account, low risk vs. high risk
for example, we have different trading strategies. That is the problem with giving advice;
each person has different situations. FastTrack is operated under the rules that the individual investor takes active involvement in investment decisions, and the authors of FastBreak have the same rule. With the introduction of all the new options in recent versions,
we have not even scratched the surface in studying all the combinations of parameters
that are possible.
Note: Even with this answer, we still receive many calls asking us to help, and we have
spent countless hours on the phone. Therefore, we have a new policy. We will help develop and modify strategies, but our fee is $60 per hour for this support with a $100
minimum.
Q) FastBreak encounters an error when it is in the process of launching.
83
Page 84

A) When FastBreak is launched, it will read all the family names in your FastTrack di-
rectories (Ft\Ftdef, Ft\Userdef, and Ft\Ft4win\Sftdef), including user created families,
and load all the fund names, including your FNU files. If FastBreak hits an error during
the loading of your FNU files, this indicates you have a corrupt FNU file. You will need
to move all your FNU files from your FastTrack (FT) folder to a temporary location.
Now, try to restart FastBreak. If FastBreak launches you will need to determine which of
your FNU files is corrupted. This can be done by moving the files one at a time from the
temporary location and launching FastBreak after each transfer.
Q) Just because a particular strategy works well in back testing, what guarantee is there
that it will work well in the future?
A) We are all looking for the perfect trading strategy or tool. There are no guarantees
any strategy or indicator will work well in the future. An investor needs to look at his
strategy(s) over a variety of market conditions and try to determine if it is a good general
solution.
Q) How is FastBreak different from other FastTrack add-on products on the market?
A) FastBreak was written to do one type of trading strategy - Fund rotation. We only do
one thing but we try to do it right.
Q) I start to type a trading family name to find it in the list of family names, I locate and
select the trading family, the name is highlighted but the name doesn’t jump to the top
line where I was typing?
A) It isn’t supposed too. The family selection box is also used for individual fund selec-
tion, and this prevents making the family selection fill the input box.
Q) Yes, but when I type the money market fund name it is highlighted automatically.
A) After the first few runs of FastBreak this will not bother you.
Q) FastBreak gave me a trade several days ago, but tonight when I ran FastBreak it shows
I’m holding a different fund than was indicated several days ago.
A) There is usually at least a one day delay in adjusting the FastTrack data base for dis-
tributions. Funds that have distributions can show significant drops on the Price chart
until the distributions are included the next day. This drop in NAV can force FastBreak
to make a trade that is not accurate. Later, when the NAV is adjusted for the distribution, the trade will be reversed. There isn’t a good solution to avoid this problem but it is
rare. It is more common near year end when many funds make distributions. Bond fund
trades at month end should always be questioned. If a trade is indicated, the fund sold
should always be checked in FastTrack to try to determine if there is an unexpected drop
84
Page 85

in NAV that may indicate a distribution. If there is, then you may want to wait a few days
until FastTrack adds the distribution to the database.
Q) Today in the Detail file I see a situation where position #1 of my strategy sold a fund
and position #3 sold its position and purchased the fund sold by position #1. Why?
A) This explanation for this situation can be found in Chapter 11.0 FastBreak Calcula-
tion Details under the section Clarification on using Stops and Signal Files.
Q) My account doesn’t show the same gain or loss as FastBreak when I trade with a zero
day delay?
A) The zero day delay option is a bit archaic at this point, but may be useful for those
who trade stocks/ETFs at the next day open. The zero day delay option was initially
added at user request when Fidelity Select funds had hourly pricing. Users wanted to
trade the Select funds at the next day 10:00 am pricing and the assumption was that the
10:00 am pricing would be close to the previous day close. FastBreak assumes you can
buy and sell funds on a given day at the 10:00 price that is equal to the previous day’s
closing price. If you use a one day delay and trade non-Select funds, or trade the Selects
at the 4:00 p.m. price, you should get agreement (excluding exchange fees).
Q) I notice that when I use a one day delay and get a sell signal, the gain of my trade
(TRADE GAIN %) changes the next night?
A) At the time the sell signal is given, FastBreak does not know what price you will actu-
ally get the next day at market close (if we did, we would ask for more money!); therefore, it assumes you get the price of the day the signal is given. The next night, it actually
knows the trade price and updates the TRADE GAIN % data in the Detail file.
Q) I notice that the DAYS HELD in the detail file is 1 to 3 days greater than I have actu-
ally held?
A) FastBreak looks ahead. After the market is closed, FastBreak knows the earliest you
can sell a fund is the next market day and it gives you credit. If today is a Friday, FastBreak gives you credit for Saturday, Sunday and Monday. FastBreak does not count
market holidays so you will need to track those yourself.
Q) File not found error?
A) One of the file names you used is not valid. File names need to start with a letter of
the alphabet and have up to three characters after the period.
Q) How well does the Short Trading option work?
85
Page 86

A) We added this functionality at the suggestion of a user and have no experience with
how effective this strategy works. This option may be worth further consideration with
the FastTrack stock data base.
Q) I’m using a signal file and the signal file gave a buy (or sell) today but the Detail tab
does not show any trades happening?
A) Are you using a signal file Risk value other than zero? If so, on the days that the sig-
nal file changes direction the strategy will move money into or out of the money market
fund. You can observe this in the % in MMK column of the Detail Tab. A fund rotation
can occur on the signal day also, and that trade will be reflected in the normal manner.
See additional information in the manual section that describes the Detail Tab.
86
Page 87

16.0 Resources
We have sample trading systems on our web site www.edge-ware.com. We also write a
yearly commentary on how different trading systems performed. You may get ideas from
reading these commentaries or avoid some of the mistakes we have made over the years.
These commentaries are available on our website.
We use www.ft-talk.com as a place to post new information and discussion. This subscription site is popular with Investment FastTrack users.
Our favorite investment book is Design, Testing, and Optimization of Trading Systems by
Robert Pardo. If you want a better understanding of how to build and test trading systems
this would be our #1 choice. Another good choice is Cybernetic Trading Strategies by
Murray A. Ruggiero, Jr.
A good choice for explanations of many technical indicators is Martin Pring on Market
Momentum by Martin Pring.
Formula Research is a newsletter research report published by Nelson Freeburg. This
publication evaluates mechanical market timing systems and trading strategies. Back issues are available. Call 800-720-1080 or 901-767-1956 for information.
87
Page 88

Appendix A - Technical Discussion
Curve Fitting
FastBreak uses three different types of curve fits: Least Squares Linear, Power (called
non-linear on menu), and Quadratic.
Linear is the most common curve fit and has the form: y = a1x + a
0
Where:
x : is the independent variable (in our case, days)
y : is the dependent variable (in our case the normalized NAV)
a : is a constant
The slope is the rate of change of y with respect to x. For this equation the slope is a1(a
constant value)
The Quadratic equation has the form: y = a2x2+a1x + a
0
The slope is: 2 a2x+ a1(slope varies with x)
The Power equation has the form: y = ax
b
b : is a constant
The slope is: abx
b-1
Again, the slope varies with x
How do these equations look when plotted?
1.05
y = 0.0037x + 1.0009
1.04
y = 0.9947x
1.03
Normalized Price Data
0.0178
NAV
1.02
1.01
1.00
0 2 4 6 8 10 12
y = -0.0005x2+ 0.0101x + 0.9858
Trading Days
Each equation has a somewhat different fit to the data. The NAV is normalized in FastBreak by dividing the NAV of each trading day by the NAV of the first trading day at the
start of the ranking period.
88
Page 89

Now, using the slope of each equation at trading day 12 the following chart is made:
Quadratic
1.05
1.04
1.03
NAV
1.02
1.01
1.00
0 2 4 6 8 10 12
The Linear curve fit has not changed because it is a constant value for all values of x.
The slope of the Quadratic equation has gone negative while the Power equation is still
positive but less so than the Linear fit. The general characteristic of the slope could have
been seen from the curve fits in the first figure.
FastBreak curve fits the data of each fund over the ranking period, and determines the
slope at the most recent day. The slopes are then ranked in decreasing order, much the
same as gain is ranked in a simple ranking.
Slope at Day 12
Power
Trading Days
Curve fits may help smooth the data, but at the same time pick up the developing trend of
the price data.
Ulcer Index
The Ulcer Index is defined in Martin & McCann’s book The Investor’s Guide to Fidelity
Mutual Funds. The Ulcer Index, UI, is a measure of risk, with a higher UI an indication
of higher risk.
1/2
UI =
Where:
Sum of R
(
R = The percent amount that a fund is below its highest previous value.
N = The number of market trading days over the period the UI is calculated.
2
)
N
89
Page 90

Ulcer Performance Index
The Ulcer Performance Index is defined in Martin & McCann’s book The Investor’s
Guide to Fidelity Mutual Funds. The Ulcer Performance Index, UPI, is a measure of risk
adjusted return. It is a measure of the investment performance over money market returns compared to the amount of risk. In general, the higher the value of UPI the better
the strategy.
UPI = ANN - 5.4
UI
Where:
ANN = The compound annual return of a fund or strategy over a test period.
5.4 = The annual performance of a money market over the FastTrack data
history
UI = The Ulcer Index over the test period.
Parabolic Stop
The parabolic stop system was developed by Welles Wilder and is documented in many
books on technical analysis. The system can be used to generate both buy and sell points.
The parabolic formula can be summarized as follows:
Par2= Par1+ Acc_fac x {high_of_trade - Par1}
Where:
Par2= Tomorrow’s parabolic value
Par1= Today’s parabolic value
Acc_fac = Acceleration factor
high_of_trade = Highest price since the trade was established
The fund is held until the mutual fund NAV becomes equal to or drops below the Par
value. The initial value of the parabolic for a long trade is set to the lowest price reached
while the fund was trading below the parabolic.
Wilder suggested setting the initial value of the acceleration factor to 0.02 and increased
by 0.02 each time the trading vehicle (stock, commodity, etc.) hit a new high during the
trade. He also suggested a maximum value of 0.2. Traders using this function for mutual
funds have found the 0.02 increase for each new high to be too large a value. A more reasonable value is in the 0.001-0.0001 range. FastBreak allows the user to set the starting,
maximum, delta increase.
90
Page 91

When using the parabolic stop, FastBreak will not purchase a fund if it is trading below
its parabolic because the fund would be stopped out the following day.
Graphically, the mutual fund NAV and corresponding parabolic value look as follows:
Parabolic
60
50
40
30
NAV, $
20
10
0
0 100 200 300 400 500
NAV
Parabolic
Trading Days
Kase Dev-Stop
The Dev-Stop system was developed by Cynthia Kase and is explained in her book Trading with the Odds. The Dev-Stop can be used to trade both long and short positions.
FastBreak uses the system only to generate sell signals. The advantage to the Dev-Stop is
that the stop point is adjusted for the volatility of the fund. More volatile funds have
wider stops than less volatile funds. The fund is sold when the NAV drops below the
Dev-Stop value. The Dev-Stop formula can be summarized as follows:
Dev-Stop = Trade_high - ATR - #SD x SD
Where:
Dev-Stop = Dev-Stop value
Trade_high = NAV high since the trade began
ATR = Average True Range
#SD = Number of standard deviations on true range
SD = Standard deviation of the true ranges
The ATR is the average of the daily true ranges. Since mutual funds do not have a daily
range (only closing prices) as stocks do, FastBreak calculates a synthetic true range by
91
Page 92

looking at three days of closing prices. For example, today’s true range would be the
high of the last three days minus the low of the last three days.
The ATR and SD of the true ranges is calculated over a user defined number of market
days. Kase has recommended 30 market days, but the user can specify any number of
market days.
Kase typically uses three standard deviations (#SD) for her work, but this is probably too
few for mutual funds because of the low volatile nature of most mutual funds, and the
three day calculation of true range probably introduces additional smoothing. We recommend trying values of 4 to 7.
Graphically, the mutual fund NAV and corresponding Dev-Stop value look as follows
once a trade is initiated:
Kase Dev-Stop
50
45
40
35
NAV, $
30
25
20
0 20 40 60 80 100 120 140 160
NAV
Dev-Stop
Trade Days
Persistence of Price (POP)
If a user does not understand all aspects of the calculations used in POP, here is the important rule - Increasing the user input value for POP will tend to favor funds that have
small drawdowns over the ranking periods. The net effect should be to lower the Ulcer
Index of a strategy; however, you may decrease the annualized return for the strategy.
This is a tradeoff that only the user can make.
This concept is unique to FastBreak and was inspired by Marc Chaikin’s Persistency of
Money Flow. One aspect of Chaikin’s concept is that stocks which are in demand by investors will draw buyers each time the stock has a small pull back and the pull back never
92
Page 93

becomes very deep. It was felt that this steady buying may also apply to mutual funds
that are invested in a “high demand” group of stocks.
A methodology was developed that would apply a penalty to funds based on the number
and depth of their drawdowns from their recent highs. Another way of looking at the
methodology is to favor upside volatility, but penalize downside volatility. Here is how
POP works:
Each time a fund is ranked over a ranking period, a summation is made of the square of
the percentage the fund NAV is below the previous high. This summation is made each
day over the ranking period and is very similar to the calculation made in the Ulcer Index:
Sum DD = Sum of R
2
Where:
Sum DD = Sum of the percentage draw down.
R = The percent amount that a fund is below its highest previous value
Next, Sum DD for all the funds in the trading family needs to be scaled. The mean and
standard deviation is calculated for the Sum DD of the entire family. The number of standard deviations from the mean is calculated for each fund, i.e., if a fund has a low Sum
DD it will have a negative value for the number of standard deviations from the mean. A
positive number of standard deviations will result from funds with a Sum DD greater than
the mean. The algorithm truncates the number of standard deviations between +/- 3 standard deviations which should incorporate 99% of the expected range for a normal distribution. This methodology will “clump” most of the funds around the mean, i.e., zero
standard deviations.
The final step is to scale the range between a value of 1 to a maximum value supplied by
the user. If the user has a value of 4 for the POP input then the scaling range will be 1 (3 standard deviations from the mean) to 4 (+ 3 standard deviations from the mean). Most
of the funds will have a value near a scaled value of 2.5. This scaled range is used to adjust the percentage gain over the ranking period for each fund. If a fund has a very low
scaling factor, the gain will be divided with a value near 1. A fund that has a high Sum
DD will have its gain scaled by a large number.
Note: POP will not work with all ranking methods. See the summary of options matrix
in the FastBreak Options and Functions chapter. Money Market should be excluded
from ranking when using this option because the option will have a tendency to purchase the money market often (money market funds never have drawdowns).
Anchored Momentum
Anchored Momentum (AM) is a technique developed by Rudy Stefenel. Mr. Stefenel
describes the technique in the February 1998 issue of Technical Analysis of Stocks &
93
Page 94

Commodities magazine. FastBreak incorporates two versions of AM - General Anchored
NAV
7 day period
Momentum (GAM), and Most Anchored Momentum (MAM).
GAM divides a smoothed recent price by a smoothed price from some number of lookback days (ranking period). The recent price is smoothed by an Exponential Moving Average (EMA). The price from the look-back period is smoothed by a Simple Moving Average (SMA) centered the price on the look-back number of days. For example, the following chart shows the case of a 3 day EMA and a 5 day SMA:
7
GAM
EMA
9
Day
11
SMA
13
15
17
19
2.35
2.25
NAV
2.15
2.4
2.3
2.2
2.1
1
3
5
A ratio value is calculated by dividing the EMA by the SMA from a number of look-back
days. This ratio is calculated for all the funds, then a ranking is made on the ratios to determine a relative strength ranking of the fund family.
Notice that the moving averages smooth the short term noise in the NAV but retain the
major price trends. In the above chart if you were to use a 7 day ranking period, the SMA
from 7 days back has smoothed the sharp peak at day 13 and may give a better representation of the actual price action. By centering the SMA about the ranking period, NAV lag
in not introduced. FastBreak uses the same parameters in GAM for buy and sell ranking.
In theory, different parameters could be used but this could lead to over optimization of
parameters, i.e., cure fitting.
Note: If you use a value of one day for both the EMA and SMA, the GAM is exactly
the same as a simple change of price ranking.
MAM is a special case of GAM. MAM uses a SMA that is twice the look-back period.
For example, if a user specifies a buying period of 10 days, the NAV from 10 days ago
will be smoothed with a 20 day simple average centered on the NAV 10 days back. Another way of looking at MAM is to say that the NAV is smoothed using all the days from
the current NAV back to the NAV of the look-back period plus an equal number of days
on the other side of the look-back period date. For this reason, the user does not need to
specify the SMA period since the SMA period is a function of the look-back or ranking
94
Page 95

period. The current NAV is smoothed by an EMA specified by the user. The ratio of the
Return vs Beta
two moving averages is used to calculate a ratio used to make a relative strength ranking
just like GAM.
Alpha Ranking
Several users have asked for an option to trade funds based on “alpha” ranking.
Most investors are familiar with the “beta” parameter that measures fund volatility when
compared to an index. A common example of high beta funds is Rydex Nova. This fund
has a beta of 1.5 when measured against the S&P 500 index. The means that the fund
will move one and a half times as much as the index. For example, if the S&P moves up
1% then Nova will move 1.5%. The same is true on the downside where the moves are
also amplified.
Alpha is often described as the performance a fund would have if there is no change in
the index. For example, if the S&P did not change over a given time period, but the fund
increased by 5%, then alpha could be thought of as 5%. Note: Alpha can also have a
negative value.
A mutual fund manager can improve the fund performance using volatility (beta) by being a better stock picker (alpha) or a combination of volatility and good stock picking. A
potential advantage to a fund that has a lower beta and a high alpha is that the fund may
not drop as much during down markets as a fund that relies more on beta for performance. Note: In markets that are moving up strongly, high beta funds are usually the
place to be. However, if the market moves strongly to the downside, the high beta can
quickly do a lot of damage to fund performance.
The following chart was made using the annual return and beta (measured against the
S&P 500 Index) for a large group of growth funds:
35
(1988-1999
30
25
20
Return, %/year
15
10
0.8 1 1.2 1.4
Beta
)
95
Page 96

Notice there is a very obvious relationship between return and beta. The thin line is a
trend line of all the data points. You will notice that there is considerable “scatter” in the
data. For example, at a beta value of approximately 1.2, the annual performance for individual funds can vary from 19% to over 27%. Alpha ranking has the intent of trying to
purchase the fund with superior performance at a given level of beta. For example, FastBreak Pro was used to build an alpha ranking trading system using the funds in the chart.
We then looked at those funds which were purchased most often (five or more times between 1989 and 1999). We put a second trend line (the thick trend line) in the above
chart for only those preferred funds. Notice that the preferred funds have a higher average return for a given beta than the average fund.
The usual calculation for determining alpha takes the “correlation” between the fund and
index into account. The alpha ranking we have incorporated in FastBreak is the noncorrelated alpha (NCAlpha) preferred by our users.
The NCAlpha calculation over a ranking period is as follows:
NCAlpha = gain of fund - (ofund/oindex) X gain of index
Where o is the standard deviation (volatility). The ratio of the fund and index volatility
is beta.
Note: If the index has a zero gain then NCAlpha is exactly the same as standard ranking.
There are some practical considerations for using alpha ranking. We have found that alpha ranking is most useful for trading diversified domestic growth funds. We have not
found it to be useful in trading sector funds. There is the question of which index to use.
The most commonly used index is the S&P 500 (SP-CP in FastTrack), but FastBreak allows any available index or fund to be used. It is not clear how alpha could be used to
trade international funds because of a lack of a common index. We encourage you to experiment.
Trendline Stop and Buy Filters
Trendlines are one of the oldest and still most useful technical analysis tools. Trendlines
can be used to determine when a stock or mutual fund has broken down in an upward
move, i.e., used as a sell Stop, or trendlines can be used to determine if a downward move
has ended and it is safe to buy, i.e., Buy filter. The vast majority of trendline users use a
manual method to draw the trendline on a paper chart or a computer screen. Programming a computer to calculate a trendline that a human brain can draw in a few seconds is
a daunting task; however, there is a tendency when manually drawing trendlines to
96
Page 97

“force” the line to other expectations. A mathematical algorithm is not subject to such
expectations, but at the same time cannot “see” other potential complications and complexities.
NOTE: The algorithm to determine trendlines is very computer time intensive. If you
are using a very large trading family you will notice a long delay to evaluate the strategy.
Although the basic idea of trendlines is rather simple, implementation and especially
automated implementation, can be come rather complex. Analysts don’t agree on methods to draw trendlines (Note: Analysts don’t even agree on how to spell trendline, i.e.,
“trendline” or “trend line.”) For upward trendlines, FastBreak uses a method that draws a
trendline between significant low price points and at no time is the price of the stock or
fund allowed to penetrate the trendline. In the chart below the trendline is drawn between
the 1stand 2ndsignificant price low points. For the trendline to be valid the equity curve
cannot penetrate below the trendline anywhere between those two points.
For downward sloping trendlines two significant high price points are used to draw the
trendline.
It has been a standing joke that trendlines are very easy to draw after the fact; however, in
real time it can be quite difficult to determine which point to choose on the equity curve
to anchor the trendline. For example, using the above chart it may have seemed reasonable to draw the trendline shown below at an earlier decision point. However, it is clear
that this trendline would have forced you out of a very profitable upward trend too early.
This is to say, that the rules of trendline technical analysis forces a sell when the equity
curve violates the trendline until a new trendline can be drawn.
97
Page 98

The trendline algorithm in FastBreak makes a determination if the low price point dip (in
an upward trend) is significant and should be considered as a trendline anchor point. The
exact method used to make this determination is proprietary. It is also quite technical and
the vast majority of users would not be interested in a multiple page explanation filled
with equations.
Another aspect of trendlines is that they can be drawn for the short term or the long term.
This is driven by the degree or significance of the dips that form the low points used to
anchor the trendline. See the two examples in the following chart. In one case the trendline is capturing a very long term move, in the other case the trendline is anchored with
less significant low points.
98
Page 99

Investment objectives will help define how trendlines are drawn. For example, if a primary objective is to avoid large equity draw-downs then trendlines that capture smaller
price moves and avoid significant sell offs will be a reasonable choice. However, it is
often the case that to maximize return at the expense of large draw-downs requires trendlines that capture larger price moves and are drawn using more significant price low
points. The algorithm used in FastBreak allows either choice to be made.
Finally, trendlines can be drawn using linear price data or using logarithmic price data.
There are advantages and disadvantages to both methods. FastBreak will allow either
method to be used.
Using Trendlines in FastBreak
An option on the Strategy Tab can force use of a logarithmic trendline.
If the Use Log Trendline option is checked, then logarithmic trendlines will be used for
both the Trendline Stop and Trendline Buy Filter. If it isn’t checked then linear (arithmetic) trendlines are used.
Trendline Stop
The above boxes have been added to the Stop Tab to activate the trendline Stop. The option is used just like the other Stop options. That is to say, check the box to activate the
trendline Stop as either a singe period Stop or a two period Stop.
The Size text box is used to control the significance of the price dips used to draw the
trendline. If a small value is used then smaller price dips will be considered significant
and shorter term trendlines will be drawn. If larger values are used then larger price dips
are required before they are determined to be significant enough to anchor the trendline
and the trendlines will capture longer term trends.
In the above example a value of 9 is used to control the trendline for the first 30 days.
Starting on day 31 a value of 5 is used which will tend to use small price dips, and therefore, shorter trends. Reasonable values are 0 to 15.
If a position is stopped out due to a trendline being violated then a “T” is placed in the
WHY column of the output Detail Tab.
Trendline Buy Filter
99
Page 100

To activate the trendline Buy filter the above option is on the Buy Filter Tab. Activation
of this option will prevent purchase of any issue that is trading below its trendline. As
with the Trendline Stop, the Size box controls the type of trendline used. Reasonable
values to use are 0 to 15.
Data Required to Determine a Trendline
It can take a considerable amount of historical data to determine the first trendline. This
is because it requires two meaningful dips (in the case of an upward trendline) to create
the first trendline section. If the stock or fund is in a significant upward movement at the
beginning of its historical data, then no trendline can be drawn. Until a trendline can be
drawn, FastBreak will assume that the stock or fund is BELOW its trendline. Therefore,
this stock or fund can’t be purchased if either the trendline Stop or Buy Filter is used by
the strategy.
You need to be aware of this issue because you may see situations where a stock or fund
is highly ranked and clearly in an uptrend but a strategy will not purchase the equity. Re-
peat, until a stock or fund has two meaningful dips in the equity curve a trendline
cannot be constructed, and therefore FastBreak will assume the issue is below the
trendline and unavailable for purchase.
Trendline Summary
Is the trendline algorithm perfect? The answer is no, there are no perfect technical indicators. Sometimes the algorithm makes an excellent determination, but other times it fails.
The question for an investor is does the indicator succeed more often than it fails.
Options for Buying Weakness and Selling Strength – BAT and RAT Options
FastBreak V6.5 added several new capabilities. Some of the changes were intended to
build systems that are complementary to traditional FastBreak systems that always buy
into strength. Some of the new options allow buying into temporary weakness and selling
into overbought conditions. This will become clear as each of the new options is explained. Note: The new options will only work with Linear Slope ranking.
BOOM (Breakout Optimization Method) with Linear Slope Ranking
Long term FastBreak users are familiar with the BOOM option for ranking. Read the description for the option later in the manual. We have made BOOM available to use with
the Linear Slope ranking method. In recent years we have found that Linear Slope is a
great ranking method for stocks and ETFs. This ranking method appears to help adjust
for the greater volatility of stocks/ETFs vs. the less volatile mutual funds so allowing
BOOM to be used with Linear Slope was a natural extension.
100
 Loading...